analyst conference -...
TRANSCRIPT

FULL-YEAR RESULTS 2018
ANALYST CONFERENCE
RADISSON BLU, ZURICH AIRPORT
14 MARCH 2019, 1:00 PM CET
PRESENTATION

© Vifor Pharma
ETIENNE JORNOD
EXECUTIVE CHAIRMAN
OF THE BOARD OF DIRECTORS
STEFAN SCHULZE
PRESIDENT OF THE EXECUTIVE
COMMITTEE & COO
COLIN BOND
CHIEF FINANCIAL OFFICER
FULL-YEAR RESULTS 2018
SPEAKERS
14 March 2019 2

© Vifor Pharma
AGENDA
1
3
2
Vifor Pharma
2018 highlights
3 Business update and outlook 2019
14 March 2019
4 Financial performance and guidance 2019
© Vifor Pharma
1) Proposed per share dividend to be approved by the shareholders at the Annual Shareholders Meeting on 8 May 2019
4
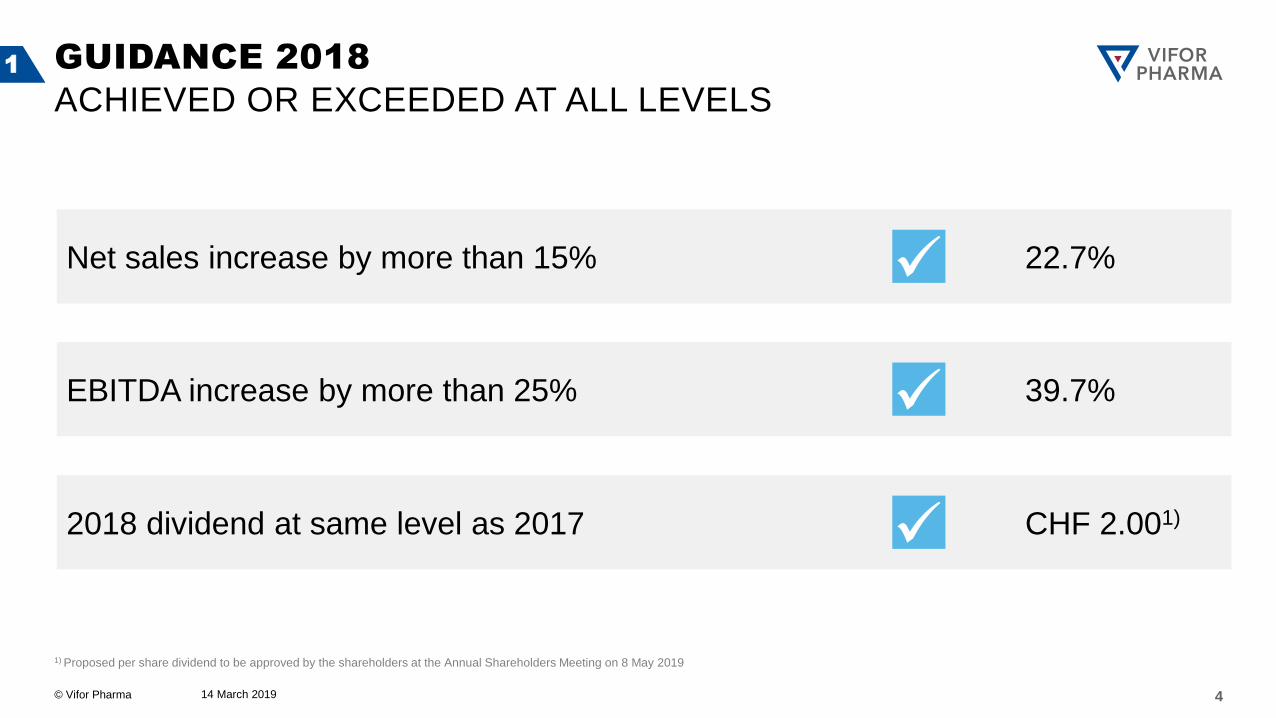
1 GUIDANCE 2018
ACHIEVED OR EXCEEDED AT ALL LEVELS
14 March 2019
2018 dividend at same level as 2017 CHF 2.001)
EBITDA increase by more than 25% 39.7%
Net sales increase by more than 15% 22.7%

© Vifor Pharma
LEADING PORTFOLIO IN TARGET THERAPY AREAS
1) Pre-commercial products
Avacopan1) CCX1401)
1)
Vadadustat1)
14 March 2019 5
CR8451)
Iron
deficiency Nephrology Cardio-renal
Own
products
In-licensed
products
1

© Vifor Pharma
Veltassa® Build a blockbuster
Vifor Fresenius Medical Care Renal Pharma Grow and enhance value
THREE STRATEGIC GROWTH DRIVERS 1
6 14 March 2019
Ferinject® Exploit the potential through market awareness

© Vifor Pharma 14 March 2019 7
1) In-market sales, based on quarterly IQVIATM MIDAS® panel, GERS, Insight Health, DLI, historical data at constant exchange rate (average 2018)
FERINJECT®
2 BILLION PLUS IN-MARKET SALES BY 20251)
> CHF 2 billion
1
2008 2009 2010 2011 2012 2013 2014 2015 2016 2017 2018 2019 2020 2021 2022 2023 2024 2025
Launch in
Japan
Launch
in China
AFFIRM-AHF
results
FAIR-HF2
results
HEART-FID
results

© Vifor Pharma
EXPECTED GLOBAL MARKET EVOLUTION FOR PHARMACEUTICALS IN NEPHROLOGY
< 5%
14 March 2019 8
VIFOR FRESENIUS MEDICAL CARE RENAL PHARMA
BECOME A GLOBAL LEADER IN A FAST-GROWING MARKET
Source: EvaluatePharma 2017-22 CAGR of 10.3%, 2022-25 CAGR assumed unchanged, Vifor Pharma analysis, excludes iron products
2018
>$20bn >$40bn
2025
VFMCRP current market share
Rest of the nephrology market
1

© Vifor Pharma
CURRENT INDICATIONS
14 March 2019
VIFOR FRESENIUS MEDICAL CARE RENAL PHARMA
NUMEROUS OPPORTUNITIES REMAIN
Polycystic kidney disease
Metabolic acidosis
Vascular calcification
Kidney stones
Hypernatremia
Fabry
aHUS
Diabetic nephropathy
Acute kidney injury
β-Thalassemia renal disease
FSGS
ANCA associated vasculitis
Uremic pruritus
C3G
Secondary hyperparathyroidism Hyperphosphatemia
Hyperkalaemia
Anaemia
Iron deficiency
PIPELINE INDICATIONS POTENTIAL INDICATIONS
9
1
© Vifor Pharma
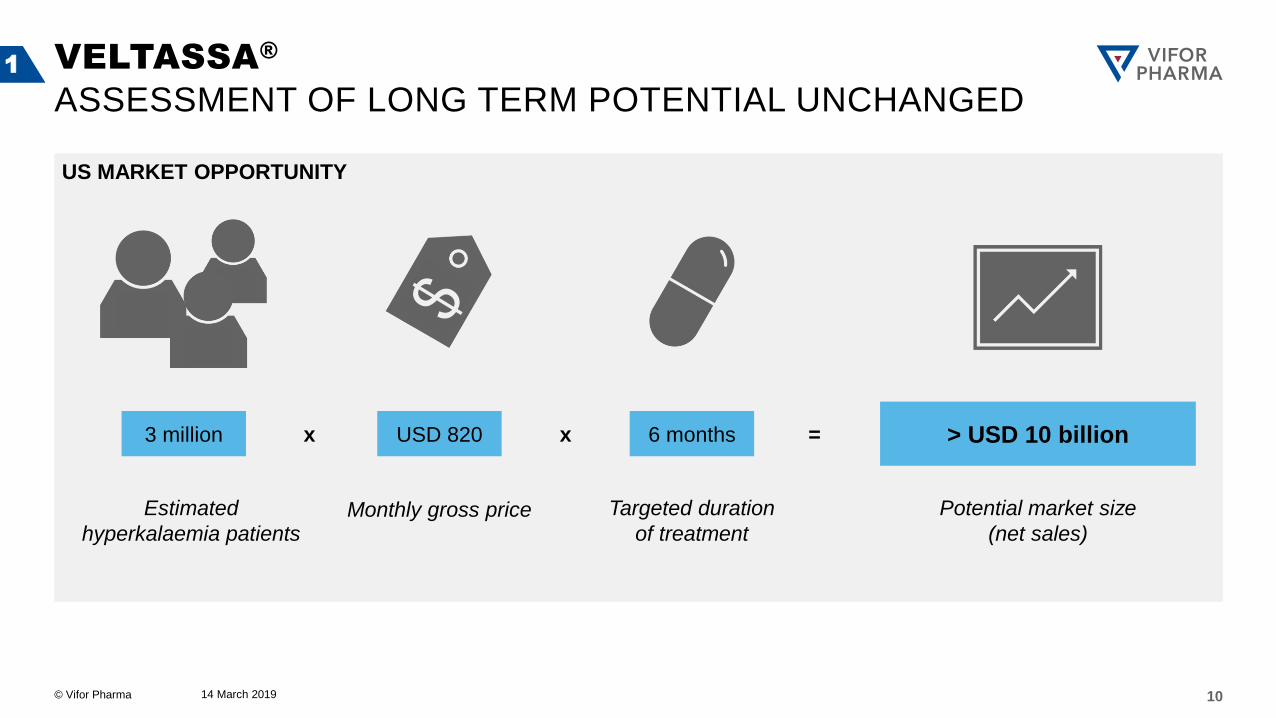
US MARKET OPPORTUNITY
14 March 2019 10
VELTASSA®
ASSESSMENT OF LONG TERM POTENTIAL UNCHANGED 1
3 million USD 820
Monthly gross price Estimated
hyperkalaemia patients
6 months
Targeted duration
of treatment
x x > USD 10 billion =
Potential market size
(net sales)

© Vifor Pharma
EBITDA
280.4 391.5
FY 2017 FY 2018 2019E 2020E
NET SALES
14 March 2019 11
MILESTONE 2020
ON TRACK TO REACH OUR GUIDANCE 1
1'291.7
1'584.6
FY 2017 FY 2018 2019E 2020E
Grow between
11% and 13%
Exceed
CHF 2 billion
+23%
Grow by 25%
In the range of
700 million
+40%

© Vifor Pharma
>CHF 1 billion
in reported
net sales
>CHF 1 billion
in reported
net sales
>CHF 1 billion
in reported
net sales
OBJECTIVE 2025
STRONG POTENTIAL FOR OUR EXISTING GROWTH DRIVERS
14 March 2019
Ferinject® Vifor Fresenius Medical
Care Renal Pharma Veltassa®
12
1

© Vifor Pharma
VFMCRP – Grow and enhance value
Veltassa® – Build a blockbuster
14 March 2019 13
OBJECTIVE 2025
KEY ELEMENTS FOR OUR FUTURE GROWTH
1) Therapeutic areas
EXISTING GROWTH DRIVERS
Ferinject® – Exploit the potential
Licensing/acquisition across geographies & TAs1):
• Nephrology
• Cardio-renal
• Patient blood management, gastroenterology, etc.
INORGANIC GROWTH – ADJACENT INDICATIONS
• Leverage US commercial infrastructure
• Become EU partner of choice for non-European growth
and innovation companies
EXISTING INFRASTRUCTURE
• Ferroportin inhibitor
• Exploit data & pay-for-performance (anaemia and
bone-mineral metabolism management, etc.)
• Replicate VFMCRP structure in other therapeutic areas
NEW TECHNOLOGIES AND BUSINESS AREAS
1

© Vifor Pharma
AGENDA
1
14
2
Vifor Pharma
2018 highlights
3 Business update and outlook 2019
14 March 2019
4 Financial performance and guidance 2019
© Vifor Pharma 15
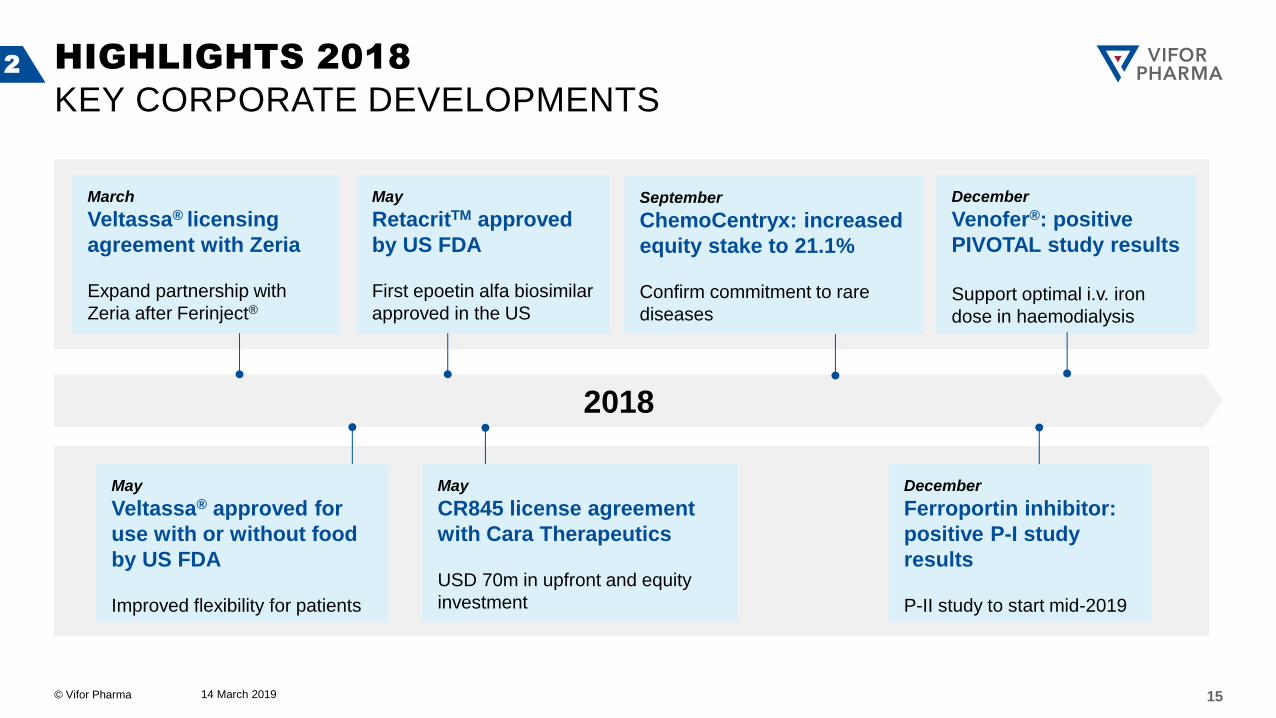
2 HIGHLIGHTS 2018
KEY CORPORATE DEVELOPMENTS
14 March 2019
2018
March
Veltassa® licensing
agreement with Zeria
Expand partnership with
Zeria after Ferinject®
May
CR845 license agreement
with Cara Therapeutics
USD 70m in upfront and equity
investment
December
Ferroportin inhibitor:
positive P-I study
results
P-II study to start mid-2019
May
RetacritTM approved
by US FDA
First epoetin alfa biosimilar
approved in the US
December
Venofer®: positive
PIVOTAL study results
Support optimal i.v. iron
dose in haemodialysis
May
Veltassa® approved for
use with or without food
by US FDA
Improved flexibility for patients
September
ChemoCentryx: increased
equity stake to 21.1%
Confirm commitment to rare
diseases

© Vifor Pharma
1) Including IFRS 15 restatement 2) Profit after minorities adjusted for amortisation of intangible assets
16
2 HIGHLIGHTS 2018
FINANCIAL OVERVIEW
• FY 2018 net sales of CHF 1’584.6 million, up 22.7%1)
• FY 2018 EBITDA of CHF 391.5 million, up 39.7%
• Core EPS2) of CHF 4.16
• Net debt of CHF 179.7 million
• Equity ratio of 74.8%
KEY FINANCIAL HIGHLIGHTS
14 March 2019

© Vifor Pharma
AGENDA
1
17
2
Vifor Pharma
2018 highlights
3 Business update and outlook 2019
14 March 2019
4 Financial performance and guidance 2019

© Vifor Pharma
Veltassa® Build a blockbuster
Vifor Fresenius Medical Care Renal Pharma Grow and enhance value
THREE STRATEGIC GROWTH DRIVERS 3
18 14 March 2019
Ferinject® Exploit the potential through market awareness
© Vifor Pharma
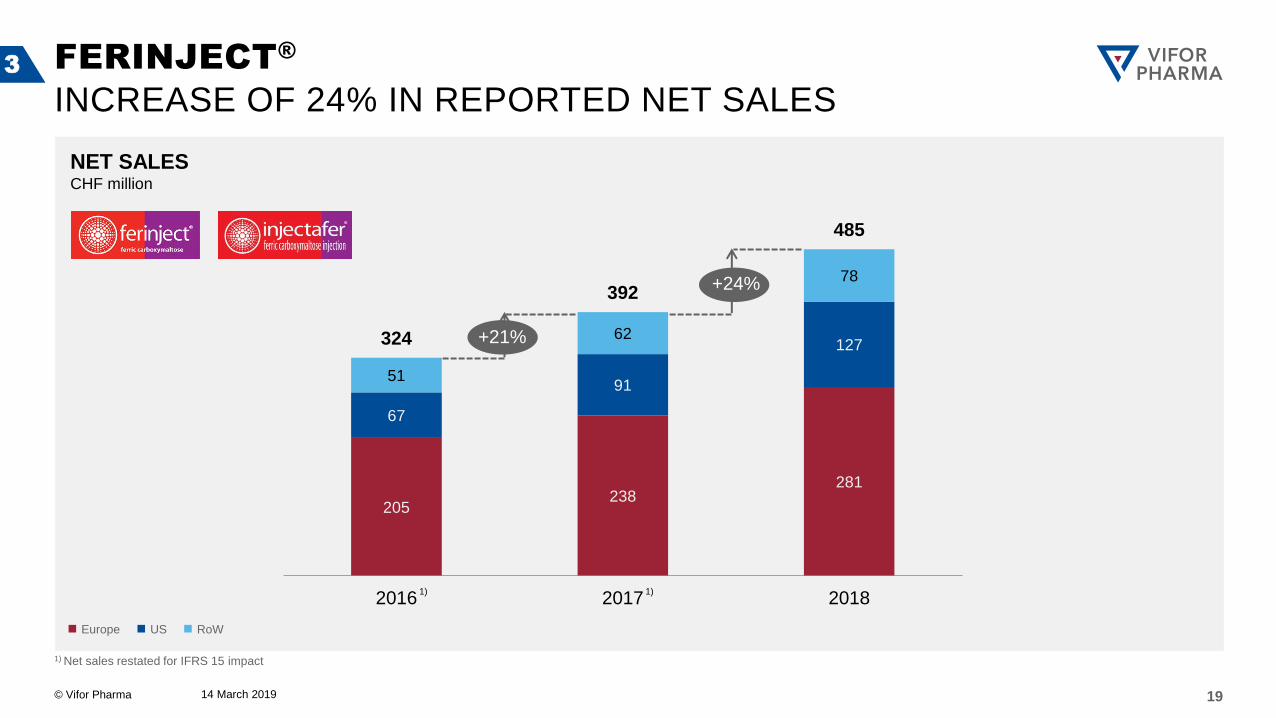
NET SALES CHF million
205 238
281
67
91
127
51
62
78
324
392
485
2016 2017 2018
14 March 2019 19
1) Net sales restated for IFRS 15 impact
FERINJECT®
INCREASE OF 24% IN REPORTED NET SALES 3
+21%
+24%
Europe US RoW
1) 1)

© Vifor Pharma
16 39 59 83 126
191 244
379
540
698
898
14 March 2019
FERINJECT®
POTENTIALLY A BLOCKBUSTER ALREADY IN 2019 3
Europe US RoW
MAT = Moving annual total
1) Based on quarterly IQVIATM MIDAS® panel, GERS, Insight Health, DLI, historical data at constant exchange rate (average 2018)
20
2008 2009 2010 2011 2012 2013 2014 2015 2016 2017
GLOBAL I.V. IRON MARKET (MAT Q4 2018)1)
• Global in-market sales of CHF 1’837 million (+17%)
• Ferinject® in-market sales growth of 29%
• Global market share of Ferinject® in value is 49%
IN-MARKET SALES1)
CHF MILLION
2018

© Vifor Pharma 14 March 2019 21
FERINJECT®
THE BLOCKBUSTER PLAN – UPDATE 2018
1) Study conducted by our US partner Daiichi Sankyo
Therapeutic
areas with high
unmet need
• Strong heart failure growth
in EU5
• Various pilots in patient
blood management
Strong
partnerships
Geographic
expansion
Life cycle
management
• Approved in 76 countries
• Launch in Japan expected
in H2 2019
• Launch in China expected
in 2021
• AFFIRM-AHF
• HEART-FID1)
• Leading product for Daiichi
Sankyo in the US
• Go-to-market strategy for
China in 2019
3

© Vifor Pharma
VELPHORO® NET SALES CHF million
54
81
96
2016 2017 2018
ESA PORTFOLIO NET SALES CHF million
329 340
461
2016 2017 2018
14 March 2019 22
1) Fresenius Kidney Care (FKC): Fresenius Medical Care North America dialysis provider organization 2) Net sales restated for IFRS 15 impact
VIFOR FRESENIUS MEDICAL CARE RENAL PHARMA
ESA PORTFOLIO / VELPHORO®
• >95% penetration of Mircera® in FKC clinics1)
• Strong growth of Mircera® outside of FKC clinics1)
• First RetacritTM sales at end of 2018
3
• Recent update of KDIGO guidelines recommend use of non-calcium based phosphate binders
• Rollout of a new program in FKC clinics1) in H2 2018
+36%
+3%
+48%
+19%
Mircera® RetacritTM
2) 2)

© Vifor Pharma
KEY ELEMENTS GOING FORWARD
14 March 2019 23
1) Bundled payment under the end stage renal disease prospective payment system (ESRD PPS) for renal dialysis services
VIFOR FRESENIUS MEDICAL CARE RENAL PHARMA
HIF PROLYL-HYDROXYLASE INHIBITORS (HIFS) 3
Clinical trials Reimbursement Treatment protocol Uptake
Data on safety and
efficacy outstanding
HIFs expected to be
included in the “bundle”1)
Pilots required to test
real world safety?
Low impact expected on
i.v. iron net sales
Vadadustat in-license agreement offsets potential risk to current ESA portfolio
© Vifor Pharma
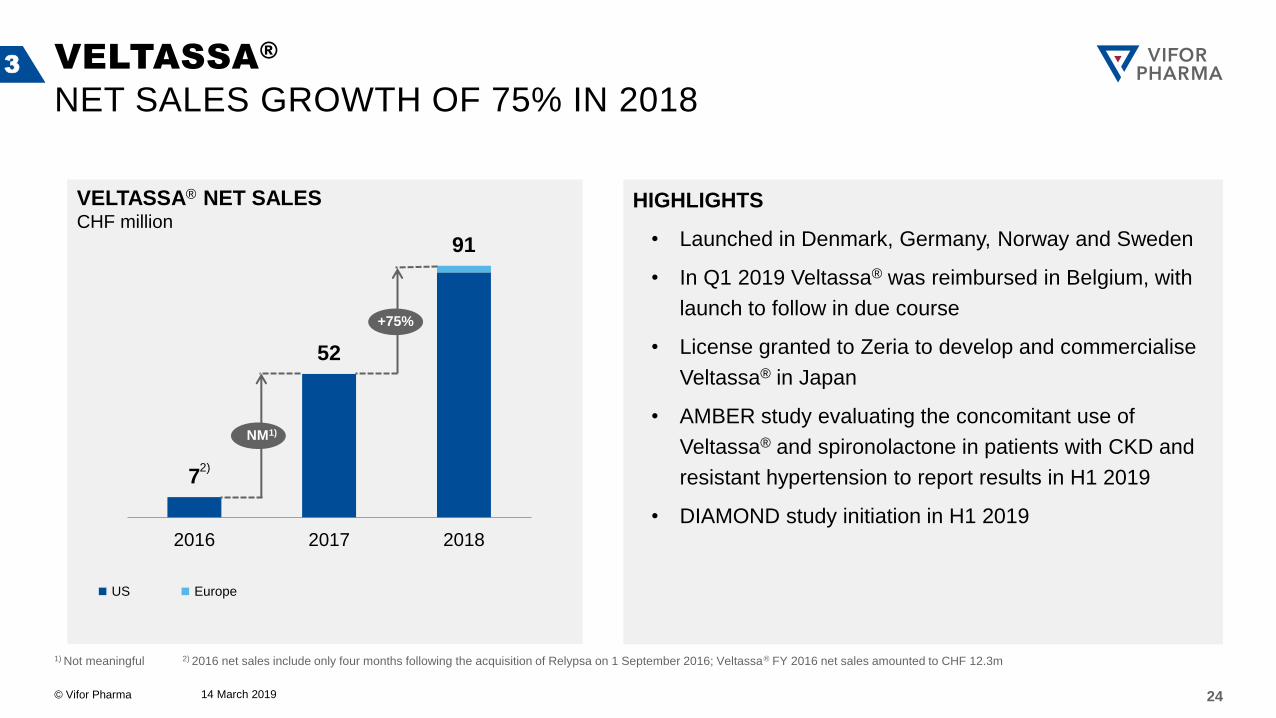
VELTASSA® NET SALES CHF million
7
52
91
2016 2017 2018
14 March 2019 24
1) Not meaningful 2) 2016 net sales include only four months following the acquisition of Relypsa on 1 September 2016; Veltassa® FY 2016 net sales amounted to CHF 12.3m
VELTASSA®
NET SALES GROWTH OF 75% IN 2018
3
NM1)
HIGHLIGHTS
• Launched in Denmark, Germany, Norway and Sweden
• In Q1 2019 Veltassa® was reimbursed in Belgium, with
launch to follow in due course
• License granted to Zeria to develop and commercialise
Veltassa® in Japan
• AMBER study evaluating the concomitant use of
Veltassa® and spironolactone in patients with CKD and
resistant hypertension to report results in H1 2019
• DIAMOND study initiation in H1 2019
US Europe
+75%
2)

© Vifor Pharma 14 March 2019 25
1) % of nephrologists considering Veltassa® as appropriate long-term treatment, Putnam Associates survey 2) Relypsa data on file 3) For all approved claims
VELTASSA® IN THE US
KEY CONSIDERATIONS
Awareness
Usage
Duration of treatment
Payers’ coverage
Prescription (% of nephrologists2))
Pricing Monthly gross price
Median out-of-pocket costs3)
31.12.2018
USD 820
89%
DIAMOND study validation Cardiology
Nephrology: positive feedback1)
~4-5 months
USD 6
94%
3

© Vifor Pharma 14 March 2019 26
CLINICAL PROGRAMS
KEY UPCOMING TRIAL MILESTONES 3
0.8
1.7
2019 2020
H1 2019 - Veltassa®
Read out of the
AMBER study
Q4 2019 - Avacopan
Read out of the
ADVOCATE P-III
study
H1 2019 - Veltassa®
Initiation of the
DIAMOND study
Mid-2019 – Ferroportin inhibitor
Initiation of the P-II study
in beta-thalassemia
Q1/H2 2019 - CR845
Data from the
two KALM P-III
studies
2020 - Ferinject®
Data from the
AFFIRM-AHF
study
2020 - CCX140
Read out of the P-II
study in FSGS
2020 - Vadadustat
INNO2VATE study
read out

© Vifor Pharma
OUTLOOK 2019
CLINICAL TRIALS
MARKET ACCESS
Veltassa®: read-out of the AMBER study (H1 2019)
Veltassa®: initiation of the DIAMOND outcome study for RAASi enabling (H1 2019)
Ferroportin inhibitor: initiation of phase-II study (mid-2019)
Avacopan: phase-III ADVOCATE study readout (Q4 2019)
CR845: KALM-1 and KALM-2 study readouts (Q1 and H2 2019, respectively)
Ferinject® launch in Japan (H2 2019)
Go-to-market strategy in China
Partnering the Japanese rights for CCX140
BUSINESS
DEVELOPEMENT Completion of at least one additional in-licensing, product acquisition or corporate transaction
14 March 2019 27
3
© Vifor Pharma
AGENDA
1
28
2
Vifor Pharma
2018 highlights
3 Business update and outlook 2019
14 March 2019
4 Financial performance and guidance 2019
© Vifor Pharma
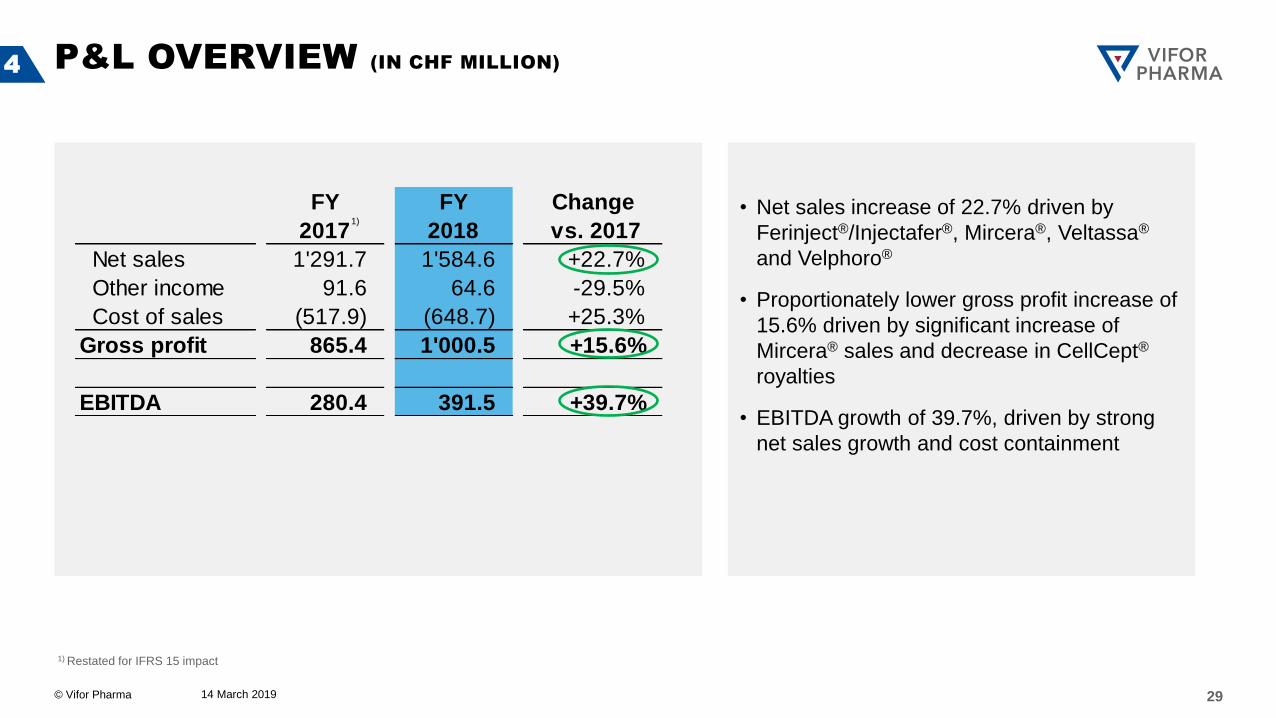
FY
2017
FY
2018
Change
vs. 2017
Net sales 1'291.7 1'584.6 +22.7%
Other income 91.6 64.6 -29.5%
Cost of sales (517.9) (648.7) +25.3%
Gross profit 865.4 1'000.5 +15.6%
EBITDA 280.4 391.5 +39.7%
14 March 2019 29
P&L OVERVIEW (IN CHF MILLION)
1) Restated for IFRS 15 impact
4
• Net sales increase of 22.7% driven by
Ferinject®/Injectafer®, Mircera®, Veltassa®
and Velphoro®
• Proportionately lower gross profit increase of
15.6% driven by significant increase of
Mircera® sales and decrease in CellCept®
royalties
• EBITDA growth of 39.7%, driven by strong
net sales growth and cost containment
1)

© Vifor Pharma
93.4
111.4
8.6
15.1
38.8
10.0
15.6
292.9
+23.8%
+32.8%
NM2)
+7.9%
+18.7%
+75.1%
+4.9%
+22.7%
14 March 2019 30
NET SALES OVERVIEW (IN CHF MILLION)
SOLID GROWTH IN 2018
FY
2017
FY
2018
Ferinject®/Injectafer® 391.8 485.1
Mircera® 339.9 451.3
Venofer® 109.6 118.2
Velphoro® 80.6 95.7
Veltassa® 51.7 90.5
RetacritTM 0.0 10.0
Others 318.2 333.8
Net sales 1'291.7 1'584.6
Growth
in 2018
1) Restated for IFRS 15 impact 2) Not meaningful
4
1)

© Vifor Pharma
FY
2017
FY
2018
Change
vs. 2017
EBITDA 280.4 391.5 39.7%
EBIT 134.3 227.4 69.3%
Financial result (8.7) 42.0 N/A
Taxes (1.6) (25.0) N/A
Profit from continuing operations 124.0 244.4 97.1%
Profit from discontinued operations 1'113.0 - N/A
Net profit before minorities 1'237.0 244.4 -80.2%
Minority interests (89.9) (92.0) +2.3%
Profit after minorities 1'147.1 152.4 -86.7%
Core earnings1)
per share 2.12 4.16 +95.9%
14 March 2019 31
1) Profit after minorities adjusted for amortisation of intangible assets (CHF 117.5 million in 2018)
EARNINGS OVERVIEW (IN CHF MILLION)
• Financial result of CHF 42.0,
mainly driven by FX gains on
intercompany loan repayment
(Relypsa)
• Effective tax rate of 9.3%
benefiting from recognition of
deferred tax assets
• Core earnings per share of
4.16, driven by strong operating
performance and financial
result
4

© Vifor Pharma
31 Dec
2017
31 Dec
2018
Change
vs. 2017
Cash & cash equivalents 425.1 400.3 (24.8)
Receivables 407.4 509.0 101.6
Inventories 232.0 281.7 49.7
Financial investments & other 147.1 266.1 119.0
Deferred tax assets 17.6 88.4 70.8
Property & equipment 245.6 274.0 28.4
Goodwill & intangibles 2'651.1 2'676.0 24.9
Assets 4'125.9 4'495.5 369.6
Current financial liabilities 139.6 116.2 (23.4)
Other current liabilities 449.3 478.3 29.0
Non-current liabilities 204.5 536.4 331.9
Shareholders' equity 3'332.5 3'364.6 32.1
Liabilities & shareholders' equity 4'125.9 4'495.5 369.6
• Receivables increase driven by
net sales increase
• Increase in financial investments
& other mainly driven by:
o ChemoCentryx: CHF 85.4
o Cara Therapeutics: CHF 14.6
• Increase in non-current liabilities
mainly driven by the bond issue of
CHF 463.8 (net proceeds),
partially offset by the repayment of
the private placement of
CHF 114.5
14 March 2019 32
BALANCE SHEET OVERVIEW (IN CHF MILLION)
STRONG EQUITY RATIO OF 74.8%
4
© Vifor Pharma
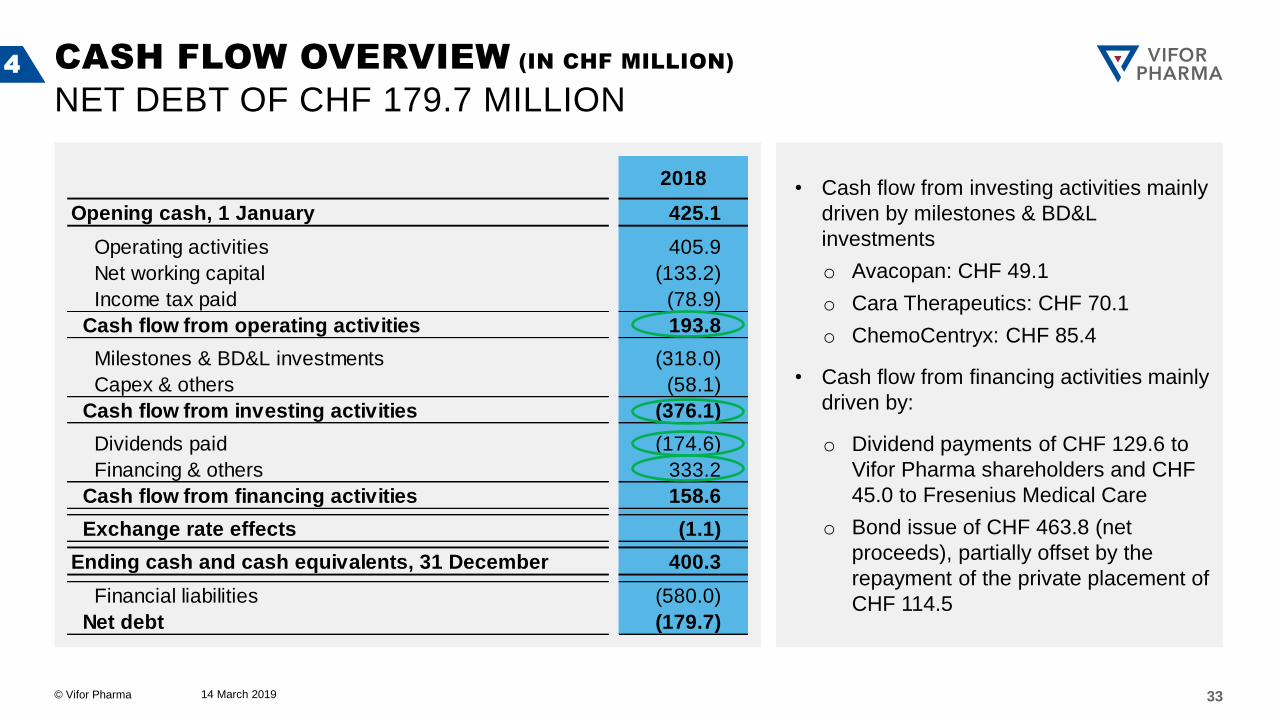
2018
Opening cash, 1 January 425.1
Operating activities 405.9
Net working capital (133.2)
Income tax paid (78.9)
Cash flow from operating activities 193.8
Milestones & BD&L investments (318.0)
Capex & others (58.1)
Cash flow from investing activities (376.1)
Dividends paid (174.6)
Financing & others 333.2
Cash flow from financing activities 158.6
Exchange rate effects (1.1)
Ending cash and cash equivalents, 31 December 400.3
Financial liabilities (580.0)
Net debt (179.7)
• Cash flow from investing activities mainly
driven by milestones & BD&L
investments
o Avacopan: CHF 49.1
o Cara Therapeutics: CHF 70.1
o ChemoCentryx: CHF 85.4
• Cash flow from financing activities mainly
driven by:
o Dividend payments of CHF 129.6 to
Vifor Pharma shareholders and CHF
45.0 to Fresenius Medical Care
o Bond issue of CHF 463.8 (net
proceeds), partially offset by the
repayment of the private placement of
CHF 114.5
CASH FLOW OVERVIEW (IN CHF MILLION)
NET DEBT OF CHF 179.7 MILLION
33
4
14 March 2019

© Vifor Pharma
GUIDANCE 2019
4
In 2019 at constant exchange rates Vifor Pharma net sales are expected to grow
between 11% and 13%, reported EBITDA is expected to increase by 25%.
In 2020 net sales are expected to exceed CHF 2 billion and
EBITDA to be in the range of CHF 700 million.
Going forward the dividend is expected to remain at the current level of CHF 2 per share.
34 14 March 2019

© Vifor Pharma
DISCLAIMER
Certain statements, beliefs and opinions in this presentation are forward-looking, which reflect the Company’s or, as
appropriate, the Company’s directors’ current expectations and projections about future events. By their nature, forward-
looking statements involve a number of risks, uncertainties and assumptions that could cause actual results or events to
differ materially from those expressed or implied by the forward-looking statements. These risks, uncertainties and
assumptions could adversely affect the outcome and financial effects of the plans and events described herein. A multitude
of factors including, but not limited to, changes in demand, competition and technology, can cause actual events,
performance or results to differ significantly from any anticipated development. Forward-looking statements contained
in this presentation regarding past trends or activities should not be taken as a representation that such trends or activities
will continue in the future. As a result, the Company expressly disclaims any obligation or undertaking to release any update
or revisions to any forward-looking statements in this presentation as a result of any change in expectations or any change
in events, conditions, assumptions or circumstances on which these forward-looking statements are based. Neither the
Company nor its advisers or representatives nor any of its of their parent or subsidiary undertakings or any such person’s
officers or employees guarantees that the assumptions underlying such forward-looking statements are free from errors
nor does either accept any responsibility for the future accuracy of the forward-looking statements contained in this
presentation or the actual occurrence of the forecasted developments. You should not place undue reliance on forward-
looking statements, which speak only as of the date of this presentation.
35 14 March 2019