annual report 2017 - viforpharma.com/media/files/v/vifor-pharma/documents/en/... · 2 172 vifor...
TRANSCRIPT

ANNUALREPORT2017

Vifor Pharma Ltd. Annual Report 20172 172
AT A GLANCEANNUAL REPORT 2017
Guidance raised at half-year, continued good performance in H2 led to strong full-year results
› Net sales CHF 1,342.1 million, up 15.2% on a constant currency basis › EBITDA CHF 511.8 million, up 17.7% excluding Veltassa® launch costs › Cash net of debt of CHF 191.1 million
Transformation into a pure-play pharmaceutical company successfully completed
› Separation of Galenica Santé via initial public offering (IPO) › Etienne Jornod re-elected as Executive Chairman with remuneration
exclusively in shares blocked until 2020 › Change of name from Galenica Group to Vifor Pharma Group › New Executive Committee appointed › Operational headquarters transferred from Bern to Zurich
Reported net sales growth of Ferinject® +24.6% for full year 2017
Excellent performance of Veltassa® with net sales of USD 52.7 million
Partnering and licencing deals completed in line with strategy
› Territory expansion to market avacopan everywhere outside the US and China › Exclusive licence agreement to sell vadadustat to FMCNA dialysis clinics
in the US upon FDA approval › Expansion of exclusive Mircera® licence agreement with Roche › Licence agreement to Kissei Pharmaceutical Co. Ltd. to develop and
commercialise avacopan in Japan
Vifor Fresenius Medical Care Renal Pharma
› Excellent performance of Velphoro® (+48.6%) › Mircera® achieves high penetration within the dialysis clinics of
Fresenius Medical Care North America (FMCNA) in the US › Conditional Marketing Authorisation application for avacopan in the treatment
of patients with ANCA-associated vasculitis accepted for review by the EMA

Vifor Pharma Ltd. Annual Report 2017 3 172
02 2017 at a glance 03 Table of contents 04 Executive message 08 Highlights 10 Our vision, mission and strategy 14 Performance overview 18 Key medium-term growth drivers
and products 20 – Ferinject®/Injectafer® 26 – Vifor Fresenius Medical Care Renal Pharma 30 – Veltassa® 32 – Anti-infectives 37 Corporate governance 65 Remuneration 88 Our people 92 Corporate responsibility 96 Consolidated financial statements158 Financial statements of Vifor Pharma Ltd.170 Key dates171 Addresses
TABLE OF CONTENTS
Vifor Pharma Ltd. Annual Report 2017
ExECUTiVE MESSAGE
4 172
ExECUTiVE CHAiRMAN
Dear Shareholder,
It is with great pleasure that I deliver my message as Executive Chairman for the first time following the change in the name of our company to Vifor Pharma. Within the long and successful history of Galenica Group, 2017 was an extraordinary year by any measure.
The success of our company has been based on a vision that drugs based on iron mixed with water and sugar could significantly improve the quality of life of millions of people. As a result of this vision, our reported revenues in 2017 were well in excess of CHF 1.3 billion. By 2020, a combination of our established products, recent launches and our pipeline products is expected to generate revenues in excess CHF 2 billion. At the same time, we plan to increase our EBITDA by more than 20% each year by 2020.
These mid-term objectives represent the first step towards the realisation of our vision to create an ever-more attractive pharmaceutical company and to become a leader in the industry. Our plans are ambitious, but we are absolutely convinced that we will be able to become a major global player.
In 2016 and 2017, we succeeded strategically in exchanging our low-margin Swiss-based wholesale/retail business that was no longer our focus for the global biotech company, Relypsa.
Originally, Galenica Group was established as a purchasing group for Swiss pharmacists. From 1995 onwards, the Group developed into Galenica Santé, a pharmacy chain and service provider in the field of healthcare. The Group also diversified its international activity in various
pharmaceutical sectors under the name Vifor Pharma.
Following the rapid growth of Vifor Pharma, the Board of Directors decided to sell Galenica Santé via an initial public offering (IPO) on the Swiss stock market to pay back the loan related to financing the acquisition of the NASDAQ- listed biotech company, Relypsa, for USD 1.5 billion in September 2016. The IPO, which was completed on 7 April 2017, was an overwhelming success that resulted in a cash-positive position net- of-debt and an equity ratio above 80%. The IPO proceeds also provided a solid financial base that will support the realisation of our business development projects. Subsequent to the IPO, Galenica Group changed its name into Vifor Pharma Group following approval at the annual General Meeting on 11 May 2017.
We are convinced that our loyal and committed shareholders will benefit from this development and the unique position that the company now occupies. It is our conviction that our share price will develop better in the medium term by doing the IPO rather than by simply splitting the Group by splitting its shareholdings. Vifor Pharma Group has an extremely solid basis and a compelling future.

Vifor Pharma Ltd. Annual Report 2017 5 172
The acquisition of Relypsa, fully funded by the IPO, has significantly increased the profile of Vifor Pharma both in the pharmaceutical industry and on the capital markets. Within a six-month period, we concluded the ninth-largest pharma-ceutical M&A transaction and then the largest healthcare IPO globally. These transactions speak for themselves.
Our strategy going forward is focused, clear and simple and is concentrated on the following therapeutic areas:
1. iron deficiency, where Vifor Pharma is clearly the worldwide leader;
2. nephrology, where Vifor Pharma has estab-lished a leadership position due to its unique relationship with Fresenius Medical Care and as a result of the large number of strategic in-licensing deals concluded in the last three years; and
3. cardio-renal therapies, which Vifor Pharma entered as a result of the Relypsa acquisition.
Vifor Pharma has unique expertise with very experienced and talented employees who have joined us from the best companies. The Group’s remarkable achievements in 2017 are an expression of our unique culture and expertise, and our ability to continue to attract talented employees with the best experience in the industry.
They enrich the strong company culture oriented towards our core values, “Passion – entrepreneu rial spirit – together we are stronger – trust – respect”, which are keys for the Board of Directors and essential to the future success of Vifor Pharma. I am grateful to each and every one of our employees for the excellent work that they do.
Our strategic partnerships with some of the best performing and most renowned companies in the world are the cornerstone of our success. A perfect example is our joint company created together with Fresenius Medical Care, the global leader in dialysis products and services.
By joining our respective skills and expertise, we are clearly on the path to become the global leader in nephrology.
In addition, the agreements signed with world-class companies like Roche (for Mircera® in the US), Pfizer (for a biosimilar) and Daiichi Sankyo (for Injectafer® in the US) or with promising and innovating companies like ChemoCentryx, OPKO Health or Akebia Therapeutics demonstrate our ability to attract the best partners.
The implementation of our Milestone 2020 strategy is progressing well and in line with our objectives. All intermediate goals for 2017 have been overachieved. We reconfirm our intention to exceed net revenues of more than CHF 2 billion in 2020 from a combination of very well established and leading products, such as Ferinject®, Venofer®, Veltassa® and Mircera®, but also from new drugs that will be launched soon, such as avacopan, CCX140 and Rayaldee®. In addition, our EBITDA will reach a high triple-digit million level in 2020.
We have a different view of the world because we are a different company that always has a strong sense of what it wants to be. We are fortunate and grateful that you, our shareholders, have supported us time and time again in making our vision reality and in helping us to be the best we can possibly be. On behalf of the Vifor Pharma Board of Directors, thank you.
Sincerely,
Etienne Jornod Executive Chairman of the Board of Directors

Vifor Pharma Ltd. Annual Report 2017
ExECUTiVE MESSAGE
6 172
PRESiDENT OF THE ExECUTiVE COMMiTTEE AND COO
We delivered on our financial guidance, com-pleted the integration of Relypsa, increased the market share of all of our key products and continued to strengthen our product pipeline and partnership network with complementary deals with new and existing partners. In sum, we reached multiple internal and external milestones in 2017 so that we are now in an even better position to help patients around the world with severe and chronic diseases to lead better, healthier lives.
On 8 August, we raised our 2017 full-year guid-ance on the back of our strong half-year results. Overall, our 2017 full-year results surpassed each component of our revised guidance: net sales grew by 15.2% on a constant currency basis and EBITDA increased by 17.7%, excluding the costs to support the launch and ramp-up of Veltassa®. The ramp-up of Veltassa® in the US is progressing according to expectations. Net sales for 2017 reached CHF 51.6 million. In addition, we started to launch Veltassa® in Europe at the end of 2017. The increase of 24.6% in net sales of Ferinject® versus the prior year is in accordance with the expect ation of mid-twenties growth that we communi cated in our Half-Year 2017 Report on 8 August. Global in- market sales data grew by 29.4% (source: IQVIA, from December 2017, with moving annual total growth, MAT, versus the prior year) and clearly shows that Ferinject® is
Dear Shareholder,
2017 was a truly outstanding year, marked by several key milestones around our company’s transformation towards becoming a global leader in iron deficiency, nephrology and cardio-renal therapies. Following our very successful separation from Galenica Santé via an initial public offering (IPO) on 7 April, we are now fully focused on delivering pharmaceuticals and innovative, patient-focused solutions.
the main driver of overall i.v. iron market growth. The strong growth in Velphoro® sales and the high pene tration rate for Mircera® within the dialysis clinics of Fresenius Medical Care North America (FMCNA) are other highlights of our exceptional operational performance in 2017.
In 2017, we concluded a number of strategic in-licensing deals to access innovation to the benefit of patients. We were granted additional rights from ChemoCentryx to commercialise avacopan everywhere outside the US and China. We entered into an exclusive licence agreement with Akebia Therapeutics to sell vadadustat to FMCNA dialysis clinics in the United States upon approval by the US Food and Drug Administration (FDA) and inclusion of vadadustat in a bundled reimbursement model. We granted Kissei Pharmaceutical Co. Ltd. rights to develop and commercialise avacopan (CCX168) in Japan. We expanded our Mircera® licence with Roche, giving us access to additional volume. This allowed us to initiate sales to third parties in the US (outside of FMCNA) in Q4 2017. After period- end a Notice of Compliance was issued for Velphoro® in Canada on 5 January 2018. The European Medicines Agency accepted for review a Conditional Marketing Authorisation appli-cation for avacopan in the treatment of patients with ANCA-associated vasculitis.

Vifor Pharma Ltd. Annual Report 2017 7 172
We are extremely proud of our employees’ outstanding achievements in 2017 and we are grateful for their efforts to ensure a strong start to 2018. We will forge ahead to deliver on our medium-term guidance of net sales exceeding CHF 2 billion and EBITDA reaching a high, triple-digit level by 2020. Accordingly, we will focus on leveraging our three medium- term growth drivers.
– Firstly, we will ensure that Ferinject®/Injectafer® achieves in-market sales of more than CHF 1 billion in 2020 at the latest by continuing to build market awareness of iron deficiency and iron deficiency anaemia on a global basis and by leveraging the strong clinical data supporting Ferinject®/Injectafer®.
– Secondly, we will focus on our compelling product portfolio from Vifor Fresenius Medical Care Renal Pharma (VFMCRP), continue to strengthen our collaboration with Fresenius Medical Care and to provide innovative, patient-focused solutions to address the needs of patients with chronic kidney disease (CKD).
– Thirdly, we will ensure that Veltassa® is on track to achieve its blockbuster potential as the new standard of care for patients with hyper-kalaemia. In the US, we will continue to raise the level of awareness and work with payers on advancing access to therapy for patients. With the launches in Europe, we will significantly expand the number of patients who can benefit from this innovative treatment.
The decision of numerous world-class pharma-ceutical and biotech companies to partner with Vifor Pharma Group is something we are very proud of. Their decision to work with us is also an independent validation of our increasing strength and successful progress towards being the global leader in iron deficiency, nephrology and cardio-renal therapies. Going forward, we will proceed deliberatively and collaboratively to strengthen our portfolio and partner network so that patients everywhere benefit from cutting- edge therapies and better treatment options.
Finally, on behalf of the entire Executive Commit-tee, I wish to express our thanks to our share-holders and to our employees for their continued loyalty and support during this transformational period.
Very sincerely,
Stefan Schulze President of the Executive Committee and COO

Vifor Pharma Ltd. Annual Report 2017
ANNUAL REPORT 2017
8 172
HiGHLiGHTS
FINANCIAL HIGHLIGHTS
IPO of Galenica Santé
Largest healthcare IPO globally and oversubscribed multiple times; IPO leaves Vifor Pharma net of debt in a cash-positive position
2017 net sales
Mircera® sales attributable to Vifor Pharma grow to
million CHF
Net sales growth of Ferinject®
Veltassa® launch and ramp-up costs
1,342.1million CHF up 15.2% vs 2016 on a constant currency basis
EBITDA Share split
share split and 2016 annual dividend of CHF 2 per registered share (CHF 20 per share before share split) approved by shareholders
+17.7% 1:10or CHF 511.8 million excluding Veltassa® launch and ramp-up costs of CHF 231.5 million
Net cash
191.1million CHF as at 31 December 2017
Veltassa® net sales of
51.7
231.5 339.9million CHFas at 31 December 2017
for full-year 2017
+24.6%
million CHF

Vifor Pharma Ltd. Annual Report 2017 9 172
STRATEGIC HIGHLIGHTSContinued focus on mid-term strategic growth drivers
Leadership team Milestone 2020 strategy
Executive Committee strengthened
Milestone 2020 strategy launched, with investments committed to launch and rollout new products (impact on EBITDA 2016–2019: CHF 850 million).
Ferinject®/Injectafer®
Daiichi Sankyo designates Injectafer® as one of its most important growth drivers in the United States and is focusing a substantial portion of its commercial effort to promote Injectafer® in the United States
Initiation of first Ferinject® study (AFFIRM-AHF) in acute heart failure
Veltassa®
Net sales of Veltassa® of CHF 51.6 million in the US (USD 52.7 million) compared to CHF 12.3 million in the US in 2016 (including revenues prior to Relypsa acquistion)
After positive opinion from the Committee for Medicinal Products for Human Use (CHMP) on 18 May, the European Commission approved Veltassa® for hyperkalaemia in adults on 19 July
Further strengthening of nephrology pipeline through strategic partnerships
Licence agreement with Akebia Therapeutics to sell vadadustat exclusively to Fresenius Medical Care North America dialysis clinics in the US in a bundled reimbursement model
Expansion of rare diseases collaboration with ChemoCentryx, including rights to avacopan (CCX168) to market avacopan everywhere outside the US and China
VFMCRP granted exclusive rights to Kissei Pharmaceutical Co., Ltd. to develop and commercialise avacopan (CCX168) in Japan
Mircera® net sales up
3.4%

Vifor Pharma Ltd. Annual Report 2017
ANNUAL REPORT 2017
10 172
OUR ViSiON, MiSSiONAND STRATEGY
OUR MARKETS
Vifor Pharma operates in the international iron deficiency, nephrology and cardio-renal markets both directly and through collaborations with partners. Factors affecting the global market for pharmaceuticals include continued population growth, greater longevity and rising wealth, particularly in developing economies, leading to increased global expenditure on healthcare and medicines. At the same time, the industry is affected by pressures to reduce the costs of healthcare in most markets, challenges over pricing levels for innovative medicines and competition from generic products.
iron deficiency Vifor Pharma has pioneered the field of iron-based products, growing to become the world leader in the treatment of iron deficiency. Iron deficiency is estimated to affect 37–61% of patients with chronic heart failure (CHF), 24–85% of patients with chronic kidney disease (CKD) and 13–90% of patients with inflammatory bowel disease (IBD).1
Our leadership and expertise in iron deficiency is built around innovative and trusted brands such as Ferinject®/Injectafer®, Venofer® and Maltofer®.
Vifor Pharma believes there is a major opportun-ity to expand the use of i.v. iron, both thera-peutically and geographically. We work with partners to drive awareness of Ferinject® and generate clinical data in areas of high unmet need beyond nephrology and dialysis, including heart failure, gastroenterology and patient blood management (PBM).
1 Source: Cappellini MD et al Am J Hematol. 2017 Oct; 92(10): 1068–1078. doi: 10.1002/ajh.24820.
With the transformation of Vifor Pharma Group into a pure-play pharmaceutical company, we redefined our vision and mission in 2017.
Our vision
Global leader in iron deficiency, nephrology and cardio-renal therapies. The partner of choice for specialty pharmaceuticals and innovative patient-focused solutions.
Our mission
We strive to help patients around the world with severe and chronic diseases lead better, healthier lives.

Vifor Pharma Ltd. Annual Report 2017 11 172
NephrologyVifor Pharma’s focus on the global nephrology market is based on its product portfolio and its fast-growing joint company, Vifor Fresenius Medical Care Renal Pharma (VFMCRP). VFMCRP combines Vifor Pharma’s pharmaceutical exper-tise with Fresenius Medical Care’s leadership in patient care, especially dialysis services. The objective of the joint company is to provide pharmaceutical products and innovative solutions to treat the symptoms and progression of chronic kidney disease (CKD) to more than 320,000 dialysis patients served by Fresenius Medical Care, other dialysis patients and patients with non-dialysis CKD. Products offered by VFMCRP cover three essential therapeutic areas: anaemia management, mineral and bone disorder man-agement and renal protection.
In the US, approximately six million adults are estimated to have some form of iron deficiency anaemia (IDA), which is often underdiagnosed and undertreated. Only around 20% of these receive i.v. iron, representing a significant growth opportunity.2 Our US partner, Daiichi Sankyo, is focused on building a blockbuster franchise by maintaining Venofer®’s market leadership in dialysis and hospital settings, while strengthening Injectafer®’s market leadership with haematolo-gists and oncologists. It is seeking to expand the use of Injectafer® in gastroenterology, cardi ology, obstetrics, gynecology and nephrology, supported by extensive clinical studies.
Vifor Pharma is also expecting to launch Ferinject® into major new markets, such as in China and in Japan with our partner, Zeria Pharmaceutical Co Ltd.
2 Source: Looker AC, Dallman PR, Carroll MD, Gunter EW, Johnson CL. Prevalence of iron deficiency in the United States. JAMA. 1997;277(12):973–976. 2. Centers for Disease Control and Prevention. Iron deficiency – United States, 1999–2000. MMWR. 2002;51(40):897-9. 3. U.S. Census Bureau. 2014 American Community Survey 1-Year Estimates.

Vifor Pharma Ltd. Annual Report 2017
OUR ViSiON, MiSSiON AND STRATEGY
12 172
The prevalence of CKD is increasing worldwide. This is due to ageing populations in developed countries and to the increase in the prevalence of specific diseases that increase the risk of develop-ing CKD, for example hypertension and diabetes.
The US, Europe and Japan are expected to remain the most significant markets for CKD treatment, accounting for more than 80% of total sales worldwide. Anaemia treatments, in par-ticular ESA and i.v. iron, currently represent the largest therapy area. The area of renal protection offers the largest growth opportunities for new products and services in several diseases that affect the kidney function and often lead to complete renal failure and subsequently the need for dialysis.
Cardio-renalVifor Pharma is also targeting the cardio-renal market, initially through its i.v. iron product, Ferinject®/Injectafer®, and through Veltassa®, the first new treatment for hyperkalaemia approved in the US for more than 50 years. Hyperkalaemia is defined as abnormally elevated levels of potassium in the blood, and is a serious condition that can lead to life-threatening cardiac arrhythmia and sudden death. It is frequently prevalent in patients who suffer from CKD, hypertension, diabetes and/or heart failure. Hyperkalaemia represents a major market opportunity, with an estimated three million patients affected in both the US and Europe, and a further one million in Japan.
OUR BUSiNESS MODEL AND STRATEGY
Vifor Pharma is an entrepreneurial pharmaceuti-cal company focused on clearly defined thera-peutic areas in iron deficiency, nephrology and cardio-renal diseases, where we aim for global leadership. We use our expertise in research, development, regulatory affairs, manufacturing and commercialisation to bring innovative products and services to patients around the world.
Building on several decades of global leadership in the treatment of iron deficiency, we have used our expertise in iron deficiency to expand into the complementary fields of nephrology and cardio- renal diseases through world class partnerships and the in-licensing of best-in-class products. By focusing principally on commercial and late- stage opportunities, we seek to mitigate risk and offer clear visibility to investors.
Vifor Pharma moved into the field of nephrology through the establishment of VFMCRP, our joint company with Fresenius Medical Care in 2010. Since 2015, our nephrology portfolio has been significantly enhanced and expanded via seven product in-licensing agreements. This is a significant achievement and a testament to the strength and depth of our unique partnership with Fresenius Medical Care.
With the acquisition of Relypsa and the ground- breaking hyperkalaemia therapy Veltassa® in 2016, Vifor Pharma entered the third phase of its growth strategy by moving into cardio-renal therapy.

Vifor Pharma Ltd. Annual Report 2017 13 172
Partnering is an essential component of our success. We market products directly in leading markets through our global commercial organisa-tion. Through licensing agreements, we offer partner companies access to our unique relation-ships with clinicians, patients and clinics. The company will continue to expand its portfolio through in-licensing agreements for innovative pharmaceuticals for late-stage development assets, while focusing early-stage research on areas of proven expertise in iron chemistry and biology. At the same time, we seek and maintain strong relationships with outstanding local partners for our products in other markets such as Russia, Japan, China and other countries in Europe, Asia, the Middle East and Latin America.
Vifor Pharma has set out a plan to achieve net revenues of more than CHF 2 billion in 2020 by maximising the performance of its three key growth drivers, the potential blockbuster products, Ferinject®/Injectafer® and Veltassa® and its joint company, VFMCRP.
Vifor Pharma has committed CHF 850 million of targeted investment to the launch and rollout of new products from 2016 through the end of 2019. Initiatives include extensive phase-IV programmes to expand the uptake of products such as Ferinject®/Injectafer® and increased market awareness of the medical benefits of Veltassa® in cardiology as well as nephrology.
Current product portfolio
PHASE 1 PHASE 2 PHASE 3 PRE- COMMERCiAL
COMMERCiAL PHASE 4
Own Products
Ferroportin inhibitor¹
in-licensed Products
Mircera®
Biosimilar epoetin alfa
CCX140 > 2018
Rayaldee® > 2019
Avacopan > 2020²
Vadadustat³ > 2021
1 Iron overload; leveraging iron metabolism expertise.2 Earlier launch possible due to EMA conditional marketing approval3 Filing expected by the end of 2019.
Ferinject® > AFFIRM-AHF
Venofer®
Maltofer®
Velphoro® > Paediatric
Veltassa® > AMBER
Anti-infectives

Vifor Pharma Ltd. Annual Report 2017
ANNUAL REPORT 2017
14 172
PERFORMANCE OVERViEW
KEY PROFiT AND LOSS FiGURES
Vifor Pharma Group net sales for 2017 grew to CHF 1,342.1 million, a strong increase of 15.0% versus the prior year or of 15.2% on a constant currency basis. Reported EBiTDA in 2017 decreased to CHF 280.4 million compared to CHF 322.2. million in the prior year. However, excluding the costs to support the launch and ramp-up of Veltassa® of CHF 231.5 million in 2017 and CHF 112.6 million in 2016, EBiTDA increased by 17.7% versus the prior year to CHF 511.8 million. This increase was due to the strong growth in sales combined with cost containment.
Cost of sales amounted to CHF 517.9 million in 2017 compared to CHF 445.7 million in the prior period, resulting in a gross profit margin of 68.2% compared to 70.4% in the previous year. The strong growth of higher margin products such as Ferinject® was offset by the fact that in accordance with IFRS, the amortisation of the Veltassa® intangible asset is charged to cost of sales on a straight-line basis.
Marketing and distribution expenses amounted to CHF 434.0 million, up 29.8% from the prior period. This increase was mainly driven by the acquisition of Relypsa and some additional invest- ments in the European commercial organisation in preparation for the Veltassa® launch in 2017.
Research and development expenses increased to CHF 185.1 million compared to CHF 121.8 million in the previous year. This was primarily driven by the full-year impact of the Relypsa organisation following the acquisition of the company on 1 September 2016 as well as investments in landmark Ferinject® cardiology studies.
General and administration expenses amounted to CHF 162.4 million compared to CHF 129.0 million in the previous year. The increase is attributable to the additional costs from the acquisition of Relypsa.
Other operating income declined to CHF 91.6 million in 2017 from CHF 100.4 million in 2016. This was primarily due to royalty payments from Cellcept decreasing to CHF 78.9 million in 2017 from CHF 86.4 million in 2016.
The financial result in 2017 of CHF –8.7 million consists mainly of interest payments on the bridge loan of CHF 1,450.0 million that was put in place to finance the acquisition of Relypsa on 1 September 2016. This loan was fully repaid on 11 April 2017.
Tax expense of CHF –1.6 million was reported in 2017. Current taxes of CHF –57.8 million were almost completely offset by deferred tax benefits of CHF +56.2 million predominantly related to the Relypsa acquisition.
Net profit after minorities for 2017 amounted to CHF 1,147.1 million compared to CHF 237.0 million in the previous year. The significant increase was due to the profit from discontinued operations following the divestiture of Galenica Santé.
Core earnings per share in 2017 were CHF 2.12. Core earnings are defined as reported earnings after minorities adjusted for amortisation of intangible assets and goodwill to normalise for the significant impact from the acquisition of Relypsa. In 2017, attributable amortisation of intangible assets and goodwill amounted to CHF 103.7 million.
CASH FLOWS AND FiNANCiAL POSiTiON
Cash flow from operating activities for 2017 amounted to CHF 60.3 million compared to CHF 258.7 million in the previous year.
Cash flow from investing activities was CHF 2,065.0 million due to divestiture of Galenica Santé via an IPO generating proceeds of CHF 1,797.7 million and the repayment of a CHF 360.0 million loan from Galenica Santé

Vifor Pharma Ltd. Annual Report 2017 15 172
being partially offset by investments of CHF 92.7 million.
Cash flow from financing activities of CHF –1,881.5 million was mainly due to the repayment of the Credit Suisse bridge loan of CHF 1,450.0 million and of the public bond of CHF 300.0 million in October. In addition, the 2016 dividend of CHF –129.9 million was distrib uted to shareholders in May 2017.
The overall cash flow for 2017 was therefore CHF 244.2 million, resulting in an increase in the cash position from CHF 180.9 million at the end of 2016 to CHF 425.1 million as of 31 December 2017.
SOLiD BALANCE SHEET
Goodwill and intangible assets at the end of 2017 amounted to CHF 2.7 billion or 64.5% of total assets of CHF 4.1 billion, with the majority of these related to the acquisition of Relypsa. Cash and cash equivalents at the end of 2017 amounted to CHF 425.1 million or 10.3% of total balance sheet assets. Cash net of outstanding debt was CHF 191.1 million resulting in a net-cash-to- EBITDA ratio of 0.68x at the end of 2017. With CHF 3.3 billion of shareholders’ equity Vifor Pharma had a strong equity ratio at the end of 2017 of 80.8%.
DiSCONTiNUED OPERATiONS
Cash flow from discontinued operations amounted to CHF 7.0 million and represents the Galenica Santé business that was separated via an IPO on 7 April 2017. This total consists of CHF 32.0 million that was invested into the operating activities primarily due to an increase in accounts receivables, being more than offset by divest-ments and financing activities of CHF 4.9 million and CHF 34.1 million, respectively. The CHF 1,797.7 million net proceeds from the Galenica Santé IPO were disclosed separately and were primarily used to repay the bridge loan including interest of CHF 1,457.0 million.
Net sales
1,342.1million CHF in net salesduring 2017, a strongincrease of 15.0% versusthe prior year
EBITDA
+17.7%or CHF 511.8 million versusthe prior year, excluding thecosts to support the launchand ramp-up of Veltassa®

Vifor Pharma Ltd. Annual Report 2017
ANNUAL REPORT 2017
16 172
OUTLOOK: CLiNiCAL
In the post-reporting period, VIT-2763, our ferroportin inhibitor, entered clinical development with a phase-I, first-in- human study in early March of 2018.
Recruitment will continue in the AFFIRM-AHF phase-IV trial of Ferinject® for acute heart failure. The trial is the first study to investigate the effects of i.v. iron therapy on mortality and morbidity of acute heart failure patients. The study will recruit about 1,100 patients with data readout expected in 2019. A phase-III pivotal approval study of Ferinject® in China is progressing according to plan.
Recruitment for the AMBER study of Veltassa® for treatment of patients with resistant hypertension started in 2016 and is expected to conclude at the end of 2018, with top-line results at the beginning of 2019. The EMERALD study, initiated in 2017, to test the safety and efficacy of Veltassa® in paediatric patients is progressing as planned.
A study to test the safety and efficacy of Velphoro® for treating hyperphosphataemia in adults is expected to begin in China in 2018.
Trials underway with our partner, ChemoCentryx, for avacopan and CCX140 are progressing according to expectation.
OUTLOOK 2018 AND GUiDANCE

Vifor Pharma Ltd. Annual Report 2017 17 172
In 2018 at constant exchange rates, Vifor Pharma net sales are expected to grow by more than 10% and reported EBITDA is expected to increase by more than 20%.
In 2020 net sales are expected to exceed CHF 2 billion and EBITDA to reach a high triple-digit level.
For 2018 and 2019, the dividend is expected to be at the same level as for 2017. From 2020 onwards, the payout ratio is targeted at 35% of net income.
OUTLOOK: PRODUCT LAUNCHES
The European Medicines Agency (EMA) approved the marketing authorisation for Veltassa® on 19 July 2017. The product was made available for patients in the UK, Norway and Denmark in 2017. Full launches across the rest of Europe are expected in 2018 and 2019.
OUTLOOK: PARTNERiNG
We expect to partner the Japanese rights of both Veltassa® and CCX140 during the course of 2018. We are targeting the completion of one in-licensing deal before the end of 2018.
GUiDANCE

Vifor Pharma Ltd. Annual Report 201718 172
FERINJECT®
N°1intravenous iron product worldwide
75Approved in 75 countries
3 48.6%339.9increase in net salesCHF million in net sales
3/3/12030Addressable patient population US: 3 millionEurope: 3 millionJapan: 1 million
Patent term to at least 2030
indications now granted orphan disease designation (ODD) with the addition of C3 glomerulopathy (C3g) in both Europe and the US
6.3millionpatient years of experience since launch
VIFOR FRESENIUS MEDICAL CARE RENAL PHARMA
Mircera® Velphoro® Avacopan
VELTASSA® Patent term Addressable patients
AT A GLANCEKEY MEDiUM-TERM GROWTH DRiVERS
Patient yearsMarket-leading product Available worldwide
Payer coverage
85%for all US covered lives

Vifor Pharma Ltd. Annual Report 2017 19 172
iron deficiency Nephrology Cardio-renal
Vifor Pharma has three medium-term strategic growth drivers
Ferinject®/Injectafer®, the world’s leading intravenous (i.v.) iron product — The joint company, Vifor Fresenius Medical Care Renal Pharma (VFMCRP), providing innovative pharma solutions to address the needs of nephrology patients— Veltassa®, the first novel treatment of hyperkalaemia in more than fifty years in the United States
STRONG PERFORMANCE iN 2017
KEY MEDiUM-TERM GROWTH DRiVERS

Vifor Pharma Ltd. Annual Report 2017
KEY MEDiUM-TERM GROWTH DRiVERS
20 172
FERiNJECT®/iNJECTAFER®
The first of our medium-term growth drivers is Ferinject® (in the US and Belgium: Injectafer®), which is the market-leading intravenous (i.v.) iron therapy. In 2017, Ferinject® celebrated ten years on the market. By the end of 2017, this product was approved in 75 countries, with over 6.3 million years of patient experience, demonstrating broad market demand as well as the safety and tolerability of the brand. Vifor Pharma is committed to building market awareness of the benefits of i.v. iron therapy to patients in multiple therapeutic areas.
Given its current trajectory and the substan-tial remaining unmet medical need, Ferinject® is on track to achieve in-market sales in excess of CHF 1 billion by 2020.
REPORTED NET SALES iN 2017
In 2017, reported net sales of Ferinject® increased by CHF 86.1 million (24.6%) to 435.6 million compared to the previous year. This is absolutely in line with the commitment that was made in our H1 2017 report for full-year growth to be in the mid-twenties percentage range.
iN-MARKET SALES
We closely monitor in-market sales to determine actual growth rates for the product. Among other things, we also use this data to quantify the effect of phasing and timing differences as described above.
The latest available IQVIA data from December 2017 indicates global market sales of Ferinject®/Injectafer® of approximately CHF 696 million, an increase of 29.4% versus the prior-year period. In addition, we saw a robust increase in overall i.v. iron market share to 70% compared to the prior year.
Injectafer® (US name of Ferinject®) keeps driving the growth of the US intravenous iron market. US partner Luitpold Pharmaceuticals, Inc., recorded net sales of USD 273.6 million in 2017, an increase of 36.4%. As a result, Vifor Pharma posted net sales of CHF 91.2 million.
The absolute annual increase of Ferinject®/Injectafer® sales is expected to remain on trend, continuing to grow in the high double-digit millions. As overall sales value increases, the baseline level of usage continues to increase, the annual percentage growth rate will reflect a lower number, despite continued on-trend growth.

Vifor Pharma Ltd. Annual Report 2017 21 172
iNJECTAFER® (US)
In-market sales of Injectafer® were CHF 295 million in 2017 compared to CHF 215 million in the same period of the prior year, an increase of 37%. In the US, Vifor Pharma receives approximately one third of Daiichi Sankyo’s reported Injectafer® net sales, resulting in reported net sales of CHF 91.2 million in 2017 compared to CHF 67.4 million in 2016.
In January 2017, Daiichi Sankyo designated Injectafer® as one of its most important growth drivers in the US and decided to further increase commercial resources toward building Injectafer® into a blockbuster. During the second half of the year, this increased focus started to generate additional sales momentum for Injectafer® in the US market for i.v. iron products and the proper treatment of patients suffering from iron defi-ciency anaemia.
Ferinject®/Injectafer®: approved in 75 countries worldwide
Countries where approved

Vifor Pharma Ltd. Annual Report 201722 172

Vifor Pharma Ltd. Annual Report 2017 23 172
In April 2017, the American College of Cardiology/ American Heart Association/Heart Failure Society of America (ACC/AHA/HFSA) issued an update of the guidelines for the management of heart failure. This update included a new recommenda-tion that intravenous repletion of iron, especially in the setting of concomitant hepcidin deficiency in heart failure, may improve exercise capacity and quality of life (QoL).
FERiNJECT® OUTSiDE THE US
Net sales of Ferinject® outside the US (Injectafer® in Belgium) in 2017 increased by 22.1% to CHF 344.3 million compared to CHF 282.1 million in the previous year.
iMPORTANT SCiENTiFiC AND MARKET AWARENESS ACTiViTiES
Data-driven amendments to the label continue to strengthen the benefit-risk profile and differen-tiated value proposition of Ferinject® compared with other i.v. iron products. These amendments include a new cardiology section based on data from the Chronic Heart Failure (CONFIRM-HF) study, which demonstrates the potential of Ferinject® to reduce recurrent hospitalisation due to heart failure.
As part of its continued commitment to improving the lives of patients suffering from heart failure with iron deficiency, Vifor Pharma has initiated a large randomised, controlled trial in acute heart failure, the AFFIRM-AHF trial. This trial will investigate the effect of Ferinject® on outcomes in vulnerable patients after stabilisation following an episode of acute heart failure. In addition, morbidity and mortality outcomes with Ferinject® versus placebo will also be analysed inde-pendently in the FAIR-HF2 investigator initiated study. Results from these studies are anticipated from 2019 onwards.
In addition, American Regent, a member of the Daiichi Sankyo group, is currently conducting one of the largest studies of i.v. iron in heart failure, the HEART-FID study. HEART-FID is a double- blind, multi-centre, prospective, randomised, placebo-controlled study to assess the efficacy and safety of Injectafer® in the treatment of patients with heart failure, iron deficiency and a reduced ejection fraction. Iron deficiency affects up to half of all heart failure patients. In April 2017, American Regent announced that the first patient had been enrolled into the study.
The clinical trials required for registration in Japan and China are currently being conducted, with study completion and clinical study report targeted for 2018 in Japan and for 2020 in China.
6.3millionOver 6.3 million patient years of experience since launch
Ferinject®: ten years on the market

Vifor Pharma Ltd. Annual Report 2017
KEY MEDiUM-TERM GROWTH DRiVERS
24 172
The use of Ferinject® was supported by a wide range of scientific presentations and publications during 2017. These included:
– A meta-analysis of four randomised, controlled trials comparing Ferinject® to placebo was published in April 2017 in the “European Journal of Heart Failure” and demonstrated significant reductions in the rate of recurrent cardiovascular hospitalisations and cardiovas-cular death for patients treated with Ferinject® versus placebo. In addition, the positive results of the EFFECT-HF study were published online in “Circulation” in July 2017 and in the print edition in October 2017. These results rein-force the significant beneficial effect of treating iron deficiency in heart failure patients with Ferinject®.
– A network meta-analysis was published in the “Journal of Alimentary Pharmacology and Therapeutics” in March 2017. The study, which compares the efficacy and tolerability of different intravenous iron formulations for the treatment of iron deficiency anaemia in patients with inflammatory bowel disease, showed that Ferinject® was the most effective among the intravenous products compared.
– Data supporting the concept that alternative therapies should be considered early in the management of renal anaemia in patients who do not respond to oral iron were presented at the 54th Annual Congress of the European Renal Association and European Dialysis and Transplant Association (ERA-EDTA) in Madrid in June 2017. Data from a post-hoc analysis of the response rate in patients randomised to the oral iron arm of the FIND-CKD clinical trial showed a low rate of early response to oral iron therapy in patients with renal anaemia, with less than half of these early non-responders showing a subsequent response. The findings were accepted for publication in “Clinical Nephrology” in December 2017.
– An expert review entitled “Iron deficiency across chronic inflammatory conditions: International expert opinion on definition, diagnosis and management” was published by the “American Journal of Hematology” in July. The review was part of the Iron Core Initiative started in 2016, led by a steering committee of 14 expert physicians spanning cardiology, gastroenterology, nephrology, haematology, patient blood management, epidemiology and women’s health, with the aim of establishing iron deficiency as a distinct health-related condition separate from anaemia. The authors hope the paper will be used as a guideline for better diagnosis and treatment of iron defi-ciency without anaemia in patients with chronic heart failure, chronic kidney disease and inflammatory bowel disease.
– A supplement dedicated to iron therapy in CKD was published in “Clinical Kidney Journal” in December 2017. The supplement contained articles covering the KDIGO (Kidney Disease Improving Global Outcomes) guidelines for the use of iron therapy in patients with CKD, the implications of randomised clinical trials and observational analyses and recent evidence on the use of iron therapy to treat iron deficiency, particularly in patients with heart failure.

Vifor Pharma Ltd. Annual Report 2017 25 172
In addition to the leading intravenous iron therapy, Ferinject®, Vifor Pharma develops complex iron products for other therapeutic areas, such as for iron deficiency in dialysis and most recently for iron overload.
VENOFER®
Venofer®, the originator i.v. iron sucrose product, continued to be the leading intravenous iron brand in terms of volume usage worldwide and is the trusted gold standard in iron therapy for dialysis patients. In 2017, more than 31 million doses of Venofer® equivalent to 100 mg were used worldwide. Overall monitored usage of Venofer® now correlates to over 22.8 million patient years of clinical experience.
The positive experience of generations of physicians and patients has helped to secure the position of Venofer® in a highly competitive environment of iron sucrose similars. The reliabil-ity of Venofer® is a key differentiator and one of the main reasons the brand retains strong demand after many decades on the market.
In 2017, Venofer® net sales decreased by 11.8% versus prior year to CHF 110.3 million. The majority of Venofer® sales continue to be in the US market, where sales remained stable in 2017 due to the strong collaboration in nephrology between Daiichi Sankyo and Fresenius Medical Care North America.
Outside North America, Venofer® is distributed mainly via our partner network and therefore reported net sales in any single period can be significantly affected by the ordering patterns of our partners.
VFMCRP continued to support Kidney Research UK on the PIVOTAL trial, the largest-ever study to investigate optimised iron deficiency treatment in haemodialysis patients, which includes the use of Venofer®. The study is expected to be completed in mid-2018.
MALTOFER®
Net sales of other iron products totaled CHF 69.1 million in 2017, an increase of 7.7% compared to the prior year. This includes sales of the leading oral iron product Maltofer®, which has now been on the market for more than fifty years. In 2017, net sales of Maltofer® increased by 6.9% compared to the prior year to CHF 58.8 million, primarily due to the phasing of shipments to markets in southern and eastern Europe. Going forward, net sales of Maltofer® are expected to remain stable.
ViT-2763 IN DEVELOPMENT
VIT-2763 is the first-ever oral ferroportin inhibitor for treating patients suffering from iron overload. A Clinical Trial Application (CTA) was submitted for VIT-2763 in November 2017 for a phase-I clinical trial in healthy volunteers It was approved on 19 December 2017. In the post-reporting period, VIT-2763, our ferroportin inhibitor, entered clinical development with a phase-I, first-in-human study in early March of 2018.
Other key complex iron products

Vifor Pharma Ltd. Annual Report 2017
KEY MEDiUM-TERM GROWTH DRiVERS
26 172
ViFOR FRESENiUS MEDiCAL CARE RENAL PHARMA (VFMCRP)
Our second medium-term strategic growth driver is Vifor Fresenius Medical Care Renal Pharma (VFMCRP), our joint company with Fresenius Medical Care. VFMCRP was estab-lished in 2010 and is dedicated to addressing the needs of dialysis and chronic kidney dis-ease patients around the world. The collabo-ration with Fresenius Medical Care provides VFMCRP access to the world’s largest net-work of dialysis clinics. The joint company has already built a strong product portfolio by concluding commercial, pre-commercial and late-stage in-licensing deals and is well pos-itioned to achieve its goal of being the global leader in nephrology while focusing on renal pharmaceuticals and innovative, patient- focused solutions.
MiRCERA®
Mircera® is a long-acting erythropoiesis-stimulat-ing agent (ESA) that was licensed from Roche in May 2015 to treat symptomatic anaemia associ-ated with chronic kidney disease. Vifor Pharma has exclusive rights to commercialise Mircera® in the US and its territories. In September 2017, Vifor Pharma and Roche expanded their collabor-ation agreement, giving Vifor Pharma access to additional supplies of Mircera® for the US market. This increased volume will enable Vifor Pharma to meet the needs of new and existing partners. This agreement allowed us to initiate sales to third parties in the US outside Fresenius Medical Care North America in Q4 2017. Following a successful rollout of Mircera® at Fresenius Kidney Care clinics, more than 140,000 patients in the US were under treatment with Mircera® at the end of Q3 in 2017.
Net sales of Mircera® increased in 2017 by 3.4% compared to the prior year to CHF 339.9 million. This slight increase is due to the phasing of shipments at year-end. It was always anticipated that from 2017 onwards growth in Mircera® net sales would be at a low single-digit rate due to the overwhelming success of the product in 2016 achieving a high penetration rate within the dialysis clinics of Fresenius Kidney Care.
VELPHORO®
Net sales of the phosphate binder, Velphoro®, increased by 48.6% in 2017 to CHF 80.8 million, with excellent momentum in the US, Japan and Europe’s five largest markets. The global rollout continued during 2017 with launches. As of 31 December 2017, Velphoro® is registered in 39 countries and available in 24. After period- end, a Notice of Compliance, the official approval in Canada, was issued on 5 January 2018.

Vifor Pharma Ltd. Annual Report 2017 27 172
Data from Fresenius Medical Care’s retrospective analysis of databases published in “Clinical Nephrology” in June 2017 continued to demon-strate the benefits of Velphoro® for patients, including a lower pill burden and an increase in the number of patients able to achieve and maintain their target serum phosphorus levels.
New KDIGO (Kidney Disease Improving Global Outcomes) guidelines for the diagnosis, evalu-ation, prevention and treatment of chronic kidney disease-mineral and bone disorder (CKD-MBD) were published in June 2017 in “Kidney Inter-national”. These guidelines contain a number of significant changes that will help to strengthen the position of Velphoro® in the management of CKD-MBD.
The use of Velphoro® in real-life conditions is also being investigated under the European phase-IV VERIFIE study, with enrolment on track, including patients in Spain, Germany, France, the Netherlands, the UK, Italy, and Greece. A first interim analysis has confirmed the efficacy and safety of Velphoro® in real-life use. Data from the analysis were presented at the annual meeting of the “American Society of Nephrology” in November 2017.
By the end of 2017, half of the planned 130 patients had been enrolled in the EU and US in the PA-CL-PED-01 paediatric trial, which will inves-tigate the efficacy and safety of Velphoro® in paediatric and adolescent CKD patients.
VFMCRP signed a licence and supply agreement for the development and commercialisation of Velphoro® in China in March 2017. Together with our partner, we are currently working on the planning, following regulatory approval of the clinical study protocol by Chinese regulators. VFMCRP also continued to work towards regula-tory approval in additional markets including Canada, South Korea and Saudi Arabia. Velphoro® was approved for commercialisation in Mexico on 2 October 2017.
In September 2017, the US Patent and Trademark Office granted a second interim patent term extension for Velphoro® valid until 19 December 2018. The review process for the patent term extension to 2020 is still ongoing.

Vifor Pharma Ltd. Annual Report 2017
KEY MEDiUM-TERM GROWTH DRiVERS
28 172
RAYALDEE® IN DEVELOPMENT/PRE-COMMERCIAL
VFMCRP obtained rights from OPKO Health in 2016 to commercialise modified-release calcife-diol capsules (US brand name: Rayaldee®) for the treatment of secondary hyperparathyroidism (SHPT) in chronic kidney disease (CKD) and vitamin D deficiency in Europe, Canada and certain other international markets. Rayaldee® was approved by the FDA in June 2016, and in November 2016, OPKO Health began selling Rayaldee® in the US for the treatment of SHPT in adult patients with stage 3 or 4 CKD and vitamin D insufficiency.
New KDIGO guidelines for the diagnosis, evalu-ation, prevention and treatment of chronic kidney disease-mineral and bone disorder (CKD-MBD), published in June 2017, are expected to strengthen the role of Rayaldee® in treatment. The updated guideline recommends against routine use of the existing standard of care and mentions Rayaldee®, which combines the benefits from different types of vitamin D (both active and nutritional) to lower parathyroid hormone (PTH) levels associated with SHPT.
VFMCRP filed a regulatory dossier for Rayaldee® for the treatment of SHPT in CKD stage 3 and 4 with vitamin-D deficiency in Canada in May 2017. Following the receipt of EMA scientific advice in the first half of 2017, VFMCRP plan to file a regulatory dossier for Rayaldee® in Europe for the treatment of SHPT in adult patients with non-dialysis CKD (ND-CKD) with vitamin D deficiency in Q3 2018.
BiOSiMiLAR EPOETiN ALFA IN DEVELOPMENT/PRE-COMMERCIAL
Vifor Pharma has commercialisation rights in certain channels in the US for Pfizer’s proposed biosimilar epoetin alfa. This proposed product is currently under review by the US FDA for the treatment of anaemia associated with chronic kidney disease, renal failure and chemotherapy-
induced anaemia. In June 2017, the FDA issued a Complete Response Letter (CRL) regarding ongoing matters noted in a February Warning Letter received by the US manufacturing site for the proposed biosimilar. No additional data were requested in the CRL to support a future ap proval. Pfizer is working actively with the FDA to resolve the situation. Once this product has been approved, Vifor Pharma would be able to offer a second ESA therapy in the US in addition to Roche’s Mircera® and to strengthen its position in the US EPO market in the medium term.
AVACOPAN/CCx168 IN DEVELOPMENT/PRE-COMMERCIAL
Avacopan (CCX168) is an orally administered, selective complement 5a (C5aR) receptor inhibitor being developed and investigated by US partner and biotechnology company, ChemoCentryx. This small molecule is currently in development for orphan and rare renal diseases, such as anti- neutrophil cytoplasmic auto-antibody-associated vasculitis (ANCA-associated vasculitis), C3 glomerulopathy (C3G) and atypical hemolytic uremic syndrome (aHUS).
Orphan designations previously granted for avacopan include ANCA-associated vasculitis in the US and the EU; and aHUS in the US. Avacopan was granted Priority Medicines (PRIME) designa-tion by the EMA in 2016. In 2017, avacopan was granted orphan drug designation (ODD) for C3G by the US FDA, the European EMA and in January 2018, by Swissmedic in Switzerland. Swissmedic also granted avacopan ODD status for ANCA- associated vasculitis in 2017. In January 2017, following an expansion of their original agreement with ChemoCentryx, VFMCRP was granted exclusive rights to market avacopan everywhere outside the US and China, where commercial rights are retained by ChemoCentryx.
In 2017, a global phase-III study, ADVOCATE, began worldwide patient enrolment. ADVOCATE will evaluate the efficacy of avacopan to induce

Vifor Pharma Ltd. Annual Report 2017 29 172
and sustain complete remission in patients with active ANCA-associated vasculitis when used in combination with cyclophosphamide followed by azathioprine, or in combination with rituximab.
Clinical and pharmaceutical development of avacopan is also progressing as planned, with the first patients dosed in a phase-II study on C3G in Q4 of 2017 and aHUS, where proof of concept for dose range is underway.
In June 2017, VFMCRP granted Kissei Pharmaceutical Co., Ltd. exclusive rights to develop and commercialise avacopan in Japan, where ANCA- associated vasculitis has been declared an intractable disease by the Japanese Ministry of Health, Labour and Welfare. Three months after signing this deal, Kissei began a phase-I study in healthy volunteers in Japan.
Post-balance-sheet on 4 January 2018, VFMCRP and ChemoCentryx announced that the Condi-tional Marketing Authorisation application for avacopan in the treatment of patients with ANCA- associated vasculitis had been accepted for review by the EMA. Under the terms of the kidney health alliance between ChemoCentryx and VFMCRP, the acceptance triggered a milestone payment of USD 50 million to ChemoCentryx.
CCx140 IN DEVELOPMENT/PRE-COMMERCIAL
CCX140 is an orally administered inhibitor of the chemokine receptor known as CCR2. This orphan drug candidate is in development by ChemoCentryx for the treatment of focal segmen-tal glomerulosclerosis (FSGS). FSGS is a disease of the kidneys that can cause nephrotic syndrome, which is associated with protein in the urine, low blood albumin levels and high blood lipids. There is a high, unmet need to provide effective treatments for FSGS, which can lead to progressive kidney failure and for which no targeted therapy currently exists. CCX140 has the potential to act as a precision medicine that protects podocytes and
targets the disease process above and beyond proteinuria and loss in renal function.
Clinical and pharmaceutical development is progressing as planned for FSGS. Interaction with regulatory agencies is underway to advance CCX140 for registration trials for FSGS.
VADADUSTAT IN DEVELOPMENT/PRE-COMMERCIAL
In May 2017, Vifor Pharma Group and Akebia Therapeutics, Inc. entered into a licence agreement granting Vifor Pharma Group the right to exclusively sell vadadustat an oral hypoxia-inducible factor (HIF) stabiliser currently in phase-III development, to Fresenius Medical Care North America dialysis clinics in the United States upon approval by the US FDA. This agreement is structured as a profit-sharing arrangement between Akebia and Vifor Pharma. It is subject to the approval of vadadustat by the FDA and to the inclusion of vadadustat in a bundled reimbursement model, upon which Akebia will receive a USD 20 million payment from Vifor Pharma. Akebia’s revenue from the profit share and the milestone payment will be shared with Otsuka Pharmaceutical Co. Ltd., Akebia’s US collaborator. Akebia, in collaboration with Otsuka, plans to commercialise vadadustat in other dialysis organ isations and centres and in the non-dialysis market in the US.
Vadadustat is an oral, investigational hypoxia-in-ducible factor (HIF) stabiliser currently in phase-III development for the treatment of anaemia related to CKD. Vadadustat has not been approved by the FDA or any other regulatory authority.

Vifor Pharma Ltd. Annual Report 2017
KEY MEDiUM-TERM GROWTH DRiVERS
30 172
VELTASSA®
Our third medium-term strategic growth driver is Veltassa®, the first new product in more than fifty years in the United States for the treatment of elevated potassium levels, or hyperkalaemia, a life-threatening and often asymptomatic condition that occurs most frequently in patients with chronic kidney disease and heart failure. Veltassa® has a patent portfolio of US and ex-US patents which are expected to provide protection through 2030 and 2029, respectively, exclud-ing any additional term from the extension of the patent. This product has an addressable estimated population of about three million patients in the US with stage 3 or 4 chronic kidney disease (CKD) and/or heart failure, and approximately the same number of patients in Europe and one million in Japan, respectively.
In accordance with our strategy, the acquisition of Relypsa represented an accelerated move into the cardio-renal therapeutic area, where Vifor Pharma had established an initial presence through Ferinject®/Injectafer®. The acquisition of Relypsa also achieved our strategic objective of establishing our own commercial infrastructure in the key US market.
In 2017, net sales of Veltassa® reported on an ex-works basis in the US were CHF 51.6 million (USD 52.7 million), a significant increase com-pared to CHF 12.3 million in 2016 (including eight months of revenues prior to the acquisition of Relypsa on 1 September 2016).
By the end of December 2017, payer coverage for Veltassa® continues to improve and now com-prises approximately 85% of all US covered lives. The addressable patient population and our experience with Veltassa® since launch confirm our view that the product has blockbuster potential.
Following the positive opinion from the Commit-tee for Medicinal Products for Human Use (CHMP) on 18 May, the European Commission approved Veltassa® on 19 July 2017 for the control of hyperkalaemia in adults. This includes patients who develop hyperkalaemia while being treated with renin angiotensin aldosterone system (RAAS) inhibitor therapy. Almost one hundred per cent of patients treated with Veltassa® in the phase II–III clinical programme were on RAAS inhibitors at baseline.

Vifor Pharma Ltd. Annual Report 2017 31 172
The approval enables Veltassa® to be made available to patients in the EU member states as well as Iceland, Liechtenstein and Norway. On 7 December 2017, the Therapeutic Goods Administration (TGA) approved Veltassa® for Australia. Swiss authority, Swissmedic, also approved Veltassa® for marketing in Switzerland in December 2017. Veltassa® was made available to patients in UK, Norway and Denmark in Q4 2017, with a number of EU patients already benefiting. Veltassa® reimbursement negotiations and launches will continue across Europe through 2018 and 2019.
Results from drug-drug interaction studies of Veltassa® in healthy volunteers showed there were no clinically meaningful or statistically significant interactions between Veltassa® and 12 oral medications when taken at least three hours apart. The results were published online by the “Journal of Cardiovascular Pharmacology” and “Therapeutics” in February 2017.
In April 2017, Relypsa presented data from the TOURMALINE study at the 2017 National Kidney Foundation Spring Clinical Meeting. The results showed no statistically significant difference in the percentage of patients achieving serum potassium levels within the target range (3.8 to 5.0 mEq/L) between the groups taking Veltassa® with or without food at either week 3 or week 4 follow-up. Relypsa submitted a Supplemental New Drug Application to revise the Veltassa® label to reflect the data.

Vifor Pharma Ltd. Annual Report 2017
KEY MEDiUM-TERM GROWTH DRiVERS
32 172
ANTi-iNFECTiVES
We continue to optimise our anti-infectives (infectious diseases/OTX) product portfolio by actively seeking new ways to increase awareness of these products. The three leading products in the ID/OTX portfolio are Broncho-Vaxom®, Uro-Vaxom® and Doxium®.
BRONCHO-VAxOM®
Net sales of Broncho-Vaxom® grew 26.6% compared to the previous year to CHF 52.6 million. This improvement reflected dynamic growth in Russia, where Broncho-Vaxom® (also sold as Broncho Munal® by our partner Sandoz) began its second season as an over- the-counter product. Sales continued to grow in other emerging pharmaceutical markets including Brazil and Poland. A relaunch in Italy in the second half of 2017 also contributed to the brand’s strong momentum.
In the first half of 2017, progress was also made in new research fields such as paediatric wheezing and asthma. The ORBEX study, which is supported by a grant of more than CHF 20 million from the US National Institute of Health, began in January 2017 to investigate how Broncho-Vaxom’s® unique immuno-enhancing properties can be used to stave off respiratory tract infections in young children and potentially to reduce the development of asthma.
URO-VAxOM®
Net sales of Uro-Vaxom® in 2017 were CHF 15.1 million, up 0.5%. Overall market profitability and market share have been increasing consistently over the last five years despite the 2016 slowdown in Venezuela. Recent revised national guidelines, such as in Germany and South Korea in 2017, have emphasised the need to prevent recurrent urinary tract infections to reduce antibiotic consumption. At our OM Pharma plant in Geneva, which celebrated its 80th anniversary in 2017, important investments were committed during the first half to increase the production of both Uro-Vaxom® and Broncho- Vaxom® by 2020.
DOxiUM®
Net sales of Doxium® in 2017 increased to CHF 22.0 million, up 8.0%. The focus was particularly on key emerging pharma markets such as Turkey and China. Our partner in China, Merck Biopharma, a leader in the local diabetes market, increased its promotion of Doxium® in the management of diabetes-related micro- vascular complications. This targeted strategy has significantly increased the number of hospitals in which Doxium® is listed, with local treatment guidelines strengthening the clinical profile of the brand.

Vifor Pharma Ltd. Annual Report 2017 33 172

Vifor Pharma Ltd. Annual Report 201734 172
PATiENT PORTRAiT
ANNE T., 38“I was diagnosed with iron deficiency for the first time ever after my first pregnancy. It was the exhaustion: That’s how I knew that something wasn’t right. It’s such a debilitating feeling of being tired that just won’t pass and weighs down your entire day. My doctor tested my blood and found that my iron levels were low. Really, really low. That was four or five years ago. Since then I make sure that that kind of weariness can’t take over my life again. Eating right, for example. That helps a lot. Choosing to take my health into my own hands is what has ultimately made all the difference, really. Like night and day.”

Vifor Pharma Ltd. Annual Report 2017 35 172

CORPORATE GOVERNANCE
ANNUAL REPORT 2017

Vifor Pharma Ltd. Annual Report 2017 37 172
TABLE OF CONTENTS
38 Group structure and shareholders40 Structure of the share capital42 The Board of Directors46 Management and areas of responsibility48 Shareholders’ rights to participate50 Change of control and
protective measures50 Compliance network51 Management information and
monitoring tools of the Board of Directors52 Auditors53 Information policy53 Brand management54 Members of the Board of Directors58 Members of the Executive Committee
Vifor Pharma is committed to the principles of corporate governance. Vifor Pharma meets the requirements of Swiss law and those stated in the “Directive of the SIX Swiss Exchange on Information Relating to Corporate Governance”. It also follows the recommendations of the “Swiss Code of Best Practice for Corporate Governance” of Economie suisse. The remuneration and profit-sharing for top management are disclosed in the remuneration chapter of this Annual Report.

Vifor Pharma Ltd. Annual Report 2017
CORPORATE GOVERNANCE
38 172
GROUP STRUCTURE AND SHAREHOLDERS
STRUCTURE OF THE GROUP
Vifor Pharma Ltd., headquartered at Rechen-strasse 37, 9014 St. Gallen, Switzerland, is a corporation under Swiss law. As a holding company, Vifor Pharma Ltd. owns all the companies in the Vifor Pharma Group directly or indirectly. Vifor Pharma Group consists of Vifor Pharma; Vifor Fresenius Medical Care Renal Pharma, its joint company with Fresenius Medical Care; Relypsa; and OM Pharma. The Group’s structure and the consolidated subsidiaries and associates are shown in the financial statements 2017 on pages 165 and 166, respectively. The Vifor Pharma Articles of Association, Organisational Regulations and charters of the Committees of the Board of Directors can be accessed at http://www.viforpharma.com/governance. Vifor Pharma Ltd. shares are listed on the SIX Swiss Exchange; shares of the individual Group companies are not publicly traded.
2017 GROUP SEPARATiON: iPO OF GALENiCA SANTÉ – CHANGE OF NAME TO ViFOR PHARMA
The initial public offering (IPO) of the Group’s pharmacy and wholesale business unit Galenica Santé was successfully completed on 7 April 2017. The IPO of Galenica Santé allowed the bridge loan used to finance the acquisition of Relypsa Inc. on 1 September 2016 to be fully repaid and left the company in a net-of-debt cash-positive position. The Annual Shareholder Meeting approved to change the name of the company from Galenica Ltd. to Vifor Pharma Ltd. on 11 May 2017 and the IPO effectively completed the transform ation of Vifor Pharma into a stand-alone pharmaceutical company specialising in innovative, patient- focused solutions.
ViFOR PHARMA GROUP GOVERNANCE
Chief Operations
Officer
Chief Financial Officer
Chief Commercial
Officer
President, Relypsa Inc.
Executive Committee of the Vifor Pharma Group
Committees of the Board of Directors
Board of Directors of Vifor Pharma Ltd.
Vifor Pharma Ltd. Annual Shareholder Meeting
Governance and Nomination Committee
Remuneration Committee
Audit and Risk Committee
Scientific Committee
Chief
Human Resources
Officer
Chief Strategy Officer
CEO VFMCRP Ltd.
and Chief Marketing
Officer

Vifor Pharma Ltd. Annual Report 2017 39 172
SHAREHOLDERS
On 31 December 2017, Vifor Pharma had 13,021 shareholders, four of which according to documents submitted to Vifor Pharma Ltd. and the SIX Swiss Exchange were major shareholders holding more than 3% of the voting rights in Vifor Pharma Ltd.:
– Patinex AG, Freienbach, Switzerland, and BZ Bank Aktiengesellschaft, Freienbach, Switzerland, (beneficial owners: Martin and Rosmarie Ebner, Wilen) with 13,250,000 registered shares.
– VV Value Vals AG, Vals, Switzerland (beneficial owners: Remo and Manuela Stoffel, Chur), with 7,199,750 registered shares.
– Alecta pensionsförsäkring, ömsesidigt, Stockholm, Sweden, with 2,100,000 registered shares.
– BlackRock, Inc., New York, USA, 1,614,230 own registered shares and voting rights, and additional 340,780 voting rights as delegate for a third party.
No other shareholder has announced a crossing of the 3% threshold of registered shares.
The transactions disclosed to the stock exchange Disclosure Office pursuant to Art. 20 of the Stock Exchange Act is available on the Disclosure Office website of the SIX Swiss Exchange: https://www.six-exchange-regulation.com/en/home/ publications/significant-shareholders.html/.
CROSS SHAREHOLDiNGS
Vifor Pharma Ltd. has no cross shareholdings in companies outside the Vifor Pharma Group.
EVENTS AFTER THE BALANCE SHEET DATE
There are no changes to report.
Vifor Pharma Ltd. Annual Report 2017
CORPORATE GOVERNANCE
40 172
SHARE CAPiTAL
Vifor Pharma shares (securities no. 36474934, ticker symbol VIFN) are listed on the SIX Swiss Exchange. As of 31 December 2017, 64,846,488 registered shares were outstanding (not including treasury shares). The market capitalisation amounted to CHF 8,099,326,351.20.
AUTHORiSED CAPiTAL
According to Art. 3a of the Articles of Association, the Board of Directors is authorised to increase the share capital of CHF 650,000 by a maximum of CHF 65,000 at any time up to and including 28 April 2018 by issuing no more than 6,500,000 fully paid registered shares.
CONDiTiONAL CAPiTAL
Vifor Pharma has no conditional capital.
CHANGES iN THE CAPiTAL iN RECENT YEARS
Information about changes in the share capital, reserves and distributable profit over the past few years can be found on page 177 of the financial statements 2017. Please see previous Galenica Group annual reports for information about prior years.
PARTiCiPATiON CERTiFiCATES
Vifor Pharma has no participation certificates.
DiViDEND CERTiFiCATES
Vifor Pharma has not issued any dividend cer tificates.
REGiSTRATiON AND VOTiNG RiGHTS
Pursuant to Art. 6 of the Articles of Association, each registered share entitles the holder to one vote at the Annual Shareholder Meeting.
The Board of Directors may refuse registration in the shareholders’ register if purchasers do not declare explicitly, upon request, that they have acquired the shares in their own name and for their own account. The Board of Directors is also authorised, after hearing the individuals con-cerned, to cancel any entries in the shareholders’ register that were obtained on the basis of incorrect information.
STRUCTURE OF THE SHARE CAPiTAL
On 31 December 2017, following the 1:10 share split approved by the shareholders at the Annual Shareholder Meeting on 11 May 2017, the fully-paid share capital of Vifor Pharma Ltd. amounted to CHF 650,000, divided into 65,000,000 publicly listed registered shares with a nominal value of CHF 0.01 each.

Vifor Pharma Ltd. Annual Report 2017 41 172
ANNUAL SHAREHOLDER MEETiNG
Registration of nomineesA nominee may be registered with voting rights up to a limit of 2% of the share capital entered in the commercial register. Shares in excess of this limit can only be registered if the nominee in question discloses the name, address and number of shares of the person for whose account the nominee holds 0.5% or more of the share capital entered in the commercial register. During the financial year 2017, agreements of this nature were in force with two nominees.
Legal entities and partnerships, other groups of persons or joint owners who are interrelated through capital ownership, voting rights, common management or are otherwise linked, as well as individuals or legal entities or partnerships that act in concert to circumvent this provision, shall be treated as one single entity.
CONVERTiBLE BONDS AND OPTiONS
Vifor Pharma has no outstanding convertible bonds, nor has it issued any traded options.

Vifor Pharma Ltd. Annual Report 2017
CORPORATE GOVERNANCE
42 172
The duties of the Board of Directors are based on the Swiss Code of Obligations, the Vifor Pharma Ltd. Articles of Association and its Organisational Regulations. Pursuant to the Articles of Association, the Board of Directors consists of a minimum of five and a maximum of twelve members. It consisted of eight members as of the end of 2017.
In selecting the members of the Board of Directors, care is taken to ensure that competency for Vifor Pharma Group’s areas of activity are duly represented and that the necessary specialised expertise is available. The Board of Directors reviews its functional effectiveness once a year.
The Articles of Association of Vifor Pharma Ltd. (Art. 17 para. 3) restrict the ability of its directors to act on the Board or senior management of other profit-oriented companies, limiting such outside Board activity to five mandates in listed and seven mandates in non-listed companies. None of the members has reached the limit.
With the exception of the Executive Chairman and the newly elected Dr. Gianni Zampieri, none of the members of the Vifor Pharma Group Board of Directors had an operational management function at Vifor Pharma or at any of the com-panies in the Group in the year under review or at any time during the previous three years.
DiSCLOSURE OF POTENTiAL CONFLiCTS OF iNTEREST
No member of the Vifor Pharma Group Board of Directors has any significant relations with Vifor Pharma or any of its subsidiaries.
ELECTiON AND TERM OF OFFiCE
Each member of the Board of Directors, its Chairman, each member of the Remuneration Committee as well as the independent proxy are elected individually by the Annual Shareholder Meeting for a term of office of one year, ie from one Annual Shareholder Meeting to the end of the next. Members may be re-elected. The Articles of Association do not stipulate a limit regarding terms of office.
THE BOARD OF DiRECTORS AND iTS COMMiTTEES iN 2017
The Board of Directors is made up of the Executive Chairman, one or more Deputy Chairpersons and the other members. The Board of Directors forms the following committees from its members:
THE BOARD OF DiRECTORS
The Vifor Pharma Group Board of Directors determines the strategic goals and general ways and means to achieve them while harmonising strategy, risks and financial re-sources; and appoints and oversees the managers respon-sible for conducting the company’s businesses. It also designs the company’s corporate governance profile and puts it into practice.

Vifor Pharma Ltd. Annual Report 2017 43 172
– Governance and Nomination Committee – Remuneration Committee – Audit and Risk Committee – Scientific Committee
Each committee has its own charter setting out its duties and responsibilities. The committee charters are published on http://www.viforpharma.com/governance.
iNTERNAL ORGANiSATiON
The Board of Directors may pass binding reso-lutions for the company with respect to all matters that are not expressly reserved for the authority of the Annual Shareholder Meeting either by law or the Articles of Association.
The Executive Chairman calls a meeting of the Board of Directors at least once a quarter, prepares and leads the meetings. The individual agenda items are set by the Executive Chairman. He decides on a case-by-case basis whether to involve additional individuals in the meetings of the Board of Directors. Executive Committee members usually participate at least in part of every meeting to report on ongoing business and to explain in more detail the documentation submitted to the Board of Directors in light of the decisions to be taken. Any member of the Board of Directors may propose, in writing, items to be included in the agenda or may request that a meeting of the Board of Directors be convened, briefly giving reasons for doing so. Board mem-bers receive the documentation they need to prepare for the agenda items in a timely manner, usually at least ten days before the meeting in question. Decisions are taken by the entire Board of Directors. Minutes of the meeting are kept to document all discussions and resolutions.
The Executive Chairman and the COO represent the interests of the Group towards third parties in important matters.
In 2017, the Board of Directors held nine meetings. In addition to meetings and the associated flow of information (documentation on individual agenda items, reports), the Board of Directors are also informed on a regular basis about the Group’s activities and challenges and on the current state and general development. Furthermore, the Board of Directors is often consulted by the members of the Executive Committee in its role as advisory body.
As part of its risk management, the Board of Directors receives from the Executive Committee an overview of the most important risks, along with preventive measures to be implemented Group-wide as part of the risk management process. It evaluates and takes decisions on this overview of risks and measures, which is provided when circumstances require it, but at least once a year. Further information on this topic can be found on page 74.
COMMiTTEES
Committees of the Board of Directors prepare the business of the Board on particular topics and submit recommendations to the entire Board of Directors. Except for the Remuneration Committee, the committees have no decision- making authority of their own. They meet as often as business requires and report to the Board of Directors on activities and results. They draw up their own agendas and keep minutes of meetings.
Each committee has its own charter governing its duties and responsibilities.
GOVERNANCE AND NOMiNATiON COMMiTTEE
The Governance and Nomination Committee ensures the management and monitoring of the Group’s business activities by the Board of Directors (overall management and ultimate supervision pursuant to Art. 716a of the Swiss

Vifor Pharma Ltd. Annual Report 2017
CORPORATE GOVERNANCE
44 172
Code of Obligations). In addition, the Governance and Nomination Committee has the following duties in particular:
– Develops the values, short- and long-term objectives and strategy of the Group in close cooperation with the COO for submission to the Board of Directors.
– Takes provisional decisions and intervenes in urgent cases where a decision of the Board of Directors cannot be obtained in a timely manner.
– Draws up selection criteria for the nomination of members of the Board of Directors, Committees and Executive Committee and reviews the relevant succession plans.
– Evaluates and makes proposals for the appointment and dismissal of members of the Board of Directors, Committees and Executive Committee.
REMUNERATiON COMMiTTEE
The Remuneration Committee is made up of three members elected directly by the Annual Shareholder Meeting, who must be independent. The Remuneration Committee carries out the following duties in particular:
– Proposes a remuneration strategy for the Group and the members of the Executive Committee to the Board of Directors.
– Proposes the maximum possible remuneration (total amount) for the members of the Execu-tives Committee and the Board of Directors to be decided upon by the Annual Shareholder Meeting.
– Proposes targets and assesses their achievement for determination of the variable compensation of the members of the Executive Committee and management of Vifor Pharma Group.
– Proposes to the Board of Directors the salaries and remuneration for the members of the Board of Directors and the committees as well as the COO.
– Decides on the remuneration for the members of the Executive Committee within the scope of the guidelines adopted by the Annual Share-holder Meeting.
AUDiT AND RiSK COMMiTTEE
The Audit and Risk Committee carries out the following duties in particular:
– Verifies compliance with internal and external regulations by carrying out random checks.
– Checks the performance and independence of the external auditor and approves its fees.
– Evaluates and submits its nomination for external auditor to the Board of Directors for the Annual Shareholder Meeting.
– Reviews together with the external auditors the scope and method of the audit.
– Defines the internal audit programmes, including compliance and IT security, and checks the audit reports and the status reports on the implementation of measures.
– Analyses at least once a year the scope of internal control systems, the auditing projects and processes affected, the results of internal audits and the implementation of recommen-dations by the Executive Committee.
– Reviews with the external auditors the Group’s compliance with accounting policies and standards.
– Assesses the organisation of risk management processes.
– Reviews, if necessary together with the external auditors, the risks that could affect the Group’s result and the measures planned for reducing those risks.
– Issues new guidelines, instructions or clarifica-tions in connection with the Code of Conduct.
– Assesses the financial structure, the develop-ment of investments and acquisitions, and the influence of currency fluctuations and measures to be taken.
– Monitors the Group’s financial situation and financial controls.

Vifor Pharma Ltd. Annual Report 2017 45 172
– Receives regular information from the Executive Committee concerning major changes that could affect the Group’s financial situation.
SCiENTiFiC COMMiTTEE
The Scientific Committee acts as an advisory body to the Executive Chairman and the Board of Directors in matters of R&D strategy, the innov-ation process and pipeline, protection of intellec-tual property; and in the assessment, selection and prioritisation of target markets and thera-peutic areas.
It also gives its view on acquisitions and proposals aimed at strengthening the technology base of the Group or accelerating market penetration.
FREQUENCY OF MEETiNGS OF THE BOARD OF DiRECTORS AND iTS COMMiTTEES iN 2017
In 2017, the Board of Directors held nine meet-ings. The Governance and Nomination Committee met once, the Remuneration Committee five times, the Audit and Risk Committee seven times, and the Scientific Committee met twice. In principle, all the members participate in all the meetings of the Board of Directors. Excluding absences to avoid conflicts of interest, the members participated in more than 97% of the meetings of the Board of Directors, 100% of the meetings of the Governance and Nomination Committee, 100% of the meetings of the Remu-neration Committee, 94% of the meetings of the Audit and Risk Committee, and 100% of the meetings of the Scientific Committee. Outside the official meetings the members of the Board of Directors also exchanged their views with other members and the Executive Chairman in numer-ous telephone conferences. The allocation of tasks among the committees is described starting from page 43 of this report.
Excluding specific absences to avoid conflicts of interest, only one member has been excused from several meetings for severe health condi-tions and one other member has been excused from one Board and one Committee meeting held at the same day. All other members have participated in all meetings of the Board and its Committees.

Vifor Pharma Ltd. Annual Report 2017
CORPORATE GOVERNANCE
46 172
In particular, the Board of Directors is responsible for approving or passing resolutions on:
– The values, objectives and strategy of the Group.
– The essential framework of the Group’s activities.
– The Group’s planning, budget and projections. – Selection and deselection of the members
of the Committees, the COO and the other members of the Executive Committee.
– The organisation of the remuneration system.
The Board of Directors has delegated the management of the company in accordance with the Organisational Regulations. Etienne Jornod serves as Executive Chairman and has certain, clearly defined operational duties. More precise details of his duties are set out below. Stefan Schulze, President of the Executive Committee and COO of Vifor Pharma assumes responsibility for operational management and heads the Executive Committee. The Board of Directors maintains close contact with the COO and the members of the Executive Committee and invites them to attend its meetings when relevant items are to be discussed. At each meeting, the members of the Executive Committee are invited to report on their areas of responsibility and to discuss important business matters with the Board. Other members of senior or executive management of companies within the Group are
also regularly invited to report on their activities or present their projects.
DUTiES OF THE ExECUTiVE CHAiRMAN
As Executive Chairman, Etienne Jornod is responsible for leading the Board of Directors, the ongoing strategic development of the Group, alliances and acquisitions, the positioning of the Group concerning communications and stakeholder relations. In particular, he carries out his executive role in boards that are strategically important for Vifor Pharma Group, such as his role as Chairman of the Board of Directors of Vifor Fresenius Medical Care Renal Pharma Ltd.
The Executive Chairman is closely involved in the implementation of the most important strategic projects. In addition, he has overall responsibility for the Group’s corporate culture, a competitive factor of importance in the labour market. Likewise, he helps shape Vifor Pharma Group corporate communications and HR policy. Vifor Pharma Group honours and preserves its heri-tage from its home market of Switzerland, which it considers a competitive advantage. Currently, more than 1,200 of over 2,600 Vifor Pharma Group employees are based in Switzerland.
MANAGEMENT AND AREAS OF RESPONSiBiLiTY
The Board of Directors is legally responsible for the overall management and ultimate supervision of the Group. It has the duties provided for under Art. 716a, para. 1 of the Swiss Code of Obligations; it cannot be deprived of these duties, nor can it delegate them. In addition, it may pass resolutions with respect to all matters that are not reserved for the authority of the Annual Shareholder Meeting either by law or the Articles of Association.

Vifor Pharma Ltd. Annual Report 2017 47 172
DUTiES OF THE COO
The President of the Executive Committee and COO, Stefan Schulze, is responsible for imple-menting the strategic and operational objectives approved by the Board of Directors, for (together with the CFO) preparing budgets and ensuring that they are met; and for developing relation-ships with customers, suppliers and authorities. He implements Group values (including safety, quality and the Code of Conduct). Together with the other members of the Executive Committee, he issues binding guidelines for our group companies and functions. The COO leads the Executive Committee and reports directly to the Executive Chairman, with whom he works closely on the most important decisions and prepares the information for the meetings of the Board of Directors. At these meetings, the COO and other members of the Executive Committee, inform the Board of Directors and submit strategic, HR- related and financial business to the Board for consultation and decision-making.
ExECUTiVE COMMiTTEE
Following the structural changes with the IPO of Galenica Santé and the succeeding name change from Galenica to Vifor Pharma Group, the former ultimate executive management body (“Direction Générale”) of the Group became redundant due to the simplified new structure and was replaced in its every function by the Executive Committee of the Vifor Pharma Group. Continuity and persistence in management guidance and style is ensured, not least through the continued super-vision by the Executive Chairman and the individual members of the Board of Directors. The instruc-tions and resolutions of the Board of Directors are implemented by the Executive Committee under the leadership of the COO. The Board sets appropriate objectives, approves the budget and continually monitors compliance with set targets. Monitoring is based on monthly reports to the Board which include key figures and reporting on important events and developments, and on the
planning cycle. In the first quarter, the results for the previous year are compared with the budget for that year. In the second quarter, the current financial year is evaluated by means of a “last- estimate 1”, and a medium-term plan for the next three years is drawn up. In the third quarter, the results for the first half-year are prepared and reviewed, and in the fourth quarter the expected annual result “last-estimate 2” is determined and the budget for the following year agreed.
The Articles of Association of Vifor Pharma Ltd. (Art. 19 para. 3) restrict the ability of the members of the Executive Committee to act in the board or senior management of other profit-oriented companies, limiting such activity to only one mandate in listed and three mandates in non-listed companies, both being subject to prior approval by the Governance and Nomination Committee.
Further information on the other duties of the Board of Directors, Executive Chairman and Executive Committee can be found in the Organ-isational Regulations published on the Vifor Pharma website (http://www.viforpharma.com/governance).
iNFORMATiON AND MONiTORiNG TOOLS
The Board of Directors monitors the Executive Committee and supervises its working practices. Vifor Pharma Group has a comprehensive elec-tronic information management system. The Board of Directors receives a written report on a quar-terly basis and is informed on a monthly basis about the Group’s financial and operating performance. In addition, operating performance, opportunities and risks are discussed in depth at meetings attended by members of the Executive Committee.
MANAGEMENT CONTRACTS
No management contracts exist as specified under point 4.3 of the “SIX Swiss Exchange Directive on Information Relating to Corporate Governance”.
Vifor Pharma Ltd. Annual Report 2017
CORPORATE GOVERNANCE
48 172
Each share recorded as a share with voting rights in the shareholders’ register entitles the holder to one vote at the Annual Shareholder Meeting. Shareholders are also entitled to dividends and have other rights pursuant to the Swiss Code of Obligations.
Results of the ballots taken at the Annual Share-holder Meetings are made available on the Vifor Pharma website (http://www.viforpharma.com/agm) within one week after each meeting.
PROxY VOTiNG
A registered shareholder may be represented at the Annual Shareholder Meeting on the basis of a written power of attorney by an appointed representative or the independent proxy to whom instructions may be given in writing or electronically. There are no rules that deviate from legal provisions relating to attendance of the Annual Shareholder Meeting.
Instructions to the independent proxy holder may be given in writing and – since 2014 – also electronically. The e-voting platform used by Vifor Pharma is provided by ShareComm Service AG, Switzerland. The invitation to the Annual Shareholder Meeting, which will be sent to all shareholders on or around 20 April 2018, includes the required login information to create a personal user
profile. The instructions must be received by the independent proxy holder on or before 11 May 2018.
QUORUMS UNDER THE ARTiCLES OF ASSOCiATiON
In addition to the cases cited in Art. 704 of the Swiss Code of Obligations, approval by at least two-thirds of the votes represented and the absolute majority of the nominal capital repre-sented is required in the following cases:
– A change in the provisions relating to restric-tions on the transfer of registered shares, Art. 15 c) of the Articles of Association.
– Conversion of registered shares into bearer shares and vice versa, Art. 15 d) of the Articles of Association.
SHAREHOLDERS’ RiGHTS TO PARTiCiPATE
The Annual Shareholder Meeting is held each year within five months of the close of the financial year. Extraordinary General Meetings are called as often as necessary by a decision of the Annual Shareholder Meeting or Board of Directors, at the request of the auditors or at the written request of shareholders representing on aggregate not less than 7% of the share capital entered in the commercial register.

Vifor Pharma Ltd. Annual Report 2017 49 172
CONVENiNG OF THE ANNUAL SHAREHOLDER MEETiNG
The Articles of Association do not differ from legal regulations with regard to the convening of the Annual Shareholder Meeting and the setting of the agenda. The Annual Shareholder Meeting is convened by the Board of Directors at least 20 days before the date of the meeting. The shareholders are invited to attend by a notice placed in official publications. The meeting may also be convened by sending a letter to all the registered shareholders at the addresses entered in the shareholders’ register. The notice of a meeting shall state the items on the agenda, the proposals of the Board of Directors and the requests of any shareholders who have called for a General Meeting to be convened or for a particular item to be included on the agenda.
iNCLUSiON OF iTEMS ON THE AGENDA
Shareholders who together represent not less than 0.5% of the share capital entered in the commercial register may request that an item be included on the agenda. They must submit such requests in writing no later than 40 days before the scheduled date of the meeting. Agenda items relating to financial year 2017 that are to be dealt with at the Annual Shareholder Meeting on 15 May 2018 must be submitted no later than
4 April 2018. The items to be included on the agenda must be specified along with the motion on which the shareholder requests a vote.
SHAREHOLDERS’ REGiSTER
There are no regulations in the Articles of Association regarding a deadline for entry in the shareholders’ register. However, for practical reasons the shareholders’ register remains closed to entries for several days prior to an Annual Shareholder Meeting. This will be the case from Tuesday, 8 May 2018, for financial year 2017 and from Wednesday, 1 May 2019, for financial year 2018. Shareholders entered in the shareholders’ register by Friday, 4 May 2018, and Tuesday, 30 April 2019, respectively may exercise their voting rights at the corresponding Annual Shareholder Meeting.

Vifor Pharma Ltd. Annual Report 2017
CORPORATE GOVERNANCE
50 172
commitment to protect personal data of individ-ual patients, clients and business partners and to respect privacy rights across its operations all over the world, the function of the Vifor Pharma Group Data Protection Officer was established, aiming to ensure compliance with a complex and constantly changing set of laws and regulations.
A network of compliance officers throughout the Group, assisted by global functions and oper-ational management, maintain the compliance structure and efficiently designed processes, provide standardised compliance trainings across our functions and local organisations, and work continuously to maintain a high level of compli-ance awareness. Independence from the Group operations and self-determination of the compli-ance officers network and the Data Protection Officer are further strengthened as they are now reporting directly to the Group General Secre-tary, and thereby ultimately only to the Executive Chairman and the Board of Directors.
Change of control and protective measures
The obligation to make a public offer pursuant to Art. 22 of the Stock Exchange Act (Federal Act on Stock Exchanges and Securities Trading) has not been changed in the Articles of Association. The employment contracts of the members of the Executive Committee and the members of senior management also contain no provisions to this effect. Remuneration components based on shares of Vifor Pharma Ltd. would terminate in the case of an acquisition and vesting period restric-tions on pre-existing awards would be removed.
Vifor Pharma Group compliance network
Vifor Pharma Group operates in a highly regulated international environment. In all of its business dealings it is committed to highest standards of integrity and transparency to ensure legal and ethical behaviour across Vifor Pharma Group. This means following all laws and regulations applicable to its business activities, especially those designed to protect patients and improve the quality of medicines and healthcare services.
In 2017, Vifor Pharma focused on systematically strengthening the compliance culture throughout the company, firmly establishing it in daily working life. A revised “Code of Conduct and Business Ethics”, and a revised “Anti-Bribery and Anti-Corruption Directive” were introduced and processes further aligned, requiring employees of the Vifor Pharma Group to act with integrity at all times and to follow Vifor Pharma Group’s ethical standard even when it is stricter than local standards. Employees were trained on the new provisions in six languages and an anonymous reporting system has been set up which can be used by employees to address any concerns or alleged violations. Reflecting Vifor Pharma’s

Vifor Pharma Ltd. Annual Report 2017 51 172
CORPORATE GOVERNANCECORPORATE GOVERNANCE
RiSK MANAGEMENT PROCESS
As part of risk management throughout Vifor Pharma Group, the Group companies conduct a risk assessment at least once a year. This standardised process is based on a risk grid, in which the most important strategic and oper-ational risks and their possible financial effects are identified in line with pre-defined criteria and then evaluated in accordance with the probability of their occurrence and their effect. Such risks are monitored as part of the overall Group risk matrix.
The Board of Directors of Vifor Pharma Group receives an overview of the most important risks from the Executive Committee as required but at least once a year. The Board evaluates the overview, adding information as needed, and where required takes decisions on any preventive measures necessary, which must then be imple-mented Group-wide as part of the risk manage-ment process.
Vifor Pharma defines risk as the possibility that an event or an action will lead to immediate financial loss or other negative consequences.
Vifor Pharma risk management defines three basic objectives:
– Creating a framework for effective risk management within Vifor Pharma Group that will be embedded in existing management and planning processes and will therefore effect ively strengthen risk awareness at all management levels.
– Creating and guaranteeing a lean and pragmatic risk management system that will effectively protect business operations and the Group’s profit-earning ability.
– A credible presentation to stakeholders that Vifor Pharma is managing its risks effectively.
Risk management at the Group level revolves around strategic risks that could have significant consequences for the Group. Operational risk management is specifically defined and managed by the individual operating Group companies, although it is recognised that events in individual companies can clearly have an influence on the strategic risks to the Group. Risks are managed at the appropriate level by the management hierarchy that is best suited for this purpose. This approach ensures that action is taken in an efficient manner and that experience is broadly reinforced throughout Vifor Pharma Group.
The systematic overview of the key risks enables the Vifor Pharma Group Board of Directors to coordinate with the chosen strategy, prioritise risk, allocate resources and specify any action required.
MANAGEMENT iNFORMATiON AND MONiTORiNG TOOLS OF THE BOARD OF DiRECTORS
Vifor Pharma has a risk management process in place which enables the Board of Directors, the Executive Committee as well as the relevant management of Group companies to identify potential risks in a timely manner and take the preventive measures necessary. The goal of this process is to identify and assess significant risks at all management levels and to manage them while making conscious use of the opportunities the process provides.

Vifor Pharma Ltd. Annual Report 201752 172
CORPORATE GOVERNANCE
The Executive Committee and other management who are responsible for the Group com panies are familiar with the risks of the overall Group, specific therapeutic area or their Group company. They successfully implement any measures decided upon and are responsible for the efficient operation of the risk management process. They also draw attention, however, to new risks which have become apparent or to any other change in the risk situation and, in addition to implementing measures to prevent or minimise such elements, ensure that these are incorpor ated into the risk management process.
Additional information about the management of financial risks can be found in the notes to the consolidated financial statements on pages 121 and 122.
iNTERNAL CONTROL SYSTEM
As part of its risk management system, Vifor Pharma Group operates an internal control system (ICS) to provide reliable internal and external financial reporting and to prevent false information and errors about business transac-tions. The ICS provides the necessary processes and controls to ensure that risks relating to the quality of the company’s financial reporting can be detected and managed in a timely manner. A thorough review of the existence of the pro-cesses and controls of the Vifor Pharma Group ICS is carried out annually by the external auditors at the time of the interim audit. The results of these reviews are reported to the Audit and Risk Committee and appropriate measures are taken by management to continually improve the company’s processes with regard to book-keeping, accounting and financial reporting.
iNTERNAL AUDiT
Internal Audit carries out audits of operational and strategic risk management and the ICS in accordance with the audit plan determined by the
Audit Committee. It carries out reviews, analyses and interviews across the Group and helps business operations to meet set targets by ensuring an independent assessment of the effectiveness of the internal control processes. Internal Audit regularly produces reports on its audits and reports directly to the Audit and Risk Committee in writing. The activities of Internal Audit are conducted through contracts issued to external service providers.
Auditors
Ernst & Young Ltd., Bern, Switzerland, have been the Group’s auditors since 1992. Martin Mattes, certified accountant, a partner at Ernst & Young, took over charge of the audit in 2017, succeeding Roland Ruprecht.
The fees paid to the Group’s auditors Ernst & Young Ltd. in 2017 for their audit of Vifor Pharma Ltd. and companies within the Vifor Pharma Group totalled approximately CHF 912,000.
The fees paid to Ernst & Young Ltd. and their close collaborators for other services rendered to Vifor Pharma Ltd. and its subsidiaries in the period under review amounted to CHF 902,000. They break down as follows:
– Additional advice in audit matters CHF 188,000.
– Tax and legal advice CHF 317,000. – Other advisory services CHF 397,000.
In 2017, the auditors attended two meetings of the Audit and Risk Committee. Moreover, they presented their report at the meeting of the Board of Directors on 13 March 2018.
The auditors are regularly informed of new projects by the Board of Directors. The auditors’ activities are reviewed at least once a year by the Audit and Risk Committee. The criteria that

Vifor Pharma Ltd. Annual Report 2017 53 172
are of particular importance in these reviews are: competence in reporting, understanding of the complex structure of the Group, the quality of reporting, compliance with deadlines, independ-ence and costs. The involvement of the auditors in the financial elements of due diligence reviews for acquisitions and in the related legal advice improves the efficiency of the process.
Information policy
Vifor Pharma Group and its affiliate companies have an active, transparent policy for informing all their stakeholder groups. Consistency and credibility are two fundamental principles that are reflected in factual, comprehensive and objective communication.
AD HOC PUBLiCiTY
Important and price-relevant events are commu-nicated in a timely manner via electronic media and in accordance with the Directive of the SIX Swiss Exchange. Any employees affected are informed first, to the extent that this is possible in the specific situation and allowed by law.
PERiODiC PUBLiCATiONS
Vifor Pharma reports its half-year and full-year results in business reports (published in print and/or online formats and at media events). A list of the latest publications is available online under http://www.viforpharma.com/en/media where all relevant information and documents, including media releases, investor updates, as well as presentations held at investor or analyst confer-ences can be found. Vifor Pharma Group pub-lishes a printed short version of the annual report, which is sent to the shareholders by mail upon request.
The invitation to the Annual Shareholder Meeting as well as corporate notices are sent to share-holders electronically or by mail and published in the “Schweizerisches Handelsamtsblatt”.
iNTERNET
Publications, media releases and other supple-mentary information published by Vifor Pharma Group can be found on the Vifor Pharma Media Relations webpage (http://www.viforpharma.com/en/media). Corporate governance documents can be found at http://www.viforpharma.com/governance, and corporate responsibility documentation, including the Vifor Pharma Group Code of Conduct, is made accessible under http://www.viforpharma.com/en/about-vifor-pharma/corporate-responsibility.
Brand management
PHiLOSOPHY AND iMPLEMENTATiON
Vifor Pharma Group seeks to be recognised as a reliable, dynamic and efficient company within the global pharmaceutical industry and to create value for all stakeholder groups with high-quality products and services. Thus, Vifor Pharma also invests its energies in looking after its brands. Vifor Pharma stands for quality and professional-ism, for credibility and transparency, for reliability and continuity. Global Communications, in particular, is responsible for implementing Vifor Pharma brand communication.
PROTECTiON OF THE GROUP’S BRANDS
Vifor Pharma systematically fosters and protects its company brands in all countries where it is active and guarantees a high standard of quality.

Vifor Pharma Ltd. Annual Report 2017
CORPORATE GOVERNANCE
54 172
MEMBERS OF THE BOARD OF DiRECTORS
ETiENNE JORNOD EXECUTIVE CHAIRMAN,
ELECTED IN 1996
DR. SYLViE GRÉGOiRE
ELECTED IN 2013
PROF. DR. MiCHEL BURNiER
ELECTED IN 2010
DR. ROMEO CERUTTi ELECTED IN 2015
MARC DE GARiDEL ELECTED IN 2015

Vifor Pharma Ltd. Annual Report 2017 55 172
ETiENNE JORNOD EXECUTIVE CHAIRMAN, ELECTED IN 1996 – Born 1953, Swiss citizen – Lic. oec., HEC University of Lausanne/Senior
Executive Program, Stanford University (USA) – Joined the Group in 1975 as a Junior Product
Manager; left the Group in 1978; returned in 1981 (after obtaining a university degree) as Assistant to the Corporate Executive Commit-tee; joined the Corporate Executive Committee in 1989; Chairman of the Board of Directors and CEO of Galenica from 1996 to 2011; Executive Chairman of Galenica since 2012 and then of the Vifor Pharma Group from May 2017.
– Chairman of the Board of Directors of the Aktiengesellschaft für die Neue Zürcher Zeitung (Zurich, Switzerland)
DANiELA BOSSHARDT-HENGARTNER ELECTED IN 2008 – Born 1972, Swiss citizen – Pharmacist, Federal Diploma in Pharmacy,
Federal Institute of Technology, Zurich – Financial analyst at Bank am Bellevue
(1998–2002) and M2 Capital (2003–2004) – Management consultant in the pharmaceutical,
medical technology and biotechnology sectors since 2004
– Member of the Board of Directors of Galenica AG (Bern), RepRisk AG (Zurich) and investiere.ch
PROF. DR. MiCHEL BURNiER ELECTED IN 2010 – Born 1953, Swiss citizen – Swiss-registered Doctor of Internal Medicine
and Nephrology – University Lecturer, University of Lausanne – Formerly a member of the Medicines Committee
of the Swiss Association of Pharmacists (until 2001), the Board of Swissmedic (2002–2010) and the Board of Directors of Speedel Holding Ltd. (2007–2009)
– Member of the following organisations: Swiss Society of Nephrology (former President), Scientific Council of the European Society of Hypertension (Treasurer) and Swiss Society of Hypertension (former President)
– Member of the Board of Directors of Galenica AG (Bern)
FRiTZ HiRSBRUNNER ELECTED IN 2012
DANiELA BOSSHARDT-HENGARTNER ELECTED IN 2008
DR. GiANNi ZAMPiERi FIRST ELECTED 2017

Vifor Pharma Ltd. Annual Report 2017
CORPORATE GOVERNANCE
56 172
DR. ROMEO CERUTTi ELECTED IN 2015 – Born 1962, Swiss and Italian citizen – Doctor of Law from the University of Fribourg,
Switzerland; Master of Laws from the University of California, School of Law, Los Angeles
– Attorney-at-law with Latham and Watkins (1993–1995) and Homburger Rechtsanwälte (1995–1999)
– Head of Corporate Finance at Lombard Odier Darier Hentsch & Cie (1999–2006) and partner of the Group Holding of Lombard Odier Darier Hentsch & Cie (2004–2006)
– General Counsel to the Credit Suisse Private Banking Division (2006–2009)
– General Counsel and member of the Executive Board of Credit Suisse Group Ltd. and Credit Suisse Ltd. since April 2009
– Member of the Board of Trustees of the Swiss Finance Institute (SFI) since 2016; Chairman since 2017
MARC DE GARiDEL ELECTED IN 2015 – Born 1958, French citizen – Master in Engineering, Ecole Supérieure des
Travaux Publics, Paris; Master in International Management, Thunderbird School of Manage-ment, Phoenix (USA); Executive Master in Business Administration, Harvard University, Boston (USA)
– Various positions at Lilly, most recently as Finance Director Germany (1983–1995)
– Various positions at Amgen, including Vice-President Finance and Administration Europe, Vice-President and Chief Administration Officer, and General Manager for France and Vice-President of the South International Region (1995–2010)
– Since 2010 Chairman of the Board of Directors; CEO of Ipsen from 2010 to 2016
COMMiTTEES AND MEETiNG ATTENDANCE iN 2017
Members of the Board of Directors1 First elected
Governance and Nomination Committee
Remuneration Committee
Audit and Risk Committee
Scientific Committee
Etienne Jornod, Chairman 1996 Chair
Marc de Garidel, Vice-Chairman 2015 Member Chair Member
Daniela Bosshardt-Hengartner 2008 Chair Member
Michel Burnier 2010 Member Chair
Romeo Cerutti 2015 Member Member
Sylvie Grégoire 2013 Member
Fritz Hirsbrunner 2012 Member2 Member
Dr. Gianni Zampieri2 2017 Member
Andreas Walde, General Secretary
Ernst & Young Ltd., Group auditor
Number of meetings in 2017 1 5 7 2
1 Former members of the Board of Directors Stefano Pessina and This E. Schneider, former Vice-Chairman, did not stand for re-election to the Board of Directors at the Annual Shareholder Meeting of 11 May 2017.
2 Since the Annual Shareholder Meeting 2017.

Vifor Pharma Ltd. Annual Report 2017 57 172
DR. SYLViE GRÉGOiRE ELECTED IN 2013 – Born 1961, Canadian and US citizen – Dr. pharm., State University of New York in
Buffalo (NY/USA), pharmacy degree from Université Laval, Quebec City (Canada)
– Formerly President of Shire Human Genetic Therapies (2007–2013); worked in various roles at companies including Merck & Company (1987–1995), Biogen Inc. (1995–2003), GlycoFi Inc. (2004–2005) and IDM Pharma (2006–2007)
– Advisor to venture capital and biotech companies – Former board member at various companies
in the United States and Canada; also served on the boards of various charitable organisations
– Member of the Board of Directors at Novo Nordisk and PerkinElmer Inc. since 2015
FRiTZ HiRSBRUNNER ELECTED IN 2012 – Born 1949, Swiss citizen – Lic. oec., HEC University of Lausanne/Senior
Executive Program, IMD, Lausanne – 1972–1977 Controller at Ciba-Geigy – Joined the Galenica Group in 1977 as Assistant
to the Corporate Executive Committee; member of the Corporate Executive Commit-tee from 1992 to 2011; Deputy CEO and CFO; Head Investor Relations until February 2014
– Member of the Board of Directors of Berlac AG, Sissach, Switzerland, and IVF Hartmann Holding AG, Neuhausen, Switzerland
– Member of the Board of Trustees of IST Investmentstiftung, Zurich, Switzerland
– Member of the Board of Directors of VenCap 6 Ltd., Jersey, UK
– Member of the Board of Directors of Galenica AG (Bern)
DR. GiANNi ZAMPiERi FIRST ELECTED 2017 – Born 1956, Swiss citizen – PhD ETH Zurich (Federal Institute of Technology);
postgraduate study in economics, Senior Executive Program, Stanford University, USA
– Held positions with Hofmann-La Roche and Novartis (Strategic Planning)
– Joined Vifor Pharma in 1996 as CEO Vifor (International) Ltd., then became Head of the Pharma Division, Galenica Group; 2002–2017 Member of the Corporate Executive Commit-tee; 2008 Head of Industrial Operations Vifor Pharma and in 2010 CEO of OM Pharma; 2011 Deputy CEO of Vifor Pharma; 2012–2016 Deputy CEO and Head of Pharma Operations
– May 2016–May 2017 CEO Vifor Pharma – Member of the Board of Directors of
ECSA Group
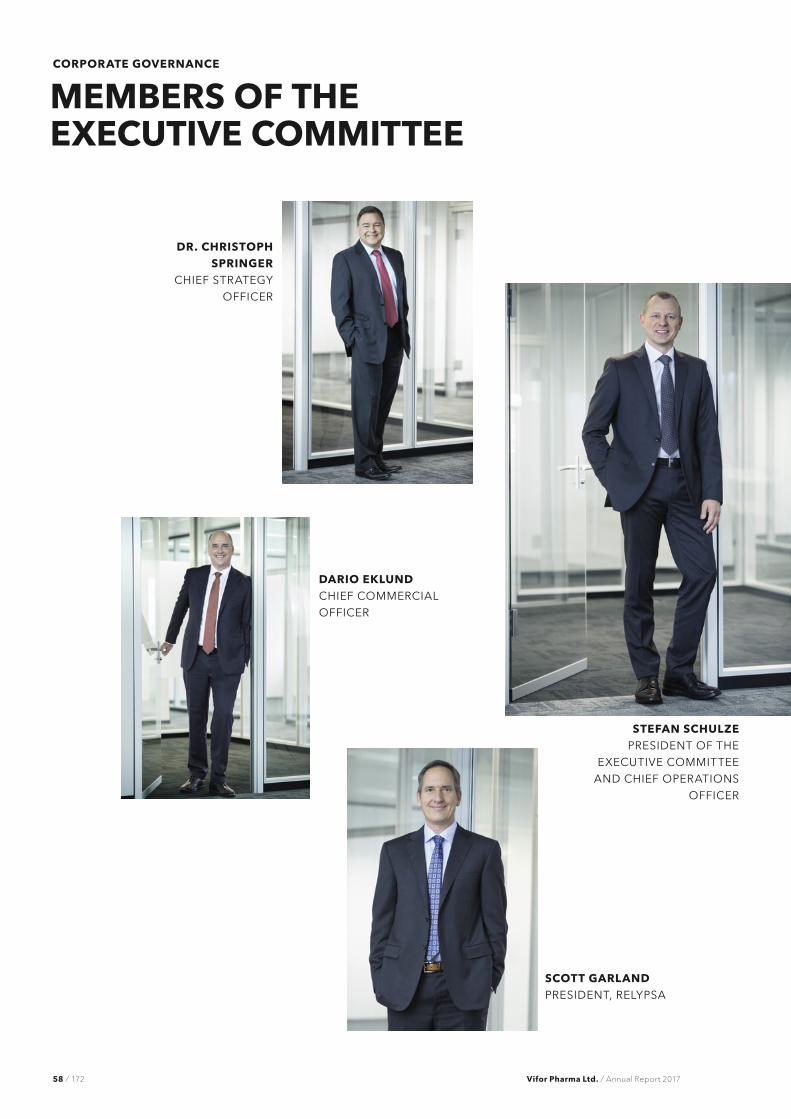
Vifor Pharma Ltd. Annual Report 2017
CORPORATE GOVERNANCE
58 172
MEMBERS OF THE ExECUTiVE COMMiTTEE
STEFAN SCHULZE PRESIDENT OF THE
EXECUTIVE COMMITTEE AND CHIEF OPERATIONS
OFFICER
DR. CHRiSTOPH SPRiNGER
CHIEF STRATEGY OFFICER
DARiO EKLUND CHIEF COMMERCIAL OFFICER
SCOTT GARLAND PRESIDENT, RELYPSA

Vifor Pharma Ltd. Annual Report 2017 59 172
STEFAN SCHULZE PRESIDENT OF THE EXECUTIVE COMMITTEE AND CHIEF OPERATING OFFICER – Born 1965, German citizen – Industrial Engineer, Technical University
of Berlin, Germany – Leading positions, such as Executive Vice-
President Sales & Marketing Fresenius AG, Germany; President and General Manager of Fresenius HemoCare’s Adsorber Technology Business Unit, Germany; President Fresenius HemoCare, USA; and Senior Vice-President Business Development Fresenius Medical Care North America, Germany and USA
– Joined the company as CEO Vifor Fresenius Medical Care Renal Pharma Ltd.; member of the Vifor Pharma Executive Committee since 2014
– Since May 2017 President of the Executive Committee and COO
DAViD BEVAN CEO OF VIFOR FRESENIUS MEDICAL CARE RENAL PHARMA LTD. AND CHIEF MARKETING OFFICER – Born 1967, British citizen – Leading positions such as Speciality Care
Business Unit Director of Pfizer UK Ltd. and Regional Vice-President Commercial Opera-tions of Otsuka Pharmaceutical Europe Ltd.
– Joined Vifor Pharma Group as CEO of Vifor Fresenius Medical Care Renal Pharma Ltd. in 2017
COLiN BOND CHIEF FINANCIAL OFFICER – Born 1960, British and Swiss citizen – FCA, Institute of Chartered Accountants in
England and Wales; MRPharmS, Royal Pharmaceutical Society of Great Britain; MBA, London Business School, UK; BSc. in Pharmacy, University of Aston in Birmingham, UK
– Leading positions such as CFO of the listed biotechnology company, Evotec; CFO of Jet Aviation Group. During his early career, Mr Bond worked as a pharmacist, auditor and management consultant for Procter & Gamble, Arthur Andersen and PricewaterhouseCoopers.
– Since 2013 Board member, Chairman of the Audit Committee of Siegfried AG
– Joined Vifor Pharma Group as CFO in 2016
DAViD BEVAN CEO OF VIFOR FRESENIUS MEDICAL CARE RENAL PHARMA LTD. AND CHIEF MARKETING OFFICER
MiCHAEL PURi CHIEF HUMAN RESOURCES OFFICER
COLiN BOND CHIEF FINANCIAL OFFICER

Vifor Pharma Ltd. Annual Report 2017
CORPORATE GOVERNANCE
60 172
DARiO EKLUND CHIEF COMMERCIAL OFFICER – Born 1968, Finnish and Austrian citizen – Master in Science, Swedish School of
Economics and Business Administration in Helsinki, Finland
– Leading positions such as Commercial Director, Area Manager Eastern Europe and Israel and Country Manager with Novartis, Switzerland and USA, General Manager of Aventis Pharma AG (now Sanofi), Switzerland and Vice-President for Ex-US Operations, Business Development and Gintuit Business Unit with Organogenesis Inc., USA
– Joined the company as Head of Global Business Operations in 2014
– Since May 2017 Chief Commercial Officer
SCOTT GARLAND PRESIDENT, RELYPSA – Born 1968, US citizen – MBA, Fuqua School of Business; BS in
Biological Sciences, California Polytechnic State University, San Luis Obispo
– Leading positions such as Executive Vice- President and Chief Commercial Officer of Exelixis; Vice-President, Avastin Franchise, at Genentech
– Joined Relypsa as Chief Commercial Officer in 2014
– President Relypsa and member of the Vifor Pharma Group Executive Committee since May 2017
MiCHAEL PURi CHIEF HUMAN RESOURCES OFFICER – Born 1969, Belgian citizen – Bachelor’s (Hons.) in Economics at the Univer-
sity of Nantes, France, and Master’s in Strategic Marketing, at the IESM Management School of Grenoble, France
– Started his professional life in Marketing, then moved to management consulting which led him to positions in HR where he has since developed a multinational career over the last 15 years, working amongst others as Senior Director Global Talent Development for UCB and Vice-President Human Resources Europe for Staples
– Global Head of the HR and member of the Global Executive Team at GrandVision
– Since 2015 Senior Vice-President and Head of Global Human Resources Vifor Pharma
– Chief Human Resources Officer since 2017
DR. CHRiSTOPH SPRiNGER CHIEF STRATEGY OFFICER – Born 1968, Swiss citizen – Master of Natural Science at the Swiss Federal
Institute of Technology (ETH) Zurich; PhD in Molecular Biology at Georg-August-University, Göttingen, Germany; MBA studies at George Washington University, USA
– Global Product Leader Anaemia at Vifor (International) Ltd.; General Manager at AMGEN Switzerland; International Marketing Director Nephrology at AMGEN International AG
– Re-joined the company in 2007 as Global Head of Anaemia TA Marketing
– Since 2011 Deputy CEO Vifor Fresenius Medical Care Renal Pharma Ltd.
– Since 2016 Head of Global Business Development of Vifor Pharma
– Vifor Pharma Group Chief Strategy Officer since 2017

Vifor Pharma Ltd. Annual Report 2017 61 172
DUTiES OF THE ExECUTiVE CHAiRMAN
– Leading the Board of Directors – Ongoing strategic development of the Group – Supporting alliances and acquisitions – Positioning the Group with respect to
communications – Maintaining relationships with partners – Overall responsibility for the corporate culture
(HR policy, communications) – Involvement in implementing key strategic
projects – Member of the Group’s strategic Boards
of Directors
DUTiES OF THE COO
– Operational management of the Group – Budget realisation and control – Ensuring compliance, internal control systems
and risk management – Developing relationships with customers,
suppliers and authorities – Supporting the Executive Chairman in preparing
strategic, HR-related and financial business for consultation and decision-making

Vifor Pharma Ltd. Annual Report 201762 172
PATiENT PORTRAiT

Vifor Pharma Ltd. Annual Report 2017 63 172
CHRiSTiAN B., 62“About twenty-five years ago, I came down with pneumonia. Every winter after that without fail I would have this awful cold, with cough-ing. A lot of coughing. Now, I am very fortunate to have a partner who I trust completely and a great team, but our business is non-stop, to say nothing of the fact that when I come to work in the morning, a whole day’s worth of work has just taken place between Geneva, Lausanne and Gstaad. We have over 6,500 customers who depend on our services. It’s a business where things never slow down, not even for ten seconds. You need every hand on deck. I knew I had to take care of myself to be able to be there for my team.”

REMUNERATiONANNUAL REPORT 2017

Vifor Pharma Ltd. Annual Report 2017 65 172
66 Chairwoman’s overview67 Philosophy and approach
to remuneration68 Governance72 Board and executive remuneration78 Remuneration awarded
in 2017 and 201684 Overview of executive remuneration
in 2016 and 201785 Auditor’s report
TABLE OF CONTENTS

Vifor Pharma Ltd. Annual Report 2017
REMUNERATiON
66 172
CHAiRWOMAN’S OVERViEW
The reporting year was marked by considerable changes with a number of extraordinary factors influencing the remuneration of our executives. With the integration of Relypsa and the prep ar-ation for launching Veltassa® substantially increas-ing the US workforce, Vifor Pharma took on the complexity of a truly international group. The successful placement of our company’s former Swiss pharmacy chain and wholesale business, Galenica Santé, at the Swiss stock exchange compensated for the cost of the acquisition of Relypsa. However, it also reduced the company’s stable revenues. Further, to reflect Vifor Pharma’s strategic focus as an international pharmaceutical company, a new executive leadership team was appointed, resulting in a completely different composition of the Executive Committee.
Our approach to remuneration follows the same philosophy as that of the former Galenica Group: we reward entrepreneurial behaviour that drives performance and long-term value creation. Our remuneration philosophy also revolves around recruiting and retaining highly talented and ethical individuals who help us promote the well-being of patients, deliver returns for our shareholders, look after the interests of our stakeholders and ensure our company’s long-term success. Our remuneration programmes are aligned with our corporate strategy to ensure Vifor Pharma Group’s strong and sustainable performance towards 2020 and beyond. Specifically, our executives’ remuneration is tied to the achievement of financial objectives derived from our strategic financial plan. A special feature of our remu-neration relates to the achievement of long-term goals, given that we are deliberately investing in our future.
As in previous years, our Executive Chairman continues to demonstrate his personal commit-ment, his alignment with the shareholders’ interest and his confidence in Vifor Pharma Group by being remunerated solely in blocked shares.
On the following pages, we explain how the different remuneration programmes for the Executive Committee, the Board of Directors and the Executive Chairman of the Board of Directors are designed to ensure sustainable success and to protect the interests of our shareholders.
Yours sincerely,
Daniela Bosshart-Hengartner Chairwoman of the Remuneration Committee
It is my pleasure to present the first annual remuneration report of Vifor Pharma Group, now an international pharmaceutical company building on our successful history as Galenica.

Vifor Pharma Ltd. Annual Report 2017 67 172
REMUNERATiON
PHiLOSOPHY AND APPROACH TO REMUNERATiON
To reflect their different roles on delivering the strategy, the Executive Committee, the Board of Directors (Board) and the Executive Chairman of the Board are remunerated by different standards.
Members of the Board receive a fixed remuneration independent of operational performance because their focus is on ensuring company stability and sus-tainability. To strengthen the alignment with shareholders’ interests, Board members receive all or part of their remuneration in the form of restricted shares and, as in 2016 and previous years, the Executive Chairman continues to receive his remuneration solely in restricted shares.
Members of the Executive Committee are remuner-ated according to the principles below.
ATTRACTiON AND RETENTiON
We aim to attract and retain highly talented, entrepreneurial, effective individuals who comply with the highest ethical standards and who can help us to promote the well-being of patients, protect the interests of our shareholders and drive the long-term success of our company.
STRATEGiC AND SHAREHOLDER ALiGNMENT
Our remuneration principles are in line with our vision and strategy, both in terms of driving performance and of delivering the returns expected by our shareholders. Vifor Pharma’s remuneration system is part of a sustainable, long-term devel-opment policy to support the strategic goals defined by the Board, who recognise that under certain circumstances, achieving economic
success may require a longer period of time. Our company does not pay any remuneration in the form of traded options. In order to strengthen the alignment of executives and shareholders, mem-bers of the Executive Committee receive part of their remuneration in restricted shares and are subject to a minimum shareholding ownership requirement. Selected members of senior manage-ment involved in long-term company projects may also be invited to participate in the share-based long-term incentive programme.
PAY-FOR-PERFORMANCE ALiGNMENT
In addition to their fixed salary, members of the Executive Committee receive variable remuner-ation to reflect the operational performance of the company as well as their individual contributions.
FAiRNESS
We strive to remunerate our employees fairly in the highly competitive market environment.
The company’s philosophy and approach to remuneration have remained stable in recent years.

Vifor Pharma Ltd. Annual Report 2017
REMUNERATiON
68 172
SHAREHOLDERS’ ENGAGEMENT
Our shareholders have been given a greater voice on remuneration matters in recent years. The Articles of Association that outline the principles of remuneration were approved by the Annual Shareholder Meeting. In addition, shareholders annually elect the members of the Remuneration Committee for the coming period of office and approve the maximum aggregate remuneration amounts each year for the Board and the Executive Committee prospectively for the next business year.
Furthermore, shareholders may express their opinion on the remuneration report in a consulta-tive vote at the Annual Shareholder Meeting. The remuneration report describes the remuneration principles and programmes as well as the gov-ernance framework related to the remuneration of the Board and Executive Committee. The report also provides details on the remuneration awarded
to the members of the Board and of the Executive Committee in the reporting year.
PROViSiONS iN THE ViFOR PHARMA ARTiCLES OF ASSOCiATiON: SUMMARY
The responsibilities of the different decision-making bodies in determining remuneration and the guiding principles are defined in the Vifor Pharma Articles of Association. The Articles of Association form the basis for our remuneration strategy and policy for the Executive Committee and the Board. They are also the basis for any recommendation or proposal that the Remuneration Committee formulates.
Key provisions of the Articles of Association on remuneration are summarised in the table below and can be found online at http://www.viforpharma.com/governance.
GOVERNANCE
PROViSiONS iN THE ViFOR PHARMA ARTiCLES OF ASSOCiATiON: SUMMARY
Topic Article Summary
Remuneration Committee
19 a The Remuneration Committee generally comprises three members who are elected individually by the shareholders at the Annual Shareholder Meeting for a period of one year. The Remuneration Committee supports the Board in establishing and reviewing the remuneration strategy, principles and programmes, in preparing the proposals to the Annual Shareholder Meeting on remuneration matters and in determining the remuneration of the Board, the Executive Chairman and of the members of the Executive Committee.
“Say-on-pay” votes 19 bpar. 1
Shareholders approve the maximum possible amount of remuneration of the Board (incl. Executive Chairman) and the Executive Committee for the following financial year.
Remuneration principles
19 bpar. 2
Remuneration of the members of the Board consists of fixed remuneration only. Remuneration of the members of the Executive Committee consists of fixed and variable elements. Variable remuneration may comprise short-term and long-term components. Remuneration may be paid in cash, shares or other benefits.
Supplementary amount for new Executive Committee members
19 bpar. 6
If the maximum approved remuneration amount is not sufficient to also cover the remuneration of newly promoted/hired members of the Executive Committee, the maximum possible remuneration amount for such newly promoted/hired members may exceed the average of existing members excluding the CEO by up to 25% as a supplementary amount to cover the remuneration of such new Executive Committee member(s). For a newly promoted/hired CEO the supplementary amount is 40% of the maximum possible remuneration amount of his or her predecessor.
Credits and loans 19 bpar. 8
Credits and loans may not be granted to members of the Board and only up to 50% of the annual base salary for members of the Executive Committee.

Vifor Pharma Ltd. Annual Report 2017 69 172
RESPONSiBiLiTiES OF THE DiFFERENT BODiES iN DETERMiNiNG REMUNERATiON
Vifor Pharma’s remuneration and reporting comply with:
– the Swiss Code of Obligations, – the Swiss Federal Ordinance against excessive
compensation in publicly listed corporations (VegüV),
– the standards on corporate governance of SIX Swiss Exchange and
– the Swiss Code of Best Practice for Corporate Governance of Swiss national federation, Economiesuisse.
The Board is responsible for designing the remuneration policy and programmes and for defining individual remuneration packages for the members of the Board and the Executive Committee. Furthermore, the Board is accountable
for the preparation and overall fair presentation of the remuneration report in accordance with Swiss law and the VegüV (“Verordnung gegen über mässige Vergütungen bei börsen kotierten Aktiengesellschaften” or “Ordinance against excessive compensation in publicly listed corporations”).
The Remuneration Committee acts in an advisory capacity while the Board retains the decision authority on matters relating to remuneration except for the maximum remuneration amounts for the Board and for the Executive Committee, which are approved by shareholders at the Annual Shareholder Meeting. The responsibilities of the different bodies regarding remuneration matters are detailed in the table below.
RESPONSiBiLiTiES REGARDiNG REMUNERATiON DECiSiONS
COORemuneration
Committee Executive Chair Board of Directors Shareholders
Remuneration policy and incentive plans Proposes Approves
Maximum remuneration amount of EC Proposes Recommends Recommends Approves
COO remuneration Proposes Recommends Approves
Individual remuneration of EC members Proposes Approves Informs
Recommends Is informed
Performance objectives and assessment of COO
Proposes Recommends Approves
Performance objectives and assessment of EC
Proposes Approves Informs
Recommends Is informed
Shareholding requirements of COO and EC
Proposes Approves
Maximum remuneration amount of the Board
Proposes Recommends Recommends Approves
Individual remuneration of Board members Proposes Approves
Remuneration report Proposes Recommends Approves Consultative vote

Vifor Pharma Ltd. Annual Report 2017
REMUNERATiON
70 172
THE REMUNERATiON COMMiTTEE
The Remuneration Committee supports the Board in defining the principles of the remuner ation policy and in determining the remuneration awarded to members of the Board and the Executive Committee within the maximum aggregate amount of remuneration approved by shareholders at the Annual Shareholder Meeting. The Committee supports the Board in designing participation and incentive programmes and in all other tasks related to remuneration. The Remuneration Committee formulates appropriate recommenda-tions for submission to the Board. The Board may delegate further duties and powers to the
Remuneration Committee. The Executive Chairman is invited regularly to meetings in an advisory capacity. The Chairman of the Committee may also invite other executives, such as the COO, as appropriate. Agenda items and matters directly affecting the Executive Chairman or the COO are deliberated in their absence.
The Remuneration Committee meets as often as business requires, but at least quarterly during a year according to the annual remuneration plan-ning cycle described below. In the 2017 business year, the Committee held six meetings, each lasting between one and three hours.
ANNUAL REMUNERATiON PLANNiNG CYCLE
Q1 Q2 Q3 Q4
Annual Shareholder Meeting ×
Corporate strategy planning
Review/amend strategy ×
Assess/amend mid-term plan ×
Establish budget for next year × ×
Remuneration decisions
Define maximum aggregate remuneration amount of Board of Directors to be submitted to shareholders’ vote
×
Define maximum aggregate remuneration amount of Executive Committee to be submitted to shareholders’ vote
×
Define maximum aggregate remuneration amount of the Executive Chairman to be submitted to shareholders’ vote and calculate the number of shares allocated
×
Shareholders approve maximum remuneration amounts for the Board of Directors (incl. Executive Chairman) and the Executive Committee
×
Set performance objectives for the Executive Committee ×
Assess performance achievement of Executive Committee (mid-year assessment) ×
Assess performance achievement of Executive Committee (final assessment) and propose related variable remuneration payments
×
Approve variable remuneration of Executive Committee for the previous business year (short-term bonus)
×

Vifor Pharma Ltd. Annual Report 2017 71 172
USE OF BENCHMARKS AND ExTERNAL ADViSORS
The remuneration paid to the Executive Commit-tee members is compared with the remuneration paid to Executive Committee members in comparable European pharmaceutical companies. We base our assessment on public information, respected market data providers, data published by non-profit organisations focused on socially responsible investment and active share ownership, and on Remuneration Committee members’ experience and expertise from similar companies. A pharmaceutical company is regarded as similar if it is comparable to Vifor Pharma in terms of sector, structure, size (sales and number of employees), geographic presence, profitability, market capitalisation and complexity.
As a general rule, no external consultants are engaged for determining remuneration. Rather, external consultants support the Remuneration Committee in the development of the remuneration strategy and of the review of short-term and long-term remuneration, cash and equity-based remuneration and salary levels. In connection with the separation of the Group in 2017, Mercer carried out a benchmark study on the remu-neration of members of the former Galenica Group Corporate Executive Committee and certain other functions and updated it for the new Vifor Pharma Executive Committee functions. The peer group compared in the benchmark consisted of Ipsen, Hikma Pharmaceuticals, BTG, Stada Arzneimittel, Lonza, Actelion, Sonova, Indivior, Grifols, UCB, Recordati, Orion and Lundbeck. No other external consultants were mandated in 2017.

Vifor Pharma Ltd. Annual Report 2017
REMUNERATiON
72 172
Remuneration for the Board of Directors
The Board sets remuneration for its members in order to attract and retain a mix of Swiss and international high-calibre individuals with global experience. Board members do not receive variable performance-based remuneration or options, and except for the Executive Chairman, are not eligible to company pension benefits, which underscores their focus on corporate strategy, supervision and governance.
Each member of the Board receives an annual fee for Board membership and for performing additional functions as chair and/or member of a Board committee. The level of remuneration for each role is determined based on the skill set, experience and time required as described below.
CHF
Board membership 140,000
Vice-chair of the Board 70,000
Chair of either the Remuneration or the Audit and Risk Committee 30,000
Chair of Scientific Committee 20,000
Committee membership (not Chair) 10,000
Remuneration is paid 50% in shares, which are blocked for five years. Board members may elect to be paid fully in shares.
The remuneration of the Board includes regular social security contributions.
Board members are subject to a minimum shareholding ownership requirement: they must hold the equivalent of at least their annual remuneration in shares within two years of their election to the Board.
Remuneration of the Board is benchmarked from time to time (last review in 2014 by Hostettler Kramarsch Partner, Zurich) against the current
best practices of listed companies of comparable size and market capitalisation in Switzerland (Peer group: Actelion, Aryzta, Barry Callebaut, Clariant, DKSH, Dufry, Fischer, Lindt, Lonza, OC Oerlikon, Schindler, Sika, Sonova, Straumann, Sulzer, Bucher Ems-Chemie, Flughafen Zürich and Panalpina) and against data collected by foundations for socially responsible investment and active share ownership.
Remuneration for the Executive Chairman
Since 2012, Etienne Jornod has been remunerated exclusively in registered shares for his respon-sibilities and duties as Executive Chairman of the Board of the company. The agreement between the Board and Mr Jornod is that, conditionally upon his re-election by shareholders at the Annual Shareholder Meeting, his share-based remuneration will remain unchanged until 2020. His annual share-based remuneration is therefore held constant at CHF 3,670,000 and awarded at the end of each business year in form of shares blocked for five years. In addition, Mr Jornod also receives CHF 150,000 in cash to cover his em-ployee social security contributions. In the event of Mr Jornod stepping down during the year, he would be entitled to pro-rata remuneration.
The Board and Mr Jornod also agreed to keep the 200,000 shares that he owned prior to 2017 blocked until the 2020 Annual Shareholder Meeting. This conscious decision to reinvest value into the company is a clear demonstration of Mr Jornod’s personal commitment to shareholders and his confidence in the company’s vision, strategy and leadership.
The restriction on the shares may expire if Mr Jornod’s function were to end or if his function were rendered non-executive. His shares remain blocked in all other instances.
BOARD AND ExECUTiVE REMUNERATiON

Vifor Pharma Ltd. Annual Report 2017 73 172
Remuneration for the Executive Committee
In order to reward performance and promote Executive Committee members’ loyalty and long-term engagement, the Vifor Pharma remu-neration system is applied consistently through-out the group and comprises an annual base salary, a short-term bonus, a long-term incentive and customary benefits. The ratio between fixed and variable remuneration may vary depending on criteria such as position level, scope and responsibility of the role (eg impact on organisation, profit and loss, budget and team, headcount). Accordingly, the variable portion of remuneration (“at risk”) is higher for members of the Executive Committee. Executive Committee members also participate in long-term incentive programmes, as they directly impact Vifor Pharma’s long-term performance and success.
ANNUAL BASE SALARY
The annual base salary constitutes the fixed pay that reflects the scope and responsibilities of the function, the required skills and the profile of the incumbent (qualifications and previous experi-ence). Base salary is determined according to typical market practice (external benchmarks) and the Vifor Pharma Group’s internal salary structure. A base salary around the median of the benchmark is considered competitive. Base salary is re-viewed annually in line with market salary trends, the company’s ability to pay based on its financial performance and the evolving experience of the incumbent.
VARiABLE REMUNERATiON (iNCENTiVES)
Executive Committee members are eligible for an annual short-term bonus. They may also be invited to participate in a Long-Term Incentive Programme (LTI) that recognises and rewards the achievement of company goals over several years,
such as specific long-term financial objectives or the integration of a new business (eg Relypsa). The short-term bonus and LTI are variable, performance-based income. This incentive system is designed to ensure that the participants’ actions, choices and behaviour support the fulfilment of the company’s goals and its sustainable success.
These incentive schemes constitute independent elements in a remuneration package and are therefore weighted and calculated individually. The ratio between annual base salary and the variable elements of remuneration is determined by the Remuneration Committee based on function level. Both the short-term bonus and the LTI are capped at a payout level of 200% of the target. Each of the target short-term bonus and the target LTI may not exceed an Executive Committee member’s annual base salary.
Each LTI programme has a vesting period of three years. (PSUs awarded are only converted into shares and paid out after performance targets have been achieved and after the period of three years for the respective LTI programme has ended.) Vifor Pharma does not have an explicit clawback policy, among other things because the company is in full control of PSUs that have not yet vested, ie from up to three LTI programmes. This policy allows Vifor Pharma to withhold incentive payments rather than having to recover incentives that have already been paid out if necessary.

Vifor Pharma Ltd. Annual Report 2017
REMUNERATiON
74 172
SHORT-TERM BONUS
The purpose of the annual, or short-term, bonus is to reward the company’s overall financial results and individual contributions during a given business year.
The target bonus is defined once a year at the beginning of a performance period and constitutes the amount to be paid out to the extent that all performance objectives have been fully achieved (100% payout). The target bonus typically ranges from 70% to 90% of the annual base salary for the CEO and from 30% to 50% of annual base salary for the other members of the Executive Committee.
The financial performance objective is defined as a target percentage of the entire Vifor Pharma Group return on invested capital (ROIC) and is weighted at 75%; individual performance objectives are weighted at 25%.
Individual objectives are either quantitative or qualitative (eg strategic, operational or project- based objectives including safety, compliance and corporate responsibility). The evaluation of an Executive Committee member’s individual
performance is conducted at the end of the year and includes a qualitative assessment of whether he or she has carried out his or her duties in line with company values and expected leadership behaviours.
Maximum payout of the short-term bonus is capped at 200% of target amount.
The short-term bonus is paid out annually after the full-year results have been published. Executive Committee members receive 32% of their bonus in Vifor Pharma shares, which remain blocked for a period of five years; the remaining 68% is paid out in cash. If the Board awards a discretionary bonus for extraordinary perform-ance, the bonus would ususally be paid out in cash only.
LONG-TERM iNCENTiVE PROGRAMME
The Long-term Incentive Programme (LTI) recognises and rewards Executive Committee members and selected senior managers ( currently about 2.5% of all employees) for the achievement of specific long-term objectives, such as long-term financial targets or the successful integration of a major acquisition. The LTI is designed to align management and company interests over the medium and long terms to ensure sustainable value for patients, customers and shareholders. LTI participants also have the opportunity to benefit from the long-term appreciation of Vifor Pharma’s overall value through the evolution of the share price, which strengthens their personal investment in the company and gives them a compelling reason to stay at Vifor Pharma.
The LTI is a long-term equity plan whose value is influenced by the Group’s operating performance and the Vifor Pharma share price. The Board decides the COO’s eligibility and award size; the Remuneration Committee takes these decisions for the other members of the Executive Committee.
USiNG ROiC AS A PERFORMANCE MEASURE
The ROIC target was chosen as a performance measure for both the short-term bonus and the LTI because it expresses how well the company is generating cash relative to the capital it has invested in its business and is a simple and easily accessible metric for management on all levels. The financial target level is defined annually, generally substantially above the weighted average cost of capital; individual targets are not published as they are considered commercially sensitive information. A performance band constitutes a range of payout, from a minimum level of performance (threshold) below which the payout is zero and a maximum level of performance (cap) above which the payout is capped, with the target in the middle.

Vifor Pharma Ltd. Annual Report 2017 75 172
The LTI award is based on performance share units (PSUs) that vest and are converted into Vifor Pharma shares at the end of a three-year vesting period (programme period).
The Remuneration Committee defines the target amount for an LTI cycle (typically a three-year period) as a percentage of the annual base salary for each member of the Executive Committee at the beginning of a three-year programme period. The number of PSUs allocated at the beginning of a programme period depends on the target amount and on the average share price during the final month prior to allocation. At the end of a programme period, the number of PSUs to vest depends on ROIC performance during the vesting period.
The PSUs granted may be fully or partially forfeited as per the programme rules in the event of termination of employment during a programme period except in the cases of death or disability where a pro-rata vesting applies on the date of termination. In case of change of control, eg if the shares were to be delisted, outstanding PSUs may vest immediately.
LTi PERFORMANCE MEASURES: PAST, PRESENT, FUTURE
Performance objectives for 2016 and earlier were set using a measure called Galenica Economic Profit (GEP), which constituted the relative increase in economic profit at the comprehensive group level of Vifor Pharma (then named Galenica) including its pharmacy and wholesale business, which was separated and sold in an initial public offering (IPO) in April 2017. GEP is based on an economic-value-added (EVA) management approach. It revolves around the idea that long-term Group return on investment exceeding the weighted cost of capital is in the interest of shareholders and other key stakeholders. This measure is calculated as net operating profit (before interest and after depreciation, amortisation and tax) less the weighted average cost of capital (WACC) over average invested capital. Currently outstanding LTIs for 2015–2017 and for 2016–2018 are based on both GEP and ROIC objectives on a pro-rata basis. Performance objectives for 2017 and later are based solely on ROIC.

Vifor Pharma Ltd. Annual Report 2017
REMUNERATiON
76 172
PENSiONS AND OTHER EMPLOYEE BENEFiTS
Vifor Pharma offers additional benefit plans that are designed to protect and support employees around the uncertainties of life. These benefits including retirement, disability and death plans are country-specific and are designed in accordance with local legal requirements and competitive market practices. Members of the Executive Committee based in Switzerland are covered by the pension scheme for all Vifor Pharma employees in Switzerland. The Vifor Pharma pension plan in Switzerland exceeds the legal requirements stipulated by the Swiss Federal Law on Occupational Pension Schemes (BVG) and is in line with what other listed companies of similar size in Switzerland offer. The President of Relypsa is covered by a comparable pension scheme in the United States.
Independent of their remuneration, employees (including Executive Committee members) are entitled to acquire a limited number of shares under the share acquisition plan. These shares are blocked for three years at a reduced price with a 30% discount on the market price.
Other benefits may include an expense allowance, a company car and reimbursement for one-time expenses relating to relocation, tax and legal advice (eg in order to move to Switzerland) for select management and Executive Committee members. The fair value of these other benefits is part of
the remuneration and disclosed in the table on page 79. Members of the Executive Committee do not receive additional benefits.
EMPLOYMENT CONTRACTS
Members of the Executive Committee are employed under contracts of unlimited duration and subject to a maximum notice period of 12 months. They are not entitled to severance packages, termination payments or change-of-control payments except the special vesting provisions under the LTI as described above.
MiNiMUM SHAREHOLDiNG REQUiREMENTS
The members of the Executive Committee are required to own at least 75% of their annual base salary and target bonus in Vifor Pharma shares within five years of their appointment to the Executive Committee.
OPTiONS AND LOANS
Vifor Pharma does not issue any tradeable options. The Vifor Pharma Articles of Association excludes loans or credits to members of the Board; loans to members of the Executive Committee are permitted up to 50% of an annual base salary.
÷
×
=
=
Beginning of cycle
End of cycle
Number of performance
share units
Number of complete
shares awarded
% of base salary
Number of performance
share units
% of target achievement
during three-year
period
Vifor Pharma share price
How performance share units (PSUs) are calculated and awarded
Vifor Pharma Ltd. Annual Report 2017 77 172

Vifor Pharma Ltd. Annual Report 2017
REMUNERATiON
78 172
Accordingly, the Executive Committee was expanded to seven members following the IPO in April 2017 instead of the original five members. This structural shift within the Executive Committee around the IPO means that a direct line-by-line comparison between 2016 and 2017 is not conclusive.
REMUNERATiON OF THE ViFOR PHARMA ExECUTiVE COMMiTTEE AND THE FORMER GALENiCA CORPORATE ExECUTiVE COMMiTTEE
The remuneration of the Executive Committee increased substantially compared to the previous year. This increase was primarily due to the Executive Committee’s new, larger composition (increased from five to seven members) covering a different scope of roles as described above and due to certain contractually agreed ongoing remuneration obligations to former members of the Galenica Corporate Executive Committee who stepped down in connection with the separation of the Group and the IPO. Overall, the remuneration of the Executive Committee in 2017 of CHF 9,763,000 amounted to of 88.8% of the maximum amount of remuneration approved by the shareholders at the 2016 Annual Shareholder Meeting. This amount is then adapted in accord-ance with Art. 19b, par. 6 of the Vifor Pharma Articles of Association.
Despite the increase of the overall amount for all members of the Executive Committee, the average maximum remuneration amount per each member remained stable. Otherwise, the remuneration system and programmes for the Executive Committee remained essentially unchanged.
The disclosed remuneration for the business year 2017 includes the remuneration for four members of the Galenica Group Corporate Executive Committee until the IPO (ie from 1 January to 31 March 2017), and seven Vifor Pharma Executive Committee members from 1 April to 31 December. Variable elements of the remuneration were calculated at 100% achievement for the first three months for the members of the former Galenica Corporate Executive Committee, while the remaining nine months were calculated for the new members of the Vifor Pharma Executive Committee on an effective performance achieve-ment basis. The financial performance achieved under the short-term bonus, which accounts for 75% of the payout amounts to 119.7% for Vifor Pharma Group. For the individual portion of the bonus, which accounts for 25% of the payout, average performance achievement was 111%. In 2017, the Board of Directors awarded the members of the new Executive Committee members a discretionary bonus for extraordinary perform ance, resulting in an average payout of 116% for each of these individuals.
REMUNERATiON AWARDED iN 2017 AND 2016
A number of extraordinary factors influenced the remuner-ation in 2017, notably the separation of the Group with the sale of Galenica Santé in an initial public offering (IPO) on the stock market on 7 April 2017. The composition of the Executive Committee was therefore changed to reflect the skill set and experience needed in an independent, international pharmaceutical company.

Vifor Pharma Ltd. Annual Report 2017 79 172
REMUNERATiON OF ExECUTiVE COMMiTTEE MEMBERS iN 20171
In thousand CHF Total 2Of which
Stefan Schulze, COO
Base salary 3,664 438
Bonus in cash 2,339 419
Bonus in shares 897 137
Long-term Incentive Programme 1,610 307
Contributions to pension funds 551 71
Other remuneration 137 14
Remuneration received 9,198 1,386
Social security costs 565 76
Executive Committee member remuneration 9,7634 1,462
Within approval limit5 Yes
1 All remuneration amounts are gross amounts. 2 Remuneration includes amounts paid to current members of the Executive Committee pro rata since appointment as well as pro rata remuner-
ation for former members of the Corporate Executive Committee until the IPO of the pharmacy and wholesale business. 3 Member with the highest remuneration of the Executive Committee. In addition, Stefan Schulze was paid CHF 172,000 as compensation for lost
remuneration in relation to his engagement as COO. Amounts constitute pro-rata payments for the nine-month period beginning 1 April when Stefan Schulze assumed his duties as COO.
4 Including CHF 1,800,371 remuneration and contractual obligation to former CEO, Dr. Gianni Zampieri; CHF 2,166,000 to former CEOs, Søren Tulstrup and Jörg Kneubühler; and former members of the Galenica Executive Committee, Felix Burkhard and Jean-Claude Clémençon.
5 The maximum remuneration of CHF 8,000,000 for five members of the Corporate Executive Committee has been increased by 25% for two new members other than the CEOs due to the increase to seven members in accordance with Art. 19 b, para. 6 of the Articles of Association.
The allocation of PSUs under the LTI was defined on the basis of the average share price during the month of February 2017 of CHF 1,119.15 (before the 1:10 share split effective on 22 May 2017). The 2017 ROIC target was set at 14.3%. Given that the company is in a transition period with many changing parameters, the Remuneration Committee has agreed as a one-time exception to define the ROIC target on a rolling annual basis rather than at the beginning of the plan cycle for the entire three-year performance period. For future awards, the three-year target mechanism will apply.
The performance achievement under the 2015–2017 that vested at the end of 2017 was 145.6%. Prior to the IPO, the portion of the LTI for the period of time between 1 January and 30 April 2017 was calculated at target.
3

Vifor Pharma Ltd. Annual Report 2017
REMUNERATiON
80 172
OPTiONS, LOANS AND CREDiTS
As of 31 December 2017, no member of the Executive Committee held tradable options or was granted any loan or credit from the company.
REMUNERATiON OF THE BOARD OF DiRECTORS
The amount of the share-based remuneration of the Executive Chairman remained unchanged from the previous year. Reflecting the more international, and thus more complex and competitive, environment in which Vifor Pharma operates, remuneration for each Board member was slightly higher, but the overall total amount decreased by 5.3% to CHF 5,516,000 compared to the previous year.
For the remuneration in shares, the amount was converted at the average share price for the month of June 2017, ie CHF 108.67, minus a 25% discount.
REMUNERATiON OF THE ExECUTiVE CHAiRMAN
Consistent with previous years, the Executive Chairman was again remunerated fully in shares blocked for five years for his service in the period from 1 January to 31 December 2017. The overall amount for the share-based remuneration remained unchanged at CHF 3,670,000 as agreed and approved by the 2016 Annual Shareholder Meeting of Galenica AG. This amount was divided by the average share price of January/February 2016 (CHF 140.47 per share) resulting in 26,127 shares of Vifor Pharma. In addition, Etienne Jornod receives CHF 150,000 in cash to cover the employee contributions to social security and is eligible for customary benefits outlined in “other remuneration” in the table above (eg company car, commensurate expenses including business expenses and representation allowance).
ExECUTiVE COMMiTTEE MEMBERS SHAREHOLDiNGS AND OUTSTANDiNG PERFORMANCE SHARE UNiTS (PSU)
Number of registered shares held as at 31.12.2017 1
Number of PSU granted after appointed to the EC
(potential vesting 2020) 2
Number of PSU granted before appointed to the EC
(potential vesting until 2021) 3Total number of
PSUs outstanding
Stefan Schulze 2,980 1,828 14,829 16,657
David Bevan 100 1,087 0 1,087
Colin Bond 1,020 1,274 10,210 11,484
Dario Eklund 2,640 1,522 12,988 14,510
Scott Garland 0 0 0 0
Michael Puri 1,160 913 10,350 11,263
Dr. Christoph Springer 20,350 968 10,509 11,477
1 Registered shares held by related parties of members of the Executive Committee are also included in the totals disclosed above.2 Including pro rata 2017 attributable to the time after appointment to the EC.3 Including pro rata 2017 attributable to the time before appointment to the EC.4 Upon vesting, each PSU will be converted to registered shares within a range of 0 and 2 depending on target achievement.
4

Vifor Pharma Ltd. Annual Report 2017 81 172
FORMER MEMBERS OF THE BOARD OF DiRECTORS AND CORPORATE ExECUTiVE COMMiTTEE
Vifor Pharma continued to pay contractually agreed remuneration in the reporting period to former members of the Corporate Executive Committee: Dr. Gianni Zampieri, who resigned on 11 May 2017, the day of the Galenica Group Annual Shareholder Meeting, to join the
Vifor Pharma Group Board of Directors;and Jörg Kneubühler, who resigned in connection with the IPO on 7 April 2017 as disclosed in the remuneration table for the Executive Committee on page 79. The company also continued to pay CHF 532,620 as remuneration to Søren Tulstrup, who resigned as CEO on 24 May 2016. Otherwise, Vifor Pharma did not pay any remuneration to former members of the Board or the Executive Committee.
REMUNERATiON OF THE ViFOR PHARMA BOARD OF DiRECTORS iN 20171
Registered shares
In thousand CHF Role(s) Fee in cashFee equivalent
in sharesOther
remuneration 2 TotalHeld as at
31.12.2017Allocated
for 2017
Etienne Jornod, Executive Chairman CG, S 150 3,670 3563 4,176 226,627 26,127
Executive member of the Board of Directors 150 3,670 356 4,176 226,627 26,127
Daniela Bosshardt-Hengartner CR, S 0 179 13 193 11,990 2,209
Michel Burnier CS, R 0 169 13 182 6,320 2,086
Romeo Cerutti A, G 0 159 12 171 1,930 1,963
Marc de Garidel VC, CA, G, S 0 247 18 266 2,500 3,047
Sylvie Grégoire S 75 75 11 161 3,650 920
Fritz Hirsbrunner A, R 80 80 11 171 66,030 982
Dr. Gianni Zampieri (as from Annual General Meeting 2017) S 0 100 7 107 41,2695 1,227
This E. Schneider (until Annual General Meeting 2017) A, G 47 0 3 50
Stefano Pessina (until Annual General Meeting 2017) 37 0 2 39
Non-executive members of the Board of Directors 238 1,010 92 1,340 133,689 12,434
Remuneration of the members of the Board of Directors 388 4,680 448 5,516 360,316 38,561
1 All remuneration amounts are gross amounts.2 Other remuneration includes the employer’s contribution to social security and pension fund. In addition, the employer pays the employee’s
amount for this social security costs amounting to CHF 228,000.3 Includes CHF 20,000 resulting from change in remuneration structure to maintain economic value despite change in payment structure.4 Will be allocated in February 2018.5 Includes the share-based portion of Dr Zampieri’s 2016 short-term bonus and PSUs that were awarded during his tenure as a member of the
Corporate Executive Committee and that were subsequently converted into shares.
Registered shares held by related parties of members of the Board of Directors are included in the declaration of the number of shares they hold.
A: Membership in the Audit and Risk Committee; CA: Chair of the Audit and Risk Committee; CG: Chair of the Governance Committee; CR: Chair of the Remuneration Committee; CS: Chair of the Scientific Committee; G: Membership in the Governance Committee; R: Membership in the Remuneration Committee; S: Membership in the Scientific Committee; VC: Vice-Chairperson
4

Vifor Pharma Ltd. Annual Report 2017
REMUNERATiON
82 172
REMUNERATiON OF THE FORMER GALENiCA BOARD OF DiRECTORS iN 2016¹
Registered shares
In thousand CHF Fee in cashFee equivalent
in sharesOther
remuneration2 TotalHeld as at
31.12.2016Allocated
for 2016
Etienne Jornod, Executive Chairman 150 3,670 341 4,161 20,050 8,000
Executive member of the Board of Directors 150 3,670 341 4,161 20,050 8,000
Daniela Bosshardt-Hengartner 50 213 14 277 1,008 191
Michel Burnier 753 100 10 185 542 90
Romeo Cerutti - 173 9 182 38 155
Marc de Garidel4 12 200 10 222 71 179
Hans Peter Frick (until Annual Shareholder Meeting 2016) 20 27 1 48 - 24
Sylvie Grégoire 60 80 8 148 293 72
Fritz Hirsbrunner4 35 173 7 215 6,448 155
Stefano Pessina - 146 5 151 1,975 131
This E. Schneider - 227 10 237 3,670 203
Non-executive members of the Board of Directors 252 1,339 74 1,665 14,045 1,200
Remuneration of the members of the Board of Directors 402 5,009 415 5,826 34,095 9,200
1 Reflects status quo before the 1:10 share split. 2 Other remuneration corresponds to the social security costs due from the member of the Board of Directors but paid by Galenica as well as to
the employer’s contribution to the pension funds. The employer’s contributions to social security costs amounted to CHF 352,000.3 The amount was paid to the Centre Hospitalier Universitaire Vaudois (CHUV) in Lausanne.4 The remuneration also included remuneration for services rendered to Group companies and the Galenica pension funds.
Registered shares held by related parties of members of the Board of Directors are included in the declaration of the number of shares they hold.

Vifor Pharma Ltd. Annual Report 2017 83 172
REMUNERATiON OF THE FORMER GALENiCA CORPORATE ExECUTiVE COMMiTTEE iN 2016
In thousand CHF TotalOf which
Dr. Gianni ZampieriOf which
Jörg Kneubühler
Base salary 2,621 554 504
Bonus in cash 1,543 504 539
Bonus in shares 734 316 213
Long-term Incentive Programme1 874 201 209
Contributions to pension funds 406 89 87
Other remuneration2 16 - 2
Remuneration received 6,194 1,664 1,554
Social security costs 432 114 107
Corporate Executive Committee member remuneration3 6,626 1,778 1,661
1 The PSUs falling due after three years are included with the fair value at grant based on estimated target achievement (IFRS 2).2 Including private utilisation of company car, reimbursement for relocation and tax/legal advice.3 Remuneration to Søren Tulstrup, former CEO Galenica Group, for services provided to companies in the Galenica Group amounted
to CHF 1,387,000.
SHAREHOLDiNGS AND OUTSTANDiNG PSUS OF THE FORMER CORPORATE ExECUTiVE COMMiTTEE (BEFORE COMPANY NAME CHANGE TO ViFOR PHARMA LTD)¹
Number of registered shares
held as at 31.12.2016²
PSUs granted in 2016
(potential vesting on 31.12.2018)
PSUs granted in 2015
(potential vesting on 31.12.2017)
PSUs granted in 2014
(potential vesting on 31.12.2016)
Total unvested PSUs³, 4
Felix Burkhard 911 66 118 165 349
Jean-Claude Clémençon 488 85 144 165 394
Jörg Kneubühler 672 142 250 273 665
Dr. Gianni Zampieri 3,598 137 167 251 555
1 Reflects status quo before the 1:10 share split.2 Registered shares held by related parties of members of the Corporate Executive Committee are also included in the totals disclosed above.3 Each performance share unit transforms at vesting into one registered share.4 The shares corresponding to the PSU are transferred to the beneficiaries in the subsequent year.
For better comparability, the number of PSUs are shown already when granted and not only at vesting after the three-year plan period expires. Included in the table above is the expected number of PSUs that will – based on the current assessment of target achievement – ultimately vest.

Vifor Pharma Ltd. Annual Report 2017
REMUNERATiON
84 172
88%
79%
89%
78%
12%
21%
11%
22%201
874
1,610
307
820
2,277
3,238
556
202854
1,253
161
5542,6213,664
438
2016 (five members) 2016
CEO CEO/COO
20172017 (seven members)
2,027
8,3411
11,000 2,5002
1,777
6,626
9,7651,875
1,462
OVERViEW OF ExECUTiVE REMUNERATiON iN 2016 AND 2017
In line with the Articles of Association, the maximum aggregate amount of remuneration for members of the Board of Directors and of the Executive Committee will be submitted to shareholders for approval prospectively for the business year following the Annual Shareholder Meeting. This approval process sets an upper limit to the maximum possible remuneration amount and accounts for all variable elements including
in particular the short-term bonus and the LTI (blocked shares and PSUs are valued at the grant date). The table below shows a comparison for the Executive Committee as a whole and for the CEO/COO for the years 2016 and 2017. The remuneration for the entire Executive Committee should be seen in the context of an increase from four to seven members and of the Executive Committee’s completely new composition.
Executive Committee remuneration in 2016 and 2017 in thousand CHF
CEO/COO remuneration in 2016 and 2017 in thousand CHF
1 Amount approved by the Annual General Meeting increased due to promotion and pursuant to Art. 19 b, para. 6 in the Vifor Pharma Articles of Association.
Per cent of maximum potential not paid or allocated
Per cent of maximum potential paid or allocated
LTI STI Social insurance and
other remuneration Annual base salary
12-month potential maximum
12-month potential maximum
12-month potential maximum
12-month potential maximum
Paid or allocated
Paid or allocated
Paid or allocated
9-month potential maximum
9 months paid or
allocated
2 Potential maximum remuneration for the full year in 2017.

Vifor Pharma Ltd. Annual Report 2017 85 172
REMUNERATiON
Report of the statutory auditor on the remuneration report
We have audited the accompanying remuneration report of Vifor Pharma Ltd. for the year ended 31 December 2017. The audit was limited to the information according to articles 14–16 of the Ordinance against Excessive Compensation in Stock Exchange Listed Companies (Ordinance) contained on pages 78 to 81 of the remuneration report.
BOARD OF DiRECTORS’ RESPONSiBiLiTYThe Board of Directors is responsible for the preparation and overall fair presentation of the remuneration report in accordance with Swiss law and the Ordinance. The Board of Directors is also responsible for designing the remuneration system and defining individual remuneration packages.
AUDiTOR’S RESPONSiBiLiTYOur responsibility is to express an opinion on the accompanying remuneration report. We conducted our audit in accordance with Swiss Auditing Standards. Those standards require that we comply with ethical requirements and plan and perform the audit to obtain reasonable assurance about whether the remuneration report complies with Swiss law and articles 14–16 of the Ordinance.
An audit involves performing procedures to obtain audit evidence on the disclosures made in the remuneration report with regard to compensation, loans and credits in accordance with articles 14–16 of the Ordinance. The procedures selected depend on the auditor’s judgment, including the assessment of the risks of material misstatements in the remuneration report, whether due to fraud or error. This audit also includes evaluating the reasonableness of the methods applied to value components of remuneration, as well as assessing the overall presentation of the remuneration report.
We believe that the audit evidence we have obtained is sufficient and appropriate to provide a basis for our opinion.
OPiNiONIn our opinion, the remuneration report for the year ended 31 December 2017 of Vifor Pharma Ltd. complies with Swiss law and articles 14–16 of the Ordinance.
Berne, 12 March 2018
Ernst & Young Ltd.
Martin Mattes Julian Fiessinger Licensed audit expert Licensed audit expert (Auditor in charge)
STATUTORY AUDiTOR’S REPORT

Vifor Pharma Ltd. Annual Report 201786 172
PATiENT PORTRAiT
JOE R., 56“For many years, I was a strong, working, 300-lb man. I had a family that depended on me. And rather quickly, I was so tired, I couldn’t work. I couldn’t hold food down, lost weight and was in and out of the emergency room. My kidney doctor ran some tests. I had stage-four kidney disease, and my potassium levels were very high. I had never been this sick before. This disease turned my life upside down. But it has also made my wife and me an even stronger team. We are so thankful for each other. We’ve learned much healthier eating habits together. We both feel a lot better than we did before. At the end of each day, I’m grateful for what I could do, and I want to try to do a little more tomorrow. That keeps me motivated.”

Vifor Pharma Ltd. Annual Report 2017 87 172

Vifor Pharma Ltd. Annual Report 2017
ANNUAL REPORT 2017
88 172
OUR PEOPLE
For our people, change is a critical constant at Vifor Pharma Group. It shapes us, challenges us to review and raise our own standards and teaches us how to grow organically, strategically and sustainably. We never expect life to “go back to normal” because constant, evolutionary change is the norm that every company must negotiate, every day.
2017: A YEAR OF CHANGE AND GROWTH
In 2017, we took the decision to transform our organisation to better reflect and improve our focus on our therapeutic areas. We re-aligned our structure, to increase efficiency, clarity and accountability. We also streamlined and simplified our processes and governance systems to build greater collaboration across our business.
We continued to integrate our US company, Relypsa, which we acquired in 2016 and which added more than 400 people to our inter-national community. We also helped to manage the separation from Galenica Santé, which saw thousands of former colleagues separated into an independent company.
Our community continued to grow in line with our vision of becoming a world leader in iron defi - ciency, nephrology and cardio-renal therapies. During 2017, we hired over 600 new employees, of which approximately 325 joined our affiliate operations to support our growing customer- facing presence in the field in 27 different countries.
Over the last decade, our geographical base has evolved significantly. In 2008 nearly 80% of the workforce was based in Switzerland. By the end of 2017, less than half our people were based in Switzerland. Additionally, from 2008 to 2017, our overall people numbers increased from 863 to over 2,650, with 1,000 of these individuals employed in our country based sales and marketing affiliates.
OUR VALUES
We see our values as a reflection of who we are. They connect us above and beyond our company vision and goals. They inform us about who we are and how we want to behave as human beings, especially in times of uncertainty and challenge. They allow us, both collectively as a company and individually as employees, to embrace change and guide our company’s development pro-actively and with agility against the backdrop of the ever-changing pharmaceutical industry.
Everything we do, we do with passion. To us passion means doing everything we possibly can to make sure that we create better medicines and services that truly help patients live better, healthier day-to-day lives. We give our all and take ownership of the things we do. As just one example of how our passion to help patients goes above and beyond regular office hours, over one hundred of our US employees at Relypsa participated with almost as many friends and family in 18 Kidney Walks to support the National Kidney Foundation in 2017. For us, passion means
2017 was another year of significant evolution for people within our company and the culmination of several years’ preparation that led to the transformation from Galenica Group to Vifor Pharma Group, a standalone global pharma-ceutical company listed on the Swiss stock exchange.
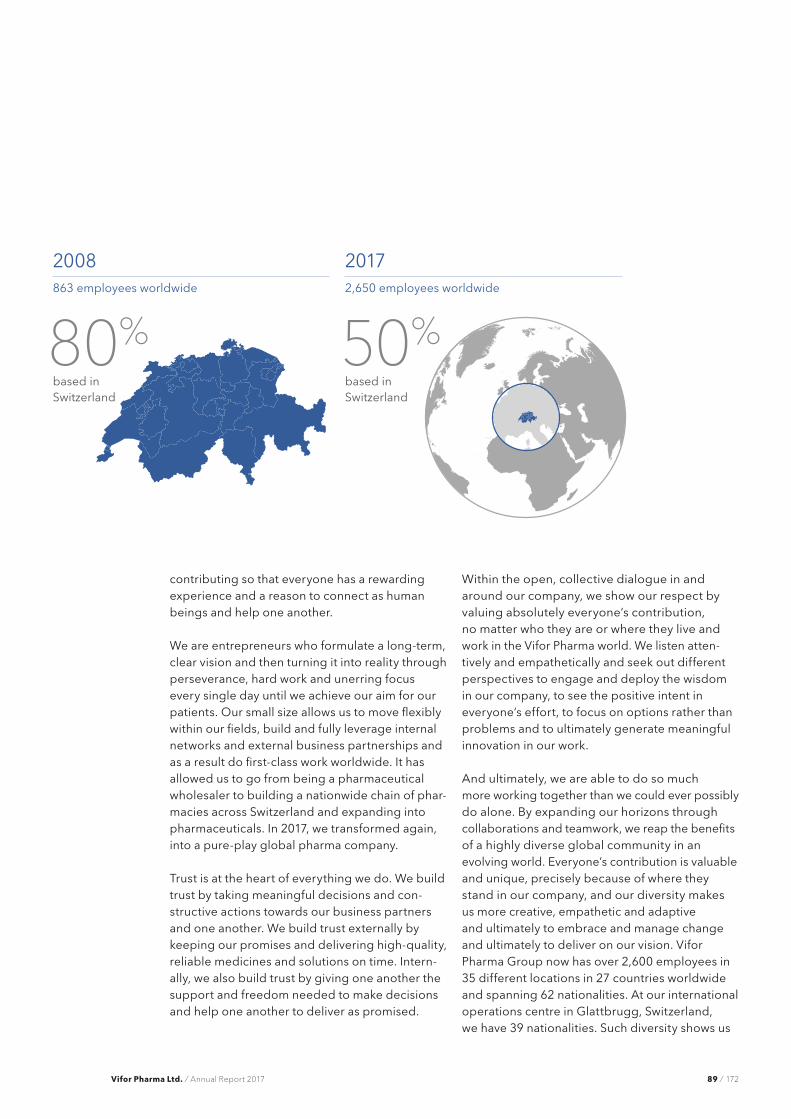
Vifor Pharma Ltd. Annual Report 2017 89 172
contributing so that everyone has a rewarding experience and a reason to connect as human beings and help one another.
We are entrepreneurs who formulate a long-term, clear vision and then turning it into reality through perseverance, hard work and unerring focus every single day until we achieve our aim for our patients. Our small size allows us to move flexibly within our fields, build and fully leverage internal networks and external business partnerships and as a result do first-class work worldwide. It has allowed us to go from being a pharmaceutical wholesaler to building a nationwide chain of phar-macies across Switzerland and expanding into pharmaceuticals. In 2017, we transformed again, into a pure-play global pharma company.
Trust is at the heart of everything we do. We build trust by taking meaningful decisions and con-structive actions towards our business partners and one another. We build trust externally by keeping our promises and delivering high-quality, reliable medicines and solutions on time. Intern-ally, we also build trust by giving one another the support and freedom needed to make decisions and help one another to deliver as promised.
Within the open, collective dialogue in and around our company, we show our respect by valuing absolutely everyone’s contribution, no matter who they are or where they live and work in the Vifor Pharma world. We listen atten-tively and empathetically and seek out different perspectives to engage and deploy the wisdom in our company, to see the positive intent in everyone’s effort, to focus on options rather than problems and to ultimately generate meaningful innovation in our work.
And ultimately, we are able to do so much more working together than we could ever possibly do alone. By expanding our horizons through collaborations and teamwork, we reap the benefits of a highly diverse global community in an evolving world. Everyone’s contribution is valuable and unique, precisely because of where they stand in our company, and our diversity makes us more creative, empathetic and adaptive and ultimately to embrace and manage change and ultimately to deliver on our vision. Vifor Pharma Group now has over 2,600 employees in 35 different locations in 27 countries worldwide and spanning 62 nationalities. At our international operations centre in Glattbrugg, Switzerland, we have 39 nationalities. Such diversity shows us
2008 2017
50%80%863 employees worldwide
based in Switzerland
based in Switzerland
2,650 employees worldwide

Vifor Pharma Ltd. Annual Report 2017
OUR PEOPLE
90 172
where we all have common ground and to leverage it to build one future together as Vifor Pharma Group.
MOBiLiTY AND DiVERSiTY
In 2017, we completed a new set of international mobility policies to facilitate our employees’ ability to go where they are needed for work and to continue to grow within the company. For our people, this new policy also provides the oppor-tunity to work across different cultures and gain experience that further enriches their abilities.
Diversity and inclusion is another focal point that we aim for at every level, in every department, at every location and in every country. Over a quarter of our workforce are over 50 years of age, bringing with them a lifetime of experience, from our own and related industries, from around the world, while more than 10% are aged 30 or younger. Some 62% are between 31 and 49 years old. Almost 60% of our employees below manage-
ment level and around half of our management is female. In 2017, we hired more women than men and promoted more women than men into management positions.
Female Male
Employees, management-level 42% 58%
Employees, non-management-level 57% 43%
ATTRACTiNG PEOPLE AND DEVELOPiNG TALENT
Critical to our success is our ability to identify and attract rapidly the right person with the right experience, skills and cultural fit. We invest deeply in the recruitment and interview process to ensure that a candidate’s aspirations, values and talents synergise with company goals, values and needs. In 2017, we spoke to approximately 35,000 candidates to hire 657 people. Vifor Pharma Group has improved its independent ranking in the top 100 best companies to work for every year and in 2017 was ranked among the top 30 (number 20 for students and number 11 for professionals; for more information, visit www.universumglobal.com).
Once they have been hired, we invest continuously in our people through ongoing development. We do this by improving professional skills and fostering a culture of commitment, performance and focus. We provide meaningful and challeng-ing roles and develop leadership skills; and we streamline our internal processes to make them as fair and transparent as possible.
Developing our internal talent is a major focus for us. Giving employees opportunities to grow and develop optimises the effectiveness of our talent management and succession processes and helps our people to have a well-designed development plan that supports their personal ambitions and meets Vifor Pharma Group’s business needs.
Our values
We participate with passion.
We act as entrepreneurs.
We build trust.
We show respect.
Together, we are stronger.

Vifor Pharma Ltd. Annual Report 2017 91 172
The Vifor Academy was created with this ambition in mind: to enable employees to be their most effective. The purpose of the Academy is to provide employees with training, content and development that will help them to do their work better. More importantly, the Academy also serves as a community platform for connecting through shared understanding and language with which to craft strategic goals and learn together. Finally, the Academy is a place for all our employees to participate actively, learn from one another, and contribute their expertise to the collective learning process and internal know-how transfer. In 2017, 140 of our managers and leaders graduated from leadership programmes as part of the Academy and a further 40 from newly created open programmes that offer skill- building and training to all employees.
Ensuring our employees meet the compliance regulations required by our industry and our company in areas as diverse as financial, medical, marketing and ethical standards among many others is a core part of our training. In 2017, compliance teams provided specialised training on standard operating procedures and related procedural documents, general compliance awareness and specific compliance expectations in a Group-wide campaign. Over 100,000 individual training events were delivered in multiple languages across Vifor Pharma.
Staying true to our values and investing in our people in this sustainable, long-term way, is, and will remain our focus.
Vifor Pharma Ltd. Annual Report 2017
ANNUAL REPORT 2017
92 172
CORPORATE RESPONSiBiLiTY
A major development within this effort in 2017 was to evolve our approach to corporate respon-sibility and to structure it around five pillars:
– We conduct business with integrity. – We focus on patients. – We value our employees. – We care about the environment. – We engage with our community.
An interdisciplinary Responsibility Steering Committee consisting of experts and senior management was formed in 2017. The Committee oversees and coordinates our corporate respon-sibility activities, achievements and the publica-tion of related information and data. The Commit-tee also defines focal areas for each pillar and follows the development of each. In addition, the Committee began building Vifor Pharma Group’s corporate responsibility network by training champions and recruiting ambassadors to support local activities and report them to the Committee.
This refined and more focused approach to corporate responsibility is endorsed by the Vifor Pharma Group Executive Committee and super-vised by the Chief Human Resources Officer and the General Secretary.
CONDUCTiNG BUSiNESS WiTH iNTEGRiTY
Vifor Pharma Group operates in a highly regulated international environment. We are committed to integrity and transparency in everything we do. We follow all laws and regulations applicable to our business activities, especially those designed to protect patients and improve the quality of medicines and healthcare services.
In 2017, we further strengthened our commitment to doing business compliantly and with integrity. We published our “Anti-Bribery and Anti-Corruption Directive” to set forth Vifor Pharma Group behavioural standards relating to compliance with anti-bribery and anti-corruption laws. This was followed by our new “Code of Conduct and Business Ethics,” which was developed to help employees understand how to meet ethical, compliance and legal obligations while position-ing Vifor Pharma Group for lasting success. Training courses on our Code of Conduct were held throughout the Group, and a whistle-blower hotline was set up to give employees a safe, round-the-clock and multi-language platform through which to voice their concerns.
As a global pharmaceutical company, we recognise and actively manage our economic, social and envi-ronmental responsibilities in order to have a positive impact on the wider world. We believe this commit-ment will also help to ensure our long-term success as a company.

Vifor Pharma Ltd. Annual Report 2017 93 172

Vifor Pharma Ltd. Annual Report 2017
CORPORATE RESPONSiBiLiTY
94 172
FOCUSiNG ON PATiENTS
At Vifor Pharma, we put patients first. We conduct research in a patient-oriented, ethical manner, and have strict measures in place to ensure patient safety. We also seek dialogue with patients and patient organisations in order to understand and address their health needs in the best way possible.
One such project that we endorsed in 2017 was the pilot of the Nefralia® Patient Support Programme for renal patients in Spain, offering support to approximately 1,300 patients. The programme helps empower patients by providing them information in order to make better deci-sions and improve quality of life and outcomes. Nefralia® is co-developed by renowned Spanish patient organisations and medical societies specialising in renal care. The multi-channel programme offers different kinds of patient support, such as training, peer-to-peer exchange, mentoring, educational events, special training for renal nurses, and an online community platform. We are looking forward to see Nefralia® evolve and expand to other countries from 2018 on.
VALUiNG OUR EMPLOYEES
Our employees are our greatest asset. Vifor Pharma Group strives to provide a safe, healthy and state-of-the art workplace. We support the continuous development of our employees, while fostering a culture of diversity and inclusion. We want our employees to be proud to work for the Vifor Pharma Group. Every employee should be able to identify with the values of the company.
2017 was a year of change for many at our company. We faced a separation within our former group, had to rebuild corporate functions, integrate Relypsa and shift the focus to solely pharmaceuticals. Vifor Pharma Group sought to leverage the opportunities associated with these changes for our employees. We engaged in a Group-wide initiative in order to better understand how we live our values as a company. Besides, we gave our employees interactive tools such as the Vifor Pharma Academy (see p. 91 of this report for more detail) to foster understanding and employee development in alignment with our strategy.
CARiNG ABOUT THE ENViRONMENT
We aim to minimise our environmental impact by conducting our business efficiently and in accordance with environmental laws, regulations and industry standards. We expect our supply partners to apply comparable environmental measures. Since 2013 all our production sites have been in line with ISO 14001, the international standard for environmental management. In 2016, our Ettingen and St. Gallen sites, both in Switzerland, were certified with the ISO 14001: 2015 update.
In 2017, our Geneva (Switzerland) and Lisbon (Portugal) production sites were given ISO 14001: 2015 certification. These new certifications will help to identify options for reducing the environ-mental impact of our operations through even more deliberative resource, waste and energy management.

Vifor Pharma Ltd. Annual Report 2017 95 172
ENGAGiNG WiTH COMMUNiTiES
Vifor Pharma Group supports selected programmes that result in improvements for our stakeholders and the communities in which we operate in. As a science-driven pharmaceutical company, our contribution to society includes the promotion of knowledge and particularly health literacy.
We seek to empower people by sharing our medical expertise and promoting health literacy. One such initiative was the annual international awareness campaign around Iron Deficiency Day, launched on 26 November 2017. At the same time, giving back to our communities can also mean providing monetary or in-kind support. In 2017, for example, the hurricane season hit the US and Caribbean hard, leaving dialysis patients seriously affected by power loss and reduced access to medical care. Our US affiliate Relypsa made donations to the American Kidney Fund (AKF) for dialysis and CKD patients impacted by the hurricanes. In addition, a team of Relypsa employees helped on-site in Texas ensure uninterrupted patient access to therapies and medicines.
OUTLOOK
Vifor Pharma Group will steadily advance its corporate responsibility activities pursuant to the five pillars. To ensure a positive impact, the Responsibility Steering Committee will monitor progress within the focal areas and guide further development. Information and key data about Vifor Pharma Group’s main activities and achieve-ments in 2017 will be presented and published in a separate responsibility report in mid-2018.

Vifor Pharma Ltd. Annual Report 201796 172
CONSOLiDATEDFiNANCiAL STATEMENTS
ANNUAL REPORT 2017

Vifor Pharma Ltd. Annual Report 2017 97 172
TABLE OF CONTENTS
98 Consolidated statement of income
99 Consolidated statement of comprehensive income
100 Consolidated statement of financial position
101 Consolidated statement of changes in equity
102 Consolidated statement of cash flows
103 Notes to the consolidated financial statements
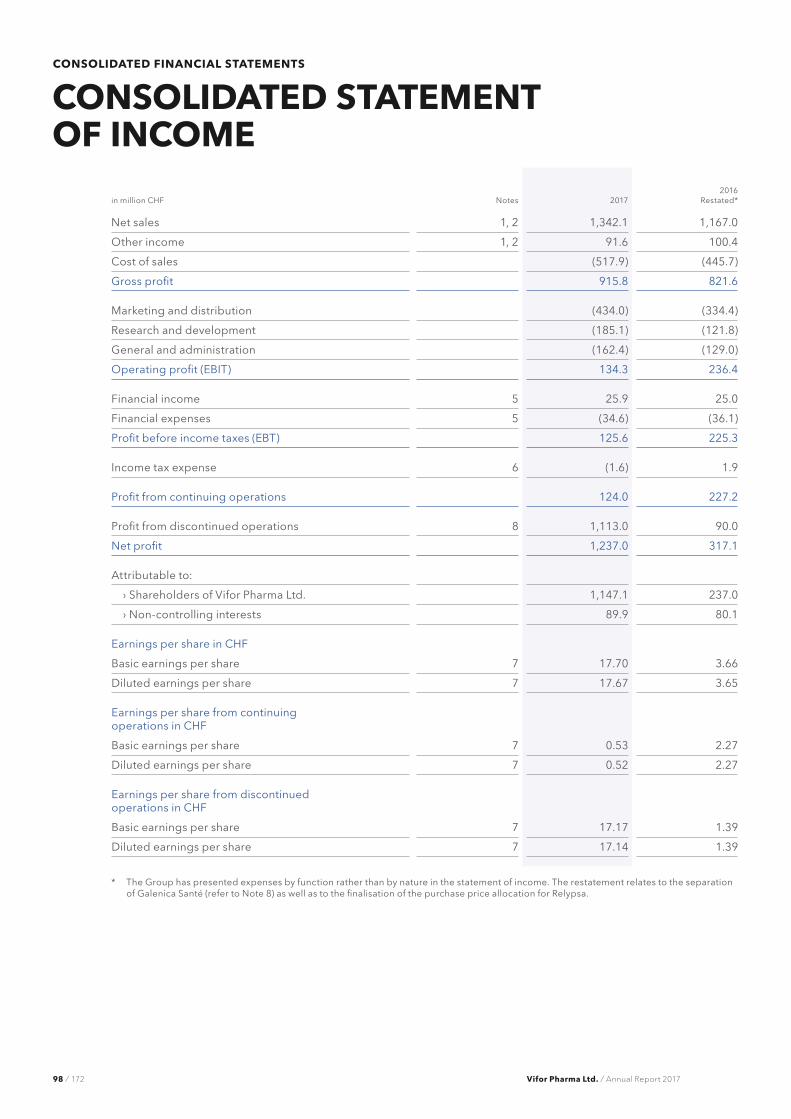
Vifor Pharma Ltd. Annual Report 2017
CONSOLIDATED FINANCIAL STATEMENTS
98 172
in million CHF Notes 20172016
Restated*
Net sales 1, 2 1,342.1 1,167.0
Other income 1, 2 91.6 100.4
Cost of sales (517.9) (445.7)
Gross profit 915.8 821.6
Marketing and distribution (434.0) (334.4)
Research and development (185.1) (121.8)
General and administration (162.4) (129.0)
Operating profit (EBIT) 134.3 236.4
Financial income 5 25.9 25.0
Financial expenses 5 (34.6) (36.1)
Profit before income taxes (EBT) 125.6 225.3
Income tax expense 6 (1.6) 1.9
Profit from continuing operations 124.0 227.2
Profit from discontinued operations 8 1,113.0 90.0
Net profit 1,237.0 317.1
Attributable to:
› Shareholders of Vifor Pharma Ltd. 1,147.1 237.0
› Non-controlling interests 89.9 80.1
Earnings per share in CHF
Basic earnings per share 7 17.70 3.66
Diluted earnings per share 7 17.67 3.65
Earnings per share from continuing operations in CHF
Basic earnings per share 7 0.53 2.27
Diluted earnings per share 7 0.52 2.27
Earnings per share from discontinued operations in CHF
Basic earnings per share 7 17.17 1.39
Diluted earnings per share 7 17.14 1.39
* The Group has presented expenses by function rather than by nature in the statement of income. The restatement relates to the separation of Galenica Santé (refer to Note 8) as well as to the finalisation of the purchase price allocation for Relypsa.
CONSOLiDATED STATEMENT OF iNCOME

Vifor Pharma Ltd. Annual Report 2017
CONSOLIDATED FINANCIAL STATEMENTS
99 172
in million CHF Notes 2017 2016
Net profit* 1,237.0 317.1
Hedging transactions
› Change in fair value 19 2.3 3.0
› Realised in profit or loss - 1.5
Financial assets available for sale
› Change in fair value 19 (1.9) 15.7
› Realised in profit or loss 19 1.5 -
Translation differences (80.1) 48.4
Income tax expense - (3.2)
Items that will be reclassified subsequently to profit or loss (78.2) 65.3
Remeasurements of the net defined benefit liability/(asset) 24 17.5 51.7
Income tax from remeasurements of the net defined benefit liability/(asset) 6 (3.8) (11.4)
Share of other comprehensive income from joint ventures 0.4 2.4
Items that will not be reclassified to profit or loss 14.1 42.7
Other comprehensive income (64.1) 108.0
Total comprehensive income* 1,172.9 425.1
Attributable to:
› Shareholders of Vifor Pharma Ltd. 1,085.7 345.0
› Non-controlling interests 87.3 80.1
* The restatement relates to the separation of Galenica Santé (refer to Note 8) as well as to the finalisation of the purchase price allocation for Relypsa.
CONSOLiDATED STATEMENT OF COMPREHENSiVE iNCOME

Vifor Pharma Ltd. Annual Report 2017
CONSOLIDATED FINANCIAL STATEMENTS
100 172
in million CHF Notes2017
31.12.
2016 31.12.
Restated*
Cash and cash equivalents 425.1 180.9
Financial assets 19, 20 1.5 2.1
Trade and other receivables 15, 19 407.4 699.3
Tax receivables 4.6 4.3
Inventories 16 232.0 432.5
Prepaid expenses and accrued income 22.9 40.0
Assets held for sale 8 - 29.6
Current assets 1,093.5 1,388.7
Property, plant and equipment 14 245.6 479.2
Intangible assets 13 2,651.1 3,387.8
Investments in associates and joint ventures - 43.5
Financial assets 19, 20 118.1 87.3
Deferred tax assets 6 17.6 40.3
Employee benefit assets 24 0.1 -
Non-current assets 3,032.4 4,038.1
Assets 4,125.9 5,426.8
Financial liabilities 19 139.6 1,829.4
Trade and other payables 19 174.2 514.1
Tax payables 50.3 58.5
Accrued expenses and deferred income 224.0 234.5
Provisions 17 0.8 3.7
Current liabilities 588.9 2,640.2
Financial liabilities 19, 20 154.8 275.1
Deferred tax liabilities 6 41.8 149.9
Employee benefit liabilities 24 7.8 65.9
Provisions 17 0.2 1.4
Non-current liabilities 204.5 492.3
Share capital 0.7 0.7
Reserves 3,072.4 2,117.0
Equity attributable to shareholders of Vifor Pharma Ltd. 3,073.1 2,117.6
Non-controlling interests 259.4 176.7
Shareholders’ equity 3,332.5 2,294.3
Liabilities and shareholders’ equity 4,125.9 5,426.8
* Certain amounts shown here reflect the revised and final fair values associated with the Relypsa acquisition made in 2016 (see Note 9), and therefore do not correspond to the consolidated statement of financial position for the year ended 31 December 2016.
CONSOLiDATED STATEMENT OF FiNANCiAL POSiTiON

Vifor Pharma Ltd. Annual Report 2017
CONSOLIDATED FINANCIAL STATEMENTS
101 172
in million CHFShare
capitalTreasury
sharesRetained earnings
Foreign currency
translation reserves
Fair value reserves Total
Non- controlling
interestsTotal
equity
31 December 2015 0.7 (21.9) 2,025.7 (124.1) (1.3) 1,879.1 97.1 1,976.2
Net profit - - 237.0 - - 237.0 80.1 317.1
Other comprehensive income - - 42.7 48.4 16.9 108.0 - 108.0
Total comprehensive income - - 279.7 48.4 16.9 345.0 80.1 425.1
Dividends - - (116.6) - - (116.6) - (116.6)
Transactions on treasury shares - (1.8) (7.6) - - (9.4) - (9.4)
Share-based payments - - 19.3 - - 19.3 - 19.3
Changes in non-controlling interests - - 0.2 - - 0.2 (0.5) (0.3)
31 December 2016* 0.7 (23.7) 2,200.7 (75.7) 15.6 2,117.6 176.7 2,294.3
Net profit - - 1,147.1 - - 1,147.1 89.9 1,237.0
Other comprehensive income - - 14.1 (80.1) 4.6 (61.4) (2.7) (64.1)
Total comprehensive income - - 1,161.1 (80.1) 4.6 1,085.7 87.3 1,172.9
Dividends - - (129.8) - - (129.8) - (129.8)
Transactions on treasury shares - 6.0 (23.6) - - (17.5) - (17.5)
Share-based payments - - 17.1 - - 17.1 - 17.1
Changes in non-controlling interests - - (0.1) - - (0.1) (4.5) (4.6)
31 December 2017 0.7 (17.7) 3,225.6 (155.7) 20.2 3,073.1 259.4 3,332.5
* Certain amounts shown here reflect the revised and final fair values associated with the Relypsa acquisition made in 2016 (see Note 9), and therefore do not correspond to the consolidated statement of changes in equity for the year ended 31 December 2016.
CONSOLiDATED STATEMENT OF CHANGES iN EQUiTY

Vifor Pharma Ltd. Annual Report 2017
CONSOLIDATED FINANCIAL STATEMENTS
102 172
in million CHF 20172016
Restated*
Net profit from continuing operations 124.0 227.2
Income tax expense 1.6 (1.9)
Depreciation and amortisation 146.0 85.8
Increase in provisions and employee benefit assets and liabilities 4.1 6.3
Net financial result 8.7 11.1
Other non-cash items 16.2 16.1
Change in trade and other receivables (68.9) (95.6)
Change in inventories (63.9) (21.1)
Change in trade and other payables (32.6) 30.3
Change in other net current assets 20.7 (110.0)
Interest received 1.1 0.3
Interest paid (23.3) (23.7)
Other financial payments 3.1 16.2
Income tax paid (44.5) (39.0)
Cash flow from discontinued operations (32.0) 156.8
Cash flow from operating activities 60.3 258.7
Investments in property, plant and equipment (49.8) (47.0)
Investments in intangible assets (38.6) (201.5)
Investments in financial assets and securities (50.7) (10.5)
Proceeds from property, plant and equipment 0.5 0.3
Proceeds from financial assets and securities 401.7 5.2
Purchase of subsidiaries and payment for purchase consideration (0.7) (1,223.9)
Net proceeds from disposal of Galenica Santé (discontinued operations) 1,797.7 -
Cash flow from discontinued operations 4.9 (64.9)
Cash flow from investing activities 2,065.0 (1,542.3)
Dividends paid (129.9) (116.5)
Purchase of treasury shares (1.5) (18.1)
Sale of treasury shares 5.4 9.7
Proceeds from financial liabilities 0.6 1,490.8
Repayment of financial liabilities (1,790.3) (325.0)
Cash flow from discontinued operations 34.1 1.5
Cash flow from financing activities (1,881.5) 1,042.4
Effects of exchange rate changes on cash and cash equivalents 0.5 (0.0)
Increase/(decrease) in cash and cash equivalents 244.2 (241.3)
Cash and cash equivalents as at 1 January 180.9 422.2
Cash and cash equivalents as at 31 December 425.1 180.9
* Amounts shown have been restated to reflect the separation of Galenica Santé. For details on the restatement relating to the separation please refer to Note 8.
Cash and cash equivalents include cash, sight deposits at financial institutions and time deposits with an original term of three months or less. Cash and cash equivalents are measured at nominal value.
CONSOLiDATED STATEMENT OF CASH FLOWS

Vifor Pharma Ltd. Annual Report 2017
NOTES TO THE CONSOLIDATED FINANCIAL STATEMENTS
103 172
Compared to the prior year, the contents and structure of the notes to these consolidated financial statements have been redesigned to help users find and understand the most relevant information. Information is only being included in the financial statements to the extent it has been considered material and relevant to the understanding of the Group’s performance.
Accounting policies and key accounting judgments and estimates applied to the preparation of the financial statements are shown where the related accounting balance or financial statement matter is discussed.
To assist in identifying key accounting judgments, we have highlighted them with the following symbol:
Key judgments and estimates
Certain information (new and revised accounting standards, presentation currency and translation of foreign currencies, etc.) has been placed at the end of the document and cross-referenced where appropriate.
NOTES TO THE CONSOLiDATED FiNANCiAL STATEMENTS
Performance and strategic assets
Group structure
Assets and liabilities
Capital and financial risks
Employee remuneration
Other disclosures
1 Net sales and other income
2 Operating segment
3 Product intangibles and licensing agreements
4 Expenses by nature and reconciliation to EBITDA
5 Financial result
6 Income tax
7 Earnings per share
8 Discontinued operations of Galenica Santé
9 Business combinations
10 Non-controlling interests
11 Changes in consolidated shareholders’ equity
12 Share capital and number of shares
13 Intangible assets
14 Property, plant and equipment and investment properties
15 Trade and other receivables
16 Inventories
17 Provisions
18 Risk management
19 Financial instruments
20 Fair value measurement
21 Personnel costs
22 Key management personnel
23 Share-based payments
24 Employee benefit plans
25 New and revised accounting standards
26 Presentation currency and translation of foreign currencies
27 Commitments and contingent liabilities
28 Related party transactions
29 Group companies
30 Subsequent events
ABOUT THESE NOTES

Vifor Pharma Ltd. Annual Report 2017
NOTES TO THE CONSOLIDATED FINANCIAL STATEMENTS
104 172
These are the consolidated financial statements of Vifor Pharma Ltd. (“Vifor Pharma”, formerly Galenica Ltd.) and its subsidiaries (together referred to as “the Group”). Vifor Pharma is a pharmaceutical company focused on the development, manufacture and distribution of pharmaceutical products.
The consolidated financial statements of Vifor Pharma have been prepared in accordance with IFRS as issued by the International Accounting Standard Board (IASB), as well as the interpretations of the IFRS Interpretations Committee and the provisions of Swiss law.
The consolidated financial statements have been presented on a historical cost basis except for items which are required to be accounted for at fair value.
KEY EVENTS AND TRANSACTiONSThe financial position and performance of the Group was particularly affected by the following events and transactions during the reporting period:
(i) Separation of Galenica Santé and name change to Vifor Pharma Ltd. On 14 March 2017, the Board of Directors of Galenica Ltd. announced its intention to separate the Galenica Santé business from Galenica Ltd. The separation was effected on 7 April 2017 by way of a demerger and initial public offering (IPO) of Galenica Santé as a new company. Galenica Ltd. was renamed to Vifor Pharma Ltd. on 11 May 2017 so that Galenica Santé could trade under the Galenica name going forward.
(ii) Repayment of bridge loanOn 11 April 2017, Vifor Pharma repaid the bridge loan of CHF 1,450 million using proceeds from the Galenica Santé IPO. The bridge loan was used to finance the acquisition of Relypsa, Inc. in 2016.
(iii) 1:10 share splitOn 11 May 2017, the shareholders approved a 1:10 share split of the company's outstanding common shares to increase the tradability of the Vifor Pharma shares. Accordingly, all share and per share amounts (including earnings per share) for all periods presented in these financial statements and notes thereto have been adjusted retroactively, where applicable, to reflect the new number of shares outstanding.
(iv) investment in Akebia and licence agreementOn 12 May 2017, Vifor Pharma made a USD 45.3 million equity investment in Akebia Therapeutics, Inc. (“Akebia”), representing an ownership interest of 8.4%. Simultaneously, Vifor Pharma and Akebia entered into a licence agreement for a consideration of USD 4.7 million to sell vadadustat exclusively to Fresenius Medical Care dialysis clinics in the United States upon approval by the US Food and Drug Administration. The Akebia shares are recognised as financial assets and measured at fair value, as reported in Note 19.
NOTES TO THE CONSOLiDATED FiNANCiAL STATEMENTS
Vifor Pharma Ltd. Annual Report 2017
NOTES TO THE CONSOLIDATED FINANCIAL STATEMENTS
105 172
(v) Veltassa® approved for marketing in the EU and SwitzerlandOn 19 July 2017, Vifor Pharma received the approval from the European Commission for patiromer to be marketed as Veltassa® for treatment of elevated serum potassium levels (hyperkalaemia) in adult patients in the 28 EU countries as well as Norway, Iceland and Liechtensein. On 3 January 2018, approval from Swissmedic was obtained for patiromer to be marketed in Switzerland as Veltassa® for the treatment of hyperkalaemia. Marketing authorisation for Veltassa® has also been granted in Australia, has been submitted and under review in Canada and is planned in other markets worldwide.
(vi) Avacopan conditional marketing authorisation application accepted for regulatory review by EMAOn 28 December 2017, Vifor Pharma received conditional marketing authorisation application for treatment of patients with anti-neutrophil cytoplasm antibody–associated (ANCA- associated) vasculitis validated for start of procedure by European Medicines Agency (EMA). This regulatory milestone event triggered a payment to ChemoCentryx which was added to the cost of the intangible asset, as detailed in Note 3.
CHANGES iN PRESENTATiONGiven the Group’s continuing operations in the pharmaceutical industry and to align with industry practice, the Group has presented expenses by function rather than by nature in the consolidated statement of income. Refer to Note 4 for the presentation of expenses by nature.
As detailed in Note 8, Galenica Santé is presented as discontinued operations and the prior- period consolidated statements of income and cash flows have been restated accordingly, in addition to numerous notes to the consolidated financial statements.

Vifor Pharma Ltd. Annual Report 2017
NOTES TO THE CONSOLIDATED FINANCIAL STATEMENTS
106 172
Performance and strategic assets
This section provides insight into the Group’s performance in the current year as well as an overview of the key strategic assets:
– 2017 net sales amounted to CHF 1,342.1 million – Product-related intangible assets amount to CHF 1,435.5 million at 31 December 2017 – 2017 EBITDA was CHF 280.4 million
– 2017 basic earnings per share (EPS) from continued operations was CHF 0.53
1 NET SALES AND OTHER iNCOMENet salesRevenue from the sale of goods is recognised upon transfer of the principal risks and rewards to the customer once it is probable that future economic benefits will flow to the Group and these benefits can be measured reliably.
Price discounts, cash discounts, volume rebates and other discounts granted to the customers are recognised in revenue as a sales discount. Accumulated past experience, historical developments and contractual provisions are used to estimate and provide for the discounts granted and anticipated returns. Revenue from sales is based on the price specified in the sales contracts, net of discounts.
The table below shows the breakdown of net sales by brand.
in million CHF 2017 2016
Ferinject® 435.6 349.5
Venofer® 110.3 125.0
Maltofer® 58.8 55.0
Mircera® 339.9 328.6
Velphoro® 80.8 54.4
Veltassa® 51.7 7.4
Other Rx brands 95.6 92.8
Broncho-Vaxom® 52.6 41.4
Uro-Vaxom® 15.1 15.1
Doxium® 22.0 20.4
Anti-infectives 27.9 26.1
Third-party production 51.8 51.3
Net sales 1,342.1 1,167.0
Other incomeRoyalties (licence fee income): are recognised in accordance with the provisions of the underlying contract when an inflow of economic resources is probable and the amount of revenue can be measured reliably.

Vifor Pharma Ltd. Annual Report 2017
NOTES TO THE CONSOLIDATED FINANCIAL STATEMENTS
107 172
As per its agreement with Roche, Vifor Pharma receives royalties which, after taking account an agreed basic sum, correspond to half of the net sales for non-transplant indications of CellCept, developed by Roche. The CellCept collaboration and promotion agreement expired on 31 December 2017. Upon expiration of this agreement, Roche shall pay to Vifor Pharma a sunset royalty for the years 2018, 2019 and 2020.
Milestone and upfront payments: certain Group companies obtain milestone and upfront payments from third parties for the sale or granting of licence rights to products and technologies. Milestone payments are recognised in profit or loss according to the achieve-ment of the targets defined in the agreements. Upfront payments for which services have yet to be provided are deferred and included in other income, spread over the duration of the development collaboration or production.
in million CHF 20172016
Restated*
Royalties, milestone and upfront payments 86.3 86.7
Other operating income 5.3 13.7
Other income 91.6 100.4
* Figures for 2016 represent the continued operations of the Group.
Royalties, milestone and upfront payments comprises royalty income from sales of CellCept of CHF 78.9 million (2016: CHF 86.4 million). Other operating income primarily consists of services provided to customers.
2 OPERATiNG SEGMENT Financial information is reported in a manner consistent with the internal reporting provided to the Executive Committee (Chief Operating Decision Maker). The financial information is presented to the Executive Committee on an aggregate basis for evaluating financial performance and allocating resources. Following the disposal of Galenica Santé, Vifor Pharma reports a single operating segment. The other segments reported in 2016 were disposed with the separation of Galenica Santé.
Geographic areasRevenues are attributed to countries (or regions) based on the country where the sale originates, as represented in the following table:
2017
in million CHF Switzerland
Europe (excluding
Switzerland) AmericasOther
countries Group
Net sales 147.8 393.5 678.5 122.3 1,342.1
Other income 80.9 5.6 0.8 4.4 91.6
Third-party operating income 228.7 399.1 679.3 126.7 1,433.7
Non-current assets1 1,243.2 116.0 1,537.3 0.1 2,896.7
1 Without financial assets, deferred tax assets and employee benefit assets.
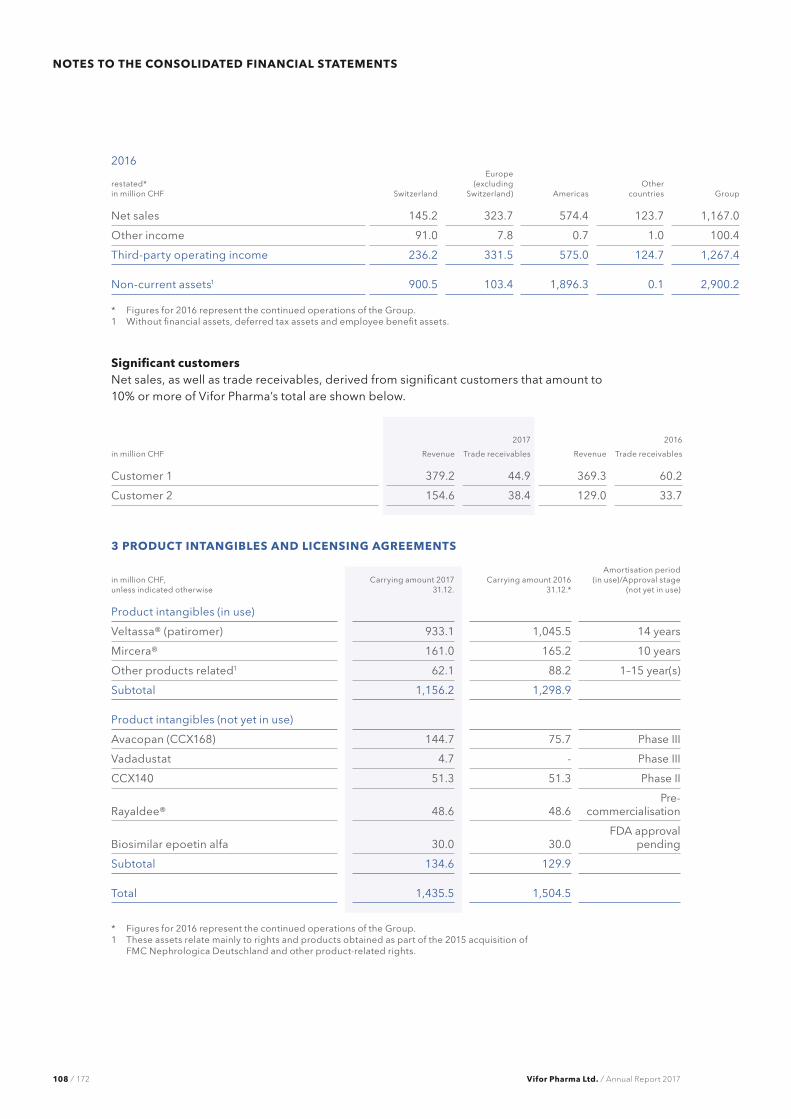
Vifor Pharma Ltd. Annual Report 2017
NOTES TO THE CONSOLIDATED FINANCIAL STATEMENTS
108 172
2016
restated* in million CHF Switzerland
Europe (excluding
Switzerland) AmericasOther
countries Group
Net sales 145.2 323.7 574.4 123.7 1,167.0
Other income 91.0 7.8 0.7 1.0 100.4
Third-party operating income 236.2 331.5 575.0 124.7 1,267.4
Non-current assets1 900.5 103.4 1,896.3 0.1 2,900.2
* Figures for 2016 represent the continued operations of the Group.1 Without financial assets, deferred tax assets and employee benefit assets.
Significant customersNet sales, as well as trade receivables, derived from significant customers that amount to 10% or more of Vifor Pharma’s total are shown below.
2017 2016
in million CHF Revenue Trade receivables Revenue Trade receivables
Customer 1 379.2 44.9 369.3 60.2
Customer 2 154.6 38.4 129.0 33.7
3 PRODUCT iNTANGiBLES AND LiCENSiNG AGREEMENTS
in million CHF, unless indicated otherwise
Carrying amount 2017 31.12.
Carrying amount 2016 31.12.*
Amortisation period (in use)/Approval stage
(not yet in use)
Product intangibles (in use)
Veltassa® (patiromer) 933.1 1,045.5 14 years
Mircera® 161.0 165.2 10 years
Other products related1 62.1 88.2 1–15 year(s)
Subtotal 1,156.2 1,298.9
Product intangibles (not yet in use)
Avacopan (CCX168) 144.7 75.7 Phase III
Vadadustat 4.7 - Phase III
CCX140 51.3 51.3 Phase II
Rayaldee® 48.6 48.6Pre-
commercialisation
Biosimilar epoetin alfa 30.0 30.0FDA approval
pending
Subtotal 134.6 129.9
Total 1,435.5 1,504.5
* Figures for 2016 represent the continued operations of the Group.1 These assets relate mainly to rights and products obtained as part of the 2015 acquisition of
FMC Nephrologica Deutschland and other product-related rights.

Vifor Pharma Ltd. Annual Report 2017
NOTES TO THE CONSOLIDATED FINANCIAL STATEMENTS
109 172
Veltassa® (patiromer)As a result of the acquisition of Relypsa, Inc. in September 2016, the Group obtained worldwide rights to the potassium binder Veltassa®. At the reporting date, the asset had a remaining useful life of 12.7 years.
Mircera®In May 2015, Vifor Pharma and Roche entered into an exclusive licence agreement for the commercialisation of Roche’s drug Mircera® in the US and Puerto Rico. Under this licence agreement Roche manufactures and supplies Mircera® to VFMCRP and in return for upfront and milestone payments, supply reimbursements, as well as tiered royalties on Mircera® sales in the US and Puerto Rico. Under the terms of the agreement, Roche received upfront and milestone cash payments of USD 100.0 million. The expected future upfront and milestone payments of USD 167.0 million were capitalised at present value at the signing date, whereof 25.0 million were due and got paid in 2017. At the reporting date, the asset had a remaining useful life of 7.4 years.
In 2017, the Group made an additional USD 20 million payment related to an extension of the Mircera commercialisation rights. This payment is amortised over 15 months until the end of 2018.
VadadustatIn May 2017, Vifor Pharma and Akebia Therapeutics, Inc. (“Akebia”) entered into an exclusive licence agreement granting Vifor Pharma the right to sell vadadustat to Fresenius Medical Care North America dialysis clinics in the US upon approval by the US FDA. Under the terms of the agreement, Vifor Pharma paid USD 50.0 million, of which USD 45.3 million relates to the acquisition of an approximate 8.4% of shares in listed Akebia which are classified as available for sale and recorded at fair value. The remaining USD 4.7 million is attributable to the licence agreement and was recorded as an intangible asset.
CCx140In December 2016, Vifor Pharma and ChemoCentryx, Inc. (“CCX”) entered into an exclusive agreement for the development and commercialisation of ChemoCentryx’s orally adminis-tered chemokine receptor CCX140 for rare renal diseases in worldwide territories outside of the US and China. CCX140 has previously completed a successful phase-II clinical trial in patients with diabetic kidney disease. Under the terms of the agreement, CCX received an upfront cash payment of USD 50.0 million in 2017 which was added to the cost of the intangible asset.
Avacopan (CCx168)In May 2016, Vifor Pharma and CCX entered into an exclusive agreement for the development and commercialisation of CCX’s orally administered Complement 5a Receptor (C5aR) inhibitor avacopan for orphan and rare renal diseases in Europe, Canada, Mexico, Central and South America and South Korea. Under the terms of the agreement, Vifor Pharma paid USD 85.0 million, of which USD 7.0 million relates to the acquisition of an approximate 7% of shares in listed CCX which are classified as available for sale and recorded at fair value. The remaining USD 78.0 million is attributable to the licence agreement and was recorded as an intangible asset.

Vifor Pharma Ltd. Annual Report 2017
NOTES TO THE CONSOLIDATED FINANCIAL STATEMENTS
110 172
In February 2017, the licence agreement was expanded for the rights to commercialise avacopan in Asia, including Japan and the Middle East. The expanded agreement effectively gives the Group rights to commercialise avacopan for orphan and rare renal diseases in all markets outside the United States and China. Under the terms of this agreement, CCX received an upfront payment which was added to the cost of the intangible asset.
In December 2017, the EMA accepted for review the registration dossier in support of a conditional marketing authorisation for avacopan treatment of patients with ANCA- associated vasculitis. This regulatory milestone event triggered a payment to CCX which was also added to the cost of the intangible asset.
Rayaldee®In May 2016, VFMCRP and OPKO Health, Inc. entered into an exclusive agreement for the development and commercialisation of OPKO’s drug Rayaldee® in Europe, Canada, Mexico, Australia, South Korea and certain other international markets for the treatment of secondary hyperparathyroidism (SHPT) in patients with chronic kidney disease (CKD) and vitamin D insufficiency. In addition, OPKO has granted VFMCRP an option to acquire rights to the US market for treatment of dialysis patients. Under the terms of the agreement, OPKO received an upfront cash payment of USD 50.0 million which has been capitalised at the signing date.
Biosimilar epoetin alfaIn December 2015, Vifor Pharma and Hospira, Inc. entered into an exclusive licence agreement for the commercialisation and distribution of Pfizer’s proposed biosimilar epoetin alfa in dialysis clinics in the US and Puerto Rico. Under the terms of the agreement, Hospira received an upfront payment of USD 30 million which was recorded as an intangible asset in 2015.
4 ExPENSES BY NATURE AND RECONCiLiATiON TO EBiTDA
in million CHF 20172016
Restated*
Cost of goods and materials 256.4 250.1
Personnel expenses 482.4 370.2
Marketing and advertising expenses 161.0 118.0
Operating and production costs 102.6 85.0
Administration 96.5 81.7
Purchase, replacement, maintenance and repair 33.1 24.4
Operating lease expenses 14.1 10.2
Other operating expenses 7.3 5.7
Depreciation and amortisation 146.0 85.8
Operating expenses 1,299.4 1,031.0
* Figures for 2016 represent the continued operations of the Group.
Other operating expenses mainly comprises other taxes, allowance of receivables and losses on disposal of fixed assets.
Amortisation expense is included in cost of sales (CHF 108.4 million; 2016: CHF 53.5 million), general and administration expenses (CHF 3.8 million; 2016: CHF 0.9 million), marketing and distribution (CHF 2.1 million; 2016: CHF 2.7 million) and research and development (nil; 2016: CHF 0.2 million).

Vifor Pharma Ltd. Annual Report 2017
NOTES TO THE CONSOLIDATED FINANCIAL STATEMENTS
111 172
Depreciation expense is included in cost of sales (CHF 18.7 million; 2016: CHF 19.7 million), general and administration expenses (CHF 8.7 million; 2016: CHF 3.1 million), marketing and distribution (CHF 1.7 million; 2016: CHF 2.4 million) and research and development (CHF 2.5; 2016: CHF 3.3 million).
Reconciliation from EBiT to EBiTDA
in million CHF 20172016
Restated*
Operating profit (EBIT) 134.3 236.4
Depreciation and amortisation 146.0 85.8
EBITDA 280.4 322.2
* Figures for 2016 represent the continued operations of the Group.
5 FiNANCiAL RESULT
in million CHF 20172016
Restated*
Interest income 1.0 20.4
Securities and other financial income 16.0 4.7
Net foreign exchange differences 8.9 -
Financial income 25.9 25.0
Interest expense (25.1) (30.5)
Net interest expense from employee benefit plans (0.1) (0.1)
Other financial costs (9.5) (4.6)
Net foreign exchange differences - (1.0)
Financial expense (34.6) (36.1)
* Figures for 2016 represent the continued operations of the Group.
The net interest expense was mainly attributable to financing costs of CHF 24.1 million (2016, restated: CHF 10.1 million) from the acquisition of Relypsa and the acquisitions in prior periods.
6 iNCOME TAxIncome tax expense comprises of current and deferred tax.
Key judgments and estimates: the calculation of the Group’s tax charge involves a degree of estimation and judgment in respect of certain items. There are transactions and calculations relating to the ordinary course of business for which the ultimate tax determination is uncertain. Additionally, the assumptions regarding future realisation, and therefore the recognition of deferred tax assets, may change due to future operating performance and other factors.

Vifor Pharma Ltd. Annual Report 2017
NOTES TO THE CONSOLIDATED FINANCIAL STATEMENTS
112 172
Current income tax is based on taxable profit for the current year and is recognised in profit or loss, unless the underlying transaction is recognised outside profit or loss.
Deferred taxes are taxes on temporary differences between the value of assets and liabilities in the tax accounts and the carrying amounts included in the Group’s consolidated financial statements. Deferred taxes are calculated on the basis of enacted or substantively enacted tax rates expected to apply when the tax asset is realised or the liability is settled. Deferred tax assets, including tax-loss carry forwards and expected tax credits, are only recognised if it is probable that future profits will be available against which the assets mentioned can be offset.
Deferred tax liabilities are recorded for all taxable temporary differences associated with investments in subsidiaries, except where Vifor Pharma is able to control the timing of the distribution and no dividend distribution is planned or likely in the foreseeable future.
Analysis of tax expense for the year
in million CHF 20172016
Restated*
Current tax on profit for the year (57.8) (43.9)
Income tax of prior periods 9.6 2.2
Deferred income tax 46.6 43.6
Income tax expense (–)/income (+) (1.6) 1.9
* Figures for 2016 represent the continued operations of the Group.
Factors affecting the tax expense for the yearThe table below presents the main elements causing Vifor Pharma’s effective tax rate to differ from the expected tax rate for the years ended 31 December 2017 and 2016. Vifor Pharma’s expected tax rate consists of the domestic Swiss tax rate applicable at its head office in St. Gallen. Vifor Pharma applies the domestic Swiss tax rate as it is more meaningful than using a weighted average tax rate.
in million CHF 20172016
Restated*
Profit before income tax 125.6 225.3
Tax expense at expected rate of 17.4% for St. Gallen (2016: 17.4%) (21.8) (39.2)
Different tax rates1 43.8 27.3
Factors affecting expense:
Effects from income that is taxable at a lower rate or tax-free 19.4 12.5
Effects of changes in tax rates 4.2 -
Effects of unrecognised losses in the current year (2.7) -
Derecognition of deferred taxes of prior year (48.0) -
Realisation of unrecognised tax losses of prior periods - 1.6
Items from prior periods and other items 3.5 (0.3)
Effective income tax expense (–)/income (+) (1.6) 1.9
* Figures for 2016 represent the continued operations of the Group.1 These amounts relate largely to Relypsa as this entity was loss-making in both years and was subject
to a high tax rate.

Vifor Pharma Ltd. Annual Report 2017
NOTES TO THE CONSOLIDATED FINANCIAL STATEMENTS
113 172
Deferred tax assets (DTA) and liabilities (DTL)
in million CHF 20172016
Restated*
Deferred taxes due to temporary differences
› Current assets (1.2) 20.4
› Property, plant and equipment 9.0 11.5
› Intangible assets 188.3 415.5
› Investments - 62.8
› Provisions 0.2 0.3
› Employee benefit plans (1.4) (14.5)
› Other temporary differences 0.9 (12.6)
› Share-based compensation (2.4) (1.6)
Deferred tax due to temporary differences 193.5 481.8
Tax-loss carry forwards (DTA) (169.3) (372.2)
Net DTL 24.2 109.6
Recognised as DTA in the statement of financial position 17.6 40.3
› of which due to recognised tax-loss carry forwards 0.5 13.8
› of which due to temporary differences 17.1 26.5
Recognised as DTL in the statement of financial position 41.8 149.9
Net DTL 24.2 109.6
* Final fair values associated with the Relypsa acquisition made in 2016 (see Note 9).

Vifor Pharma Ltd. Annual Report 2017
NOTES TO THE CONSOLIDATED FINANCIAL STATEMENTS
114 172
Movements in net DTL
in million CHF 20172016
Restated*
1 January 109.6 60.2
Recognised in income tax in profit or loss — Continued operations
› Addition/(reversal) of temporary differences (55.9) (32.9)
› Fiscal realisation of recognised tax-loss carry forwards 0.1 0.2
› Tax-loss carry forwards taken into account for the first time or no longer taken into account 1.2 (28.8)
› Effects of changes in tax rates 4.2 -
Recognised in income tax in profit or loss — Discontinued operations 5.5 14.1
Recognised in other comprehensive income 3.8 11.4
Recognised in shareholder’s equity (related to share-based payments) (0.4) -
Addition to scope of consolidation - 84.3
Disposal from scope of consolidation (42.0) -
Translation differences (2.0) 1.2
31 December 24.2 109.6
* Final fair values associated with the Relypsa acquisition made in 2016 (see Note 9).
In December 2017, the US-enacted tax reform legislation (Tax Cuts and Jobs Act), which, among other provisions, reduced the US federal corporate tax rate from 34% to 21%, effective 1 January 2018. This required a revaluation of the DTA and DTL to the newly enacted tax rates at the date of enactment. The impact from this revaluation and other pronouncements do not have a significant impact on the Group for the periods reported. This also because there is no net deferred tax position recognised at Relypsa as at 31 December 2017. The unrecognised tax-loss carry forwards at Relypsa amount to CHF 243.2 million as at 31 December 2017 (2016: nil).
Summary of tax-loss carry forwards and tax credits
20172016
Restated*
in million CHF
Tax loss carry forwards/
tax creditsTax
effect
Tax loss carry forwards/
tax creditsTax
effect
Tax-loss carry forwards and tax credits 977.5 218.6 1,110.3 374.3
Of which capitalised as DTA - - (40.5) (13.8)
Of which netted with DTL (732.5) (163.7) (1,061.8) (358.4)
Unrecognised tax loss carry forwards and tax credits 244.9 54.8 8.0 2.1
Of which expire:
› within 1 year 18.5 1.3 0.4 0.1
› in 2 to 5 years 39.9 2.8 1.3 0.3
› in more than 5 years 186.5 50.6 6.3 1.7
* Final fair values associated with the Relypsa acquisition made in 2016 (see Note 9).

Vifor Pharma Ltd. Annual Report 2017
NOTES TO THE CONSOLIDATED FINANCIAL STATEMENTS
115 172
7 EARNiNGS PER SHARE
2017 2016
Number of shares 65,000,000 65,000,000
Average number of treasury shares (189,930) (233,334)
Average number of outstanding shares 64,810,070 64,766,666
Share-based payments 108,323 100,430
Theroretical average number of outstanding shares (diluted) 64,918,393 64,867,096
in million CHF 2017 2016
Net profit — attributable to shareholders of Vifor Pharma 1,147.1 237.0
Earnings per share in CHF
Basic earnings per share 17.70 3.66
Diluted earnings per share 17.67 3.65
Earnings per share from continuing operations in CHF
Basic earnings per share 0.53 2.27
Diluted earnings per share 0.52 2.27
The calculation of basic and diluted earnings per share for all periods presented has been adjusted retrospectively to reflect the new number of shares outstanding, subsequent to the stock split effected in May 2017.

Vifor Pharma Ltd. Annual Report 2017
NOTES TO THE CONSOLIDATED FINANCIAL STATEMENTS
116 172
Group structure
This section provides further insights into the Group structure, including the changes resulting from the separation of Galenica Santé from Vifor Pharma and the final fair value of net assets acquired from Relypsa, Inc.
8 DiSCONTiNUED OPERATiONS OF GALENiCA SANTÉOn 7 April 2017, the Group disposed of 97.5% of its investment in the Galenica Santé business by way of an initial public offering with proceeds from the sale amounting to CHF 1,901.3 million.
in million CHF2017
7.4.
Consideration received 1,901.3
Fair value of investment retained 48.8
Carrying amount of net assets disposed (786.0)
Non-controlling interests disposed 4.5
Costs to sell (87.2)
Gain on sale 1,081.4
The remaining shares after the IPO amounted to 2.5% of the Galenica Santé share capital. These shares were reserved for the exchange of Vifor Pharma shares into Galenica Santé shares for eligible employees of Galenica Santé. The exchange period closed on 29 June 2017 and Vifor Pharma received 80,600 own shares as part of the exchange. These shares were recognised in equity as treasury shares. On 30 June 2017, Galenica Santé purchased all remaining Galenica Santé shares held by Vifor Pharma for a cash consideration of CHF 41.2 million.
The table below shows the financial performance of the discontinued operations.
in million CHF2017
1.1.—7.4.2016
1.1.—31.12.
Net sales 836.6 3,008.9
Other income 23.4 49.8
Expenses (822.6) (2,948.4)
Profit before income taxes 37.4 110.3
Income tax expenses (5.8) (20.3)
Profit after income taxes 31.6 90.0

Vifor Pharma Ltd. Annual Report 2017
NOTES TO THE CONSOLIDATED FINANCIAL STATEMENTS
117 172
The table below shows the financial position of the discontinued operations.
in million CHF2017
7.4.
Cash and cash equivalents 17.1
Trade accounts receivable 425.5
Inventories 279.2
Other current assets 27.2
Current assets 749.1
Property, plant and equipment 253.7
Intangible assets 668.9
Investments in associates and joint ventures 43.5
Other non-current assets 23.4
Non-current assets 989.4
Financial liabilities 402.2
Trade accounts payable 273.9
Other current liabilities 154.5
Current liabilities 830.7
Financial liabilities 7.8
Employee benefit liabilites 51.0
Other non-current liabilities 63.0
Non-current liabilities 121.8
Total net assets 786.0
› Attributable to shareholders of Vifor Pharma Ltd. 781.5
› Attributable to non-controlling interests 4.5
Assets and liabilities of disposal group classified as held for sale Due to its lack of strategic relevance, an investment property with a carrying amount of CHF 29.6 million was classified as held for sale on 31 December 2016. This building was sold to an independent third party on 30 January 2017 for a consideration of CHF 39.6 million. The resulting net gain of CHF 5.1 million is included within discontinued operations.
9 BUSiNESS COMBiNATiONSThe acquisition method of accounting is used to account for business combinations by the Group.
The Group did not complete any business combinations in 2017 as part of continued operations. All additions to the scope of consolidation disclosed relates to the discontinued operations.
Finalisation of Relypsa, inc. purchase price allocation (PPA)On 1 September 2016, Vifor Pharma Ltd. (formerly Galenica Ltd.) acquired 100% of the issued share capital and control of Relypsa, Inc.

Vifor Pharma Ltd. Annual Report 2017
NOTES TO THE CONSOLIDATED FINANCIAL STATEMENTS
118 172
As at 31 August 2017, the PPA was finalised. The final fair values of the net assets acquired are as follows:
in million CHFProvisional fair values disclosed 31.12.2016
PPA refinements in 2017
Final fair values
Cash and cash equivalents 207.2 - 207.2
Trade receivables 1.9 - 1.9
Inventories 47.3 - 47.3
Other current assets 8.2 - 8.2
Property, plant and equipment 7.1 - 7.1
Intangible assets 1,053.6 - 1,053.6
Financial assets 1.4 - 1.4
Trade and other payables (387.2) (2.8) (390.0)
Deferred tax liabilities (95.7) 11.3 (84.3)
Fair value of net assets 843.7 8.5 852.2
Goodwill 624.7 (15.1) 609.5
Purchase consideration 1,468.4 (6.6) 1,461.8
Cash acquired (207.2) - (207.2)
Net settlement of pre-existing relationship (38.2) 6.6 (31.6)
Net cash flow from business combination 1,223.0 - 1,223.0
As a result of the PPA refinements in 2017, the 2016 income statement was restated. The decrease of deferred tax liabilities of CHF 11.3 million as part of the PPA resulted in a reduction in tax expense of CHF 6.6 million for the year 2016.
10 NON-CONTROLLiNG iNTERESTSVifor Fresenius Medical Care Renal Pharma (VFMCRP) is the only Group company with significant non-controlling interests. The company is registered in St. Gallen, Switzerland. Vifor Pharma owns 55% of the share capital and voting rights, while Fresenius Medical Care holds 45% of the share capital and voting rights. The minority shareholder has extensive protection rights. In the event of disagreement, Vifor Pharma has the casting vote within a defined escalation process. Condensed financial information of VFMCRP (before elimination of intercompany transactions) is set out below:
in million CHF 2017 2016
Current assets 195.9 86.5
Non-current assets 625.7 529.9
Current liabilities 154.1 138.1
Non-current liabilities 94.7 97.1
Equity before appropriation of earnings 572.9 381.3
Net sales 406.9 389.2
Other operating income 133.9 130.3
Operating profit (EBIT) 215.9 209.9
Net profit 197.7 177.0
Other comprehensive income (5.9) -
Cash flow from operating activities 305.5 126.8
No dividends were paid to non-controlling interests in 2017 (2016: nil).

Vifor Pharma Ltd. Annual Report 2017
NOTES TO THE CONSOLIDATED FINANCIAL STATEMENTS
119 172
11 CHANGES iN CONSOLiDATED SHAREHOLDERS’ EQUiTYAt the Annual General Meeting of Shareholders held on 11 May 2017, a resolution was passed to pay a dividend of CHF 2.00 per share (post-split), representing a total amount of CHF 129.8 million. In the previous year, a resolution was passed to pay a dividend of CHF 1.80 per share, constituting a total amount of CHF 116.6 million.
In the reporting period, 95,333 treasury shares (2016: 163,360) were bought at an average price of CHF 110.95 (2016, restated: CHF 110.87) and 171,481 treasury shares (2016, restated: 165,060 treasury shares) were issued as share-based payments.
The Board of Directors will submit a proposal to the Annual General Meeting of Shareholders on 15 May 2018 to pay a dividend of CHF 2.00 per registered share, corresponding to about CHF 130 million for the financial year 2017 (2016: CHF 2.00 per registered share, CHF 129.8 million).
12 SHARE CAPiTAL AND NUMBER OF SHARESSubsequent to the 1:10 stock split effected in May 2017 and as at the reporting date, Vifor Pharma had fully paid-up share capital of CHF 650,000, divided into 65,000,000 pub-licly listed registered shares with a par value of CHF 0.01 each. All shares have the same capital rights with the exception of the treasury shares which do not earn any dividends.
According to Art. 3a) of Vifor Pharma’s Articles of Association, the Board of Directors may raise the share capital of CHF 650,000 by 10%, ie an amount of CHF 65,000 (6,500,000 shares), at any time until 28 April 2018.
Number of shares*Total shares
Vifor Pharma Ltd.Treasury
sharesOutstanding
shares
as at 31.12.2015 65,000,000 (231,360) 64,768,640
Change - 1,700 1,700
as at 31.12.2016 65,000,000 (229,660) 64,770,340
Change 76,148 76,148
as at 31.12.2017 65,000,000 (153,512) 64,846,488
* Number of shares has been adjusted retrospectively to reflect the new number of shares outstanding, subsequent to the stock split effected in May 2017.
The treasury shares are reserved for share-based payments to employees.

Vifor Pharma Ltd. Annual Report 2017
NOTES TO THE CONSOLIDATED FINANCIAL STATEMENTS
120 172
Assets and liabilities
This section highlights the primary assets used and liabilities incurred to support the Group’s operating activities. Assets and liabilities relating to the Group’s financing activities are covered in section “Capital and financial risks”. Deferred tax assets and liabilities are shown in Note 6 with the current-year tax expense.
13 iNTANGiBLE ASSETSIntangible assets include acquired trademarks, patents, licences, technologies, purchased or other assets without physical substance. These items are measured at cost less accumu-lated amortisation and/or impairment. The cost of an intangible asset acquired in a business combination corresponds to its fair value determined at acquisition.
Amortisation is charged on a straight-line basis over the estimated economic or legal useful life, whichever is shorter. The amortisation period for trademarks, patents, licences and technologies ranges from 1 to 20 year(s).
The amortisation period and the amortisation method are reviewed at least at each financial year-end.
in million CHF
Trademarks, patents, licences, technologies with
finite useful lives
Trademarks and technologies with
indefinite useful lives
Acquired software and
internally developed
software Goodwill Total
Net carrying amounts as at 31.12.2015 365.2 125.7 21.9 1,088.6 1,601.4
Addition 218.6 - 7.7 - 226.3
Reclassification 0.2 - (0.2) - -
Amortisation (54.7) - (2.6) - (57.3)
Amortisation from discontinued operations (1.2) - (6.6) - (7.8)
Addition to scope of consolidation 1,052.2 - 2.6 631.7 1,686.5
Settlement of pre-existing relationship (106.6) - - - (106.6)
Translation differences 30.9 - 0.1 14.3 45.3
Net carrying amounts as at 31.12.2016 1,504.5 125.7 22.9 1,734.6 3,387.8
Overview as at 31.12.2016
Cost 1,902.6 125.7 94.4 1,734.6 3,857.3
Accumulated amortisation and impairment (398.1) - (71.5) - (469.5)
Net carrying amounts as at 31.12.2016 1,504.5 125.7 22.9 1,734.6 3,387.8
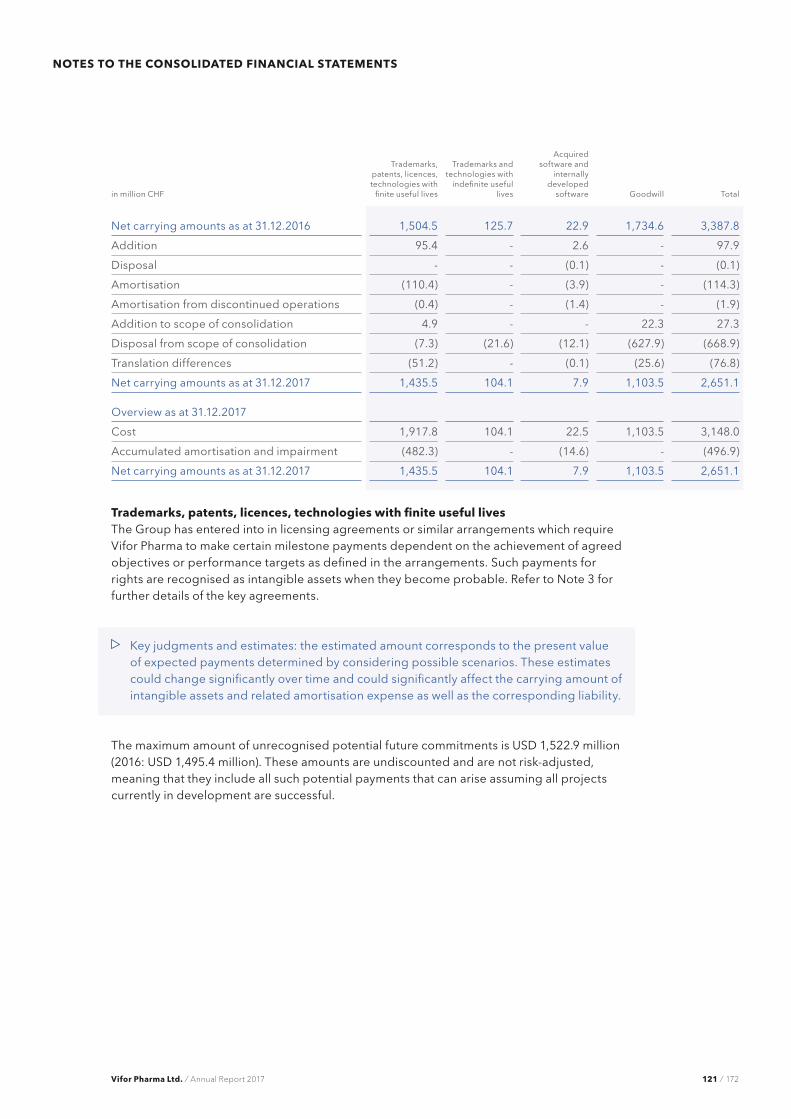
Vifor Pharma Ltd. Annual Report 2017
NOTES TO THE CONSOLIDATED FINANCIAL STATEMENTS
121 172
in million CHF
Trademarks, patents, licences, technologies with
finite useful lives
Trademarks and technologies with
indefinite useful lives
Acquired software and
internally developed
software Goodwill Total
Net carrying amounts as at 31.12.2016 1,504.5 125.7 22.9 1,734.6 3,387.8
Addition 95.4 - 2.6 - 97.9
Disposal - - (0.1) - (0.1)
Amortisation (110.4) - (3.9) - (114.3)
Amortisation from discontinued operations (0.4) - (1.4) - (1.9)
Addition to scope of consolidation 4.9 - - 22.3 27.3
Disposal from scope of consolidation (7.3) (21.6) (12.1) (627.9) (668.9)
Translation differences (51.2) - (0.1) (25.6) (76.8)
Net carrying amounts as at 31.12.2017 1,435.5 104.1 7.9 1,103.5 2,651.1
Overview as at 31.12.2017
Cost 1,917.8 104.1 22.5 1,103.5 3,148.0
Accumulated amortisation and impairment (482.3) - (14.6) - (496.9)
Net carrying amounts as at 31.12.2017 1,435.5 104.1 7.9 1,103.5 2,651.1
Trademarks, patents, licences, technologies with finite useful livesThe Group has entered into in licensing agreements or similar arrangements which require Vifor Pharma to make certain milestone payments dependent on the achievement of agreed objectives or performance targets as defined in the arrangements. Such payments for rights are recognised as intangible assets when they become probable. Refer to Note 3 for further details of the key agreements.
Key judgments and estimates: the estimated amount corresponds to the present value of expected payments determined by considering possible scenarios. These estimates could change significantly over time and could significantly affect the carrying amount of intangible assets and related amortisation expense as well as the corresponding liability.
The maximum amount of unrecognised potential future commitments is USD 1,522.9 million (2016: USD 1,495.4 million). These amounts are undiscounted and are not risk-adjusted, meaning that they include all such potential payments that can arise assuming all projects currently in development are successful.

Vifor Pharma Ltd. Annual Report 2017
NOTES TO THE CONSOLIDATED FINANCIAL STATEMENTS
122 172
Trademarks and technologies with indefinite useful livesThe caption includes unpatented technology assets with a carrying amount of CHF 104.1 million (2016: CHF 104.1 million) related to OM Pharma. These acquired manufacturing technologies are regarded as having indefinite useful lives because they have been in existence for many years, they are not patent-registered in order to prevent publication and as such there are no legal provisions that limit the useful lives of the technologies. The products generated using the technologies have a history of strong revenue and cash flow performance. These technology assets have been allocated to the cash-generating unit (CGU) OM Pharma in the Vifor Pharma business unit for impairment testing purposes.
GoodwillGoodwill is recognised at cost on the acquisition date and corresponds to the difference between the consideration transferred and the fair value of assets, liabilities and contingent liabilities identified in the purchase price allocation. Goodwill is capitalised and included in intangible assets, while negative goodwill is recognised immediately in profit or loss. After initial measurement, goodwill is recognised at cost less any accumulated impairment.
Goodwill is allocated to a single cash-generating unit (CGU), consistent with the level at which management monitors the balance.
Research and developmentExpenditure on research and development is recognised directly in profit or loss as incurred. The costs of development cannot be capitalised since the regulatory risks and the considerable periods of time before a product is launched do not allow a reliable estimate to be made of the economic benefit, which would be necessary for capitalisation.
impairment assessmentIntangible assets with finite useful lives are amortised and are reviewed for impairment whenever events or changes in circumstances indicate that the carrying amount may not be recoverable.
Intangible assets with indefinite useful lives, those not yet ready for use, and goodwill are not amortised but tested for impairment annually or more frequently if there are indications of impairment.
If the recoverable amount (higher of fair value less costs of disposal and value in use) is lower than the carrying amount, the carrying amount is reduced to the recoverable amount by recording an impairment charge.

Vifor Pharma Ltd. Annual Report 2017
NOTES TO THE CONSOLIDATED FINANCIAL STATEMENTS
123 172
Key judgments and estimates: to determine the value in use, the future cash flows are discounted on a pre-tax basis and require the use of various assumptions (such as growth rate, discount rate, budgeted margins) all subject to significant judgment. Impairments are recognised in profit or loss under depreciation and amortisation and disclosed separately. The weighted average cost of capital (WACC) is used to determine the applicable pre-tax discount rate. Goodwill is evaluated on the basis of the medium- term plans for the next three years approved by the management. Cash flows beyond the planning horizon are extrapolated using a perpetual growth rate.
The growth rates and pre-tax discount rates below were used.
Goodwill
2017 2016
in million CHFCarrying
amountGrowth
rateInterest
rateCarrying
amountGrowth
rateInterest
rate
Vifor Pharma 1,103.5 1.7% 7.9% 1,129.0 1.7% 7.9%
Discontinued operations - 605.6 1.0% 6.6%
Total 1,103.5 1,734.6
No goodwill impairment was identified based on the impairment testing for 2017 and 2016. Vifor Pharma performed a sensitivity analysis taking into account reasonably possible changes in the assumptions used to calculate the discounted cash flows, such as higher discount rates, lower EBITDA, lower gross margins or lower perpetual growth rates.
Trademark and technologies
2017 2016
in million CHFCarrying
amountGrowth
rateInterest
rateCarrying
amountGrowth
rateInterest
rate
OM Pharma 104.1 1.0% 7.1% 104.1 1.0% 7.1%
Vifor Pharma - 21.6 1.0% 6.7%
Total 104.1 125.7
No impairment of indefinite-life intangible assets was necessary based on the impairment testing for 2017 and 2016. Vifor Pharma performed a sensitivity analysis taking into account reasonable changes in the assumptions used to calculate the discounted cash flows, such as higher discount rates, lower EBITDA, lower gross margins or lower perpetual growth rates. The sensitivity analysis for 2017 and 2016 did not reveal situations where carrying amounts of cash-generating units would exceed its recoverable amount.

Vifor Pharma Ltd. Annual Report 2017
NOTES TO THE CONSOLIDATED FINANCIAL STATEMENTS
124 172
14 PROPERTY, PLANT AND EQUiPMENT AND iNVESTMENT PROPERTiES Property, plant and equipment and investment properties are measured at cost less accumulated depreciation and impairment. Depreciation is charged on a straight-line basis over the assets’ useful lives as follows:
Buildings 10–50
Manufacturing systems and warehouse equipment 5–15
Furniture, fittings, IT equipment and vehicles 3–10
Land and buildings not used for operations are included in investment properties. They are recognised and depreciated on the same basis as property, plant and equipment. They include land and buildings or parts thereof that are being held for an undetermined future use or to generate rental income. The fair value of these properties, which is disclosed separately, is based on external appraisals.
in million CHF
Real estate used for commercial
operationsAssets under construction
Other property, plant and
equipment
Total property, plant and
equipmentInvestment properties
Net carrying amounts as at 31.12.2015 252.7 16.1 181.4 450.2 34.7
Addition 14.6 16.9 46.2 77.7 0.5
Disposal - - (0.6) (0.6) (1.1)
Reclassification 15.0 (23.5) 8.7 0.2 (29.8)
Depreciation (7.4) - (21.0) (28.4) -
Depreciation from discontinued operations (12.7) - (20.0) (32.7) (1.3)
Addition to scope of consolidation 2.3 - 6.3 8.6 1.1
Translation differences - (0.1) 0.1 0.1 -
Net carrying amounts as at 31.12.2016 264.6 9.5 201.1 475.1 4.1
Overview as at 31.12.2016
Cost 441.7 9.5 549.3 1,000.4 4.4
Accumulated depreciation and impairment (177.1) - (348.2) (525.3) (0.3)
Net carrying amounts as at 31.12.2016 264.6 9.5 201.1 475.1 4.1
Net carrying amounts as at 31.12.2016 264.6 9.5 201.1 475.1 4.1
Addition 8.9 36.4 13.3 58.6 -
Disposal - - (1.0) (1.0) -
Reclassifications 12.3 (0.2) (12.1) - -
Depreciation (7.9) - (23.8) (31.7) -
Depreciation from discontinued operations (3.2) - (5.0) (8.3) -
Addition to scope of consolidation 0.6 - 0.9 1.4 -
Disposal from scope of consolidation (169.2) (5.9) (78.5) (253.7) -
Translation differences 0.1 0.7 0.1 0.9 -
Net carrying amounts as at 31.12.2017 106.2 40.4 94.9 241.5 4.1
Overview as at 31.12.2017
Cost 193.6 40.4 246.8 480.7 4.4
Accumulated depreciation and impairment (87.4) - (151.8) (239.2) (0.3)
Net carrying amounts as at 31.12.2017 106.2 40.4 94.9 241.5 4.1

Vifor Pharma Ltd. Annual Report 2017
NOTES TO THE CONSOLIDATED FINANCIAL STATEMENTS
125 172
Other property, plant and equipment consists of manufacturing systems, warehouse equipment, furniture, fittings, IT equipment and vehicles.
Investment properties include non-operating real estate:
in million CHF 20172016
Restated*
Fair value 4.9 4.9
Rental income 0.4 0.4
* Figures for 2016 represent the continued operations of the Group.
15 TRADE AND OTHER RECEiVABLESTrade receivables are carried at their original invoice value. If there is objective evidence that the amounts will not be paid in full, the carrying amount is adjusted accordingly. These bad debt allowances are based on the difference between the carrying amount and the recoverable amount as derived from individual valuations or for groups with comparable credit risk profiles. The remaining receivables are carried in the statement of financial position at nominal value less any individual allowances required.
in million CHF 2017 2016
Trade receivables 357.5 657.8
Bad debt allowances (7.4) (12.2)
Other receivables 57.4 53.7
Trade and other receivables 407.4 699.3
Maturity profile of trade receivables
2017 2016
in million CHFGross trade receivables
Bad debt allowances
Gross trade receivables
Bad debt allowances
Not past due 212.3 (0.1) 534.1 (2.8)
Past due:
› 1–30 days 87.6 - 57.8 (0.1)
› 31–60 days 17.1 - 30.8 (0.2)
› 61–90 days 17.9 (0.1) 6.3 (0.9)
› more than 90 days 22.6 (7.3) 28.8 (8.2)
Total 357.5 (7.4) 657.8 (12.2)

Vifor Pharma Ltd. Annual Report 2017
NOTES TO THE CONSOLIDATED FINANCIAL STATEMENTS
126 172
Change in bad debt allowances for trade receivables
in million CHF 2017 2016
1 January (12.2) (7.4)
Addition (5.5) (6.5)
Use 0.5 0.2
Reversal 2.7 1.5
Disposal from scope of consolidation 7.1 -
Translation differences (0.1) -
31 December (7.4) (12.2)
16 iNVENTORiESInventories are carried at the lower of cost or net realisable value. Cost includes all direct manufacturing costs and a proportion of manufacturing overheads. Borrowing costs are not included. The standard cost method is primarily used to determine cost.
in million CHFRaw
materialsSemi-finished
and finished goods Total
Gross carrying amounts as at 31.12.2015 331.3 77.1 408.4
Addition to scope of consolidation 12.8 36.4 49.2
Change in stock (14.0) 13.7 (0.3)
Translation differences 0.2 1.1 1.3
Gross carrying amounts as at 31.12.2016 330.3 128.3 458.6
Adjustments as at 31.12.2015 (16.1) (8.4) (24.6)
Addition (2.0) (5.3) (7.2)
Use 2.3 3.3 5.7
Translation differences - - -
Adjustments as at 31.12.2016 (15.8) (10.4) (26.1)
Net carrying amounts as at 31.12.2016 314.5 117.9 432.5
Gross carrying amounts as at 31.12.2016 330.3 128.3 458.6
Addition to scope of consolidation 9.0 - 9.0
Disposal from scope of consolidation (292.4) - (292.4)
Change in stock 12.0 56.7 68.7
Translation differences 0.3 (2.0) (1.7)
Gross carrying amounts as at 31.12.2017 59.2 183.0 242.2
Adjustments as at 31.12.2016 (15.8) (10.4) (26.1)
Addition (1.7) (1.6) (3.3)
Use 1.0 5.1 6.1
Disposal from scope of consolidation 13.2 - 13.2
Translation differences (0.1) 0.1 (0.1)
Adjustments as at 31.12.2017 (3.5) (6.8) (10.3)
Net carrying amounts as at 31.12.2017 55.8 176.2 232.0

Vifor Pharma Ltd. Annual Report 2017
NOTES TO THE CONSOLIDATED FINANCIAL STATEMENTS
127 172
17 PROViSiONSProvisions are recorded when Vifor Pharma has a present legal or constructive obligation towards a third party as a result of a past event, when the amount of the obligation can be reliably estimated and an outflow of economic resources is probable.
in million CHF 2017 2016
1 January 5.1 6.4
Addition 5.8 1.7
Use (1.4) (0.2)
Reversal (1.1) (2.8)
Addition in scope of consolidation 3.5 -
Disposal from scope of consolidation (10.9) -
Translation differences 0.1 -
31 December 1.0 5.1
› Current provisions 0.8 3.7
› Non-current provisions 0.2 1.4
Provisions are recognised for the estimated cost of excess on damage not covered by insurance, contractual liabilities, liabilities related to sureties, customer complaints, litigation risks and ongoing legal proceedings (recoverable amount). The cash outflow from the non-current provisions is expected within the next 3 to 4 years.

Vifor Pharma Ltd. Annual Report 2017
NOTES TO THE CONSOLIDATED FINANCIAL STATEMENTS
128 172
Capital and financial risks
The Group is exposed to various market and financial risks. This section outlines these key risks and how they are managed by the Group Finance Division in line with the hedging policy approved by the Board of Directors, as well as internal guidelines on cash and liability management.
It is Vifor Pharma’s policy not to enter into any speculative financial arrangements and to ensure matching maturities. Together, the risk management and monitoring measures described below are designed to limit negative impact on the financial statements.
18 RiSK MANAGEMENT18.1 Credit riskVifor Pharma is exposed to financial risk from its financial assets, primarily receivables. Other financial assets include cash and cash equivalents, securities, loans and certain derivative financial instruments. Credit risks arise when a customer or a third party fails to meet its contractual obligations and causes Vifor Pharma a financial loss. Credit risks are minimised and monitored by restricting business relations to known, reliable partners. All derivative financial instruments, money market investments and current account deposits are placed with financial institutions whose credit ratings are usually at least investment grade and are contained within strict predetermined limits. Given the very high standards and creditworthiness applied to the commercial and financial partners, the default risks to which Vifor Pharma are exposed are estimated to be limited.
Corporate policy ensures that credit checks are performed for customers who are supplied on credit. Financial assets are subject to active risk management procedures to identify concentrations of credit risks. They are continually monitored and credit risks are reviewed in the process of reporting to management. Necessary allowances are made for foreseeable losses in accordance with uniform Vifor Pharma guidelines on the measurement of out-standing receivables.
Financial assets subject to credit risk
in million CHF 2017 2016
Cash and cash equivalents 425.1 180.9
Derivative financial instruments 1.5 2.1
Trade and other receivables 407.4 699.3
Loans and other financial assets 1.8 16.9
Total 835.7 899.2
No past due financial assets have been renegotiated. Trade receivables past due are analysed on an ongoing basis and these receivables are accounted for using individual bad debt allowances, which are calculated on the basis of past experience.
As collateral for future deliveries, Vifor Pharma has accepted guarantees and assignment of receivables from various customers; these total CHF 3.0 million (2016, restated: CHF 2.0 million).

Vifor Pharma Ltd. Annual Report 2017
NOTES TO THE CONSOLIDATED FINANCIAL STATEMENTS
129 172
18.2 Capital and liquidity management The objective of capital management at Vifor Pharma is to ensure the continuity of opera-tions, increase enterprise value on a sustainable basis, provide an adequate return to investors, provide the financial resources to enable investments in areas that deliver future benefits for patients and customers and further returns to investors.
To ensure that Vifor Pharma has sufficient cash to meet its payment obligations, on time while maintaining the flexibility to take advantage of market opportunities and optimum investment conditions, liquidity is monitored and managed centrally.
The Treasury department is responsible for raising current and non-current loans as well as for decisions on investments. Apart from financing operations, Vifor Pharma’s credit standing enables it to borrow cash at an advantageous rate. The Treasury department monitors the cash flows using rolling liquidity planning. This takes into account the maturities of the financial instruments as well as the cash flows from operating, investing and financing activities. In this way, Vifor Pharma ensures that it has cost-effective access to capital and that its liquidity situation reflects its liquidity requirements.
A reconciliation of the net debt is shown in the table below.
in million CHF Current financial
liabilitiesNon-current
financial liabilities
Cash and cash
equivalentsNet asset (+) Net debt (–)
Net debt as at 31.12.2015 (144.9) (668.8) 422.2 (391.5)
Financing cash flows from continuing operations (1,162.0) (3.8) (447.1) (1,612.9)
Investing cash flows from contingent consideration 0.8 - - 0.8
Cash flows from discontinued operations 5.8 0.5 (4.3) 2.0
Foreign exchange adjustments 0.1 (0.0) (0.0) (0.0)
Addition to scope of consolidation (169.3) 34.5 210.1 75.4
Reclassification (359.9) 362.5 - 2.6
Net debt as at 31.12.2016 (1,829.4) (275.1) 180.9 (1,923.6)
excluding non-interest bearing financial liabilities (1,795.4) (217.9) 180.9 (1,832.4)
Net debt as at 31.12.2016 (1,829.4) (275.1) 180.9 (1,923.6)
Financing cash flows from continuing operations 1,789.7 (0.1) 249.0 2,038.6
Investing cash flows from contingent consideration 0.7 - - 0.7
Cash flows from discontinued operations (18.2) - - (18.2)
Foreign exchange adjustments (0.8) 0.1 0.5 (0.2)
Addition to scope of consolidation (0.6) (7.0) 11.9 4.3
Disposal from scope of consolidation 37.0 7.6 (17.1) 27.5
Reclassification (116.0) 116.0 - -
Other non-cash movements (2.1) 3.8 - 1.7
Net debt as at 31.12.2017 (139.6) (154.8) 425.1 130.7
excluding non-interest bearing financial liabilities (134.0) (100.0) 425.1 191.1
To secure Vifor Pharma’s liquidity position, the Group entered into a syndicated credit facility with a group of relationship banks on 28 June 2017 for CHF 300.0 million. There were no drawn amounts as at 31 December 2017.
The loan agreement contains standard covenants. As at 31 December 2017, the Group was in compliance with all covenants.

Vifor Pharma Ltd. Annual Report 2017
NOTES TO THE CONSOLIDATED FINANCIAL STATEMENTS
130 172
Maturity profile of financial liabilities and derivative financial instruments 2017
in million CHFCarrying
amount
Total undiscounted
cash flowsup to
3 months3 to 12
months1 to 5 years
Maturities more than
5 years
Trade and other liabilities 174.2 174.2 170.2 4.0 - -
Current financial liabilities (unhedged) 25.2 25.2 18.5 6.7 - -
Non-current financial liabilities 154.8 163.6 0.7 2.3 151.2 9.4
Private placement notes 89.5 117.8 117.8 - - -
Of which hedged 89.5 117.8 117.8 - - -
› Cross currency interest rate swap — cash inflow
24.8(92.4) (92.4) - - -
› Cross currency interest rate swap — cash outflow 117.8 117.8 - - -
Other derivative financial instruments (current and non-current)
(1.3)(1.3) (0.1) (1.2) - -
Foreign exchange forwards — cash inflow(1.3)
(162.7) (33.9) (128.8) - -
Foreign exchange forwards — cash outflow 161.3 33.8 127.6 - -
Total 467.0 504.9 332.5 11.8 151.2 9.4
Maturity profile of financial liabilities and derivative financial instruments 2016
in million CHFCarrying
amount
Total undiscounted
cash flowsup to
3 months3 to 12
months1 to 5 years
Maturities more than
5 years
Trade and other liabilities* 514.1 514.1 506.0 8.1 - -
Current financial liabilities 1,529.8 1,529.8 71.3 1,458.6 - -
Non-current financial liabilities (unhedged) 157.8 173.9 0.8 2.3 162.0 8.9
Bond 299.5 307.5 - 307.5 - -
Private placement notes 91.5 123.1 3.0 3.0 117.1 -
Of which hedged 91.5 123.1 3.0 3.0 117.1 -
› Cross currency interest rate swap — cash inflow
25.9(100.4) (3.0) (3.0) (94.5) -
› Cross currency interest rate swap — cash outflow 123.1 3.0 3.0 117.1 -
Other derivative financial instruments (current and non-current) (2.1) (2.1) (2.1) - - -
Foreign exchange forwards — cash inflow(2.1)
(32.6) (32.6) - - -
Foreign exchange forwards — cash outflow 30.4 30.4 - - -
Total 2,616.5 2,668.8 578.8 1,779.4 301.6 8.9
* Final fair values associated with the Relypsa acquisition made in 2016 (see Note 9).
The values presented above are contractually agreed undiscounted cash flows including interest. Wherever the contractually agreed payment amount is liable to change before maturity as a result of variable interest rates, the payment amounts based on the interest rates on the reporting date are disclosed.
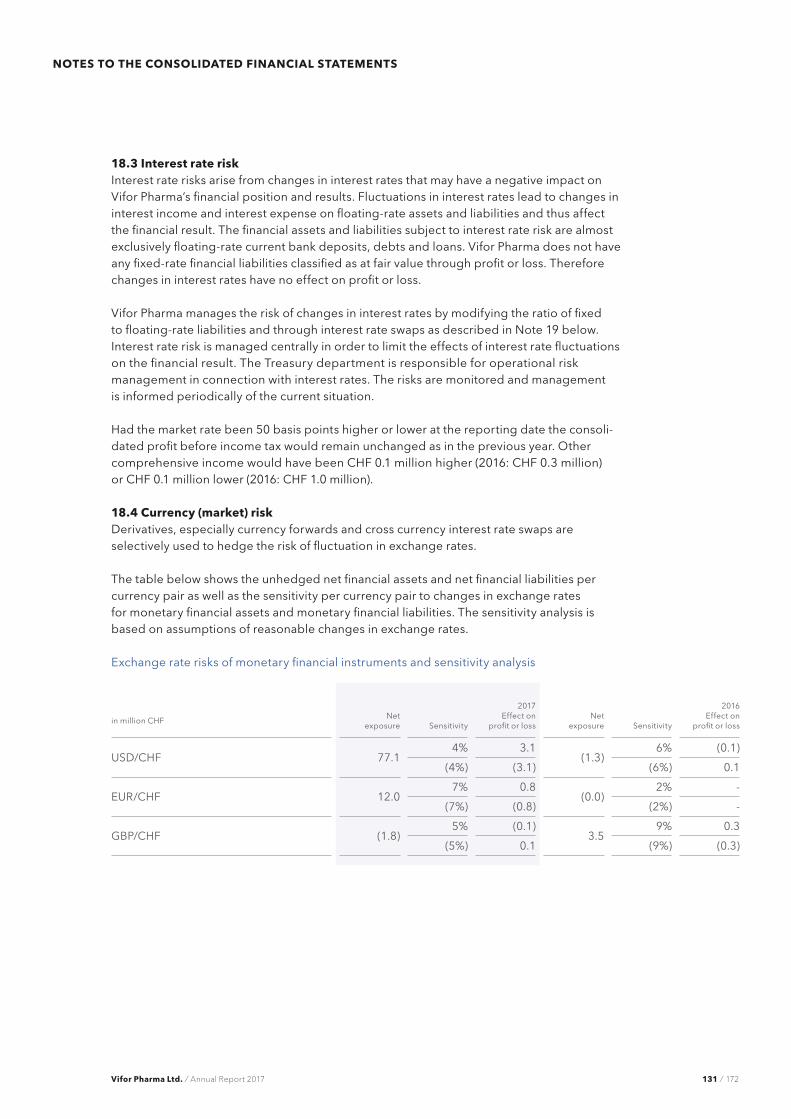
Vifor Pharma Ltd. Annual Report 2017
NOTES TO THE CONSOLIDATED FINANCIAL STATEMENTS
131 172
18.3 interest rate riskInterest rate risks arise from changes in interest rates that may have a negative impact on Vifor Pharma’s financial position and results. Fluctuations in interest rates lead to changes in interest income and interest expense on floating-rate assets and liabilities and thus affect the financial result. The financial assets and liabilities subject to interest rate risk are almost exclusively floating-rate current bank deposits, debts and loans. Vifor Pharma does not have any fixed-rate financial liabilities classified as at fair value through profit or loss. Therefore changes in interest rates have no effect on profit or loss.
Vifor Pharma manages the risk of changes in interest rates by modifying the ratio of fixed to floating-rate liabilities and through interest rate swaps as described in Note 19 below. Interest rate risk is managed centrally in order to limit the effects of interest rate fluctuations on the financial result. The Treasury department is responsible for operational risk management in connection with interest rates. The risks are monitored and management is informed periodically of the current situation.
Had the market rate been 50 basis points higher or lower at the reporting date the consoli-dated profit before income tax would remain unchanged as in the previous year. Other comprehensive income would have been CHF 0.1 million higher (2016: CHF 0.3 million) or CHF 0.1 million lower (2016: CHF 1.0 million).
18.4 Currency (market) riskDerivatives, especially currency forwards and cross currency interest rate swaps are selectively used to hedge the risk of fluctuation in exchange rates.
The table below shows the unhedged net financial assets and net financial liabilities per currency pair as well as the sensitivity per currency pair to changes in exchange rates for monetary financial assets and monetary financial liabilities. The sensitivity analysis is based on assumptions of reasonable changes in exchange rates.
Exchange rate risks of monetary financial instruments and sensitivity analysis
2017 2016
in million CHFNet
exposure SensitivityEffect on
profit or lossNet
exposure SensitivityEffect on
profit or loss
USD/CHF 77.14% 3.1
(1.3)6% (0.1)
(4%) (3.1) (6%) 0.1
EUR/CHF 12.07% 0.8
(0.0)2% -
(7%) (0.8) (2%) -
GBP/CHF (1.8)5% (0.1)
3.59% 0.3
(5%) 0.1 (9%) (0.3)

Vifor Pharma Ltd. Annual Report 2017
NOTES TO THE CONSOLIDATED FINANCIAL STATEMENTS
132 172
18.5 Other market riskOther market risks include changes in share prices and the general economic environment. Non-current assets comprise securities which are publicly traded as well as investments in venture funds which are not usually publicly traded. The values of the securities classified as available for sale which are publicly traded depend on the share price quoted on the corresponding stock exchange. The values of the venture funds classified as available for sale depend on the general market environment and not directly on a share index.
Potential changes in fair value are assessed on the stock markets or independently of the stock markets and separately for each fund based on the earnings power and prospects of the respective investment. A change in value of +/–15% of the securities and investments in venture funds would have had a positive or negative effect of CHF 17.2 million (2016: +/–15%, +/–CHF 10.2 million) on other comprehensive income.
19 FiNANCiAL iNSTRUMENTSIn May 2017, Vifor Pharma made a USD 45.3 million equity investment in Akebia Therapeutics, Inc. (“Akebia”). The Akebia shares are recognised as securities available for sale and measured at fair value through other comprehensive income. The fair value of those shares amounted to CHF 51.5 million as at 31 December 2017.
Vifor Pharma’s other financial assets primarily include cash, securities, trade receivables, certain other receivables and loans. Securities available for sale include investments in venture funds and listed shares in ChemoCentryx purchased in 2016.
Vifor Pharma’s financial liabilities primarily include advances on current bank accounts, trade payables, finance lease liabilities, loans and as well as deferred and milestone payments for the acquisition of intangible assets.
Carrying amounts of financial instruments 2017
in million CHF
Financial assets at fair value
through profit or loss
Loans and receivables
Financial assets available
for sale (securities)
Financial liabilities at fair
value through profit or loss
Financial liabilities at
amortised cost Total
Cash and cash equivalents - 425.1 - - - 425.1
Derivative financial instruments 1.5 - - - - 1.5
Trade and other receivables - 407.4 - - - 407.4
Financial assets - 1.8 116.2 - - 118.1
Current financial liabilities - - - 25.0 114.6 139.6
Trade and other payables - - - - 174.2 174.2
Non-current financial liabilities - - - 14.6 140.1 154.8
Total 1.5 834.4 116.2 39.7 428.9
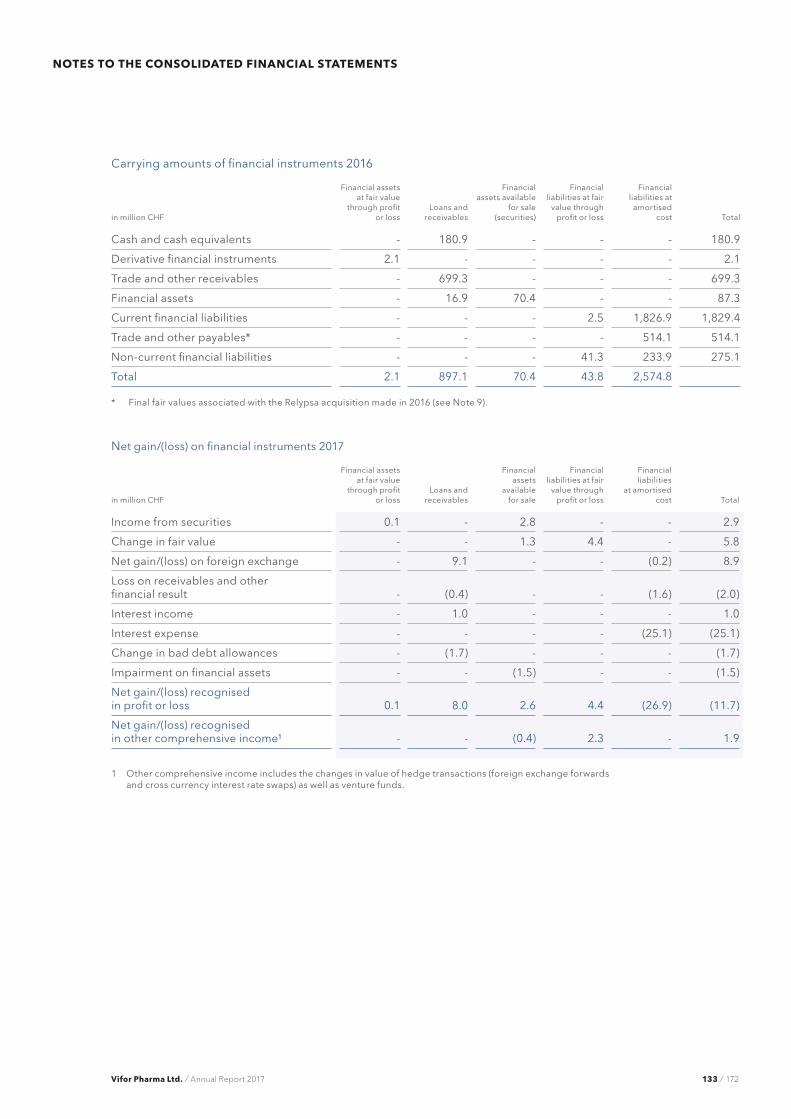
Vifor Pharma Ltd. Annual Report 2017
NOTES TO THE CONSOLIDATED FINANCIAL STATEMENTS
133 172
Carrying amounts of financial instruments 2016
in million CHF
Financial assets at fair value
through profit or loss
Loans and receivables
Financial assets available
for sale (securities)
Financial liabilities at fair
value through profit or loss
Financial liabilities at
amortised cost Total
Cash and cash equivalents - 180.9 - - - 180.9
Derivative financial instruments 2.1 - - - - 2.1
Trade and other receivables - 699.3 - - - 699.3
Financial assets - 16.9 70.4 - - 87.3
Current financial liabilities - - - 2.5 1,826.9 1,829.4
Trade and other payables* - - - - 514.1 514.1
Non-current financial liabilities - - - 41.3 233.9 275.1
Total 2.1 897.1 70.4 43.8 2,574.8
* Final fair values associated with the Relypsa acquisition made in 2016 (see Note 9).
Net gain/(loss) on financial instruments 2017
in million CHF
Financial assets at fair value
through profit or loss
Loans and receivables
Financial assets
available for sale
Financial liabilities at fair
value through profit or loss
Financial liabilities
at amortised cost Total
Income from securities 0.1 - 2.8 - - 2.9
Change in fair value - - 1.3 4.4 - 5.8
Net gain/(loss) on foreign exchange - 9.1 - - (0.2) 8.9
Loss on receivables and other financial result - (0.4) - - (1.6) (2.0)
Interest income - 1.0 - - - 1.0
Interest expense - - - - (25.1) (25.1)
Change in bad debt allowances - (1.7) - - - (1.7)
Impairment on financial assets - - (1.5) - - (1.5)
Net gain/(loss) recognised in profit or loss 0.1 8.0 2.6 4.4 (26.9) (11.7)
Net gain/(loss) recognised in other comprehensive income¹ - - (0.4) 2.3 - 1.9
1 Other comprehensive income includes the changes in value of hedge transactions (foreign exchange forwards and cross currency interest rate swaps) as well as venture funds.

Vifor Pharma Ltd. Annual Report 2017
NOTES TO THE CONSOLIDATED FINANCIAL STATEMENTS
134 172
Net gain/(loss) on financial instruments 2016*
in million CHF
Financial assets at fair value
through profit or loss
Loans and receivables
Financial assets
available for sale
Financial liabilities at fair
value through profit or loss
Financial liabilities
at amortised cost Total
Income from securities - - 2.7 - - 2.7
Change in fair value 2.0 - - 0.1 - 2.0
Net gain/(loss) on foreign exchange - (1.0) - - - (1.0)
Loss on receivables and other financial result - (0.2) - - (4.6) (4.8)
Interest income - 20.4 - - - 20.4
Interest expense - - - - (30.5) (30.5)
Change in bad debt allowances - (1.4) - - - (1.4)
Net gain/(loss) recognised in profit or loss 2.0 17.7 2.7 0.1 (35.1) (12.6)
Net gain/(loss) recognised in other comprehensive income¹ - - 15.7 3.0 - 18.7
1 Other comprehensive income includes the changes in value of hedge transactions (foreign exchange forwards and cross currency interest rate swaps) as well as venture funds
* Figures for 2016 represent the continued operations of the Group.
Measurement of financial assets and financial liabilitiesFinancial assets and financial liabilities are initially recognised at fair value including transaction costs with the exception of financial assets and liabilities classified as “at fair value through profit or loss”, for which transaction costs are recognised directly in profit or loss. All financial assets and liabilities at fair value through profit or loss are held for trading purposes or are derivative financial instruments. All purchases and sales are recognised using trade date accounting. Assets that are not carried at fair value through profit or loss are tested for impairment annually or more frequently if there are indications or impairment. Financial assets are generally derecognised when the contractual rights to the cash flows expire. Financial liabilities are derecognised when they have been settled.
For subsequent measurement Vifor Pharma distinguishes between the following types of financial assets and financial liabilities:
(i) Loans and receivablesLoans and receivables are non-derivative financial assets with fixed or determinable payments that are not quoted in an active market. They include, but are not limited to, trade receivables and loans to third parties. These types of financial instruments are recognised in the statement of financial position at amortised cost using the effective interest rate method less accumulated impairment. Uncollectible loans and receivables are only derecognised if a certificate of loss has been issued.
(ii) Financial assets and financial liabilities at fair value through profit or loss (FVPL)Financial assets and financial liabilities are classified as at fair value through profit or loss if they are acquired or incurred principally for the purpose of selling or repurchasing it in the near term.
The resulting realised and unrealised changes in fair value are recognised directly in profit or loss (financial result) for the relevant reporting period.

Vifor Pharma Ltd. Annual Report 2017
NOTES TO THE CONSOLIDATED FINANCIAL STATEMENTS
135 172
Derivative financial instruments 2017
Positive fair value
Negative fair value
Contract value
Expiry date of contract values
in million CHF up to 3 months to 12 months 1 to 5 years
Foreign exchange forwards 1.5 (0.2) 162.7 34.2 128.5 -
Currency instruments 1.5 (0.2) 162.7 34.2 128.5 -
Cross currency interest rate swaps - (24.8) 89.5 89.5 - -
Interest instruments - (24.8) 89.5 89.5 - -
Derivative financial instruments 1.5 (25.0) 252.1 123.6 128.5 -
Derivative financial instruments 2016
Positive fair value
Negative fair value
Contract value
Expiry date of contract values
in million CHF up to 3 months to 12 months 1 to 5 years
Foreign exchange forwards 2.1 - 32.6 32.6 - -
Currency instruments 2.1 - 32.6 32.6 - -
Cross currency interest rate swaps - (25.9) 91.5 - - 91.5
Interest instruments - (25.9) 91.5 - - 91.5
Derivative financial instruments 2.1 (25.9) 124.1 32.6 - 91.5
Derivative financial instruments are initially and subsequently measured at fair value. Depending on their maturity, derivative financial instruments with a positive fair value are either classified within current assets or non-current assets as financial assets. Derivative financial instruments with a negative fair value are presented as current or non-current financial liabilities according to their maturity.
Cash flow hedgingCash flow hedges are hedges against changes in cash flows due to fluctuations in foreign exchange or interest rates of a financial instrument or a forecast transaction. Vifor Pharma uses hedge accounting for selected transactions if the hedge relationship is expected to be highly effective throughout the entire term and the formal documentation requirements are met at inception, ie, documentation contains the strategy, objectives, identification of the hedging instrument, the hedged item or transaction, the nature of the risk being hedged and details of how the hedging instrument’s effectiveness will be assessed.
The effective portion of changes in the fair value of cash flow hedging instruments is recognised in other comprehensive income. If the underlying hedged transaction is no longer expected, the cumulative unrealised gain or loss in other comprehensive income is reclassified to profit or loss.
Foreign currency hedgingVifor Pharma selectively hedges liabilities and expected cash flows in USD and EUR against foreign currency risks by means of foreign exchange forwards. The contract volume amounted to CHF 162.7 million (2016: CHF 32.6 million) as at the reporting date with a (net) positive fair value of CHF 1.3 million (2016: CHF 2.1 million).

Vifor Pharma Ltd. Annual Report 2017
NOTES TO THE CONSOLIDATED FINANCIAL STATEMENTS
136 172
Foreign currency and interest rate risk hedging (cross currency interest rate swaps)Vifor Pharma entered into cross currency interest rate swaps to hedge foreign currency risks and interest rate risks in connection with the private placement notes issued in USD and GBP. The contract volume amounted to CHF 89.5 million (2016: CHF 91.5 million) as at the reporting date with a negative fair value of CHF 24.8 million (2016: negative fair value of CHF 25.9 million). These cross currency interest rate swaps are deemed to be highly effective. Consequently, the changes in fair value of these derivatives are recognised directly in other comprehensive income (hedge accounting). In 2017, CHF 1.3 million (2016: CHF 1.9 million) was recognised directly in other comprehensive income.
(iii) Financial assets available for saleAvailable-for-sale financial assets (AFS) are any non-derivative financial assets designated on initial recognition as AFS or any other instruments that are not classified as loans and receivables, held-to-maturity investments or financial assets at fair value through profit or loss. Fair value changes on AFS assets are recognised in other comprehensive income (adjusted for taxes)/equity except impairment losses and for foreign exchange gains and losses on interest-bearing AFS debt instruments. Interest calculated using the effective interest method on AFS debt instruments as well as dividends on AFS equity instruments are recognised in profit or loss. The cumulative gain or loss that was recognised in equity is recognised in profit or loss when an available-for-sale financial asset is derecognised.
An impairment loss for an equity instrument is recognised when there is a significant or prolonged decline in fair value, ie longer than six months or material, ie more than 20% below the acquisition value.
(iv) Financial liabilities at amortised costFinancial liabilities mainly comprise trade and other payables as well as financial liabilities and are measured at amortised cost using the effective interest rate method.
Financial liabilities
in million CHF 2017 2016
Current Non-current Current Non-current
Bank debts 0.4 100.0 1,453.0 100.0
Loans 0.1 - 0.3 0.5
Private placement (notes) 89.5 - - 91.5
Bond - - 299.5 -
Finance leases - - - 0.1
Liability to pension funds 17.4 - 38.0 -
Current portion of non-current financial liabilities 7.3 - 38.5 -
Derivative financial instruments 25.0 - - 25.9
Other financial liabilities - 54.7 - 57.2
Total 139.6 154.8 1,829.3 275.2

Vifor Pharma Ltd. Annual Report 2017
NOTES TO THE CONSOLIDATED FINANCIAL STATEMENTS
137 172
Bank debtsOn 11 April 2017, Vifor Pharma repaid the bridge loan of CHF 1,450 million using proceeds from the Galenica Santé IPO. The bridge loan was used to finance the acquisition of Relypsa, Inc.
The non-current bank debt amounting to CHF 100 million are due for repayment on 1 July 2019.
Private placement (notes)On 12 March 2008 Vifor Pharma borrowed USD 105.0 million and GBP 20.0 million from a number of American and British insurance companies by means of a private placement of unsecured notes. The remaining amount totalling USD 65.0 million and GBP 20.0 million are due for repayment on 12 March 2018. The interest rate and currency risk of the private placement was hedged.
Financial covenants (debt coverage ratio and interest coverage ratio) were agreed in connection with the private placement. Failure to comply with these could trigger early repayment of the notes. Vifor Pharma complied with the covenants on the reporting date and expects to continue to do so.
BondOn 27 October 2017, Vifor Pharma redeemed a matured fixed-rate bond for a nominal amount of CHF 300.0 million with an annual coupon of 2.5%, initially issued in 2010. The bond was traded on the SIX Swiss Exchange under securities no. 11848005 (ISIN CH0118480059).
Other financial liabilitiesNon-current contingent and deferred consideration liabilities from business combinations as well as deferred and milestone payments for the acquisition of intangible assets have been recognised as other financial liabilities. Refer to Note 20 for further details.
20 FAiR VALUE MEASUREMENTWith the exception of non-current financial liabilities and the private placement which has been reclassified to current financial liabilities, the carrying amounts of financial assets and liabilities approximate their fair values.
2017 2016
in million CHF Carrying amount Fair value Carrying amount Fair value
Non-current financial liabilities1 154.8 161.0 183.7 190.0
Private placement (notes) 89.5 87.6 91.5 97.7
1 excluding private placement (notes) in 2016
Fair value hierarchyVifor Pharma measures financial instruments at fair value using the following hierarchies for determining the fair value:
Level 1: quoted prices (unadjusted) in active markets for identical assets or liabilities.Level 2: inputs other than quoted prices included within Level 1 that are observable for the asset or liability, either directly (as prices) or indirectly (derived from prices).Level 3: unobservable inputs for the asset or liability.

Vifor Pharma Ltd. Annual Report 2017
NOTES TO THE CONSOLIDATED FINANCIAL STATEMENTS
138 172
Vifor Pharma is invested in venture funds. These funds are structured as closed-end funds, for which Vifor Pharma has undertaken a defined capital commitment. The funds call this capital commitment over the term. Vifor Pharma and the other investors are usually bound to their fund units throughout the entire term; consequently there is no active market for units in these funds, although a transaction cannot be ruled out in principle. The funds themselves are likewise usually invested in venture funds with the same attributes (fund of funds).
Vifor Pharma determines the fair values for the venture funds using the net asset values. According to the venture funds, the net asset values for the funds are based on the net asset values reported to them by the respective investments; net asset values are not usually determined based on publicly available input data, or only to an insignificant extent.
There were no transfers between level 1 and level 2 in the financial year, or any transfers into or out of level 3.
Financial assets measured at fair value
in million CHF 2017 2016
Derivative financial instruments Level 2 1.5 2.1
Securities available for sale 114.3 68.0
› thereof publicly traded securities Level 1 70.8 25.2
› thereof investments in venture funds Level 3 43.5 42.8
Fair value of venture funds (net asset value)
in million CHF 2017 2016
1 January 42.8 41.2
Investments 5.5 3.6
Disposals (0.5) (0.2)
Gain/(loss) recognised in profit or loss (1.5) -
Gain/(loss) recognised in other comprehensive income (0.6) (2.7)
Translation differences (2.2) 0.9
31 December 43.5 42.8
Financial liabilities measured at fair value
in million CHF 2017 2016
Derivative financial instruments Level 2 25.0 25.9
Contingent consideration liabilities from business combinations Level 3 14.6 17.9
The fair values of the other non-current financial liabilities are calculated based on the expected cash flows, the current market interest rates and the counterparties’ credit risk (level 3 of the fair value hierarchy).

Vifor Pharma Ltd. Annual Report 2017
NOTES TO THE CONSOLIDATED FINANCIAL STATEMENTS
139 172
For contingent consideration that qualifies as a financial instrument, it is remeasured to fair value and any difference is recognised in other operating income or other operating costs. The fair value of these financial instruments is measured based on the expected cash flows in due consideration of the probability of occurrence and the current market interest rates.
Fair value of contingent consideration liabilities
in million CHF 2017 2016
1 January 17.9 20.9
Arising from business combinations - 1.7
Disposal from scope of consolidation (1.7) -
Total unrealised gains and losses included in the income statement
› Unused amounts reversed - (2.9)
› Additional amounts created 0.9 -
Payments (cash out) (2.5) (1.8)
31 December 14.6 17.9
› thereof discontinued operations - 3.5
As part of the 2015 acquisition of FMC Nephrologica Deutschland, the Group continues to record a contingent consideration. The liability falls due in the years 2018 to 2024 if certain earning targets are achieved.

Vifor Pharma Ltd. Annual Report 2017
NOTES TO THE CONSOLIDATED FINANCIAL STATEMENTS
140 172
Employee remuneration
This section provides insight into Vifor Pharma’s employee remuneration arrangements and should be read in conjunction with the remuneration chapter as included in Vifor Pharma’s 2017 annual report.
21 PERSONNEL COSTS
in million CHF 20172016
restated*
Salaries and wages 348.6 266.1
Social security costs and pension expenses 68.0 52.6
Other personnel costs 65.9 51.5
Personnel costs 482.4 370.2
* Figures for 2016 represent the continued operations of the Group.
Personnel costs include expenses for defined benefit plans of CHF 16.0 million (2016, restated: CHF 19.8 million) and for share-based payments of CHF 16.1 million (2016, restated: CHF 16.3 million) (refer to Note 23 and 24).
22 KEY MANAGEMENT PERSONNEL
Remuneration of the Board of Directors and the Executive Committee
in million CHF 2017 2016
Remuneration 6.0 4.6
Social security costs and pension expenses 1.6 1.6
Share-based payments 6.8 6.5
Total 14.4 12.7
23 SHARE-BASED PAYMENTSVifor Pharma has a number of equity-settled share-based payment plans.
The share-based payments are measured at fair value on the grant date. When measuring the grant date fair value only those conditions which are linked to the price of Vifor Pharma’s shares (market conditions) are taken into account, along with any non-vesting conditions.
The expense is recognised over the vesting period as part of personnel expense and an increase in shareholders’ equity is recorded for the best estimate of the number of shares Vifor Pharma expects to vest. Refer to the Statement of Changes in Equity for details of movements in equity during the year. Adjustments to these expectations are immediately recognised in profit or loss.
If the arrangements are modified during the life of an equity-settled share-based payment plan, any incremental fair value is recognised over the remaining vesting period.

Vifor Pharma Ltd. Annual Report 2017
NOTES TO THE CONSOLIDATED FINANCIAL STATEMENTS
141 172
23.1 Share plan for the Executive ChairmanFor his service in the period from 1 January 2017 to 31 December 2020, Etienne Jornod will be remunerated exclusively in Vifor Pharma shares, all blocked until 2020. The remuneration is a fixed amount (2017: CHF 3.67 million) as approved at the Annual Shareholder Meeting, entirely paid out in shares. The number of shares to be granted is determined based on the average share price in January and February of the preceding year (2016: 140.47) resulting in a payout of 26,127 shares for 2017. The fair value of the shares at the AGM date is only relevant for the computation of the related share-based payment expense.
23.2 Remuneration for members of the Board of DirectorsThe members of the Board of Directors receive annual remuneration. The remuneration is a fixed amount which the members can choose to receive in full (100%) or in part (50%) as registered shares of Vifor Pharma. The amount settled in shares is paid out with a discount of 25%.
The fair value of the shares granted is equivalent to the amount to be paid out in shares plus the discount of 25%.
23.3 Share plan for members of senior managementAccording to the participation plan, members of senior management receive their perfor-mance-related bonus partly in cash and partly in registered shares of Vifor Pharma. The proportion of cash to shares is set out in the regulations and is based on the salary grade of the recipient. In addition, all members of senior management are obliged to hold a number of shares of the Group. The amount to be settled in shares is paid out in spring in the form of registered shares of the Group with a discount of 25%.
The fair value of the shares granted is equivalent to the amount to be paid out in shares plus the discount of 25%.
23.4 Long-term incentive plan (LTi)Members of the Corporate Executive Committee and certain members of senior manage-ment participate in an LTI plan for the allocation of performance units. The number of these performance units is based on the extent to which defined long-term performance targets are attained. An LTI plan always runs for a vesting period of 3 years. At the beginning of each financial year a new LTI plan with a new vesting period of 3 years is issued. At the start of the vesting period a defined number of performance units are individually allocated. Beneficiaries leaving the Group before the end of the vesting period are entitled to a cash payment in lieu of shares calculated based on the months of service completed during the three-year vesting period.
The number of performance units allocated is dependent on the defined percentage of the annual salary incorporated into the LTI plan as well as the effective share price at the grant date. At the end of the vesting period, performance units are settled by delivering regis-tered shares of Vifor Pharma. 101,002 performance units (2016: 23,580 performance units) were granted to beneficiaries at an average fair value of CHF 110.00 (2016: CHF 147.30) at the beginning of the reporting period for the 2017–2019 LTI plan.
23.5 Employee share planEmployees of Vifor Pharma are entitled to buy a fixed number of registered shares of Vifor Pharma at a preferential price. All employees who, at the time of the purchase offer, are not under notice and have an employment contract of unlimited duration are entitled to acquire shares.

Vifor Pharma Ltd. Annual Report 2017
NOTES TO THE CONSOLIDATED FINANCIAL STATEMENTS
142 172
The purchase price for the registered shares is calculated at the time of the purchase offer based on the average price for the previous month less a 30% discount.
In the reporting period, employees purchased 27,741 registered shares of Vifor Pharma (2016: 48,940 registered shares) at a preferential price of CHF 73.71 (2016: CHF 91.32), representing a price discount of CHF 31.59 (2016: CHF 39.14) per registered share.
Share-based payment expense
in million CHF 20172016
restated*
Share plan for the Executive Chairman 3.2 3.7
Remuneration for members of the Board of Directors 1.0 1.6
Share plan for members of senior management 4.4 6.4
Long-term incentive plan (LTI) 6.6 4.0
Employee share plan 0.9 0.7
Total 16.1 16.3
* Figures for 2016 represent the continued operations of the Group.
24 EMPLOYEE BENEFiT PLANS24.1 Defined benefit plansThe employees of Vifor Pharma participate in the employee benefits plans provided by the Group. Vifor Pharma has both defined contribution and fully funded defined benefit plans based on local conditions and legal requirements. Plans are legally separate and are managed separately from Vifor Pharma’s assets by an independent pension fund.
The majority of employees work in Switzerland and are insured at least in accordance with the legal provisions by pension funds that are financed by Vifor Pharma, Galenica Santé and the employees. The pension plans cover the risks of the economic consequences of old age, disability and death in accordance with the Swiss Federal Occupational Retirement, Survivors and Disability Pension Plans Act (BVG/LPP). The benefits target is 70% of the most recent base salary as at statutory retirement age for employees with a full insurance history of 35 years. The pension plans are structured in the legal form of a foundation. All actuarial risks are borne by the foundation and regularly assessed by the Board of Trustees (consist-ing of employee and employer representatives) based on an annual actuarial appraisal prepared in accordance with BVG/LPP. The calculations made in these appraisals do not apply the projected unit credit method required by IFRS. If the calculations made in accordance with the provisions of BGV/LPP reveal a funded status of less than 100%, suitable restructuring measures would be introduced.
The most recent actuarial valuation was prepared as at 31 December 2017. The underlying assumptions reflect the economic circumstances. The pension funds’ assets are invested in accordance with local investment guidelines. Vifor Pharma pays its contributions to the pension funds in accordance with the regulations defined by the funds. The final funded status pursuant to BVG/LPP is not available until the first quarter of the subsequent year. The projected funded status as at 31 December 2017 (unaudited) is 119.4% (2016: 118.6%, audited).

Vifor Pharma Ltd. Annual Report 2017
NOTES TO THE CONSOLIDATED FINANCIAL STATEMENTS
143 172
Key judgments and estimates: Vifor Pharma’s defined benefit obligation (DBO) is assessed annually by an independent pension actuary using the projected unit credit method. This method considers employees’ service in the periods prior to the reporting date and their future expected salary development. In addition, actuaries make use of statistical data such as employee turnover and mortality to calculate the DBO. These valuations involve making assumptions about the discount rate, future salary and pension developments, mortality and future employee turnover. Vifor Pharma considers the discount rate and development of salaries to be key assumptions.
Any surplus (deficit) in funded defined benefit plans – when the fair value of plan assets exceeds (is less than) the present value of the DBO – is recorded as a net defined benefit asset (liability). Vifor Pharma only recognises a net defined benefit asset if it has the ability to use the surplus to generate future economic benefits that will be available to the entity in the form of a reduction in future contributions. If Vifor Pharma does not have the ability to use the surplus or it will not generate any future economic benefit, Vifor Pharma discloses the effect of this asset ceiling in the notes.
The components of defined benefit cost are service cost, net interest on the net defined benefit asset (liability) and remeasurement of the net defined benefit asset (liability). Service cost is a component of personnel costs and comprises current service cost, past service cost (including gains and losses from plan amendments) and gains and losses from plan settlements. Net interest is determined by multiplying the net defined benefit asset (or liability) by the discount rate at the beginning of the reporting period. Net interest is included in the financial result.
Actuarial gains (losses) result from changes in actuarial assumptions and differences between actuarial assumptions and actual outcomes. Actuarial gains (losses) resulting from remeasuring the defined benefit plans are recognised immediately in comprehensive income as remeasurements of the net defined benefit asset (liability). This includes any differences in the return on plan assets (excluding interest, based on the discount rate) and, if applicable, the impact of a change in the asset ceiling. Remeasurement of the net defined benefit asset (liability) are never reclassified through profit or loss.
24.2 Long-service awardsVifor Pharma rewards employees for long service with jubilee benefits. These long-term benefits to employees are also measured using the projected unit credit method and included in employee benefit liabilities. These obligations are unfunded. Changes in obligations are recorded as personnel costs and interest expense as part of the financial expense, in line with the defined benefit plans.
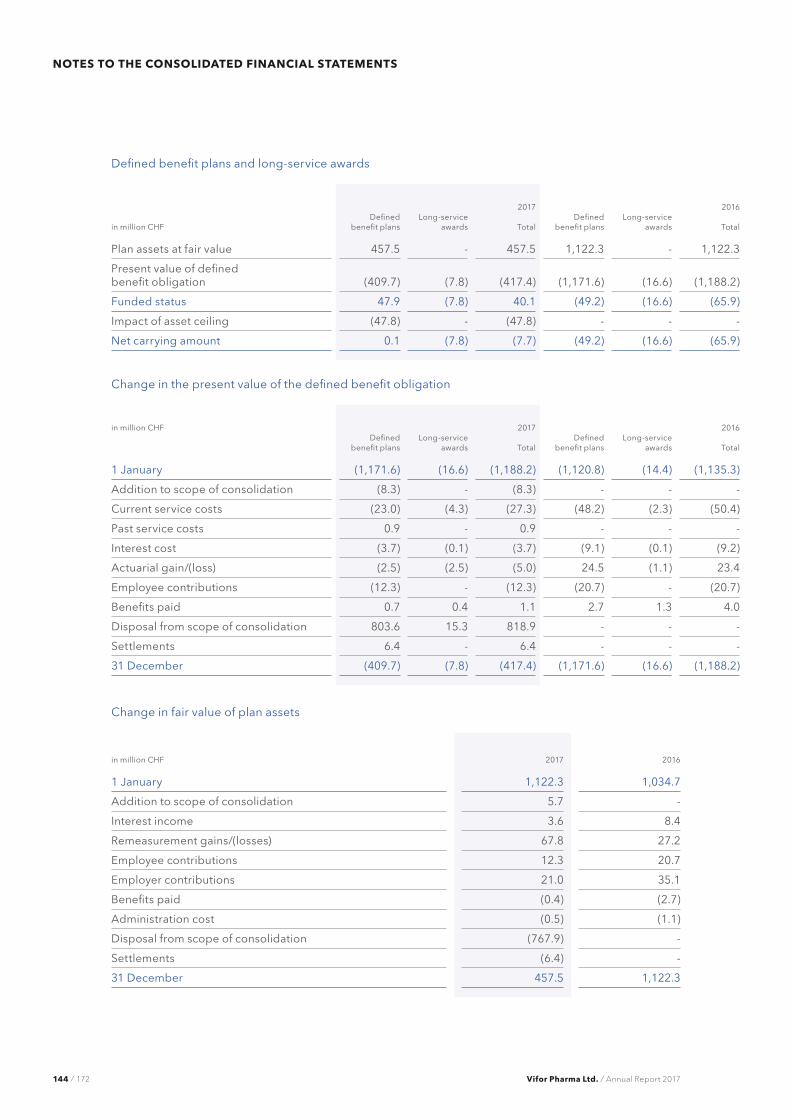
Vifor Pharma Ltd. Annual Report 2017
NOTES TO THE CONSOLIDATED FINANCIAL STATEMENTS
144 172
Defined benefit plans and long-service awards
2017 2016
in million CHFDefined
benefit plansLong-service
awards TotalDefined
benefit plansLong-service
awards Total
Plan assets at fair value 457.5 - 457.5 1,122.3 - 1,122.3
Present value of defined benefit obligation (409.7) (7.8) (417.4) (1,171.6) (16.6) (1,188.2)
Funded status 47.9 (7.8) 40.1 (49.2) (16.6) (65.9)
Impact of asset ceiling (47.8) - (47.8) - - -
Net carrying amount 0.1 (7.8) (7.7) (49.2) (16.6) (65.9)
Change in the present value of the defined benefit obligation
in million CHF 2017 2016Defined
benefit plansLong-service
awards TotalDefined
benefit plansLong-service
awards Total
1 January (1,171.6) (16.6) (1,188.2) (1,120.8) (14.4) (1,135.3)
Addition to scope of consolidation (8.3) - (8.3) - - -
Current service costs (23.0) (4.3) (27.3) (48.2) (2.3) (50.4)
Past service costs 0.9 - 0.9 - - -
Interest cost (3.7) (0.1) (3.7) (9.1) (0.1) (9.2)
Actuarial gain/(loss) (2.5) (2.5) (5.0) 24.5 (1.1) 23.4
Employee contributions (12.3) - (12.3) (20.7) - (20.7)
Benefits paid 0.7 0.4 1.1 2.7 1.3 4.0
Disposal from scope of consolidation 803.6 15.3 818.9 - - -
Settlements 6.4 - 6.4 - - -
31 December (409.7) (7.8) (417.4) (1,171.6) (16.6) (1,188.2)
Change in fair value of plan assets
in million CHF 2017 2016
1 January 1,122.3 1,034.7
Addition to scope of consolidation 5.7 -
Interest income 3.6 8.4
Remeasurement gains/(losses) 67.8 27.2
Employee contributions 12.3 20.7
Employer contributions 21.0 35.1
Benefits paid (0.4) (2.7)
Administration cost (0.5) (1.1)
Disposal from scope of consolidation (767.9) -
Settlements (6.4) -
31 December 457.5 1,122.3

Vifor Pharma Ltd. Annual Report 2017
NOTES TO THE CONSOLIDATED FINANCIAL STATEMENTS
145 172
Change in asset ceiling
in million CHF 2017 2016
1 January - -
Changes asset ceiling (recognised in equity) (47.8) -
31 December (47.8) -
Net defined benefit cost
in million CHF 2017 2016
Current service cost 23.0 48.2
Net interest 0.1 0.6
Past service cost (0.9) -
Administration cost 0.5 1.1
Net defined benefit cost 22.6 49.9
› thereof discontinued operations 6.5 30.1
Remeasurement of net defined benefit liability/asset
in million CHF 2017 2016
Actuarial gain/(loss)
› Changes in demographic assumptions - (0.6)
› Changes in financial assumptions 15.1 4.4
› Experience adjustments (19.9) 20.7
Remeasurement of plan assets 67.7 27.2
Change in asset ceiling (47.8) -
Remeasurements of net defined benefit liability/asset recognised in other comprehensive income 17.5 51.7
› thereof discontinued operations 16.8 41.9
Investment structure of plan assets
in million CHF 2017 2016
Cash and cash equivalents 17.9 3.9% 36.1 3.2%
Debt instruments 88.3 19.3% 241.3 21.5%
Equity instruments 199.2 43.5% 469.9 41.9%
Real estate 107.9 23.6% 268.5 23.9%
Other investments 44.2 9.7% 106.5 9.5%
Fair value of plan assets 457.5 100.0% 1,122.3 100.0%
Current return on investments 7.5% 3.4%

Vifor Pharma Ltd. Annual Report 2017
NOTES TO THE CONSOLIDATED FINANCIAL STATEMENTS
146 172
The Board of Trustees is responsible for investing the plan assets. It defines the investment strategy and determines the long-term target asset structure taking account of the legal requirements, objectives set, the benefit obligations and the foundations’ risk capacity. The Board of Trustees delegates implementation of the investment policy in accordance with the investment strategy to an investment committee, which also comprises of trustees from the Board of Trustees and a general manager. Plan assets are managed by external asset managers in line with the investment strategy.
Instrument Explanation
Cash and cash equivalents Deposited with financial institutions with a minimum A credit rating.
Debt instrumentsQuoted prices in active markets. Invested in instruments with a minimum BBB credit rating.
Equity instrumentsInvestments in equity funds and direct investments include shares of Vifor Pharma with a fair value of CHF 6.7 million (2016: CHF 6.5 million)
Real estateBoth residential property and offices. If real estate is held directly, it is valued by an independent expert.
Other investments
Hedge funds, insurance-linked securities (ILS), mixed investments and receivables. Includes receivables from Group companies of CHF 17.3 million (2016: CHF 38.0 million). Investments in hedge funds are classified as alternative investments. Primarily used for risk management purposes. Quoted prices in an active market are not available for hedge funds investments.
The pension funds manage the assets of 1,254 active members (2016: 5,710) and 219 pensioners (2016: 914).
Basis for measurement
Weighted average in % 2017 2016
Discount rate 0.7 0.6
Salary development 1.0 1.0
Mortality (mortality tables) BVG 2015 GT BVG 2015 GT
Turnover BVG 2015 BVG 2015

Vifor Pharma Ltd. Annual Report 2017
NOTES TO THE CONSOLIDATED FINANCIAL STATEMENTS
147 172
24.3 Sensitivity analysisThe discount rate and future salary development were identified as key actuarial assumptions. Changes in these assumptions would affect the DBO as follows:
in million CHF 2017 2016Basis for
calculation DBOBasis for
calculation DBO
Discount rate
0.70% 409.7 0.60% 1,171.6
+0.25% 394.3 +0.25% 1,127.7
–0.25% 426.1 –0.25% 1,218.5
Salary development
1.00% 409.7 1.00% 1,171.6
+0.25% 410.9 +0.25% 1,175.0
–0.25% 408.4 –0.25% 1,168.2
The sensitivity analysis assumes potential changes in the above parameters as at year-end. Every change in a key actuarial assumption is analysed separately; interdependencies were not taken into account.
Maturity structure of pension obligations
in million CHF 2017 2016
In 1 year 6.6 32.2
In 2 years 6.5 33.3
In 3 years 6.4 32.8
In 4 years 6.2 32.9
In 5 years 6.0 32.7
In 6–10 years 25.7 159.8
The pension obligations have an average duration of 21.9 years (2016: 20.4 years).
Cash outflows for pension payments and other obligations can be budgeted reliably. The benefit plans collect regular contribution payments. The investment strategy requires the safeguarding of liquidity at all times.
The employer contributions to the pension funds are estimated at CHF 15.1 million for 2018.

Vifor Pharma Ltd. Annual Report 2017
NOTES TO THE CONSOLIDATED FINANCIAL STATEMENTS
148 172
Other disclosures
This section provides information on other items which require disclosure to comply with International Financial Reporting Standards (IFRS) and Swiss law, however are not considered critical in understanding the financial performance or position of the Group.
Vifor Pharma Ltd. is a Swiss company limited by shares with its head office in St. Gallen. The registered office is at Rechenstrasse 37, 9000 St. Gallen, Switzerland. Shares in Vifor Pharma are traded on the SIX Swiss Exchange under securities no. 036474934 (ISIN CH0364749348).
The Board of Directors authorised the 2017 consolidated financial statements for publication on 13 March 2018. The 2017 consolidated financial statements will be submitted for approval to the Annual General Meeting of shareholders on 15 May 2018.
25 NEW AND REViSED ACCOUNTiNG STANDARDS25.1 Amendments to iFRSThe standards adopted are consistent with the previous financial year with the following exceptions. As at 1 January 2017, Vifor Pharma adopted the following amended International Financial Reporting Standards.
– Disclosure Initiative – amendments to IAS 7 – Recognition of Deferred Tax Assets for Unrealised Losses – amendments to IAS 12 – Annual improvements 2014–2016 cycle – amendments to IFRS 12
These changes have no or no material impact on the financial position, financial perform-ance and cash flows of Vifor Pharma but resulted in additional disclosures, refer to Note 18.2 net debt reconciliation.
25.2 New standards and interpretations not yet adoptedAs at the reporting date, various new and amended standards and interpretations have been issued with effective dates in the financial year 2018 or later. Vifor Pharma has opted not to early adopt any of the following standards or amendments to standards or inter-pretations that are potentially relevant for the Group. Vifor Pharma intends to apply the new or amended standards for the first time in the financial year beginning on or after the date shown:
IFRS 2 Classification and Measurement of Share-based Payment Transactions (1 January 2018)IFRS 9 Financial Instruments (1 January 2018)IFRS 15 Revenue from Contracts with Customers (1 January 2018)IFRS 16 Leases (1 January 2019)

Vifor Pharma Ltd. Annual Report 2017
NOTES TO THE CONSOLIDATED FINANCIAL STATEMENTS
149 172
IFRS 9 – Financial InstrumentsIFRS 9 addresses the classification, measurement and derecognition of financial assets and financial liabilities, introduces new rules for hedge accounting and a new impairment model for financial assets. The Group is expecting the following impact on its financial assets and liabilities from the adoption of the new standard on 1 January 2018: The venture funds currently measured at fair value through other comprehensive income (FVOCI) will be reclassified to financial assets at fair value through profit or loss (FVPL) as they do not meet the definition of equity instruments. Related fair value gains of CHF 0.3 million will be transferred from the available-for-sale financial assets reserve to retained earnings on 1 January 2018.
The strategic investments in ChemoCentryx and Akebia (equity instruments) currently classified as available for sale will continue to be measured at FVOCI as management will utilise the available FVOCI election. Accordingly, the new guidance does not affect the classification and measurement of these financial assets. However, gains or losses realised on the sale of financial assets at FVOCI will no longer be transferred to profit or loss on sale, but instead reclassified from the FVOCI reserve to retained earnings.
The new hedge accounting rules will align the accounting for hedging instruments more closely with the Group’s risk management practices. The Group believes that its current hedge relationships will qualify as continuing hedges upon the adoption of IFRS 9.
The new impairment model requires the recognition of impairment provisions based on expected credit losses (ECL) rather than only incurred credit losses as is the case under IAS 39. This will mainly impact the Group’s financial assets classified at amortised cost.
IFRS 15 – Revenue from Contracts with CustomersIFRS 15 amends revenue recognition requirements and establishes principles for reporting information about the nature, amount, timing and uncertainty of revenue and cash flows arising from contracts with customers. Whereas Vifor Pharma does not expect a significant impact on revenue recognition from existing contracts with customers, going forward new contracts will need to be assessed. The standard includes specific implementation guid-ance for licences of intellectual property (“IP”). The evaluation of whether a licence is a right to access IP or a right to use IP will be relevant for the Group.
The Group will apply the modified retrospective transition approach and consider the additional disclosure requirements in the year of adoption. Furthermore, the standard will require additional detailed disclosures regarding revenue in the notes.
IFRS 16 – LeasesIFRS 16 will result in almost all leases being recognised on the balance sheet, as the distinc-tion between operating and finance leases is removed. Under the new standard, an asset (the right to use the leased item) and a financial liability to pay rentals are recognised. The only exceptions are short-term and low-value leases. The accounting for lessors will not significantly change.
The standard will affect primarily the accounting for Vifor Pharma’s operating leases and the Group is currently analysing the impacts. As at the reporting date, the Group has operating lease commitments of CHF 87.5 million, see Note 27. A significant portion of these commit-ments will be recognised on the balance sheet.
The Group does not intend to adopt the standard before its effective date (1 January 2019).

Vifor Pharma Ltd. Annual Report 2017
NOTES TO THE CONSOLIDATED FINANCIAL STATEMENTS
150 172
26 PRESENTATiON CURRENCY AND TRANSLATiON OF FOREiGN CURRENCiESThe functional currency of the Group companies is the currency of the primary economic environment in which they operate. The functional currency of the parent entity, Vifor Pharma Ltd., is CHF. Transactions in foreign currencies are translated at the exchange rate effective on the transaction date. Monetary items are re-translated into the functional currency using exchange rates as at the reporting date. The resulting exchange gains and losses are recognised in profit or loss.
Assets and liabilities of foreign subsidiaries are translated into CHF using year-end exchange rates. Income and expenses and cash flows are translated using the average exchange rate for the year. Exchange differences arising from net investments in foreign operations are recognised directly in comprehensive income and reported separately as accumulated translation differences.
Translation differences on equity-like loans that form part of the net investment in a foreign operation are recognised in comprehensive income, provided that repayment of these loans is neither planned nor likely to occur in the foreseeable future.
Exchange ratesThe table below shows the exchange rates against the CHF of the main currencies of relevance for the consolidated financial statements.
Exchange rates against CHF
Year-end rate 2017
Year-end rate 2016
Average rate 2017
Average rate 2016
1 USD 0.97 1.02 0.98 0.99
1 EUR 1.17 1.07 1.11 1.09
1 GBP 1.32 1.26 1.27 1.35
27 COMMiTMENTS AND CONTiNGENT LiABiLiTiES27.1 CommitmentsVifor Pharma entered into various obligations regarding the purchase of services, goods and equipment as part of its ordinary business operations.
As disclosed in Note 3, Vifor Pharma has entered into strategic arrangements with various companies in order to gain access to potential new products. Potential future payments may become due to certain collaboration partners achieving certain milestones as defined in the collaboration agreements. The maximum amount of future commitments for such payments amounts to USD 1,522.9 million (2016: USD 1,495.4 million).
Prior to the acquisition by Vifor Pharma, Relypsa has signed non-cancellable purchase commitments with contract manufacturers or service providers which serve as commercial manufacturers and suppliers of the active pharmaceutical ingredient for Veltassa and provide manufacturing services in relation to Veltassa. The purchase commitments as at 31 December 2017 amount to USD 191.0 million and fall due in the years 2018 to 2022.
Furthermore, there are guarantees to third parties of CHF 7.0 million (2016: CHF 6.1 million). Vifor Pharma entered into payment obligations for the purchase of securities available for sale up to a maximum of CHF 17.4 million (2016: CHF 19.8 million). There are no unusual pending transactions or risks to be disclosed.

Vifor Pharma Ltd. Annual Report 2017
NOTES TO THE CONSOLIDATED FINANCIAL STATEMENTS
151 172
Cash and cash equivalents includes CHF 1.4 million (2016: CHF 1.4 million) posted as collateral for a credit line and lease and is therefore not available for general use. There are no other assets pledged to secure own liabilities in both periods reported.
The table below summarises the maturity profile of non-cancellable operating lease payments (undiscounted).
in million CHF 20172016
restated*
Within 1 year 13.9 11.9
In 2 to 5 years 44.0 32.2
In more than 5 years 29.5 15.9
Total 87.5 60.1
* Figures for 2016 represent the continued operations of the Group.
27.2 Contingent liabilitiesCertain Group companies are currently involved in administrative proceedings, legal disputes and investigations relating to their business activities. The results of ongoing proceedings cannot be predicted with certainty. Management has established appropriate provisions for any expenses likely to be incurred. These projections, however, are also subject to uncertainty. Vifor Pharma does not expect the results of these proceedings to have a significant impact on the consolidated financial statements. 28 RELATED PARTY TRANSACTiONSRelated parties include pension funds, members of the Board of Directors of Vifor Pharma, members of the Corporate Executive Committee and major shareholders, as well as the companies controlled by them. Refer to Note 22 for remuneration of the Board of Directors and Executive Committee.
During the reporting period, Vifor Pharma acquired no Vifor Pharma shares from members of the Board of Directors and the Corporate Executive Committee (2016: 9,360 shares for a total of CHF 1.4 million).
As at 31 December 2017, payables to the pension fund amounted to CHF 17.3 million (2016: CHF 38.0 million).

Vifor Pharma Ltd. Annual Report 2017
NOTES TO THE CONSOLIDATED FINANCIAL STATEMENTS
152 172
29 GROUP COMPANiESSubsidiaries are fully consolidated from the date on which control is transferred to the Group. They are deconsolidated from the date that control ceases.
Country Entity CityShare capital
(in thousands)
Vifor Pharma Group — 100% equity interest
Switzerland Vifor Ltd. Villars-sur-Glâne CHF 2,250
Vifor (International) Ltd. St. Gallen CHF 2,000
Vifor Pharma Ltd. (holding company) St. Gallen CHF 650
Vifor Pharma Participations Ltd. 1 Bern CHF 1,000
Vifor Pharma Participations 2 Ltd. St. Gallen CHF 1,000
Vifor Pharma Finance Ltd. 1 St. Gallen CHF 2,000
Vifor Pharma Management Ltd. Glattbrugg-Zurich CHF 100
Vifor Pharma Technology Ltd. St. Gallen CHF 100
Vifor Pharma Innovation Ltd. St. Gallen CHF 100
Aspreva Pharmaceuticals Ltd. Bern CHF 2,700
Cophar Ltd. Villars-sur-Glâne CHF 700
Etrea Ltd. Meyrin CHF 200
OM Pharma Ltd. Meyrin CHF 3,000
United States Relypsa Inc. Delaware USD 850,000
Vifor Pharma US Participations Inc. Delaware USD 850,000
Aspreva Pharmaceuticals Inc. Basking Ridge USD -
Austria Vifor Pharma Österreich GmbH Vienna EUR 100
Belgium Vifor Pharma België NV Antwerp EUR 61
France Vifor France S.A.S. Paris La Défense EUR 50
Germany Vifor Pharma Deutschland GmbH Munich EUR 50
Great Britain Vifor Pharma UK Ltd. Bagshot GBP 36
Vifor Pharma (B.V.I.) Ltd. 1 British Virgin Island USD 50
Italy Vifor Pharma Italia S.r.l. Rome EUR 10
Netherlands Vifor Pharma Nederland B.V. Breda EUR 18
Portugal OM Pharma S.A. Amadora-Lisboa EUR 5,000
Romania Vifor Pharma Romania Srl. Cluj-Napoca RON 258
Spain Vifor Pharma España S.L. Palau-Solità i Plegamans EUR 200
Sweden Vifor Pharma Nordiska AB Kista SEK 200
Canada Aspreva International Ltd. Victoria CAD -
Argentina Vifor Pharma America Latina S.A. Pilar, Buenos Aires USD 304
Peru OM Pharma S.A. Lima PEN 12,375
Australia Vifor Pharma Pty Ltd. Melbourne AUD -
Singapore Vifor Pharma Asia Pacific Pte. Ltd. Singapore SGD 100
1 Directly held by Vifor Pharma Ltd.

Vifor Pharma Ltd. Annual Report 2017
NOTES TO THE CONSOLIDATED FINANCIAL STATEMENTS
153 172
Country Entity CityShare capital
(in thousands)
Vifor Fresenius Medical Care Renal Pharma (“VFMCRP”) — 55% equity interest held
Switzerland VFMCRP Ltd. 1 St. Gallen CHF 1,000
GermanyFresenius Medical Care Nephrologica Deutschland GmbH Bad Homburg EUR 225
Belgium VFMCRP België NV Antwerp EUR 61
Denmark VFMCRP Danmark A/S Taastrup DKK 500
France VFMCRP France S.A.S. Paris La Défense EUR 10
Great Britain VFMCRP UK Ltd. Bagshot GBP 1
Italy VFMCRP Italia S.r.l. Vaiano Cremasco EUR 10
Netherlands VFMCRP Nederland B.V. Breda EUR 1
Spain VFMCRP España S.L. Palau-Solità i Plegamans EUR 3
1 Directly held by Vifor Pharma Ltd.
30 SUBSEQUENT EVENTSNo transactions occurred between 31 December 2017 and 13 March 2018, the date on which the consolidated financial statements were authorised for publication.
There were no significant events after the reporting date.

Vifor Pharma Ltd. Annual Report 2017
CONSOLIDATED FINANCIAL STATEMENTS
154 172
STATUTORY AUDiTOR’S REPORT
Statutory auditor’s report on the audit of the consolidated financial statements to the Annual Shareholder Meeting of Vifor Pharma Ltd., St. Gallen
OPiNiONWe have audited the consolidated financial statements of Vifor Pharma Ltd., and its sub- sidiaries (the Group), which comprise the consolidated statement of financial position as at 31 December 2017 and the consolidated statement of income, consolidated statement of comprehensive income, consolidated statement of cash flows and consolidated statement of changes in equity for the year then ended, and notes to the consolidated financial statements, including a summary of significant accounting policies.
In our opinion, the consolidated financial statements (pages 96 to 153) give a true and fair view of the consolidated financial position of the Group as at 31 December 2017, and its consolidated financial performance and its consolidated cash flows for the year then ended in accordance with International Financial Reporting Standards (IFRS) and comply with Swiss law.
BASiS FOR OPiNiONWe conducted our audit in accordance with Swiss law, International Standards on Auditing (ISAs) and Swiss Auditing Standards. Our responsibilities under those provisions and standards are further described in the Auditor’s Responsibilities for the Audit of the Consolidated Financial Statements section of our report.
We are independent of the Group in accordance with the provisions of Swiss law and the requirements of the Swiss audit profession, as well as the IESBA Code of Ethics for Professional Accountants, and we have fulfilled our other ethical responsibilities in accordance with these requirements.
We believe that the audit evidence we have obtained is sufficient and appropriate to provide a basis for our opinion.
KEY AUDiT MATTERSKey audit matters are those matters that, in our professional judgment, were of most significance in our audit of the consolidated financial statements of the current period. These matters were addressed in the context of our audit of the consolidated financial statements as a whole, and in forming our opinion thereon, and we do not provide a separate opinion on these matters. For each matter below, our description of how our audit addressed the matter is provided in that context.
We have fulfilled the responsibilities described in the Auditor’s responsibilities for the audit of the consolidated financial statements section of our report, including in relation to these matters. Accordingly, our audit included the performance of procedures designed to respond to our assessment of the risks of material misstatement of the consolidated financial statements. The results of our audit procedures, including the procedures per-formed to address the matters below, provide the basis for our audit opinion on the consolidated financial statements.
Carrying value of goodwill and other indefinite-lived intangible assets
Area of focusAs of 31 December 2017 goodwill amounted to CHF 1,103.5 million, representing 27% of the Group’s total assets. In addition the group has intangible assets with indefinite useful

Vifor Pharma Ltd. Annual Report 2017
CONSOLIDATED FINANCIAL STATEMENTS
155 172
lives with a carrying amount of CHF 104.1 million. Per Note 13, both goodwill and intangible assets with indefinite useful lives are tested for impairment at least annually.
In performing the impairment analysis management applies considerable judgement in respect of future market and economic conditions, such as economic growth, expected inflation rates, demographic developments, expected market share, revenue and margin development. Changes in these assumptions might lead to a change in the carrying value of intangible assets and goodwill.
We focused on this area given the significant judgement and complexity of valuation methodologies applied in the assessment process.
Our audit responseWe assessed and tested, the assumptions, weighted average cost of capital (WACC), methodologies and technical input parameters applied by the Company. We involved our internal valuation specialists to assist us with these audit procedures. In addition, we evaluated the cash flow projections for all cash generating units (CGUs) by performing a retrospective assessment of the accuracy of management’s past projections and analysing management’s business forecasts. In particular, we focused on the sensitivity in the available headroom of CGUs and whether changes in assumptions could cause the carrying amount to exceed its recoverable amount.
Revenue recognition of new arrangements
Area of focusThe Group enters into strategic arrangements to develop partnerships and gain access to potential new products. Such arrangements can be complex in nature, as well as the related application of accounting standards. Complex arrangements require careful consideration regarding their impact on revenue recognition. As described in the Group’s revenue recognition policy in Note 1, revenue is only recognised if certain criteria are met.
We focused on this area given the complexity of accounting resulting from the arrange-ments, and the potential material impact on revenue recognition.
Our audit responseWe tested the timing of recognition and accounting for revenues from licence contracts in accordance with the Group’s accounting policy. In addition, we analysed revenue recognised to identify any material new revenue streams. Our audit procedures focused on the nature of revenue, the degree of automation, unusual contractual terms, and the requirement for exercise of significant management judgement. We inspected material contracts and assessed the corresponding judgments and revenue recognition applied.
Complexity in recognition of intangible assets from license agreements, including contingent considerations
Area of focusThe Group enters into various in-licencing agreements to obtain the marketing and commercialisation rights of specific pharmaceutical products. The total amount of licence payments recognised as intangible assets in 2017 was CHF 95.4 million, as described in Note 13.
Some of the licenced products are still in the clinical development phase and therefore do not yet have the regulatory approvals for prescription.

Vifor Pharma Ltd. Annual Report 2017
CONSOLIDATED FINANCIAL STATEMENTS
156 172
Procedures over the recognition of intangible assets were significant to our audit due to the complexity of the licence contracts. The underlying contracts include deferred payment terms for licence payments as well as milestone payments that are contingent on future developments.
Our audit responseWe analysed the relevant licence contracts and assessed the recognition criteria. In particular, we tested whether the Group’s accounting policy regarding the recognition of intangible assets was applied consistently. In case of deferred payment terms, we evaluated the computation of the net present value of the payments. For milestone payments that are contingent on future developments, we compared the consistency of the Group’s estimates with forecasts and other planning figures.
Discontinued Operations
Area of focusOn 14 March 2017, the Board of Directors of Galenica Ltd. announced its intention to separate the Galenica Santé business from Galenica Ltd. The separation was effective 7 April 2017 by way of a demerger and initial public offering (IPO) of Galenica Santé as a new company.
As detailed in Note 8, the profit from discontinued operations of CHF 1,113.0 million consists of a gain on sale of CHF 1,081.4 million and profit after taxes from the performance of the discontinued operations of CHF 31.6 million. The gain on sale includes the total consideration received of CHF 1,901.3 million, the fair value of retained investment in Galenica of CHF 48.8 million reduced by the net carrying amount of net assets disposed of CHF 781.5 million and costs to sell of CHF 87.2 million.
The profit from discontinued operations for 2017 and 2016 is presented as a single amount in the consolidated statement of income. The Group has therefore restated the 2016 consolidated statement of income as well as the statement of cash flows and various notes. In addition, detailed disclosures regarding discontinued operations are disclosed in Note 8 to the consolidated financial statements.
We consider the classification and presentation of the Group’s discontinued operations significant to our audit due to the impact on the presentation of the financial statements.
Our audit responseOur audit procedures on the accounting and disclosure of reported results from discontinued operations focused on the validation of the profit from discontinued operations. The procedures included testing of received proceeds per bank statements, assessing the fair value of any investments retained, reviewing the carrying amount of net assets disposed as well as a detailed audit of the costs to sell including the correct classification. Furthermore, we considered the adequacy and completeness of the Group’s disclosures made in relation to discontinued operations.
OTHER iNFORMATiON iN THE ANNUAL REPORTThe Board of Directors is responsible for the other information in the annual report. The other information comprises all information included in the annual report, but does not include the consolidated financial statements, the stand-alone financial statements and the remuneration report and our auditor’s reports thereon.

Vifor Pharma Ltd. Annual Report 2017
CONSOLIDATED FINANCIAL STATEMENTS
157 172
Our opinion on the consolidated financial statements does not cover the other information in the annual report and we do not express any form of assurance conclusion thereon.
In connection with our audit of the consolidated financial statements, our responsibility is to read the other information in the annual report and, in doing so, consider whether the other information is materially inconsistent with the consolidated financial statements or our knowledge obtained in the audit, or otherwise appears to be materially misstated. If, based on the work we have performed, we conclude that there is a material misstatement of this other information, we are required to report that fact. We have nothing to report in this regard.
RESPONSiBiLiTY OF THE BOARD OF DiRECTORS FOR THE CONSOLiDATED FiNANCiAL STATEMENTSThe Board of Directors is responsible for the preparation of the consolidated financial statements that give a true and fair view in accordance with IFRS and the provisions of Swiss law, and for such internal control as the Board of Directors determines is necessary to enable the preparation of consolidated financial statements that are free from material misstatement, whether due to fraud or error.
In preparing the consolidated financial statements, the Board of Directors is responsible for assessing the Group’s ability to continue as a going concern, disclosing, as applicable, matters related to going concern and using the going concern basis of accounting unless the Board of Directors either intends to liquidate the Group or to cease operations, or has no realistic alternative but to do so.
AUDiTOR’S RESPONSiBiLiTiES FOR THE AUDiT OF THE CONSOLiDATED FiNANCiAL STATEMENTSOur objectives are to obtain reasonable assurance about whether the consolidated financial statements as a whole are free from material misstatement, whether due to fraud or error, and to issue an auditor’s report that includes our opinion. Reasonable assurance is a high level of assurance, but is not a guarantee that an audit conducted in accordance with Swiss law, ISAs and Swiss Auditing Standards will always detect a material misstatement when it exists. Misstatements can arise from fraud or error and are considered material if, individ-ually or in the aggregate, they could reasonably be expected to influence the economic decisions of users taken on the basis of these consolidated financial statements.
A further description of our responsibilities for the audit of the consolidated financial statements is located at the website of EXPERTsuisse: http://www.expertsuisse.ch/en/audit-report-for-public-companies. This description forms part of our auditor’s report.
REPORT ON OTHER LEGAL AND REGULATORY REQUiREMENTSIn accordance with article 728a para. 1 item 3 CO and the Swiss Auditing Standard 890, we confirm that an internal control system exists, which has been designed for the preparation of consolidated financial statements according to the instructions of the Board of Directors.
We recommend that the consolidated financial statements submitted to you be approved.
Berne, 13 March 2018
Ernst & Young Ltd
Martin Mattes Julian Fiessinger Licensed audit expert Licensed audit expert (Auditor in charge)

158 172 Vifor Pharma Ltd. Annual Report 2017
NOTES TO THE CONSOLIDATED FINANCIAL STATEMENTSANNUAL REPORT 2017
FiNANCiAL STATEMENTS VIFOR PHARMA LTD.

159 172Vifor Pharma Ltd. Annual Report 2017
TABLE OF CONTENTS
160 Statement of income161 Statement of financial position162 Notes to the financial statements

Vifor Pharma Ltd. Annual Report 2017
FINANCIAL STATEMENTS OF VIFOR PHARMA LTD.
160 172
in thousand CHF 2017 2016
Investment income 100,153 138,900
Gain on sale of investments 1,384,119 -
Financial income 14,648 281,474
Other income 10,844 34,669
Income 1,509,764 455,043
Personnel costs (11,125) (22,686)
Financial expenses (33,928) (19,741)
Depreciation and amortisation (16,058) (16,118)
Other expenses (91,631) (9,506)
Expenses (152,742) (68,051)
Profit for the year before taxes 1,357,022 386,992
Direct taxes (38) (123)
Profit for the year 1,356,984 386,869
STATEMENT OF iNCOME

Vifor Pharma Ltd. Annual Report 2017
FINANCIAL STATEMENTS OF VIFOR PHARMA LTD.
161 172
in thousand CHF 31.12.2017 31.12.2016
Assets
Cash and cash equivalents 358,161 91,730
Receivables
› Third parties 4,578 4,366
› Group companies 1,872,195 306,358
Prepaid expenses and accrued income - 2,190
Current assets 2,234,934 404,644
Financial assets 251,830 874,992
Investments 177,298 469,214
Property, plant and equipment - 32
Intangible assets 60 168
Non-current assets 429,188 1,344,406
Assets 2,664,121 1,749,050
Liabilities and shareholders’ equity
Short-term interest-bearing liabilities
› Third parties 114,058 300,000
› Group companies 11,606 15,468
Other short-term liabilities
› Third parties 1,936 3,925
› Group companies - 7
Accrued expenses and deferred income 5,015 11,070
Short-term liabilities 132,615 330,470
Long-term interest-bearing liabilities
› Third parties 100,000 214,058
Long-term liabilities 100,000 214,058
Liabilities 232,615 544,528
Share capital 650 650
Legal retained earnings
› General legal retained earnings 40,000 40,000
› Reserve for treasury shares 2,000 7,100
Voluntary retained earnings
› Other reserves 1,031,000 768,900
› Profit carryforward 872 1,003
› Profit for the year 1,356,984 386,869
Shareholders’ equity 2,431,506 1,204,522
Liabilities and shareholders’ equity 2,664,121 1,749,050
STATEMENT OF FiNANCiAL POSiTiON

Vifor Pharma Ltd. Annual Report 2017
NOTES TO THE FINANCIAL STATEMENTS OF VIFOR PHARMA LTD.
162 172
NOTES TO THE FiNANCiAL STATEMENTS
PRiNCiPLESThe financial statements of Vifor Pharma Ltd. with registered office in St. Gallen, Switzerland, have been prepared in accordance with Article 957 et seqq. of Title 32 of the revised Accounting law based on the Swiss Code of Obligations. Where not prescribed by law, the significant accounting and valuation principles applied are described below.
SEPARATiON OF GALENiCA SANTÉ AND NAME CHANGE TO ViFOR PHARMA LTD.On 14 March 2017, the Board of Directors of Galenica Ltd. announced its intention to separate the Galenica Santé business from Galenica Ltd. The separation was effected on 7 April 2017 by way of a demerger and initial public offering (IPO) of Galenica Santé as a new company. Galenica Ltd. was renamed to Vifor Pharma Ltd. on 11 May 2017 so that Galenica Santé could trade under the Galenica name going forward. The sale of the investments in the Galenica Santé business resulted in a gain of CHF 1,395 million. The costs to sell the investment of CHF 88.9 million are presented in other expenses.
FiNANCiAL iNCOMEFinancial income was effected by the revaluation of investments and intercompany loans of CHF 1.6 million (previous year: CHF 244.1 million).
iNVESTMENTS iN SUBSiDiARiES AND ASSOCiATESThe list of the investments is shown on pages 152 and 153.
FiNANCiAL ASSETSFinancial assets include long-term loans to Group companies of CHF 250.0 million (previous year: CHF 873.2 million) and other financial assets of CHF 1.8 million (previous year: CHF 1.8 million).
LONG-TERM iNTEREST-BEARiNG LiABiLiTiESThe interest-bearing liabilities are recognised at nominal value.
in thousand CHF 2017 2016
Bank debts 100,000 100,000
Private placement (notes) 1 - 114,058
Long-term interest-bearing liabilities 100,000 214,058
1 The private placement (notes) will be repaid in 2018 and were reclassified to short-term liabilities.
DERiVATiVE FiNANCiAL iNSTRUMENTSVifor Pharma selectively hedges liabilities and expected cash flows in USD and EUR against foreign currency risks by means of foreign exchange forwards. The contract volume amounted to CHF 162.7 million (previous year: CHF 32.6 million) as at 31 December 2017 with a positive fair value of CHF 1.3 million (previous year: positive fair value of CHF 2.1 million).
Vifor Pharma entered into cross currency interest rate swaps to hedge foreign currency risks and interest rate risks in connection with the private placement notes issued in USD and GBP.

Vifor Pharma Ltd. Annual Report 2017
NOTES TO THE FINANCIAL STATEMENTS OF VIFOR PHARMA LTD.
163 172
The contract volume amounted to CHF 89.5 million (previous year: CHF 91.5 million) as at 31 December 2017 with a negative fair value of CHF 25.0 million (previous year: negative fair value of CHF 25.9 million).
SHARE CAPiTALAt 31 December 2017, the share capital of Vifor Pharma amounted to CHF 650,000, divided into 65,000,000 publicly listed registered shares with nominal value of CHF 0.01 each. During the current year, the shares were split using a ratio of 1:10.
AUTHORiSED CAPiTALAccording to Article 3a) of the Articles of Incorporation, the Board of Directors is authorised to increase the share capital of CHF 650,000 by a maximum of CHF 65,000 at any time up to and including 28 April 2018 by issuing not more than 6,500,000 registered shares.
SUBORDiNATED LOANSAt the end of 2017, subordinated loans to Group companies amounted to CHF 0.5 million (previous year: CHF 232.9 million).
CONTiNGENT LiABiLiTiESAt the end of 2017, total contingent liabilities amounted to CHF 825.8 million (previous year: CHF 2,815.8 million). Vifor Pharma issued guarantees to Group companies of CHF 738.7 million (previous year: CHF 1,175.8 million), guarantees to third parties of CHF 7.0 million (previous year: CHF 5.6 million) as well as CHF 80.1 million (previous year: CHF 184.4 million) for guarantees to secure intraday transactions in connection with the zero balance cash pooling.
TREASURY SHARESVifor Pharma Ltd. registered shares owned by subsidiaries:
Number in CHF
As at 31 December 2015 231,360 12,123,095
1st quarter 2016Bought 98,500 10,041,997
Sold (67,620) (9,925,887)
2nd quarter 2016Bought 27,230 3,911,263
Sold (44,220) (6,329,872)
3rd quarter 2016Bought 9,590 1,205,256
Sold (53,220) (6,942,549)
4th quarter 2016Bought 28,040 2,952,571
Sold – –
As at 31 December 2016 229,660 7,035,874
1st quarter 2017Bought 5,090 577,540
Sold (47,420) (5,456,604)
2nd quarter 2017Bought 83,060 9,156,180
Sold (69,920) (7,807,084)
3rd quarter 2017Bought 1,300 137,461
Sold - -
4th quarter 2017Bought 5,883 705,728
Sold (54,141) (2,399,152)
As at 31 December 2017 153,512 1,949,943

Vifor Pharma Ltd. Annual Report 2017
NOTES TO THE FINANCIAL STATEMENTS OF VIFOR PHARMA LTD.
164 172
MAJOR SHAREHOLDERS
Number of registered shares
% of share capital
As at 31 December 2017
Patinex AG, Switzerland, and BZ Bank Aktiengesellschaft, Switzerland 1 13,250,000 20.4
VV Value Vals AG, Switzerland 2, 3 7,199,750 11.1
Alecta pensionsförsäkring, Sweden 2,100,000 3.2
As at 31 December 2016
Patinex AG, Switzerland, and BZ Bank Aktiengesellschaft, Switzerland 1, 2 11,223,510 17.3
Sprint Investments 2 GmbH, Switzerland 4 6,261,720 9.6
Priora Projekt AG, Switzerland, Immoport AG, Switzerland, VV Value Vals AG, Switzerland, and Kodiak Invest AG, Switzerland 2, 3 5,345,000 8.2
BNP PARIBAS SA, France 2,152,490 3.3
Alecta pensionsförsäkring, Sweden 2,100,000 3.2
1 Beneficial owners: Martin and Rosmarie Ebner, Switzerland.2 Options not considered.3 Beneficial owners: Remo and Manuela Stoffel, Switzerland.4 Beneficial owners: Stefano Pessina, Monaco, and Kohlberg Kravis Roberts & Co. L.P., USA.
No other shareholder has announced a crossing of the 3% threshold of registered shares.
FULL-TiME EQUiVALENTSThe average number of full-time equivalents until the separation of the Group in April 2017 amounted to 40 (previous year: 40). For the rest of the reporting period the average number of full-time equivalents was <10.
NET RELEASE OF HiDDEN RESERVESThere was no material release of hidden reserves for the reported period (previous year: CHF 177.6 million).

Vifor Pharma Ltd. Annual Report 2017
NOTES TO THE FINANCIAL STATEMENTS OF VIFOR PHARMA LTD.
165 172
Shareholdings of the members of the Board of Directors and the members of the Corporate Executive Committee
SHAREHOLDiNGS OF THE MEMBERS OF THE BOARD OF DiRECTORS
Registered shares Registered shares
Number of registered sharesHeld as at
31.12.2017Allocated
for 2017Held as at
31.12.2016 ²Allocated for 2016 ²
Etienne Jornod, Executive Chairman 226,627 26,127 200,500 80,000
Shares of the executive member of the Board of Directors 226,627 26,127 200,500 80,000
Daniela Bosshardt-Hengartner 11,990 2,209 10,080 1,910
Michel Burnier 6,320 2,086 5,420 900
Romeo Cerutti 1,930 1,963 380 1,550
Marc de Garidel 2,500 3,047 710 1,790
Sylvie Grégoire 3,650 920 2,930 720
Fritz Hirsbrunner 66,030 982 64,480 1,550
Stefano Pessina (until Annual General Meeting 2017) - - 19,750 1,310
This E. Schneider (until Annual General Meeting 2017) - - 36,700 2,030
Dr. Gianni Zampieri 1 41,269 1,227 - -
Shares of the non-executive members of the Board of Directors 133,689 12,434 140,450 11,760
Shares of the members of the Board of Directors 360,316 38,561 340,950 91,760
Registered shares held by related parties of members of the Board of Directors are included in the declaration of the number of shares they hold.1 Dr. Zampieri was appointed as a member of the Board of Directors in May 2017.2 Prior-year adjusted shares multiplied by a factor of ten, accounting for the 1:10 share split.
SHAREHOLDiNGS OF THE MEMBERS OF THE CORPORATE ExECUTiVE COMMiTTEE
Number of registered sharesHeld as at
31.12.2017Held as at
31.12.2016
Felix Burkhard - 9,110
Jean-Claude Clémençon - 4,880
Jörg Kneubühler - 6,720
Dr. Gianni Zampieri 1 - 35,980
David Bevan 100 -
Colin Bond 1,020 -
Dario Eklund 2,640 -
Jeffrey Garland - -
Michael Puri 1,160 -
Stefan Schulze 2,980 -
Chris Springer 20,350 -
Registered shares held by related parties of members of the Corporate Executive Committee are included in the disclosed numbers.1 Dr. Zampieri was appointed as a member of the Board of Directors in May 2017.

Vifor Pharma Ltd. Annual Report 2017
NOTES TO THE FINANCIAL STATEMENTS OF VIFOR PHARMA LTD.
166 172
Information relating to the number and value of participations rights of the members of the Board of Directors and the members of the Corporate Executive Committee are disclosed in the Remuneration Report (pages 78 to 84).
Shareholders’ equity
Shareholders’ equity developed as follows:
in thousand CHFShare
capital
General legal retained earnings
Reserve for treasury shares
Free reserve
Available earnings
Shareholders’ equity
As at 31 December 2015 650 40,000 12,200 576,800 305,003 934,653
Transfer to free reserve 187,000 (187,000) -
Dividends (117,000) (117,000)
Adjustment to the reserve for treasury shares (5,100) 5,100 -
Profit for the year 386,869 386,869
As at 31 December 2016 650 40,000 7,100 768,900 387,872 1,204,522
Transfer to free reserve 257,000 (257,000) -
Dividends (130,000) (130,000)
Adjustment to the reserve for treasury shares (5,100) 5,100
Profit for the year 1,356,984 1,356,984
As at 31 December 2017 650 40,000 2,000 1,031,000 1,357,856 2,431,506
Appropriation of available earnings for the year ending 31 December
At the Annual General Meeting of shareholders as at 15 May 2018, the Board of Directors will propose the following appropriation of available earnings:
in thousand CHF
Proposal to the Annual General Meeting 2017 2016
Balance brought forward 871 1,003
Profit for the year 1,356,984 386,869
Available earnings 1,357,856 387,871
Appropriation of available earnings
Transfer to free reserves (1,227,000) (257,000)
Dividends (130,000) (130,000)
Balance to be carried forward 856 871

Vifor Pharma Ltd. Annual Report 2017
FINANCIAL STATEMENTS OF VIFOR PHARMA LTD.
167 172
STATUTORY AUDiTOR’S REPORT
Statutory auditor’s report on the audit of the financial statements to the Annual Shareholder Meeting of Vifor Pharma Ltd., St. Gallen
As statutory auditor, we have audited the financial statements of Vifor Pharma Ltd., which comprise the statement of income, statement of financial position and notes (pages 158 to 166), for the year ended 31 December 2017.
BOARD OF DiRECTORS’ RESPONSiBiLiTYThe Board of Directors is responsible for the preparation of the financial statements in accordance with the requirements of Swiss law and the company’s articles of incorporation. This responsibility includes designing, implementing and maintaining an internal control system relevant to the preparation of financial statements that are free from material misstatement, whether due to fraud or error. The Board of Directors is further responsible for selecting and applying appropriate accounting policies and making accounting estimates that are reasonable in the circumstances.
AUDiTOR’S RESPONSiBiLiTYOur responsibility is to express an opinion on these financial statements based on our audit. We conducted our audit in accordance with Swiss law and Swiss Auditing Standards. Those standards require that we plan and perform the audit to obtain reasonable assurance whether the financial statements are free from material misstatement.
An audit involves performing procedures to obtain audit evidence about the amounts and disclosures in the financial statements. The procedures selected depend on the auditor’s judgment, including the assessment of the risks of material misstatement of the financial statements, whether due to fraud or error. In making those risk assessments, the auditor considers the internal control system relevant to the entity’s preparation of the financial statements in order to design audit procedures that are appropriate in the circumstances, but not for the purpose of expressing an opinion on the effectiveness of the entity’s internal control system. An audit also includes evaluating the appropriateness of the accounting policies used and the reasonableness of accounting estimates made, as well as evaluating the overall presentation of the financial statements. We believe that the audit evidence we have obtained is sufficient and appropriate to provide a basis for our audit opinion.
OPiNiONIn our opinion, the financial statements for the year ended 31 December 2017 comply with Swiss law and the company’s articles of incorporation.
REPORT ON KEY AUDiT MATTERS BASED ON THE CiRCULAR 1/2015 OF THE FEDERAL AUDiT OVERSiGHT AUTHORiTY Key audit matters are those matters that, in our professional judgment, were of most significance in our audit of the financial statements of the current period. We have determined that there are no key audit matters to communicate in our report.

Vifor Pharma Ltd. Annual Report 2017
FINANCIAL STATEMENTS OF VIFOR PHARMA LTD.
168 172
REPORT ON OTHER LEGAL REQUiREMENTSWe confirm that we meet the legal requirements on licensing according to the Auditor Oversight Act (AOA) and independence (article 728 CO and article 11 AOA) and that there are no circumstances incompatible with our independence.
In accordance with article 728a para. 1 item 3 CO and Swiss Auditing Standard 890, we confirm that an internal control system exists, which has been designed for the preparation of financial statements according to the instructions of the Board of Directors.
We further confirm that the proposed appropriation of available earnings complies with Swiss law and the company’s articles of incorporation. We recommend that the financial statements submitted to you be approved.
St. Gallen, 13 March 2018
Ernst & Young Ltd.
Matthias Mattes Julian FiessingerLicensed audit expert Licensed audit expert(Auditor in charge)

Vifor Pharma Ltd. Annual Report 2017 169 172
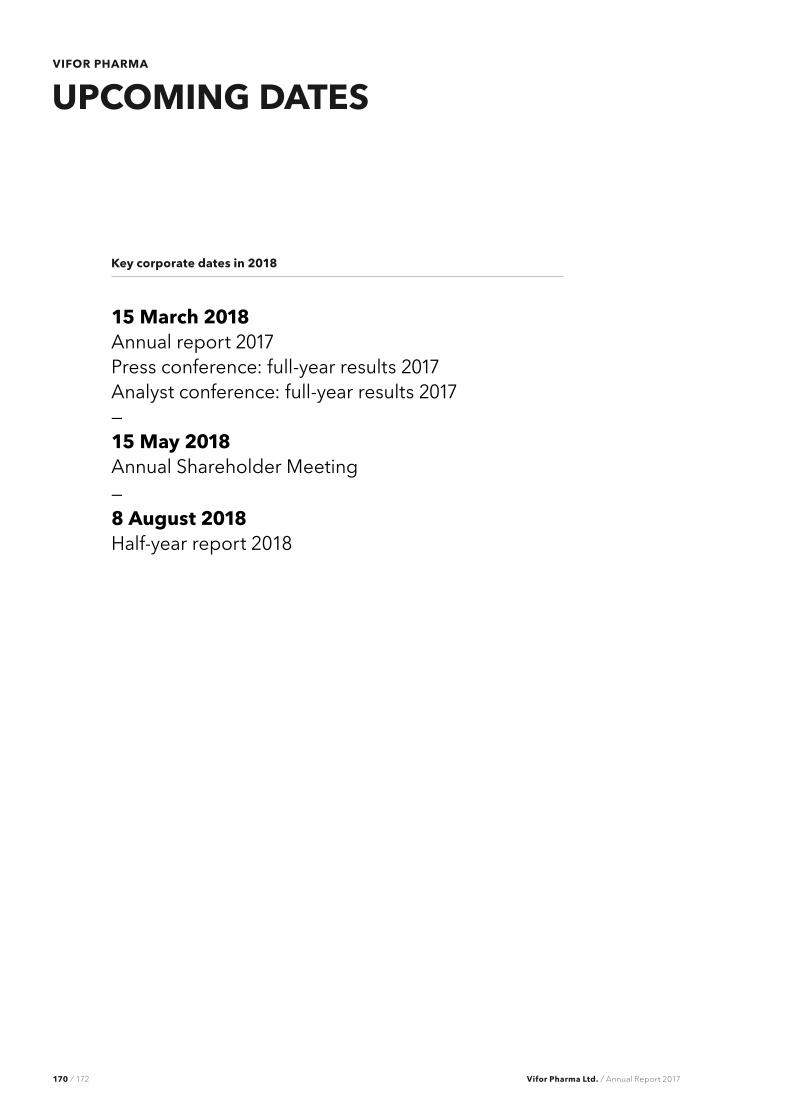
170 172 Vifor Pharma Ltd. Annual Report 2017
ViFOR PHARMA
Key corporate dates in 2018 15 March 2018 Annual report 2017 Press conference: full-year results 2017 Analyst conference: full-year results 2017 — 15 May 2018 Annual Shareholder Meeting— 8 August 2018 Half-year report 2018
UPCOMING DATES

171 172Vifor Pharma Ltd. Annual Report 2017
Imprint:Vifor Pharma GroupAnnual Report 2017
This report is available in PDF form only at www.viforpharma.com
In the case of any discrepancy in the interpretation of the short version of the English, French or German texts of this report, the English text of the full version shall be authoritative. 2018 © Vifor Pharma Ltd.
Vifor Pharma Ltd.Rechenstrasse 379001 St. GallenSwitzerland Vifor Pharma GroupVifor Pharma Management Ltd. Flughofstrasse 61 8152 GlattbruggSwitzerland
MEDIA CONTACT [email protected]
INVESTOR CONTACT [email protected]
www.viforpharma.com
ADDRESSES

Vifor Pharma GroupVifor Pharma Management Ltd. Flughofstrasse 61CH-8152 Glattbrugg
Phone +41 58 851 80 00 Mail [email protected] Web www.viforpharma.com