vifor pharma/media/files/v/vifor... · outlook 2020 april 2020 28 clinical trials market access...
TRANSCRIPT

VIFOR PHARMAINVESTOR PRESENTATION
April 2020
© Vifor Pharma April 2020
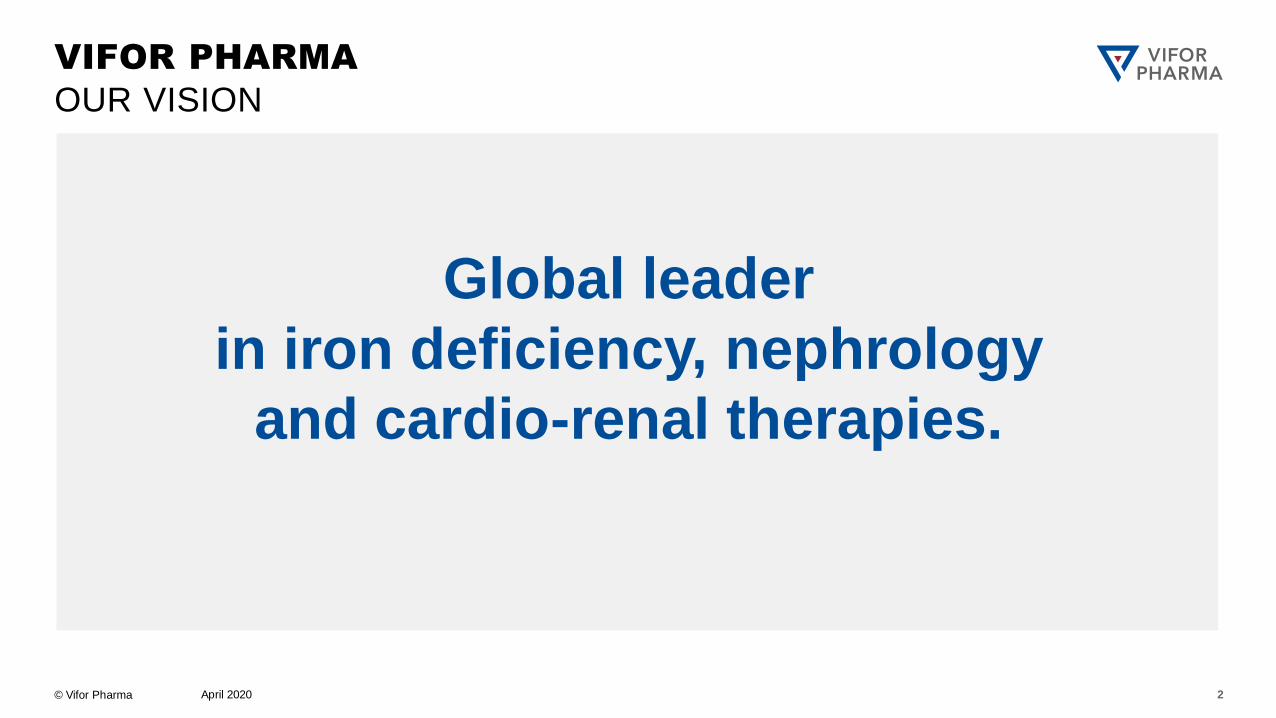
VIFOR PHARMA
OUR VISION
Global leader
in iron deficiency, nephrology
and cardio-renal therapies.
2
© Vifor Pharma
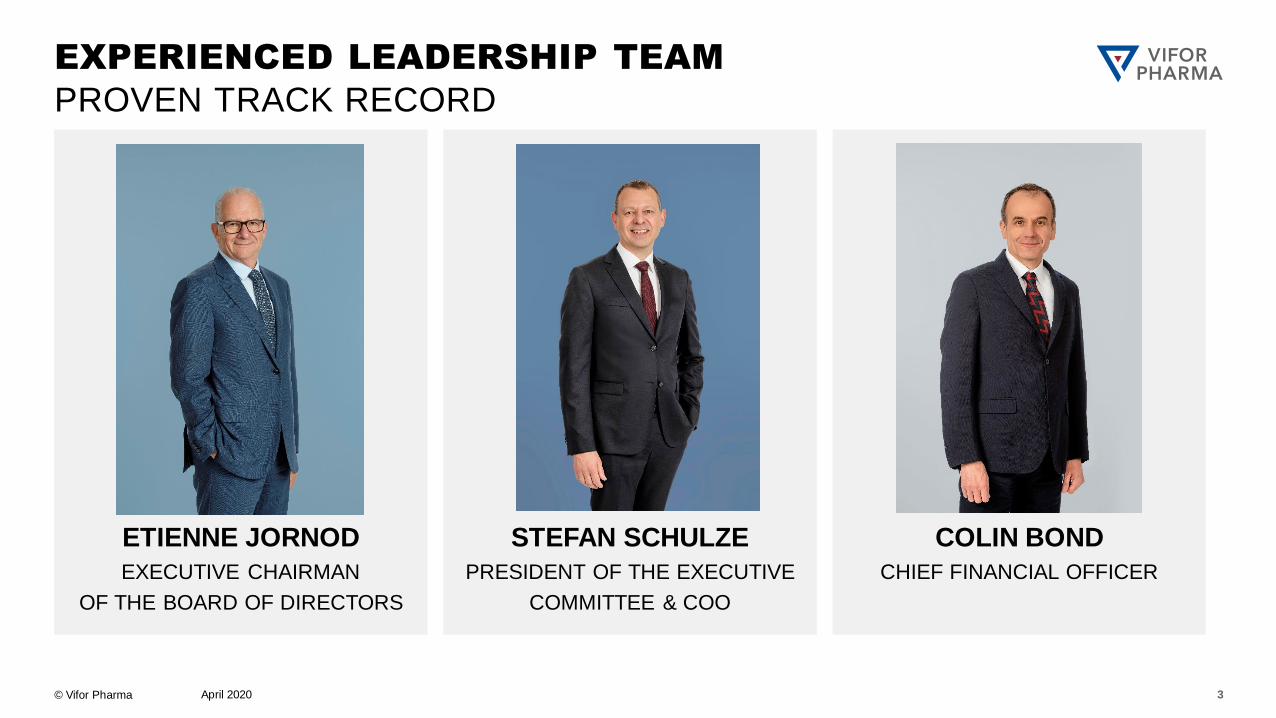
EXPERIENCED LEADERSHIP TEAM
PROVEN TRACK RECORD
April 2020 3
ETIENNE JORNOD
EXECUTIVE CHAIRMAN
OF THE BOARD OF DIRECTORS
STEFAN SCHULZE
PRESIDENT OF THE EXECUTIVE
COMMITTEE & COO
COLIN BOND
CHIEF FINANCIAL OFFICER
© Vifor Pharma
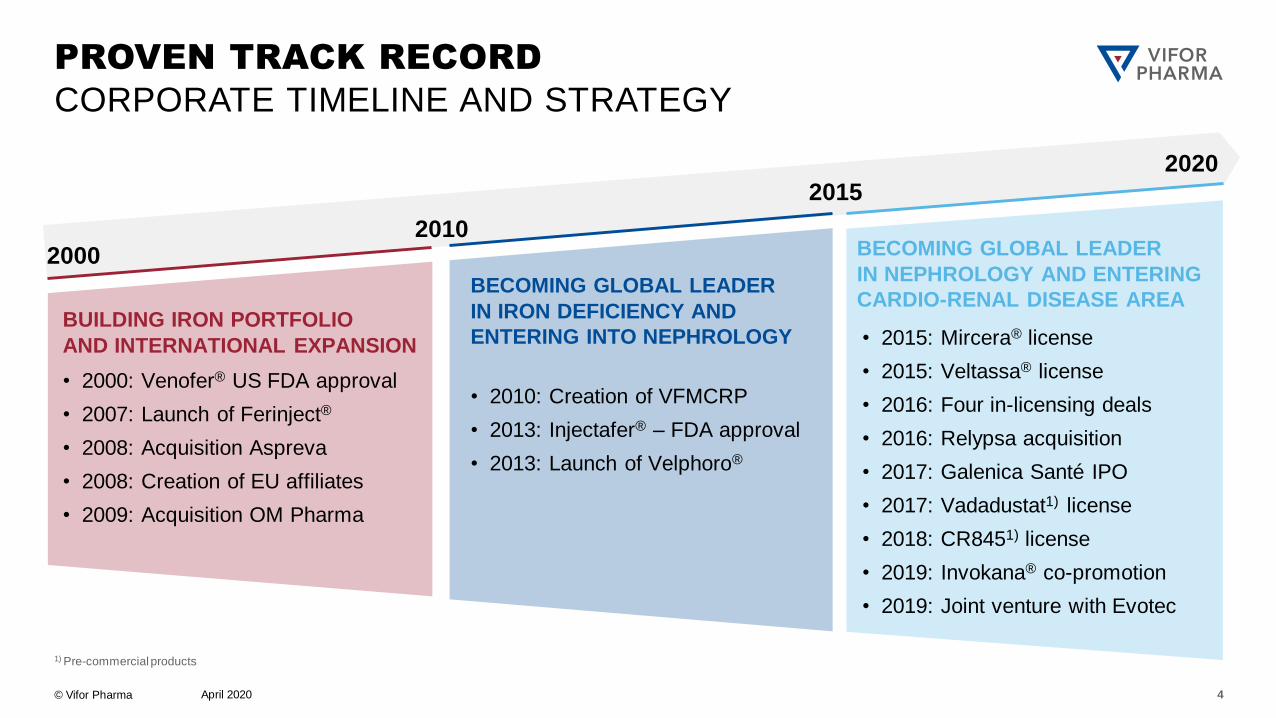
PROVEN TRACK RECORD
CORPORATE TIMELINE AND STRATEGY
20002010
2015
2020
BECOMING GLOBAL LEADER
IN IRON DEFICIENCY AND
ENTERING INTO NEPHROLOGY
BECOMING GLOBAL LEADER
IN NEPHROLOGY AND ENTERING
CARDIO-RENAL DISEASE AREA
• 2000: Venofer® US FDA approval
• 2007: Launch of Ferinject®
• 2008: Acquisition Aspreva
• 2008: Creation of EU affiliates
• 2009: Acquisition OM Pharma
• 2010: Creation of VFMCRP
• 2013: Injectafer® – FDA approval
• 2013: Launch of Velphoro®
• 2015: Mircera® license
• 2015: Veltassa® license
• 2016: Four in-licensing deals
• 2016: Relypsa acquisition
• 2017: Galenica Santé IPO
• 2017: Vadadustat1) license
• 2018: CR8451) license
• 2019: Invokana® co-promotion
• 2019: Joint venture with Evotec
BUILDING IRON PORTFOLIO
AND INTERNATIONAL EXPANSION
April 2020
1) Pre-commercial products
4
© Vifor Pharma
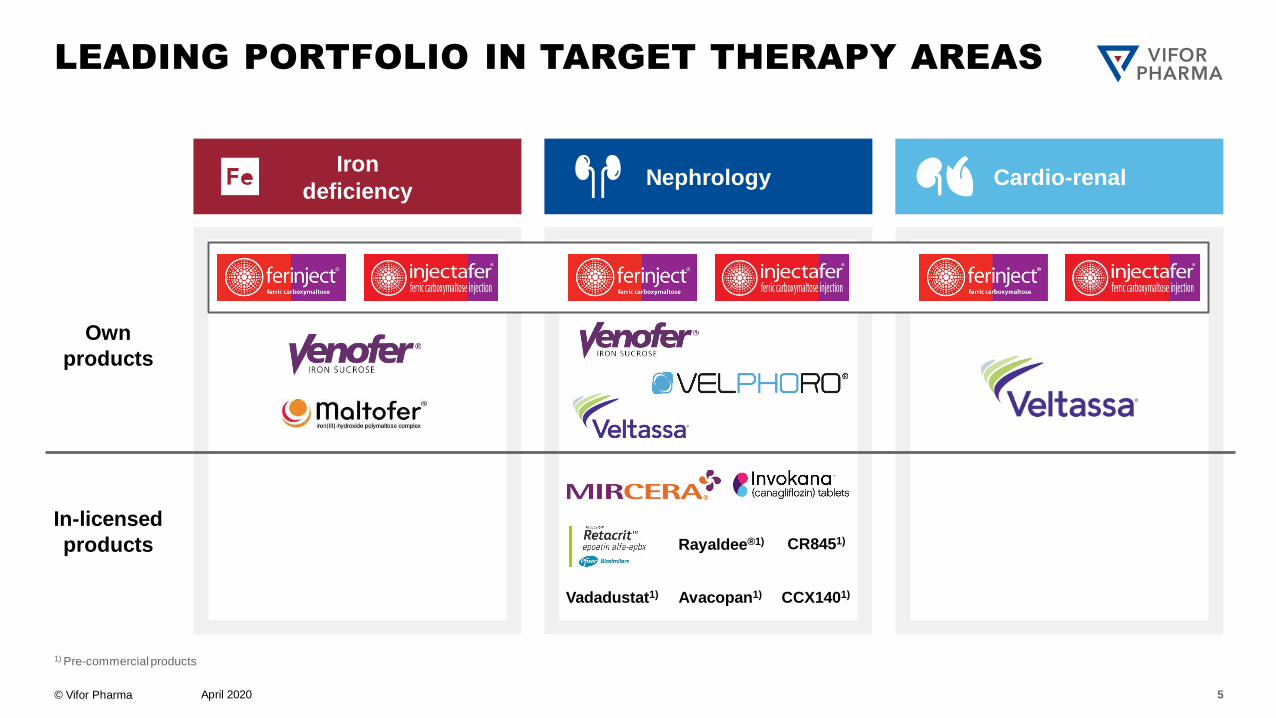
LEADING PORTFOLIO IN TARGET THERAPY AREAS
1) Pre-commercial products
Avacopan1) CCX1401)Vadadustat1)
April 2020
CR8451)
Iron
deficiencyNephrology Cardio-renal
Own
products
In-licensed
products Rayaldee®1)
5
© Vifor Pharma
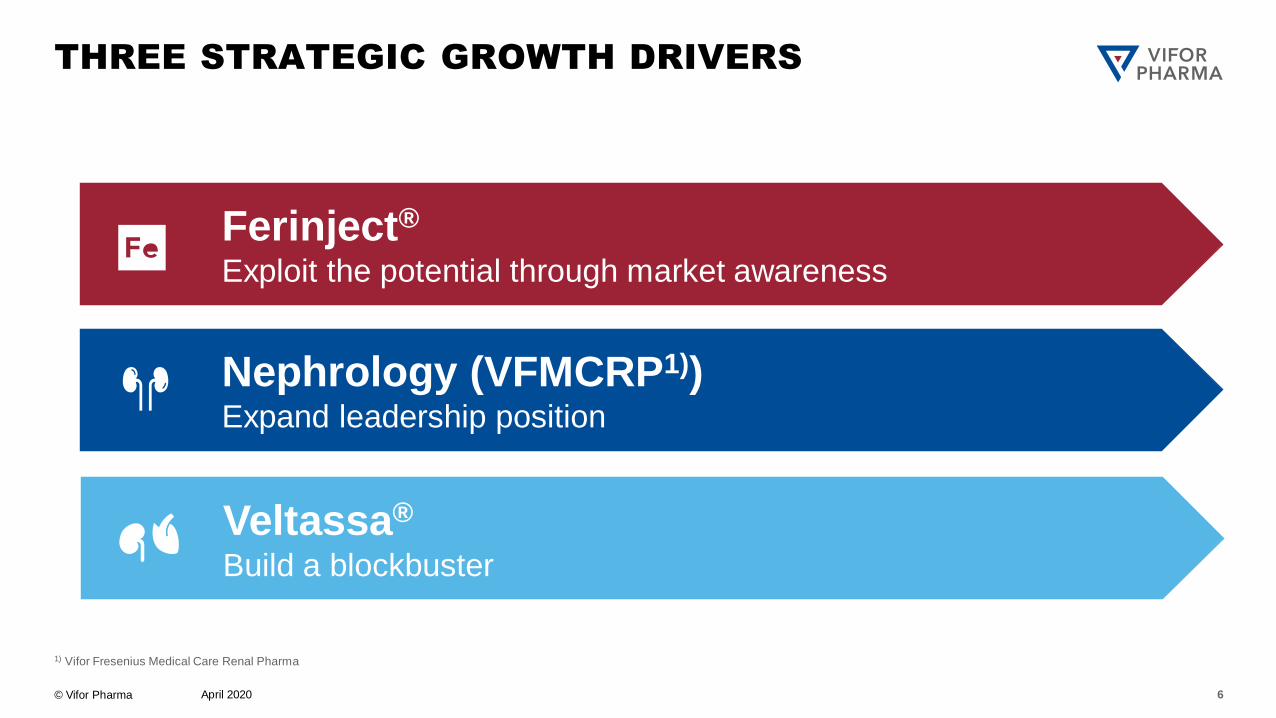
THREE STRATEGIC GROWTH DRIVERS
Ferinject®
Exploit the potential through market awareness
Veltassa®
Build a blockbuster
Nephrology (VFMCRP1)) Expand leadership position
April 2020
1) Vifor Fresenius Medical Care Renal Pharma
6
© Vifor Pharma
[T
April 2020
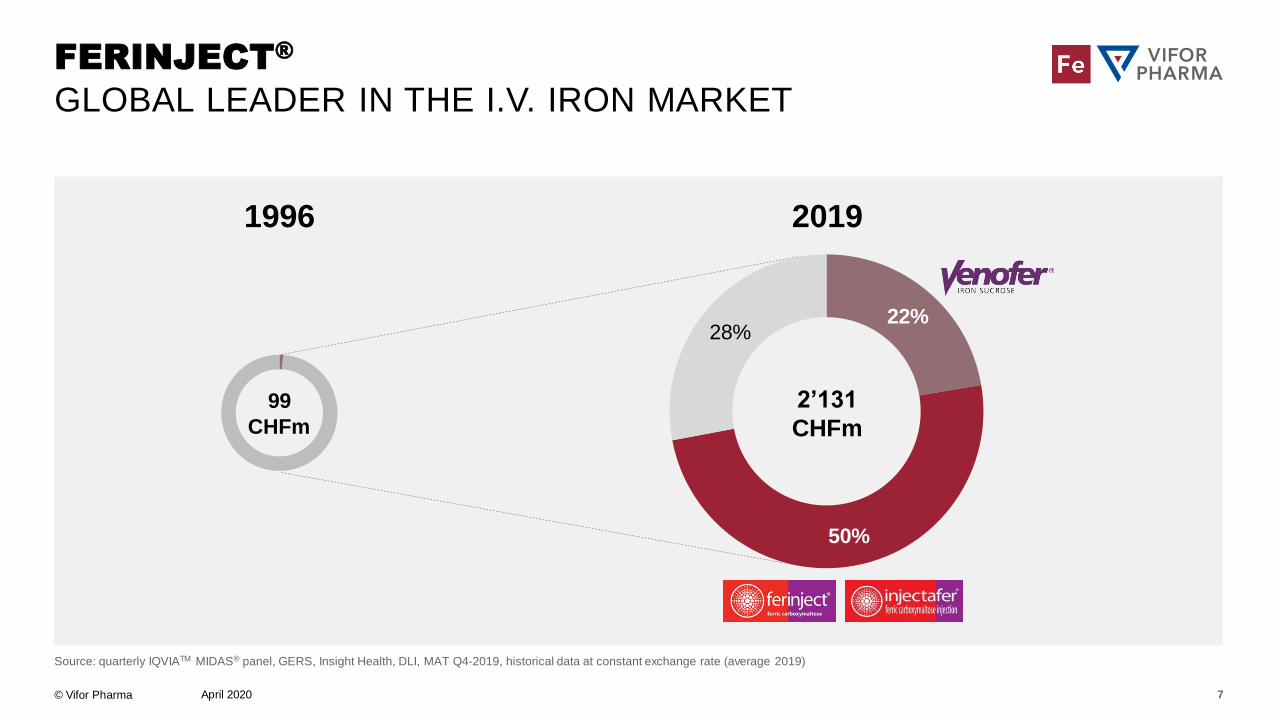
Source: quarterly IQVIATM MIDAS® panel, GERS, Insight Health, DLI, MAT Q4-2019, historical data at constant exchange rate (average 2019)
FERINJECT®
GLOBAL LEADER IN THE I.V. IRON MARKET
20191996
7
22%
50%
28%
2’131
CHFm
99
CHFm
© Vifor Pharma
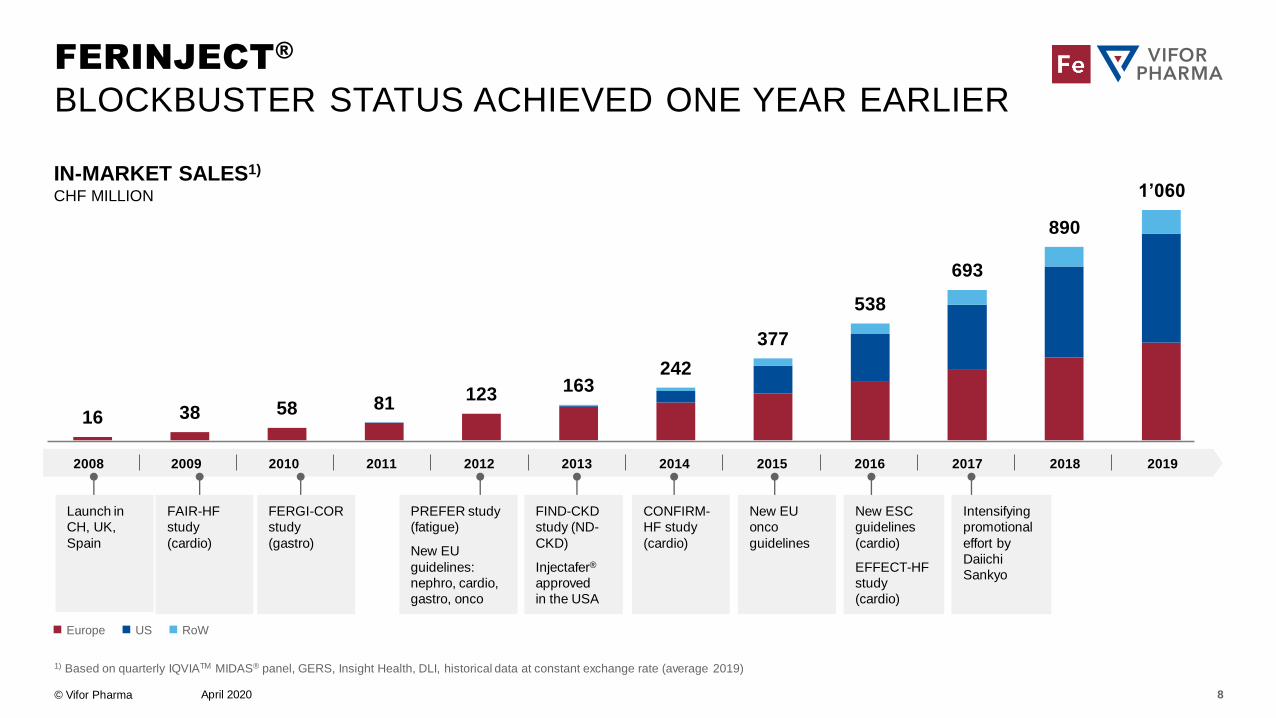
16 38 58 81123 163
242
377
538
693
890
1’060
April 2020
FERINJECT®
BLOCKBUSTER STATUS ACHIEVED ONE YEAR EARLIER
Europe US RoW
1) Based on quarterly IQVIATM MIDAS® panel, GERS, Insight Health, DLI, historical data at constant exchange rate (average 2019)
IN-MARKET SALES1)
CHF MILLION
2008 2009 2010 2011 2012 2013 2014 2015 2016 2017 2019
FAIR-HF
study
(cardio)
FERGI-COR
study
(gastro)
PREFER study
(fatigue)
New EU
guidelines:
nephro, cardio,
gastro, onco
FIND-CKD
study (ND-
CKD)
Injectafer®
approved
in the USA
CONFIRM-
HF study
(cardio)
New ESC
guidelines
(cardio)
EFFECT-HF
study
(cardio)
Intensifying
promotional
effort by
Daiichi
Sankyo
Launch in
CH, UK,
Spain
New EU
onco
guidelines
2018
8
© Vifor Pharma
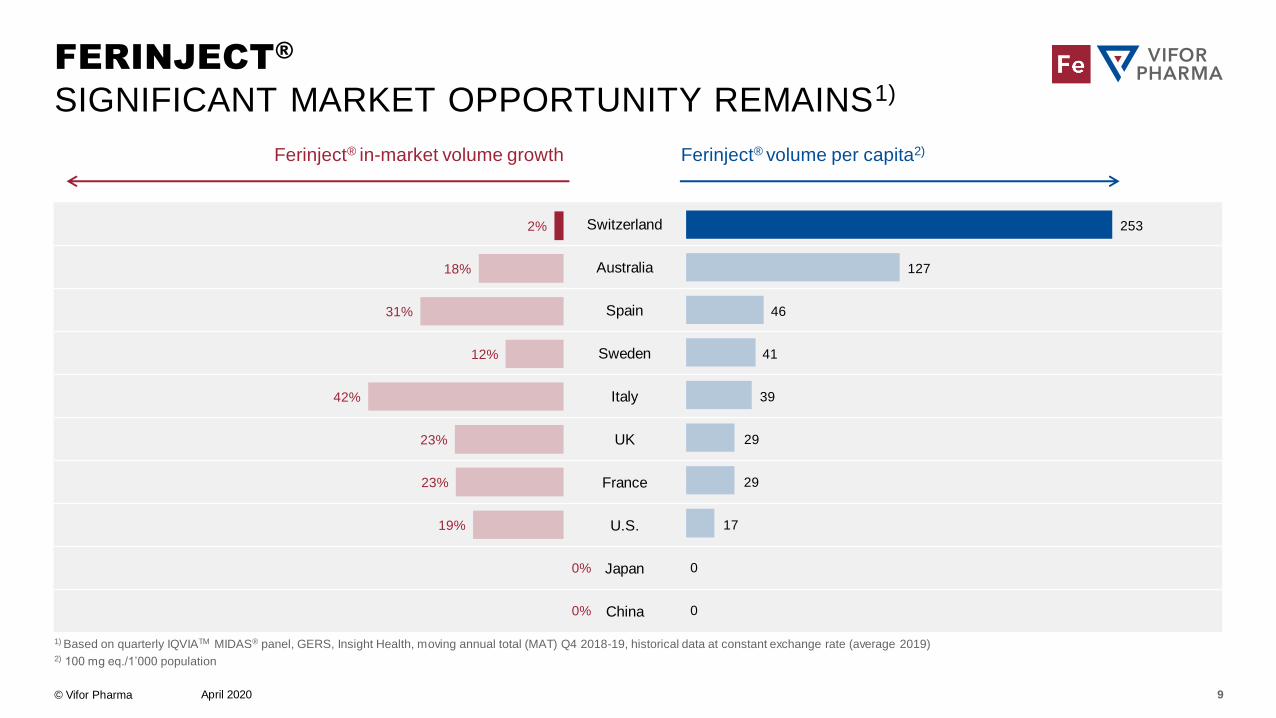
Switzerland
Australia
Spain
Sweden
Italy
UK
France
U.S.
Japan
China
2%
18%
31%
12%
42%
23%
23%
19%
0%
0%
April 2020
FERINJECT®
SIGNIFICANT MARKET OPPORTUNITY REMAINS1)
1) Based on quarterly IQVIATM MIDAS® panel, GERS, Insight Health, moving annual total (MAT) Q4 2018-19, historical data at constant exchange rate (average 2019)2) 100 mg eq./1’000 population
Ferinject® volume per capita2)Ferinject® in-market volume growth
253
127
46
41
39
29
29
17
0
0
9
© Vifor Pharma
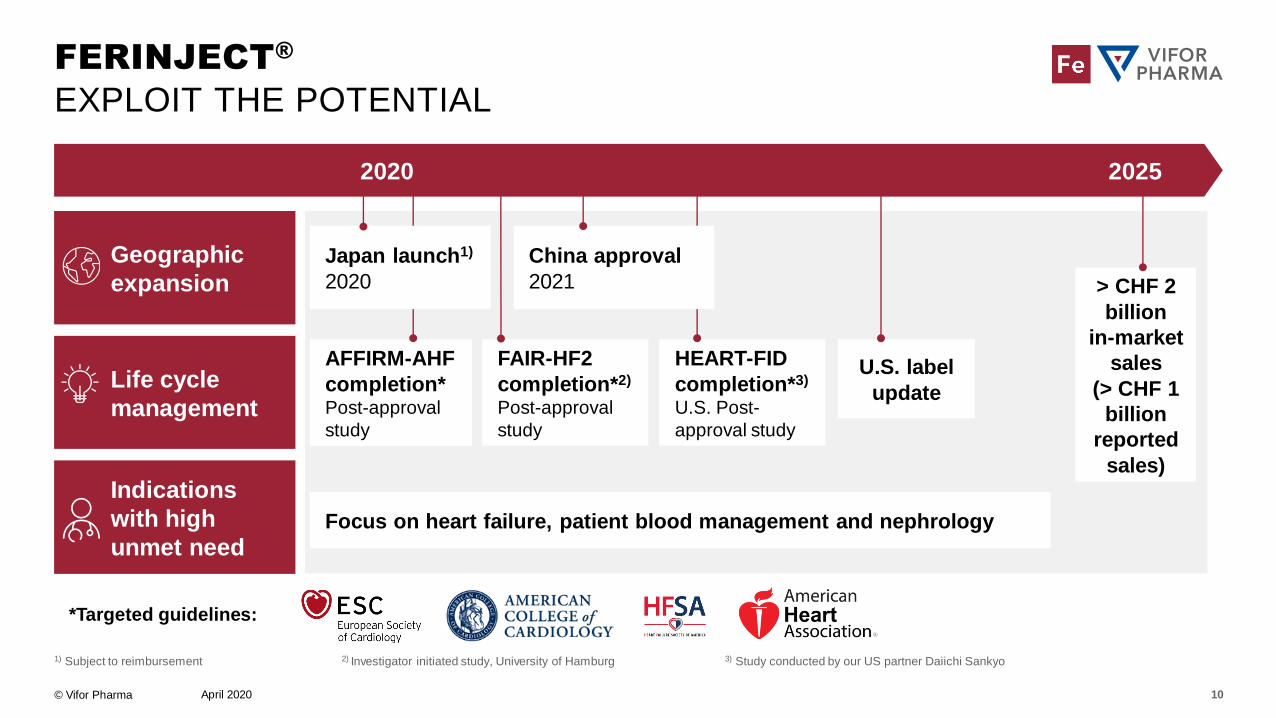
2021 2022 2023 2024
Life cycle
management
Indications
with high
unmet need
April 2020
1) Subject to reimbursement 2) Investigator initiated study, University of Hamburg 3) Study conducted by our US partner Daiichi Sankyo
FERINJECT®
EXPLOIT THE POTENTIAL
2020 2025
HEART-FID
completion*3)
U.S. Post-
approval study
FAIR-HF2
completion*2)
Post-approval
study
Focus on heart failure, patient blood management and nephrology
*Targeted guidelines:
> CHF 2
billion
in-market
sales
(> CHF 1
billion
reported
sales)
U.S. label
update
Geographic
expansion
AFFIRM-AHF
completion*Post-approval
study
China approval
2021
Japan launch1)
2020
10
© Vifor Pharma
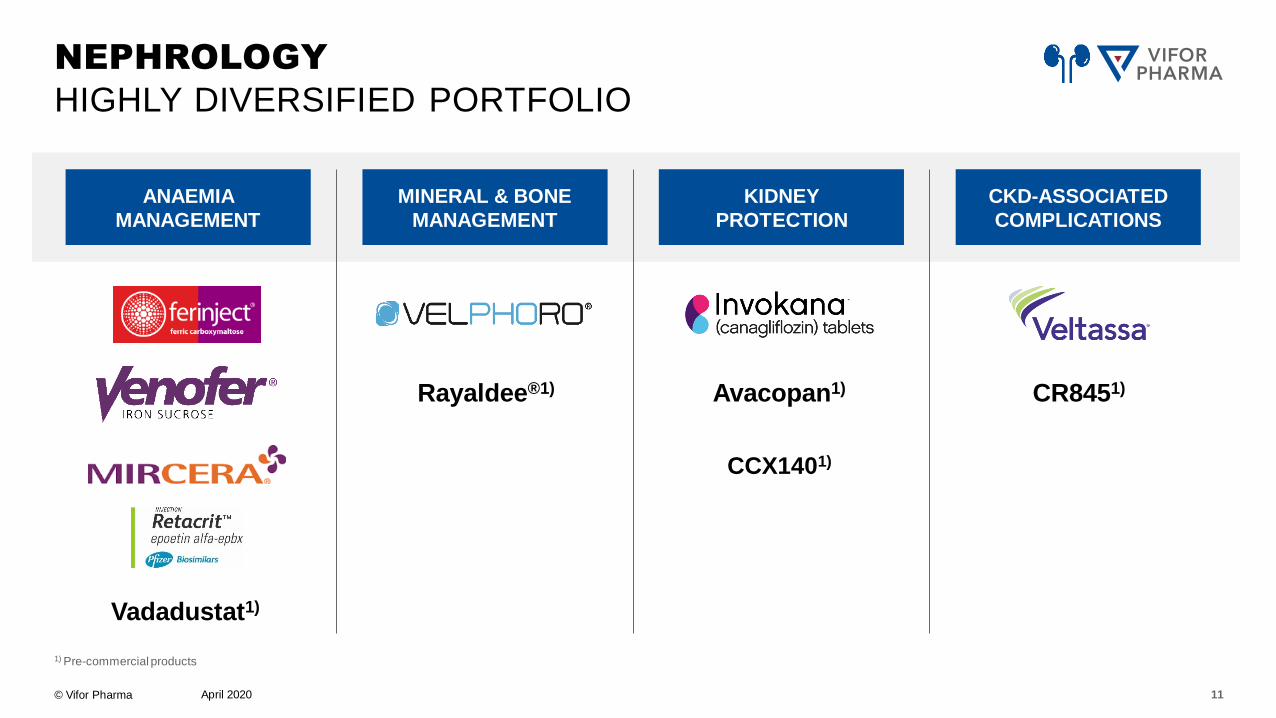
NEPHROLOGY
HIGHLY DIVERSIFIED PORTFOLIO
April 2020
1) Pre-commercial products
MINERAL & BONE
MANAGEMENT
ANAEMIA
MANAGEMENT
KIDNEY
PROTECTION
Avacopan1)
Vadadustat1)
CR8451)
CCX1401)
CKD-ASSOCIATED
COMPLICATIONS
Rayaldee®1)
11
© Vifor Pharma April 2020
1) Pre-commercial products
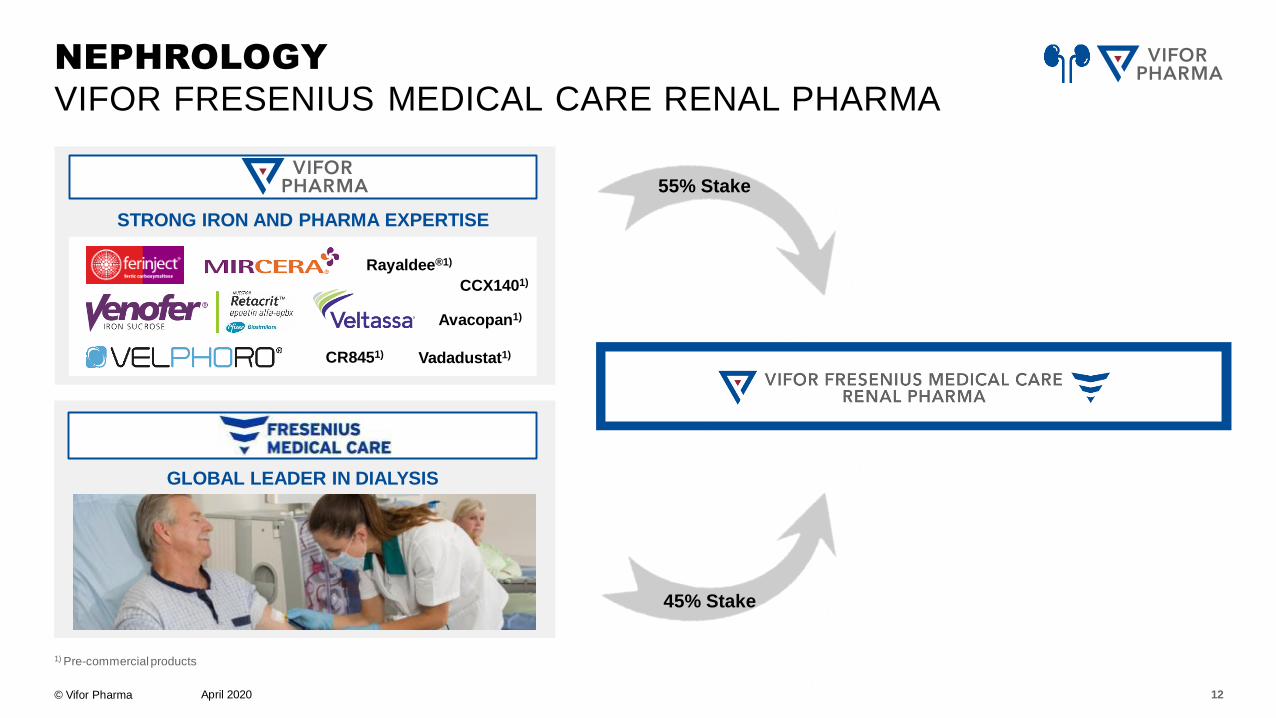
NEPHROLOGY
VIFOR FRESENIUS MEDICAL CARE RENAL PHARMA
STRONG IRON AND PHARMA EXPERTISE
GLOBAL LEADER IN DIALYSIS
Avacopan1)
CCX1401)
55% Stake
45% Stake
Vadadustat1)CR8451)
Rayaldee®1)
12
© Vifor Pharma
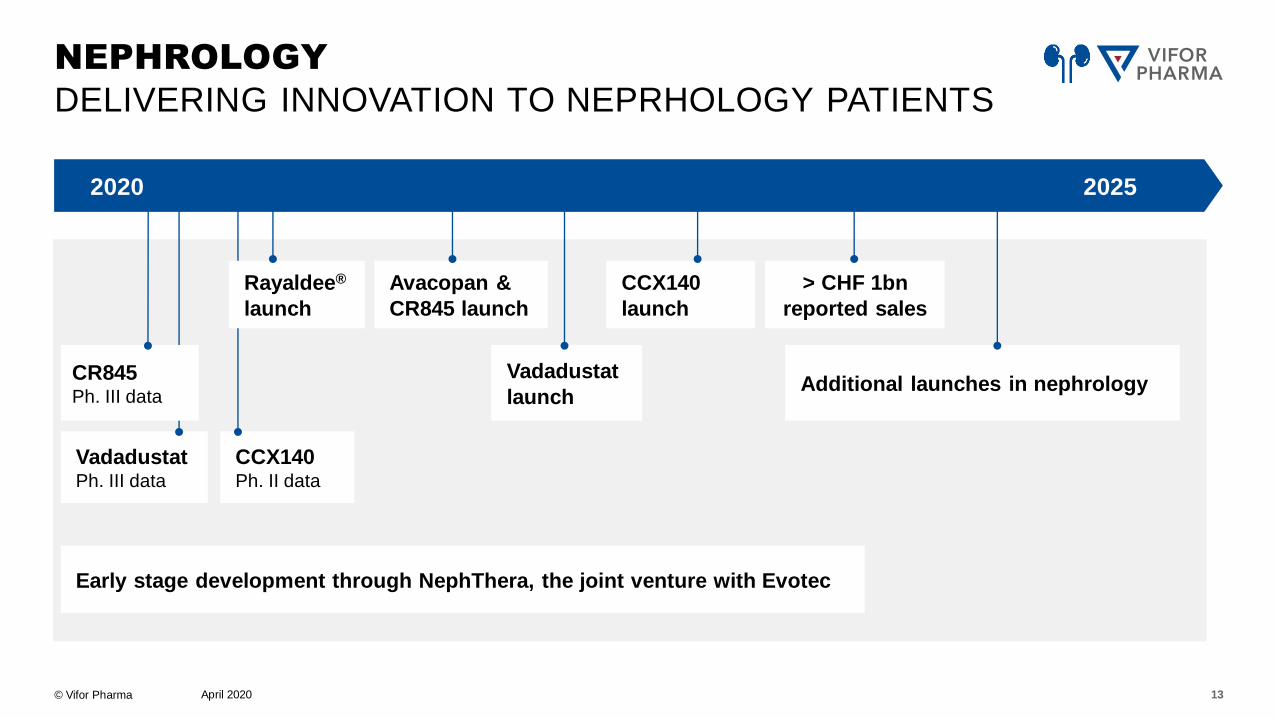
2020 2021 2022 2023 2024
April 2020
NEPHROLOGY
DELIVERING INNOVATION TO NEPRHOLOGY PATIENTS
2020 2025
Additional launches in nephrologyVadadustat
launch
CCX140
launch
VadadustatPh. III data
> CHF 1bn
reported sales
Avacopan &
CR845 launch
CCX140Ph. II data
Rayaldee®
launch
13
Early stage development through NephThera, the joint venture with Evotec
CR845Ph. III data
© Vifor Pharma
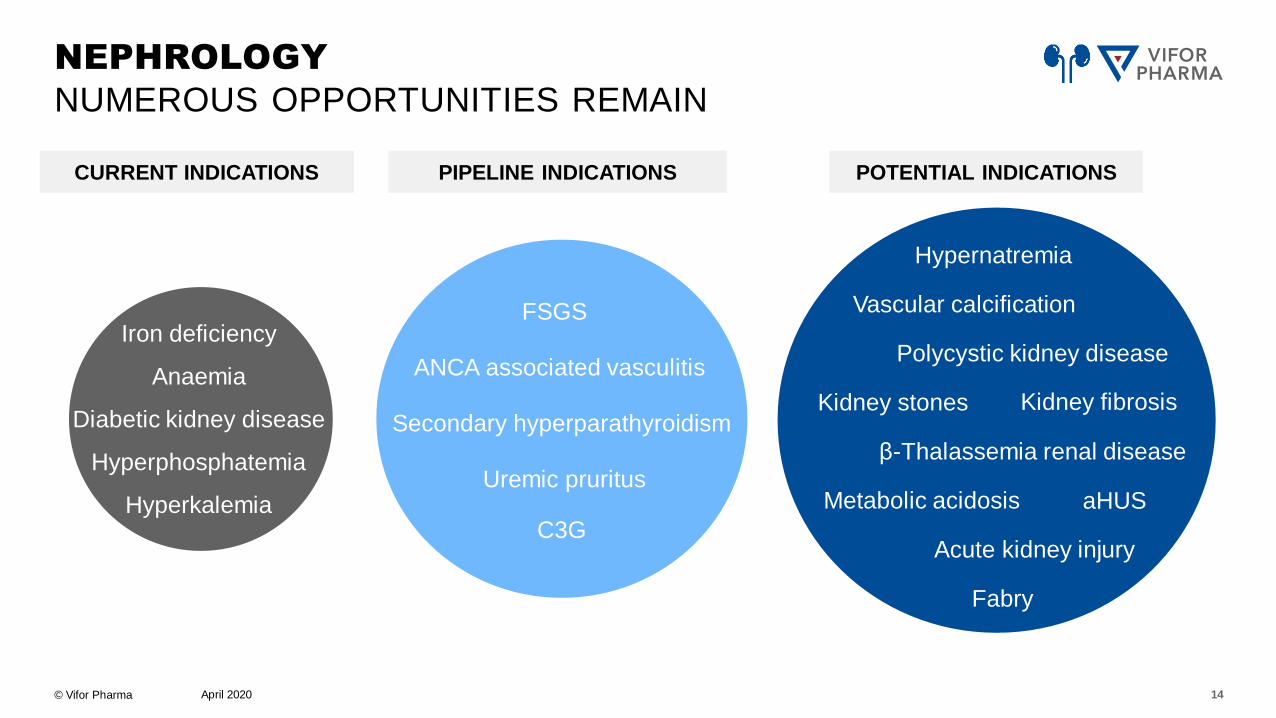
CURRENT INDICATIONS
April 2020
NEPHROLOGY
NUMEROUS OPPORTUNITIES REMAIN
Polycystic kidney disease
Metabolic acidosis
Vascular calcification
Kidney stones
Hypernatremia
Fabry
aHUS
Acute kidney injury
β-Thalassemia renal disease
FSGS
ANCA associated vasculitis
Uremic pruritus
C3G
Secondary hyperparathyroidism
Hyperphosphatemia
Hyperkalemia
Anaemia
Iron deficiency
PIPELINE INDICATIONS POTENTIAL INDICATIONS
Diabetic kidney diseaseKidney fibrosis
14
© Vifor Pharma April 2020
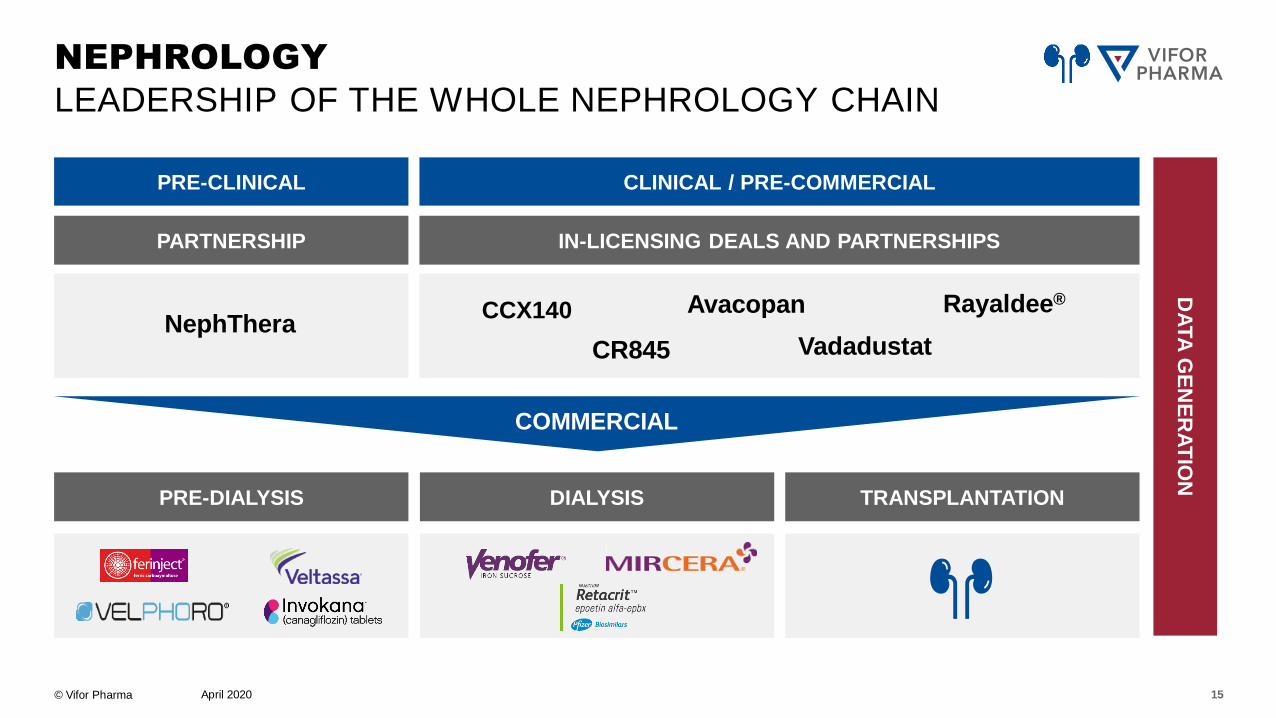
NEPHROLOGY
LEADERSHIP OF THE WHOLE NEPHROLOGY CHAIN
CLINICAL / PRE-COMMERCIAL
IN-LICENSING DEALS AND PARTNERSHIPS
Avacopan
VadadustatCR845
CCX140
PRE-CLINICAL
DA
TA
GE
NE
RA
TIO
N
PARTNERSHIP
TRANSPLANTATION
COMMERCIAL
PRE-DIALYSIS DIALYSIS
15
NephTheraRayaldee®
© Vifor Pharma
US nephrologists
April 2020
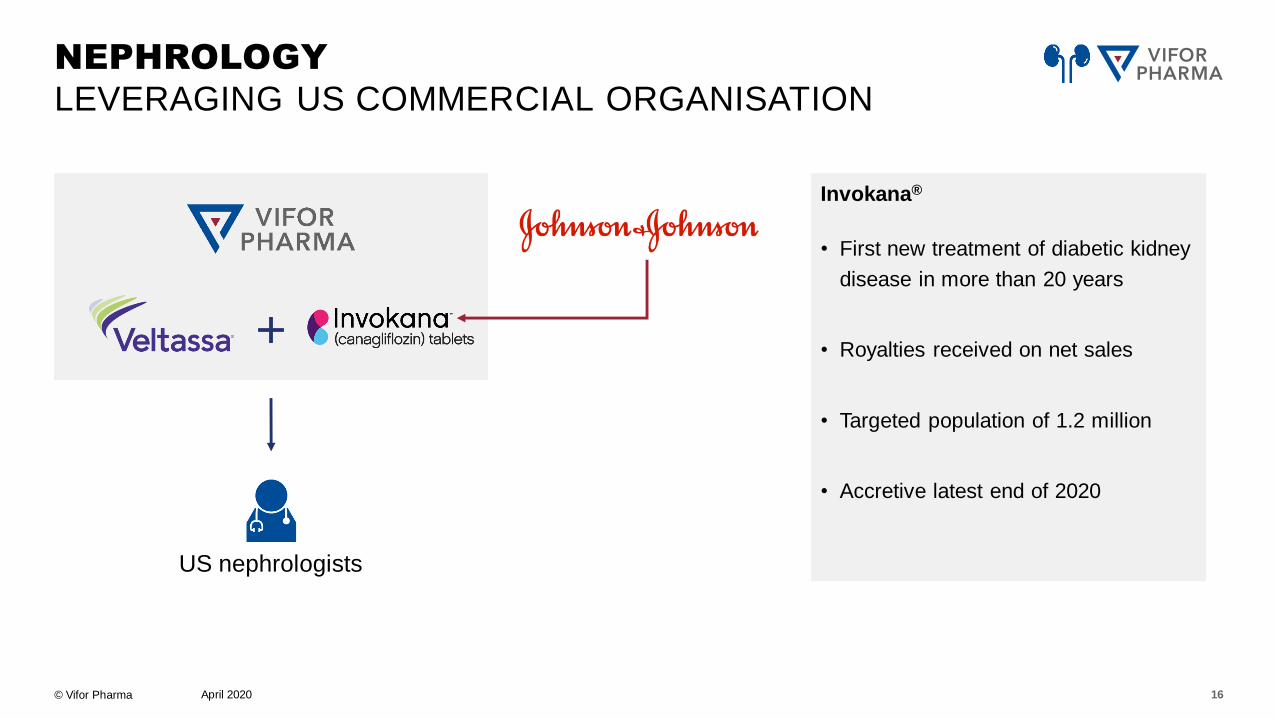
NEPHROLOGY
LEVERAGING US COMMERCIAL ORGANISATION
+
Invokana®
• First new treatment of diabetic kidney
disease in more than 20 years
• Royalties received on net sales
• Targeted population of 1.2 million
• Accretive latest end of 2020
16
© Vifor Pharma April 2020 17
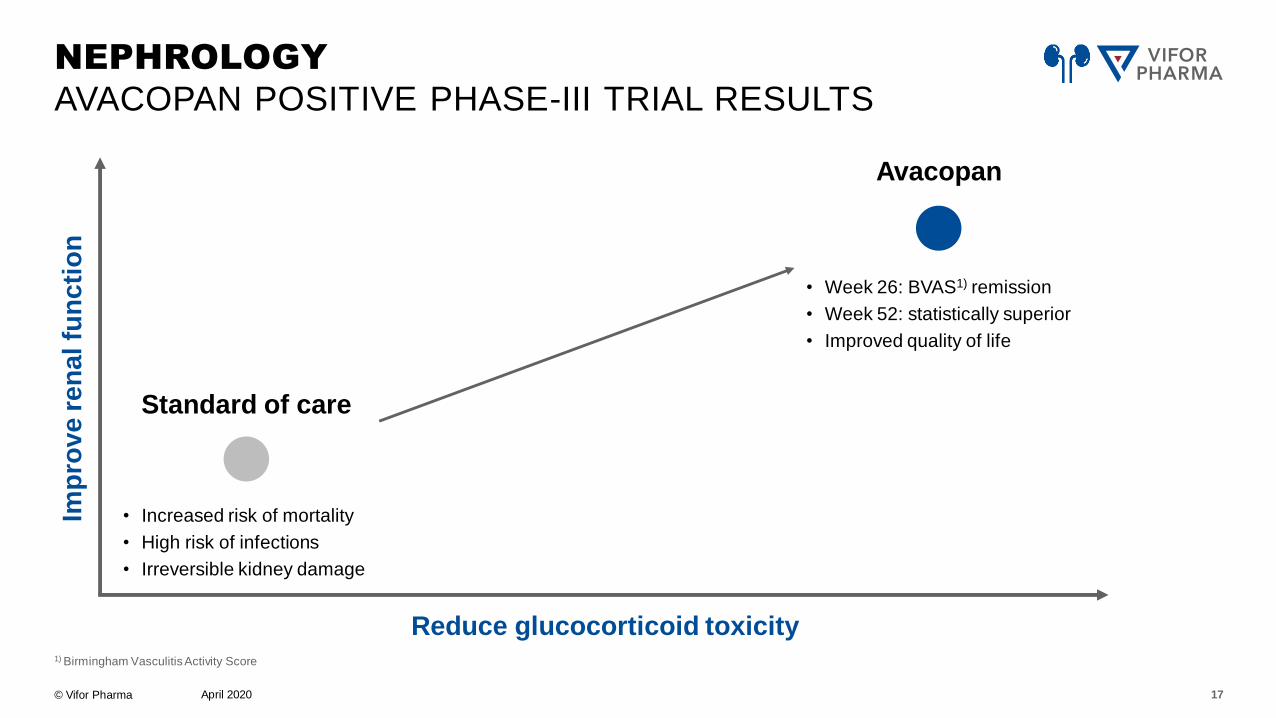
1) Birmingham Vasculitis Activity Score
NEPHROLOGY
AVACOPAN POSITIVE PHASE-III TRIAL RESULTS
Reduce glucocorticoid toxicity
Imp
rove r
en
al fu
ncti
on
• Week 26: BVAS1) remission
• Week 52: statistically superior
• Improved quality of life
• Increased risk of mortality
• High risk of infections
• Irreversible kidney damage
Standard of care
Avacopan
© Vifor Pharma
[]
April 2020
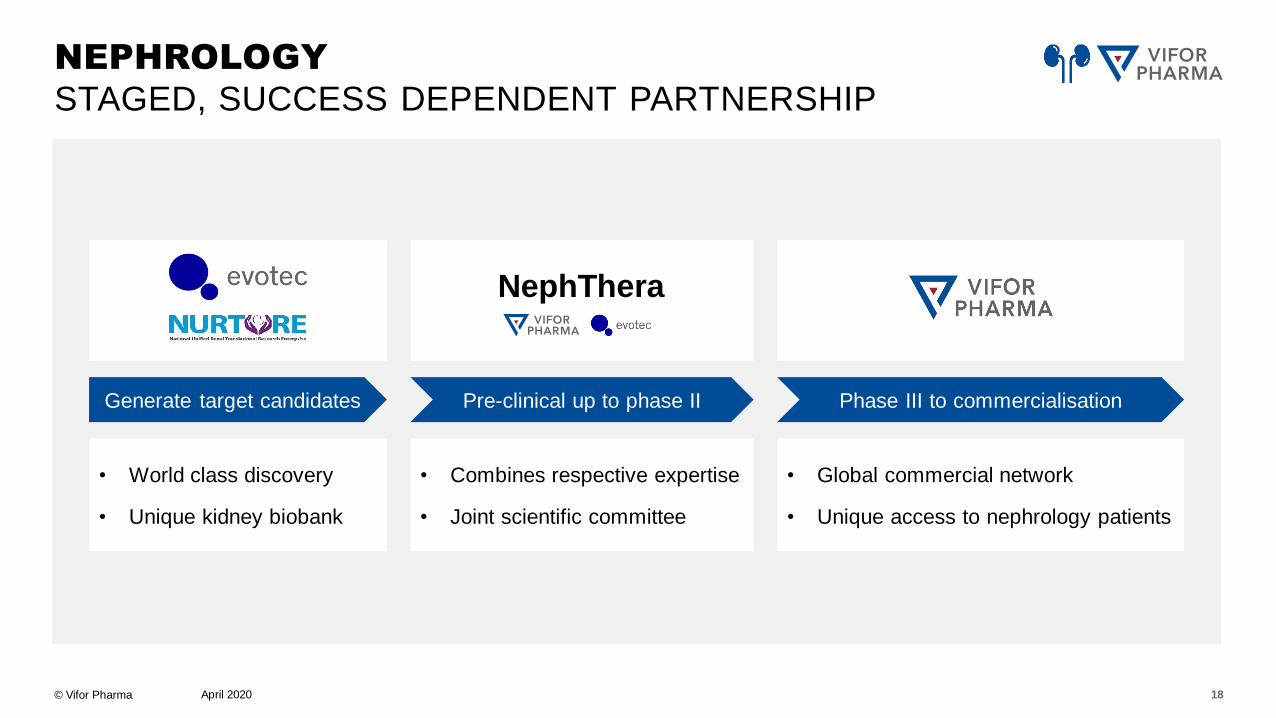
NEPHROLOGY
STAGED, SUCCESS DEPENDENT PARTNERSHIP
NephThera
Generate target candidates Pre-clinical up to phase II Phase III to commercialisation
• World class discovery
• Unique kidney biobank
• Combines respective expertise
• Joint scientific committee
• Global commercial network
• Unique access to nephrology patients
18
© Vifor Pharma
[]
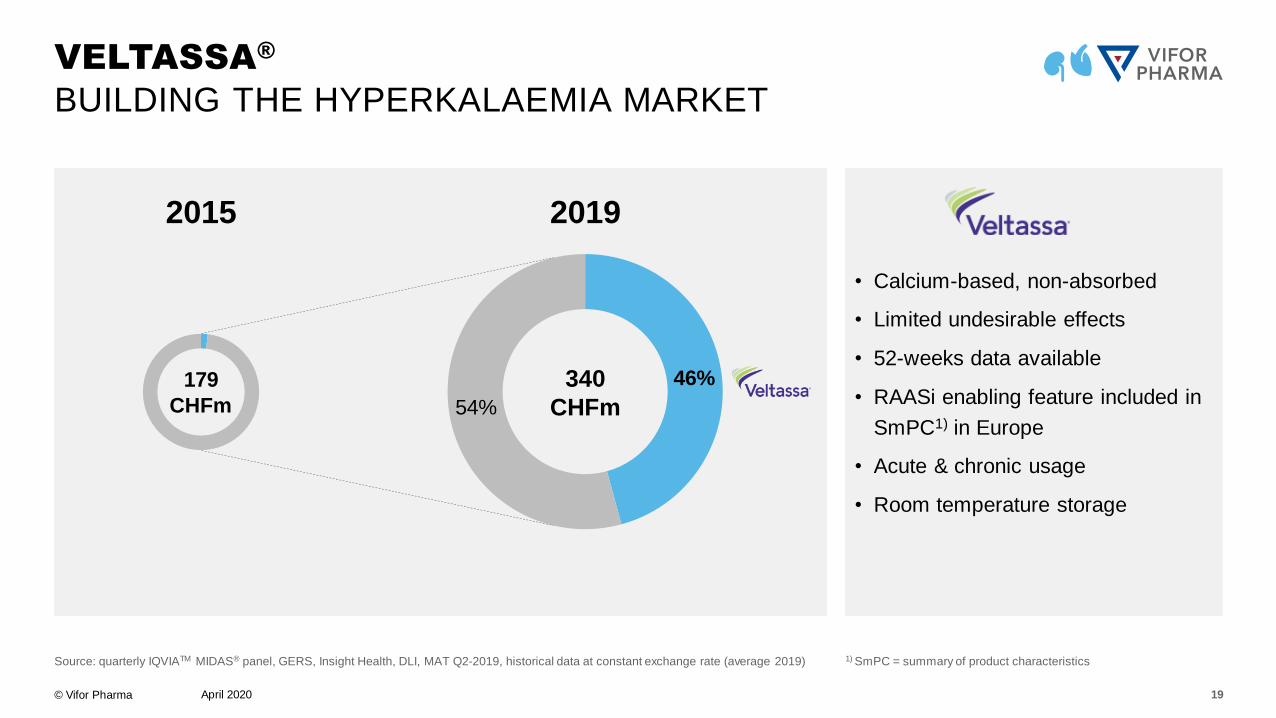
46%
54%
April 2020
• Calcium-based, non-absorbed
• Limited undesirable effects
• 52-weeks data available
• RAASi enabling feature included in
SmPC1) in Europe
• Acute & chronic usage
• Room temperature storage
VELTASSA®
BUILDING THE HYPERKALAEMIA MARKET
Source: quarterly IQVIATM MIDAS® panel, GERS, Insight Health, DLI, MAT Q2-2019, historical data at constant exchange rate (average 2019) 1) SmPC = summary of product characteristics
20192015
19
179
CHFm
340
CHFm
© Vifor Pharma
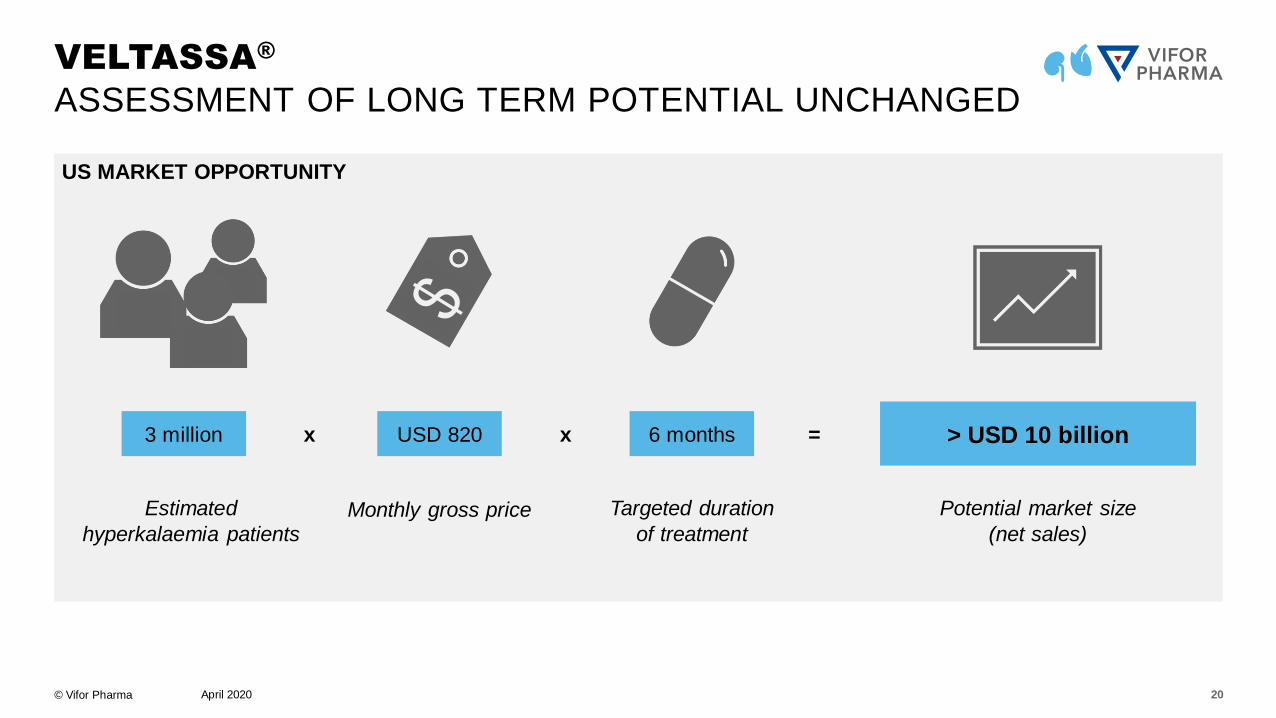
US MARKET OPPORTUNITY
April 2020
VELTASSA®
ASSESSMENT OF LONG TERM POTENTIAL UNCHANGED
3 million USD 820
Monthly gross priceEstimated
hyperkalaemia patients
6 months
Targeted duration
of treatment
x x > USD 10 billion =
Potential market size
(net sales)
20
© Vifor Pharma
2020 2021 2022 2023 2024
April 2020
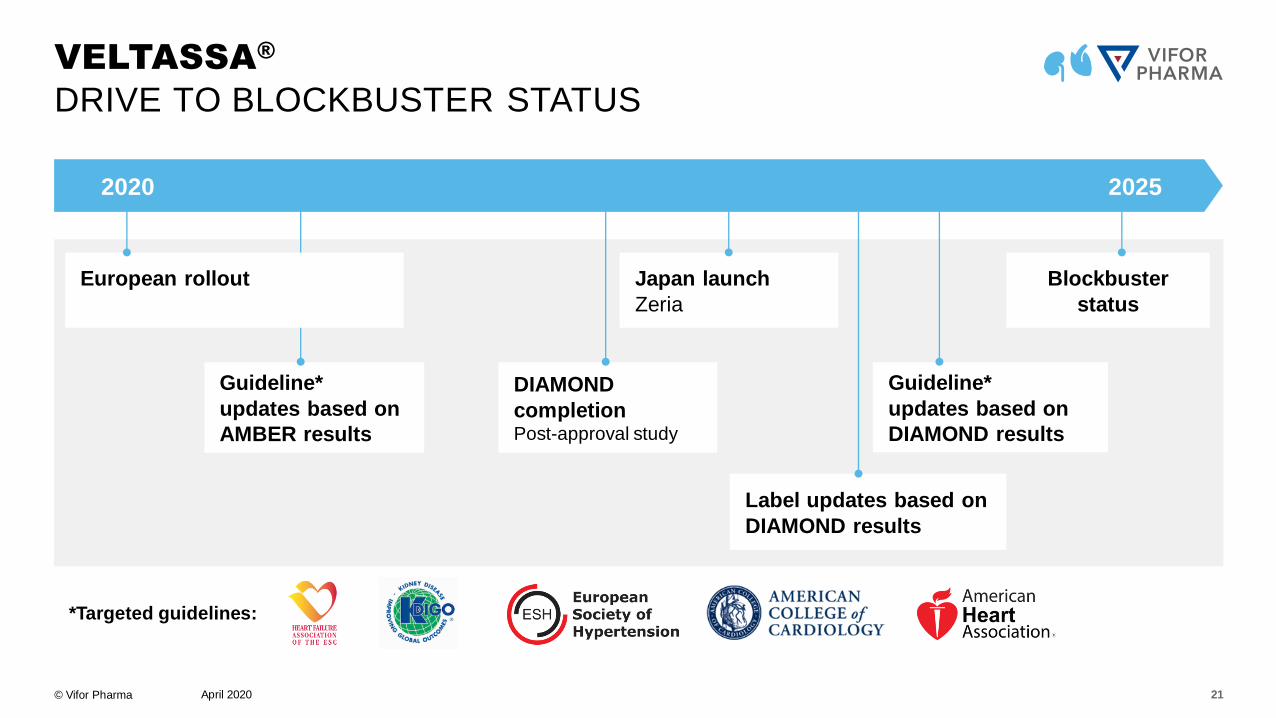
VELTASSA®
DRIVE TO BLOCKBUSTER STATUS
2020 2025
DIAMOND
completionPost-approval study
Label updates based on
DIAMOND results
Blockbuster
status
Guideline*
updates based on
AMBER results
Guideline*
updates based on
DIAMOND results
*Targeted guidelines:
European rollout Japan launch
Zeria
21
© Vifor Pharma
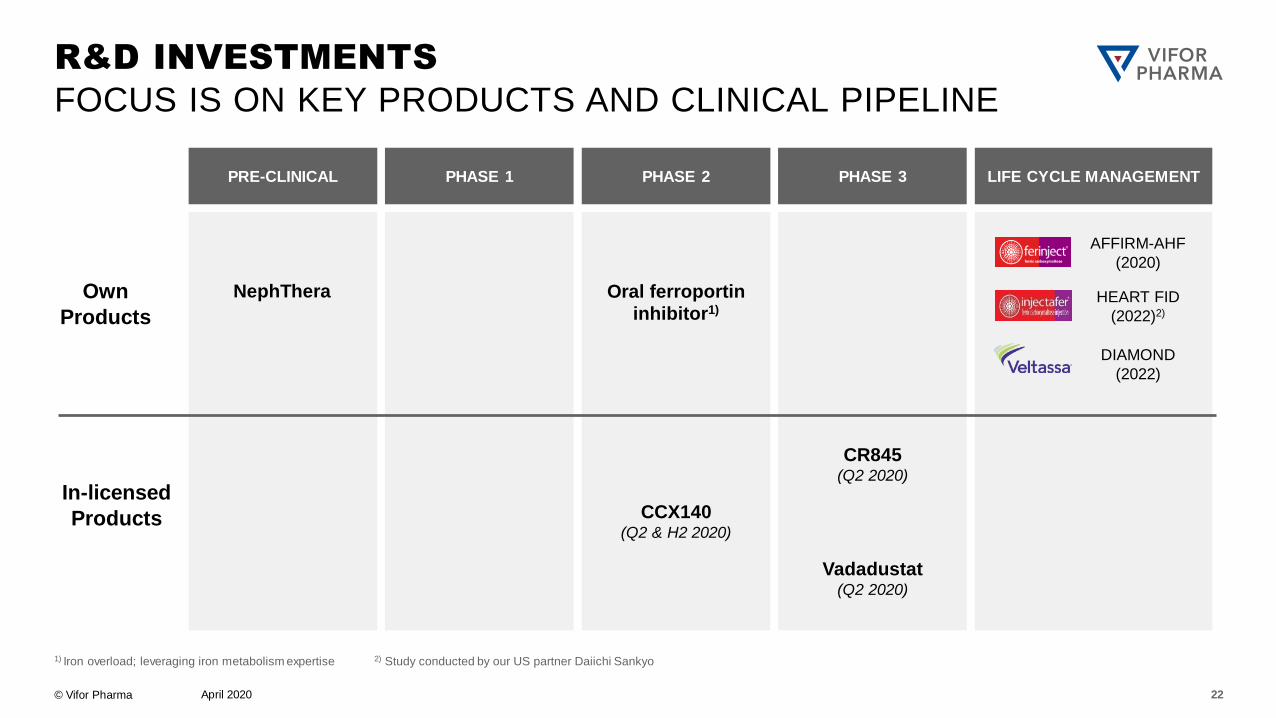
PRE-CLINICAL
April 2020
R&D INVESTMENTS
FOCUS IS ON KEY PRODUCTS AND CLINICAL PIPELINE
1) Iron overload; leveraging iron metabolism expertise 2) Study conducted by our US partner Daiichi Sankyo
PHASE 1 PHASE 2 PHASE 3 LIFE CYCLE MANAGEMENT
Own
Products
In-licensed
Products
Oral ferroportin
inhibitor1)
CCX140 (Q2 & H2 2020)
AFFIRM-AHF
(2020)
DIAMOND
(2022)
Vadadustat(Q2 2020)
CR845 (Q2 2020)
HEART FID
(2022)2)
NephThera
22
© Vifor Pharma
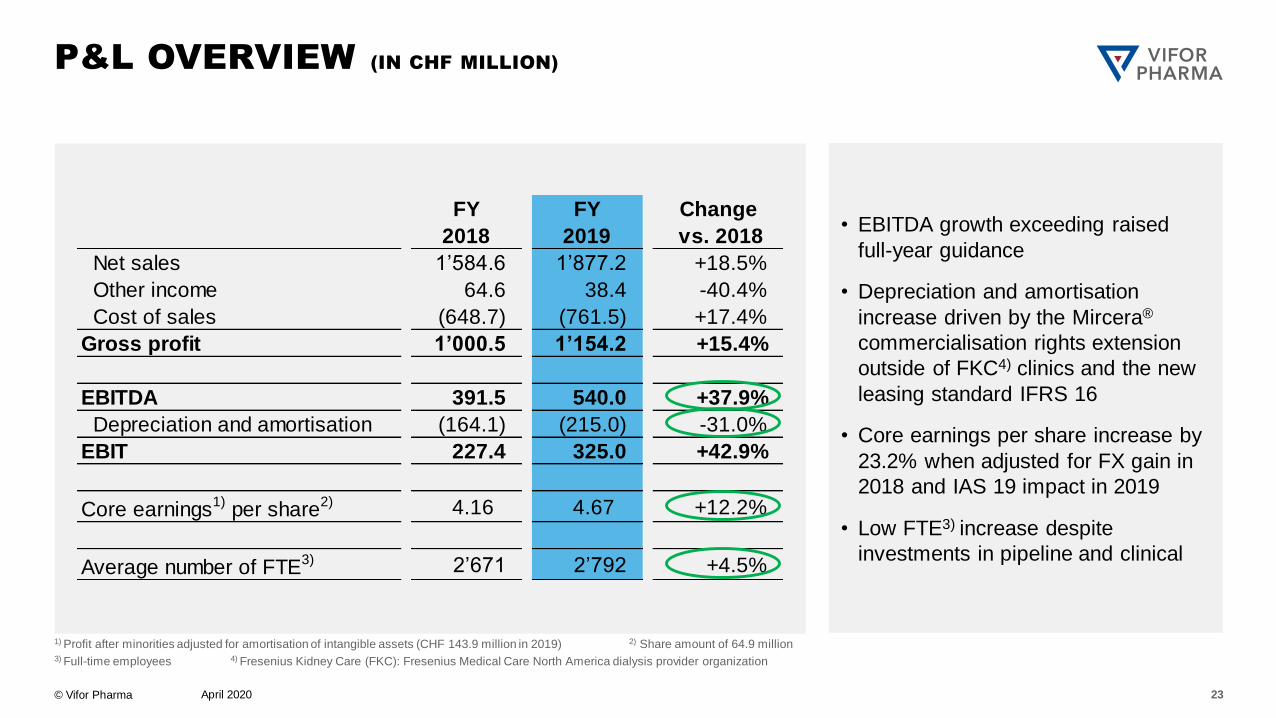
FY
2018
FY
2019
Change
vs. 2018
Net sales 1’584.6 1’877.2 +18.5%
Other income 64.6 38.4 -40.4%
Cost of sales (648.7) (761.5) +17.4%
Gross profit 1’000.5 1’154.2 +15.4%
EBITDA 391.5 540.0 +37.9%
Depreciation and amortisation (164.1) (215.0) -31.0%
EBIT 227.4 325.0 +42.9%
Core earnings1)
per share2) 4.16 4.67 +12.2%
Average number of FTE3) 2’671 2’792 +4.5%
April 2020
P&L OVERVIEW (IN CHF MILLION)
1) Profit after minorities adjusted for amortisation of intangible assets (CHF 143.9 million in 2019) 2) Share amount of 64.9 million3) Full-time employees 4) Fresenius Kidney Care (FKC): Fresenius Medical Care North America dialysis provider organization
• EBITDA growth exceeding raised
full-year guidance
• Depreciation and amortisation
increase driven by the Mircera®
commercialisation rights extension
outside of FKC4) clinics and the new
leasing standard IFRS 16
• Core earnings per share increase by
23.2% when adjusted for FX gain in
2018 and IAS 19 impact in 2019
• Low FTE3) increase despite
investments in pipeline and clinical
23
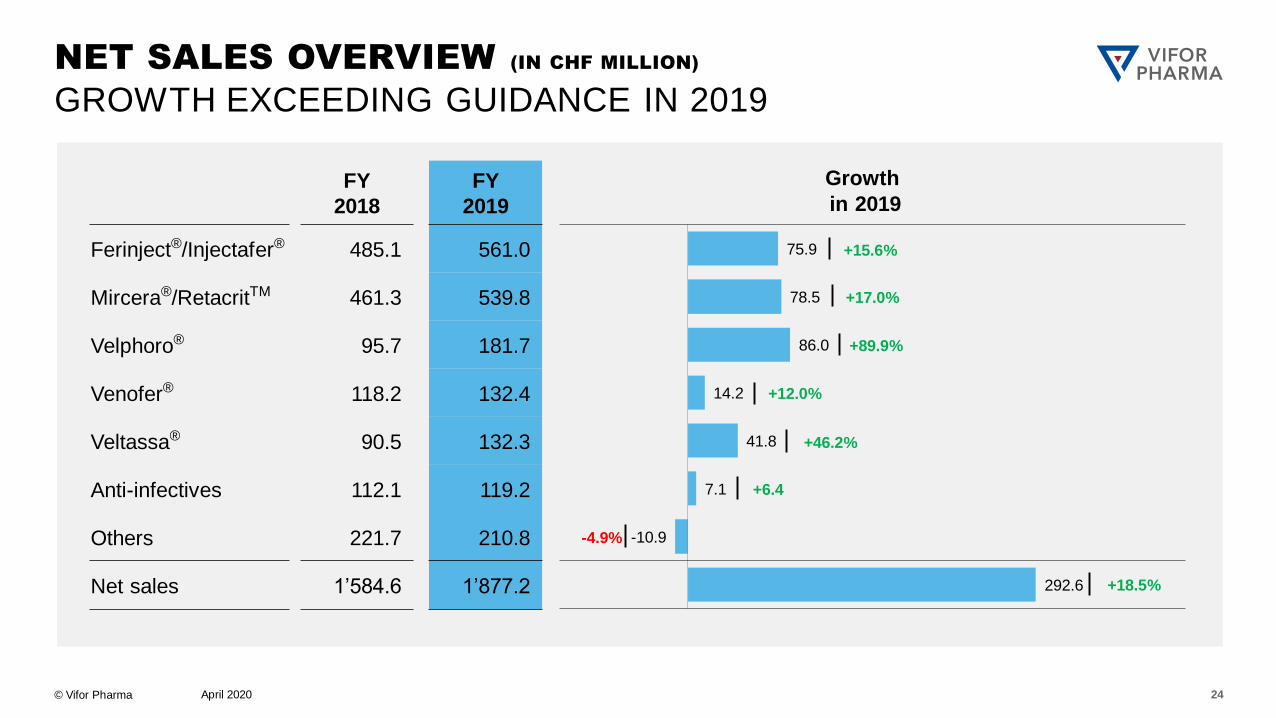
© Vifor Pharma
75.9
78.5
86.0
14.2
41.8
7.1
-10.9
292.6
+15.6%
+17.0%
+6.4
+89.9%
+12.0%
+46.2%
-4.9%
+18.5%
April 2020
NET SALES OVERVIEW (IN CHF MILLION)
GROWTH EXCEEDING GUIDANCE IN 2019
FY
2018
FY
2019
Ferinject®/Injectafer® 485.1 561.0
Mircera®/RetacritTM 461.3 539.8
Velphoro® 95.7 181.7
Venofer® 118.2 132.4
Veltassa® 90.5 132.3
Anti-infectives 112.1 119.2
Others 221.7 210.8
Net sales 1’584.6 1’877.2
Growth
in 2019
24
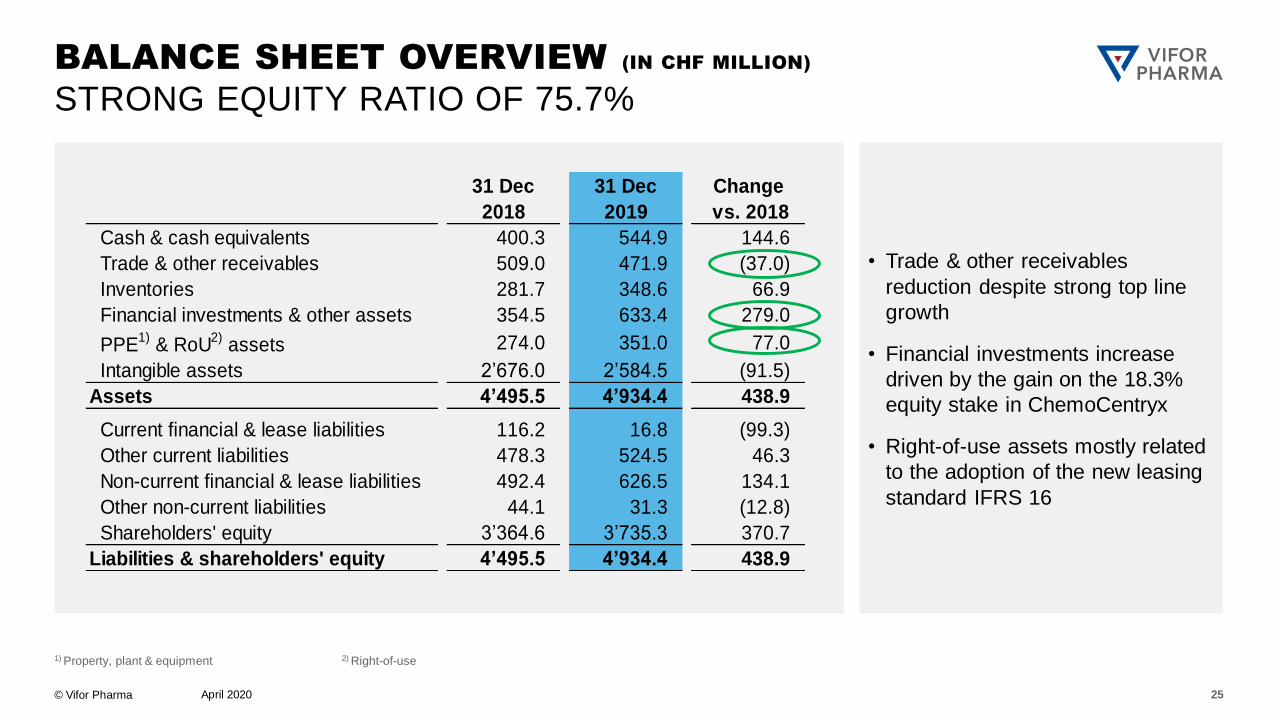
© Vifor Pharma
31 Dec
2018
31 Dec
2019
Change
vs. 2018
Cash & cash equivalents 400.3 544.9 144.6
Trade & other receivables 509.0 471.9 (37.0)
Inventories 281.7 348.6 66.9
Financial investments & other assets 354.5 633.4 279.0
PPE1)
& RoU2)
assets 274.0 351.0 77.0
Intangible assets 2’676.0 2’584.5 (91.5)
Assets 4’495.5 4’934.4 438.9
Current financial & lease liabilities 116.2 16.8 (99.3)
Other current liabilities 478.3 524.5 46.3
Non-current financial & lease liabilities 492.4 626.5 134.1
Other non-current liabilities 44.1 31.3 (12.8)
Shareholders' equity 3’364.6 3’735.3 370.7
Liabilities & shareholders' equity 4’495.5 4’934.4 438.9
• Trade & other receivables
reduction despite strong top line
growth
• Financial investments increase
driven by the gain on the 18.3%
equity stake in ChemoCentryx
• Right-of-use assets mostly related
to the adoption of the new leasing
standard IFRS 16
April 2020
BALANCE SHEET OVERVIEW (IN CHF MILLION)
STRONG EQUITY RATIO OF 75.7%
1) Property, plant & equipment 2) Right-of-use
25
© Vifor Pharma
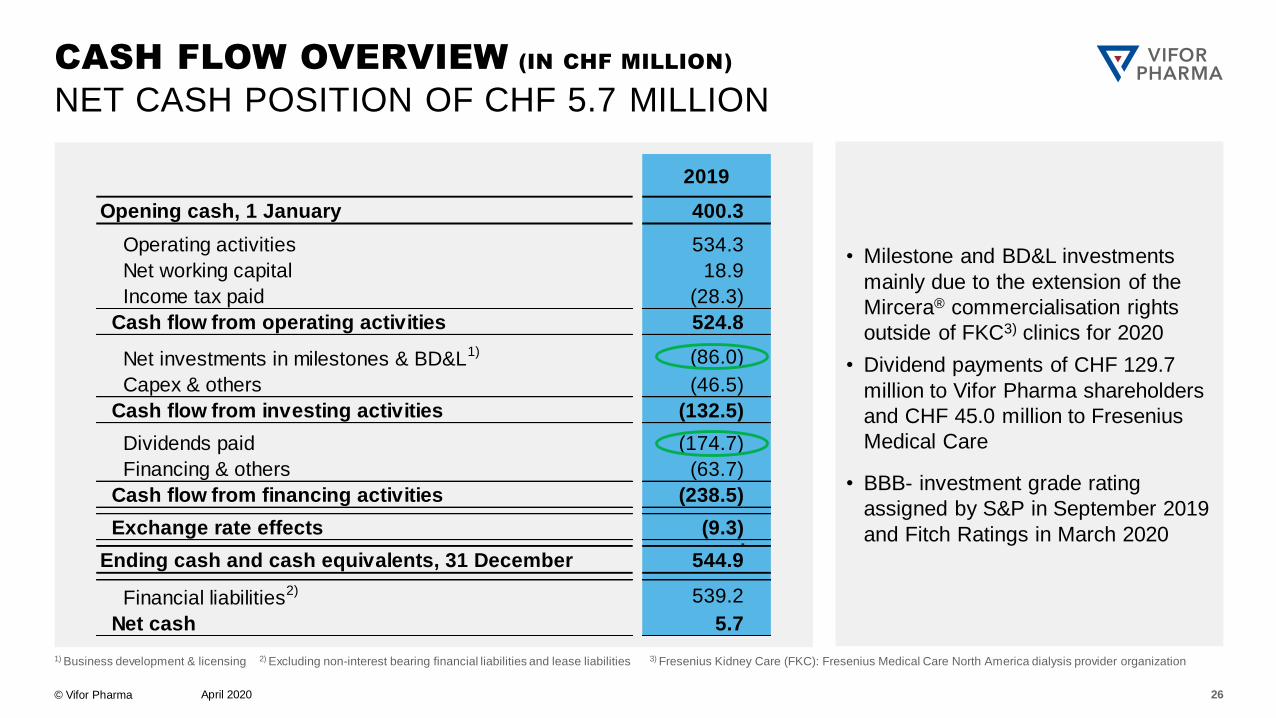
2019
Opening cash, 1 January 400.3
Operating activities 534.3
Net working capital 18.9
Income tax paid (28.3)
Cash flow from operating activities 524.8
Net investments in milestones & BD&L1) (86.0)
Capex & others (46.5)
Cash flow from investing activities (132.5)
Dividends paid (174.7)
Financing & others (63.7)
Cash flow from financing activities (238.5)
Exchange rate effects (9.3)-
Ending cash and cash equivalents, 31 December 544.9
Financial liabilities2) 539.2
Net cash 5.7
• Milestone and BD&L investments
mainly due to the extension of the
Mircera® commercialisation rights
outside of FKC3) clinics for 2020
• Dividend payments of CHF 129.7
million to Vifor Pharma shareholders
and CHF 45.0 million to Fresenius
Medical Care
• BBB- investment grade rating
assigned by S&P in September 2019
and Fitch Ratings in March 2020
April 2020 26
1) Business development & licensing 2) Excluding non-interest bearing financial liabilities and lease liabilities 3) Fresenius Kidney Care (FKC): Fresenius Medical Care North America dialysis provider organization
CASH FLOW OVERVIEW (IN CHF MILLION)
NET CASH POSITION OF CHF 5.7 MILLION
© Vifor Pharma
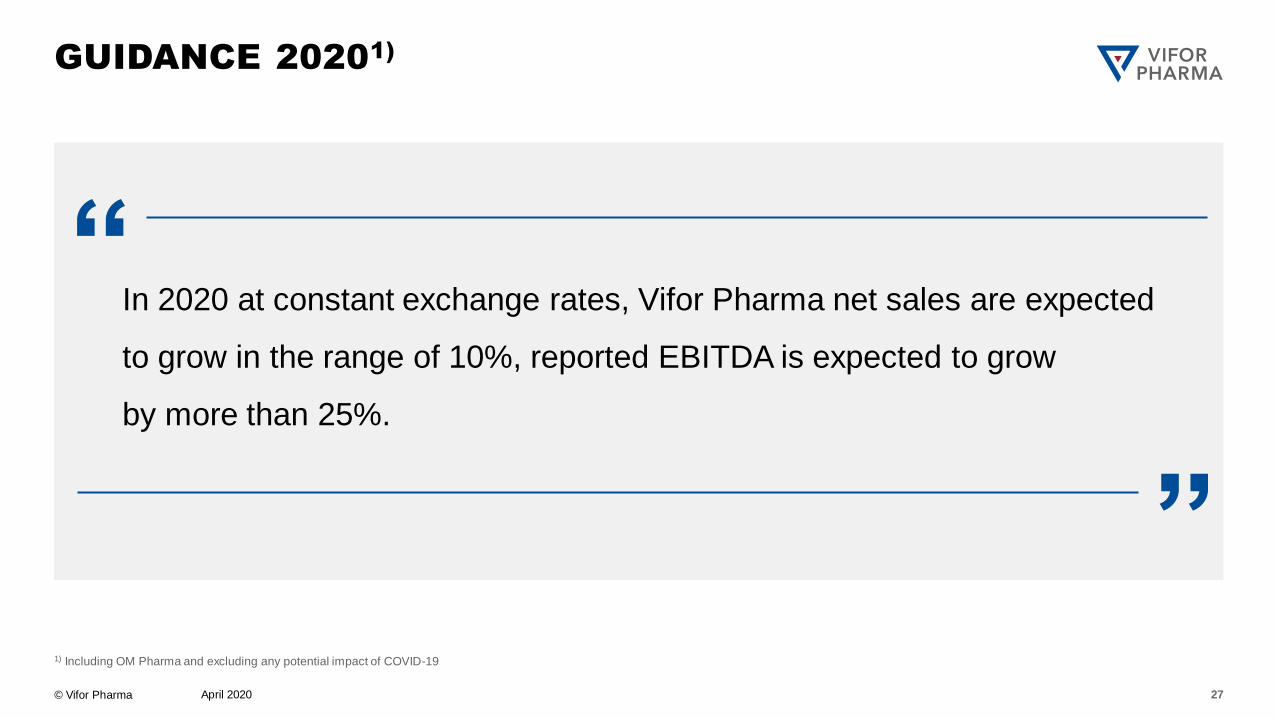
GUIDANCE 20201)
1) Including OM Pharma and excluding any potential impact of COVID-19
April 2020 27
In 2020 at constant exchange rates, Vifor Pharma net sales are expected
to grow in the range of 10%, reported EBITDA is expected to grow
by more than 25%.
© Vifor Pharma
OUTLOOK 2020
April 2020 28
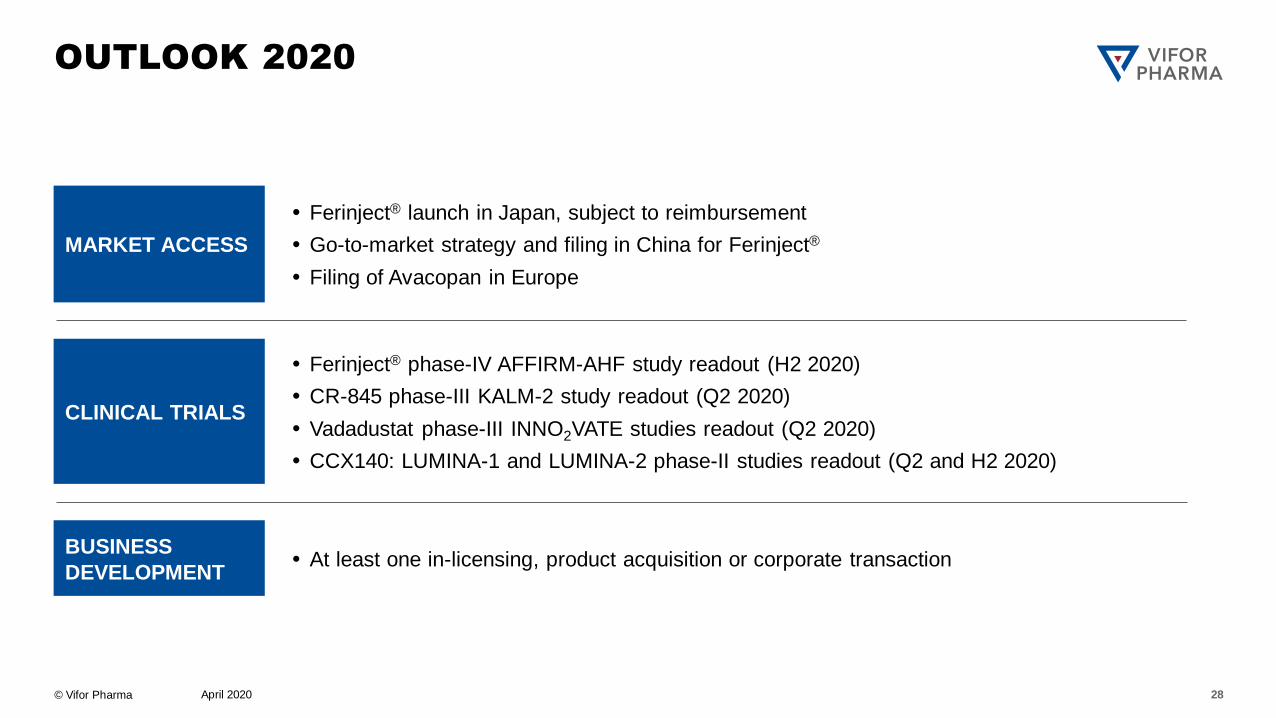
CLINICAL TRIALS
MARKET ACCESS
Ferinject® launch in Japan, subject to reimbursement
Go-to-market strategy and filing in China for Ferinject®
Filing of Avacopan in Europe
BUSINESS
DEVELOPMENT At least one in-licensing, product acquisition or corporate transaction
Ferinject® phase-IV AFFIRM-AHF study readout (H2 2020)
CR-845 phase-III KALM-2 study readout (Q2 2020)
Vadadustat phase-III INNO2VATE studies readout (Q2 2020)
CCX140: LUMINA-1 and LUMINA-2 phase-II studies readout (Q2 and H2 2020)
© Vifor Pharma
CONTACT INFORMATION
Colin Bond – CFO
Phone: +41 58 851 83 53
Email: [email protected]
INVESTOR RELATIONS
Julien Vignot – Head of Investor Relations
Phone: +41 58 851 66 90
Email: [email protected]
Laurent de Weck – Investor Relations Manager
Phone: +41 58 851 80 95
Email: [email protected]
April 2020 29
© Vifor Pharma
DISCLAIMER
Certain statements, beliefs and opinions in this presentation are forward-looking, which reflect the Company’s or, as
appropriate, the Company’s directors’ current expectations and projections about future events. By their nature, forward-
looking statements involve a number of risks, uncertainties and assumptions that could cause actual results or events to
differ materially from those expressed or implied by the forward-looking statements. These risks, uncertainties and
assumptions could adversely affect the outcome and financial effects of the plans and events described herein. A multitude
of factors including, but not limited to, changes in demand, competition and technology, can cause actual events,
performance or results to differ significantly from any anticipated development. Forward-looking statements contained
in this presentation regarding past trends or activities should not be taken as a representation that such trends or activities
will continue in the future. As a result, the Company expressly disclaims any obligation or undertaking to release any update
or revisions to any forward-looking statements in this presentation as a result of any change in expectations or any change
in events, conditions, assumptions or circumstances on which these forward-looking statements are based. Neither the
Company nor its advisers or representatives nor any of its of their parent or subsidiary undertakings or any such person’s
officers or employees guarantees that the assumptions underlying such forward-looking statements are free from errors
nor does either accept any responsibility for the future accuracy of the forward-looking statements contained in this
presentation or the actual occurrence of the forecasted developments. You should not place undue reliance on forward-
looking statements, which speak only as of the date of this presentation.
April 2020 30