pgem 2015 - bssm conference/pgem2015... · pgem 2015 abstract submissions. ... containers from...
TRANSCRIPT

Postgraduate Experimental
Mechanics Conference
Sponsored by
PGEM 2015
Abstract submissions

Page
Damage Measurement
Quantitative measurement of the J-integral of loaded cracks using 2D and 3D Digital Image Correlation - Selim Barhli
1
Data rich multiaxial fatigue characterisation of off-axis layers in GFRP laminates - Jens Ammitzbøll Glud
2
Imaging techniques for enhancing the characterisation of composite material and structures - James Thatcher
3
Overview of Office of Naval Research Funded Projects at Imperial College London - Emily Rolfe
4
Applied Measurements
Subsurface temperature and enthalpy measurement using fibre optic - Anggoro Wisaksono 5
Assessing the deformation accuracy of Digital Image Correlation in a wind tunnel environment - Laura Marimon Giovannetti
6
Measurement of Contact Stiffness - Kurien Parel 7
Investigation of shake-out effects on residual stress redistribution in ship structures - Jazeel R Chukkan
8
Analysis of high strength steels in transmission gears - Dewi Griffiths 9
Study of surface strain of the forearm skin at different postures - Zing Siang Lee 10
Materials Characterisation(1)
Determination of Young’s modulus through Virtual fields Method on PET (Polyethylene Terephthalate) containers from Stretch Blow Moulding - Narendran Anumula
11
Investigation of Lüders banding phenomenon in pipeline steel - Longjie Wang 12
Thermomechanics of welded structure - Palaniappan Jaya Seelan 13
Strain uncertainties of global and local DVC approaches in bone at organ level – Marco Curto
14
Measurement techniques
Implementation of a novel apparatus to perform Photoelastic Tomography analysis - Samantha Abrego
15
SHM of aluminium & composite structures using AE - Stephen Grigg 16
Novel inertial heterogeneous high strain rate tests for non-linear constitutive model parameters identification with the Virtual Fields Method - Sarah Dreuilhe
17
Investigation of Acoustic Emission Generated by Asperity Interaction in Mixed Lubrication Contacts - Simon Hutt
18
Improving Digital Volume Correlation accuracy in the presence of persistent ring artefacts: A case study using the double torsion technique – Matt Molteno
19
Virtual delta-t mapping technique using a local interaction simulation approach for improved location of acoustic emission damage events for aerospace - Ryan Marks
20
Materials Characterisation(2)
Strain heterogeneity in a cast Ni superalloy: comparing experimental and modellin results - Mohammed Luqmaan Fazal
21
A lattice misorientation approach to quantify inelastic strains during creep-fatigue deformation of 316H austenitic stainless steel - Rahul Unnikrishnan
22
Solid State Phase Transformation prediction and validation in SA 508 gr.3 cl.1 - Elise Chevallier
23
The Identification of Regions Containing Plastic Strain within the Heat Affected Zone of Welded 316L Using Thermoelastic Stress Analysis - Geoffrey P Howell
24

Quantitative measurement of the J-integral of loaded cracks using 2D and 3D Digital Image Correlation
S.M. Barhli1a, T.J. Marrow1
1 University of Oxford, Department of Materials, UK.
Abstract. The study of crack propagation requires methods to determine the elastic strain
energy release rate. Standard test specimens allow this to be calculated from simple measurements of applied loads. However, in non-standard situations, calculation or measurement of this value can be problematic, particularly when plasticity occurs or when the loading state cannot be perfectly defined. A compound approach using finite element analysis of full field displacement data obtained via digital image correlation techniques is presented here to tackle this problem. The method, based on the J-integral formulation, is robust to image noise. The finite element approach provides versatility and computational efficiency, which is of particular interest for the analysis of 3D datasets. Results presented here are from a controlled crack propagation experiment conducted on nuclear Gilsocarbon graphite observed by computed synchrotron X-ray tomography at the Diamond Light Source. Analysis of the experimental dataset demonstrates the measurement of the material’s R-curve behaviour. The application to complex crack shapes in 3D is also discussed.
1

DATA RICH MULTIAXIAL FATIGUE CHARACTERISATION OF OFF-AXIS LAYERS IN GFRP LAMINATES
J.A. Glud1, J.M. Dulieu-Barton2, O.T. Thomsen1,2 and L.C.T. Overgaard1
1Department of Mechanical and Manufacturing Engineering, Aalborg University E-mail: {jag,ott,lcto}@m-tech.aau.dk, web page: http://www.m-tech.aau.dk
2Faculty of Engineering and the Environment, University of Southampton Email: {janice,o.thomsen}@soton.ac.uk, web page: www.southampton.ac.uk/engineering
Keywords: Multiaxial Fatigue, Composites, Intralaminar Damage, Digital Image Processing Abstract: For more than four decades, experimental characterisation of fatigue damage in laminated composites has been a subject of great interest. The experimental characterisation has benefitted from major advances in non-destructive measurement techniques. However, the characterisation process from sampling test results to post processing data is, to a large extent, still manual. Therefore, accurate fatigue characterisation becomes a labour intensive task since many sampling points are required, which in turn generates large amounts of data for post-processing. The consequence of the manual characterisation process is often experimental campaigns of limited scope and size, and/or significant data parameterisation, which often makes it difficult to draw firm conclusions. The objective of the current research is to study the influence of multiaxial fatigue loading on initiation and growth of through-the-thickness tunnelling matrix cracks and modelling the observed phenomena. Uniaxial constant amplitude tension-tension fatigue tests on three different laminates are carried out. If the inherent anisotropy of GFRP is properly utilised, multiaxial stress states within each ply of a laminate can be obtained, even though only uniaxial loading is applied. The layups of the tested laminates are [0/-60/0/60]s, [0/-40/0/40]s and [0/902/0] and an example of through-the-thickness tunnelling matrix cracks in the [0/-60/0/60]s and [0/902/0] laminates can be seen in Figure 1. The fatigue damage evolution process of through-the-thickness tunnelling cracks is stochastic [2], which therefore requires data rich assessment to achieve statistical significant conclusions when material parameters are derived and new multiaxial fatigue models are developed. Therefore, the present study makes use of the novel automatic crack counting (ACC) method, [1] which enables a data rich assessment of fatigue failure properties such as crack density evolution, crack initiation strength (see Figure 2) and crack growth rate as function of loading cycles using only a limited amount of tests.
Figure 1: Through-the-thickness tunneling cracks in two different laminates.
Figure 2: SN-curve for two different layers in the [0/-60/0/60]s laminate. Cycles to crack initiation
varies over 2 decades thereby indicating the stochastic nature of crack initiation.
References: [1] Glud JA, Dulieu-Barton JM, Thomsen OT, Overgaard LCT. Automated counting of off-axis tunnelling cracks using digital
image processing. Compos Sci Technol 2015;Under Revi. [2] Glud JA, Dulieu-Barton JM, Thomsen OT, Overgaard LCT. Micro-mechanical Multiaxial Fatigue Model for Crack Density
Evolution and Stiffness Degradation. Proc. 20th Int. Conf. Compos. Mater., 2015.
2

Imaging techniques for enhancing the characterisation of composite material and structures
J. Thatcher1, D.A. Crump1, P. Bailey2, J.M. Dulieu-Barton1.
1Engineering Materials, Faculty of Engineering and the Environment, University of Southampton, UK 2Senior applications specialist, Dynamic systems, Instron, UK
INTRODUCTION
The mechanical testing of composite material and
structures predominantly utilises an array of point
measurement strain gauges, bonded to the surface of the test
specimen, to monitor and record the strain during testing.
These gauges can be used to monitor local changes in
stiffness. The present procedure for monitoring damage
evolution, within the aviation industry, is to stop the test,
return the load level to zero, and use ultrasonic inspection
techniques.
Currently, when a specimen is tested, the test machine is
generally operated in either displacement or load control.
Displacement control allows damage to evolve slowly, but
does not replicate “in service” conditions. Whereas load
control replicates “in service” conditions, but damage
evolution is rapid and not easily monitored. The project
investigates the possibility of controlling the rate of damage
evolution during a test, with the aid of infrared thermography
(IRT), giving this type of test the ability to replicate “in
service” conditions, with the damage evolution control of
displacement loading. The ability to control damage evolution
within a composite material or structure would allow more
information to be gained from a single test and reducing the
need for multiple repeat tests and their associated costs.
Unlike the point or local monitoring achieved by strain
gauges, IRT is a full-field technique which can be used to
globally monitor test specimens. Before the damage evolution
rate can be controlled, the infrared signature associated with
types of material damage must be defined. The present paper
describes a series of characterisation tests to identify potential
features within the signature that could be used to show
damage, and hence requiring a modification to the loading
conditions to control the rate of damage evolution. Although
the aim is to use the technique on composite materials,
metallic specimens were tested first due to the materials more
predictable damage growth behaviour.
CHARACTERISATION OF DAMAGE MARKERS
Initial trials were carried out using metallic specimens
manufactured from 316L stainless steel. The specimen
configuration was a single edge notch tensile (SENT). They
were subjected to cyclic waveform in load control and the
crack growth from the end of the notch was monitored and
recorded with an infrared detector at various points during its
lifecycle.
From the infrared images recorded, the data was post
processed using Thermoelastic stress analysis (TSA). TSA
takes the temperature change, captured by the infrared
detector, then utilises a lock-in algorithm, to determine the ΔT
and phase, which can then be calibrated into a stress sum. [1].
Figure 1 shows the ΔT image of a specimen after 60,000
cycles. It can be seen that the crack has propagated from the
starter notch and the highest ΔT value is just ahead of the
crack tip. With further post processing it was possible to locate
the crack tip.
The data available from the tests allows the crack tip
location to be monitored, therefore the maximum load would
be reduced to maintain a constant crack growth rate, or the
maximum ΔT value could be specified and the test load
adjusted to give a constant stress as the crack evolves.
The second phase of trials used specimens manufactured
from a composite material. Unidirectional glass fibre
reinforced epoxy was chosen, due to the materials partially
transparent properties, which permits visual inspection of
delaminated areas. Therefore, allowing the infrared signature
to be compared with a visual damage inspection.
The open hole configuration was used to introduce a stress
concentration within the specimen, and initiate damage
growth. The specimen hole diameter to width ratio used, was
based upon the British standard BS ISO 12817 [2]. The
specimen geometry was 250 mm, by 36 mm, by 1.8 mm thick,
with a 6 mm diameter hole in the centre of the specimen
Two different laminate lay-ups were chosen to give
different failure mechanisms: (+45°,-45°)3S to introduce
interlamina shear failure and subsurface defects and (0°,90°)3S
to introduce ply splitting, fibre failure, and other surface
defects.
The specimens were subjected to a cyclic waveform in
load control and damage evolution from the hole was
monitored and recorded using an infrared detector at a number
of points during the test. TSA post processing was carried out.
Figure 2 shows the ΔT image of the (0°,90°)3S laminate after
9750 cycles. From the data recorded ΔT threshold levels
would be set and the area within the levels considered as a
“damaged area” and the tests maximum load adjusted to
maintain a constant “damaged area” growth rate
FUTURE WORK
The threshold levels defining the damaged area need to be
specified. Therefore the tested specimens will undergo
fractographic analysis or computed tomography (CT) scan to
determine the exact failure/damage method and cross-
reference with the infrared signature. The test data will be
converted into format suitable for the test machine controller
via LabVIEW. A program will be created to monitor and
measure the temperatures, damaged areas and other features.
Then the information will be converted into a format suitable
for the test machine.
Figure 1: ΔT image of SENT specimen after 60000 cycles.
Figure 2: ΔT image of open hole specimen after 9750 cycles.
REFERENCES 1. Dulieu-Barton, J. (2012) Thermoelastic Stress Analysis. Optical Methods for
Solid Mechanics: A Full Field Approach, Chpt 8, p345-366.
2. BS ISO 12817:2013 Fibre-reinforced plastic composites – Determination of
open-hole compression strength.
3

Overview of Office of Naval Research Funded Projects at
Imperial College London Emily Rolfe, Imperial College London.
Office of Naval Research (ONR) projects have focussed on investigating the mechanical and high
strain rate properties of composite sandwich and composite monolithic structures. This includes the
resistance of composite panels to full-scale blast loading in air and underwater environments. The aim
of the research is to identify the best composite material combinations and structures for use in
demanding new naval applications.
During the air blast loading experiments, high speed photography, with 3D digital image correlation
(DIC), has been used to monitor the deformation of the rear-face of the panels. In a number of the
experiments a laser gauge was used to verify the data recorded by the DIC. Post-blast sectioning of
the composite panels has been used to confirm the DIC results and to further quantify the extent of the
damage. Indicators, such as the amount of debonding between the face-sheets and core and the
number of core cracks, enabled comparisons between the panels to be drawn. For underwater blast
loading experiments strain gauges have been used to monitor the structural response of the panels.
Research has been performed by Arora et al (1) to compare the responses to air blast loading of
composite sandwich panels with glass fibre reinforced polymer (GFRP) and carbon fibre reinforced
polymer (CFRP) face-sheets. The experimental and supporting numerical results confirmed that
CFRP panels had a superior blast performance. The effect of panel core material and thickness on
blast resistance has also been investigated. Kelly et al (2) subjected Styrene Acrylonitrile (SAN),
Polyvinyl Chloride (PVC) and Polymethacrylimide (PMI) cores to air blast loading. Each composite
panel in this experiment had GFRP face-sheets and equal foam core density and thickness. It was
concluded that SAN foam polymer suffered the least amount of damage out of the three polymers
tested. Arora et al (3) demonstrated the positive correlation between the core thickness and panel
stiffness and hence reduction in the peak amplitude of displacement in the panel.
Arora et al (3) have carried out underwater blast loading experiments on GFRP panels in order to
compare the performance with the same panels that underwent air blast loading. During air blast
loading the main damage mechanisms were front-face skin damage and core shear cracking.
Underwater blast loading, however, caused different damage mechanisms, namely severe core
crushing and skin fibre-breakage.
Experimental results from blast loading, along with results from appropriate laboratory evaluations,
have aided the development of analytical and computational models demonstrating the deformation
processes. The findings have highlighted the importance of support conditions and demonstrated the
strong influence that boundary stiffness has on panel deformation. Experimental and computational
data revealed that the boundary conditions are not necessarily fixed during high rate and impulsive
loading events.
Further research will be focussed on the use of different skin configurations for the face-sheets. The
relative performance of carbon-fibre skinned, glass-fibre skinned and other fibre materials, such as
ultra high molecular weight polyethylene (UHMWPE), with multiple different lay-ups will be
compared.
(1) Arora H, Hooper P, Linz PD, Yang H, Chen S, Dear J. Modelling the behaviour of composite
sandwich structures when subject to air-blast loading. The International Journal of Multiphysics
2012;6(3):199-218.
(2) Kelly M, Arora H, Dear JP. The Comparison of Various Foam Polymer Types in Composite
Sandwich Panels Subjected to Full Scale Air Blast Loading. Procedia Engineering; International
Symposium on Dynamic Response and Failure of Composite Materials, DRaF2014 2014;88:48-53.
(3) Arora H, Hooper PA, Dear JP. The Effects of Air and Underwater Blast on Composite Sandwich
Panels and Tubular Laminate Structures. Exp Mech 2012 01/01;52(1):59-81.
4

Subsurface temperature and enthalpy measurement using fibre optic technology in hydrothermal system
Anggoro Wisaksono, University of Glasgow
Resource risk which includes exploration, development and technology is identified as generic risks in geothermal energy projects. Subsurface temperature and enthalpy measurements will be benefited for resource risk mitigation in monitoring produced fluids to evaluate the productivity of geothermal reservoirs and to optimize the economic output of geothermal energy. Most of the Indonesia's geothermal system is two-phase hydrothermal, with liquid or vapour dominated. An experiment using the current available high resolution single mode OTDR fibre optic distributed Raman sensor for subsurface temperature and enthalpy measurement will be conducted. High resolution single mode fibre optic distributed Raman sensor with boiling tank as geothermal reservoir will be assembled to simulate the real condition in geothermal reservoir in a two-phase hydrothermal system. Geothermal energy provides promising potential to solve the government estimated power crisis in 2019, since Indonesia has the largest estimated geothermal energy reserves in the world at approximately 27 GW or 40% of the global total, which ironically, only less than 5% of the reserves are being utilised.
5

Assessing the deformation accuracy of Digital Image Correlation in a wind tunnel environment
L. Marimon Giovannetti1, [email protected], J. Banks2, S.W. Boyd3, S.R. Turnock4
This paper presents the assessment of DIC accuracy for an experimental methodology that quantifies the structural behaviour of a flexible aerofoil structure under fluid loading in a wind tunnel environment. This paper aims to highlight some of the challenges associated with performing DIC in this environment and investigate their impact on deformation accuracy.
The structural response of a flexible foil is measured subject to aerodynamic loading in the 3.5 m x 2.4 m R.J. Mitchell wind tunnel at the University of Southampton. The cameras were placed outside of the tunnel working section behind a large viewing window.
The full field structural deformation technique utilises high speed three-dimensional Digital Image Correlation (DIC). The measurement accuracy of the full-field optical measurement system is quantified for translation and rotation in static and transient conditions against high precision motorised stages. The influence of wind tunnel vibrations on camera motions is assessed measuring the motion of the wind tunnel walls using the same DIC methodology. Moreover, the influence of glass distortion and light-filters are investigated to understand the effects of diffraction of light passing through the glass and the influence of the white light histogram on the DIC speckle pattern. The impact on the full-field results from relatively low-resolution, high speed cameras is assessed by comparing with a set of identical high-resolution images binned to the resolution of the high speed cameras. Finally, two calibration plates are compared to investigate the effects of the calibration plate on the field of view covered by the specimen.
1 PhD Student, University of Southampton, Fluid Structures Interaction Group 2 Research Fellow, University of Southampton, Fluid Structures Interaction Group 3 Associate Professor, University of Southampton, Fluid Structures Interaction Group 4 Professor, University of Southampton, Fluid Structures Interaction Group
6

Measurement of Contact Stiffness
Kurien Parel Department of Engineering Sciences, University of Oxford
When two bodies are in contact and subject to loading, the total compliance (deformation per unit load) is greater than the sum of the bulk compliance values of each body. This is because there is an additional compliance in the contact region, since real contact surfaces are rough. This additional compliance is called the contact compliance and its reciprocal is the contact stiffness.
The knowledge of the contact stiffness values of all the contacts in a system is required for computing the total stiffness value of the system, which is needed to determine its natural frequency, an important parameter in the design of components such as turbines. Systems frequently need to be designed such that their natural frequencies are not near the operational loading frequencies, to avoid excessive vibration and possible failure.
Both normal and tangential contact stiffness values have been measured using a new rig. In this rig, normal loading is applied onto a specimen pressed by two pads. In the case of measuring normal contact stiffness, the normal load is applied incrementally and a photograph of the contact region is taken for each increment. Digital image correlation is used to find the relative displacements of two points near the contact on either side of the contact to find the contact displacement values for different load increments. The slope of the load-contact displacement plot provides the contact stiffness values.
To find the tangential stiffness values, a fixed normal load is applied onto the pads and the specimen. A single actuator is used to apply incrementally a tangential load. As in the previous case, photographs of the contact region are used to find the relative tangential displacement between two adjacent points on both sides of the contact surface for each load increment, and the slope of the tangential load-tangential contact displacement curve provides the tangential contact stiffness values.
7

Investigation of shake-out effects on residual stress redistribution in ship structures
J. R. Chukkan, M. E. Fitzpatrick, E. Eren
In ship structures, hull stresses are very important that they almost always contribute to ship structural
failures. Welding residual stresses (usually tensile in the weldments) have a direct influence on hull stresses. In ship
structures, during occasional overloads, shake-down phenomenon will occur. Although structure is considered to be
safe after elastic shake-down, it is necessary to understand the redistributed residual stresses followed by shake-
down for better understanding of hull stresses and fatigue crack growth.
A structure when applied with a cyclic load, during first cycle (or first few); a finite amount of plastic
deformation accompanied with a change in residual stress makes the structure respond elastically for the same load.
This phenomenon is called elastic shake-down. Elastic shake-down limit is the limit above which structure may fail
either due to reverse plasticity (low cycle fatigue) or ratchetting (plastic collapse). In ship structures, longitudinal
stiffeners and transverse members are welded on to the bottom decks as load bearing members as shown in figure
1. The longitudinal end connections are very critical in fatigue crack growth in this structure. Hence, finding elastic
shake-down limits and further studying the shake-down effect on residual stress redistribution of these members are
very important.
The experiments for this project are divided in to three stages. Initially, the specimen manufacturing, a
small portion of the double bottom deck of a ship which is a GMAW welded AH 32 ship steel structure (figure 1),
is going to be used. Secondly, the residual stress measurement using neutron diffraction on a relevant lab coupon
from the structure in conjunction with cyclic load equivalent for shakedown behaviour (obtained from FE models)
is carried out to study the redistribution of residual stresses. Finally, the structure is studied for the fatigue crack
growth behaviour.
Figure 1: Ship double bottom
This project is intended to understand the redistribution of residual stresses during shakedown in critical
areas of ship structure and to further investigate the fatigue crack growth in the structure considering redistributed
residual stresses.
8
Analysis of high strength steels in transmission gears
D Griffiths, A. Clarke, HP Evans, S Evans, R. Pullin Cardiff School of Engineering, Cardiff University, UK
Traditionally, the design and analysis of gears has been concluded using Hertzian contact equations, simple bending calculations and basic software. In recent years, the use of FE (Finite Element) analysis has increased significantly as computational power increases and software improves. No longer is complex coding necessary in FE analyses, instead user friendly graphical interfaces have made FE analysis more common for everyday engineering applications.
Gears represent the most common means of transferring power within transmission systems. As well as transferring rotational power, they also allow for changes of ratios, powers and torques depending on the input and output criteria. These transmission gears form the basis of power transfer in many types of machinery from wind turbines to automotive/motorsport transmission systems. In both these applications, reliability, performance and service life are a key criteria in design.
Gears that are exposed to high loadings are often exposed to heat treatments which harden the external layer of the material, making it less susceptible to damage through rolling, sliding, overloading’s and contact stresses. Case hardening is a process commonly associated with hardening of gears and has been modelled in FE for numerous components including bearing raceways, splines and rolling elements. Although some modelling of case hardened gears is apparent in literature, very little data exists which quantifies the increase in strength and resistance to damage.
During the project an understanding of the penetration of heat treatments through the gear profile needs to be understood and quantified. Additionally, through the use of dog-bone tensile specimens, the additional strength in a case hardened layer needs to be quantified, and the material data used to improve FE analysis. Through physical measurement using techniques such as DIC (Digital Image Correlation), FE models can be validated.
This research aims to improve the understanding of the mechanisms of yield and post-yield behaviour within a case carburised gear tooth as it experiences high load. Increasing this understanding of gear and material behaviour will lead to further confidence in gear design techniques and allow further development to improve gear performance, such as mass reductions.
This research aims to provide the industrial sponsor with a set of design rules for the FE modelling of case hardened gears. It will outline the most accurate means of modelling materials, geometry and components to achieve the most accurate results with maximum computational efficiency.
9

Study of surface strain of the forearm skin at different postures Lee, Z1; Gerhardt, L.-C.2; Maiti, R1; Franklin, S.E.2; Lewis, R1; Carré, M.J.1
1Department of Mechanical Engineering, Sir Frederick Mappin Building, University of Sheffield, UK 2Philips Research, High Tech Campus 4, 5656AE Eindhoven, The Netherlands. 3Department of Materials Science and Engineering, University of Sheffield, UK
The mechanical behaviour of the skin is very complex with different tribological and mechanical properties at different location. It also exhibits anisotropic, adhesive and heterogeneous material properties with non-linear stress strain relationship. The knowledge of these properties is essential for cosmetic and clinical research. The study focuses on using 3D-Digital Image Correlation (DIC) system to measure the surface strain of the human skin, which the volar forearm is the case study of this work.
The surface strain was measured using a 3D DIC system from Correlated Solutions. It consists of two 5MP AVT Pike cameras (2452 x 2452 pixels) with an image capture rate of 5 frames per second. The volar forearm skin was imaged from when the elbow joint was positioned from 90 degrees flexion to the full extension of the hand. The images were then analysed using the DIC software, which would show the relative strain of the volar forearm from the different postures to its initial position.
The result has shown that the volar forearm had a maximum of 25% increase in surface strain when the hand was fully extended, which the high strain occurred at the part of volar forearm that was nearer to the elbow joint.
The future work will involve in investigating the behaviour of the strain with the application of skin creams in order to study their influence on the skin.
This work was supported by EU Marie Curie Industry-Academia Partnerships and Pathways: UNITISS, Understanding Interactions of Human Tissue with Medical Devices, FP7-PEOPLE-2011-IAPP/286174
10

Determination of Young’s modulus through Virtual fields Method on PET (Polyethylene Terephthalate) containers from Stretch Blow
Moulding
Narendran Anumula1, Gary Menary2
1 Advanced Material Processing, Queen’s University Belfast 2 Advanced Material Processing, Queen’s University Belfast
The objective of this project is to develop a model for PET (Polyethylene Terephthalate) to determine the Young’s modulus at room temperature as a function of thermal and strain history. This is achieved through inverse analysis whereby PET pre-forms are heated above Tg (~100°C) and bi-axially stretch blown without a mould whilst monitored via high speed camera. The strain fields during blowing are obtained through Digital Image Correlation (DIC). The free-blown containers are then subsequently pressurised at room temperature within the linear deformation ranges whilst monitored by a camera. From anisotropic Hooke’s law and the virtual fields method, the corresponding room temperature Young’s modulus in the axial and hoop direction is obtained on the free-blown bottle.
References
[1] Fabrice Pierron, Michel Grediac, The virtual Fields Method: Extracting Constitutive Mechanical Parameters from Full-field Deformation Measurements, Springer Science + Business Media, LLC 2012.
11

Investigation of Lüders banding phenomenon in pipeline steel
Longjie1, Elvin Eren2, Simon Smith2, Bin Wang1, Guiyi Wu2
1 – Brunel University; 2 – TWI Ltd.
Discontinuous yielding, known as Lüders plateau, is a macroscopic phenomenon that is manifested with localised deformation and inclined propagating bands, which has been observed experimentally in tensile specimens loaded predominantly in tension. Lüders plateau has been shown to have adverse effect on the integrity of structures. For example, it has been well established that Lüders plateau causes localised curvature in pipes loaded in pure bending, and may potentially result in premature buckling before the pipe is globally plastically deformed. However, the influence of Lüders plateau on fracture capacity of structures is yet to be understood. Furthermore, In Engineering Critical Assessment (ECA) of pipeline girth welds, the stress-strain curve of material with a Lüders plateau is usually idealised as ‘flat’ over the extent of plateau, neglecting the upper yield point. This is believed to be the global stress-strain behaviour measured in tensile tests, and may not correctly capture the real stress-strain behaviour over the Lüders plateau, due to the localised deformation nature of Lüders behaviour.
This work aims at understanding the characteristics of Lüders band phenomenon on a typical pipeline steel of grade X65. The experiment programme consists of three tasks, including: 1. Lüders band on plain tensile specimen; 2. Effect of stress concentration on Lüders band evolution; 3.extraction of the underlying stress-strain behaviour during Lüders deformation.
Task 1 and Task 2 will use plain tensile specimens and notched tensile specimens, respectively, with the same dimensions of the tensile strips. These specimens will be loaded in tension under displacement control and the digital image correlation (DIC) will be utilised to monitor the full-field strain evolution.
Task 3 uses a tri-layer test specimen that consists of three bars bonded together, as illustrated in Figure 1. The tri-layer specimen (200 mm long, 25 mm wide, 3 mm thick for carbon steel, 6 mm thick for each stainless steel) attempts to use the stainless steel to control the deformation of the carbon steel so that the straining is uniform. This means that the strain can be correctly measured. When the properties of the stainless steel are separately measured, the stress in the pipeline steel can be calculated. This experiment is expected to establish the underlying stress-strain response over the extent of Lüders plateau. The underlying stress-strain response will be later used in finite element modelling for validation, and potentially provide implications on treatment of Lüders plateau in ECA.
Figure 1 Three-layer test specimen
12

Heat Chamber Infrared
Detector
THERMOMECHANICS OF WELDED STRUCTURE
P.J. Seelan1, .JM. Dulieu-Barton1, F. Pierron1
1Engineering Materials, Faculty of Engineering and the Environment, University of Southampton, UK
INTRODUCTION Residual stress or locked-in stress is the stress that exists in an object without the presence of external loads. In welding processes, residual stresses develop primarily due to the differential heating and cooling rates experienced at the weld joint. Residual stress can cause premature and catastrophic failure of a component when combined with in-service stress. Therefore, it is necessary for residual stresses to be accounted for to maintain the structural integrity of the components. The development of thermography based residual stress measurement technique is attractive since it is non-destructive, portable, and full-field. When a material is cyclically loaded, temperature variations can be observed on the surface of the material. These temperature variations are caused by two different heat sources: thermoelastic source [1], and the dissipative source [2]. The dissipative heat source is due to local defects in lattice or movement of dislocations, which causes an increase in the mean temperature. This project aims to measure and characterise the local dissipative heat source in the weldment and potentially relate it to the existing residual stresses.
METHODOLOGY Preliminary measurements of dissipative heat source have been conducted using a 316L stainless steel strip specimen of 2 mm thickness. The specimen was cyclically loaded at a frequency of 15 Hz using a servo-hydraulic test machine. A maximum stress, σMAX = 250 MPa was applied with a load ratio, Rσ = 0.1. The resulting temperature variations were recorded using a Cedip 480M infrared detector with a noise equivalent temperature difference (NETD) of 15.56 mK. The temperature rise due to dissipative heat source is well below the NETD of the detector. This has been overcome by protecting the specimen from parasitic heat sources, i.e. external radiative reflections, by enclosing the specimen in a specially designed chamber. The chamber consists of polystyrene foam covered by aluminium foil on the outer side and black paper on the inner side (see Figure 1).
Figure 1 Experimental Setup
A reference specimen made of the same material was also placed adjacent to the specimen mounted on insulating tape attached to the chamber. The purpose of the reference specimen is to ensure that any thermal exchanges between the specimen and the environment in the chamber can be accounted for. Also, application of the thermomechanical equation ensures that the heat lost through conduction, convection, and radiation is taken into consideration when calculating the dissipative heat source. The thermomechanical equation is given as follows:
thDtht
SdCktt
C +=+D−
∂∂
−∂∂
−=122
)0( tθρθθθρ (1)
where 1d is the dissipative source, thS is the thermoelastic
source, ρ is the material density, C is the specific heat, kis the thermal conductivity, 2D is the Laplacian operator, θ is the local temperature variation of the specimen due to the thermomechanical sources, and D
th2t is a time constant
characterizing the convection and radiation losses. The temperature variation obtained in the form of 2D temperature distribution maps from the infrared detector is processed by using methods developed by Connesson et al. [2] involving spatial averaging and smoothing to reduce the noise; any spatial variations in the specimen temperature are accounted for by subtracting the initial thermal image from subsequent images The detection threshold of the set up was assessed by processing the data of an experiment performed with the actuator load fixed at mean stress. The resulting dissipative heat source can be considered as noise. This was repeated three times. The detection threshold was set to be the two standard deviation of these measurements. Any measurement made above the two standard deviation level has a confidence level of 95%.
RESULTS AND DISCUSSION Preliminary results of dissipative heat sources are shown in Figure 2. The detection threshold (two standard deviation) is indicated by the red line.
Figure 2 Dissipative heat source
From the dissipative heat source it can be seen that there is a peak in the initial cycles and the source is almost constant in the subsequent cycles. The peak is attributed to microplastic cyclic adaptation and the constant source is due to viscoelasticity. The former is due to irreversible movements of dislocation whereas the latter is due to reversible movement of anchored dislocation.
CONCLUSION AND FUTURE WORK It can be seen that the current setup is adequate to measure the spatially averaged heat source of a homogenous stress field. A dedicated image processing technique has to be developed for welds which have heterogeneous material characteristics. The relationship between dislocation density, residual stress, and dissipative heat source also has to be determined to enable residual stress measurement using dissipative heat source.
REFERENCE 1. Dulieu-Barton, J.M., & Stanley, P., 1998. The Journal of Strain Analysis
for Engineering Design, 33, pp. 93-104.2. Connesson, N., Maquin, F., Pierron, F., 2010. Experimental Mechanics,
51, pp. 23-44.
0 2 4 6 8 10-2
0
2
4
6
8
x 104
Time (s)
Sou
rce
(Wm
-3)
Dissipative Heat Source± 2 × Standard Deviation
13
STRAINUNCERTAINTIESOFGLOBALANDLOCALDVCAPPROACHESINBONEATORGANLEVEL
PalancaM.1,CurtoM.2,TozziG.2,Dall’AraE.3,CristofoliniL.11UniversityofBologna,Bologna,Italy
2UniversityofPortsmouth,Portsmouth,UK3UniversityofSheffield,Sheffield,UK
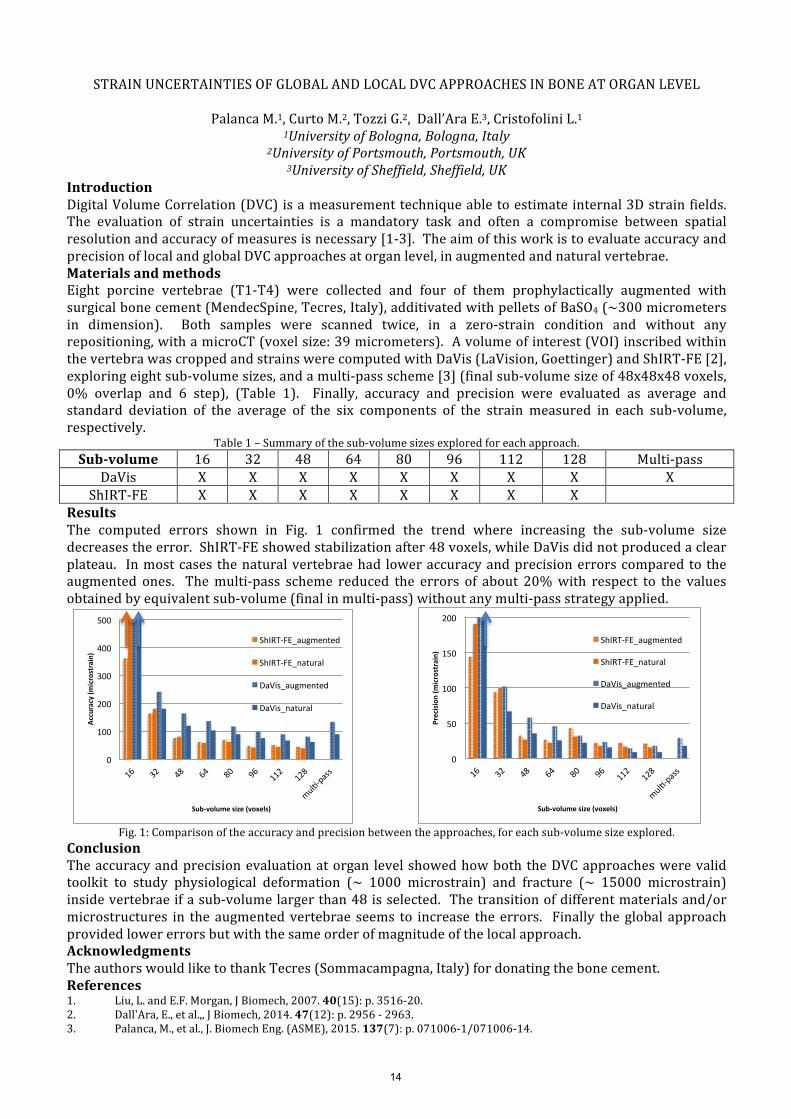
IntroductionDigitalVolumeCorrelation(DVC)isameasurementtechniqueabletoestimateinternal3Dstrainfields.The evaluation of strain uncertainties is a mandatory task and often a compromise between spatialresolutionandaccuracyofmeasuresisnecessary[1-3].TheaimofthisworkistoevaluateaccuracyandprecisionoflocalandglobalDVCapproachesatorganlevel,inaugmentedandnaturalvertebrae.MaterialsandmethodsEight porcine vertebrae (T1-T4) were collected and four of them prophylactically augmented withsurgicalbonecement(MendecSpine,Tecres,Italy),additivatedwithpelletsofBaSO4(~300micrometersin dimension). Both samples were scanned twice, in a zero-strain condition and without anyrepositioning,withamicroCT(voxelsize:39micrometers).Avolumeofinterest(VOI)inscribedwithinthevertebrawascroppedandstrainswerecomputedwithDaVis(LaVision,Goettinger)andShIRT-FE[2],exploringeightsub-volumesizes,andamulti-passscheme[3](finalsub-volumesizeof48x48x48voxels,0% overlap and 6 step), (Table 1). Finally, accuracy and precision were evaluated as average andstandard deviation of the average of the six components of the strain measured in each sub-volume,respectively.
Table1–Summaryofthesub-volumesizesexploredforeachapproach.Sub-volume 16 32 48 64 80 96 112 128 Multi-pass
DaVis X X X X X X X X XShIRT-FE X X X X X X X X
ResultsThe computed errors shown in Fig. 1 confirmed the trend where increasing the sub-volume sizedecreasestheerror.ShIRT-FEshowedstabilizationafter48voxels,whileDaVisdidnotproducedaclearplateau. Inmostcases thenaturalvertebraehad loweraccuracyandprecisionerrorscomparedto theaugmented ones. Themulti-pass scheme reduced the errors of about 20%with respect to the valuesobtainedbyequivalentsub-volume(finalinmulti-pass)withoutanymulti-passstrategyapplied.
Fig.1:Comparisonoftheaccuracyandprecisionbetweentheapproaches,foreachsub-volumesizeexplored.ConclusionTheaccuracyandprecisionevaluationatorgan levelshowedhowboththeDVCapproacheswerevalidtoolkit to study physiological deformation (~ 1000 microstrain) and fracture (~ 15000 microstrain)insidevertebraeifasub-volumelargerthan48isselected. Thetransitionofdifferentmaterialsand/ormicrostructures in theaugmentedvertebrae seems to increase theerrors. Finally theglobal approachprovidedlowererrorsbutwiththesameorderofmagnitudeofthelocalapproach.AcknowledgmentsTheauthorswouldliketothankTecres(Sommacampagna,Italy)fordonatingthebonecement.References1. Liu,L.andE.F.Morgan,JBiomech,2007.40(15):p.3516-20.2. Dall'Ara,E.,etal.,,JBiomech,2014.47(12):p.2956-2963.3. Palanca,M.,etal.,J.BiomechEng.(ASME),2015.137(7):p.071006-1/071006-14.
0
100
200
300
400
500
16
32
48
64
80
96
112
128
mul.-pass
Accuracy(m
icrostrain)
Sub-volumesize(voxels)
ShIRT-FE_augmented
ShIRT-FE_natural
DaVis_augmented
DaVis_natural
0
50
100
150
200
16
32
48
64
80
96
112
128
mul.-pass
Precision(m
icrostrain)
Sub-volumesize(voxels)
ShIRT-FE_augmented
ShIRT-FE_natural
DaVis_augmented
DaVis_natural
14

Implementation of a novel apparatus to perform Photoelastic Tomography analysis.
Photoelasticity is a well-known experimental stress analysis technique based on the study of the light polarization when a light ray is passed through a birefringent material under load. One of the branches of photoelasticity is 3D photoelasticity, where internal stress measurements may be made by stress freezing a polymer model of an engineering component under a thermal cycle, followed by sectioning the sample in thin slices to perform a 2D photoelastic analysis [1]. However this procedure is time consuming, destroys the specimen and if the experiment intends to measure the internal stress in more than one axis, it has to be repeated [2]. Many industries such as telecommunications, automotive, aerospace and architecture are interested in internal and residual stresses but these destructive drawbacks of the technique are very limiting [3].
In order to overcome these drawbacks of 3D photoelasticity, an alternative technique has been proposed. Integrated photoelasticity or photoelastic tomography, is a technique that allows internal stress analysis without the need of destroying the specimen [4]. Photoelastic tomography can be taken as an optical tomography, however it is not possible to apply directly the equations used in conventional tomography since the mathematical approach of the Radon equation is just for scalar fields but photoelastic tomography intends to obtain a tensor stress field. Photoelastic tomography could give promising results on the internal stress reconstruction however some problems need to being overcome. For example, the fact that the directions and values of the principal stresses vary through the thickness of the material makes data difficult to process and to relate the measured data with the non-linear stress distribution. In order to resolve this, an optical equivalence was proposed, where three characteristic parameters (axis of the retarder ‘’θr’’, the retardation of the retarder ‘’2Δ’’ and the rotatory power of the rotator ‘’𝛾𝛾’’) are analysed with a digital photoelasticity method (Phase stepping or Fourier analysis)[5]. Nevertheless some drawbacks such as noise in the light system and the priori assumptions such as symmetry of the specimen or weak birefringence has to be considered making the analysis not general [6]. Further investigation and improved experimentation has to be performed in order to achieve a full reconstruct of the internal stresses under general conditions.
The proposed experimental setup for this technique includes a 635 nm laser as a light source, a spatial filter, a plano-convex lens, a polariser, an immersion tank filled with a fluid that matches the refractive index of the specimen in order to avoid light refraction, an analyser, a converging lens and finally a CCD camera connected to a computer in order to process the acquired images [7]. The specimen is rotated in the light path and multiple images are recorded for the tomographic reconstruction.
References: 1. Forte, P., A. Paoli, and A. Razionale, A CAE approach for the stress analysis of gear models by 3D digital
photoelasticity. Int J Interact Des Manuf, 2015. 9(1): p. 31-43. 2. Doyle, J.F. and J.W. Phillips, Manual on experimental stress analysis. 1989: Society for Experimental.3. Aben, H., Photoelasticity of glass, ed. C. Guillemet. 1993, Berlin ; New York: Berlin ; New York : Springer-Verlag, c1993.4. Aben, H.K., Integrated Photoelasticity as Tensor Field Tomography, in Photoelasticity, M. Nisida and K. Kawata,
Editors. 1986, Springer Japan. p. 243-250.5. Tomlinson, R. and E. Patterson, The use of phase-stepping for the measurement of characteristic parameters in
integrated photoelasticity. Experimental Mechanics, 2002. 42(1): p. 43-50.6. Aben, H.K., J.I. Josepson, and K.J.E. Kell, The case of weak birefringence in integrated photoelasticity. Optics and
Lasers in Engineering, 1989. 11(3): p. 145-157.7. Szotten, D., Limited Data Problems in X-ray and Polarized Light Tomography, W. Lionheart and P. Withers, Editors.
2011, The University of Manchester, Manchester, UK.
15

SHM of aluminium & composite structures using AE Stephen Grigg, Cardiff University
A major issue affecting the aerospace industry is the unknown presence of damage within aircraft structures caused by both impacts and fatigue loading. Structural Health Monitoring (SHM) aims to continually monitor structures for damage throughout their entire life, using permanently mounted or embedded sensors. This enables repairs to be conducted prior to significant growth, saving weight and downtime. Acoustic Emission (AE) is one technique that can be utilized for SHM and involves the detection of high frequency stress waves produced by the growth of damage. Traditional methods to detect these waves and locate their source involve bonding a number of Piezoelectric sensors to a structure, which connect via wires to a central hub elsewhere on the aircraft. A major issue with this setup is the large addition of weight caused by these wires, as well as issues with the integration of these systems to existing aircraft.
One solution to solve this problem is a wireless system consisting of numerous wireless sensor nodes; however issues then arise due to power limitations and time synchronisation. Highly accurate time synchronisation, as require in traditional methods of AE sources localisation, needs regular RF transmission between nodes to account for irregular drift in timers. A node with multiple sensors in a close triangular array has been proposed which would calculate the angle of arrival and potentially the distance to the source location. A technique of calculating the angle at which the source arrives at the sensor array as well has the distance the source has travelled has been investigated with practical testing on a range of structures. Current results show good accuracy in simple aluminium and composite structures with more complex structure posing further problems.
16

Novel inertial heterogeneous high strain rate tests for non-linear constitutive model parameters identification with the Virtual Fields Method
S. Dreuilhe, F. Pierron
University of Southampton
The study of the mechanical behaviour of materials at high strain rates is of growing interest in many engineering applications such as automotive crash-tests, high speed machining and defence. With the development of modern high speed cameras, full-field deformation of solids at high strain rates can be recorded with techniques such as Digital Image Correlation (DIC) or the grid method. Current high strain rate techniques such as the Split Hopkinson Pressure Bar fail to provide entirely reliable experimental data for material model identification. Recently, the Virtual Fields Method (VFM) has enabled the identification of linear elastic parameters from full-field strain measurements at high strain rates with ultra-high speed cameras with remarkable accuracy, opening the way to design novel high strain rate testing techniques. The idea is to use fields of acceleration as a load cell, whose virtual work is balanced out with the virtual work of stresses in the principle of virtual work, in the novel test configuration proposed. This promising approach is presently taken to identify non-linear model parameters at high strain rate with the VFM. After a brief summary of the procedure developed for the identification of a simple elasto-plastic model at high strain rates, the recent application on experimental strain and acceleration maps recorded using an ultra-high speed camera will be presented.
17

Investigation of Acoustic Emission Generated by Asperity Interaction in Mixed Lubrication Contacts
Simon Hutt, Cardiff University
As a material is deformed energy is spontaneously released in the form of transient high frequency elastic waves known as Acoustic Emission (AE). They can be measured using piezoelectric transducers mounted on the material. AE has many proven uses as a structural health monitoring tool, however, its use for monitoring rotating machinery is still in the development stage.
Mixed lubrication refers to a contact condition where the lubricant film is too thin to maintain complete separation between surface asperities. Thus direct interaction between asperities occurs at points in the contact. Recent research has shown that, in a mixed elastohydrodynamic (EHL) lubrication regime, metal to metal asperity contact is a significant source of AE. This lubrication regime is typical of the contacts in heavily loaded aerospace and power transmission gearing. Therefore AE measurement has the potential to be a useful tool in monitoring the health and operating conditions of gears in such transmissions.
Researchers have investigated differences in the AE from healthy and damaged gears and at different points in the meshing cycle. However, there have been only limited attempts to quantify and correlate AE with the specific tribological conditions at the contact. This research seeks to address this by experimental measurements of the AE generated from a contact with controllable parameters. The ultimate aim of the research is to develop a numerical model of the AE in realistic gear contacts.
The rig used in this research generates an elliptical contact between two disks. The oil film thickness, which determines the degree of asperity interaction, is controlled by the following parameters: oil temperature, contact load, rotational speed and slide to roll ratio of the disks. Contact Voltage (CV) measurements are used to indicate the severity of asperity interactions. Two PAC Pico transducers are used to measure the AE at the contact. The CV and AE measurements are triggered simultaneously at periodic intervals by a shaft encoder.
To date, experiments have been conducted on the running-in phase of two disks having an equal hardness and with a surface finish approximately equivalent to that of ground gears. A correlation has been found between the amplitude of the AE signal in the 300-700 kHz range and the CV signal. This confirms that the amplitude of AE from the contact is related to, among other things, the severity of the asperity interactions. Further experiments are now being carried out in order to quantify the relationship between the AE, CV and Lambda ratio (the ratio of the oil film thickness to surface roughness) of the contact for a range of operating conditions.
18

Improving Digital Volume Correlation Accuracy in the Presence of Persistent Ring Artefacts:
A Case Study Using the Double Torsion Technique
M.R. Molteno1a, T.H. Becker1, T.J. Marrow2
1 University of Stellenbosch, 2 University of Oxford
Abstract: The use of digital volume correlation (DVC) on X-ray computed tomography images is a
widely used experimental-numerical technique. High aspect ratio geometries are known to cause non-
linear ring artefacts that can persist even after conventional ring artefact removal techniques have been
applied; such artefacts can be suppressed by using combined Wavelet – Fourier Filtering (WFF). In this
novel approach greater accuracy was achieved by correlating datasets in WFF treated - untreated dataset
pairs. This method is compared with conventional approaches, such as non-linear and correlation co-
efficient based filters, to improve the quality of the resultant displacement fields. The experimental data
is obtained from a double torsion specimen geometry loaded in situ and imaged using synchrotron X-ray
tomography at Diamond Light Source.
19

Virtual delta-t mapping technique using a local interaction simulation approach for improved location of acoustic emission damage events for aerospace applications
Mr. Ryan Marks1, Dr. M Pearon1 Dr. A Clarke1, Prof. C Featherston1, Prof. C Paget2, Dr R Pullin1
1. Cardiff School of Engineering, Cardiff University, Cardiff. CF24 3AA2. Airbus Operations Ltd, New Filton House, Filton. BS99 7AR
Due to pressures to reduce greenhouse emissions of aircraft operations there is an industry-wide objective to save weight in aero structures. This has led to the application complex structural solutions and materials. Because of this, combined with size and hard to access areas of modern aircraft, inspection during maintenance operations has become increasingly more costly, time-consuming and difficult in order to ensure structural integrity. By installing a structural health monitoring (SHM) sensor network onto an aircraft to continually monitor the structure for damage and its location, maintenance operations can be optimised, aircraft down-time can be reduced and substantial cost savings can be made. By incorporating SHM at the design stage of an aircraft, it has been suggested that weight savings of up to 15% could be achieved at component level [1].
One SHM method is sensing acoustic emission (AE) emitted during a damage event [2]. There has been a reluctance to apply AE to aircraft structures due to past experiences [3, 4] however great advancements have been made since particularly in the locations of AE events on complex structures. A method of AE location known as ‘delta-T’ was devised by Baxter et al. [5] which uses the difference in the times of arrival of an AE event between a sensor pair. An AE representative ‘Hsu-Neilson’ source is used to train an AE sensor network which can be then interrogated for improved AE location. This method has yielded great results in lab-based testing however, due to the time required to manually train the system there is reluctance to apply it on large scale structures.
A 370mm x 200mm x 3mm 2026-T6 Aluminium plate with eight machined holes of numerous sizes was delta-t mapped using the traditional technique with a 4 sensor array shown in Figure 1. AE events were then recorded as the plate was subjected to a fatigue loading cycle until failure. The traditional delta t technique successfully located the growth of the fatigue crack on the plate. A second set of training data was then created virtually by modelling the plate using the local interaction simulation approach (LISA). This virtual training data was then interrogated to successfully locate the growth of the fatigue crack from the experimental data. This virtual technique shows great potential for automated training of sensor networks while also providing a useful tool for AE sensor network designers for the placement of AE sensors for aerospace applications.
Figure 1: Aluminium plate specimens before and after fatigue testing
1. Speckmann, H. and H. Roesner, Structural Health Monitoring: A Contribution to the Intelligent Aircraft Structure,in ECNDT 2006. 2006.
2. Miller, R.K. and P. McIntire, NDT Handbook Vol 5. 1987: American Society for Non-destructive Testing.3. Bittel, S.L.E., H.L. Command, and R.A.F. Wyton, The Effect of Proof Pressure Testing on the Retardation of Multi-
site Damage. Widespread Fatigue Damage in Military Aircraft, 1995.4. Skinner, G., Maintaining mature military air transport aircraft. Proceedings of the Institution of Mechanical
Engineers, Part G: Journal of Aerospace Engineering, 1996. 210(2): p. 129-134.5. Baxter, M.G., et al., Delta T source location for acoustic emission. Mechanical Systems and Signal Processing,
2007. 21(3): p. 1512-1520.
20

Strain heterogeneity in a cast Ni superalloy: comparing experimental and modelling results
Luqmaan Fazala, Wei Lib, Michael Preussa, João Quinta Da Fonsecaa
aThe University of Manchester, Manchester Materials Science Centre, Manchester M13 9PL, UK ���
bRolls-Royce plc., PO Box 31, Moor Lane, Derby DE24 8BJ, UK
Scatter observed in the fatigue lifing results of a cast Ni superalloy may arise from its coarse grain microstructure. The interactions between mechanically anisotropic grains generate non-uniform local plastic strain even though the test sample is subjected to uniform macroscopic loading conditions. It has been postulated that in a coarse grain material (grain size ~0.2-3mm), where the test samples consist of a few grains (< 20 grains), this heterogeneous strain distribution has a significant effect on the fatigue life of the test sample. Crystal plasticity finite element modelling (CPFEM) was used to model the deformation of a flat test piece containing a few grains in the cross-section. The mesh was generated using EBSD map from the surface of a sample tested in tension, where digital image correlation (DIC) was used to study the local strain on the surface. The model assumed the grains to be columnar across the sample cross section which is a simplification of the actual case. In both cases, strain heterogeneity is observed on the sample surface (Figure 1(a) and (b)) but the distribution is quantitatively different (Figures 1(c) and (d)). These differences are attributed to the simplistic microstructural representation in the model and the experimental limitations when measuring local strain. This will be discussed in the presentation with suggestions for further improvement in the method used.
Keywords: Nickel-based superalloy, plastic deformation, crystal plasticity, finite element, digital image correlation
Figure 1(a)DIC (b) CPFE εyy map at 1.0% macroscopic εyy, showing how the local axial strain distribution observed experimentally is different from what is predicted in the model (c) and (d) are the histograms for (a) and (b) respectively shows how the model does not predict localised strain as high as what is observed experimentally.
Abs
olut
e Fr
eque
ncy
εyy
% 2.0 1.5 2.5 3.0 3.5 1.0 0.5 0 0
50000
100000
150000
200000
250000
(c)
2.0 1.5 2.5 3.0 3.5 1.0 0.5 0
Abs
olut
e Fr
eque
ncy
0
50000
100000
150000
200000
250000
εyy
% (d)
0.0
0.5
1.0
εyy
% DIC CPFEM
(a) (b) 3mm
8mm
21
A lattice misorientation approach to quantify inelastic strains during creep-fatigue deformation of 316H austenitic stainless steel
Rahul Unnikrishnan*, Shirley M. Northover, Hedieh Jazaeri, P. John Bouchard The Open University, Milton Keynes, United Kingdom
Austenitic stainless steels are widely used in nuclear structural components operating at high
temperatures due to their excellent resistance to creep and corrosion. The electron backscatter
diffraction (EBSD) technique has been emerged as a method that enables precise
measurement of strain induced lattice rotations in polycrystalline materials along with
microstructural level information at high spatial resolution using a conventional scanning
electron microscope (SEM). The relationship between crystallographic misorientations and
inelastic strain is not well studied under conditions favouring creep-fatigue. This study
focuses on the inelastic strain induced lattice misorientation developments in creep-fatigue
deformation of service aged 316H austenitic stainless steel. Creep deformation in
polycrystalline materials at elevated temperature can also lead to the nucleation, growth and
coalescence of intergranular voids forming micro-cracks along the grain boundaries. The
possibilities of using EBSD to visualize inelastic strain around a reheat crack is also explored.
22

Solid State Phase Transformation prediction and validation in SA 508 gr.3 cl.1 E. C. Chevallier1 2, S. Blackwell2, M. Warwick2 and J. M. Dulieu-Barton1
1Faculty of Engineering and the Environment, University of Southampton, UK 2 TWI Ltd, Cambridge, UK
The RESIST (Residual Stress and Structural Integrity Studies using Thermography) project aims to develop a non-contact, non-destructive, full-field measurement and portable residual stress assessment technique based on Thermoelastic Stress Analysis (TSA) [1]. The TSA residual stress assessment (RSA) technique relies upon the variation of the thermal expansion coefficient 𝛼𝛼 when a material is subjected to plastic straining [2]. The thermoelastic constant K of a material is defined as
𝐾𝐾 =𝛼𝛼𝜌𝜌𝐶𝐶𝑝𝑝
(1)
where 𝜌𝜌 is the mass density and 𝐶𝐶𝑝𝑝 the specific heat at constant pressure of the material. Any change in 𝛼𝛼 would directly influence 𝐾𝐾, therefore, by measuring the change in K, the plastic strain can be assessed. TSA has been successfully applied to non-welded materials [3], however, the next stage is to assess the feasibility of application on weldments. In nuclear power plants, the ferritic steel, SA 508 gr.3 cl.1. is commonly used. During the welding process of this material, the heating and cooling induce solid state phase transformation (SSPT). Depending on the heating and cooling rates, the phase proportion of bainite, ferrite, martensite and retained austenite can vary significantly. These phases have different material properties, which could influence the TSA result. This study focuses on the prediction of phase proportion in specimens which are subjected to different heat treatments, replicating the welding process. Thin strip specimens were manufactured and subsequently heat treated. Micrographs were produced for each heat treatment and light microscopy was used to identify phases. To provide a more in-depth image, electron back scattered diffraction (EBSD) was applied, enabling the distinction between the austenite and ferrite phases. Martensite and bainite are almost indistinguishable on micrographs, therefore micro-hardness tests were carried out to differentiate these two phases.
(a) (b) (c) Figure 1: Micrographs of (a) a mix of bainite, ferrite and martensite, (b) martensite, (c) ferrite and retained austenite References [1] Dulieu-Barton J. M. Thermoelastic stress analysis. 2012. Optical Methods for Solids Mechanics, Wiley-VCH, pp. 345-366. [2] S. Quinn, J. M. Barton, and J. M. Langlands, Progress in Thermoelastic Residual Stress measurement. Strain (2004) vol. 40, 127-133 [3] A. F. Robinson, Assessment of residual stress using thermoelastic stress analysis, in Faculty of Engineering and the Environment. (2011), PhD thesis, University of Southampton
23

The Identification of Regions Containing Plastic Strain within the Heat Affected Zone of Welded 316L Using Thermoelastic
Stress Analysis G P Howell1, J M Dulieu-Barton1, M Achintha1
1Engineering Materials, Faculty of Engineering and the Environment, University of Southampton, UK
INTRODUCTION
Plastic strains are located in the interaction region between
a weld and the base metal. The strains arise from the
difference between thermal conductivity of the substrate metal
and the weldment [1]. It is proposed that the region containing
plastic strain can be identified through the application of
Thermoelastic Stress Analysis (TSA) [2]. The working
equation for TSA is:
⁄ (1)
where is surface temperature and is the thermoelastic
constant, ⁄ , where is the coefficient of thermal
expansion, the is density, and is the specific heat..
TSA allows the identification of regions of plastic strain. It
is considered that there is a change in K caused by the plastic
straining of the material; and it is the change in K which
causes ΔT to differ from a specimen with zero plastic strain.
Therefore the purpose of the present investigation is to
examine the possibility of identifying any changes in ΔT as a
result of plastic straining in specimens made from 316L
stainless steel that contain welds.
METHODOLOGY
A 15 x 321 x 270 mm plate of 316L stainless steel had two
weld beads laid down on opposite faces in the position shown
in Figure 1. The TIG welding was carried out simultaneously
by two welders so that any heat dissipation would occur at the
same time on both sides of the plate; thus allowing a
symmetrical heat affected zone (HAZ) through the thickness
of the plate and avoiding any asymmetrical deformation
caused by non-uniform cooling. After welding, three 7 mm
thick specimens were cut using electro-discharge machining
(EDM) as shown in Figure 1, so that each specimen contained
the cross section of the welded plate, shown in the insert in the
figure.
Figure 1: Welded plate showing the location of the 7 mm thick
specimens A, B, and C. Inset is a diagram of the cross section
including the weld bead.
To conduct TSA it is necessary to apply a cyclic load and
collect images from an infra-red (IR) detector [2]. The
approximate field of view of the IR detector is shown by the
insert in Figure 1. Once the TSA images had been obtained
using the Cedip 480M system they were processed into T/T
using a MATLAB script [3] into a form known as an
‘experimental thermoelastic bitmap’. It is important to note
that any changes in the response due to plastic straining
caused by the welding process are captured in this data. To
identify the regions of plastic straining it is necessary to create
a ‘synthetic thermoelastic bitmap’ of T/T values without the
effects of plastic straining. This reference bitmap is provided
by a finite element (FE) model that has purely elastic material
properties with no heating effects and therefore no plastic
strain [3]. The difference between the synthetic and
experimental bitmaps can be mapped to a resultant bitmap that
shows only the regions affected by the plastic straining.
RESULTS
Figure 2 shows a FE model of the plastic strain
experienced during the welding of the specimen cut from the
plate. The resultant bitmap, shown on the right of Figure 2,
has three distinct regions under the weld toe on either side of
the plate. The two negative regions (shown in dark blue)
underneath the edge of the weld toe are regions of high stress
caused by the geometric differences between the experimental
and synthetic bitmaps. Precise maps of the weld geometry are
being made using macro camera images and will be
incorporated into the synthetic bitmap. Currently the FE model
used to produce this has an idealised geometry near the edges
of the weld toe, which does not accurately capture the shape of
the weld. The region of positive change (shown in yellow)
underneath the bulk of the weld toe is where the model has
predicted the highest region of plastic strain, indicating that a
difference in K exists as a result of the plastic straining during
the welding process.
Figure 2: Left: heating and cutting FE model predicting
regions of plastic strain under the toe weld1, Right: resultant
bitmap.
CONCLUSIONS AND FUTURE WORK
The present work has shown that through the application
of TSA and with the use of a synthetic bitmap for the
reference dataset it is possible to reveal regions in a specimen
that contain plastic strain caused by dissimilar cooling rates
between the weldment and substrate metal. The next steps are
to reduce the geometric differences between the FE model and
the experimental thermoelastic bitmap, and to convert the
difference in thermoelastic response to a value of plastic
strain. This conversion will be achieved through the use of a
calibration constant.
The calibration constant is unique for each material and a
second set of experiments will be undertaken to populate a
“strain vs. change in thermoelastic response” plot such that the
anticipated bilinear relationship can be derived.
REFERENCES1. Ranjbarnodeh, E. & Farajpour, M. 2012. Journal of Metallurgical &
Materials Engineering, 18, pp. 19-27.
2. Dulieu-Barton, J.M. & Stanley, P. 1998. Journal of Strain Analysis, 33, pp.
93-104.
3. Howell, G., Dulieu-Barton, J.M., Achintha, M. & Robinson, A.F. 2014. 13th
Asian Conference on Experimental Mechanics, SPIE 9302,
1 Provided by Elise Chevallier PhD student at UoS
24