pgem q1 2015 earnings slides final
TRANSCRIPT

May 7, 2015
Ply Gem Holdings
First Quarter 2015 Results
Gary E. Robine@e Shawn K. Poe President & Chief ExecuJve Officer Chief Financial Officer
Legal Disclaimer
2
These slides and the accompanying oral discussion may contain “forward-‐looking statements” within the meaning of the Private Securi=es Li=ga=on Reform Act of 1995. Such statements involve known and unknown risks, uncertain=es and other factors that could cause the actual results of Ply Gem Holdings, Inc. (the “Company”) to differ materially from the results expressed or implied, including: downturns in the home repair and remodeling or the new construc=on end markets, or the economy or the availability of consumer credit; compe==on from other exterior building products manufacturers and alterna=ve building materials; inability to successfully develop new products or improve exis=ng products; changes in the costs and availability of raw materials; consolida=on and further growth of our customers; loss of, or a reduc=on in orders from, any of our significant customers; inclement weather condi=ons; increases in union organizing ac=vity and work stoppages at our facili=es or the facili=es of our suppliers; our ability to employ, train and retain qualified personnel at a compe==ve cost; claims arising from the opera=ons of our various businesses prior to our acquisi=ons; product liability claims, including class ac=on claims, rela=ng to the products we manufacture; li=ga=on outside of product liability claims; loss of certain key personnel; interrup=ons in deliveries of raw materials or finished goods; environmental costs and liabili=es; inability to realize an=cipated synergies and cost savings with respect to acquisi=ons; manufacturing or assembly realignments; threats to, or impairments of, our intellectual property rights; increases in fuel costs; changes in foreign currency exchange and interest rates; material non-‐cash impairment charges; our significant amount of indebtedness; covenants in the ABL Facility, the credit agreement governing our Senior Secured Term Loan Facility and the indenture governing the 6.50% Senior Notes; limita=ons on our net opera=ng losses and payments under the tax receivable agreement to our current stockholders; failure to successfully consummate and integrate future acquisi=ons; actual or perceived security vulnerabili=es or cyberaZacks on our networks; failure to effec=vely manage labor inefficiencies associated with increased produc=ons and new employees added to the Company; failure to generate sufficient cash to service all of our indebtedness and make capital expenditures; control by the CI Partnerships; failure to maintain effec=ve internal controls over financial repor=ng; and the risks set forth in the Company’s filings with the Securi=es and Exchange Commission. Consequently such forward-‐looking statements should be regarded as the Company’s current plans, es=mates and beliefs. Except as required by law, the Company does not undertake and specifically declines any obliga=on to publicly release the results of any revisions to these forward-‐looking statements that may be made to reflect any future events or circumstances a_er the date of such statements or to reflect the occurrence of an=cipated or unan=cipated events.
In addi=on, these slides and the accompanying oral discussion reference non-‐GAAP financial measures, such as adjusted EBITDA. A reconcilia=on of non-‐GAAP financial measures to the most directly comparable GAAP financial measure is provided in the Appendix to these slides and is included in our news release issued on May 7, 2015 and posted on www.plygem.com.

3
41%
55% 45%
3
First Quarter 2015 Results Today’s PresentaJon
90%
10%
Agenda
• First Quarter Review Gary Robine3e
• Financial Results Shawn Poe
• Acquisi;on Synergies and Cost Savings Shawn Poe
• Margin Ini;a;ves Gary Robine3e
• Economic Outlook Gary Robine3e
• Ques;ons and Answers Gary Robine3e & Shawn Poe
• Closing Remarks Gary Robine3e

4
41%
55% 45%
4
One of the Largest Manufacturers of Exterior Building and Home Improvement Products
90%
10%
Company Overview
Repair and Remodel
Leverage to New Housing Starts
New Products and InnovaJon Drive
Share Gains M&A OpportuniJes
Pla[orm Built for Growth and OperaJng Leverage
• Leading Manufacturer of Exterior Building Products • Comprehensive Product PorKolio with Strong Brand Recogni;on
• Mul;-‐Channel Distribu;on Network Servicing a Broad Customer Base • Balanced End Market Exposure Driven by Diversified Product Mix
• Highly Efficient, Low Cost Opera;ng PlaKorm • Proven Track Record of Acquisi;on Integra;on & Cost Savings Realiza;on • Strong Management Team with Significant Ownership
US 85%
Canada 15% (*)
Siding 45% Windows
55%
(*)
(*) LTM April 4, 2015, Pro Forma for Simonton acquisiJon

5
Ply Gem Results
Key Highlights First Quarter Results
First Quarter 2015 Highlights
• Net sales increase of 39.6% was due to the Simonton acquisi;on, organic growth and four addi;onal shipping days for the first quarter of 2015 rela;ve to 2014. The Simonton acquisi;on resulted in a net sales increase of $63.4. Organic growth of 16.0% was driven by a 4.4% increase in U.S. single-‐family housing starts, an increase in average selling prices in both of our business segments and increased demand for our products especially during January and February compared to the same period in 2014 due to favorable winter weather condi;ons.
• Gross margin expansion of 120 basis points driven by increased average selling prices in both of our business segments, opera;ng efficiency improvements in our Windows and Doors segment par;ally offset by product mix, unfavorable aluminum commodity costs and unfavorable foreign currency impact from a weakening Canadian dollar.
• Fourth consecu;ve year-‐over-‐year quarterly adjusted EBITDA improvement.
($ in Millions) Q1 2015 Q1 2014
Net Sales Y-O-Y Change
$376.0 39.6%
$269.5
Gross Profit Gross Profit %
$60.3 16.0%
$39.8 14.8%
Adj. EBITDA
$2.3 $(1.5)
New construcJon
55%
Home repair & remodel
45%
End Market Exposure
6
Windows & Doors (W&D) Segment
Key Highlights First Quarter Results
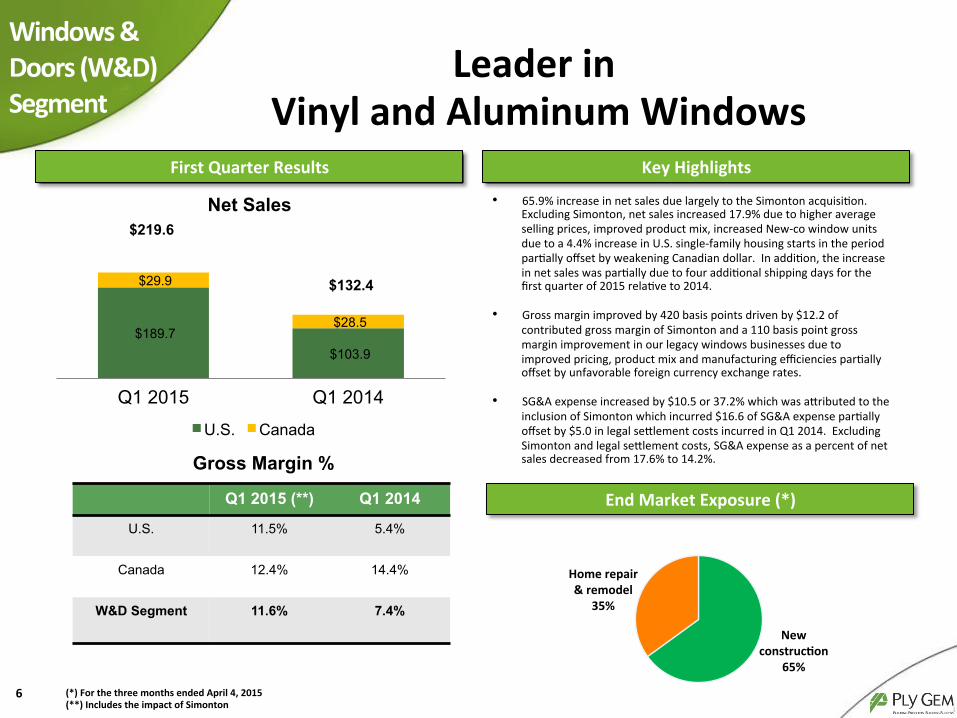
Leader in Vinyl and Aluminum Windows
$189.7 $103.9
$29.9
$28.5
Q1 2015 Q1 2014
Net Sales
U.S. Canada
$132.4
$219.6
End Market Exposure (*)
• 65.9% increase in net sales due largely to the Simonton acquisi;on. Excluding Simonton, net sales increased 17.9% due to higher average selling prices, improved product mix, increased New-‐co window units due to a 4.4% increase in U.S. single-‐family housing starts in the period par;ally offset by weakening Canadian dollar. In addi;on, the increase in net sales was par;ally due to four addi;onal shipping days for the first quarter of 2015 rela;ve to 2014.
• Gross margin improved by 420 basis points driven by $12.2 of contributed gross margin of Simonton and a 110 basis point gross margin improvement in our legacy windows businesses due to improved pricing, product mix and manufacturing efficiencies par;ally offset by unfavorable foreign currency exchange rates.
• SG&A expense increased by $10.5 or 37.2% which was a3ributed to the inclusion of Simonton which incurred $16.6 of SG&A expense par;ally offset by $5.0 in legal se3lement costs incurred in Q1 2014. Excluding Simonton and legal se3lement costs, SG&A expense as a percent of net sales decreased from 17.6% to 14.2%.
Q1 2015 (**) Q1 2014
U.S. 11.5% 5.4%
Canada 12.4% 14.4%
W&D Segment 11.6% 7.4%
Gross Margin %
New construcJon
65%
Home repair & remodel
35%
(*) For the three months ended April 4, 2015 (**) Includes the impact of Simonton

Q1 2014 Gross Margin 7.4%
Selling Price/Product Mix 1.1%
Conversion Improvements 0.4%
Simonton Acquisi;on Impact 3.1%
Freight Costs 0.3%
Unfavorable FX -‐0.3%
Other -‐0.4%
Q1 2015 Gross Margin 11.6%
W&D Gross Margin
Unfavorable foreign currency exchange rates.
Less operaJng leverage due to sales volume decreases driven by weather and pull-‐back in new construcJon demand
7
W&D Segment Gross Margin Bridge and Historical Performance
Reflects favorable product mix and pricing. As noted during previous price increases, the pull through of pricing changes occur over a 90 to 120 day period.
20.9% 15.4% 14.0% 15.4% 13.1% 13.8%
9.7% 12.9% 13.4%
1,046
622
445 471 431 535
618 648 654
2007 2008 2009 2010 2011 2012 2013 2014 LTM
Historical Gross Margin Performance
Annual Gross Profit % U.S. SFHS (*)
Note: Includes Simonton from date of acquisiJon
Simonton favorable impact on overall segment gross margin for the quarter.
Improved operaJonal efficiency improvements within our manufacturing faciliJes.
Favorable freight costs due to decline in fuel pricing parJally offset by rising driver and freight insurance costs.

8
Siding, Fencing & Stone (SFS) Segment
Key Highlights First Quarter Results
Market Leader in Vinyl Siding
$137.7 $118.2
$18.7 $18.9
Q1 2015 Q1 2014
Net Sales
U.S. Canada
$137.1
New construcJon
41%
Home repair & remodel
59%
End Market Exposure (*)
• 14.1% increase in net sales due largely to favorable market demand in metal accessories and vinyl siding with units shipped increasing 6.7% and 1.9%, respec;vely. In addi;on, higher selling prices were realized in response to increased raw material costs and freight costs related to our 2014 selling price increase announcements and par;ally due to four addi;onal shipping days for the first quarter of 2015 rela;ve to 2014.
• Gross margin expanded by 30 basis points, driven by 182 basis point increase in vinyl siding margin offset by margin contrac;on of 218 basis points in metal accessories. The vinyl siding margin expansion is a3ributed to impact of 2014 selling price increase and a slight favorable impact of PVC resin pricing during the quarter. The metal accessory margin contrac;on is a3ributed to higher aluminum costs of 7.9% within the period. We expect addi;onal recovery through selling price increases in vinyl and metal products which became effec;ve during the period.
• SG&A expense as a percentage of sales decrease from 14.5% to 13.7% during the period due to improved leverage on the fixed component of SG&A expense. Gross Margin %
Q1 2015 Q1 2014
U.S. 21.2% 21.3%
Canada 30.1% 26.2%
SFS Segment 22.2% 21.9%
$156.4
(*) For the three months ended April 4, 2015

Q1 2014 Gross Margin 21.9%
Selling Price/Product Mix 2.4%
Freight Costs 0.4%
Commodity Costs -‐1.9%
Other -‐0.6%
Q1 2015 Gross Margin 22.2%
SFS Gross Margin
Favorable freight costs due to decline in fuel pricing parJally offset by rising driver and freight insurance costs.
9
SFS Segment Gross Margin Bridge and Historical Performance
Reflects favorable product mix and pricing. As noted during previous price increases, the pull through of pricing changes occur over a 30 to 60 day period.
20.4% 18.4% 25.9% 25.7% 24.8% 27.4% 26.8% 26.1% 26.1%
.5208 .6200 .5288 .6458 .6971 .6975 .7134
.7534 .7509
2007 2008 2009 2010 2011 2012 2013 2014 LTM
Historical Gross Margin Performance
Annual Gross Profit % PVC Resin Price (*)
Increased raw material costs, mainly aluminum commodity costs parJally offset by remaining impact of the Q3 2014 metal accessory price increases. AddiJonal recovery through future selling price increases.

0.176.80
255,128,0
102,102,102
193,0,0
226,133,131
192,192,192
245,171,088
102,179,97
10
AcquisiJon Synergies
(1) Improved procurement economics as a result of increased purchasing power (2) Freight cost maximization and improved fixed overhead as a result of various manufacturing cost reductions from rationalizations (3) SG&A leverage scale and back office efficiencies (4) Expand vertical integration efficiency
EBITDA Impact of Expected Simonton Synergies and Cost Savings
$8 Million Original Savings
Raw material sourcing (1) $3.6M
Mfg. efficiencies (2) $2.7M
Insourcing products (4) $1.5M
SG&A (3) $0.2M
Simonton AcquisiJon Synergies and Cost Savings
$10 Million
AddiJonal Incremental Savings $2.0M
11
Margin IniJaJves
The Market Innovator
The Leading Brand
Lean through Technology
Our Future Leaders
New Channels and Markets
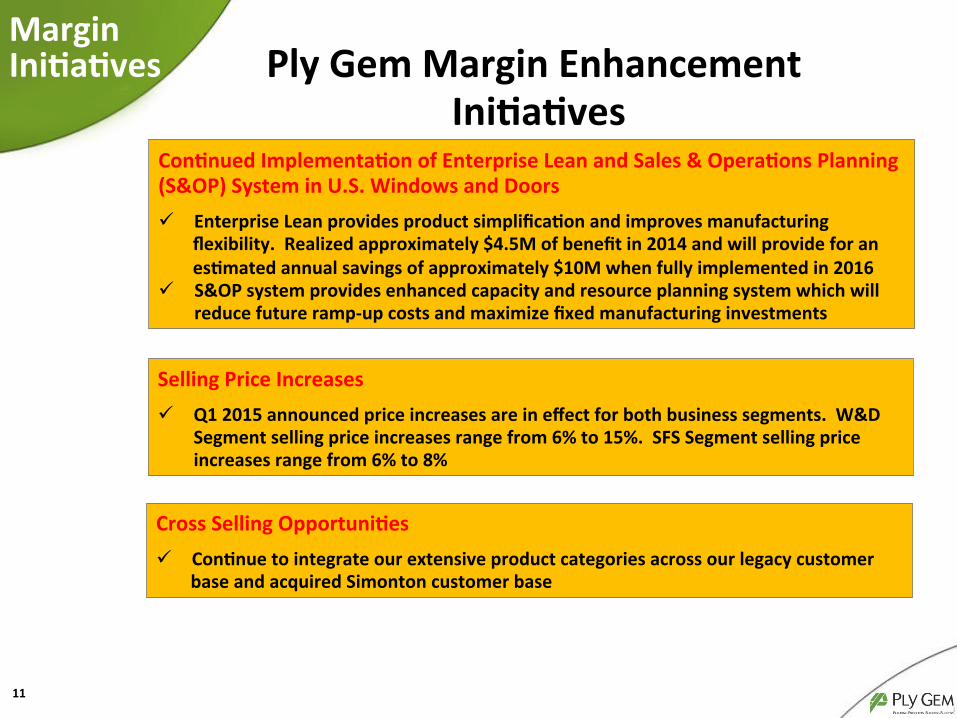
Selling Price Increases
ü Q1 2015 announced price increases are in effect for both business segments. W&D Segment selling price increases range from 6% to 15%. SFS Segment selling price increases range from 6% to 8%
ConJnued ImplementaJon of Enterprise Lean and Sales & OperaJons Planning (S&OP) System in U.S. Windows and Doors
ü Enterprise Lean provides product simplificaJon and improves manufacturing flexibility. Realized approximately $4.5M of benefit in 2014 and will provide for an esJmated annual savings of approximately $10M when fully implemented in 2016
ü S&OP system provides enhanced capacity and resource planning system which will reduce future ramp-‐up costs and maximize fixed manufacturing investments
Ply Gem Margin Enhancement IniJaJves
Cross Selling OpportuniJes
ü ConJnue to integrate our extensive product categories across our legacy customer base and acquired Simonton customer base

12
Ply Gem Outlook
The Market Innovator
The Leading Brand
Lean through Technology
Our Future Leaders
New Channels and Markets
2Q 2015 Guidance
ü Based on the forecasted growth of the U.S. housing market and R&R spend, the impact of our enacted selling price increases and other margin enhancing iniJaJves, the expected impact of Simonton, anJcipated acquisiJon synergies, and commodity fluctuaJons, we expect our EBITDA for 2Q 2015, in the range of $57 to $62 million
Economic Outlook & Guidance
Expect ConJnued Steady Growth in U.S. Housing Starts
ü Expect conJnued overall moderate growth of 10% to 15% in U.S. housing recovery in 2015, however we expect the market to experience periods of choppiness in the growth rate
ü Expect conJnued moderate growth of 3% in big Jcket R&R spend
ü Overall Canadian housing starts expected to be flat for 2015 with demand pressure in Western Canada due to oil pricing

Q&A
13
Appendix: Non-‐GAAP Adjusted EBITDA
ReconciliaJon
14
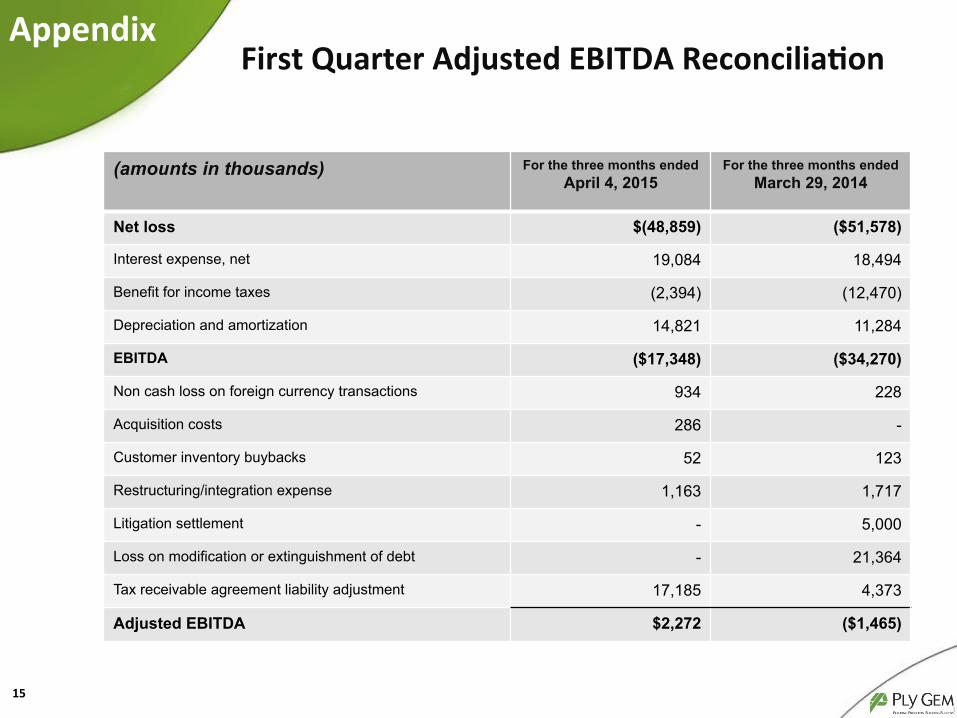
(amounts in thousands) For the three months ended April 4, 2015
For the three months ended March 29, 2014
Net loss $(48,859) ($51,578)
Interest expense, net 19,084 18,494
Benefit for income taxes (2,394) (12,470)
Depreciation and amortization 14,821 11,284
EBITDA ($17,348) ($34,270)
Non cash loss on foreign currency transactions 934 228
Acquisition costs 286 -
Customer inventory buybacks 52 123
Restructuring/integration expense 1,163 1,717
Litigation settlement - 5,000
Loss on modification or extinguishment of debt - 21,364
Tax receivable agreement liability adjustment 17,185 4,373
Adjusted EBITDA $2,272 ($1,465)
15
First Quarter Adjusted EBITDA ReconciliaJon Appendix

(amounts in thousands) For the three months ended April 4, 2015
For the three months ended March 29, 2014
SFS Segment W&D Segment Total SFS Segment W&D Segment Total
Non cash loss on foreign currency transactions
$253 $681 $934 $143 $85 $228
Acquisition costs - 261 261 - - -
Customer inventory buybacks 52 - 52 123 - 123
Restructuring/integration expense
160 1,003 1,163 - 1,717 1,717
Litigation settlement - - - - 5,000 5,000
$465 $1,945 $2,410 $266 $6,802 $7,068
16
EBITDA Adjustments By Segment(*) Appendix
(*) Does not reflect unallocated and corporate EBITDA adjustments