orcharding the future: the - repositorio digital...
TRANSCRIPT

Name: Marco Rodrigo Calderón LoorStudent number: 615288
Title of the research project: Orcharding the Future: Theinfluence of temperature on Australian pome fruit flowering
Degree: Master of Environment
Subject: ENST70001 Environmental Research Project Long(50 points)
Supervisor: Dr Rebecca DarbyshireFaculty: Melbourne School of Land and Environment
Co-Supervisor: Dr Heidi Parkes
Date: November 2014
Marco Rodrigo Calderón Loor Id #: 615288
Table of ContentsList of abbreviations.................................................................................................................... i
Statement of original authorship............................................................................................... ii
Dedication ................................................................................................................................. iii
Acknowledgments..................................................................................................................... iv
Abstract...................................................................................................................................... v
1 Introduction........................................................................................................................1
1.1 Apple production cycle................................................................................................2
1.1.1 Winter Dormancy.................................................................................................3
1.1.2 Green tip and Flowering ......................................................................................5
1.2 Buds.............................................................................................................................5
1.2.1 Bud types .............................................................................................................6
1.2.2 Flower bud development.....................................................................................7
1.3 Effects of temperature on the phenology of buds .....................................................7
1.3.1 Effects of temperature on dormancy ..................................................................8
1.3.2 Effects on flowering timing..................................................................................8
1.4 Research Questions...................................................................................................10
2 Methods............................................................................................................................11
2.1 Study Area .................................................................................................................11
2.2 Data ...........................................................................................................................12
2.3 Analytical approach...................................................................................................12
3 Results...............................................................................................................................13
3.1 Temperature differences ..........................................................................................13
3.2 Variability between trees ..........................................................................................15
3.3 Normality of the green tip data ................................................................................16
3.4 Day-of-year of green tip ............................................................................................16
3.5 Length of green tip stage ..........................................................................................17
3.6 Variability in green tip timing....................................................................................20
4 Discussion .........................................................................................................................21
4.1 Differences in green tip timing..................................................................................21
4.2 Effect of temperature on green tip timing................................................................22
4.3 Sample size................................................................................................................24
4.4 Climate change implications .....................................................................................24

Marco Rodrigo Calderón Loor Id #: 615288
5 Conclusion ........................................................................................................................25
6 References ........................................................................................................................27
List of figures
Figure 1.1: Apple production by state (APAL 2014). .................................................................2
Figure 1.2: Southern hemisphere’s seasonal cycle of pome fruit trees....................................3
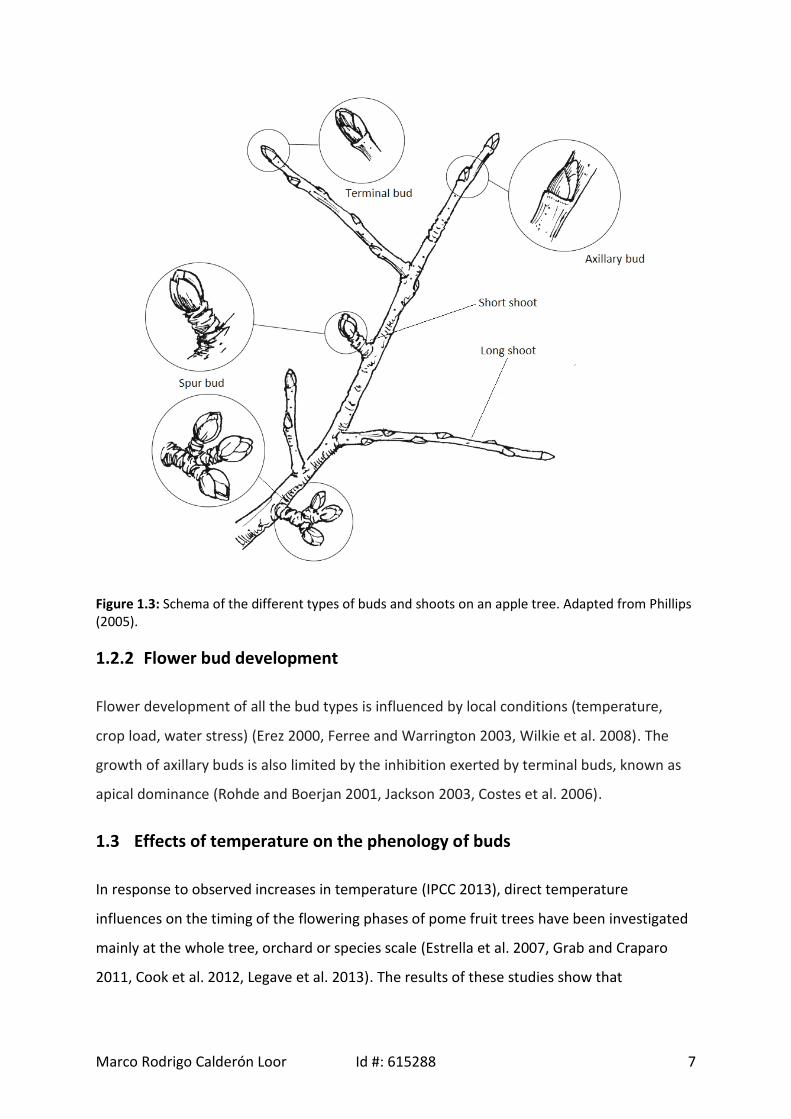
Figure 1.3: Schema of the different types of buds and shoots on an apple tree. Adapted
from Phillips (2005)....................................................................................................................7
Figure 2.1: Apples production zones in Australia. The locations analysed in this study are
highlighted in red. Adapted from APAL (2013)........................................................................11
Figure 3.1: Schematic plots of daily means winter and spring temperatures grouped by
month for a) Applethorpe, b) Shepparton and c) Manjimup for 2012 (black)
and 2013 (blue). .......................................................................................................................15
Figure 3.2: Observed green tip day-of-year for Cripps pink apple buds in Applethorpe (QLD,
black circles), Shepparton (VIC, blue circles) and Manjimup (WA, red circles) for a) 2012 and
b) 2013. ....................................................................................................................................19
List of tables
Table 1.1: Advance in days/decade of green tip and full bloom phenophases for apple trees
in Australia, and trends for mean temperature in °C/decade for each location. Advances are
reported as negative values and delays are positive values.
Source: Darbyshire et al. (2012). ...............................................................................................9
Table 2.1: Summary of cultivar’s locations, and historical winter and spring temperature
(1911-2009). Source: Darbyshire (2013)..................................................................................11
Table 3.1: Monthly mean temperature for the study for 2012 and 2013. The months
highlighted in blue correspond to winter season. The months highlighted with green
correspond to spring season. The notation used for the site is Applethorpe (App),
Shepparton (She) and Manjimup (Man). .................................................................................13

Marco Rodrigo Calderón Loor Id #: 615288
Table 3.2: Results of Kruskal-Wallis test of the differences in the day-of-year in reach green
tip between trees, p-values ≥ 0.5 means that there were no significant difference between
trees. ........................................................................................................................................15
Table 3.3: Shapiro-Wilk test for each data set. The highlighted cells represents data with
normal distribution (p-value ≥ 0.05)........................................................................................16
Table 3.4: Summary of median day-of-year of green tip and length of the phase for each
type of bud and location for Cripps pink apple. Blue and orange cells are the maximum and
minimum values for each parameter respectively. Where: n: number of buds, DOY: Day-of-
year, MAD: Median absolute deviation, FDOY: First day-of-year, LDOY: Last day-of-year, LGT:
Length of green tip phase and IQR: Interquartile range..........................................................18
Table 3.5: Pairwise Wilcoxon-Mann-Whitney results for individual buds of Cripps Pink apple.
Values highlighted represent samples with statistical equal medians (p-values > 0.05). Na are
non-meaningful comparisons. .................................................................................................20

Marco Rodrigo Calderón Loor Id #: 615288 i
List of abbreviations
DOY Day-of-year
IPCC Intergovernmental Panel on Climate Change
IQR Interquartile range
LGT Length of the green tip phase
MAD Median absolute deviation

Marco Rodrigo Calderón Loor Id #: 615288 ii
Statement of original authorship
The work in this project was undertaken in partial fulfilment of the requirements of the
University of Melbourne for the degree of Master of Environment. The views expressed are
those of the author and might not reflect the views of the University of Melbourne, Office
for Environmental Programs.

Marco Rodrigo Calderón Loor Id #: 615288 iii
Dedication
A Carla a tí te lo dedico todo, mi tiempo, mi trabajo, mis alegrías, mi vida y mi amor. Gracias
por ayudarme en estos tiempos sin tiempo, por levantarme cada vez y cuando, por
sostenerme, abrazarme y arruncharme. Gracias porque nunca dejamos de soñar y de
cumplir. A Martín a tí mi hijo también te dedico este trabajo, gracias por entenderme,
enseñarme y quererme como tú lo haces. A ustedes dos por sera el hogar que nunca me
abandona, que me motiva a ser mejor y que me trae por tantos caminos diferentes. La
siguiente aventura será mejor aún!
De la misma manera este trabajo, y todo lo que ha significado lograrlo, está dedicado a las
personas que me han ayudado a llegar hasta tan lejos, en sentido literal y figurado! Padres,
hermanos, familia y amigos siempre están en mi corazón acompañandome en cada uno de
mis pasos.

Marco Rodrigo Calderón Loor Id #: 615288 iv
Acknowledgments
I would like to express my sincere gratitude to all those who helped me during the
completion of this research project. First I have to present my gratitude to Horticulture
Australian Limited the main funder of this project using the apple and pear industry levy and
matched funds from the Australian Government. Additionally, thanks to the Ecuadorian
Government for sponsoring my graduate studies overseas.
A special thanks to my supervisor Dr. Rebecca Darbyshire for her guidance, patience,
knowledge, kindness and motivation throughout this thesis process. Many thanks for
allowing me to investigate about such an interesting field such as Horticulture. I would also
like to thank my co-supervisor Dr. Heidi Parkes, her experience, clarity and knowledge were
an invaluable help in all the stages of this project.
To all the people who helped me in different ways during this stage, but mainly I wish to
thank my wife, Carla, and my friend Francisco (aka “el niño”) for helping me to polish this
paper.
Last but not least a big special thank goes to my family, Carla and Martin, your support
during this period have been crucial and without you this would not have meaning.

Marco Rodrigo Calderón Loor Id #: 615288 v
Abstract
Flowering development of pome fruit trees is dependent on local environmental conditions.
The main driver in the timing of pome fruit flowering is temperature. However,
understanding of the effect of temperature at an individual bud scale, is limited. The main
purpose of this research was to investigate the differences in green tip timing, one of the
earliest stages of flowering development, between bud types and potential temperature
drivers. Changes in climate conditions may influence flowering timing potentially leading to
a rise in the variability of fruit maturation, increasing harvesting costs as more picks are
required. In addition, greater variability can potentially affect cross-pollination as varieties
that pollinate each other may have different flowering at different times, limiting pollination
potential. Furthermore, a better understanding of the relationships between temperature
and individual bud behaviour will assist in assessments of future impacts of climate change
on timing of flowering.
Data from three different types of buds from ‘Cripps Pink’ apple were collected for 2012 and
2013. The study sites, which represent different climatic conditions, were Applethorpe
(QLD), Shepparton (VIC) and Manjimup (WA). Statistical tests were applied to the datasets
to evaluate possible differences in green tip emergence between bud types, sites and years.
The results showed that on average spur buds were the first to burst at all sites. These were
closely followed by terminal buds and then axillary buds. Comparing across locations buds in
Shepparton and Applethorpe were first to burst in both years, and some days later those
located in Manjimup. There were significant differences in the day-of-year when individual
buds reached green tip between bud types, within and across sites. The length of the green
tip phase also varied between buds, sites and years.
There was a consistent relationship between date of green tip and winter temperature.
Cooler sites, Shepparton and Applethorpe, had the earliest dates of green tip while
Manjimup experienced warmer winter seasons and the latest dates of green tip. Likewise,
the warmer winter season, 2013, experienced a delay in the day-of-year when buds reached
the green tip phase in all locations compared with 2012. Similarly, the length of the green
tip phases was longer for 2013 than 2012.

Marco Rodrigo Calderón Loor Id #: 615288 vi
The results from this study help to further elucidate the relationships between winter
temperatures and green tip in ‘Cripps Pink’ apple. Understanding these relationships is
essential for the identification of potential impacts that future climate change may have on
apple production in Australia.

Marco Rodrigo Calderón Loor Id #: 615288 1
1 Introduction
Apples are a pome fruit grown on perennial deciduous trees. Cultivars can be grown
commercially from the tropics to high latitude temperate regions (Wilkie et al. 2008),
although most of the world’s production comes from temperate zones. In Australia apples
are grown in all six states (Figure 1.1), with Victoria the most productive zone (46% of total
Australian production, 2002–2013) (APAL 2013). The apple industry is the second largest
fruit industry in Australia (APAL 2013). The gross income of production for 2012 was
approximately 567 AUD million. However, production can be significantly impacted by local
climatic conditions. For instance, data from Australian Bureau of Statistics (2013) indicates a
drop in apple production for 2011–2012, attributed to hailstorms that damaged the crops.
This highlights the importance of understanding the impacts of environmental factors on
the development of pome fruit, not only to account for reductions in yield, but also to
propose appropriate adaptive measures for expected future changes in climate.
More than 10 varieties are grown in Australia, with Cripps Pink one of the most important as
is the most cultivated in the country, about 60,500 tonnes in 2007–08 (Australian Bureau of
Statistics 2011). Cripps Pink is the focus of this study. This variety was developed in Western
Australia and is grown commercially known as Pink Lady® (Aussie apples 2012).
.

Marco Rodrigo Calderón Loor Id #: 615288 2
Figure 1.1: Apple production by state (APAL 2014).
1.1 Apple production cycle
An idealised seasonal cycle of apple fruit production is presented in Figure 1.2. Starting after
harvest, the trees drop their leaves in order to prepare for winter. During winter the trees
are characterised by a dormant state where any visible growth is suspended (Lang et al.
1987). To overcome this dormant phase, cumulative exposure to cold temperatures is
required (Saure 1985). In early spring warm temperatures promote flowering, with green tip
the first stage of the flowering phase. After flowering and pollination the fruit is set and
then fruit maturation occurs up until harvest. This research is focused on the spring green
tip component of the annual growth cycle of pome fruit trees. However, focusing on spring
conditions alone may be insufficient in capturing the whole process. Hence, a description of
two of the main processes related to green tip, winter dormancy and spring flowering, in the
seasonal cycle of apples will be explored.

Marco Rodrigo Calderón Loor Id #: 615288 3
Figure 1.2: Southern hemisphere’s seasonal cycle of pome fruit trees.
1.1.1 Winter Dormancy
Dormancy takes place after the trees have dropped their leaves in autumn and this stage
enables the trees to survive unfavourable conditions during winter (Faust et al. 1997). Lang
et al. (1987) defines dormancy as the period of temporary suspension of visible growth of
any plant structure containing a meristem1. In deciduous fruit trees the buds can be
dormant and still have growth in other parts of the tree (Martin 1991). However, only bud
dormancy will be considered in this research2.
The dormancy process of pome fruit buds in temperate regions, like southern Australia, can
be differentiated in three stages depending on the condition or event influencing the
dormancy state (Martin 1991). These phases are paradormancy, endodormancy and
ecodormancy (Lang et al. 1987).
1 Meristems are defined as regions where the cells maintain the ability to divide itself. Source: Taiz, L andZeiger, E 2006 Plant Physiology, Sinauer Associates, Sunderland, Massachusetts.2 For a broad revision of tree dormancy other useful resource is Lakso, A 1994 'Apple', Schaffer, B & Andersen,P (eds.) in: Handbook of environmental physiology of fruit crops. Volume I: Temperate crops, CRC Press.
Marco Rodrigo Calderón Loor Id #: 615288 4
Paradormancy takes place in mid-summer until early autumn, the main mechanism affecting
this stage is called apical dominance or correlative inhibition. Although the whole inhibition
process is not fully understood, in most cases hormones such as auxin, cytokinin, gibberellin,
ethylene and absisic acid regulate paradormancy (Jackson 2003, Horvath 2009, Campoy et
al. 2011, Darbyshire 2013).
Endodormancy, also known as rest or true dormancy, is defined as a state where growth
suspension is regulated by physiological factors originating within the bud itself (Ferree and
Warrington 2003, Maguylo et al. 2012, Andreini et al. 2014). It starts around mid-autumn,
being deeper in winter and cannot be broken by temperatures favourable for growth or
adequate soil moisture (Voller 2004, Charrier et al. 2011, Darbyshire 2013). This state can
only be released after exposure to a certain period of chilling temperatures called winter
chilling or vernalisation (Charrier et al. 2011, Darbyshire et al. 2011, Maguylo et al. 2012).
After the buds overcome endodormancy, they move into the ecodormancy phase. In this
stage the buds remain dormant due to unfavourable growing conditions, such as cold
temperatures and water stress (Martin 1991, Dennis 2003, Horvath 2009). Ecodormancy
lasts until early spring—generally September in Australia—when the buds have been
exposed to suffice warm temperatures to reach green tip (Jackson 2003, Horvath 2009). Of
these types of dormancy, endodormancy is recognised as true dormancy, hence hereinafter
endodormancy is referred to as dormancy.
Dormancy induction, depth of dormancy and breaking appears to differ depending on the
variety and the type of bud (Cook et al. 1998, Cook and Jacobs 1999, Maguylo et al. 2012).
For instance, terminal buds in apples rapidly enter into dormancy in autumn, whereas the
exit from dormancy begins slower but becomes faster, after the exposure of the buds to
chilling temperatures, before green tip in spring (Cook et al. 1998, Jackson 2003, Maguylo et
al. 2012). This is related to differences in chilling requirements at the bud level. Some
authors noted that terminal buds of apple trees have a lower chilling requirement than the
axillary buds (Paiva and Robitaille 1978, Saure 1985, Dennis 2003, Ramírez and Davenport
2013).
Marco Rodrigo Calderón Loor Id #: 615288 5
Salisbury and Ross (1992) state that the effects of chilling to break dormancy are on
individual buds, rather than on the whole tree. Therefore, buds exposed to different
temperatures within a tree may break dormancy at distinct times.
1.1.2 Green tip and Flowering
Flowering in pome fruit trees is part of a complex biological process of reproduction and
development that starts in the previous summer with floral initiation and differentiation of
the floral parts (Wilkie et al. 2008, Darbyshire 2013). The cycle continues in spring after the
buds have fulfilled their chilling requirements and have received environmental signals
promoting their growth (e.g. warm temperatures) (Wilkie et al. 2008, Horvath 2009,
Darbyshire 2013). The first stage of flowering is called green tip. At this point, the buds show
a green colour in their tips, and is also known as bud burst or budbreak (Darbyshire et al.
2012, Campoy et al. 2013). The timing of green tip depends primarily on temperature (Faust
et al. 1997, Jackson 2003), with warmer temperatures associated with earlier dates when
buds reach green tip stage (Heide 1993). However, factors such as species, variety and
growing region may also have an influence on green tip timing (Strand et al. 1999).
Flowering timing, including green tip, differs between apple bud types (Strand et al. 1999).
The precise nature of the relationships between environmental factors and the date of
flowering is not yet clear (Campoy et al. 2012). A common method for determining
blooming is relating the mean springtime temperature with the timing of the phase3 (Grab
and Craparo 2011, Darbyshire 2013). Winter temperatures have also been used as a
predictor of the timing of green tip (Campoy et al. 2011).
1.2 Buds
Apple trees produce buds annually during the summer season. Buds are immature shoots
systems, with or without flowers (Marini and Facts 2003, Jackson et al. 2011). These buds
3 There are two other commonly used methods applied for accounting the spring progression, these are thegrowing degree days and growing degree hours see: Zavalloni, C, Andresen, JA and Flore, J 2006, PhenologicalModels of Flower Bud Stages and Fruit Growth of 'Montmorency' Sour Cherry Based on Growing Degree-dayAccumulation, Journal of the American Society for Horticultural Science, vol. 131, no. 5, pp. 601-607,Darbyshire, R, Webb, L, Goodwin, I and Barlow, E 2012, Evaluation of recent trends in Australian pome fruitspring phenology, International journal of biometeorology, vol. 57, no. 3, pp. 409-421.

Marco Rodrigo Calderón Loor Id #: 615288 6
are the basis for flower and leaf formation for the next season and are thus a crucial part of
the production cycle.
1.2.1 Bud types
The buds on apple trees can be located on long (extension) or short shoots (spurs) (Simpson
2010, Jackson et al. 2011). Long shoots are defined by Wilkie et al. (2008) as “[an] extension
of the current season’s growth…”, whereas short shoots are those “in which the growth is
limited to the production of a rosette with a few leaves”.
Buds are important to the vegetative and reproductive growth of fruit trees. In apple trees
buds can be vegetative and mixed (Simpson 2010). Only mixed buds contains flowers,
usually from three to six, and can be found in all the types of buds in different proportions
(Strand et al. 1999, Ferree and Warrington 2003, Ramírez and Davenport 2013).
Buds are classified as terminal, axillary or spur buds depending on their location. Terminal
buds are located on the tip of long shoots, spur buds at the end of short shoots and axillary
buds are located in the axils of the leaves (Schroeder 1921, Mitchell et al. 1994, Ferree and
Warrington 2003, Jackson 2003, Simpson 2010).
These three types of buds, as outlined in Figure 1.3, were the subject of investigation in this
research project.
Marco Rodrigo Calderón Loor Id #: 615288 7
Figure 1.3: Schema of the different types of buds and shoots on an apple tree. Adapted from Phillips(2005).
1.2.2 Flower bud development
Flower development of all the bud types is influenced by local conditions (temperature,
crop load, water stress) (Erez 2000, Ferree and Warrington 2003, Wilkie et al. 2008). The
growth of axillary buds is also limited by the inhibition exerted by terminal buds, known as
apical dominance (Rohde and Boerjan 2001, Jackson 2003, Costes et al. 2006).
1.3 Effects of temperature on the phenology of buds
In response to observed increases in temperature (IPCC 2013), direct temperature
influences on the timing of the flowering phases of pome fruit trees have been investigated
mainly at the whole tree, orchard or species scale (Estrella et al. 2007, Grab and Craparo
2011, Cook et al. 2012, Legave et al. 2013). The results of these studies show that

Marco Rodrigo Calderón Loor Id #: 615288 8
temperature have an impact on both major phenological processes dormancy and
flowering.
1.3.1 Effects of temperature on dormancy
According to Andreini et al. (2014) the consequences of inadequate chill due to insufficient
exposure to chilling temperatures4 are: 1) late bud break due to a late dormancy release; 2)
low percentage of bud break; and 3) high percentage of flower bud drop. Others have
outlined that inadequate chill can also lead to a prolonged flowering period, poor fruit
development, small fruit size and uneven ripening times (Ferree and Warrington 2003,
Darbyshire et al. 2011).
1.3.2 Effects on flowering timing
A high percentage of the studies investigating the effects of temperature on flowering
timing have been implemented in the Northern Hemisphere, concluding that there has been
an advance in flowering time (Chmielewski et al. 2004, Estrella et al. 2007, Legave et al.
2008, Legave et al. 2013). However, there are species that showed a delay in their flowering
timing (Cook et al. 2012, Darbyshire et al. 2012). Cook et al. (2012) stated that the winter
chilling period played a major role in the response of temperate wild species to
temperature. They described two types of species those with spring-only response to
temperature and those with divergent response. That is responses to both spring and
autumn/winter temperatures. Species showing a delay in their flowering timing are
categorised as divergent, since the interaction between temperatures across winter and
spring influence their timing.
Only two studies have been carried out in the Southern Hemisphere assessing these effects
on the phenology of pome fruit trees (Grab and Craparo 2011, Darbyshire et al. 2012),
showing in general advancements in flowering timing but with different magnitudes. The
only study of historical temporal trends in pome fruit phenology in Australia (Darbyshire et
al. 2012) reported an advance in flowering phenophases for apple trees in three different
4 To determine the exposure to chilling temperatures various models have been developed. For a review of thehistorical chill trends for deciduous fruit trees in Australia using some of these models see Darbyshire, R,Webb, L, Goodwin, I and Barlow, S 2011, Winter chilling trends for deciduous fruit trees in Australia,Agricultural and Forest Meteorology, vol. 151, no. 8, pp. 1074-1085.

Marco Rodrigo Calderón Loor Id #: 615288 9
locations. As can be noticed from Table 1.1, there are differences in the magnitude of
change for varieties and sites. In the case of Granny Smith apples there are not only
differences in the values but in the trends, showing an advance in the full bloom dates in
Yarra Valley (1.4 days/decade) and a delay in Tatura (0.6 days/decade).
Table 1.1: Advance in days/decade of green tip and full bloom phenophases for apple trees inAustralia, and trends for mean temperature in °C/decade for each location. Advances are reportedas negative values and delays are positive values. Source: Darbyshire et al. (2012).
Variety Phenophase Advance(days/decade) Location Tmean trend
(°C/decade)Jonathan Green tip -2.5 Lenswood (SA)a 0.1
Granny Smith Full bloom 0.6 Tatura (VIC)b 0.1Granny Smith Full bloom -1.4 Yarra Valley (VIC)c 0
GoldenDelicious
Full bloom -1.9 Yarra Valley (VIC)c 0
Red Delicious Full bloom -3.5 Yarra Valley (VIC)c 0
Period a 1963-2009, b 1982-2009, c 1976-2005.
The effects of advances of flowering phenophase dates of pome fruit trees are diverse.
Positive effects of advancements include early maturation that may be an advantage for
growers as it could increase the market value of their fruit (Erez 2000). These advancements
may also expose the young leaves and flowers to frost causing injuries in reproductive
organs of the tree leading to yield losses (Rodrigo 2000). Additionally, Darbyshire (2013)
suggested that changes in green tip and flowering times may lead to loss of synchronisation
of flowering between cross-pollinating species, affecting the fruit set process.
A delay in green tip and flowering timing may also have adverse impacts. These include,
poor leafing, reducing the leaf area and hence reducing photosynthesis and variability in the
bloom period causing a reduction in fruit set and yield (Erez 2000). Furthermore, delays in
green tip are linked with uneven and light budbreak exposing the leafless trees to direct
insolation that may cause a progressive deterioration of the tree, due to the dryness of the
exposed branches. With time this can affect yield and production (Erez 2000). Cook and
Jacobs (1999) noted that the delay in green tip affects the buds differently. Delays in the
green tip of axillary buds may reduce the number of developed branches.

Marco Rodrigo Calderón Loor Id #: 615288 10
Studies assessing the effect of temperature on green tip timing at bud level are scarce. One
study has been conducted in South Africa aiming to assess the precedence of green tip (i.e.
which bud type reached the green tip phase first) on terminal and axillary buds (Maguylo et
al. 2012). Their results showed that the terminal buds of Golden Delicious broke first in
almost all the cases. On the other hand, the terminal buds of the Granny Smith only broke
first in 58% of the assessments in a cool area against 43% in a warm area. Despite which bud
type broke first in Granny Smith, there was not a significative difference in the days, around
3 days, when terminal and axillary buds reached green tip in both areas. The opposite
situation occurred in Golden Delicious where the delay between the green tip of terminal
and axillary buds was more evident. The delay in the cool area was about 6 days, compared
with the warm area where the delay was around 20 days. The authors hypothesised that
these differences could be caused by variations in branch architecture between the two
sites or the apical dominance exerted by terminal buds. On the other hand, differences in
chilling accumulation between the two sites could be affecting the precedence of green tip
in terminal and axillary buds.
1.4 Research Questions
Green tip timing, important for apples production, can be influenced by climatic conditions.
In this context it is necessary to deepen the understanding of the response of individual
apple buds to changes in climatic conditions in Australia. As such, this research proposed
the following questions:
1. What is the variability in the timing of green tip between bud types in ‘Cripps Pink’
apple trees?
2. What are the differences in the timing of green tip across three locations and two
years in Australia?
3. What is the relationship between temperature and the timing of green tip
emergence by bud types ‘Cripps Pink’ apple trees?

Marco Rodrigo Calderón Loor Id #: 615288 11
2 Methods
2.1 Study Area
Three areas were selected to assess the effect of temperature on green tip timing,
Applethorpe (QLD), Shepparton (VIC) and Manjimup (WA) (Figure 2.1). The selected study
areas represent three of the main growing zones in Australia and each location has different
climatic conditions (Table 2.1).
Figure 2.1: Apples production zones in Australia. The locations analysed in this study are highlightedin red. Adapted from APAL (2013).
Table 2.1: Summary of cultivar’s locations, and historical winter and spring temperature (1911–2009). Source: Darbyshire (2013).
Site State Latitude Longitude Altitude(m)
Mean wintertemperature
range (°C)
Mean springtemperature
range (°C)
Applethorpe Queensland -28.62 151.95 920.4 7.6–10.3 13.2–17.0
Shepparton Victoria -36.39 145.31 112 7.8–9.9 12.9–17.1
Manjimup WesternAustralia -34.18 116.07 286 9.6–12.4 12.0–15.3

Marco Rodrigo Calderón Loor Id #: 615288 12
2.2 Data
Day-of-year of green tip of terminal, axillary and spur buds for 2012 and 2013 springtime
season were collected for individual buds. For this study terminal buds were considered as
those located at the end of shoots > 2.5 cm, whereas spur buds those located on the tip of
shoots ≤ 2.5 cm.
In total, 30 buds were monitored, 10 of each type which were randomly located throughout
the canopy on all sides of the tree. This was repeated for five trees, thus a total of 150 buds
were monitored per site (50 of each type). The progression of bud development was
recorded three times per week from dormancy to full bloom in each location. Due to a lack
of recorded data, axillary bud data for both years as well as terminal data for 2013 from
Shepparton were excluded from the analyses.
Additionally, hourly temperature data were recorded at each site for 2012 and 2013.
2.3 Analytical approach
Temperature—Differences in temperature between locations and years were calculated
using the arithmetic difference between mean temperatures for winter season.
Variability between trees—To test the presence of non-significant differences (H0) in the
median day-of-year of green tip between trees in each location a two tailed non-parametric
analysis of variance test, Kruskal-Wallis (Kruskal and Wallis 1952, Zar 2010), was used over
the data. To perform the analysis all the data from each bud type were grouped together by
tree. The alternative hypothesis was that significant differences existed in the median day-
of-year of green tip between trees. The significance level was set a p-value <0.05, if the
given p-value is less than 0.05, non-significant differences can be rejected.
Normality of the green tip data—A normality test, Shapiro-Wilk test (Shapiro and Wilk
1965, Wilks 2011), was performed over the individual green tip data at each location for
both years in order to decide the type of tests, parametric or non-parametric5, that should
be applied to the individual data. The null hypothesis (H0) for this test was that the day-of-
5 Non-parametric tests do not assume the normality of the data Dytham, C 2011 Choosing and using statistics:a biologist's guide, John Wiley & Sons.
Marco Rodrigo Calderón Loor Id #: 615288 13
year of individual green tip data was taken from a population with normal distribution. The
alternative hypothesis (Ha) was that the samples came from a population with a non-normal
distribution.
Variability between bud types—To test if there were non-significant differences (H0) in the
median day-of-year when individual buds reached green tip across Australia in both years a
pairwise two-sample non-parametric test, Wilcoxon-Mann-Whitney (Wilks 2011) was used.
To perform the test the significance level was set a p-value <0.05 (two sided).
All the statistical analyses were performed using R statistical software (R Core Team 2012).
3 Results
3.1 Temperature differences
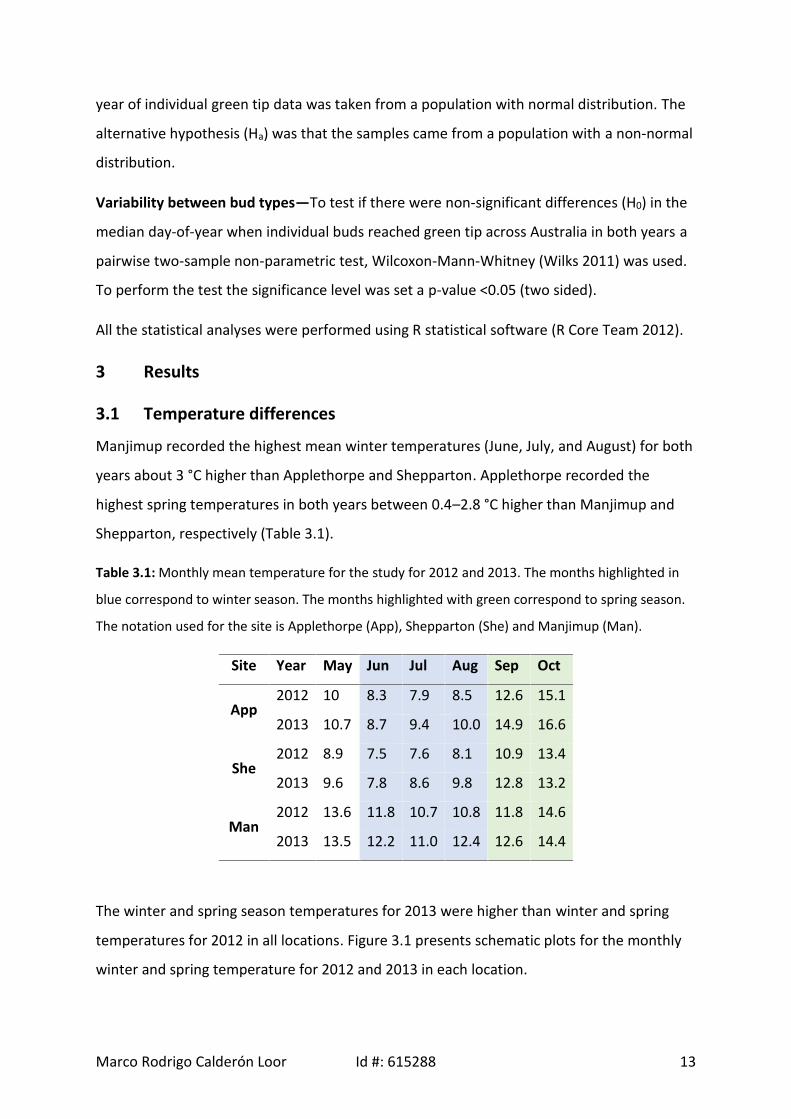
Manjimup recorded the highest mean winter temperatures (June, July, and August) for both
years about 3 °C higher than Applethorpe and Shepparton. Applethorpe recorded the
highest spring temperatures in both years between 0.4–2.8 °C higher than Manjimup and
Shepparton, respectively (Table 3.1).
Table 3.1: Monthly mean temperature for the study for 2012 and 2013. The months highlighted in
blue correspond to winter season. The months highlighted with green correspond to spring season.
The notation used for the site is Applethorpe (App), Shepparton (She) and Manjimup (Man).
Site Year May Jun Jul Aug Sep Oct
App2012 10 8.3 7.9 8.5 12.6 15.1
2013 10.7 8.7 9.4 10.0 14.9 16.6
She2012 8.9 7.5 7.6 8.1 10.9 13.4
2013 9.6 7.8 8.6 9.8 12.8 13.2
Man2012 13.6 11.8 10.7 10.8 11.8 14.6
2013 13.5 12.2 11.0 12.4 12.6 14.4
The winter and spring season temperatures for 2013 were higher than winter and spring
temperatures for 2012 in all locations. Figure 3.1 presents schematic plots for the monthly
winter and spring temperature for 2012 and 2013 in each location.

Marco Rodrigo Calderón Loor Id #: 615288 14
a
b
05
1015
2025
Applethorpe
Month
Tem
pera
ture
(°C)
05
1015
2025
Applethorpe
Month
20122013
May Jun Jul Aug Sep Oct
05
1015
2025
Shepparton
Month
Tem
pera
ture
(°C)
05
1015
2025
Shepparton
Month
20122013
May Jun Jul Aug Sep Oct

Marco Rodrigo Calderón Loor Id #: 615288 15
c
Figure 3.1: Schematic plots of daily means winter and spring temperatures grouped by month for a)Applethorpe, b) Shepparton and c) Manjimup for 2012 (black) and 2013 (blue).
3.2 Variability between trees
The results of the non-parametric analysis of variance (Kruskal-Wallis) conducted on the
green tip observations at the whole tree level (pooled data) indicate that there were not
statistical differences between the trees, p-values ≥ 0.05 (Table 3.2). Therefore, the null
hypothesis was accepted. These results demonstrate that differences in the day-of-year of
green tip at each location were not driven by differences at the tree level, hence, statistical
tests at the bud level were conducted.
Table 3.2: Results of Kruskal-Wallis test of the differences in the day-of-year in reach green tipbetween trees, p-values ≥ 0.5 means that there were no significant difference between trees.
Kruskal-WallisLocation Year p-valueApp 2012 0.65App 2013 0.14She 2012 0.77Man 2012 0.59Man 2013 0.35
510
1520
25
Manjimup
Month
Tem
pera
ture
(°C)
510
1520
25
Manjimup
Month
20122013
May Jun Jul Aug Sep Oct

Marco Rodrigo Calderón Loor Id #: 615288 16
3.3 Normality of the green tip data
The p-values obtained in the Shapiro-Wilk test showed that the day-of-year when each bud
type reached green tip follows a non-normal distribution in all locations for both years (p-
value < 0.05), except axillary buds in Applethorpe and Manjimup for 2013 (Table 3.3).
Therefore the alternative hypothesis was accepted, that is the green tip data come from a
population with non-normal distribution, thus non-parametric tests were used to analyse
the green tip data.
Table 3.3: Shapiro-Wilk test for each data set. The highlighted cells represents data with normaldistribution (p-value ≥ 0.05).
Shapiro-WilkVariety Location Bud type Year n p-value
Crip
psPi
nk
App Axillary 2012 49 <0.05App Axillary 2013 38 0.19App Spur 2012 50 <0.05App Spur 2013 50 <0.05App Terminal 2012 50 <0.05App Terminal 2013 50 <0.05She Spur 2012 32 <0.05She Spur 2013 50 <0.05She Terminal 2013 50 <0.05Man Axillary 2012 28 <0.05Man Axillary 2013 23 0.07Man Spur 2012 36 <0.05Man Spur 2013 40 <0.05Man Terminal 2012 34 <0.05Man Terminal 2013 40 <0.05
3.4 Day-of-year of green tip
The day-of-year when the measured buds reached green tip differed according to location
and bud type (Table 3.4). Buds in Shepparton burst first in 2012 marking the beginning of
the green tip phase, 241 day-of-year, followed by Applethorpe, 243 day-of-year, and almost
20 days later those located in Manjimup burst, 262 day-of-year for 2012. In 2013 buds in
Shepparton and Applethorpe burst on the same day-of-year, 244 day-of-year, followed by
Manjimup, 260 day-of-year. A similar trend was found for the median day-of-year of green
tip in both years. These results show that generally spur buds were the first buds to reach

Marco Rodrigo Calderón Loor Id #: 615288 17
the green tip phase, whereas axillary buds where the last to reach this phase at all locations
and for both years (Table 3.4).
All bud types burst later in 2013 than in 2012 at all locations, excepting spur buds in
Shepparton, which showed an advancement of 1 day compared with 2012 in the median
day-of-year when buds reached green tip (Table 3.4). The range of this delay in 2013
compared with 2012 was from 1 (spur buds in Applethorpe and terminal buds in Manjimup)
to 13 days (spur buds in Manjimup).
3.5 Length of green tip stage
The length of the green tip stage was calculated by subtracting the day-of-year when the
first bud reached green tip from the day-of-year when the last bud in burst. The length of
this stage across Australia varied widely between locations, bud types and the two years.
The length varied between 5 days for terminal buds in Shepparton for 2013 to 40 days for
spur buds in Manjimup in 2013 (Figure 3.2). The buds from trees in Manjimup recorded the
highest average length of green tip stage in both years, approximately 28 days, followed by
Applethorpe, 22 days, and finally Shepparton, 11 days6. The length of the green tip stage
was longer in 2013 at all locations and for all bud types, except for spur buds in Shepparton
which burst over a period of 7 days in 2013 compared with 21 days in 2012. The difference
in the length of the green tip phase between years was largest at Manjimup with an average
increase of 13 days with terminal buds demonstrating the largest lengthening of 15 days.
Differences in length were also present between bud types within locations, axillary buds in
Applethorpe burst over a longer time in both years (25 and 35 days in 2012 and 2013
respectively), whereas spur buds in Manjimup recorded the highest spread (28 and 40 days
for 2012 and 2013 respectively). The median absolute deviation (MAD) presented in Table
3.4, shows the same trend where longer lengths are positively correlated with higher MAD
values.
6 Datasets of spur and terminal buds only.

Marco Rodrigo Calderón Loor Id #: 615288 18
Table 3.4: Summary of median day-of-year of green tip and length of the phase for each type of budand location for Cripps pink apple. Blue and orange cells are the maximum and minimum values foreach parameter respectively. Where: n: number of buds, DOY: Day-of-year, MAD: Median absolutedeviation, FDOY: First day-of-year, LDOY: Last day-of-year, LGT: Length of green tip phase and IQR:Interquartile range.
Site Bud type Year n Median(DOY)
MAD(days) FDOY LDOY LGT
(days)IQR
(days)App Axillary 2012 49 264 6 246 271 25 13App Axillary 2013 38 267 7 251 286 35 10App Spur 2012 50 246 3 243 262 19 4App Spur 2013 50 248 4 244 265 21 7App Terminal 2012 50 247 1 243 255 12 2App Terminal 2013 50 253 7 244 262 18 8She Spur 2012 32 247 4 241 262 21 7She Spur 2013 50 246 3 244 251 7 2She Terminal 2013 50 248 0 246 251 5 3Man Axillary 2012 28 281 7 275 290 15 10Man Axillary 2013 23 286 10 273 300 27 10Man Spur 2012 36 269 5 262 290 28 6Man Spur 2013 40 282 9 260 300 40 12Man Terminal 2012 34 281 5 275 295 20 5Man Terminal 2013 40 282 4 265 300 35 3
The length of the green tip phase where half of the observations were concentrated (IQR)
was significantly shorter than the total length of the green tip phase (LGT), but showed
similar trends. IQR is shown graphically in Figure 3.2 as the observations inside the boxes,
additionally the full distribution of the day-of-year when each type of bud reached green tip
in 2012 and 2013 is displayed in the same figure.
For instance, spur buds in Manjimup for 2013 burst over 40 days; however the IQR was only
12 days, that is it took an extra 28 days to complete the green tip phase. Likewise, the
results showed a mix of right, none (almost evenly distributed) and left green tip data
skewed, representing where most of the green tip was concentrated. All the axillary buds
had none or left skewness meaning that the development of the phase was slower at the
beginning and then the remaining buds burst quickly. Conversely, terminal and spur buds
had none or right skewness in the observations. In this case, the most of the buds burst at
the beginning of the stage and only a few buds burst slowly towards the end of the phase. In
addition, although the LGT varied widely between buds, locations and years, between 5–40
days, the IQR had a less variability, between 2–13 days, which means that 50% of the

Marco Rodrigo Calderón Loor Id #: 615288 19
observations occurred in this narrower period of time. For instance, the terminal buds of
‘Cripps Pink’ apple grown in Manjimup for 2013 burst over 35 days; however, 50% of the
buds burst in only 3 days, that is it took 32 extra days to complete the green tip phase.
a
b
Figure 3.2: Observed green tip day-of-year for Cripps pink apple buds in Applethorpe (QLD, blackcircles), Shepparton (VIC, blue circles) and Manjimup (WA, red circles) for a) 2012 and b) 2013.
Day of year
Axi
llary
Spu
rTe
rmin
al
240 250 260 270 280 290 300
AppSheMan
September October
A) 2012
Day of year
Axi
llary
Spu
rTe
rmin
al
240 250 260 270 280 290 300
AppSheMan
September October
B) 2013
Marco Rodrigo Calderón Loor Id #: 615288 20
3.6 Variability in green tip timing
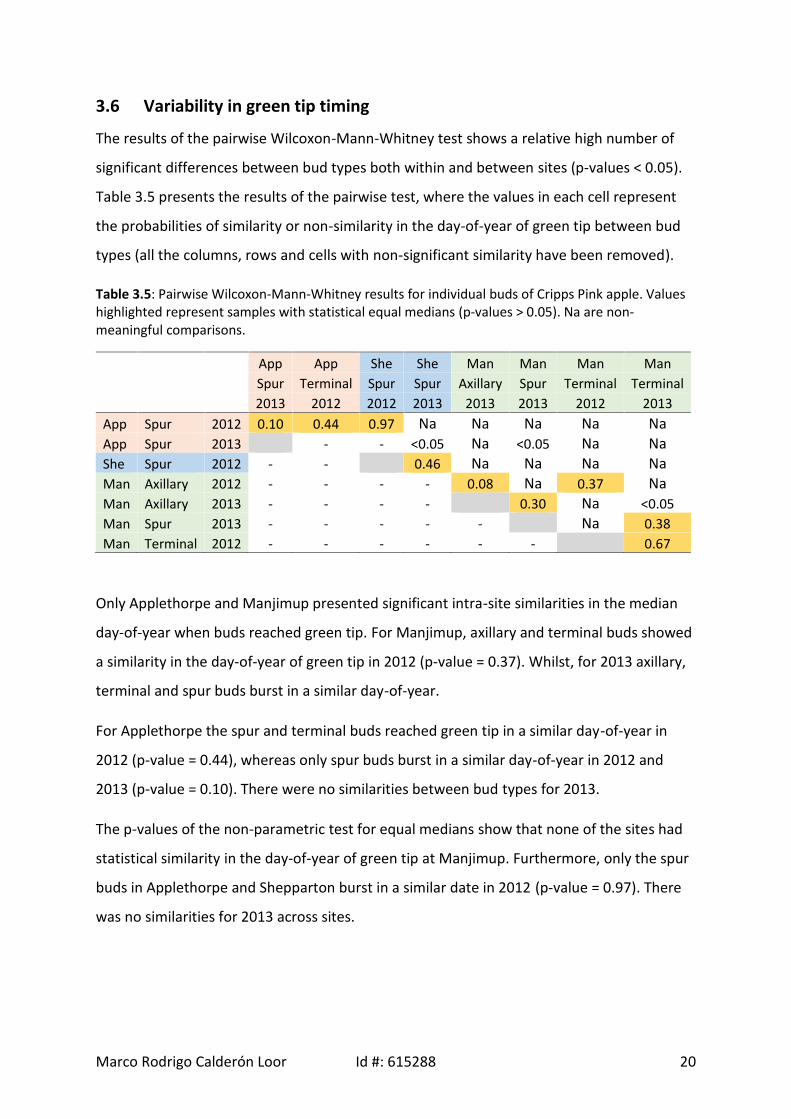
The results of the pairwise Wilcoxon-Mann-Whitney test shows a relative high number of
significant differences between bud types both within and between sites (p-values < 0.05).
Table 3.5 presents the results of the pairwise test, where the values in each cell represent
the probabilities of similarity or non-similarity in the day-of-year of green tip between bud
types (all the columns, rows and cells with non-significant similarity have been removed).
Table 3.5: Pairwise Wilcoxon-Mann-Whitney results for individual buds of Cripps Pink apple. Valueshighlighted represent samples with statistical equal medians (p-values > 0.05). Na are non-meaningful comparisons.
App App She She Man Man Man ManSpur Terminal Spur Spur Axillary Spur Terminal Terminal2013 2012 2012 2013 2013 2013 2012 2013
App Spur 2012 0.10 0.44 0.97 Na Na Na Na NaApp Spur 2013 - - <0.05 Na <0.05 Na NaShe Spur 2012 - - 0.46 Na Na Na NaMan Axillary 2012 - - - - 0.08 Na 0.37 NaMan Axillary 2013 - - - - 0.30 Na <0.05Man Spur 2013 - - - - - Na 0.38Man Terminal 2012 - - - - - - 0.67
Only Applethorpe and Manjimup presented significant intra-site similarities in the median
day-of-year when buds reached green tip. For Manjimup, axillary and terminal buds showed
a similarity in the day-of-year of green tip in 2012 (p-value = 0.37). Whilst, for 2013 axillary,
terminal and spur buds burst in a similar day-of-year.
For Applethorpe the spur and terminal buds reached green tip in a similar day-of-year in
2012 (p-value = 0.44), whereas only spur buds burst in a similar day-of-year in 2012 and
2013 (p-value = 0.10). There were no similarities between bud types for 2013.
The p-values of the non-parametric test for equal medians show that none of the sites had
statistical similarity in the day-of-year of green tip at Manjimup. Furthermore, only the spur
buds in Applethorpe and Shepparton burst in a similar date in 2012 (p-value = 0.97). There
was no similarities for 2013 across sites.

Marco Rodrigo Calderón Loor Id #: 615288 21
4 Discussion
4.1 Differences in green tip timing
The results showed that spur buds were the first buds to reach green tip in all locations for
both years, followed closely by terminal buds and later axillary buds. The results confirmed
that these differences were not driven by differences between trees (Table 3.2), but by the
bud types (Table 3.5). These differences agree with previous results from Paiva and
Robitaille (1978) and Naor et al. (2003). Both studies found that terminal buds burst earlier
than axillary buds. Maguylo et al. (2012) found a similar response for terminal buds of
Golden Delicious and Granny Smith apple which burst early than axillary buds. However, the
authors did not find any significant difference in the day-of-year of green tip between
terminal and axillary buds of Granny Smith, which is only comparable with the green tip
data for 2013 in Manjimup. Factors affecting these differences may be related to the
variety, the area and local climate conditions. It is not clear if any of these authors made a
distinction between terminal and spur buds.
Naor et al. (2003) state two main underlying reasons influencing the differences in green tip
timing between terminal/spur and axillary buds. Firstly, the specific chilling requirements of
each type of bud and secondly, the apical dominance exerted by terminal and spur buds
over axillary buds. A combination of these two phenomena may be influencing the delay of
green tip in axillary buds. This delay was observed at Applethorpe, in both years, where the
median day-of-year when axillary buds reached green tip was after the end of the green tip
phase for the spur and terminal buds. However, as was discussed above, this behaviour was
not observed at Manjimup. The non-parametric test of significance showed that the
differences in the day-of-year of green tip between axillary and spur buds were not
significant in the 2013 season at Manjimup.
It is possible that bud positioning may be driving some of the observed variability in timing
between the bud types. Cook and Jacobs (1999) found that the relative position of the bud
in the shoot may have an influence in the timing of green tip. Buds closer to the end of the
branches (distal buds) reached green tip phase first, whereas buds closer to where the
branches are attached to the trunk of the tree (proximal buds) were inhibited and burst
later.

Marco Rodrigo Calderón Loor Id #: 615288 22
Tree architecture and training systems at each location may have influenced the day-of-year
of green tip (Campoy et al. 2011). For instance, Erez (2000) and Naor et al. (2003) argue that
the orientation of the branches has an effect on green tip timing due to changes in hormone
balances in the buds. They found that buds located on horizontally oriented branches burst
earlier than those located on upright ones.
4.2 Effect of temperature on green tip timing
In general, the differences in green tip timing across locations were statistically significant.
These differences could be related to the differences in winter temperature between the
locations. The coldest region in winter was Shepparton followed by Applethorpe and
Manjimup, about 8.2, 8.8 and 11.5 °C in average for both years respectively. This was
consistent with the order in which the buds burst across sites. That is, green tip occurred
earlier in Shepparton and Applethorpe than in Manjimup.
Other studies have also found differences in green tip timing between locations. Maguylo et
al. (2012) found significant differences between areas with different temperatures in the
day-of-year of green tip of terminal and axillary buds for Golden Delicious apple. The delay
of axillary buds compared with the terminal buds was larger in the warmer area (20 days)
than the cooler area (6 days). The results of this research show an opposite relationship, the
biggest delay in green tip between these two types of buds was found in one of the coolest
areas, Applethorpe around 15 days, than the warmer area, Manjimup approximately 3 days.
Although the differences may be related to the varieties and their specific chilling
requirements, further research is needed using data from the same variety and information
about chilling requirements.
Similarly, the length of the green tip phase was consistent with differences in winter
temperature. On average across all bud types in Manjimup green tip occurred over a period
of approximately 28 days, followed by Applethorpe and Shepparton7, approximately 22 and
11 days, respectively. However, there was not a clear trend in the length of the green tip
phase within sites. For instance, the buds which burst over the longest period of time were
axillary buds in Applethorpe and spur buds in Manjimup (for both years). On the other hand,
7 Only information about terminal and spur buds.

Marco Rodrigo Calderón Loor Id #: 615288 23
the buds that burst quickest were terminal buds in Applethorpe and axillary buds in
Manjimup. Further research is needed to understand the cause of these differences.
Comparison between winter temperatures for both years showed that the 2013 winter
season in all locations was warmer than the winter temperature for 2012, about 1 °C higher
in all locations. Coupled with these higher winter temperatures a delay in the day-of-year
when the buds reached the green tip phase was observed in all locations. Spur buds in
Shepparton were an exception which showed an advancement of 1 day.
It was observed that the LGT and MAD were greater for 2013 (except for spur buds in
Shepparton), whereas the IQR of the observations were only greater in spur and terminal
buds in Applethorpe and spur buds in Manjimup for 2013. These results suggest that the
LGT and MAD (length and variability of the green tip phase) were more responsive to the
increases in mean winter temperature than the IQR, i.e. the length of time where green tip
was more intense was not directly affected by winter temperatures. One possible
explanation is that buds had suboptimal chilling due to warmer temperatures during
dormancy in 2013 (Cannell and Smith 1986). Therefore, each type of bud may have broken
the dormancy at different dates, causing a delay and a sporadic green tip in some cases
(buds with longer LGT). Results from Tromp (1976) shows a similar tendency when apple
trees were exposed to different temperatures during the dormancy phase, those exposed to
warmer temperatures demonstrated a delayed green tip. Similar trends were found by Cook
and Jacobs (1999) where buds growing in warmer areas burst more erratically and unevenly
than buds exposed to colder temperatures.
Although a number of studies have found that advances in flowering are linked with
increases in temperature (Chmielewski et al. 2004, Estrella et al. 2007), the result from this
study suggest that warmer temperatures in winter have the opposite effect on green tip
timing, i.e. causing a delay. This effect has been discussed by Cannell and Smith (1986) and
more recently by Cook et al. (2012) and Pope et al. (2013). Not all the species respond the
same way to changes in temperature and the results of this investigation suggest that
‘Cripps Pink’ apple, for the locations investigated, can be either responsive only to winter
temperatures or both spring and winter temperatures. Moreover, Darbyshire et al. (2012)
found delays in the historical trend of flowering of two one variety of apple (Granny Smith)
and one of pear (William’s Bon Chretien) which showed a delay in the full bloom timing of

Marco Rodrigo Calderón Loor Id #: 615288 24
0.6 and 1.4 days/decade respectively. Analyses of flowering and its responses to winter and
spring temperature may help to understand the effects of temperature in the spring
phenology of this variety. Due to data restrictions these analyses were not carried out in this
study, as a model could not be constructed.
4.3 Sample size
Temperature data was used to infer differences in green tip timing for different bud types.
Additional data is needed to allow a greater analysis of the drivers of green tip timing of
different bud types. Information about bud position (relative to the top of the tree, the
shoot and the branch) may help to explain differences in timing and variability between bud
types across locations. In addition, information about completion of the dormancy stage
(chilling requirements) and specific heat requirements of the different bud types may give
an idea about the beginning, variability and spread of the green tip phase.
Similarly, despite that the use of the recorded winter temperatures helped to provide an
explanation about the differences in the date and variability of green tip between bud types,
location and years, it did not give enough information to explain differences in progression
of the stage, specifically in differences in LGT and burst intensity. Improving the sample size
would provide better explanations of these phenomena. Furthermore, since apple trees can
have about 200–600 buds, depending on the tree size and training system, the sample size
(30 buds per tree) represents around 2.5–15% of the total number of buds. Authors such as
Luedeling (2012) argue the need for improved representativeness of the samples to improve
the accuracy of the results and reduce uncertainty. Depending on available resources,
factors such as the percentage of each type of bud in the tree could be used to establish a
weighted sample depending on the type of bud. Moreover, the variability reported in this
study (MAD) can be used to calculate the ideal sample size given an initial estimation error
(usually less than 10 %).
4.4 Climate change implications
The projections of the ensemble of global climate models presented by IPCC (2013)
reported that temperature increases will continue in the future. For instance, it was
projected that mean winter temperature for 2035 will increase by 0.5–1 °C across most
Australia compared with 1986–2005 baseline, results similar to those constructed by CSIRO
Marco Rodrigo Calderón Loor Id #: 615288 25
(2007). However for 2065 and 2100 it is expected that zones around Applethorpe will suffer
an increase of 1.5–2 °C and 2–3 °C respectively, compared with Manjimup and Shepparton
1–1.5 and 1–2 °C respectively (IPCC 2013). Given these possible scenarios, further shifts in
flowering dates are likely.
Following the discussion of Darbyshire et al. (2013) future increases in temperature will
reduce the amount of chilling over Australia. This may cause shifts and/or a reduction of the
suitable area for growing other pome fruit varieties and species (Webb and Whetton 2010).
Moreover, the author note that the impacts of increases in mean winter temperature will be
different depending on the location. Thus, sites currently colder, may demonstrate a lower
impacts than sites currently warmer. Therefore, according to the results of this research the
delay in spring phenology for trees located in Manjimup might be bigger in the future, as
well as the difference in days in reaching green tip with Shepparton and Applethorpe.
The impacts of increases in temperature can vary, from delays in green tip and flowering
timing (Cannell and Smith 1986) to reduction in yield (Erez 2000) and loss of suitable area
for growing crops (Webb and Whetton 2010). Therefore, adaptive strategies are needed to
mediate these expected impacts of climate change. In this context, Webb and Whetton
(2010) describe some options for Australian agriculture sectors. Some of these strategies
include assessments of the current growing areas to select sites suitable to maintain
production and development of new varieties with lower chill requirements that will be
suited to new climatic conditions.
5 Conclusion
The day-of-year when buds reached the green tip phase varied significantly—with a few
exceptions—with bud type, location and year. In general, the first buds to burst were spur
buds, followed by terminal and axillary buds. There was a consistent relationship between
temperature and date of green tip across locations. Areas with higher winter temperatures
had later day-of-year of green tip than areas with lower winter temperatures. This delay in
green tip timing was found experienced for almost all types of buds in all locations.
However, there was not a clear relationship between temperature and the period of time
when green tip was more intense (IQR).

Marco Rodrigo Calderón Loor Id #: 615288 26
Winter temperature provided insights into explaining the differences in green tip timing
between bud types, locations and years. Nevertheless, a bigger sample size and additional
data is needed in order to understand the observed differences. These data include
information about relative position of the buds, orientation of the trees, tree architecture,
management of the orchards, training systems, temperature of the buds and chilling and
heat requirements. Similarly, it is important to investigate how the variability in green tip
timing reported in this study affects subsequent developmental phases and overall
productivity. Additionally, it is important to develop comparative studies with other apple
varieties and other pome fruit species, such as pears, to improve knowledge at the bud scale
and to develop better adaptive measures for possible future climate impacts.

Marco Rodrigo Calderón Loor Id #: 615288 27
6 References
Andreini, L, De Cortázar-Atauri, IG, Chuine, I, Viti, R, Bartolini, S, Ruiz, D, Campoy, JA, Legave,JM, Audergon, J-M and Bertuzzi, P 2014, Understanding dormancy release in apricotflower buds (Prunus armeniaca L.) using several process-based phenological models,Agricultural and Forest Meteorology, vol. 184, pp. 210-219.
Apal 2013, Statistics, Apple and Pear Australia Limited, viewed 25 September 2014,<http://apal.org.au/statistics/>.
Apal 2014, Statistics – Australian apple and pear industry, Apple and Pear Australia Limited,viewed 03 October 2014, <http://apal.org.au/statistics/>.
Aussie Apples 2012, Pink Lady TM, Aussie Apples, viewed 11 October 2014,<http://www.aussieapples.com.au/aussie-grown-varieties/pink-lady.aspx>.
Australian Bureau of Statistics 2011, 7121.0.55.002 - Agricultural Survey, Apples and Pears,Australia, 2007-08, Australian Bureau of Statistics, viewed 11 Oct 2014,<http://www.abs.gov.au/ausstats/[email protected]/Previousproducts/7121.0.55.002Main%20Features22007-08?opendocument&tabname=Summary&prodno=7121.0.55.002&issue=2007-08&num=&view=>.
Australian Bureau of Statistics 2013, 7121.0 - Agricultural Commodities, Australia, 2011-12,Australian Bureau of Statistics, viewed 14 May 2014,<http://www.abs.gov.au/ausstats/[email protected]/Lookup/7121.0main+features72011-12>.
Campoy, J, Ruiz, D and Egea, J 2011, Dormancy in temperate fruit trees in a global warmingcontext: A review, Scientia Horticulturae, vol. 130, no. 2, pp. 357-372.
Campoy, J, Ruiz, D, Nortes, M and Egea, J 2013, Temperature efficiency for dormancyrelease in apricot varies when applied at different amounts of chill accumulation,Plant Biology, vol. 15, no. s1, pp. 28-35.
Campoy, JA, Ruiz, D, Allderman, L, Cook, N and Egea, J 2012, The fulfilment of chillingrequirements and the adaptation of apricot (Prunus armeniaca L.) in warm winterclimates: An approach in Murcia (Spain) and the Western Cape (South Africa),European Journal of Agronomy, vol. 37, no. 1, pp. 43-55.
Cannell, M and Smith, R 1986, Climatic warning,spring budburst and frost damage, Journalof Applied Ecology, vol. 23, pp. 16.
Charrier, G, Bonhomme, M, Lacointe, A and Améglio, T 2011, Are budburst dates, dormancyand cold acclimation in walnut trees (Juglans regia L.) under mainly genotypic orenvironmental control?, International journal of biometeorology, vol. 55, no. 6, pp.763-774.
Chmielewski, F-M, Müller, A and Bruns, E 2004, Climate changes and trends in phenology offruit trees and field crops in Germany, 1961–2000, Agricultural and ForestMeteorology, vol. 121, no. 1, pp. 69-78.
Cook, BI, Wolkovich, EM and Parmesan, C 2012, Divergent responses to spring and winterwarming drive community level flowering trends, Proceedings of the NationalAcademy of Sciences, vol. 109, no. 23, pp. 9000-9005.
Cook, NC, Rabe, E, Keulemans, J and Jacobs, G 1998, The expression of acrotony indeciduous fruit trees: a study of the apple rootstock M. 9, Journal of the AmericanSociety for Horticultural Science, vol. 123, no. 1, pp. 30-34.
Marco Rodrigo Calderón Loor Id #: 615288 28
Cook, NC and Jacobs, G 1999, Suboptimal winter chilling impedes development of acrotonyin apple shoots, HortScience, vol. 34, no. 7, pp. 1213-1216.
Costes, E, Lauri, P and Regnard, J 2006, Analyzing fruit tree architecture: implications fortree management and fruit production, Horticultural reviews, vol. 32, pp. 1-61.
Csiro 2007 Climate Change in Australia - Technical Report 2007, Melbourne, CSIRO andBureau of Meteorology.
Darbyshire, R, Webb, L, Goodwin, I and Barlow, S 2011, Winter chilling trends for deciduousfruit trees in Australia, Agricultural and Forest Meteorology, vol. 151, no. 8, pp. 1074-1085.
Darbyshire, R, Webb, L, Goodwin, I and Barlow, E 2012, Evaluation of recent trends inAustralian pome fruit spring phenology, International journal of biometeorology, vol.57, no. 3, pp. 409-421.
Darbyshire, R, 2013, Winter and Spring Phenology of Australian Pome Fruit in Historical andFuture Climates Doctor of Philosophy, The University of Melbourne.
Darbyshire, R, Webb, L, Goodwin, I and Barlow, E 2013, Impact of future warming on winterchilling in Australia, International journal of biometeorology, vol. 57, no. 3, pp. 355-366.
Dennis, F 2003, Problems in standardizing methods for evaluating the chilling requirementsfor the breaking of dormancy in buds of woody plants, HortScience, vol. 38, no. 3, pp.347-350.
Dytham, C 2011 Choosing and using statistics: a biologist's guide, John Wiley & Sons.Erez, A 2000 'Bud dormancy; phenomenon, problems and solutions in the tropics and
subtropics', in: Temperate fruit crops in warm climates, Springer, pp. 17-48.Estrella, N, Sparks, TH and Menzel, A 2007, Trends and temperature response in the
phenology of crops in Germany, Global Change Biology, vol. 13, no. 8, pp. 1737-1747.
Faust, M, Erez, A, Rowland, LJ, Wang, SY and Norman, HA 1997, Bud dormancy in perennialfruit trees: physiological basis for dormancy induction, maintenance, and release,HortScience: a publication of the American Society for Horticultural Science, vol. 32.
Ferree, DC and Warrington, IJ 2003 Apples: botany, production, and uses, CABI Publishing,United Kingdom.
Grab, S and Craparo, A 2011, Advance of apple and pear tree full bloom dates in response toclimate change in the southwestern Cape, South Africa: 1973–2009, Agricultural andforest meteorology, vol. 151, no. 3, pp. 406-413.
Heide, O 1993, Daylength and thermal time responses of budburst during dormancy releasein some northern deciduous trees, Physiologia Plantarum, vol. 88, no. 4, pp. 531-540.
Horvath, D 2009, Common mechanisms regulate flowering and dormancy, Plant science, vol.177, no. 6, pp. 523-531.
Ipcc Stocker, T, Qin, D, Plattner, G, Tignor, M, Allen, S, Boschung, J, Nauels, A, Xia, Y, Bex, V& Midgley, P (eds.) 2013 Climate change 2013: The physical science basis.Contribution of Working Group I to the Fifth Assessment Report of theIntergovernmental Panel on Climate Change, Cambridge University Press,Cambridge.
Jackson, D, Looney, NE and Morley-Bunker, M 2011 Temperate and Subtropical FruitProduction, CABI.
Jackson, JE 2003 The biology of apples and pears, Cambridge University Press.
Marco Rodrigo Calderón Loor Id #: 615288 29
Kruskal, WH and Wallis, WA 1952, Use of ranks in one-criterion variance analysis, Journal ofthe American statistical Association, vol. 47, no. 260, pp. 583-621.
Lakso, A 1994 'Apple', Schaffer, B & Andersen, P (eds.) in: Handbook of environmentalphysiology of fruit crops. Volume I: Temperate crops, CRC Press.
Lang, G, Early, J, Martin, G and Darnell, R 1987, Endo-, para-, and ecodormancy:physiological terminology and classification for dormancy research, HortScience, vol.22, no. 3, pp. 371-377.
Legave, J-MJ-M, Alméras, T, Farrera, I and Calleja, M 2008, Selecting models of appleflowering time and understanding how global warming has had an impact on thistrait, Journal of Horticultural Science & Biotechnology, vol. 83, no. 1, pp. 76-84.
Legave, JM, Blanke, M, Christen, D, Giovannini, D, Mathieu, V and Oger, R 2013, Acomprehensive overview of the spatial and temporal variability of apple buddormancy release and blooming phenology in Western Europe, International journalof biometeorology, vol. 57, no. 2, pp. 317-331.
Luedeling, E 2012, Climate change impacts on winter chill for temperate fruit and nutproduction: a review, Scientia Horticulturae, vol. 144, pp. 218-229.
Maguylo, K, Cook, NC and Theron, KI 2012, Environment and position of first bud to breakon apple shoots affects lateral outgrowth, Trees, vol. 26, no. 2, pp. 663-675.
Marini, RP and Facts, AP 2003, Physiology of pruning fruit trees, Virginia CooperativeExtension.
Martin, G 1991 'Bud dormancy in deciduous fruit trees', Steward, FC (ed.) in: PlantPhysiology a Treatise. Volume X: Growth and Development, Academic Press, NewYork.
Mitchell, P, Goodwin, I and Jerie, P 1994 'Pear and Quince', Schaffer, B & Andersen, P (eds.)in: Handbook of environmental physiology of fruit crops. Volume I: Temperate crops,CRC Press.
Naor, A, Flaishman, M, Stern, R, Moshe, A and Erez, A 2003, Temperature effects ondormancy completion of vegetative buds in apple, Journal of the American Societyfor Horticultural Science, vol. 128, no. 5, pp. 636-641.
Paiva, E and Robitaille, H 1978, Breaking bud rest on detached apple shoots: Effects ofwounding and ethylene, Journal American Society for Horticultural Science, vol. 103.
Phillips, M 2005 The Apple Grower: A Guide for the Organic Orchardist, Chelsea GreenPublishing Company.
Pope, KS, Dose, V, Da Silva, D, Brown, PH, Leslie, CA and Dejong, TM 2013, Detectingnonlinear response of spring phenology to climate change by Bayesian analysis,Global change biology, vol. 19, no. 5, pp. 1518-1525.
R Core Team 2012 R: A Language and Environment for Statistical Computing, RFoundationfor Statistical Computing, Vienna, Austria.
Ramírez, F and Davenport, TL 2013, Apple pollination: A review, Scientia Horticulturae, vol.162, pp. 188-203.
Rodrigo, J 2000, Spring frosts in deciduous fruit trees—morphological damage and flowerhardiness, Scientia Horticulturae, vol. 85, no. 3, pp. 155-173.
Rohde, A and Boerjan, W 2001 'Insights into bud development and dormancy in poplar', in:Trends in European Forest Tree Physiology Research, Springer, pp. 33-52.
Salisbury, F and Ross, C 1992 Plant Physiology. Fourth Edition, Wadsworth Inc, Belmont,California.

Marco Rodrigo Calderón Loor Id #: 615288 30
Saure, M 1985, Dormancy release in deciduous fruit trees, Horticultural Reviews, Volume 7,pp. 239-300.
Schroeder, AL 1921 Buds, Winsconsin, Wisconsin State Horticultural Society.Shapiro, SS and Wilk, MB 1965, An analysis of variance test for normality (complete
samples), Biometrika, pp. 591-611.Simpson, MG 2010 Plant systematics, Academic press.Strand, LL, Program, UOCIPM, Agriculture, UOCDO and Resources, N 1999 Integrated Pest
Management for Stone Fruits, University of California, Statewide Integrated PestManagement Project, Division of Agriculture and Natural Resources.
Taiz, L and Zeiger, E 2006 Plant Physiology, Sinauer Associates, Sunderland, Massachusetts.Tromp, J 1976, Flower-bud formation and shoot growth in apple as affected by
temperature, Scientia Horticulturae, vol. 5, no. 4, pp. 331-338.Voller, C 2004, The effect of dormancy and rest-breaking on production and fruit quality, SA
Fruit Journal, vol. 2, no. 1, pp. 8.Webb, L and Whetton, P 2010 'Horticulture', Stokes, C & Howden, M (eds.) in: Adapting
agriculture to climate change, CSIRO, Colingwood, Australia.Wilkie, JD, Sedgley, M and Olesen, T 2008, Regulation of floral initiation in horticultural
trees, Journal of Experimental Botany, vol. 59, no. 12, pp. 3215-3228.Wilks, DS 2011 Statistical methods in the atmospheric sciences, Academic press, Oxford, UK.Zar, JH 2010 Biostatistical analysis, Prentice Hall Upper Saddle River, NJ, United States of
America.Zavalloni, C, Andresen, JA and Flore, J 2006, Phenological Models of Flower Bud Stages and
Fruit Growth of 'Montmorency' Sour Cherry Based on Growing Degree-dayAccumulation, Journal of the American Society for Horticultural Science, vol. 131, no.5, pp. 601-607.