paper rv-235 a real world example: using the...
TRANSCRIPT

SESUG 2016
Paper RV-235
A Real World Example: Using the SAS® ODS Report Writing Interface to Revamp South Carolina's School District Special Education Data
Profiles
Fred Edora, South Carolina Department of Education, Columbia, SC
ABSTRACT
Creating complex reports can be a daunting task, especially when using multiple data sources. The SAS® ODS
Report Writing Interface can provide a significant amount of flexibility for your reports. Prior to the use of SAS, the
South Carolina Department of Education’s 88 special education district data profiles were created using Microsoft
Excel and Word and were required to be produced annually. With limited staff, this process took weeks to build the
reports and was not flexible to meet changing data needs. This paper will illustrate how the SAS ODS Report
Writing Interface helped revamp these annual district reports to help staff save time and effort while also including
additional features and data (such as conditional processing and color coding) to give the reports a more professional
appearance.
INTRODUCTION
Regulations in the administration of the Individuals with Disabilities in Education Act (IDEA) require states to make
determinations of school districts based on available data and publicly report relevant information regarding programs
that provide special education services to students to the general public. Previously, reports were created using a
combination of Microsoft Word and Excel which were then converted to PDF files. While feasible, the creation and
editing of these reports annually required weeks to complete in the midst of other duties priorities within the office.
As the creation, storage, and calculation of data migrated to SAS within our office in the last two years, I felt it was
time to also start producing our annual reports in SAS as well. The required annual district report was coded to
integrate many of these new SAS datasets to produce a professional report using the SAS ODS Report Writing
Interface, and now saves staff significant time to produce and distribute (from weeks to mere seconds!). Coding the
report in SAS will also give leadership and SAS programmers a template to use for future reports as well as more
flexibility in changing the report as federal, state, or local regulations change.
SPECIAL EDUCATION DISTRICT PROFILE REPORT REQUIREMENTS
The special education district profiles required:
A summary of all the special education data indicators, the specific district’s data, and how that that data
compares to the predetermined annual state targets
A report for every local education agency (LEA) and state operated program (SOP) that provides services to
special education students (In South Carolina, there are 88 LEAs and SOPs.)
The data elements to be arranged into in predefined determination categories
The definitions of the data elements on the page
Attempted improvements to the report include:
Reducing the previous district profile report from 6-7 pages to one page
“Traffic lighting” of the data – In this report, green means the local area is above the state target for the
school year, red means the local area is below the state target for the school year, and gray means the
specific indicator is not applicable for that district during that school year.
Integrating the report with specific SAS datasets so that data can automatically load into the report with as
little manual entry as possible
Producing the report automatically in a PDF format without manual entry of data (as was previously done
with Microsoft Word and Excel)

A Real World Example: Using the SAS® ODS Report Writing Interface to revamp South Carolina's School District Special Education Data Profiles, continued
SESUG 2016
2
Local district contact information
STEPS TO IMPROVEMENT USING THE SAS ODS REPORT WRITING INTERFACE
This section will describe the various sections used in the SAS ODS Report Writing Interface. The resulting output is
in Appendix A and sample SAS code used is located in the Appendix B of this paper.
STEP 1: COLORS, PDF OUTPUT, AND FOOTNOTES
This section sets the stage for the rest of the program. There are %LET statements that set the colors of the title
background as well as the targets are defined within macros (for more flexibility should it be needed), as well
statements for the the PDF file output and the footnotes. Notice the margins within the OPTIONS statement. These
are important when attempting to set regions within the document. You must know how you are setting your margins
for the regions of the document to display correctly in the output.
%let backBlue = cx007DC3;
%let backGray = cxA9A9A9;
%let belowtarget = CXFF0000;
%let mettarget = CX00FF00;
%let NA = CXDEDDED;
symbol1 i=none f=marker v=U c=CXDE7E6F;
symbol2 i=none f=marker v=U c=CX7C95CA;
options orientation=portrait leftmargin=0.5in rightmargin=0.5in topmargin=0.1in
bottommargin=0.1in nodate nonumber;
ods pdf file='***…network location…***/2014-2015 District Profiles - South
Carolina.pdf';
footnote height=5.75pt "Data Notes: N/A = Not Available/Not Applicable;
Compliance=100% State Target; ST = State Target" ;
footnote2 height=5.75pt "Legend: Green = Met Target, Red = Did Not Meet Target, Gray =
Not Applicable";
footnote3 height=5.75pt "If you have questions, please contact the Office of Special
Education Services at 803-734-8224 or email at [email protected].";
STEP 2: DECLARE AN ODS OBJECT IN A DATA STEP
A “NULL” dataset was created for the report, and the DECLARE command is the main keyword to declare the object
keyword for the rest of the report. In this example, “fbe” has been declared as the object variable name (the author’s
initials). This object will be used to reference available methods to customize various sections of the report.
This program is reading another dataset which contains district data for the school districts, and thus a DO loop was
created to read through the dataset and create each district profile. This allows the entire report to be data-driven
using previously developed SAS tables or from other variables created in the data step of this SAS program.
data _null_;
set ***SAS dataset*** end=done;
if _N_ = 1 then do;
declare odsout fbe();
end;
fbe.layout_absolute();
The LAYOUT_ABSOLUTE statement gives you the ability to set up regions within the page to place various types of
SAS output. The LAYOUT_ABSOLUTE statement is used with the LAYOUT_END statement (noted in step 6). Each
region is defined using the REGION method shown in step 3.
This object is named “fbe” and will be
referenced throughout the rest of the
code. The object can be customized.
Setting the colors using %LET
statements allows us to have
flexibility in case we need to change
colors for targets.

A Real World Example: Using the SAS® ODS Report Writing Interface to revamp South Carolina's School District Special Education Data Profiles, continued
SESUG 2016
3
STEP 3: DECLARING REGIONS WITH THE REGION STATEMENT
The REGION statement allows you to declare specific areas within the report by using X and Y coordinators. You
can also declare the width and height of the region. A good suggestion prior to programming is to use a blank sheet
of 8.5 in. x 11 in. paper and draft out the regions you would like to see on the report using a ruler and a pencil, and
then marking the length and width of the regions prior to entering the data in SAS. Marking the height and width of
the regions will make the programming significantly easier.
The STYLE_ATTR statement allows you to customize the region with colors, font sizes, and other various features.
Within this example, I have used the STYLE_ATTR statement to declare the blue background color as well as the
color of the font and the font size.
fbe.region(width: "8in",height: "1in", style_attr:
"background=&backBlue.");
fbe.format_text(data: "", style_attr:
"background=&backBlue.");
fbe.region(x: ".5in", y: ".5in", width: "3in", height: "1in");
fbe.format_text(data: District,
style_attr: "background=&backBlue.
foreground=white
font_size=14pt");
Figure 1 – Report Region with Style Attributes
STEP 4: APPLYING CONDITIONAL PROCESSING AND FORMATTING
One of the main reasons our office decided to use the ODS Reporting Writing Interface was its flexibility to allow the
use of conditional processing and formatting in order to give readers of the report an easier way to determine if a
school district met the state’s target for any of the indicators.
To create a row, use the ROW_START and ROW_END statements within the TABLE_START and TABLE_END
statements. For each special education indicator, each variable was processed to determine if the school district was
above, at, or below the target. A macro command was used to link back to the background color chosen (step 1
above) to apply the appropriate reds or greens to the data within the report using the STYLE_ATTR statement. I can
also format each cell how I choose by using the FORMAT_CELL function. You can also apply custom formatting as
shown in the example.
fbe.row_start();
fbe.format_cell(data: "Ind 6A:", just: "left");
if Ind6A < Ind6At and Ind6A ne . then do;
fbe.format_cell(data: Ind6A, just: "left", format:
"missing.", style_attr: "background=&belowtarget.");
end;
else if Ind6A ge Ind6At then do;
fbe.format_cell(data: Ind6A, just: "left", format:
"missing.", style_attr: "background=&mettarget.");
end;
else if Ind6A = . then do;
Using IF-THEN statements, the
program is able to determine
whether the background is
green, red, or gray based on
the input dataset, using the
STYLE_ATTR statement.
The start of the row Custom formats are
allowed
A Real World Example: Using the SAS® ODS Report Writing Interface to revamp South Carolina's School District Special Education Data Profiles, continued
SESUG 2016
4
fbe.format_cell(data: Ind6A, just: "left", format: "missing.",
style_attr: "background=&NA.");
end;
fbe.format_cell(data: "ST:", just: "left");
fbe.format_cell(data: "48.88%", just: "left");
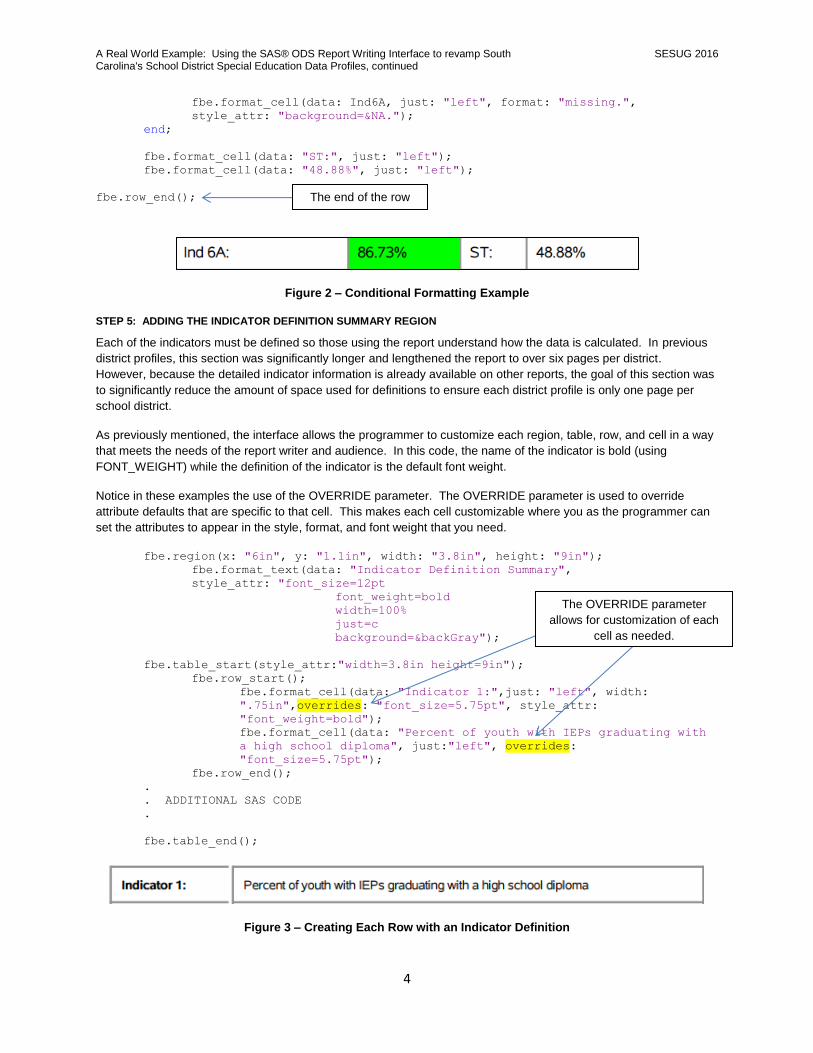
fbe.row_end();
Figure 2 – Conditional Formatting Example
STEP 5: ADDING THE INDICATOR DEFINITION SUMMARY REGION
Each of the indicators must be defined so those using the report understand how the data is calculated. In previous
district profiles, this section was significantly longer and lengthened the report to over six pages per district.
However, because the detailed indicator information is already available on other reports, the goal of this section was
to significantly reduce the amount of space used for definitions to ensure each district profile is only one page per
school district.
As previously mentioned, the interface allows the programmer to customize each region, table, row, and cell in a way
that meets the needs of the report writer and audience. In this code, the name of the indicator is bold (using
FONT_WEIGHT) while the definition of the indicator is the default font weight.
Notice in these examples the use of the OVERRIDE parameter. The OVERRIDE parameter is used to override
attribute defaults that are specific to that cell. This makes each cell customizable where you as the programmer can
set the attributes to appear in the style, format, and font weight that you need.
fbe.region(x: "6in", y: "1.1in", width: "3.8in", height: "9in");
fbe.format_text(data: "Indicator Definition Summary",
style_attr: "font_size=12pt
font_weight=bold
width=100%
just=c
background=&backGray");
fbe.table_start(style_attr:"width=3.8in height=9in");
fbe.row_start();
fbe.format_cell(data: "Indicator 1:",just: "left", width:
".75in",overrides: "font_size=5.75pt", style_attr:
"font_weight=bold");
fbe.format_cell(data: "Percent of youth with IEPs graduating with
a high school diploma", just:"left", overrides:
"font_size=5.75pt");
fbe.row_end();
.
. ADDITIONAL SAS CODE
.
fbe.table_end();
Figure 3 – Creating Each Row with an Indicator Definition
The end of the row
The OVERRIDE parameter
allows for customization of each
cell as needed.

A Real World Example: Using the SAS® ODS Report Writing Interface to revamp South Carolina's School District Special Education Data Profiles, continued
SESUG 2016
5
STEP 6: MOVING ON TO THE NEXT DISTRICT REPORT WITH A PAGE BREAK
We end the report using the LAYOUT_END statement, then the last step for this report (and the real time saver) was
to have the ODS move on to the next observation in the data step. The page break function achieves this for us.
fbe.layout_end();
if not done then do;
fbe.page();
end;
If I wanted to end this report by creating only one page (for example, I was creating one district profile to fulfill a
special request), I could remove the IF-THEN statement and end the report on the LAYOUT_END method instead.
CONCLUSIONS
The SAS ODS Report Writing Interface allows programmers significant flexibility and adaptability in creating
documents and controlling the elements within the report. While this report is fairly simple, I was able to use the
DATA step, utilize conditional processing, control the appearance of the overall document as well as within regions,
tables, and individual cells, and produce multiple reports at once. Prior to the use of SAS, every district profile was
manually entered in both a Microsoft Excel worksheet and a Microsoft Word document which then had to be
converted to PDF files for processing. Depending on the workload of the data manager and other staff, creating the
reports for the entire state could take weeks. Now, after the available data is ready to run, completing 88 district
reports takes mere seconds to process.
With some additional steps, you can incorporate a wide variety of SAS procedures within the document, including
maps, graphs, charts, and more. Thus, the SAS ODS Report Writing Interface is a powerful tool for any SAS
programmer as it allows you to produce reports that integrate SAS data while providing professional output for you
and your organization at the same time.
REFERENCES
Kummer, Daniel. “Toe to Toe: Comparing ODS LAYOUT and the ODS Report Writing Interface.” Proceedings of
the SAS Global Forum 2014 Conference, SAS Institute (Cary, NC), 2014.
Lund, Pete. “Have it Your Way: Creating Reports with the Data Step Report Writing Interface.” Proceedings of the
SAS Global Forum 2013 Conference, SAS Institute Inc. (Cary, NC), 2013.
O’Connor, Daniel. “The Power to Show: Ad Hoc Reporting, Custom Invoices, and Form Letters.” Proceedings of the
SAS Global Forum 2009 Conference, SAS Institute Inc. (Cary, NC), 2009.
CONTACT INFORMATION
Your comments and questions are valued and encouraged. Please feel free to contact the author for more information:
Fred Edora Team Lead, Data and Technology South Carolina Department of Education Office of Special Education Services 1942 Laurel Street, Room B107 Columbia, SC 29201 Phone: 803-734-0388 Email: [email protected]
SAS and all other SAS Institute Inc. product or service names are registered trademarks or trademarks of SAS Institute Inc. in the USA and other countries. ® indicates USA registration.
Other brand and product names are trademarks of their respective companies.

A Real World Example: Using the SAS® ODS Report Writing Interface to revamp South Carolina's School District Special Education Data Profiles, continued
SESUG 2016
6
APPENDIX A: FULL OUTPUT

A Real World Example: Using the SAS® ODS Report Writing Interface to revamp South Carolina's School District Special Education Data Profiles, continued
SESUG 2016
7
APPENDIX B: TEMPLATE OF SAS CODE USED FOR THIS REPORT
%let backBlue = cx007DC3;
%let backGray = cxA9A9A9;
%let belowtarget = CXFF0000;
%let mettarget = CX00FF00;
%let NA = CXDEDDED;
symbol1 i=none f=marker v=U c=CXDE7E6F;
symbol2 i=none f=marker v=U c=CX7C95CA;
options orientation=portrait leftmargin=0.5in rightmargin=0.5in topmargin=0.1in
bottommargin=0.1in nodate nonumber;
ods pdf file='…network location…/2014-2015 District Profiles - South Carolina.pdf';
footnote height=5.75pt "Data Notes: N/A = Not Available/Not Applicable;
Compliance=100% State Target; ST = State Target" ;
footnote2 height=5.75pt "Legend: Green = Met Target, Red = Did Not Meet Target, Gray =
Not Applicable";
footnote3 height=5.75pt "If you have questions, please contact the Office of Special
Education Services at 803-734-8224 or email at [email protected].";
data _null_;
set ***insert SAS dataset*** end=done;
if _N_ = 1 then do;
declare odsout fbe();
end;
fbe.layout_absolute();
/* Title Bar */
fbe.region(width: "8in",height: "1in", style_attr: "background=&backBlue.");
fbe.format_text(data: "", style_attr: "background=&backBlue.");
fbe.region(x: ".5in", y: ".5in", width: "3in", height: "1in");
fbe.format_text(data: District,
style_attr: "background=&backBlue.
foreground=white
font_size=14pt");
fbe.region(x: "5.5in", y: ".2in", width: "4.75in", height: "1in");
fbe.format_text(data: "South Carolina Department of Education",
just: "right",
style_attr: "background=&backBlue.
foreground=white
font_size=15.75pt");
fbe.region(x: "5.5in", y: ".5in", width: "2.75in", height: ".5in");
fbe.format_text(data: "Office of Special Education Services",
just: "right",
style_attr: "background=&backBlue.
foreground=white
font_size=10pt");
fbe.region(x: "5.5in", y: ".7in", width: "3in", height: "1in");
fbe.format_text(data: "2014-2015 Special Education District Profiles",
just: "right",
style_attr: "background=&backBlue.
foreground=white
font_size=10pt");

A Real World Example: Using the SAS® ODS Report Writing Interface to revamp South Carolina's School District Special Education Data Profiles, continued
SESUG 2016
8
/* Contact Information Region */
fbe.region(y: "1.1in", width: "3.5in", height: "4.5in");
fbe.format_text(data: "District Information",
style_attr: "font_size=12pt
font_weight=bold
width=100%
just=c
background=&backGray");
fbe.table_start(style_attr: "frame=void rules=none width=2in");
fbe.row_start();
fbe.format_cell(data: "Address:", just: "left");
fbe.format_cell(data: PrimaryAddress, just: "left");
fbe.row_end();
if PrimaryAddress2 ne '' then
fbe.row_start();
fbe.format_cell(data: "");
fbe.format_cell(data: PrimaryAddress2, just: "left");
fbe.row_end();
fbe.row_start();
fbe.format_cell(data: "");
fbe.format_cell(data: PrimaryAddress3, just: "left");
fbe.row_end();
fbe.table_end();
/* First Region */
fbe.region(y: "2.4in", width: "3.5in", height: "4.5in");
fbe.format_text(data: "Zone One Outcomes",
style_attr: "font_size=12pt
font_weight=bold
width=100%
just=c
background=&backGray");
fbe.format_text(data: "Are young children with disabilities beginning school
ready to learn?", style_attr: "width=100% just=c");
fbe.table_start(style_attr:"width=3.5in height=4in");
fbe.row_start();
fbe.format_cell(data: "Ind 6A:", just: "left");
if Ind6A < Ind6At and Ind6A ne . then do;
fbe.format_cell(data: Ind6A, just: "left", format: "missing.",
style_attr: "background=&belowtarget.");
end;
else if Ind6A ge Ind6At then do;
fbe.format_cell(data: Ind6A, just: "left", format: "missing.",
style_attr: "background=&mettarget.");
end;
else if Ind6A = . then do;
fbe.format_cell(data: Ind6A, just: "left", format: "missing.",
style_attr: "background=&NA.");
end;
fbe.format_cell(data: "ST:", just: "left");
fbe.format_cell(data: "48.88%", just: "left");
fbe.row_end();

A Real World Example: Using the SAS® ODS Report Writing Interface to revamp South Carolina's School District Special Education Data Profiles, continued
SESUG 2016
9
.
. ADDITIONAL SAS CODE FOR THE REMAINING ROWS IN THE TABLE
.
fbe.table_end();
/* Region Right - Definitions */
fbe.region(x: "6in", y: "1.1in", width: "3.8in", height: "9in");
fbe.format_text(data: "Indicator Definition Summary",
style_attr: "font_size=12pt
font_weight=bold
width=100%
just=c
background=&backGray");
fbe.table_start(style_attr:"width=3.8in height=9in");
fbe.row_start();
fbe.format_cell(data: "Indicator 1:",just: "left", width:
".75in",overrides: "font_size=5.75pt", style_attr:
"font_weight=bold");
fbe.format_cell(data: "Percent of youth with IEPs graduating with
a high school diploma", just:"left", overrides:
"font_size=5.75pt");
fbe.row_end();
fbe.row_start();
fbe.format_cell(data: "Indicator 2:", just: "left", overrides:
"font_size=5.75pt", style_attr: "font_weight=bold");
fbe.format_cell(data: "Percent of youth with IEPs dropping out of
high school", just: "left", overrides: "font_size=5.75pt");
fbe.row_end();
.
. ADDITIONAL SAS CODE FOR THE REMAINING ROWS IN THE TABLE
.
fbe.table_end();
/* Second Region */
fbe.region(y: "5.5in", width: "3.5in", height: "2in");
fbe.format_text(data: "Zone Two Outcomes",
style_attr: "font_size=12pt
font_weight=bold
width=100%
just=c
background=&backGray");
fbe.format_text(data: "Are children with disabilities achieving at high
levels?", style_attr: "width=100% just=c");
fbe.table_start(style_attr:"width=3.5in");
fbe.row_start();
fbe.format_cell(data: "Indicator 4A:", just: "left");
if Ind4A = 'No' then do;
fbe.format_cell(data: Ind4A, just: "left", style_attr:
"background=&mettarget.");
end;
else if Ind4A = 'Yes' then do;

A Real World Example: Using the SAS® ODS Report Writing Interface to revamp South Carolina's School District Special Education Data Profiles, continued
SESUG 2016
10
fbe.format_cell(data: Ind4A, just: "left", style_attr:
"background=&belowtarget.");
end;
fbe.format_cell(data: "ST:", just: "left");
fbe.format_cell(data: "Compliance", just: "left");
fbe.row_end();
fbe.row_start();
fbe.format_cell(data: "Indicator 4B:", just: "left");
if Ind4B = 'No' then do;
fbe.format_cell(data: Ind4B, just: "left", style_attr:
"background=&mettarget.");
end;
else if Ind4B = 'Yes' then do;
fbe.format_cell(data: Ind4B, just: "left", style_attr:
"background=&belowtarget.");
end;
fbe.format_cell(data: "ST:", just: "left");
fbe.format_cell(data: "Compliance", just: "left");
fbe.row_end();
fbe.row_start();
fbe.format_cell(data: "Indicator 5A:", just: "left");
if Ind5A ge Ind5At then do;
fbe.format_cell(data: Ind5A, just: "left", format: "missing.",
style_attr: "background=&mettarget.");
end;
else if Ind5A < Ind5At and Ind5A ne . then do;
fbe.format_cell(data: Ind5A, just: "left", format: "missing.",
style_attr: "background=&belowtarget.");
end;
else if Ind5A = . then do;
fbe.format_cell(data: Ind5A, just: "left", format: "missing.",
style_attr: "background=&NA.");
end;
fbe.format_cell(data: "ST:", just: "left");
fbe.format_cell(data: "56.00%", just: "left");
fbe.row_end();
.
. ADDITIONAL SAS CODE FOR THE REMAINING ROWS IN THE TABLE
.
fbe.table_end();
/* Third Region */
fbe.region(y: "7.5in", width: "3.5in", height: "3in");
fbe.format_text(data: "Zone Three Outcomes",
style_attr: "font_size=12pt
font_weight=bold
width=100%
just=c
background=&backGray");
fbe.format_text(data: "Does the LEA implement IDEA to improve services
and results for children with disabilities?", style_attr: "width=100%
just=c");

A Real World Example: Using the SAS® ODS Report Writing Interface to revamp South Carolina's School District Special Education Data Profiles, continued
SESUG 2016
11
if Ind8 ne . then do;
fbe.format_text(data: "(Indicator 8 Year Surveyed: " || Ind8YrSurvey ||
")", style_attr: "width=100% just=c");
end;
fbe.table_start(style_attr:"width=3.5in");
fbe.row_start();
fbe.format_cell(data: "Indicator 8:", just: "left");
if Ind8 ge Ind8t and Ind8YrSurvey = '2014 - 2015' then do;
fbe.format_cell(data: Ind8, just: "left", format: "missing.",
style_attr: "background=&mettarget.");
end;
else if Ind8 le Ind8t and Ind8 ne . and Ind8YrSurvey = '2014 - 2015' then do;
fbe.format_cell(data: Ind8, just: "left", format: "missing.",
style_attr: "background=&belowtarget.");
end;
else do;
fbe.format_cell(data: Ind8, just: "left", format: "missing.",
style_attr: "background=&NA.");
end;
fbe.format_cell(data: "ST:", just: "left");
fbe.format_cell(data: "84.00%", just: "left");
fbe.row_end();
fbe.row_start();
fbe.format_cell(data: "Indicator 9:", just: "left");
.
. ADDITIONAL SAS CODE FOR THE REMAINING ROWS IN THE TABLE
.
fbe.table_end();
/* Fourth Region */
fbe.region(x: "6in", y: "7.5in", width: "3.8in", height: "3in");
fbe.format_text(data: "Zone Four Outcomes",
style_attr: "font_size=12pt
font_weight=bold
width=100%
just=c
background=&backGray");
fbe.format_text(data: "Are youth with disabilities prepared for life,
work, and postsecondary education?",style_attr: "width=100% just=c");
if Ind13YrMon ne '' then do;
fbe.format_text(data: "(Indicator 13 Year Monitored: " || Ind13YrMon ||
")", style_attr: "width=100% just=c");
end;
fbe.table_start(style_attr:"width=3.8in");
fbe.row_start();
fbe.format_cell(data: "Indicator 1:", just: "left");
if Ind1 ge Ind1t then do;
fbe.format_cell(data: Ind1, just: "left", format: "missing.",
style_attr: "background=&mettarget.");
end;
else if Ind1 < Ind1t and Ind1 ne . then do;

A Real World Example: Using the SAS® ODS Report Writing Interface to revamp South Carolina's School District Special Education Data Profiles, continued
SESUG 2016
12
fbe.format_cell(data: Ind1, just: "left", format: "missing.",
style_attr: "background=&belowtarget.");
end;
else if Ind1 = . then do;
fbe.format_cell(data: Ind1, just: "left", format: "missing.",
style_attr: "background=&NA.");
end;
fbe.format_cell(data: "ST:", just: "left");
fbe.format_cell(data: "42.30%", just: "left");
fbe.row_end();
.
. ADDITIONAL SAS CODE FOR THE REMAINING ROWS IN THE TABLE
.
fbe.table_end();
fbe.layout_end();
if not done then do;
fbe.page();
end;
run;
footnote;
footnote2;
footnote3;
ods pdf close;