ownership dynamics within founder teams: the role of
TRANSCRIPT
1
Ownership Dynamics within Founder Teams: The Role of External Financing
February 2019
Running head: Ownership Dynamics
Keywords: Founder teams, ownership change, fairness, external financing, founder shares, dynamics
Research summary
This paper examines how founders within start-up teams dynamically re-adjust their relative ownership
stakes. It leverages a unique dataset from British Columbia, Canada, which contains detailed information
on founder ownership over time. Two trade-offs between efficiency and fairness are identified, one at
the time of founding, the other as the venture develops. Teams with a preference for fairness at the
start, as witnessed by an equal division of founder shares, also exhibit a dynamic preference for fairness,
as witnessed by a reluctance to change ownership over time. Relative founder stakes are more likely to
change when a company raises investments. Larger rounds, and lower valuations are associated with
bigger changes in relative founder stakes.
Managerial summary
Setting relative equity stakes of founders involves a delicate trade-off between efficiency and fairness.
This trade-off needs to be made not only when founders determine their initial division of equity, but
also over time as the venture develops. We find that teams that have a strong preference for fairness, as
revealed by an equal split of their original founder equity, are also less likely to change their relative
stakes over time. We also find that changes in the division of founder ownership often coincide with
external financing rounds, suggesting that renegotiations within teams are more easily settled in the
presence of outside investors. Overall the evidence suggests that even though notions of team fairness
constrain changes to relative founder stakes, these allocations are not set in stone, and financing rounds
provide opportunities for recalibration.

2
1. Introduction
In recent years entrepreneurship researchers have developed a growing interest in
understanding entrepreneurial teams (Klotz et al., 2014). Considerable progress has been made
in understanding the origins of founder teams, and the importance of founder team
characteristics for start-up growth (Åstebro and Serrano, 2011, Colombo and Grilli, 2005, Ruef,
Aldrich and Carter, 2003; Ruef, 2010). Of particular significance is the work of Beckman and
Burton (see Burton, Sørensen and Beckman, 2002; Beckman, 2006; Beckman, Burton and
O’Reilly, 2007; Beckman and Burton, 2008), which looks at how founders put an imprint on
their ventures, and how this affects the subsequent evolution of companies. The work of Baron,
Burton, and Hannan (see Baron, Burton, and Hannan, 1996; Hannan, Burton, and Baron, 1996;
Baron, Hannan, and Burton, 2001) further underscores the long-term implications of original
founder teams and their culture. Their interest lies mainly in understanding when companies
undergo organizational changes, and how the initial imprint affects these dynamic changes. A
related literature looks at how founder teams are augmented and sometime replaced by
professional managers (Ewens and Marx, 2017; Hellmann and Puri 2002; Wasserman 2003).
While the importance of the skill-sets of individual founders and the composition of the
founding team has now firmly been established, much less is known about the organisation and
incentives of individual founders within a team. In this paper we look at an important
determinant of the incentives of individual founders and the relationship between them,
namely the division of the founder shares among the founders. The allocation of founder shares
directly impacts the financial returns to individual founders, and hence their incentives, which
are key in the entrepreneurship literature (Åstebro, 2012). In addition, the initial ownership

3
choice and the willingness (or lack thereof) to subsequently change ownership speak to the
internal dynamics of founder teams.
Hellmann and Wasserman (2017) provide a theory, and empirical analysis of the initial
allocation of shares among founders. Their analysis suggests a fundamental trade-off between
an “efficiency” logic, based on efficient bargaining (Nash, 1953; Binmore, Rubinstein and
Wolinsky, 1986), which typically pushes founder teams towards unequal splitting of share
ownership, and a “fairness” logic (Adams, 1965; Dawes and Fowler, 2007; Deutsch 1975; Fehr
and Schmidt, 2006; Skott, 2005) that pushes teams towards equal splitting.1 Wasserman (2012)
further examines case studies of how initial ownership within founder teams changes over
time. However, to date there has not been any systematic study on the dynamics of founder
ownership.
This paper focuses entirely on the founder team itself. The main research question is how the
relative allocation of shares among the members of the founder team changes over time. The
relative allocation of shares involves important yet delicate decisions. It determines the relative
rewards to, and incentives for entrepreneurial activity, as well as the social dynamics and status
of the members of the founder team. Founder teams can, in principle, change their relative
ownership at any time. However, any adjustment has to be agreed upon, and a change may be
viewed as an alteration of the original agreement that was forged at the start of the company.2
1 The fairness logic is sometimes also referred to as an “equity” logic. Throughout the paper we avoid this term, because of a possible confusion with the other meaning of “equity” as company shares. 2 In this paper we do not touch upon the standard finance question of how founder ownership gets diluted as companies issue shares to investors. Instead we are solely focused on how the relative shares of the founders evolve over time. However, as our analysis shows, financial investments affect the dynamics within the founder team.

4
The motivation for our analysis is the fundamental trade-off between efficiency and fairness.
Hellmann and Wasserman (2017) derive and empirically test a formal theory that explains how
an efficiency logic encourages founder teams to choose an unequal split of the founder shares
at founding, whereas a fairness logic encourages equal splitting. In this paper we extend this
logic by expanding our horizon beyond the initial founder agreement and analyse how founder
ownership changes over time. A dynamic efficiency logic encourages teams to continuously
reconsider their relative ownership stakes, reflecting new insights and changing circumstances
that affect the efficient allocation of relative founder shares. By contrast, we conceptualize a
dynamic fairness logic as encouraging teams to maintain whichever was their initial relative
share allocation. That is, if they stick to dynamic fairness, founder teams do not go back on the
relative ownership shares they originally agreed upon, even if circumstances change.
Understanding the drivers of this dynamic trade-off between efficiency and fairness is the core
objective of this paper. We consider our analysis exploratory in the sense that there is neither
any established theory, nor any established prior empirical work to guide the analysis.
We exploit a unique dataset from the Canadian province of British Columbia (BC) where start-
ups disclose their legal share registries to an administrator as part of a tax credit program. The
dataset contains accurate and detailed information concerning share ownership over time. Our
dependent variable measures the degree of change in relative ownership within founder teams.
The analysis primarily focuses on two important antecedents, namely (i) the initial split of
shares within the founder team, and (ii) external financing events.
The first antecedent concerns the team’s initial allocation of founder shares. A key question is
whether teams that adopt a “static” fairness logic at the start, are also more likely to adopt a

5
“dynamic” fairness logic as their venture develops over time. The first main empirical finding is
that when teams initially choose an equal equity split, they are indeed less likely to
subsequently change their relative founder ownership. We also find that equal splitters have
significantly fewer financing rounds compared with unequal splitters, are less likely to raise
venture capital, and have lower pre-money valuations. Moreover, when equal split companies
receive founder investments, it is more likely that the founders contribute identical amounts,
thus preserving the equal distribution of shares. Of further note is that teams that start with an
initial division of shares that is close to equal, but not exactly equal, fundamentally behave
differently than the equal splitters.
The second antecedent concerns external financing events. A large prior literature notes that
external investors play a key role in the internal structuring of start-up companies (Hellmann
and Puri, 2002; Sapienza, Manigart and Vermeir, 1996). While founders may grapple with the
trade-off between efficiency and fairness, investors likely have a different perspective. They are
much less encumbered by the internal social dynamics within the founder team and are usually
primarily motivated by the financial success of the venture. External investors may therefore
push founders to adjust their ownership stakes towards greater efficiency. Investors do not
only have the incentives, but often also the required level of influence and control to effectuate
change (Gorman and Sahlman, 1989; Kaplan and Strömberg, 2003). We find indeed that
changes to the relative founder ownership are larger in the presence of external investors. We
also find that larger external financing rounds, as well as lower pre-money valuations, are
associated with larger relative founder ownership changes.

6
The remainder of the paper is structured as follows. In Section 2 we discuss the relevant prior
literature. In Section 3 we present our data. Section 4 contains the empirical analysis. In Section
5 we discuss and extend our main results and provide an outlook on future research. Section 6
concludes.
2. Related literature
In this section we discuss the related prior academic literature. Our starting point is that
founder teams face important choices regarding the allocation of ownership amongst
themselves. The ownership allocation choice can be governed by two very different types of
logics. A first logic is an economic calculus that is based on “efficiency,” and holds that the
division of ownership is mainly driven by a negotiation that is based on the founders’
productivity, incentives, and outside options. The efficiency logic that we refer to here is
concerned with the overall maximization of the company value, as well as with the individual
utility maximization in a bargaining context. A large economic bargaining literature examines
such division problems. Some of the early seminal contributions assume cooperative bargaining
behaviour, such as the influential work of Nash (1953) and Shapley (1953). Later contributions
by Rubinstein (1982), Rubinstein and Wolinsky (1985) and Binmore et al. (1986), show how very
similar bargaining outcomes can be derived in certain non-cooperative games. The work of
Holmström (1982) and Grossman and Hart (1986) explore bargaining problems with important
incentive problems. Overall this literature suggests that differential share ownership can be
explained by founders making contributions of different value, facing different incentives, or
having different outside options.

7
A second, very different logic comes from theories of fairness. At the philosophical level the
concept of fairness is deeply complex, but in the applied social science literature, the concept of
fairness has been widely understood as equal compensation of people that are doing
observationally equivalent jobs (see Akerlof and Yellen, 1990; Leventhal, 1976; Kacperczyk and
Bachalandran, 2018; Lazear, 1989; Pfeffer and Davis-Blake, 1992). This view on fairness dates
back to Rawls (1971), whose notion of ex-ante equality would suggest that an optimal
allocation is an equal division. In our context this would mean that the founders each get the
same stake in the company. This is also known as the 1/n rule, as each founder in the team of n
gets an equal fraction of founder shares.
The central trade-off that we explore in this paper is how founder teams choose between the
efficiency and fairness logic. This choice has been extensively studied in the economic fairness
literature, and in particular in the influential work of Fehr and Schmidt (1999, 2006). Hellmann
and Wasserman (2017) focus specifically on founder teams. They examine the initial allocation
of founder shares, looking especially at the distinction between “equal splitters” (teams that
adopt the 1/n rule, allocating founder shares equally) versus “unequal splitters.” Their analysis
considers equal splitting as a fairness-driven choice, and unequal splitting as an efficiency-
driven choice.
For large parts of the prior literature, including the works cited above, the trade-off between
efficiency and fairness is considered in a static framework: there is a single one-off ownership
allocation. In this paper, however, we raise the much less studied question of the dynamics of
this efficiency and fairness trade-off. Our starting premise is that in the context of

8
entrepreneurial ventures, founder teams constantly face this efficiency-versus-fairness trade-
off as their venture develops.
From a dynamic efficiency perspective, the founders’ roles, skills, outside options, and
incentives are likely to change over time. Thus, there are numerous moments to potentially
reconsider an original agreement. The renegotiation literature, starting with the seminal work
of Dewatripont (1989), explores the various implications of renegotiation in a dynamic
bargaining context. Renegotiation is also central to the literature on hold-up (Grossman and
Hart, 1986; Williamson, 1975). Closer to our context, Hellmann and Thiele (2015) develop a
theory specifically focused on the dynamics of founder negotiations. Their model allows for
renegotiation and looks at how founder ownership can change over time.
While our static notion of fairness is reflected by an equal split, our notion of dynamic fairness
is associated with the desire to stick to the original founder agreement. Deviating from the
original agreement is deemed unfair, because at least one party ends up with a lower relative
share than in the original agreement. If changes in the original agreement are driven by random
shocks to the parties’ bargaining strength, then dynamic fairness helps to insulate parties from
undesirable redistribution risk. To summarize, Figure 1 represents a simple two-by-two matrix
explaining the static and dynamic trade-offs between efficiency and fairness.
In our analysis we explore which factors affect the trade-off between efficiency and fairness
and lead to ownership changes over time. In principle there can be many antecedents that
affect relative ownership changes over time, some emanating from within the team, others
from the outside. Besides fairness considerations, internal forces may include changes in the
strategy of the start-up (Gans, Stern and Wu, 2016; Gans, Scott, and Stern, 2018; Ries, 2011;

9
Kerr, Nanda and Rhodes-Kropf, 2014), or changed circumstances for individuals within the team
(Wasserman 2012).
We focus on financing events as an important external factor that can affect founder
ownership. As a preliminary step, we distinguish founder financing from external financing.
When different founders invest different amounts, relative ownership changes are often a
mechanical consequence. The distinction between founder financing from external financing is
therefore essential. Thus, our primary focus will be with external financing rounds when a
change in the relative founder ownership is non-mechanical. A large prior literature looks at the
numerous roles investors play in start-up companies, such as monitoring, adding value,
professionalizing, or exercising corporate governance (Bernstein, Giroud and Townsend, 2016;
Da Rin, Hellmann and Puri, 2012; Gompers, 1995; Gorman and Sahlman, 1989; Hellmann and
Puri, 2002, Kaplan and Strömberg, 2003; Sapienza et al., 1996).
3. Data
Data availability is a major issue when researching founder team dynamics in start-up
companies, which are typically privately-held. The sensitive nature of ownership data makes
this challenge even greater. The few financial databases that provide information on start-up
investments and ownership do not report data on the internal division of ownership shares.
The survey data of Wasserman (2003, 2006, 2017) takes an important step forward by
collecting detailed data on the original allocation of founder shares. However, even in this
dataset it is not possible to systematically follow founder ownership over time. For this paper
we exploit a unique dataset of start-ups in the Canadian province of British Columbia (BC).

10
3.1. The British Columbia Investment Capital Program
Our primary data source is the Government of British Columbia, who administers the British
Columbia Investment Capital Program (henceforth BCICP). The BCICP offers a tax credit of 30%
of the amount invested in the equity of eligible entrepreneurial companies. The 30% tax credit
is available (up to some maximum annual amount) to BC-resident individuals, as well as BC-
based corporate investors. The program is mostly targeted at high-growth oriented firms that
focus on technology sectors broadly defined. Eligible companies are BC-based companies that
do not employ more than 100 employees and contractors; that pay at least 75% of the wages
and salaries to BC employees; and that “engage in an eligible activity”, i.e. primarily R&D of
proprietary technology, manufacturing for export, and digital media. BC securities legislation
also imposes further rules on companies that issue securities in BC (see British Columbia
Securities Commission, 2017).
Our sample does not represent the general population of start-ups, but instead a population of
growth-oriented technology start-ups.3 Within that class of companies, however, we have no
reasons to suspect that our sample is particularly biased in any direction.4 This is because the
program is fairly broad, and because the tax credits are attractive to a wide variety of investors,
including angels, venture capitalists, and corporate investors. The appendix contains further
3 A prior literature shows that growth-oriented technology start-ups are not representative of the general population of new companies, let alone the population of small businesses. See, in particular, Hurst and Pugsley (2011) and Decker et al. (2014). 4 We do not have access to any census level data about the entire population of new non-financial companies founded in British Columbia. BC Stats (2016) shows that there were 9,905 high tech businesses in British Columbia in 2015, of which 96% were business had fewer than 50 employees. The companies in our sample had fewer than 100 employees by a program requirement of the BCICP. They have on average around 13 employees, while we infer from BC Stats that BC high tech companies employ on average around 16 employees. Table 2 shows that 75% of the companies in our sample were from Greater Vancouver, 7% from Greater Victoria, and 18% from the rest of BC. BC Stats (2016) shows that in 2015 67% of the BC high tech companies came from Greater Vancouver, 15% from Vancouver Island and the Sunshine Coast (which includes Victoria), and therefore 17% from the rest of BC.

11
detail on the BCICP eligibility criteria for investors and companies, as well as BC securities
legislation.
In order to establish compliance with certain program rules, companies frequently submit their
entire share registries to the BCICP administrator. These registries are of particular importance
because they identify all the shareholders, not only the investors who received a tax credit. The
share registries contain a complete history of all shareholder transactions in the company, from
the founding moment to the time of the filing. From a research perspective this provides the
highest level of accuracy one can have for tracking ownership over time. Unfortunately, the
filing of these share registries is not a formal requirement, as there are other ways of showing
compliance with the program rules. Therefore, not all companies chose to submit share
registries.
3.2 Definition of sample and founders
The everyday use of the term “founder” is not always very precise, and some people consider
themselves founders if they joined a company “relatively early.” In our analysis we adopt a
conservative approach of only assigning founder status to those who satisfy some strict
objective criteria. We deliberately focus on the “original founders,” i.e., those individuals who
actually received their first shares at the time of company founding. Formally, we require all
founders to appear on the share registry in the initial quarter (“quarter 0”) of the share registry.
However, not all shareholders in quarter 0 are necessarily founders. We therefore require a
positive identification as founders from other sources. When companies register under the
BCICP they typically submit their business plans to the program managers. Often, though
unfortunately not always, these business plans list the original founders of the companies. To

12
complete the data, we used web searches to identify founders for companies for which we did
not have a business plan, or where the business plan did not identify the founders. Specifically,
we attempted to find founders through company websites, Google, LinkedIn profile searches,
as well as searches of the internet archive called the Wayback Machine
(http://archive.org/web). We used a strict rule in these searches, and only called an individual a
founder if he or she was positively identified as such in at least one of those additional sources.
Our company dataset is derived from the 759 entrepreneurial companies that received funding
supported by the BCICP between 1990 and 2009 (most of which in the 2000s). We have share
registries for 308 companies. Because of our interest in ownership changes, we limit ourselves
to companies that have two or more quarters of activity in their share registries. There are 198
such companies. Because our analysis focuses on founder teams, we also exclude all companies
with a single founder. Our final sample consists of 84 companies and 211 founders, who are
each associated with one or more of the 84 companies.
We analyse the data through two different sampling lenses. The first sample includes all
quarters, from the founding quarters to the last quarters of the share registries. This sample
consists of 1371 “company quarters.” The second sample includes all quarters during which at
least one external investor provided funding to the company. This second sample consists of
515 external “financing rounds”.5 However, our analysis focuses on changes in the relative
founder ownership, which, by construction, are not defined in the initial quarter. Our
5 As for our definition of a round, we realize that when a company raises money, not all transactions are recorded on exactly the same day. We therefore group our data into quarters, and consider all investments made in a quarter as pertaining to the same investment round. For example, if a company issues 5,000 shares to one investor on February 15th and another 5,000 on March 15th, then we would consider all 10,000 shares to be part of the same round. Allowing investments in the subsequent quarter to be included in the same round (say an investment on April 15th) does not impact our results as such close-by rounds remain rare in the data.
13
regressions are therefore based on 1287 company quarters and 480 (external) financing
rounds.6
It is useful to briefly discuss the strengths and limitations of our data. In terms of strengths, the
data is very accurate concerning the key dependent variable, namely founder ownership and its
dynamics. The data on investments is also very complete and accurate in terms of amounts and
timing. This is because the legal share registries record the initial share allocation and all
subsequent ownership changes at the individual shareholder level. This provides accurate
information not only on founders, but on all other shareholders too. Naturally this precision
comes with some limitations. First, our sample is relatively small. We are also looking at a
specific context, where all the companies in the sample apply to a tax credit program, and all of
them raise some money from investors who participate in that program. Our analysis is in any
case limited to growth-oriented start-ups that manage to attract external funding. We also do
not have share registries for all the companies in the program. Second, while we observe
individual shareholders of companies and the evolution of their shareholdings, founders are not
directly identified in the BCICP data. We also have no biographical information on these
founders, such as the expertise they bring into the venture. Third, we have limited information
about how the underlying ventures evolve in terms of their business fundamentals. It would
also be interesting to have information about the evolving circumstances of the individual
founders, something we discuss further in section 5.3.
6 Note that the difference between 1371 and 1287 is exactly 84, the number of companies. The difference between the 515 and 480 rounds comes from the 35 companies that receive their first investment in quarter 0.

14
3.3. Variable definitions
Our analysis revolves around explaining relative founder ownership changes. A founder’s
relative ownership is computed by dividing the number of a founder’s shares with the total
number of shares owned by all founders in the team. For example, assume a company has
issued 30,000 shares, of which 10,000 are owned by its two founders. If founder A owns 6,000
of the founder shares and B owns the remaining 4,000, then A has a relative ownership of 60%
and B of 40%. If this company issued 10,000 new shares to outside investors, but none to
founder A or B, then no change in relative founder ownership of A or B took place. However, if
the company issued 2,000 shares to founder A, but none to founder B then the relative founder
ownership changes. It becomes 8,000/12,000 = 66.67% for A, and 33.33% for B.7
Our main dependent variable, “Ownership Change”, is based on changes in the relative founder
ownership shares. Specifically, we measure Ownership Change by the Average Absolute
Ownership Change (AAOC). For example, in the previous example, the additional 2000 shares
issued to A imply an increase of 6.67% in the relative ownership of founder A, and a decrease of
6.67% in the relative ownership of B. Hence, at the time of this share issue, the resulting
Ownership Change, as measured by the AAOC equals (|6.67%| + |-6.67%|)/2 = 6.67%. By
construction Ownership Change is non-negative. It becomes strictly positive when a founder
buys or sells shares from another founder or investor, or, more commonly, when the company
7 Mechanically, relative ownership changes between founders can be done either through transfers of shares between founders, or by issuing additional shares to some, but not all founders. Note that founders can also pre-program relative ownership changes by writing dynamic agreements at the start (Wasserman, 2012). We do not have direct evidence about the existence of such arrangements, but can capture their effect, as we observe all the ownership changes that actually happen. In other words, our analysis includes both pre-arranged and unplanned changes in relative ownership structure.

15
issues shares to founders, but not in the same proportions as the founders’ current
shareholdings.
A first set of key explanatory variables in our analysis relates to the distribution of the relative
ownership shares amongst founders. First, “Equal Split” is a dummy that indicates whether a
company starts with all founders having the same ownership. Specifically, Equal Split = 1 for a
company if each of the n founders receives 1/n of the founder shares at the outset. Secondly,
we measure the degree of inequality among founders by the Average Absolute Deviation (AAD).
Specifically, the AAD is the average of the absolute differences between the founders’ actual
relative founder ownership and equal founder ownership. For example, if, like in the previous
example, A and B have a relative founder ownership of 60% and 40%, respectively, then the
AAD equals (|60% - 50%| + |40% - 50%|)/2 = 0.1. If A and B have a 50 – 50 ownership, then the
AAD is equal to 0 (and Equal Split = 1). By construction the AAD measure is bounded below by 0
and bounded from above by 0.5. For the analysis of Section 5.1 we also define “Near Equal
Split,” a dummy variable that takes on the value of 1 if the average absolute deviation from
equal split is greater than 0, but smaller than the 25th percentile of the AAD.
The second set of key independent variables relate to financing events of the company. We
distinguish between founder investments and external investments. The dummy variable
“Founder Financing” indicates whether in a particular quarter any founder made an investment,
and the dummy “External Financing” whether in a particular quarter anybody else made an
investment. These dummies are not mutually exclusive as founder investments could coincide
with external investments. The “Founder Financing Amount” and “External Financing Amount”
16
variables record the amount invested by founder and external investors, respectively, in that
quarter.
We make an effort not to confused founder financing with “sweat equity.” Consider again the
above company that issued an additional 2,000 shares to founder A. Suppose that this share
issuance is sweat equity, i.e. the shares are compensation for contributions made (or to be
made) by founder A. However, when companies issue sweat equity shares, then they typically
charge a nominal amount for the shares for legal reasons. Suppose other investors pay $30 per
share while the founder pays merely $0.01. Thus, the founder pays a total of $20 for 2,000
shares that are valued at $60,000. In the share registries we would in this case find a founder
investment of $20, which is due to the way the sweat equity issuance is technically
implemented. Clearly we should not consider this $20 a proper investment but think of it as an
administrative step for the issuance of sweat equity. We therefore do not consider transactions
involving deeply discounted shares to be investments. Specifically, a transaction is deemed
sweat equity if the associated share price is $0.01 or less. Overall, sweat equity transactions
account for approximately 9% of all the transactions in our sample.
Our regressions include a wide range of control variables. The construction of the time,
industry, and geography dummies is standard and further explained in Hellmann and Schure
(2010) and Hellmann, Schure, and Vo (2017). “Valuation” is the logarithm of one plus the pre-
money valuation of the company. To calculate the valuation, we use all shares issued prior to
the round and multiply by the share price of the round. The “VC Financing” dummy indicates
whether a venture capitalist participated in the financing round (possibly alongside other
investors).

17
The control variables “Revenues,” “Patents,” “Exit,” and “Fail” proxy company performance, as
will be discussed in section 4.3. “Revenues” is the logarithm of one plus the revenues that the
company reported in its financial statements. We typically have annual financial statements, in
which case we assume the quarterly revenues are ¼ of the reported annual revenues. “Patents”
is the logarithm of one plus the number of US patent applications that a company submitted
since it was founded. We track US patent applications by manually matching our companies
with companies recorded in the Disambiguation and Co-authorship Networks of the U.S. Patent
Inventor Database 1975 – 2010 (Lai et al., 2011) and on the website of the US Patent and
Trademark Office. “Exit” and “Fail” are dummy variables that indicate whether a company
experienced a successful exit or ceased operations, as of July 2016.
3.4 Descriptive statistics
Table 2 presents several descriptive statistics. Panel A reports averages and confidence
intervals for several company specific variables. About 60% of our companies are in the “high
tech” sector, with the largest component being the software industry. Perhaps unsurprisingly,
75% of the companies are located in the greater Vancouver area. In terms of performance, 20%
of our companies had an exit, and 38% of them failed by the end of the sample period.
Panel B of Table 2 provides statistics at the company quarter level (top section) and financing
round level (bottom section). Ownership changes, as measured by the Average Absolute
Ownership Change (AAOC) occur in 12% of all 1287 company quarters. On average, the size of a
change in the relative founder ownership, measured by the average absolute change, is 0.65%.
However, this includes all the quarters in which there was no ownership change. The bottom
section of Panel B shows that if we condition on there being an ownership change, then the

18
average absolute ownership change is 5.34% on average. Figure 2 shows a histogram of the
Ownership Change variable for our company-quarters. Figure 3 shows the number of
ownership changes of companies. Note that 69% of companies have at least one ownership
change and that just over 10% have five or more ownership changes. Figure 3 also makes clear
that the number of ownership changes differs substantially between equal split and unequal
split companies. For just under half the equal splitters there are no changes in the relative
founder (i.e. these companies remain equal splitters throughout the period that we observe
them). However, the bulk of the unequal splitters undergo at least one ownership change. This
is a result that foreshadows a key finding in our main empirical analysis. Figure 4 further shows
when in the lifetime of companies these ownership changes happen. For half the companies in
our sample a relative founder ownership change happens within the first 6 quarters of their life
(the average number of quarters for a company in the sample is 16).
The company-quarter sample in Panel B of Table 2 shows that financing rounds occur in 38% of
all quarters. In a typical quarter revenues average $1.7 million, and companies applied for an
average of 0.84 patents. When focusing on just quarters with financing rounds (bottom of Panel
B in Table 2), we see that in 23% of the rounds the relative founder ownership changes.
External financing amounts are considerably larger than founder financing amounts. The
average pre-money valuation in a financing round is $8 million.
In the previous subsection we also introduced the Average Absolute Deviation (AAD) as a
measure of inequality in the relative founder ownership shares. The AAD can be measured at
any point during the lifetime of a company. Figure 5 shows the AAD in the first company-
quarter. The figure shows that over half of the companies in our sample (46 of the 84

19
companies) have an AAD of 0 – these are the equal-split companies. Figure 6 shows how the
AAD changes between the first and last company quarters. For almost 40% of the companies
the AAD does not change over time. By construction the AAD can only increase over time for
equal splitters as these start from complete equality. For unequal splitters the distribution of
the founder shares can move towards more inequality or less inequality. Figure 5 shows that
inequality tends to increase over time among the unequal split companies.
Table 3 shows the pairwise correlations between our key variables of interest. It foreshadows
some of the analysis from Section 4, so we refrain from discussing the details here.
4. Regression analysis
We now turn to our empirical regression analysis. The main empirical question is to understand
the relationship between the relative ownership changes within founder teams and its
antecedents, where our overarching theme is understanding the dynamic trade-off between
efficiency and fairness. Our research is exploratory in the sense that now that we have posed
our research question, we let the data speak. Future research might build on our analysis in
terms of testing more specific theories.
4.1 Main effects
Our main regression specification uses a panel Tobit regression model where the dependent
variable is Ownership Change (AAOC). We use the Tobit model because our main dependent
variable is continuous and left-censored at 0. In section 4.4 we show that several other
specifications deliver the same key results. We initially focus on two main explanatory

20
variables. First, we look at the team’s initial founder equity choice, and specifically whether or
not the team chose an equal split at the outset. The Equal Split variable captures how the team
resolved the initial static trade-off between efficiency and fairness. Second, we look at the
impact of external financing events. In Table 4 we start with a dummy that captures all
financing events, and then distinguish between founder financing and external financing. In
later tables we will take a deeper look at the structure of external financing events.
All our regressions use control variables. We report their coefficients once, namely in Table 4,
but not anymore thereafter. Some of our controls are company specific, namely the number of
founders, a set of industry dummies, and a set of location dummies. The Age control varies at
the company quarter level. All our regressions also include unreported quarterly calendar fixed
effects, and a constant term. Throughout the analysis we use robust standard errors that are
clustered at the company level.
Table 4 is based on the company quarter sample. The first column only looks at the effect of
equal splitting of founders at the outset. We find a negative relationship between Equal Split
and Ownership Change that is significant at the 5% level. This result will prove to be very
robust: there is a clear correlation between preferences for static fairness, as suggested by an
initial equal split, and preferences for dynamic fairness, as suggested by a reluctance to change
relative ownership shares as the venture evolves. The economic magnitude of the equal split
effect is relatively large: the percentage impact on the average absolute ownership change is
negative 4.4% in a quarter, suggesting that equal splitters change their relative founder
ownership significantly less.

21
The second and third columns of Table 4 add Financing, a dummy variable indicating that some
financing round occurred in a specific quarter. In the second column we omit Equal Split; in the
third we add it back in. In the last two columns, we separate the Financing dummy into
dummies for Founder Financing and External Financing. The results show that ownership
changes are significantly more likely in the presence of financing events. The coefficients are
large and highly significant at the 1% and 5% levels depending on the specification. Our control
variables are almost all insignificant suggesting that ownership changes are not associated with
certain industries or with geography.
The financing results from Table 4 invite further exploration. We are particularly interested in
the structure of the financing round. Table 5 takes a deeper look at external financing events. It
is based on the financing round sample, which utilizes only those quarters with financing
events. As in Table 4, we find that the Equal Split coefficient is always negative and statistically
significant. Founder Financing always has positive and statistically significant coefficient. Our
main focus in this table concerns the structure of external financing. Column 1 introduces
External Financing Amount, which measures the size of the investment. The effect is positive
and highly significant: larger funding rounds are associated with larger ownership changes.
Column 2 adds a control for the pre-money valuation of the financing round. We find that
Valuation is negative and significant at the 10%.8 Overall we note that the pressure to adjust
8 Note, however, that in the third column of Table 5 the valuation coefficient is marginally insignificant, with a P-value of 15%. In the online appendix we report some additional regressions where we replaced the valuation variable with a variable measuring the investor’s equity stake. This is given by the ratio between the round amount and the post-money valuation. In this alternative specification we find that the equity stake is positive and significant at 1%.

22
relative founder ownership stakes is stronger when companies have lower valuations so that
investors take larger stakes.9
Another interesting question concerns the identity of investors. A natural question to ask is
whether venture capitalists are different from other investors.10 One hypothesis would be that
the pressure to change founder ownership is higher in the presence of venture capitalists than
other investors. Column 3 of Table 5 replaces External Financing Amount by VC Financing, a
dummy variable that indicates the presence of one or more venture capitalists in the round.11
The VC Financing coefficient is insignificant, suggesting that there is no evidence for a venture
capital effect in this context. (We thus dropped VC Financing in the remainder of the analysis.)
4.2. Interaction effects
So far, our analysis uncovers two important antecedents, the initial ownership structure, and
financing events. The next step is to ask whether these two forces interact. For example, it
might be that an initial equal split dampens the effect of financing rounds. This would be true if
equal splitting teams resist ownership changes under all circumstances. An alternative
conjecture would be that financing has a stronger effect on equal splitting teams, because
9 Note, however, that in the third column of Table 5 the valuation coefficient is marginally insignificant, with a P-value of 15%. 10 A significant strand of the entrepreneurial finance literature suggests that investors are not homogenous, and that there are important differences between informal investors (such as family, friends, or angel investors) and professional investors, especially venture capitalists (Colombo and Grilli, 2010, 2013; Da Rin et al., 2012; Hellmann and Puri, 2002; Wong, 2010). Venture capitalists invest on behalf of other investors and are therefore subject to greater accountability in their investment behaviour. They explicitly focus on generating financial returns, and tend to have disproportionately large control rights (Kaplan and Strömberg, 2003, Prowse, 1998). Venture capitalists also tend to achieve better investment performance (Colombo and Grilli, 2010; Davila, Foster, and Gupta, 2003; Engel and Keilbach, 2007). 11 We do not control for both External Financing Amount and VC Financing as these variables are highly collinear, as shown in Table 3.

23
investors perceive a greater need to fix the original (presumably inefficient) ownership
allocation.
Table 6 looks at the interaction between initial ownership structures and financing events. The
first two columns report regressions from the company quarter sample. Column 1 builds on the
model of Column 3 in Table 4 by adding an interaction effect between Equal Split and Financing.
Column 2 builds on Column 5 of Table 4, adding “Equal Split x Founder Financing” and “Equal
Split x External Financing.” The last two columns report regressions from the financing round
sample. Column 3 builds on Column 1 of Table 5 by adding “Equal Split x Founder Financing”
and “Equal Split x External Amount.” Column 4 builds on Column 2 of Table 5, adding the
interaction effect “Equal Split x Valuation.”
While some of the interaction effects are statistically significant, the most important finding
from Table 6 is that interaction effects have relatively little impact on the significance of our
two main antecedents, initial Equal Split and financing events.
4.3. Controlling for company performance
Our data does not involve a natural experiment so that we cannot identify causal relations. Still,
to get a better understanding of the relationship between the antecedents and outcomes, we
would like to control for as many possible relevant factors as possible. Our base model already
controls for possible time, industry, and location effects, as well as some company
characteristics. We next attempt to control for company performance.
Including company performance data unfortunately comes at the cost of a loss in the number
of observations. We can observe revenues for a subset of 66 of our 84 (79%) companies; and

24
770 of the 1287 (60%) of the company quarters. Revenues are often regarded as a gauge for
company size. In the context of start-ups who want to grow, it can also be interpreted as a
measure of company performance (see Croce, Martí and Murtinu, 2013; Wiklund and
Shepherd, 2003; Puri and Zarutskie, 2012). We also gather data on the accumulation of
company patents. Obtaining a patent is widely viewed as a positive signal about the outcomes
from R&D investments (see Conti, Thursby and Rothaermel, 2013; Hsu and Ziedonis, 2013; Vo,
2018). Finally, an entirely different approach of controlling for performance is to use hindsight.
Specifically, we were able to ascertain whether a company had an exit (IPO or acquisition),
failed, or was still alive at the end of the sample period. To control for eventual company
outcomes, we use two dummy variables: Exit and Fail (see Section 3 for details). The omitted
category reflects companies that are still alive by July 2016.
Table 7 reports the result of regressions that control for company performance. Since
performance is measured independently of financing events, we use the company-quarter
sample. The regressions of Table 7 all build on the model of Column 5 in Table 4. The first
column of Table 7 adds Revenues, the second Patents, the third the Exit and Fail dummies; the
final column adds all three performance proxies.
Most results from Table 7 suggest that controlling for company performance does not change
our main results. The coefficients for Equal Split and External Financing are hardly affected by
the addition of Patents or Exit and Fail. Columns 1 and 4 suggest that including Revenues lowers
the coefficient on External Financing.12 Almost none of the performance controls are
statistically significant. Overall the results from Table 7 suggest that there is no strong evidence
12 The coefficient on External Financing becomes insignificant (albeit barely; the p-value is 0.11) when we include all three performance measures simultaneously.

25
that the effects of equal splitting and financing events are affected by company performance.
Yet, the impact of company performance on the dynamics within founder teams is still an
interesting area for future inquiry.
4.4. Robustness analysis
In this section, we discuss a number of robustness checks. All results presented in this section
are available in the Online Appendix to this article.
A first set of robustness checks concerns our dependent variable. Ownership Change is based
on the average absolute ownership change across founders. A possible alternative would be to
use the maximum absolute ownership change, which looks at the founder with highest relative
ownership change in the round. We ran all our reported regressions using this alternative
measure and find very similar results. We also ran a series of regressions using a coarser set of
industry controls.13 Our results are robust to this alternative set of controls.
A more significant departure of measuring a change in the relative founder ownership is to use
a categorical variable approach, i.e. a dummy that indicates whether an ownership change
happened. This approach ignores the size of any such ownership change. Since this approach
involves a binary dependent variable, we use Probit regressions. Again, we find that the
antecedent variables have the same sign and remain significant in similar ways.14
13 In particular, we only retain dummies for those industries that comprise at least 20% of our data, grouping the smaller industries into an “other” category. 14 We encounter difficulties in 3 of the 26 regressions, where the regressions do not converge properly because of a near-perfect prediction problem. This problem can be solved by relaxing the clustering and using simple robustness standard errors instead. Rerunning all 26 regressions in this way we find again that all our results follow through.

26
Our main model uses several company controls, such as industry and location. An alternative
approach is to use company fixed effects, which control for all time-invariant company effects.
We purposely avoided this approach for the main model, since it would obviate Equal Split,
which is an important variable of interest. Nevertheless, rerunning our regressions using
company fixed effects yields no material differences in terms of the impact of the financing
events.
We also considered several variants for our key explanatory variables. For example, our main
model always uses Founder Financing as a dummy variable. For the regressions in the company-
quarter sample, a reasonable alternative would be to use “Founder Financing Amounts,” a
continuous variable constructed similarly to “External Financing Amounts.” Rerunning the
models with Founder Financing, but replacing it with Founder Financing Amounts, yields again
very similar effects.
In our models we measure valuation by the company’s pre-money valuation. A reasonable
alternative would have been to use the post-money valuation. We considered this alternative
but found no material differences. We also checked whether broadening our definition of
venture capitalist mattered. Specifically, we included corporate investors on that basis that they
too may be professional investors and found that the coefficient of the augmented VC
Financing variable remains either insignificant or becomes marginally significant at the 10%
level.
Our robustness checks also included additional ways to controlling for company performance.
We reported our results for revenues, patents, and company exits and failures, but our data
also contains some information on the number of employees of our companies. Unfortunately,

27
employee figures are only available for less than half of the company quarters. We still ran
regressions that control for employment yet found that the employment variable is always
insignificant.
Yet another approach to control for performance is to look at the evolution of a company’s
financial valuations. Of particular interest are so-called “down rounds,” where a company must
accept a lower valuation than in an earlier round. Down rounds are widely considered a sign of
poor company performance and can have negative ramifications for existing shareholders. We
therefore added a down rounds control into the analysis but found this down round control is
always insignificant.
5. Discussion and extensions
In this section we reflect on the interpretation of our main results and explore some additional
findings about main antecedents of founder ownership changes. We divide our discussion into
three parts. Section 5.1 looks at the initial split of founder shares, Section 5.2 at external
financing events. Section 5.3 provides a perspective on future research.
5.1. The role of initial fairness
We motivated our analysis with Figure 1 which provides a simple classification of static versus
dynamic preferences for fairness. One of our key findings is that an initial equal split of founder
equity is associated with a lower tendency to subsequently change relative founder shares.
There is a strong relationship between an initial (static) fairness preference and a subsequent

28
(dynamic) fairness preference. Teams that believe in fairness at the start (in terms of an equal
split), also believe in fairness over time.
Our finding on the dynamic persistence of equal split relates to the prior work of Hellmann and
Wasserman (2017), whose analysis of the initial allocation of shares among founders is based
on an entirely different dataset. The findings in this paper are consistent with those of
Hellmann and Wasserman, particularly their findings that suggest that outside investors tend to
be sceptical of equal splitters. To see this in greater detail Table 8 compares variables across the
subsamples of equal versus non-equal splitters. Focusing on the financial variables in the
company quarter sample, we note that equal splitters have significantly fewer financing rounds
(35% of the quarters as opposed to 44%). This difference is entirely driven by external financing
rounds (33% as opposed to 43%). The t-test for the significance of the difference indicates
significance at the 1% level. Equal split companies also attract lower external financing amounts
and lower founder amounts. Finally, the pre-money valuations of equal split companies are, on
average, less than half than pre-money valuations of non-equal split companies. All these
results are consistent with the findings of Hellmann and Wasserman (2017) which suggest that
investors are wary of equal splitters.
Founder financing poses another interesting challenge to equal splitters. If some founders
invest more than others, then the equal split is usually given up, simply because different
founders obtain a different number of additional shares. The way to preserve equal splits with
founder financing is for all founders invest identical amounts. To examine the prevalence of
such symmetric founder investments, we create a variable “Equal Founder Amounts” that takes
the value 1 if all founders invest identical amounts. We condition this variable on there being

29
some founder investments. Panel B of Table 2 shows that 28% of all founder financing rounds
involve identical investment amounts. However, there is a notable difference between equal
and unequal splitters. In Table 8 we see that for equal splitters 48% of all founder rounds
involve identical amounts, compared to only 2% amongst unequal splitters. The t-test for the
significance of differences is significant at the 1% level. This shows that equal investing by
founders is significantly more common among equal splitters. This finding is consistent with our
interpretation that choosing an equal split reveals a founder team preference for fairness.
Founder teams do not only choose to split the initial ownership equally but also preserve that
balance when making founder investments.15
To further investigate our interpretation of equal splits as a (static) preference for fairness, we
also examine “near equal splitters.” Equal splits require that all founders have exactly the same
number of shares. An interesting question is whether teams that choose a near equal split
behave similarly or differently from the equal splitters? Specifically, the question is whether
teams that deviate slightly from the equality norm are different from those that stick precisely
to the equality norm?
To examine this, we use “Near Equal Split” (defined in Section 3) as an additional explanatory
variable. If we use both the Equal Split and Near Equal Split dummy variables, the comparison
group effectively becomes those teams that are far away from an equal split, let us call these
teams “Far Splitters.” Thus, any finding that the “Near Equal Split” coefficient is close to zero
15 An additional question concerns unequal splitters. Equal investments preserve relative ownership for teams with equal split, but not for teams with unequal splits. In principle it is possible for unequal splitters to preserve their ownership in a founder round, namely by investing in proportion to their current (unequal) ownership stakes. In our entire dataset we only find a single instance of such proportional founder investments. Thus, we find again that unequal splitters are much less concerned about preserving their relative ownership structure.

30
would suggest that Near Equal Splitters are similar to Far Splitters in terms of dynamic
ownership changes. By contrast a finding that that the coefficients of “Near Equal Split” and
“Equal Split” were of similar magnitudes would suggest that slight deviations from the 1/n rule
are irrelevant in terms of dynamic ownership changes.
Table 9 shows the results of adding “Near Equal Split.” The first column is based on Column 1 of
Table 4, the second on Column 5 of Table 4, the third on Column 1 of Table 5, and the fourth
Column 2 of Table 5.16 In all four models we find that “Near Equal Split” is statistically
insignificant.17 This is a strong result, it establishes that even a small deviation from equal
splitting reveals an economically meaningful departure from a static fairness preference of the
founding team. We consider this to be a confirmation of our main interpretation that an equal
split at the start, meaning an exactly equal split, reveals a static preference for fairness that
subsequently very frequently translates into a dynamic preference for fairness.
5.2. The role of external financing
Our second major finding is that relative ownership changes amongst founders are associated
with external financing events. We find a positive correlation that is statistically highly
significant and robust to controls, including, notably, the company performance controls
examined in section 4.3. Yet, due to the absence of a natural experiment we remain cautious
not to impose a direct causal interpretation on this result. Instead we can think of external
16 We also considered alternative ways of defining the “Near Equal” dummy, to consider different degrees of closeness to the Equal Split variable. Our main specification uses the 25th percentile of unequal splits, but for robustness we also considered the 10th, 20th or 33th percentile of unequal splits. Our results are robust to these variations. 17 In fact, the Near Equal Split coefficient is always positive, yet insignificant. A positive and significant coefficient would put “Near Equal Splitters” even further away from Equal Splitters than the comparison group of Far Splitters.

31
funding as the event where entrepreneurs and investors jointly reconsider a new ownership
arrangement. This may be due to investors exercising pressure, but it may also be due to
founders leveraging the investment event.18
Still we ask why external investments play such an important role. As noted above, founder
teams face a trade-off between an efficiency and a fairness logic. Investors do not look at this
trade-off in the same way as founders. They do not share the social obligations and ties of the
founder team. Instead, they are investing in the venture with the expectation of generating a
financial return. As such investors have a self-interest in promoting the efficiency logic. If
founder teams face a trade-off between efficiency and fairness, but outside investors favour
efficiency, we should expect that investors play an important role in persuading founder teams
to readjust their ownership shares, if and when there are efficiency benefits to be realised. In
support of this logic we already found in Table 5 that larger financing rounds are associated
with higher values for relative ownership change. This makes sense in this context as larger
rounds presumably mean greater bargaining power of external investors vis-à-vis the founder
team. Our tentative finding of a negative coefficient for valuation further adds to this finding.
For a given round amount, a lower valuation means that the relative share of external investors
is high, which presumably means more bargaining power for external investors.
Given this line of argument, a logical conjecture is that the first encounter with investors is the
most important. Under the above argument founder teams allocate ownership based on their
18 For example, certain founders may conveniently hide behind their investors to bring about changes in the relative founder ownerships. Even though founder ownership changes can be made at any time, having an external financing event provides legitimacy to such as change. Put differently, rather than directly requesting a larger ownership share, certain founders might wait for an external funding round which already brings about changes (i.e. typically a dilution of the overall founder stake) and thus provides an opportunity to also change relative founder shares.
32
internal logic, but this internal logic gets challenged the first time they face external investors.
In such a first financing round, there ought to be a heightened chance that investors have to fix
inadequate initial arrangements. By contract, in later round investments, these issues will have
been largely addressed.19
We empirically investigate this additional implication in Table 10, which shows whether first
round investments have a differential effect on founder ownership changes. The first two
columns are based on the company quarter sample and build on the model of Column 5 in
Table 4. The first column adds the First Round dummy variable, the second column further adds
an interaction effect between Equal Split and First Round. The remaining four columns are
based on the financing round sample and build on Table 5. The third column of Table 10 adds
again the First Round dummy, and the fourth the interaction term between Equal Split and First
Round. Finally, in the fifth and sixth columns we add valuation and its interaction terms.
Table 10 finds some very weak evidence between the first round and all subsequent rounds. In
column 1 the coefficient is highly significant. However, adding further controls weakens the
statistical significance of the coefficient. We therefore consider this evidence very preliminary
but not yet conclusive.
5.3. Avenues for future research
In this section we briefly discuss how future research might further extend our understanding
of the issues we explore in this paper. One limitation of our data is that there is no random
assignment or other quasi-experimental variation. While we can observe interesting
19 In a related manner, Croce et al. (2012) show that first round investments by VCs are different, as this is where the choice of investor has an effect on performance, while later rounds do not.

33
correlations in our panel data, we cannot identify any causal links. Our data also comes from
one single geographic area (although there is nothing particularly unusual about British
Columbia). Also, as our results show, there is no evidence that industry or company location
plays a major role. Yet, it remains to be seen whether our results generalize to other contexts.
Future researchers might thus look for different institutional settings, and when doing so ideally
find natural experiments to identify causal relationships.
Our study leverages a unique opportunity to obtain dynamic ownership data from share
registries. The analysis would be even more powerful if we had access to the shareholder
agreements and negotiations that generated our data. Of particular interest would be to
examine to what extents ownership changes result from pre-meditated contingencies on the
one hand, and unanticipated circumstances on the other. An example of a pre-meditated
contingency is a founder vesting schedule which specifies in which events a founder receives
additional company shares. Founder stock option plans are pre-meditated as well. Moreover, it
could be that some wealthy founders are able to exercise pre-emptive rights to maintain
ownership in a funding round, while other founders are not. Our conjecture is that such pre-
meditated ownership changes constitute the smaller part of the founder ownership changes,
and that the majority arises from unexpected circumstances that compel founder teams to
revisit their original ownership arrangements. Future research might validate or refute this
conjecture.
One promising avenue for future research concerns incorporating the roles and characteristics
of individual founder characteristics, and what justifies receiving higher or lower stakes. Our
data is not well suited to address this question, because we do not have access to individual

34
founder data, such as their skills, their contributions, or their personal circumstances (e.g., their
involvement in other companies). We suspect that changes in the circumstances of individual
founders are likely to matter a lot for relative ownership. Our data does not contain any
information about individual founders, let alone their changing circumstances.
Another interesting question for future research is: “What is the price of fairness?” Table 8
shows that equal split companies are not as successful as unequal splitters in terms of several
metrics. But to what extent is the difference in ultimate performance caused by the inefficiency
associated with the choice for fairness? Answering this question brings us back to the
importance of natural experiments to identify causal relationships in future research.
We conjectured in the beginning of the paper that the fairness versus efficiency trade-off is
impacted by the relative bargaining power of shareholders vis-à-vis the founder team. Our
empirical finding about the role of external financing suggests that shareholders place a
different weight on efficiency than founders. The next step would be to examine what other
variables affect the relative bargaining power of shareholders versus founders. Board control
might matter and voting rights (especially dual class shares) might also be important. The same
can be said about the possible presence of dominant clients or other financiers (e.g., debt
holders).
There are considerable challenges for what we argue is a very important research agenda. Of
particular note is the challenge of finding data about internal company events that lead to
ownership changes. Our current analysis suggests tentatively that indicators of overall company
performance, such as revenues or patenting, do not affect founder ownership changes.
However, in addition to having more fine-grained measures of overall company performance,

35
the most interesting (but also most difficult to obtain) data would be to measure individual
founder circumstances and internal team dynamics.
6. Conclusion
This paper examines the dynamics of relative founder ownership within teams. Our dataset
allows us to measure the initial ownership allocation as well as all subsequent changes. While
there is a prior literature that looks at the antecedents and consequences of initial founder
splits, our contribution is to consider the dynamics of how relative ownership changes over
time.
Our analysis is motivated by a dynamic trade-off between efficiency and fairness, which we
argue is very different for founders on the one hand and shareholders on the other. Our
analysis points to two important antecedents of changes in the relative shareholdings of
founders. First, we find evidence of persistence in fairness choices. A key result is that founder
teams that initially split their founder equity equally are subsequently less likely to change their
relative shares. This effect only applies to teams that adhere to an equal split strictly; teams
that split the founder shares close to equally at the outset behave entirely differently than
equal splitters. Second, external financing events are an important determinant of relative
ownership changes amongst founders. In particular we find that founder ownership changes
are likely to coincide with external financing events. Larger investment rounds and lower
company valuations are more likely to be associated with changes in the relative founder
ownership. Our analysis also suggests that the two antecedents for founder ownership changes,

36
initial fairness preferences and external financing events, seem to operate independently of
each other.
We highlight two managerial implications of our findings. First, it is important for founder
teams to be aware of the two competing logics of efficiency and fairness, and to realize that the
initial allocation of founder shares can still be altered over time, as circumstances change.
Second, founder teams are advised to understand that, for good reason, investors will look at
their founder share allocation. The relative ownership allocation within founder teams is not a
purely internal affair between founders. Especially the first investors in the company can
challenge the team by asking for a recalibration of their original arrangements. The reason that
investors care presumably has to do with their understanding that the relative ownership
allocation affects the group dynamics between the founders, as well as their individual
incentives, and therefore ultimately also the performance of the company.
References
Adams JS. 1965. Inequity in social exchange. In Advances in Experimental Social Psychology 2. Berkowitz
L (ed). Academic Press: New York.: 267-299.
Akerlof GA, Yellen JL. 1990. The fair wage-effort hypothesis and unemployment. Quarterly Journal of
Economics 105(2): 255-283.
Åstebro T. 2012. The returns to entrepreneurship, In The Oxford Handbook of Entrepreneurial Finance,
Cummins D. (ed). Oxford University Press: Oxford, UK: 45-108.
Åstebro T, Serrano CJ. 2015. Business partners: complementary assets, financing, and invention
commercialization. Journal of Economics & Management Strategy, 24(2): 228-252.
Baron JN, Burton MD, Hannan MT. 1996. The road taken: the origins and evolution of employment
systems in high-tech firms. Industrial and Corporate Change, 5(2):239-275.
Baron JN, Hannan MT, Burton MD. 2001. Labor pains: organizational change and employee turnover in
young, high-tech firms. American Journal of Sociology, 106(4): 960-1012.

37
Beckman C. 2006. The influence of founding team company affiliations on firm behavior. Academy of
Management Journal 49(4): 741–758.
Beckman C, Burton MD, O’Reilly C. 2007. Early teams: the impact of team demography on VC financing
and going public. Journal of Business Venturing, 22(2): 147-173.
Beckman C, Burton MD. 2008. Founding the future: path dependence in the evolution of top
management teams from founding to IPO. Organization Science 19(1): 3-24.
Bernstein S, Giroud X, Townsend R. 2016. The impact of venture capital monitoring, Journal of Finance
71(4): 1591-1622.
Binmore K, Rubinstein A, Wolinsky A. 1986. The Nash bargaining solution in economic modelling. Rand
Journal of Economics 17(2): 176-188.
Burton MD, Sørensen JB, Beckman C. 2002. Coming from good stock: career histories and new venture
formation. In Research in the Sociology of Organizations 19. Lounsbury M, Ventresca MJ (eds).
JAI/Elsevier Science: New York, NY: 229-262.
BC Stats. 2016 Innovative Business: High Technology in British Columbia. BC Stats, Small Business
Quarterly 16(4) (Fourth Quarter 2016).British Columbia Securities Commission, 2017, Private &
early stage businesses, Web:
www.bcsc.bc.ca/For_Companies/Private_Placements/Private_and_early_stage_businesses/
(Last accessed on January 7, 2017)
Colombo MG, Grilli L. 2005. Founders' human capital and the growth of new technology-based firms: a
competence-based view. Research Policy 34: 795–816.
Colombo MG, Grilli L. 2010. On growth drivers of high-tech start-ups: exploring the role of founders'
human capital and venture capital. Journal of Business Venturing 25(6): 610-626.
Colombo MG, Grilli L. 2013. The creation of a middle‐management level by entrepreneurial ventures:
testing economic theories of organizational design. Journal of Economics & Management
Strategy 22(2): 390-422
Conti A, Thursby M, Rothaermel F. 2013. Show me the right stuff: signals for high-tech startups. Journal
of Economics & Management Strategy 22(2): 341-364.
Croce A, Martí J, Murtinu S. 2013. The impact of venture capital on the productivity growth of European
entrepreneurial firms: ‘screening’ or ‘value added’ effect? Journal of Business Venturing 28(4):
489-510.
Da Rin M, Hellmann T, Puri M. 2012. A survey of venture capital research. In Handbook of the Economics
of Finance, Vol 2A: Corporate Finance. Constantinides G, Harris M, Stulz R (eds). Elsevier: North
Holland.
Davila A, Foster G, Gupta M. 2003. Venture capital financing and the growth of start-up firms. Journal of
Business Venturing 18: 689–708.
Dawes CT, Fowler JH, Johnson T, McElreath R, Smirnov O. 2007. Egalitarian motives in humans. Nature
446: 794–796.

38
Decker, Ryan, John Haltiwanger, Ron Jarmin, and Javier Miranda. 2014. “The Role of Entrepreneurship in
US Job Creation and Economic Dynamism.” Journal of Economic Perspectives 28 (3): 3–24.
Dewatripont M. 1989. Renegotiation and information revelation over time: the case of optimal labor
contracts. Quarterly Journal of Economics 104(3): 589-619.
Deutsch M. 1975. Equity, equality and need: what determines which value will be used as the basis for
distributive justice? Journal of Social Issues 31: 137-149.
Engel D, Keilbach M. 2007. Firm level implication of early stage venture capital investment: an empirical
investigation. Journal of Empirical Finance 14: 150–167.
Ewens M, Marx M. 2017. Founder replacement and startup performance” Mimeo, CalTech. Available at
SSRN: http://dx.doi.org/10.2139/ssrn.2717124.
Fehr E, Schmidt KM. 1999. A theory of fairness, competition, and cooperation. Quarterly Journal of
Economics 114(3): 817-868.
Fehr E, Schmidt KM. 2006. The economics of fairness, reciprocity and altruism: experimental evidence
and new theories. In Handbook of the Economics of Giving, Altruism, and Reciprocity, Vol 1,
Kolm S, Ythier JM (eds). Elsevier: North-Holland.
Gans J., Scott E., and Stern S., 2018, Strategy for Startups, May-June, Harvard Business Review
Gans J, Stern S, and Wu J. 2016. Foundations of entrepreneurial strategy, mimeo, MIT Sloan School of
Business.
Gompers P. 1995, Optimal investment, monitoring, and the staging of venture capital. Journal of Finance
50(5):1461-1489.
Gorman M, Sahlman W. 1989. What do venture capitalists do? Journal of Business Venturing 4: 231–
248.
Government of British Columbia (2017). Investment capital. Government of British Columbia, Ministry of
International Trade. www2.gov.bc.ca/gov/content/employment-business/investment-capital
(Last accessed on January 9, 2017)
Grossman SJ, Hart OD. 1986. The costs and benefits of ownership: a theory of vertical and lateral
integration. Journal of Political Economy 94(4): 691-719.
Hannan MT, Burton MD, Baron JN. 1996. Inertia and change in the early years: employment relations in
young, high-technology firms. Industrial and Corporate Change 5(2): 503-536.
Hellmann T, Puri M. 2002. Venture capital and the professionalization of start-up firms: empirical
evidence. Journal of Finance 57(1): 169-197.
Hellmann T, Schure P. 2010. An evaluation of the venture capital program in British Columbia. Report
prepared for the BC Ministry of Small Business, Technology and Economic Development
Hellmann T, Schure P, Vo DH. 2017. Angels and venture capitalists: complements or substitutes? Saïd
Business School Working Paper 2015-2. Available at SSRN: https://ssrn.com/abstract=2602739
or http://dx.doi.org/10.2139/ssrn.2602739.

39
Hellmann T, Thiele V. 2015. Contracting among founders. Journal of Law, Economics and Organization
31(3): 629-661.
Hellmann T, Wasserman N. 2017. The first deal: the division of founder equity in new ventures
Management Science 63(8): 2647–2666.
Holmström B. 1982. Moral hazard in teams. Bell Journal of Economics 13(2): 324-340.
Hurst, Erik, and Ben Pugsley, “What Do Small Businesses Do?” Brookings Papers on Economic Activity
2011(2), May 2011
Hsu D, Ziedonis R. 2013. Resources as dual sources of advantage: implications for valuing
entrepreneurial firm patents? Strategic Management Journal 34(7): 761-781.
Kacperczyk A, Bachalandran C. 2018. Vertical and horizontal comparisons and mobility outcomes:
evidence from the Swedish microdata. Organization Science 29(1): 17-38.
Kaplan SN, Strömberg P. 2003. Financial contracting theory meets the real world: an empirical analysis
of venture capital contracts. Review of Economic Studies 70(2): 281-315.
Kerr WR, Nanda R, Rhodes-Kropf M. 2014. Entrepreneurship as experimentation. Journal of Economic
Perspectives 28(3): pp.25-48.
Klotz AC, Hmieleski KM, Bradley BH, Busenitz LW. 2014. New venture teams: a review of the literature
and roadmap for future research. Journal of Management 40(1): 226 –255.
Lai R, D’Amour A, Yu A, Sun Y, Fleming L. 2011. Disambiguation and co-authorship networks of the U.S.
patent inventor database (1975 – 2010). Harvard Business School & Harvard Institute of
Quantitative Social Science.
Lazear E. 1989. Pay equality and industrial politics. Journal of Political Economy 97(3): 561–580.
Leventhal GS. 1976. The distribution of rewards and resources in groups and organizations. In Equity
Theory: Toward a General Theory of Social Interaction. Berkowitz L, Walster E (eds). Academic
Press: New York: 92-133.
Nash J. 1953. Two-person cooperative games. Econometrica 21(1): 128–140.
Pfeffer J, Davis-Blake A. 1992. Salary dispersion, location in the salary distribution, and turnover among
college administrators. Industrial & Labor Relations Review 45(4): 753–763.
Prowse S. 1998. Angel investors and the market for angel investments. Journal of Banking & Finance 22:
785-792.
Puri M, Zarutskie R. 2012. On the lifecycle dynamics of venture-capital- and non-venture-capital-
financed firms. Journal of Finance 67(6): 2247-2293.
Rawls J. 1971. A Theory of Justice. Harvard University Press: Cambridge, MA.
Ries E. 2011. The Lean Startup: How Today's Entrepreneurs Use Continuous Innovation to Create
Radically Successful Businesses. Crown Books: New York, NY.
Rubinstein A. 1982. Perfect equilibrium in a bargaining model. Econometrica 50: 97-110.
40
Rubinstein A, Wolinsky A. 1985. Equilibrium in a market with sequential bargaining. Econometrica 53:
1133-1150.
Ruef M. 2010. The Entrepreneurial Group: Social Identities, Relations, and Collective Action. Princeton
University Press: Princeton, NJ.
Ruef M, Aldrich HE, Carter NM. 2003. The structure of founding teams: homophily, strong ties, and
isolation among U.S. entrepreneurs. American Sociological Review 68: 195-222.
Sapienza H, Manigart S, Vermeir W. 1996 Venture capitalist governance and value added in four
countries, Journal of Business Venturing 11(6): 439-469.
Shapley LS. 1953. A value for n-person games, In Contributions to the Theory of Games, Vol II (Annals of
Mathematics Studies 28), Kuhn HW, Tucker AW (eds). Princeton University Press: Princeton, NJ:
307-317.
Skott P. 2005. Fairness as a source of hysteresis in employment and relative wages. Journal of Economic
Behavior and Organization 57(3): 305-331.
Vo DH. 2018. Patents and early‐stage financing: matching versus signalling. Forthcoming in Journal of
Small Business Management. doi:10.1111/jsbm.12414.
Wasserman N. 2003. Founder-CEO succession and the paradox of entrepreneurial success. Organization
Science 14(2): 149-172.
Wasserman N. 2006. Stewards, agents, and the founder discount: executive compensation in new
ventures. Academy of Management Journal 49: 960-976.
Wasserman N. 2012. The Founder's Dilemmas: Anticipating and Avoiding the Pitfalls that can Sink a
Startup. Princeton University Press: Princeton, NJ.
Wasserman N. 2017. The throne vs. the kingdom: founder control and value creation in startups.
Strategic Management Journal 38(2): 255-277.
Williamson OE. 1975. Markets and Hierarchies: Analysis and Antitrust Implications. Free Press: New
York, NY.
Wiklund J, Shepherd D. 2003. Knowledge-based resources, entrepreneurial orientation, and the
performance of small and medium-sized businesses. Strategic Management Journal 24(13):
1307–1314.
Wong AY. 2010. Angel finance: the other venture capital, Chapter 5 In Venture Capital: Investment
Strategies, Structures, and Policies, Cumming D (ed). John Wiley & Sons: Hoboken, NJ: 71-110.

41
Figure 1: The static and dynamic trade-offs between efficiency and fairness
EFFICIENCY LOGIC FAIRNESS LOGIC
INITIAL DIVISION OF RELATIVE
FOUNDER OWNERSHIP
(STATIC)
Unequal splits are chosen,
reflecting differences between
founders
An equal split is chosen,
reflecting the conviction of the
founder team
REVISION OF THE PRIOR
OWNERSHIP ARRANGEMENT
(DYNAMIC)
Adjust relative ownership over
time, in response to changed
economic circumstances
Preserve original ownership
agreement, in order not to
renege on the initial pact
Figure 2: Histogram of relative founder ownership changes
This Figure represents AAOC, conditional on AAOC >0
0%
1%
1%
2%
2%
3%
3%
4%
4%
5%
5%
Freq
uen
cy
AAOC
EqualSplit = 1 EqualSplit = 0

42
Figure 3: Number of relative founder ownership changes by company
Figure 4: Percent of companies with at least one ownership change (as measured by AAOC)
0.0%
5.0%
10.0%
15.0%
20.0%
25.0%
30.0%
35.0%
0 1 2 3 4 5 6 or More
Per
cen
t o
f C
om
pan
ies
Number of Changes in AAOC
EqualSplit = 1 EqualSplit = 0
0
0.1
0.2
0.3
0.4
0.5
0.6
0.7
0.8
1 2 3 4 5 6 7 8 9 10 11 12 13 14 15 16 17 18 19 20 21 22 23 24 25 26 27 28 29 30
Perc
ent
of
Co
mp
anie
s
Quarters Since Incorporation

43
Figure 5: Average Absolute Deviation from equality (AAD) for initial ownership allocations
Figure 6: Change in the Average Absolute Deviation between the initial and the final ownership
allocation
0
0.1
0.2
0.3
0.4
0.5
0.6
0 0.05 0.1 0.15 0.2 0.25 0.3 0.35 0.4 0.45 0.5
Perc
ent
of
Co
mp
anie
s
AAD
0.0%
5.0%
10.0%
15.0%
20.0%
25.0%
30.0%
35.0%
40.0%
45.0%
-0.25 -0.2 -0.15 -0.1 -0.05 0 0.05 0.1 0.15 0.2 0.25 0.3 0.35 0.4 0.45
Per
cen
t o
f C
om
pan
ies
Change in AAD
EqualSplit = 1 EqualSplit = 0
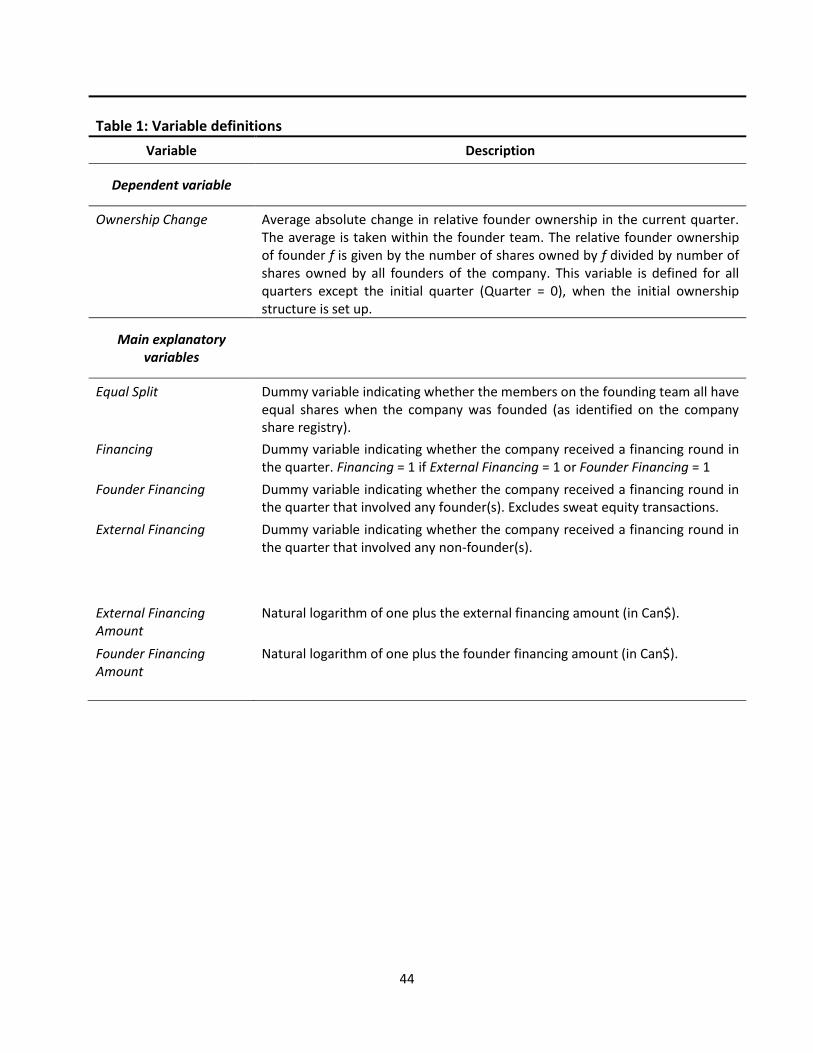
44
Table 1: Variable definitions Variable Description
Dependent variable
Ownership Change Average absolute change in relative founder ownership in the current quarter. The average is taken within the founder team. The relative founder ownership of founder f is given by the number of shares owned by f divided by number of shares owned by all founders of the company. This variable is defined for all quarters except the initial quarter (Quarter = 0), when the initial ownership structure is set up.
Main explanatory variables
Equal Split Dummy variable indicating whether the members on the founding team all have equal shares when the company was founded (as identified on the company share registry).
Financing Dummy variable indicating whether the company received a financing round in the quarter. Financing = 1 if External Financing = 1 or Founder Financing = 1
Founder Financing Dummy variable indicating whether the company received a financing round in the quarter that involved any founder(s). Excludes sweat equity transactions.
External Financing Dummy variable indicating whether the company received a financing round in the quarter that involved any non-founder(s).
External Financing Amount
Natural logarithm of one plus the external financing amount (in Can$).
Founder Financing Amount
Natural logarithm of one plus the founder financing amount (in Can$).

45
Table 1 (cont.)
Control variables
(a) Time-dependent company characteristics
Age The company's age (in quarters). Age = {0, 1, 2, …}. Quarter 0 is the quarter for which the company issued its first shares as found in the BCICP share registry data.
Valuation Natural logarithm of one plus the pre-money valuation (in Can$) since the most recent financing round. Note: in quarters in which no round takes place, the valuation of the most recent financing round applies.
VC Financing Dummy variable indicating whether the company received VC financing round in the quarter.
Revenues Natural logarithm of one plus quarterly revenues amount (in Can$). Quarterly revenues is ¼ of the reported annual revenues.
Patents Natural logarithm of one plus the cumulative number of patent application in a quarter. The patent data is obtained from Disambiguation and Co-authorship Networks of the U.S. Patent Inventor Database 1975 – 2010, as well as the US patent office.
(b) Time-independent company characteristics
Number of Founders Number of founders on the founding team as identified in the company business plan, company website, or through web searches
Industry (set of dummies) Set of dummy variables for each of the following industries: Biotech; Cleantech; IT & Telecom; Software, Manufacturing; Other industry. Information about the companies’ operation are collected from the BCICP data and from web searches for the period between 1995 and 2009.
Region (set of dummies) Set of dummy variables for each of the following regions: Victoria; Vancouver; and Rest of BC. Information about the companies’ locations are collected from the BCICP data and from web searches for the period between 1995 and 2009.
Exit Dummy variable indicating whether the company exited via M&A or IPO at the end of the sample period.
Fail Dummy variable indicating whether the company ceased from operation at the end of the sample period.
Near Equal Split Dummy variable indicating whether the members on the founding team all have near equal shares when the company was founded (as identified on the company share registry). Near equal split = 1 if the average absolute deviation from equal split is greater than 0 but is within the 25th percentile of the average absolute deviation.
First Round Dummy variable indicating whether it is the first time the company received an external financing round in the quarter.
(c) Other controls
Calendar Time Quarterly set of dummy variables for each calendar quarter.

46
Table 2 - Descriptive Statistics
Panel A - Company Characteristics Statistics on company’s characteristics are reported at a company sample.
# Obs Average [95% CI] S.D.
Equal Split (dummy) 84 0.55 [0.44-0.66] 0.501
Near Equal Split (dummy) 84 0.11 [0.05-0.19]
Number of Founders 84 2.51 [2.31-2.71] 0.925
Industries - - - -
Biotech (dummy) 84 0.14 [0.08-0.24] 0.352
Clean Tech (dummy) 84 0.02 [0.00-0.08] 0.153
IT & Telecom (dummy) 84 0.10 [0.04-0.18] 0.295
Software (dummy) 84 0.33 [0.23-0.44] 0.474
Manufacturing (dummy) 84 0.24 [0.15-0.34] 0.428
Other Industry (dummy) 84 0.17 [0.09-0.26] 0.375
BC regions - - - -
Victoria (dummy) 84 0.07 [0.03-0.15] 0.259
Vancouver (dummy) 84 0.75 [0.64-0.84] 0.436
Rest of BC (dummy) 84 0.18 [0.10-0.28] 0.385
Company Status - - - -
Exit (dummy) 84 0.20 [0.12-0.30] 0.404
Fail (dummy) 84 0.38 [0.28-0.49] 0.488
Active (dummy) 84 0.42 [0.31-0.53] 0.496
Panel B - Financing Round Characteristics Statistics on key explanatory variables are reported at the company quarter and financing round sample. Note that in this table we report all variables prior to their logarithmic transformation.
Company Quarter Sample
# Obs Average [95% CI] S.D.
Ownership Change (dummy) 1287 0.12 [0.11-0.14] 0.328
Ownership Change 1287 0.0065 [0.00-0.025] 0.038
Ownership Change (conditional) 158 0.0534 [0.038-0.069] 0.097
Financing (dummy) 1287 0.38 [0.34-0.41] 0.486
Founder Financing (dummy) 1287 0.06 [0.05-0.08] 0.246
External Financing (dummy) 1287 0.37 [0.35-0.40] 0.483
Revenues ($) 770 1,696K [1,198K-2,194K] 7,039K
Patents 1287 0.84 [0.6-1.07] 4.321
Age (# quarters) 1287 11.26 [10.79-11.72] 8.564
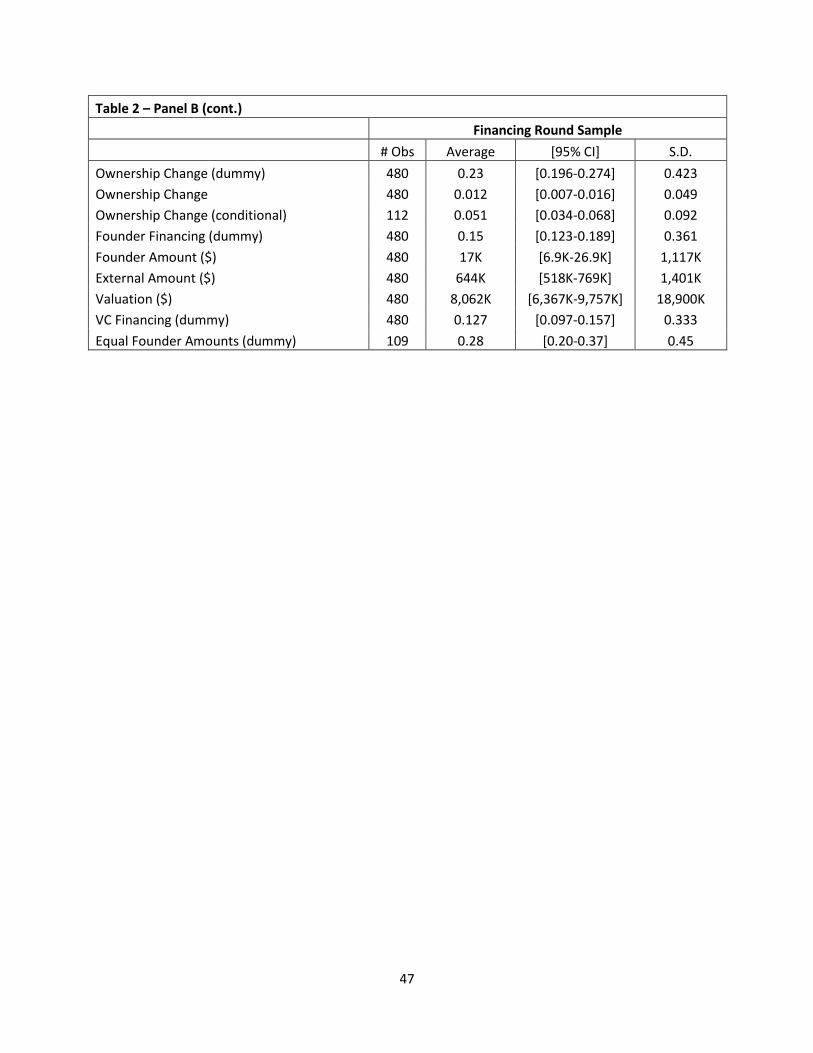
47
Table 2 – Panel B (cont.)
Financing Round Sample
# Obs Average [95% CI] S.D.
Ownership Change (dummy) 480 0.23 [0.196-0.274] 0.423
Ownership Change 480 0.012 [0.007-0.016] 0.049
Ownership Change (conditional) 112 0.051 [0.034-0.068] 0.092
Founder Financing (dummy) 480 0.15 [0.123-0.189] 0.361
Founder Amount ($) 480 17K [6.9K-26.9K] 1,117K
External Amount ($) 480 644K [518K-769K] 1,401K
Valuation ($) 480 8,062K [6,367K-9,757K] 18,900K
VC Financing (dummy) 480 0.127 [0.097-0.157] 0.333
Equal Founder Amounts (dummy) 109 0.28 [0.20-0.37] 0.45

48
Table 3 - Correlation Matrix
Panel A - Company Quarter Sample
Correlations between several key variables I the company quarter sample. ***, **, and * indicate significance at the 1%, 5%, and 10% levels, respectively. Actual p-values are in parentheses.
Ownership
Change Equal Split Near
Equal Financing Founder
Financing External
Financing Revenues Patents Exit Fail
Ownership Change 1.0000
Equal Split -0.0395 1.0000
(0.1572)
Near Equal 0.0120 -0.3772*** 1.0000
(0.6667) (0.0000)
Financing 0.1312*** -0.0911*** 0.0177 1.0000
(0.0000) (0.0007) (0.5137)
Founder Financing 0.1859*** 0.0131 -0.0368 0.3685*** 1.0000
(0.0000) (0.6274) (0.1735) (0.0000)
External Financing 0.1070*** -0.1038*** 0.0269 0.9726*** 0.2787*** 1.0000
(0.0000) (0.0001) (0.3194) (0.0000) (0.0000)
Revenues -0.0155 -0.1631*** 0.1494*** 0.0197 0.0119 0.0228 1.0000
(0.6669) (0.0000) (0.0000) (0.5806) (0.7398) (0.5223)
Patents 0.0041 -0.0662** -0.0165 -0.0308 0.0025 -0.0215 0.0445 1.0000
(0.8826) (0.0143) (0.5426) (0.2538) (0.9256) (0.4263) (0.2128
Exit -0.0138 -0.1661*** 0.2892*** -0.0143 -0.0285 -0.0044 0.2751*** -0.0809*** 1.0000
(0.6214) (0.0000) (0.0000) (0.5966) (0.2917) (0.8706) (0.0000) (0.0027)
Fail 0.0149 -0.0274 -0.0478* 0.0858*** 0.0671** 0.0757*** -0.1133*** -0.0981*** -0.3442*** 1.0000 (0.5940) (0.3116) (0.0771) (0.0015) (0.0129) (0.0051) (0.0015) (0.0003) (0.0000)

49
Table 3 (cont.)
Panel B – Financing Round Sample
Correlations between several key variables I the company quarter sample. ***, **, and * indicate significance at the 1%, 5%, and 10% levels, respectively. Actual p-values are in parentheses.
Ownership Change Equal Split Near Equal Founder Financing External Financing
Amount Valuation VC Financing
Ownership Change 1.0000
Equal Split -0.0416 1.0000
(0.3629)
Near Equal 0.0167 -0.3487*** 1.0000
(0.7151) (0.0000)
Founder Financing 0.1485*** 0.0455 -0.0523 1.0000
(0.0011) (0.3023) (0.2360)
External Financing Amount -0.0070 -0.0029 0.0286 -0.0686 1.0000
(0.8776) (0.9475) (0.5176) (0.1199)
Valuation -0.2472*** -0.1814*** 0.0824* -0.2563*** 0.6497*** 1.0000
(0.0000) (0.0000) (0.0616) (0.0000) (0.0000)
VC Financing 0.0269 -0.0796* 0.0866** 0.0079 0.4504*** 0.1534*** 1.0000
(0.5568) (0.0711) (0.0496) (0.8583) (0.0000) (0.0005)

50
Table 4: The Antecedents of Ownership Change
Results of panel Tobit regressions in the company quarter sample. The dependent variable, Ownership Change, or AAOC, is the average absolute change in the relative founder ownership in the current quarter. The main independent variables are dummy variables indicating whether members on the founding team had equal ownership when the company was founded, received financing, received founder financing, and received external financing in the current quarter. The reported control variables are company age in the current quarter, number of founding members, industry dummies, and region dummies. The unreported control is a set of dummy variables measuring calendar time in quarters. A constant was also included but not shown. All variables are defined in Table 1. Bootstrapped standard errors are reported in the parentheses. ***, **, and * indicate significance at the 1%, 5%, and 10% levels, respectively.
VARIABLES (1) (2) (3) (4) (5)
Equal Split -0.0444**
-0.0429**
-0.0539**
(0.0214)
(0.0185)
(0.0242) Financing
0.122*** 0.121***
(0.0229) (0.0231)
Founder Financing
0.193*** 0.195*** (0.0360) (0.0453)
External Financing
0.0614** 0.0601*** (0.0248) (0.0189)
Age -0.000596 0.00049 0.000450 0.000716 0.00122 (0.00163) (0.00107) (0.00105) (0.00146) (0.00103)
Number of Founders 0.00297 0.00662 0.00253 0.00663 0.00162 (0.0359) (0.0104) (0.00652) (0.0105) (0.00795)
Biotech 0.0588 0.0741 0.0649* 0.0760 0.0648 (0.0560) (0.0495) (0.0345) (0.151) (0.0401)
Cleantech -0.0273 -0.0513 -0.0461 -0.0800 -0.0719 (0.0552) (0.311) (0.219) (7.287) (0.334)
IT & Telecom 0.0514 0.0499 0.0375 0.0430 0.0270 (0.0629) (0.0579) (0.0481) (0.150) (0.0413)
Software 0.0390 0.0435 0.0277 0.0374 0.0177 (0.0590) (0.0402) (0.0285) (0.153) (0.0389)
Hitech Manufacturing 0.0531 0.0710 0.0552 0.0648 0.0450 (0.0583) (0.0508) (0.0414) (0.156) (0.0318)
Victoria 0.0197 0.0106 0.0162 0.0243 0.0320 (0.0405) (0.0338) (0.0219) (0.0342) (0.0294)
Vancouver 0.0164 -0.00779 0.00561 -0.0265 -0.00990 (0.0281) (0.0231) (0.0240) (0.0246) (0.0272)
Controls YES YES YES YES YES Observations 1,287 1,287 1,287 1,287 1,287 Number of Companies 84 84 84 84 84 Log Likelihood -161.8 -125.4 -122.3 -81.17 -76.78

51
Table 5 – The Role of External Financing Characteristics
Results of panel Tobit regressions in the financing round sample. The dependent variable, Ownership Change, or AAOC, is the average absolute change in the relative founder ownership in the current quarter. The main independent variables are dummy variables indicating whether members on the founding team had equal ownership when the company was founded, whether the company received founder financing, the logarithm of the external financing amount, the logarithm of the company's value and a dummy variable indicating whether the company received VC financing in the current financing quarter. The unreported control variables are company age in the current quarter, number of founding members, industry dummies, region dummies, and a set of dummy variables measuring calendar time in quarters. A constant was also included but not shown. All variables are defined in Table 1. Bootstrapped standard errors are reported in the parentheses. ***, **, and * indicate significance at the 1%, 5%, and 10% levels, respectively.
VARIABLES (1) (2) (3)
Equal Split -0.0394* -0.0566*** -0.0464* (0.0212) (0.0123) (0.0272) Founder Financing 0.145*** 0.121*** 0.133*** (0.0215) (0.0233) (0.0214) External Financing Amount 0.0122* 0.0278** (0.00658) (0.0115) Valuation
-0.0417* -0.0199
(0.0220) (0.0138) VC Financing 0.0368 (0.0305) Controls YES YES YES
Observations 480 480 480 Number of companies 80 80 80 Log Likelihood 10.55 29.06 31.12

52
Table 6 : Interaction of External Financing and Equal Splits
Results of panel Tobit regressions in the company quarter sample (column 1 & 2) and in the financing round sample (column 3 & 4). The dependent variable, Ownership Change, or AAOC, is the average absolute change in the relative founder ownership in the current quarter. The main independent variables are dummy variables indicating whether members on the founding team had equal ownership when the company was founded, whether the company received financing, received founder financing, received external financing, the logarithm of the external financing amount, the logarithm of the company's value and their interactions with Equal Split variable in the current quarter. The unreported controls are company age in the current quarter, number of founding members, industry dummies, region dummies, and a set of dummy variables measuring calendar time in quarters. A constant was also included but not shown. All variables are defined in Table 1. Bootstrapped standard errors are reported in the parentheses. ***, **, and * indicate significance at the 1%, 5%, and 10% levels, respectively.
VARIABLES (1) (2) (3) (4)
Equal Split -0.0621* -0.0560** -0.353* -0.749*** (0.0368) (0.0237) (0.186) (0.249) Financing 0.108***
(0.0244)
Equal Split * Financing 0.0312
(0.0296)
Founder Financing
0.171*** 0.126*** 0.0950***
(0.0316) (0.0322) (0.0210)
Equal Split * Founder Financing
0.0489 0.0417*** 0.0479**
(0.0301) (0.0116) (0.0236)
External Financing
0.0665***
(0.0253)
Equal Split * External Financing
-0.0146
(0.0282)
External Financing Amount
0.00539 0.0260***
(0.0105) (0.00561)
Equal Split * External Financing Amount
0.0246* 0.00609
(0.0131) (0.0126)
Valuation
-0.0579***
(0.0190)
Equal Split * Valuation
0.0413* (0.381) Controls YES YES YES YES Observations 1,287 1,287 480 480 Number of companies 84 84 80 80 Log Likelihood -121.7 -75.95 14.24 39.43

53
Table 7: The Role of Company Performance
Results of panel Tobit regressions in the company quarter sample. The dependent variable, Ownership Change, or AAOC, is the average absolute change in the relative founder ownership in the current quarter. The main independent variables are dummy variables indicating whether members on the founding team had equal ownership when the company was founded, whether the company received founder financing, received external financing, the logarithm of the company's revenue, logarithm of the company's cumulative number of patent applications, and a set of dummy variables indicating the company status in the current quarter. The unreported controls are company age in the current quarter, number of founding members, industry dummies, region dummies, and a set of dummy variables measuring calendar time in quarters. A constant was also included but not shown. All variables are defined in Table 1. Bootstrapped standard errors are reported in the parentheses. ***, **, and * indicate significance at the 1%, 5%, and 10% levels, respectively.
VARIABLES (1) (2) (3) (4)
Equal Split -0.0462* -0.0547*** -0.0531* -0.0614*** (0.0251) (0.0197) (0.0286) (0.0233) Founder Financing 0.149*** 0.195*** 0.194*** 0.157*** (0.0339) (0.0298) (0.0318) (0.0418) External Financing 0.0301* 0.0600*** 0.0599*** 0.0281 (0.0166) (0.0188) (0.0150) (0.0175) Revenues -0.00165
-0.00230
(0.00192)
(0.00187) Patents
-0.00450
-0.0288
(0.0292)
(0.0292) Exit
-0.000447 -0.00579
(0.0320) (0.0213) Fail
0.00940 -0.0376*
(0.0200) (0.0224) Controls YES YES YES YES Observations 770 1,287 1,287 770 Number of companies 66 84 84 66 Log Likelihood -26.79 -76.73 -76.65 -23.54

54
Table 8 –Equal versus Unequal Founder Splits
The first two columns report descriptive statistics for the two subsamples of equal and unequal splitters. We report all variables prior to their logarithmic transformation. The third column reports the P-values of the t-tests of significant difference on variables between the two sub samples. These t-tests are based on the variables used in the regression analysis, and therefore include all logarithmic transformations. This is econometrically necessary, for these variables have distributions closer to the normal distribution.
Equal Split =1 Equal Split = 0 P-value
Company Sample
Exit 0.15 0.26 0.2076
Fail 0.37 0.40 0.8131
Active 0.48 0.34 0.2077
Number of Founders 2.35 2.71 0.0734*
Biotech 0.15 0.13 0.7883
Clean Tech 0.04 0.00 0.1933
IT & Telecom 0.11 0.08 0.6439
Software 0.28 0.39 0.2779
Hi-tech Manufacturing 0.20 0.29 0.3150
Other Industry 0.22 0.11 0.1421
Victoria 0.07 0.08 0.8079
Vancouver 0.8 0.68 0.2056
Rest of BC 0.13 0.24 0.2050
Company Quarter Sample
Ownership Change (dummy) 0.091 0.163 0.0001***
Ownership Change 0.0052 0.0082 0.0003***
Financing (dummy) 0.35 0.44 0.0007***
Founder Financing (dummy) 0.08 0.08 0.6271
External Financing (dummy) 0.33 0.43 0.0001***
Revenues ($M) 555K 2,846K 0.0000***
Patents 0.36 1.37 0.0143**
Age (# quarters) 11.13 9.86 0.0073***
Financing Round Sample
Ownership Change (dummy) 0.199 0.266 0.0816*
Ownership Change (%) 0.098 0.014 0.1359
Founder Financing (dummy) 0.19 0.16 0.3014
Founder Amount ($) 20K 64K 0.8060
External Amount ($) 562K 707K 0.9475
Valuation ($) 5,011K 10,116K 0.0152**
VC Financing (dummy) 0.037 0.069 0.0071***
Equal Founder Amounts (dummy) 0.48 0.02 0.0001***

55
Table 9: Comparing Equal and Near Equal Founder Splits
Results of panel Tobit regressions in the company quarter sample (column 1 & 2) and in the financing round sample (column 3 & 4). The dependent variable, Ownership Change, or AAOC, is the average absolute change in the relative founder ownership in the current quarter. The main independent variables are dummy variables indicating whether members on the founding team had equal ownership when the company was founded, whether members of the founding team had near equal ownership when the company was founder, whether the company received founder financing, received external financing, the logarithm of the external financing amount, and the logarithm of the company's value in the current financing quarter. The unreported controls are company age in the current quarter, number of founding members, industry dummies, region dummies, and a set of dummy variables measuring calendar time in quarters. A constant was also included but not shown. All variables are defined in Table 1. Bootstrapped standard errors are reported in the parentheses. ***, **, and * indicate significance at the 1%, 5%, and 10% levels, respectively.
VARIABLES (1) (2) (3) (4)
Equal Split -0.0442* -0.0541** -0.0370*** -0.0519** (0.0267) (0.0248) (0.00986) (0.0206) Near Equal Split 0.000583 -0.000585 0.00935 0.0185 (0.0258) (0.0284) (0.0269) (0.0254) Founder Financing
0.195*** 0.145*** 0.121***
(0.0326) (0.0191) (0.0290) External Financing
0.0601***
(0.0126)
External Financing Amount
0.0121 0.0278***
(0.0111) (0.00751)
Valuation
-0.0419**
(0.0172)
Controls YES YES YES YES Observations 1,287 1,287 480 480 Number of companies 84 84 80 80 Log Likelihood -161.8 -76.78 10.59 29.27

56
Table 10: The Role of First External Financing Rounds
Results of panel Tobit regressions in the company quarter sample (column 1 & 2) and in the company financing round sample (column 3 to 6). The dependent variable, Ownership Change, or AAOC, is the average absolute change in the relative founder ownership in the current quarter. The main independent variables are dummy variables indicating whether members on the founding team had equal ownership when the company was founded, whether the company received founder financing, external financing, first external financing round and its interaction with Equal Split, the logarithm of the external financing amount and its interaction with Equal Split, the logarithm of the company's value and its interaction with Equal Split in the current quarter. The unreported controls are company age in the current quarter, number of founding members, industry dummies, region dummies, and a set of dummy variables measuring calendar time in quarters. A constant was also included but not shown. All variables are defined in Table 1. Bootstrapped standard errors are reported in the parentheses. ***, **, and * indicate significance at the 1%, 5%, and 10% levels, respectively.
VARIABLES (1) (2) (3) (4) (5) (6)
Equal Split -0.0550** -0.0593* -0.0424*** -0.0509** -0.0571*** -0.860* (0.0223) (0.0303) (0.00174) (0.0221) (0.00814) (0.445) Founder Financing 0.191*** 0.190*** 0.143*** 0.143*** 0.122*** 0.119*** (0.0455) (0.0369) (0.00700) (0.0241) (0.0155) (0.0242) External Financing 0.0508*** 0.0509***
(0.0172) (0.0194)
First Round 0.0752*** 0.0507 0.0633 0.0371*** 0.0330 -0.0111 (0.0204) (0.0485) (0.0756) (0.00572) (0.0520) (0.0201) Equal Split * First Round
0.0453
0.0495
0.102
(0.0453)
(0.0966)
(0.0686) External Financing Amount
0.0112*** 0.0116 0.0262*** 0.0275**
(0.000121) (0.00957) (0.00459) (0.0108) Valuation
-0.0394*** -0.0597**
(0.00391) (0.0280) Equal Split * Valuation
0.0539*
(0.0307) Controls YES YES YES YES YES YES Observations 1,287 1,287 480 480 480 480 Number of companies 84 84 80 80 80 80 Log Likelihood -72.85 -72.44 14.18 14.77 30.13 42.73

57
Appendix: Relevant aspects of the British Columbia Investment Capital Program and BC securities
regulation
The fundamental premise of the 30% BC tax credit for equity investments under the BCICP is that it is
available to BC-resident individuals, as well as to corporate investors that have a permanent
establishment in BC. There are additional eligibility criteria for investors and companies as well as
certain maxima that we will review below. The BCICP allows for individuals and companies to invest into
eligible companies directly, or indirectly, through an eligible investment vehicle, such as VC fund or
angel fund. Eligible investment vehicles that have attracted funding must invest these funds within a
specific time frame.
As for additional investor criteria, first, tax credits are only available to investors that do not directly or
indirectly control the eligible small business that receives the equity investment. Also, there is a cap on
the tax credits investors can receive. Individual investors can claim up to $60,000 in refundable tax
credits annually (representing eligible investments of $200,000). The tax credits for corporate investors
have no dollar maximum, but they are non-refundable. Both individual and corporate investors can
apply unclaimed tax credits in the current tax year to the next four tax years as well.
Eligible investee companies must be BC-based companies that, together with affiliate companies, if any,
do not employ more than 100 employees and contractors. They must also pay at least 75% of the wages
and salaries to BC employees. There is also an industry requirement that companies be “substantially
engaged in a prescribed activity”. This criterion is satisfied if the prescribed activity reflects the majority
of the assets and expenses of the business. The main prescribed activity is “Research and Development
of Proprietary Technology”, which covers, for example, life sciences, information and communication
technology, alternative energy development technology, or environmental technology. However, some
other activities satisfy the prescribed activity as well, primarily “Destination Tourism” and
“Manufacturing, Processing or Export of Value-Added Goods Produced in BC”. For further details, please
see Government of British Columbia (2017).
In addition to the BCICP restrictions on companies, there are some restrictions on private companies
that arise from BC securities legislation (security legislation in Canada is handled at the provincial level,
here BC). Even though there is formally a prospectus obligation for raising equity (which could become
very costly for companies), BC regulation for privately-held companies de facto grants a large degree of
freedom for companies seeking exemption from this obligation. Besides a “private issuer exemption”
(up to 50 security holders in BC, not including employees and former employees), companies can issue
equity without a prospectus to the following investors: directors and senior officers of the issuer; or
their family members, “close” personal friends, and “close” business associates; accredited investors;
and also to “anyone, regardless of their relationship, wealth or the amount of securities purchased”
under the offering memorandum exemption. Under this exemption a risk acknowledgement form and
an offering memorandum suffice for the issuer. For further details, please see British Columbia
Securities Commission (2017).