monthly gross performance report
TRANSCRIPT

P R O P R I E T A R Y & C O N F I D E N T I A L
BOSTON RETIREMENT SYSTEM
AUGUST 31, 2021
Mike Manning, CFA, CAIA, Managing Partner Will Forde, CFA, CAIA, PrincipalKiley Fischer, Analyst
MONTHLY GROSS PERFORMANCE REPORT

2011 2012 2013 2014 2015 2016 2017 2018 2019 2020 Aug YTD
S&P 500 2.1% 16.0% 32.4% 13.7% 1.4% 12.0% 21.8% -4.4% 31.5% 18.4% 3.0% 21.6%
Russell 1000 1.5% 16.4% 33.1% 13.2% 0.9% 12.1% 21.7% -4.8% 31.4% 21.0% 2.9% 20.7%
Russell 2000 -4.2% 16.3% 38.8% 4.9% -4.4% 21.3% 14.6% -11.0% 25.5% 20.0% 2.2% 15.8%
Russell 2500 -2.5% 17.9% 36.8% 7.1% -2.9% 17.6% 16.8% -10.0% 27.8% 20.0% 2.3% 17.5%
MSCI EAFE -12.1% 17.3% 22.8% -4.9% -0.8% 1.0% 25.0% -13.8% 22.0% 7.8% 1.8% 11.6%
MSCI EM -18.4% 18.2% -2.6% -2.2% -14.9% 11.2% 37.3% -14.6% 18.4% 18.3% 2.6% 2.8%
MSCI ACWI -7.3% 16.1% 22.8% 4.2% -2.4% 7.9% 24.0% -9.4% 26.6% 16.3% 2.5% 15.9%
Private Equity 9.5% 12.6% 22.3% 14.6% 10.4% 10.3% 21.0% 13.1% 17.2% 38.2% - 9.7%
BBG TIPS 13.6% 7.0% -8.6% 3.6% -1.4% 4.7% 3.0% -1.3% 8.4% 11.0% -0.2% 4.3%
BBG Municipal 10.7% 6.8% -2.6% 9.1% 3.3% 0.2% 5.4% 1.3% 7.5% 5.2% -0.4% 1.5%
BBG Muni High Yield 9.2% 18.1% -5.5% 13.8% 1.8% 3.0% 9.7% 4.8% 10.7% 4.9% -0.2% 7.2%
BBG US Corporate HY 5.0% 15.8% 7.4% 2.5% -4.5% 17.1% 7.5% -2.1% 14.3% 7.1% 0.5% 4.5%
BBG US Agg Bond 7.8% 4.2% -2.0% 6.0% 0.5% 2.6% 3.5% 0.0% 8.7% 7.5% -0.2% -0.7%
BBG Global Agg 5.6% 4.3% -2.6% 0.6% -3.2% 2.1% 7.4% -1.2% 6.8% 9.2% -0.4% -2.3%
BBG Long Treasuries 29.9% 3.6% -12.7% 25.1% -1.2% 1.3% 8.5% -1.8% 14.8% 17.7% -0.2% -4.8%
BBG US Long Credit 17.1% 12.7% -6.6% 16.4% -4.6% 10.2% 12.2% -6.8% 23.4% 13.3% -0.4% -0.7%
BBG US STRIPS 20+ Yr 58.5% 3.0% -21.0% 46.4% -3.7% 1.4% 13.7% -4.1% 20.9% 24.0% -0.2% -6.6%
JPM GBI-EM Global Div -1.8% 16.8% -9.0% -5.7% -14.9% 9.9% 15.2% -6.2% 13.5% 2.7% 0.8% -3.0%
JPM EMBI Glob Div 7.3% 17.4% -5.3% 7.4% 1.2% 10.2% 10.3% -4.3% 15.0% 5.3% 1.0% 0.7%
CS Hedge Fund 0.5% 5.9% 10.0% 5.4% 0.2% -0.6% 7.2% -1.1% 6.3% 4.1% 0.3% 10.3%
BBG Commodity -13.3% -1.1% -9.5% -17.0% -24.7% 11.8% 1.7% -11.2% 7.7% -3.1% -0.3% 23.0%
Alerian Midstream - - - 16.4% -37.3% 33.8% -2.4% -13.3% 24.0% -23.4% -1.6% 33.4%
FTSE NAREIT Equity REITs 8.3% 18.1% 2.5% 30.1% 3.2% 8.5% 5.2% -4.6% 26.0% -8.0% 1.8% 30.2%
CALENDAR YEAR INDEX PERFORMANCE
*Private Equity return represents calendar year pooled IRR and is subject to a one quarter lagSource: FactSet, Barclays, Thomson One
Market Value($)
% ofPortfolio Policy % 1 Mo
(%)3 Mo
(%)YTD(%)
1 Yr(%)
3 Yrs(%)
5 Yrs(%)
10 Yrs(%)
Inception(%)
InceptionDate
_
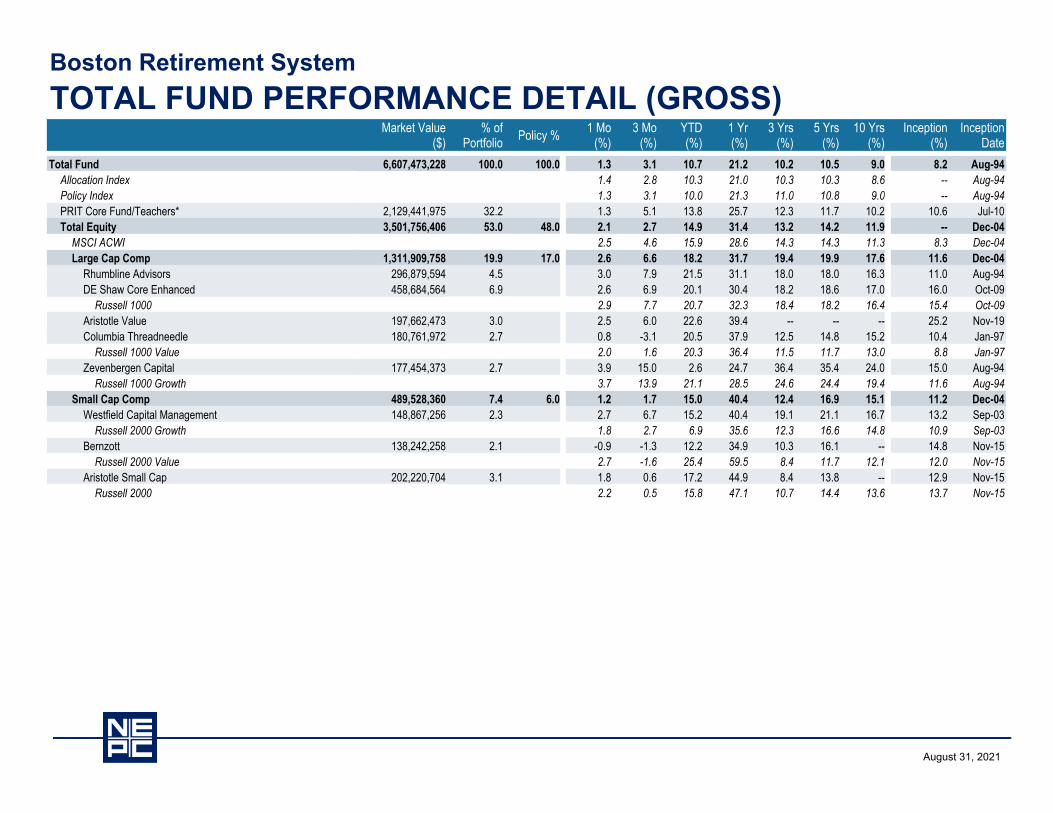
Total Fund 6,607,473,228 100.0 100.0 1.3 3.1 10.7 21.2 10.2 10.5 9.0 8.2 Aug-94Allocation Index 1.4 2.8 10.3 21.0 10.3 10.3 8.6 -- Aug-94Policy Index 1.3 3.1 10.0 21.3 11.0 10.8 9.0 -- Aug-94PRIT Core Fund/Teachers* 2,129,441,975 32.2 1.3 5.1 13.8 25.7 12.3 11.7 10.2 10.6 Jul-10Total Equity 3,501,756,406 53.0 48.0 2.1 2.7 14.9 31.4 13.2 14.2 11.9 -- Dec-04
MSCI ACWI 2.5 4.6 15.9 28.6 14.3 14.3 11.3 8.3 Dec-04Large Cap Comp 1,311,909,758 19.9 17.0 2.6 6.6 18.2 31.7 19.4 19.9 17.6 11.6 Dec-04
Rhumbline Advisors 296,879,594 4.5 3.0 7.9 21.5 31.1 18.0 18.0 16.3 11.0 Aug-94DE Shaw Core Enhanced 458,684,564 6.9 2.6 6.9 20.1 30.4 18.2 18.6 17.0 16.0 Oct-09
Russell 1000 2.9 7.7 20.7 32.3 18.4 18.2 16.4 15.4 Oct-09Aristotle Value 197,662,473 3.0 2.5 6.0 22.6 39.4 -- -- -- 25.2 Nov-19Columbia Threadneedle 180,761,972 2.7 0.8 -3.1 20.5 37.9 12.5 14.8 15.2 10.4 Jan-97
Russell 1000 Value 2.0 1.6 20.3 36.4 11.5 11.7 13.0 8.8 Jan-97Zevenbergen Capital 177,454,373 2.7 3.9 15.0 2.6 24.7 36.4 35.4 24.0 15.0 Aug-94
Russell 1000 Growth 3.7 13.9 21.1 28.5 24.6 24.4 19.4 11.6 Aug-94Small Cap Comp 489,528,360 7.4 6.0 1.2 1.7 15.0 40.4 12.4 16.9 15.1 11.2 Dec-04
Westfield Capital Management 148,867,256 2.3 2.7 6.7 15.2 40.4 19.1 21.1 16.7 13.2 Sep-03Russell 2000 Growth 1.8 2.7 6.9 35.6 12.3 16.6 14.8 10.9 Sep-03
Bernzott 138,242,258 2.1 -0.9 -1.3 12.2 34.9 10.3 16.1 -- 14.8 Nov-15Russell 2000 Value 2.7 -1.6 25.4 59.5 8.4 11.7 12.1 12.0 Nov-15
Aristotle Small Cap 202,220,704 3.1 1.8 0.6 17.2 44.9 8.4 13.8 -- 12.9 Nov-15Russell 2000 2.2 0.5 15.8 47.1 10.7 14.4 13.6 13.7 Nov-15
Note: Returns are gross of manager fees except for hedge funds and private equity which are net of fees.
Boston Retirement SystemTOTAL FUND PERFORMANCE DETAIL (GROSS)
August 31, 2021

Market Value($)
% ofPortfolio Policy % 1 Mo
(%)3 Mo
(%)YTD(%)
1 Yr(%)
3 Yrs(%)
5 Yrs(%)
10 Yrs(%)
Inception(%)
InceptionDate
_
Total Non-US Equity 1,700,318,288 25.7 25.0 2.0 0.2 12.5 28.7 8.6 9.4 6.5 6.6 Aug-94International Equity 1,154,195,055 17.5 17.0 2.1 1.4 13.6 28.6 8.0 9.3 7.2 6.8 Dec-10
Todd 335,870,452 5.1 1.9 -2.6 11.4 29.9 10.1 10.6 -- 9.8 Apr-16MSCI ACWI ex USA 1.9 -0.4 9.4 24.9 9.4 9.9 6.6 10.1 Apr-16
Panagora Asset Management 339,346,377 5.1 1.8 1.2 14.1 29.8 8.1 9.2 8.4 6.4 Aug-94Walter Scott International Equity 333,446,059 5.0 2.7 5.9 13.0 -- -- -- -- 25.5 Oct-20
MSCI EAFE 1.8 1.4 11.6 26.1 9.0 9.7 7.3 29.5 Oct-20Segall Bryant Hamill 145,302,266 2.2 1.8 1.2 18.4 35.1 3.9 -- -- 2.0 Nov-17
MSCI EAFE Small Cap 2.9 2.9 14.1 32.8 10.1 11.8 9.9 8.6 Nov-17Emerging Markets 546,123,232 8.3 8.0 1.8 -2.2 10.2 29.1 9.9 9.5 5.1 4.8 Dec-10
Columbia Emerging Markets Equity 123,659,422 1.9 -- -- -- -- -- -- -- -- Aug-21Polunin 156,375,564 2.4 3.4 -0.3 12.2 40.1 13.6 13.7 -- 10.0 Oct-13SSgA Emerging Markets 118,034,911 1.8 2.3 -1.4 11.4 27.8 6.9 9.0 -- 4.3 Oct-13
MSCI Emerging Markets 2.6 -4.1 2.8 21.1 9.9 10.4 4.9 6.1 Oct-13Lazard 148,053,336 2.2 -0.3 -0.5 19.0 33.3 9.2 6.6 -- 4.9 Oct-13
MSCI Emerging Markets Small Cap 1.2 2.2 19.6 43.7 12.6 10.5 5.6 6.8 Oct-13Total Fixed Income 1,664,726,687 25.2 26.0
Core Fixed Income 1,052,590,637 15.9 16.0 0.1 1.6 1.5 3.7 6.2 4.3 4.0 4.9 Dec-04Wells Asset Management 349,445,812 5.3 -0.1 1.9 -0.4 0.7 6.2 3.7 4.0 5.2 May-05BlackRock SIO 370,048,859 5.6 0.5 0.7 2.0 6.4 6.0 5.1 -- 4.4 Aug-15
Bloomberg US Aggregate TR -0.2 1.6 -0.7 -0.1 5.4 3.1 3.2 3.5 Aug-15IR&M 333,095,965 5.0 -0.1 2.2 2.9 4.1 6.5 4.0 -- 4.5 Jul-15
IR&M Custom Benchmark -0.2 2.0 2.4 3.4 6.0 3.4 3.3 3.8 Jul-15
Note: Returns are gross of manager fees except for hedge funds and private equity which are net of fees.
Boston Retirement SystemTOTAL FUND PERFORMANCE DETAIL (GROSS)
- IR&M Custom Benchmark reflects Bloomberg Agg since inception through 04/30/2017, as of 05/01/2017 forward it reflects 40% Bloomberg Agg/60% Bloomberg US TIPS.
Boston Retirement SystemTOTAL FUND PERFORMANCE DETAIL (GROSS)
August 31, 2021
Note: Returns are gross of manager fees except for hedge funds and private equity which are net of fees.
Market Value($)
% ofPortfolio Policy % 1 Mo
(%)3 Mo
(%)YTD(%)
1 Yr(%)
3 Yrs(%)
5 Yrs(%)
10 Yrs(%)
Inception(%)
InceptionDate
_
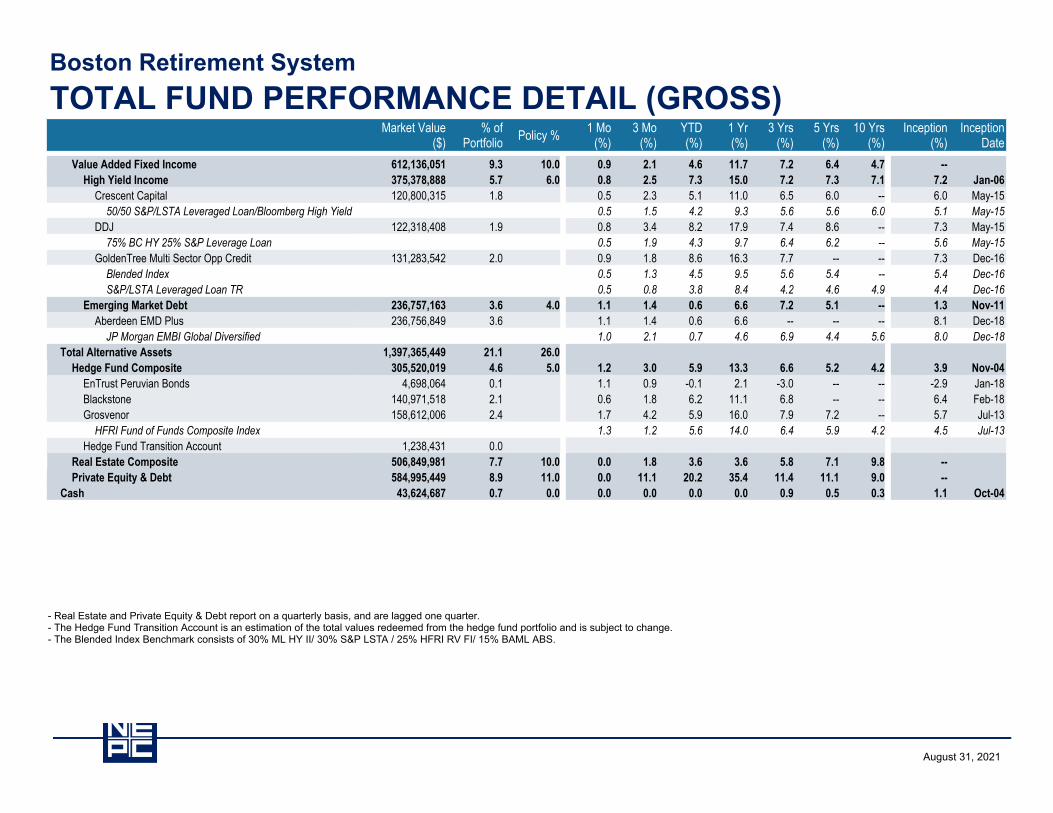
Value Added Fixed Income 612,136,051 9.3 10.0 0.9 2.1 4.6 11.7 7.2 6.4 4.7 --High Yield Income 375,378,888 5.7 6.0 0.8 2.5 7.3 15.0 7.2 7.3 7.1 7.2 Jan-06
Crescent Capital 120,800,315 1.8 0.5 2.3 5.1 11.0 6.5 6.0 -- 6.0 May-1550/50 S&P/LSTA Leveraged Loan/Bloomberg High Yield 0.5 1.5 4.2 9.3 5.6 5.6 6.0 5.1 May-15
DDJ 122,318,408 1.9 0.8 3.4 8.2 17.9 7.4 8.6 -- 7.3 May-1575% BC HY 25% S&P Leverage Loan 0.5 1.9 4.3 9.7 6.4 6.2 -- 5.6 May-15
GoldenTree Multi Sector Opp Credit 131,283,542 2.0 0.9 1.8 8.6 16.3 7.7 -- -- 7.3 Dec-16Blended Index 0.5 1.3 4.5 9.5 5.6 5.4 -- 5.4 Dec-16S&P/LSTA Leveraged Loan TR 0.5 0.8 3.8 8.4 4.2 4.6 4.9 4.4 Dec-16
Emerging Market Debt 236,757,163 3.6 4.0 1.1 1.4 0.6 6.6 7.2 5.1 -- 1.3 Nov-11Aberdeen EMD Plus 236,756,849 3.6 1.1 1.4 0.6 6.6 -- -- -- 8.1 Dec-18
JP Morgan EMBI Global Diversified 1.0 2.1 0.7 4.6 6.9 4.4 5.6 8.0 Dec-18Total Alternative Assets 1,397,365,449 21.1 26.0
Hedge Fund Composite 305,520,019 4.6 5.0 1.2 3.0 5.9 13.3 6.6 5.2 4.2 3.9 Nov-04EnTrust Peruvian Bonds 4,698,064 0.1 1.1 0.9 -0.1 2.1 -3.0 -- -- -2.9 Jan-18Blackstone 140,971,518 2.1 0.6 1.8 6.2 11.1 6.8 -- -- 6.4 Feb-18Grosvenor 158,612,006 2.4 1.7 4.2 5.9 16.0 7.9 7.2 -- 5.7 Jul-13
HFRI Fund of Funds Composite Index 1.3 1.2 5.6 14.0 6.4 5.9 4.2 4.5 Jul-13Hedge Fund Transition Account 1,238,431 0.0
Real Estate Composite 506,849,981 7.7 10.0 0.0 1.8 3.6 3.6 5.8 7.1 9.8 --Private Equity & Debt 584,995,449 8.9 11.0 0.0 11.1 20.2 35.4 11.4 11.1 9.0 --
Cash 43,624,687 0.7 0.0 0.0 0.0 0.0 0.0 0.9 0.5 0.3 1.1 Oct-04XXXXX
Boston Retirement SystemTOTAL FUND PERFORMANCE DETAIL (GROSS)
- Real Estate and Private Equity & Debt report on a quarterly basis, and are lagged one quarter.- The Hedge Fund Transition Account is an estimation of the total values redeemed from the hedge fund portfolio and is subject to change. - The Blended Index Benchmark consists of 30% ML HY II/ 30% S&P LSTA / 25% HFRI RV FI/ 15% BAML ABS.
August 31, 2021

Boston Retirement SystemTOTAL FUND PERFORMANCE DETAIL
August 31, 2021

Past performance is no guarantee of future results.
Returns for pooled funds, e.g. mutual funds and collective investment trusts, are collected from third parties;they are not generally calculated by NEPC. Returns for separate accounts, with some exceptions, are calculatedby NEPC. Returns are reported net of manager fees unless otherwise noted.
A “since inception” return, if reported, begins with the first full month after funding, although actual inceptiondates (e.g. the middle of a month) and the timing of cash flows are taken into account in Composite returncalculations.
NEPC’s preferred data source is the plan’s custodian bank or record-keeper. If data cannot be obtained from oneof the preferred data sources, data provided by investment managers may be used. Information on marketindices and security characteristics is received from additional providers. While NEPC has exercised reasonableprofessional care in preparing this report, we cannot guarantee the accuracy of all source information containedwithin. In addition, some index returns displayed in this report or used in calculation of a policy index,allocation index or other custom benchmark may be preliminary and subject to change.
All investments carry some level of risk. Diversification and other asset allocation techniques are notguaranteed to ensure profit or protect against losses.
The opinions presented herein represent the good faith views of NEPC as of the date of this presentation andare subject to change at any time. Neither fund performance nor universe rankings contained in this reportshould be considered a recommendation by NEPC.
This report may contain confidential or proprietary information and may not be copied or redistributed to anyparty not legally entitled to receive it.
Source of private fund performance benchmark data: Cambridge Associates, via Refinitiv
DISCLAIMERS & DISCLOSURES

P R O P R I E T A R Y & C O N F I D E N T I A L