marketing strategies for the social … consulting project report (winter 2012) marketing strategies...
TRANSCRIPT

1
CONSULTING PROJECT REPORT (WINTER 2012)
MARKETING STRATEGIES FOR
“THE SOCIAL SECURITY AND TAX NUMBER SYSTEM”
IN JAPAN
February 11, 2013
Prepared by
HYUN JUNG LEE (SIN: PM11E002)
Candidate of Master of Public Policy
School of International and Public Policy
Hitotsubashi University
Prepared for
YOKO KOBAYASHI
Senior Consultant
Social Innovation Consulting Sector
NTT DATA INSTITUTE OF MANAGEMENT CONSULTING, Inc.
Keywords
the Social Security and Tax Number System in Japan, My Number System, strategic framework for
policy marketing, Cash Receipt System and e-Tax Invoice System in South Korea

2
NOTE
This consulting project report is presented to the faculty of School of
International and Public Policy, Hitotsubashi University in fulfillment of the
requirements for the degree of Master of Public Policy. And this document and its
contents are intended to be presented to Yoko Kobayashi, Senior Consultant of NTT
DATA INSTITUTE OF MANAGEMENT CONSULTING, Inc.
The material presented in this report is based on published data, references,
and personal interviews coupled with my interpretation of the facts. I believe that the
basic information and recommendations presented in this document provide a basis for
designing policy marketing strategies, but no warranty as to completeness or accuracy
is implied. And the views expressed in this report are mine and do not necessarily
reflect those of NTT DATA INSTITUTE OF MANAGEMENT CONSULTING, Inc.
3
TABLE OF CONTENTS
EXECUTIVE SUMMARY ............................................................................................................................................ 4
1. Introduction ............................................................................................................................................................. 5
1.1 Objective and Scope of the Project ............................................................................................... 6
1.2 Problem Statement and Hypothesis ............................................................................................ 6
2. Situation Analysis .................................................................................................................................................. 9
2.1 Survey results ....................................................................................................................................... 9
2.2 Data for Counter Visitors at a City Hall (Machida, Tokyo) .............................................. 11
2.3 Online Service Use Rates for Administrative Procedures Related to Social Security
and Tax ......................................................................................................................................... 14
2.4 Attitude of the Japanese public towards information sharing system ....................... 17
3. Reference Data: Findings from Existing Policies ................................................................................... 19
3.1 “Cash Receipt System” in South Korea .................................................................................... 20
3.2 “e-Tax Invoice System” in South Korea ................................................................................... 23
3.3 “COOL BIZ” in Japan ......................................................................................................................... 25
3.4 “Plastic Bag Reduction Campaign” in Japan .......................................................................... 27
4. Introducing a Strategic Framework for Policy Marketing ................................................................. 31
4.1 Analysis of the Findings in 3 Using the Strategic Framework ....................................... 35
5. Policy Marketing Analysis and Strategy Planning for the Social Security and Tax Number
System ............................................................................................................................................................. 39
5.1 SWOT Analysis ................................................................................................................................... 39
5.2 Strategic Model .................................................................................................................................. 42
5.3 Recommendations ........................................................................................................................... 45
5.3.1 Strategy Mix and Planning ........................................................................................................ 47
Eliminating/reducing switching costs ....................................................................... 47
Targeting (achieving critical mass) ............................................................................ 50
Increasing benefits ............................................................................................................ 53
Increasing acceptance level (branding) .................................................................... 55
6. Concluding Thoughts ........................................................................................................................................ 57
REFERENCES ............................................................................................................................................................. 58
APPENDIX - Hofstede Dimensions of National Culture ........................................................................... 61

4
EXECUTIVE SUMMARY
The Social Security and Tax Number System (also known as My Number System) is
planned to be introduced by the Japanese government in 2015, and this project poses a
question, “Will the policy succeed in acquiring enough number of participants?”. With
focus on the factors that impacts individual participation behavior, I have been engaged
to assess the feasibility of the policy in terms of the current environment factors,
develop a strategic framework for policy marketing and propose a marketing plan for
successful implementation of STN.
Diagnosis
There is a high chance that the demand for My Portal service may be low due to the
large start-up costs faced by individual participant. And there is no incentive system
that can motivate people to conduct the desired behaviors. High political risk involved
with the policy and low awareness level also appear to be the major challenge.
Strategic Framework for Policy Marketing
According to the strategic framework I have developed for policy marketing, the
following strategies are found to be valid: switching cost strategy, targeting strategy,
and benefit/brand strategy (listed in the order of priority). The framework is found to
be consistent with the strategies of other reference policies that succeeded in marketing.
Recommendations
The recommendations that follow show a partial list of the recommendations presented
in 5.3 of this report and they are best understood in the context of the full report.
1. Establish more methods for IC card registration 2. Provide one IC card reader per household at free of charge upon request 3. Provide electronic ID at no charge for a limited period of time (first few years) 4. Make it a standard that the first IC card comes with the electronic ID 5. Introduce short term monetary compensation systems such as tax deduction,
health care service subsidy, fee waivers for administrative procedures, and lottery system
6. Allow free access or provide preferential status to programs and activities hosted by public institutions for card holders
7. Offer a variety of printing and payment options for My Portal services 8. Attach a positive image to the policy (i.e. close, quick and handy, smart, safe)

5
1. Introduction
In 2011, the Japanese government proposed a plan to implement “the Social Security
and Tax Number System” (also known as “My Number System”, STN hereafter), as a part
of the plans for “the Comprehensive Reform of Social Security and Tax”. STN is
information sharing infrastructure designed to promote efficiency of administration of
government, and it is intended to keep track of individual’s income and provide social
security and impose tax based on the accurate income information. If the system is
implemented, each individual and corporation will be assigned a number to use when
carrying out administrative procedures for matters related to social security, tax, and
disaster mitigations. And along with the number assignment, the government will
provide an integrated online platform called “My Portal”, through which the citizens in
Japan can check their information and carry out administrative procedures that are
related to the aforementioned areas (Cabinet Secretariat of Japan 2011).
According to the implementation plan, the government will assign the number
to each individual and corporation in June 2014 and introduce the system in January
2015. Meanwhile, the result of the survey conducted by Cabinet Secretariat of Japan in
December 2011 shows that the people who responded “I am aware of what the policy is
about” are as few as 16.7%. And it is found that the current policy scheme does not
provide any incentive system that can motivate people to conduct the behaviors
requested by the policy (Cabinet Secretariat of Japan 2011).
Based on these facts, this project, which is conducted under the guidance of
Yoko Kobayashi, Senior Consultant of NTT DATA INSTITUTE OF MANAGEMENT
CONSULTING, Inc., begins with posing a question, “Will STN be implemented as planned
by acquiring enough number of participants?” And it further assesses the feasibility of
the policy in terms of the environment factors, develops a strategic framework for
policy marketing and proposes a marketing plan for successful implementation of STN.
The remaining chapters of this report are organized as follows. Chapter 1
explains the objective and scope of the project and presents the problem statement and
hypothesis. Chapter 2 presents the results of the situation analysis, and Chapter 3
brings forth the cases of existing policies in South Korea and Japan for reference.
Chapter 4 describes the strategic framework for policy marketing, which is developed

6
based on the findings presented in Chapter 2 and 3. And finally, Chapter 5 proposes
marketing recommendations for STN and the last chapter concludes the report.
1.1 Objective and Scope of the Project
The objective of this project is “to develop methods for promoting widespread
participation in STN”. As shown in Table 1, policy promotions can be categorized into
three components: informing type, agenda-setting type, and marketing type, and this
project will particularly involve the “marketing type” of policy promotions. With
reference to this categorical definition, I would like to clarify the meaning of the
objective by restating it as “to produce marketing strategies for STN”.
Table 1: Categories of policy promotions (based on Kitamura (2005) Figure 1.)
Category Detail Examples (in Japan)
Informing Provide information Reform of Nursing Insurance System Amendment of Antitrust Law
Agenda-setting Ask questions on
current issues Discussion on fair anti-takeover measures Discussion on Government-owned property controls
Marketing Request participation Career support for women Fire prevention movement for the fall Influenza prevention measures for the winter
Note: Contents have been edited by author
This project is performed under the assumption that the policy will be
implemented according to the established schedule. Further, this project has a major
focus on the strategies to promote participation in STN and it does not intend to make
changes towards the core structure of the policy.
1.2 Problem Statement and Hypothesis
To clarify the problems associated with the current situation, let me begin with
brainstorming a hypothetical framework for policy marketing strategies:

7
Figure 1: Hypothetical framework for policy marketing strategies
The framework presented in Figure 1 signifies that raising the awareness level is not a
sufficient condition but a necessary condition for raising the participation level
(E/(A+B)). If maximum potential of C or E is low, we cannot expect to see the
participation rate grow much even when the level of awareness level reaches 100%.
With this idea in mind, I have taken observations on the current situation to
derive reasonable expectations towards the awareness level and the practice level. The
problems are identified as follows:
Firstly, the level of awareness is found to be not high at the current point.
According to the result of the survey conducted by Cabinet Secretariat of Japan in
December 2011 (which will be introduced in more detail in 2.1), the people who
responded “I am aware of what the policy is about” are 16.7% of the sample
respondents (2011). Considering the fact that the Japanese government plans to
announce the number to each individual in June 2014 and implement the system in
January 2015, making efforts to raise the awareness level to sufficiently high level
within a designated time frame (before the introduction) is deemed critical.
Next, it is expected that the practice level for STN will not reach high with the
current scheme. The directives requested to be performed by STN consist of the
following behaviors:
8
Behavior 1: When carrying out administrative procedures related to social security, tax or disaster mitigations at public or private institutions, input the assigned number on the paperwork.
Behavior 2: Visit local government office and sign up for IC card (a fee is incurred). Carry the card at all time and present it for ID verification when requested by public or private institutions.
Behaviors 3: Visit local government office, sign up for electronic ID (a fee is incurred), and have it issued on IC card.
Behavior 4: Purchase an IC card reader, install in on personal computer, and perform all the preliminary tasks required for logging into My Portal using the IC card.
Behavior 5: Use My Portal for carrying out administrative procedures related to social security, tax or disaster mitigations.
Regarding the list above, the number attached to each behavior type not only signifies
the degree of active participation but also helps us see that a behavior can be conducted
only after having conducted the lower-order behavior(s). Here, we see the benefits that
can be provided by STN (My Portal service) are actually delivered after conducting the
behaviors up to the 5th order. Meanwhile, monetary and nonmonetary cost factors are
associated with conducting Behavior 2, 3 and 4, while no benefit from participation is
expected. As for conducting Behavior 1, it may not involve much cost for participants
but it does not provide any benefit either. These facts suggest that unless there are
sufficiently many people whose demands for My Portal service outweigh the
preliminary costs it accompanies, there is a high chance that the participation rate will
not grow high because there does not seem to be any systems that can motivate people
to conduct the desired behaviors.
With these two statements as bases, the approach and the direction of this
project have been established as follows: as for the low awareness level, my idea is that
it will grow proportionally to the amount of inputs allocated to the promotional
activities. And having the promotional activities outsourced by professional services of
advertising firms can in fact be more efficient than taking the lead role itself. And what I
believe we need to be focusing on is to identify the factors that will elicit the
participation behaviors and develop specific marketing strategies for STN based on
those factors. This topic has been the major interest of this work and the hypothesis
established for this project is:

9
Without a valid and well-designed system exerting positive impacts on the practice level, the participation rate of the Social Security and Tax Number System will be at a low level.
The following chapters of this report will assess the above hypothesis by referring to
the current situations and other reference cases and develop a more detailed policy
marketing framework for STN based on the assessment results.
2. Situation Analysis
This section mainly focuses on analyzing the environmental factors that need to be
taken into account when producing the marketing plans for STN. The analysis has been
performed on the following subjects:
Survey results
Data for Counter Visitors at a City Hall (Machida, Tokyo)
Online Service Use Rates for Administrative Procedures Related to Social
Security and Tax
Attitude of the Japanese public towards information sharing system
2.1 Survey results
Three different pieces of surveys1 have been taken as reference to learn about (i) the
level of awareness and (ii) the level of acceptance of STN among the citizens.
Regarding the level of acceptance, the survey results show that, as of November
2011, about 16.7% of the respondents declare that they are well aware of the policy,
and the half of the rest stated they heard of the name (Cabinet Secretariat of Japan
2011). As we look into the characteristics of the respondents, men tend to demonstrate
higher awareness level than women, and for men, in particular, those who belong to a
higher age group seem to demonstrate higher level of awareness. For women, there
does not seem to be a particular correlation between the age and the level of awareness.
1 Cabinet Secretariat of Japan (Internet survey, March 2011, n=3000)
Cabinet Secretariat of Japan (Interview survey, November 2011, n=1890 out of 3000) Toyo Keizai (Internet survey, June 2012, n=1000)

10
Figure 2: Survey results about the level of awareness towards STN
(based on Cabinet Secretariat of Japan (2011))
As for the level of acceptance, those who claimed to agree are found to be 57.3%
(“agree”: 18.5%, “somewhat agree”: 38.8%). Regarding the specific tendencies found in
the differences in characteristics, first of all, men tend to show higher level of
acceptance than women, and for them the positive correlation between the age and the
level of acceptance is apparent as it was the case for the level of awareness. And it is
found that the majority (69.2%) are not demonstrating a strong position towards the
policy, and such tendency gets stronger for women (85.5%) and those in the younger
age group.
Figure 3: Survey results about the level of acceptance towards STN
(based on Cabinet Secretariat of Japan (2011))
Those who claimed that they disagree (27.3%) give reasons such as “concerns about
privacy (i.e. income, address, behavior) violations” (55.8%), “concerns about damages
caused by illegal use of personal information” (40.9%), and “concerns about monitoring
from government” (34.5%), and the level of concern for them is found to be about 20%
higher than the average level (Cabinet Secretariat of Japan 2011).
It is found interesting that those with higher level of awareness tend to
demonstrate higher level of acceptance, but at the same time, the level of awareness
10.5
23.3
16.7
39.0
44.8
41.8
50.6
31.8
41.5
0% 20% 40% 60% 80% 100%
Female (n=973)
Male (n=917)
Total (n=1890)
Aware Heard of the name Not aware
13.4
24
18.5
40.9
36.6
38.8
19.3
11.1
15.3
14.4
15.9
15.1
12
12.3
12.2
0% 20% 40% 60% 80% 100%
Female (n=518)
Male (n=482)
Total (n=1000)
Agree Somewhat agree Don’t know Somewhat disagree Disagree

11
seems to be correlated to the level of concern as well. Such results may not be sufficient
to prove that there is a causal relationship between the awareness level and the
acceptance level or between the awareness level and the level or concern, but I believe
it can be used as a resource for further empirical studies related to this topic.
2.2 Data for Counter Visitors at a City Hall (Machida, Tokyo)
STN is like an access key for individuals to interact with the government, and we can
expect that it would have much to do with the paperwork and the procedures required
to register for social security services and pay taxes. Therefore, in order to come up
with a good marketing plan, understanding the characteristics of the people who are
closely involved with the procedures is deemed essential. Since the availability of
macro-level information about the visitors who carry out administrative procedures at
counters of government offices is limited, let us take a look into a micro-level data to
draw some information at our best.
The data I have referred to is the results of the survey conducted on the visitors
of the City Hall of Machida, Tokyo as of 2010 (Table 2)2. According to the demographic
information found in the results, it is conspicuous that there are more women (53.5%)
than men (39.7%) among the entire visitors, and although the degree of such tendency
varies across divisions, it is found that women outnumber men in all divisions. Further,
it is worth noting that the tendency seems stronger in intensity at welfare related
divisions, while it tends to be weak in divisions such as Civil Affairs and Tax Submission.
As for the distributions according to age, visitors in 30s or 40s are taking the largest
share (70-80%) at the divisions related to childcare assistance, and the visitors of the
other general welfare related divisions are mostly in the age groups of 60s, 70s or above
(70-80%) (Machida City 2010).
From this data, we can make some general inferences, one of which would be
that more women than men are involved with carrying out the administrative
procedures. The reasons for such results are not examined, but the traditional role play
in a family in Japan may provide one plausible idea: men work full time and women,
who have relatively more free time than men, are charged with carrying out
administrative procedures for household.
2 The survey was conducted September 9 -18 (for 7 days).

12
Plus, the results are found consistent with the general expectations that people
in the senior ages are the major beneficiaries of the welfare services.
Hence, we conclude at this point that the reference data gives support to the
idea that women and seniors may be the groups that would be not only mostly likely to
become involved with STN, but also exhibit high willingness to participate in the policy
by complying with the suggested directions.

13
Table 2: Visitor counts for the City Hall of Machida, Tokyo, September 9-18, 2010 (based on Machida City (2010))
Counter of division
Visitor counts
Sex (%) Age group (%)
Male Female No
response 10s 20s 30s 40s 50s 60s
70 or above
No response
Total 4388 39.7 53.5 6.9 1.3 10.3 17.6 15.7 13.9 18.2 21.2 1.9
Civil Affairs 735 46.6 49.7 3.9 2.9 15.4 19.6 14.7 14.6 17.3 15.2 0.4
Petitions 53 34 64.2 1.8 - 3.8 15.1 17 13.2 32.1 18.9 -
Senior Welfare 87 34.5 60.9 4.6 - - 8 5.7 4.6 20.7 59.8 1.1
General Welfare
14 7.1 92.9 - - - - 14.3 7.1 35.7 42.9 -
Life Support 78 46.2 47.4 6.4 - 3.8 19.2 20.5 12.8 17.9 24.4 1.3
Welfare for the Disabled
147 36.7 55.1 8.2 - 3.4 13.6 22.4 15.6 19 25.2 0.7
Childcare Affairs
116 23.3 76.7 - - 13.8 51.7 26.7 1.7 4.3 1.7 -
Childcare Assistance
39 15.4 82.1 2.6 - 10.3 51.3 38.5 - - - -
Insurance and Annuity
423 43.3 49.6 7.1 0.2 15.8 15.8 13 13 18.4 21.3 2.4
Civil Tax 261 38.3 57.1 4.6 1.5 10 16.1 10 13.4 16.1 33 -
Asset Tax 49 46.9 49 4.1 - 14.3 8.2 18.4 24.5 10.2 24.5 -
Tax Submission 29 48.3 48.3 3.4 - 10.3 10.3 37.9 24.1 6.9 10.3 -
Machida Station Branch
387 30.7 56.1 13.2 2.1 9 12.4 13.4 14.7 13.4 31.3 3.6
14
2.3 Online Service Use Rates for Administrative Procedures Related to Social Security
and Tax
The benefits that will be delivered by STN, in large part, come from the online service
provided by My Portal. And in fact, the online service counters for the social security
services and the tax payments are currently available in the forms of “e-Gov3” and “e-
Tax4”; therefore, disregarding the fact that My Portal provides an integrated online
interface for carrying out procedures in both of the areas and requires the new IC card
for the access, the core services that will be offered by STN are already in service for the
citizens.
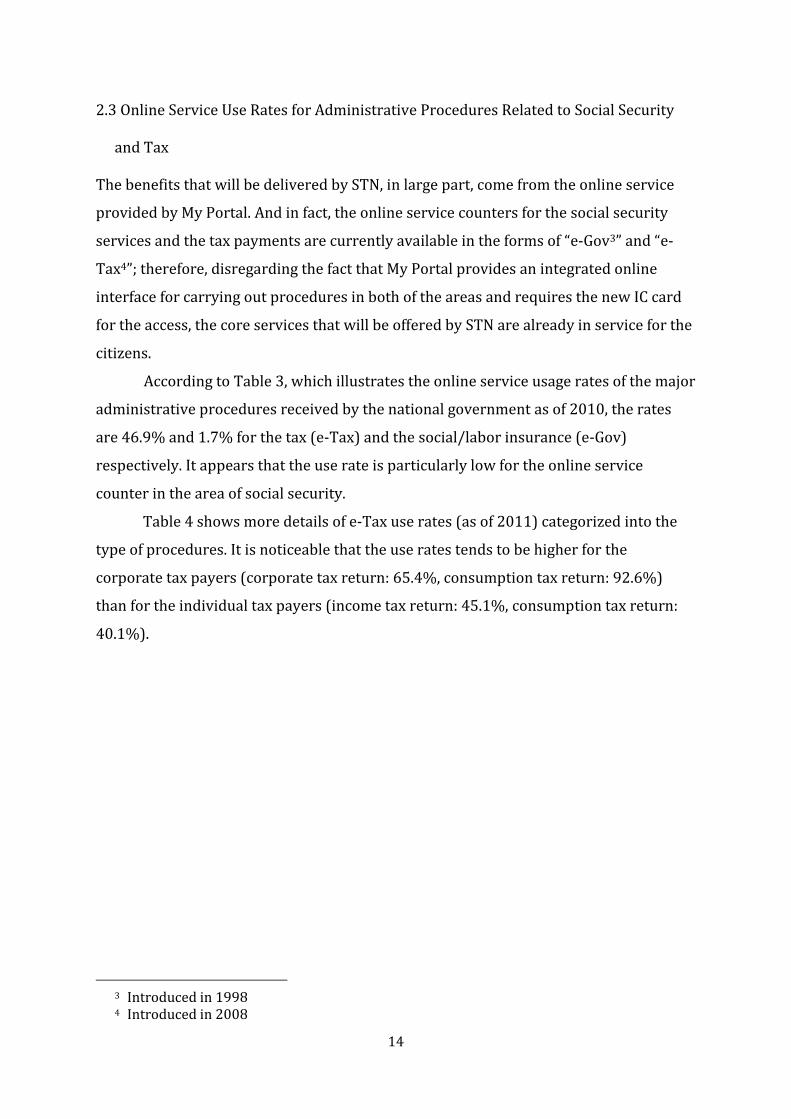
According to Table 3, which illustrates the online service usage rates of the major
administrative procedures received by the national government as of 2010, the rates
are 46.9% and 1.7% for the tax (e-Tax) and the social/labor insurance (e-Gov)
respectively. It appears that the use rate is particularly low for the online service
counter in the area of social security.
Table 4 shows more details of e-Tax use rates (as of 2011) categorized into the
type of procedures. It is noticeable that the use rates tends to be higher for the
corporate tax payers (corporate tax return: 65.4%, consumption tax return: 92.6%)
than for the individual tax payers (income tax return: 45.1%, consumption tax return:
40.1%).
3 Introduced in 1998 4 Introduced in 2008

15
Table 3: 71 major administrative procedures governed by the national government
and the fraction of procedures performed online (based on Ministry of Internal Affairs and Communications of Japan (2010))
Areas Registrations National
tax Social insurance/ labor insurance
Imports and exports/ port arrivals
Industrial property rights/patents
Vehicle registrations
Others
Number of procedures
5 15 21 20 1 1 8
Fraction of procedures performed online
50% 46.9% 1.7% 94.9% 93.6% 24.9% N/A
Table 4: e-Tax use rate on the major procedures for taxation (based on National Tax Agency of Japan (2011))
Areas Number of uses e-Tax use rate
Income tax return 8.9 million 45.1% Corporate tax return 1.7 million 65.4%
Consumption tax return (sole proprietor) 0.6 million 40.1%
Consumption tax return (corporation) 1.8 million 92.6%
Employment income withholding slip 1.5 million 62.4% Payment record of interest, etc. 0.2 million 76.4%

16
These data about e-Tax, in particular, do help us understand the situation of the
current use to a certain degree; however, we need to note that the data may not be
reflecting the true usage rates, since the values include the counts of the procedures
carried out by representatives such as tax professionals.
In order to get closer to the true use rate, I have further looked into an additional
resource, a survey conducted by a private institution on the people who filed or will file
the tax return as of the year 20105. According to the results, those who responded that
they “file the tax return by visiting tax office” took the largest portion with 32.6%, while
those who said they use e-Tax came in the second at 15.8% (see Figure 4).
Figure 4: Share of tax return filing methods (based on Rakuten Research (2010))
As to the question of whether they are aware of e-Tax, about 88.3% of the
respondents said they are aware that e-Tax is available as an option for filing tax return.
Figure 5: Level of awareness for e-Tax (based on Rakuten Research (2010))
And to the question asking for reasons of not using e-Tax, “procedures required for
using e-Tax are cumbersome” (28.2%), “IC card reader costs money” (15.9%),
“electronic ID costs money” (10.6) were the major responses.
5 Rakuten Research (Internet survey, February 2010, n=1000)
32.6 15.8 11.5 40.1
0% 20% 40% 60% 80% 100%
Actual visit to tax office e-Tax Create at NTA homepage and submit the hard copy at tax office Others
88.3 11.7
0% 20% 40% 60% 80% 100%
Aware Not aware

17
Figure 6: Reasons for not using e-Tax (based on Rakuten Research (2010))
What the above results suggest are, firstly, that there exists a large gap between
the level of awareness (88.3%) and the level of usage (15.8%). And it is suspected that
the growth of the use rate is subdued mainly due to the burden of the preliminary
procedures and the costs for purchasing the IC card and the electronic ID (Rakuten
Research 2010).
The implication of the above result towards STN would be that there is a high
chance that STN would inherit the problem of low demand in the online counter
services, since STN would hold the exact same problem of posing not a few start-up
costs on the users as e-Tax and e-Gov do, which is in fact the very reason why the
demands for the aforementioned services have been stagnating.
2.4 Attitude of the Japanese public towards information sharing system
Since 1968, there had been several attempts by the Japanese government to implement
national identification number system, which would allow information sharing among
government bodies, but none have been completely successful. The reasons for the
failures were known as that the merits expected to be gained by introducing the id
number system at the times were perceived to be not large enough to cover the costs
related to the implementation (Morinobu and Kobayashi 2011). And the costs for
introducing the national id number system were largely due to the privacy concerns of
the Japanese public. It would be beyond the scope of this paper to discuss about the
cultural differences on the attitudes towards the information technology, but according
to the previous studies in sociology, on the pathway that the Japanese society had
formed advanced information networks, several incidents of privacy invasion in the
past had fostered uniquely reactive attitudes towards the information technology
28.2 15.9 10.6 45.3
0% 20% 40% 60% 80% 100%
Procedures required for using e-Tax are cumbersome IC card reader costs money Electronic ID costs money Others

18
among Japanese people, who have particular tendencies to cherish individual
personality and inner values (Tamura 2004). The controversy over the Juki-net, a
nationwide computer network, which allows the residents’ basic information to be
shared among the municipal governments, partially illustrates the intensity of the
privacy concerns shared among the Japanese people (Bowe 2012)6.
It is certainly true that the privacy concerns are critical issues as far as the
implementation of STN is concerned. However, as it is shown on the survey results in
2.1, where the acceptance level of STN reached 57.3% as of 2011, just because one is
sensitive to the privacy protection issues may not necessarily mean that one would
automatically take the position of objection to the national ID system. Further, due to
the large penetration of the internet and social network websites, the latest trends show
that the Japanese people have become less sensitive toward the privacy protection
issues.
I would like to note that there are three major implications of the
aforementioned findings towards building marketing strategies for STN:
The reactive attitudes of the Japanese public towards the information
sharing system must be given due account when marketing STN. The
complexity in attitude towards the policy shared among the Japanese
people may mean that a large investment in the marketing could yield a
small return in terms of the participation level. Or, it could mean that
even though the participation level may eventually increase to a high
level, it may require a substantial amount of time.
6 A direct excerpt from the article reads as follows:
The Juki-net became a major source of controversy in Japan when it was launched [2002]. A newspaper opinion poll conducted just before implementation found that 86 percent of respondents were afraid of data leakage or improper use of information, while 76 percent thought implementation should be postponed. Several lawsuits challenged the new system, charging that it constituted a violation of the right to privacy guaranteed by Article 13 of the Japanese Constitution. Protests were mounted as well; 70 municipal assemblies and 29 mayors passed resolutions demanding the government postpone Juki-net’s implementation. In one city, whose mayor made it possible for citizens to opt out, 839,539 citizens went to city offices to register for non-participation. Following a Supreme Court ruling that found Juki-net to be constitutional, the citizens who’d requested to opt out were enrolled anyway (Bowe 2012).

19
It would probably be important to take a look into the distributions of
the attitudes, as well as the average level of attitudes, and design a good
targeting plan. The survey results suggest that the people who are taking
a strong position of objection are merely 12.2% of the entire population
(Cabinet Secretariat 2011).
The fact that STN is closely related to the privacy issues is apparently a
weakness. Therefore, instead of focusing on persuading the public that
they are being over reactive to supposed dangers, it would perhaps be
better to appeal the benefits that can be delivered by the policy and let
the public decide. If the public become to think that the privacy invasion
risks involved with STN are minimal compared to the benefits that will
be realized by the policy, they will choose to participate.
3. Reference Data: Findings from Existing Policies
In this section, I will bring forth the cases of four existing policies, which are considered
to have made a success in policy marketing, and analyze the major factors that have
contributed to the desirable outcomes. The purpose is to gain information from
reference cases and draw implications toward the marketing plan for STN, and, above
all, to verify the validity of the strategic framework I will be presenting in the next
chapter with the real world cases. The policies we will be looking into are:
“Cash Receipt System” in South Korea
“e-Tax Invoice System” in South Korea
“COOL BIZ” in Japan
“Plastic Bag Reduction Campaign” in Japan
“Cash Receipt System” and “e-Tax Invoice System” are similar to STN in the sense
that they deal with information sharing infrastructure established for tax purposes.
“COOL BIZ” and “Plastic Bag Reduction Campaign” do not share much in common with
STN in terms of subject matter, but in the aspect that they all involve eliciting
participation from the identical target (basically the general public in Japan), it is found
that referring to those two policies is worth taking into account.

20
3.1 “Cash Receipt System” in South Korea7
Cash Receipt System (CRS hereafter), which was first introduced by National Tax
Service of Korea (NTS hereafter) in 2005, is a policy designed to enhance transparency
of the information on the tax report and therefore bring out the notion of fair taxation. It
had often been treated as a problem by the Korean Government that the self-employed
tax payers, who make estimated tax payments, were prone to provide false or
fraudulent information about the income from the cash transactions on their tax report,
while there was no realistic measure other than the ex post tax investigation to deal
with it. Such situation was thought unfair, especially when compared to the fact that the
employment income taxation is strictly executed through withholding. CRS was then
initiated as a taxation infrastructure component that can lessen such problems through
the use of instant electronic information transfer.
The policy was designed in such a way to fulfill its purpose, and in particular, it
has proposed to do the following to the public:
<Consumers> When making a cash payment at a store, request the store to print a cash
receipt and obtain ID verification. Register at the official homepage and check the transaction information
online. <Retailers> Register as a member and have the necessary device installed on the credit
card terminal When a cash receipt is requested by a customer, verify the customer’s
identification, print it by operating on the terminal, and hand it to the customer
While putting aside whether the policy has served well its purpose per se, let us
now bring our attention to how much it has succeeded in getting the target audience to
participate in the directed actions. Table 5 below summarizes some indexes that shows
the change in the participation level.
Table 5: Indexes showing the participation level of Cash Receipt System
(based on National Tax Service of Korea (2012))
7 This section is written based on Lee and Watanabe (2012) and the interview with Dong Gu
Yang and Yoon Ju Park held on September 12, 2012.
21
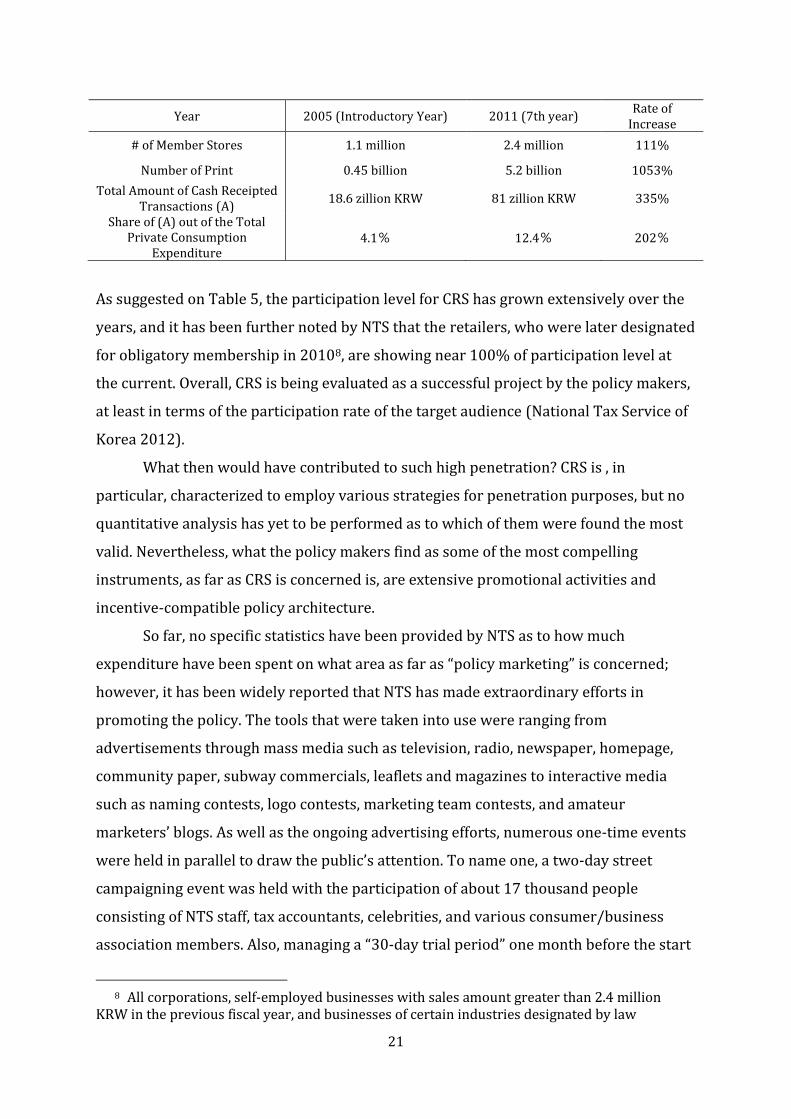
Year 2005 (Introductory Year) 2011 (7th year) Rate of
Increase
# of Member Stores 1.1 million 2.4 million 111%
Number of Print 0.45 billion 5.2 billion 1053%
Total Amount of Cash Receipted Transactions (A)
18.6 zillion KRW 81 zillion KRW 335%
Share of (A) out of the Total Private Consumption
Expenditure 4.1% 12.4% 202%
As suggested on Table 5, the participation level for CRS has grown extensively over the
years, and it has been further noted by NTS that the retailers, who were later designated
for obligatory membership in 20108, are showing near 100% of participation level at
the current. Overall, CRS is being evaluated as a successful project by the policy makers,
at least in terms of the participation rate of the target audience (National Tax Service of
Korea 2012).
What then would have contributed to such high penetration? CRS is , in
particular, characterized to employ various strategies for penetration purposes, but no
quantitative analysis has yet to be performed as to which of them were found the most
valid. Nevertheless, what the policy makers find as some of the most compelling
instruments, as far as CRS is concerned is, are extensive promotional activities and
incentive-compatible policy architecture.
So far, no specific statistics have been provided by NTS as to how much
expenditure have been spent on what area as far as “policy marketing” is concerned;
however, it has been widely reported that NTS has made extraordinary efforts in
promoting the policy. The tools that were taken into use were ranging from
advertisements through mass media such as television, radio, newspaper, homepage,
community paper, subway commercials, leaflets and magazines to interactive media
such as naming contests, logo contests, marketing team contests, and amateur
marketers’ blogs. As well as the ongoing advertising efforts, numerous one-time events
were held in parallel to draw the public’s attention. To name one, a two-day street
campaigning event was held with the participation of about 17 thousand people
consisting of NTS staff, tax accountants, celebrities, and various consumer/business
association members. Also, managing a “30-day trial period” one month before the start
8 All corporations, self-employed businesses with sales amount greater than 2.4 million
KRW in the previous fiscal year, and businesses of certain industries designated by law
22
of the policy is another good example of NTS’s promotional efforts. NTS states that these
series of activities aimed mainly to (i) raise the level of recognition and (ii) build a
positive image towards the policy.
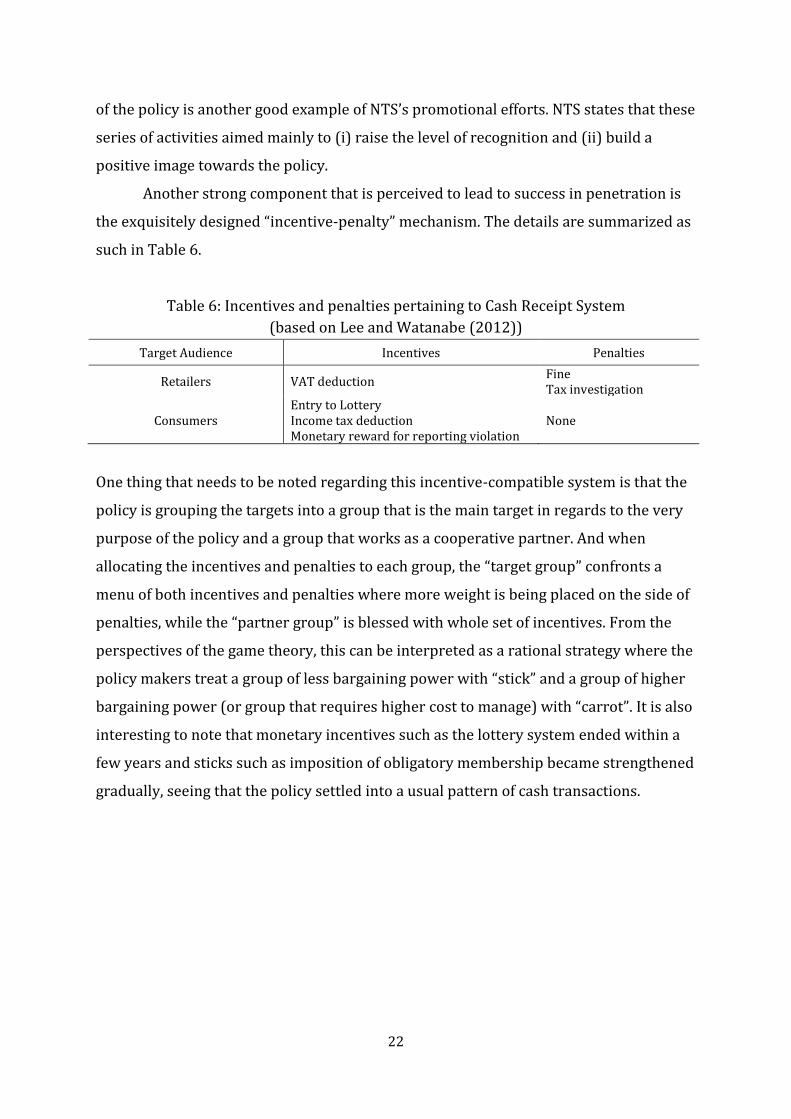
Another strong component that is perceived to lead to success in penetration is
the exquisitely designed “incentive-penalty” mechanism. The details are summarized as
such in Table 6.
Table 6: Incentives and penalties pertaining to Cash Receipt System
(based on Lee and Watanabe (2012))
Target Audience Incentives Penalties
Retailers VAT deduction Fine Tax investigation
Consumers Entry to Lottery Income tax deduction Monetary reward for reporting violation
None
One thing that needs to be noted regarding this incentive-compatible system is that the
policy is grouping the targets into a group that is the main target in regards to the very
purpose of the policy and a group that works as a cooperative partner. And when
allocating the incentives and penalties to each group, the “target group” confronts a
menu of both incentives and penalties where more weight is being placed on the side of
penalties, while the “partner group” is blessed with whole set of incentives. From the
perspectives of the game theory, this can be interpreted as a rational strategy where the
policy makers treat a group of less bargaining power with “stick” and a group of higher
bargaining power (or group that requires higher cost to manage) with “carrot”. It is also
interesting to note that monetary incentives such as the lottery system ended within a
few years and sticks such as imposition of obligatory membership became strengthened
gradually, seeing that the policy settled into a usual pattern of cash transactions.
23
3.2 “e-Tax Invoice System” in South Korea9
e-Tax Invoice System (ETS hereafter) , a policy that enforces electronic endorsement of
tax invoice, is designed to enhance transparency of the information on the tax invoice,
reduce compliance costs, and promote fair taxation particularly in regard to the VAT.
The purpose and role of ETS is very similar to that of CRS, except for the fact that ETS is
introduced to cover the transactions between businesses while CRS is to cover the cash
transactions between retailers and consumers.
ETS was first introduced in 2001, but its use did not penetrate much except
among the large corporations and their partners. The reasons were, firstly, the first-cost
hurdle (i.e. personal computers, learning cost, ERP) prevented small businesses from
participating. Also, the paper-based tax invoice was comparatively easy to fraud and
that provided another reason for businesses to prefer the paper-based one, especially
when they had a right to whichever option to choose. And lastly, even if one issued a tax
invoice electronically, he or she would have had to transcribe that information into a
separate paper-based tax invoice for tax reporting purposes, which was cumbersome
and time consuming.
NTS recognized these problems and initiated the “policy marketing” of ETS
starting from 2008. The change first began with simplifying the process flow of the
invoice exchange. The new process flow, introduced by the policy, is as follows:
Seller collects VAT together with the supply price of good or service from buyer.
Seller issues an e-tax invoice using electronic ID and sends it to buyer via e-mail.
Seller sends the issuance information to NTS electronically by a designated day of every month.
Next, NTS came up with a plan to make the electronic endorsement of tax invoice
compulsory for all businesses by 2010; however, it has later changed so that the
obligation rule applies to large corporations starting from 2011 and to self-employed
9 This section is written based on Lee and Watanabe (2013) and the following interviews: Dong Gu Yang and Yoon Ju Park (September 12, 2012) Kyung Geun Lee, Kyung Hwan Lee, and Michitaka Harayama (September 12, 2012) Kyu Sung Lee, Tae Jong Shin, and Hwan Soo Kim (September 18, 2012)

24
businesses with sales over 1 billion KRW from the year 2012, since many businesses
were having much difficulties in adjusting to such change.
The start was not smooth, but now it has become evaluated by the policy
makers and media that it has settled well. It has been reported by NTS that those with
obligatory responsibility are exhibiting near 100% of participation level and there are
many small businesses who are participating even if they are not obligated.
One reason for the success in bringing up the penetration level is, just as it was
the case for CRS, the active use of the incentive-penalty system. It includes a monetary
incentive in the form of VAT deduction and exemption of some paperwork obligations
pertaining to the paper-based tax invoice. However, what is being perceived to be the
most powerful as to the impact on the target audience is the existence of strong
penalties. It first began with incentives and no penalty, and it has gradually changed so
that noncompliance would lead to additional tax that equals 0.1~0.2% of sales amount10
of applicable transaction. After giving 1 year of grace period, the tax rate boosted up to
1%, which ultimately pushed the compliance level up high. And now that the
penetration is perceived to reach saturation level, the additional tax rate has been
raised to maximum of 2%.
It is certain that the “stick strategy” has been the most powerful tool to influence
the behavior change of the target audience for ETS; however, we can infer from the
resistance reactions at the introductory period that imposing obligatory responsibility
or introducing penalties alone would not have fulfilled sufficient condition for the
current result. In fact, substantial amount of efforts have been paid to (i) make it a user-
friendly policy and (ii) improve the recognition level and image value.
How the policy has become something that grants practical values is shown by
the survey result disclosed by NTS. The survey had responses from about 62 thousand
people representing each business and the majority raised hands to “e-tax invoice is
more convenient than the paper-based invoice and is easy to use”. And according to the
estimation results published by Korea Institute of Public Finance, the net national
compliance costs saved by the introduction of ETS are calculated to be about 700 billion
KRW. Such results suggest that policy makers were actually interested in meeting the
needs of the users, and it is further proven by the facts that NTS has continued to
10 This amount refers to sales amount exclusive of VAT.

25
manage a variety of communication channels like opinion hearing sessions, surveys, and
bulletin board system on the internet targeting tax accountants and businesses.
The promotional efforts are also found to be strategically planned. The official
homepage of ETS, where businesses can issue e-tax invoice online, is named “e-sero”
meaning “electronic pathway to tax payment”. The term “pathway” has a positive
connotation attached to it particularly in the context of Korean culture, and the name
seems to help form a positive image towards the policy and convey a message at the
same time that ETS is the right channel to use when it comes to tax. Further, it is found
that the target audience for the promotional activities changed from indefinite whole to
a specific group over time. At the beginning phase of the policy marketing, efforts were
made mainly to raise the recognition level and the mass media or campaigning events
were the main tool that were taken into use. After the policy acquired a certain number
of users, NTS went on to specifically target the businesses that had never used the e-tax
invoice. The messages delivered to the audience were then focused on the merits and
monetary incentives, and the activities involved actual visits to each business and
numerous information sessions held at the local level. I find that such efforts to draw
participation from the target have great similarity to the sales and marketing activities
performed by private enterprises.
3.3 “COOL BIZ” in Japan11
COOL BIZ (CB hereafter), a policy introduced by the Ministry of Environment of Japan
(MOE hereafter) in 2005, began as a part assignment of an environmental movement
called “Team minus 6%”. The movement, which was organized with a purpose to reduce
the greenhouse gas level by 6%, put up a slogan of “Let’s set the office temperature at 28
degrees Celsius in summer”, and CB started as a clothes suggestion for the office
workers to wear light and cool clothing that is suitable at the temperature. At first, there
was no particular dress code designated when referring to “light clothing”, but later, it
developed into indicating “open collar and no jacket or tie”.
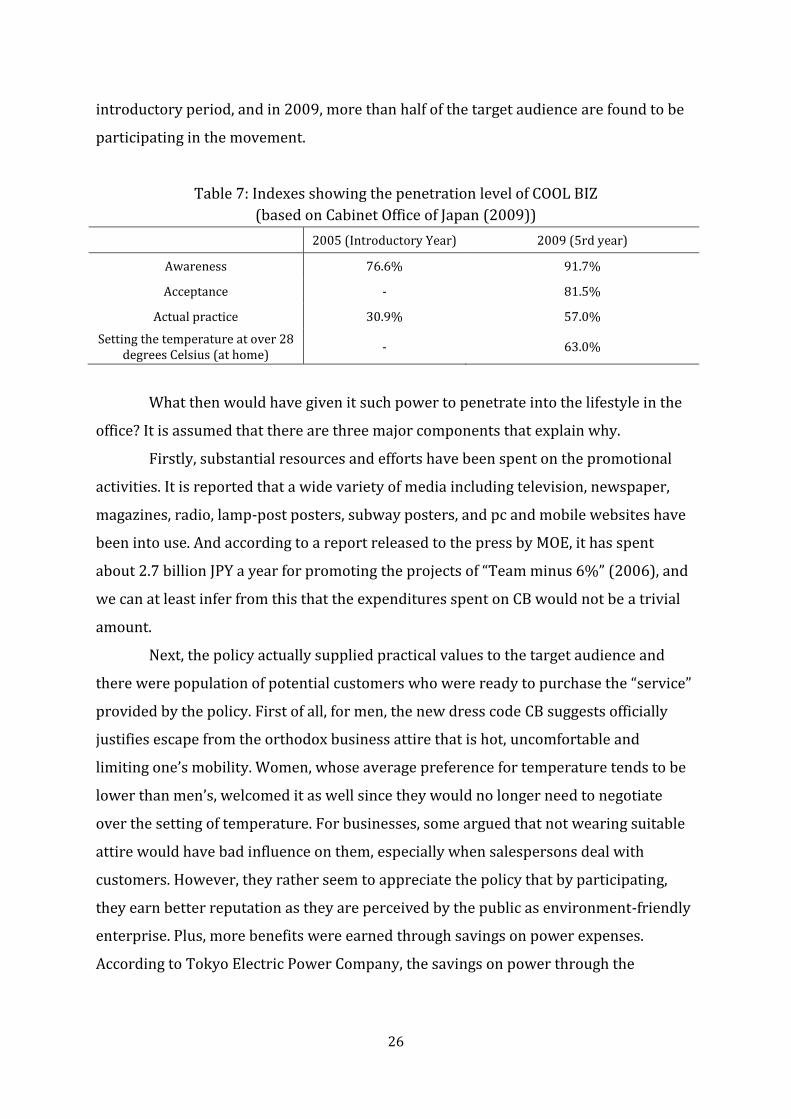
The policy is evaluated to have penetrated well into the office culture in Japan.
Table 7 summarizes the results of the surveys conducted by Cabinet Office, Government
of Japan, and it shows that the participation level was quite high even at the
11 This section is written based on Ministry of the Environment of Japan (2013).
26
introductory period, and in 2009, more than half of the target audience are found to be
participating in the movement.
Table 7: Indexes showing the penetration level of COOL BIZ
(based on Cabinet Office of Japan (2009))
2005 (Introductory Year) 2009 (5rd year)
Awareness 76.6% 91.7%
Acceptance - 81.5%
Actual practice 30.9% 57.0%
Setting the temperature at over 28 degrees Celsius (at home)
- 63.0%
What then would have given it such power to penetrate into the lifestyle in the
office? It is assumed that there are three major components that explain why.
Firstly, substantial resources and efforts have been spent on the promotional
activities. It is reported that a wide variety of media including television, newspaper,
magazines, radio, lamp-post posters, subway posters, and pc and mobile websites have
been into use. And according to a report released to the press by MOE, it has spent
about 2.7 billion JPY a year for promoting the projects of “Team minus 6%” (2006), and
we can at least infer from this that the expenditures spent on CB would not be a trivial
amount.
Next, the policy actually supplied practical values to the target audience and
there were population of potential customers who were ready to purchase the “service”
provided by the policy. First of all, for men, the new dress code CB suggests officially
justifies escape from the orthodox business attire that is hot, uncomfortable and
limiting one’s mobility. Women, whose average preference for temperature tends to be
lower than men’s, welcomed it as well since they would no longer need to negotiate
over the setting of temperature. For businesses, some argued that not wearing suitable
attire would have bad influence on them, especially when salespersons deal with
customers. However, they rather seem to appreciate the policy that by participating,
they earn better reputation as they are perceived by the public as environment-friendly
enterprise. Plus, more benefits were earned through savings on power expenses.
According to Tokyo Electric Power Company, the savings on power through the

27
introduction of CB for the year 2005 are estimated to be about70 million kilowatt hour
in the aggregate (2005 cited in Press Net Japan 2005).
Last but not least, careful endeavors to “fine tune” the policy have been made so
that the public finds it easier to follow and participate in.
Back in 1979 after the second oil crisis, “Shou Ene Looks (SEL hereafter)”, a
movement that promoted to wear half-sleeved suits and shirts in offices, was
introduced in Japan. The methodology as to the purpose of energy saving stood in the
same line with CB but it did not spread among the public. The reasons were, firstly,
people thought the outfit suggested by the policy was silly and frumpy. The policy
makers of SEL apparently neglected to see that clothes are closely related to people’s
needs to appear fashionable and stylish. The name also had negative connotations
associated with it, since the Japanese word “Shou” gives an image of “cutting something”.
Further, the suggestions of SEL were costly and not likely acceptable for many, since
one would have to purchase a new set of clothes or cut the sleeves in half to follow the
directions (Harada 2011).
CB picked up this previous case of failure and changed these elements so that it
would match the tastes of the public while keeping the original essence. As we look at
the name “COOL BIZ”, a coined word chosen by holding a naming contest, the meaning
of the adjective “COOL” is associated with not only being “moderately cold” but also
being “fashionable”. The directions have become much more simple and handy as well;
all that need to be done are, open the top button of the shirt and wear no jacket or tie
(Harada 2011). It is found that such small “adjustments” that took into account the
stance of the policy participants did not involve huge invention or large cost but such
efforts allowed the target audience to find it much easier to attach themselves to it.
3.4 “Plastic Bag Reduction Campaign” in Japan12
Plastic Bag Reduction Campaign (PRC hereafter), a policy led by the Ministry of
Environment of Japan (MOE hereafter), began as an assignment that is bundled with a
project called “3R (Reduce-Reuse-Recycle) of Waste Containers and Packaging”.
With ever-increasing recognition that plastic bags take up a large volume of
household waste, there had been voluntary movements to reduce the use of plastic bags
12 This section is written based on Ministry of the Environment of Japan (2013).

28
operating at the local level for years, and later MOE took the lead to develop it into a
nation-wide movement starting from 2006.
The campaign, which particularly involves consumers and retailers, suggests
that they do the following:
<Consumers> Bring one’s own bag (this is called “my bag”) when shopping at a store, and
refuse to receive plastic bag at the cashier Refrain from purchasing over-packaged products <Retailers> Set a specific goal for plastic bag reduction and plan out to achieve that goal Provide the information about the in-store campaign, and employ “carrot
and stick” methods to lead consumers to refrain from using plastic bag. The methods would include charging money for plastic bag, distributing durable shopping bags (“my bags”), and granting membership card points for those who refused to receive plastic bag
Ask each consumer at the cashier if he or she would need a plastic bag
Even under the MOE’s supervision, the campaign has basically continued to
operate on a local basis, and therefore, the participation level of the campaign is
perceived to differ substantially depending on local districts. For that reason, it is
difficult to measure the aggregate estimate of the penetration level for the entire nation.
Nevertheless, it is found that the movement has expanded while major franchise stores
and some municipal governments are taking active roles as co-leader, and the results
seem to have been satisfactory. Table 8 displays the change in the rate of plastic bag
refusal by consumers at the member stores of Japanese Chain Store Association (JCSA),
and it shows that the rate starts to accelerate in 2008 and continues to rise at a faster
speed.
Table 8: The rate of plastic bag refusal by consumers at the member stores of JCSA
(based on Japanese Chain Store Association (2013))
2006 2007 2008 2009 2010 2011 2012
Rate of Refusal
13.3% 13.9% 15.7% 18.5% 25.0% 31.0% 37.4%
And as for Suginami, Tokyo, the area of which municipal government is known for
making extraordinary efforts in promoting the campaign, the rate for “my bag” usage by

29
consumers is high, particularly at supermarkets, and it further experiences a rapid rise
from the year 2008 to 2009, as shown in Table 9.
Table 9: The rate of “my bag” usage by consumers at retailers in Suginami, Tokyo
(based on Tokyo Metropolitan Television Broadcasting Corporation (2010))
2008 2009
Supermarket 26.2% 56.2%
Convenience Store 13.3% 13.9%
To explain about the reasons for the success of the campaign, I would like to
name three things as the factors that have contributed the most.
First, the purpose of the campaign falls into the category of “environment
protection”, which is a value that is easily understood and readily accepted by the public
at large. According to a survey conducted by MOE in 2007, the results suggest that 49.4%
of the population agree with the campaign while 28.9% found it disagreeable.
Second, MOE have made strategic alliances with the retailers and municipal
governments that are advanced in leading the campaign. By making the alliances, MOE
became not only strengthened in reaching out to consumers at the tangible local level
but also able to provide good model cases for the businesses and municipal
governments in their planning and formulation of actions.
Finally, MOE has designed an effective “dual-layer” incentive-compatible
structure targeting businesses and consumers.
According to a report that analyzes consumer behavior in regard to My Bag
Campaign in particular, the effects of promoting the campaign by appealing to the moral
emotions alone were low while granting incentive compensation of various forms was
found more effective. The incentive structure designed by MOE reflects the
understanding of such behavior patterns (Yasuda and Marumo 2008).
The structure is constructed as follows: first, it categorizes the target audience
into “target group” and “partner group”. This pattern may have much in common with
CRS introduced in 3.1., but in contrast to CRS, that retailers are the “partner group” and
consumers are designated as the “target group”, meaning changing the consumer
behavior is the ultimate goal of the campaign. The first layer of the structure, which is a
blend of “carrot” and “stick” methods, is targeting the retailers and the municipal

30
governments, the “partner group”, and its purpose is to have them (i) make efforts to
achieve the plastic bag reduction goal and (ii) take the role as agent and come up with
their own strategies to set up incentive structures towards the consumers, the “target
group”. This, in other words, implies that the second layer of the structure is created,
not directly by the policy maker, but through the principal-agent relationship formed by
the first layer of the structure. The details of the structure are summarized in Table 10.
Table 10: Dual-layer incentive-compatible system
pertaining to Plastic Bag Reduction Campaign
Layer Action Taker Target Carrots Sticks
1 Ministry of
Environment Businesses
Deduction in the imposed charge
Imposition of legal responsibility to recycle/reduce plastic bags
Imposition of charge in response to the amount of plastic bags produced and distributed
Punishment for not accomplishing the imposed responsibility
1 Ministry of
Environment Municipal
Governments Provision of subsidy None
2 Businesses Consumers
Distribution of “my bag”
Granting membership card point
Purchase discount
Charging money for plastic bags
2 Municipal
Governments Consumers
Granting “regional currency” that can be exchanged with trash disposal bags
None
One thing that is apparent in Table 10 is that the businesses are mainly treated by MOE
with “stick” strategies while other entities face more of “carrots”. One reason could be
that the Japanese Government is thinking the businesses are the ones who are the most
responsible for resolving the environmental problems caused by the plastic bags. On the
other hand, we can think of it in a way that it is because the businesses are with less
bargaining power compared to the consumers or it is less costly, time-wise, politically
and monetarily, for the government to manage the businesses than to manage the
consumers. Such inference is found to be consistent with the evidences drawn from the
previous cases of 3.1 Cash Receipt System and 3.2 e-Tax Invoice System.

31
4. Introducing a Strategic Framework for Policy Marketing
In this section, I will be introducing a strategic framework that can be applied to explain
the relationship between the characteristics of a policy and the level of participation to
the policy.
I would like to put forth a few propositions to the demonstration of the
framework, and they are:
The participation rate toward a policy is determined by the awareness level and
the factors that impact the behavior of each individual in a society.
The factors influencing each individual’s behavior consist of three major
components:
(i) how much benefits are provided by the policy
(ii) how big is the degree of acceptance toward the participation
behavior
(iii) whether the benefits and the acceptance level mentioned in (i)
and (ii) less costs of participation are large enough to elicit
participation reaching critical mass13
And since the framework is designed to focus on the effects of the behavior factors on
participation rate exclusively, it assumes that everyone in the system is aware of the
directives of the policy and the effects of the awareness level and that the effects of the
behavior factors are mutually independent.
With these as premises, we can formulate a hypothetical framework that
explains the correlations among the three factors mentioned above. Figure 7 below
demonstrates how it works.
13 “Critical mass”, which is an aspect of the theory of Diffusion of Innovations, proposed by
the sociologist Everett Rogers, refers to a sufficient number of adopters of an innovation in a social system so that the rate of adoption becomes self-sustaining and creates further growth. In this framework, we suppose that there exists a unique and fixed point of critical mass in every social system (Rogers 2003).

32
Figure 7: Sets of acceptance level and benefits
and their relationship to achieving critical mass
The level of satisfaction derived by both the benefits and the level of acceptance can be
represented as “a point” on the plot of “benefits” versus “acceptance level” in Figure 7,
and a group of the points representing an identical level is given as “a curve” on the plot.
For the ease of exposition, let us suppose that the curve marked on the plot particularly
represents the highest possible level of satisfaction that can be earned by an individual
(or by a group of individuals), given that the level of satisfaction follows a certain
distribution with finite variance among the individuals in the system.
Here, the curve denoted by represents the minimum level of satisfaction
required for participation to reach critical mass, with costs of participation given, and
the curve refers to the minimum level of satisfaction required for the participation
rate to stay above zero. Hence, if a point for a new policy is found in the area denoted by
D, it means the participation rate would continue to be zero, and if it is located in E, the
rate will be somewhere in between zero and the point of critical mass. And if the
benefits and the acceptance level are sufficiently large that the point is found
somewhere in F (the shaded area), the participation rate will gradually increase and
accelerating as the rate is pushed beyond the point of critical mass until it reaches a
certain higher value. Such structure of dynamics suggests that if policymakers can
control the values of acceptance level (A) or benefits (B), the participation rate can go
up, possibly reaching critical mass and further upwards.

33
Further, let us suppose the case where the costs of participation have been
reduced. The result is, as illustrated in Figure 8, the curve shifts to the left and the
minimum level of satisfaction required for participation to reach critical mass ( )
decreases from to . Due to the change, a policy, of which level is identified in
the area denoted by G, becomes to acquire a sufficient number of participants reaching
critical mass. Such illustration implies that policymakers can succeed in achieving
critical mass by raising the benefits or acceptance level by a small or zero increment, if it
is preceded by eliminating or reducing the switching (participation) costs individuals
need to pay at the initial participation.
Figure 8: Reduction in switching (participation) costs and change in minimum level of
acceptance and benefits required to achieve critical mass
With this framework as an underlying scheme, I have structured an optimal
procedure for implementing policy marketing strategies as follows:
(i) Identify the cost factors associated with participation to the policy, and
eliminate or reduce the burden of the costs to the maximum possible extent
(switching cost strategy).

34
(ii) Identify the groups of people who are likely to highly evaluate the satisfaction
derived by participating in the policy level and set them as major targets for the
marketing plans (targeting).
(iii) Identify the degree of satisfaction individuals earn by participation and
determine the amount of raise (target level) in the acceptance level (branding
strategy), the benefits (benefit strategy) or both, depending on the relative cost
of controlling each factor.
And here are a few caveats I would like to add to the above procedure:
Raising the (social) acceptance level can be difficult, costly, and time-consuming,
and the outcome of a successful project can oftentimes be a small change.
“High introductory benefit strategy” (raising B substantially high by providing
momentary compensation), which involves providing monetary incentives
during the introductory period and abolishing or reducing it after the
participation rate reaches at a sufficiently high level, is particularly considered
as an effective tool. The reason is that, existing participants are likely to
continue to stay as long as the benefits are at least zero or above, since
individuals no longer take into account the switching costs they paid at the
initial participation when making decisions.
Some may argue that switching cost strategy is one kind of benefit strategy and
the effects of both strategies are identical as long as the change is made in the
same amount in the monetary form. One reason that I can give for distinguishing
the switching cost strategy from the benefit strategy is based the idea that the
willingness to pay (WTP) differs in the size from the willingness to accept (WTA)
(Robinson and Hammit 2010), where WTP corresponds to switching costs and
WTA corresponds to benefits received by participating14. A number of empirical
14 The direct excerpt from Robinson and Hammit (2011) for the definition of WTP and WTA
is as follows: WTP and WTA can be used to value beneficial or harmful changes. For a beneficial outcome, WTP represents the maximum amount of money an individual would be willing to give up in exchange for the amenity, while WTA represents the minimum amount he would need to be paid to forego, rather than gain, the amenity. For a harmful outcome, WTP is the maximum an individual would pay to avoid the harm, and WTA is the minimum he would require to accept the harm (2011: 11).

35
studies in behavioral economics have found that there are substantial
differences between WTP and WTA and behavioral economists argue that these
gaps cannot be fully explained by income and substitute effects and emphasize
the implications of the prospect theory15 for this divergence as opposed to the
expected utility theory. Knetsch (2005, 2010), in particular, notes that given the
reference state is one’s current status, WTP for a gain is smaller than WTA for a
loss of the same magnitude. This, in other words, means that people value the
change more highly if it is viewed as a loss from the reference state rather than
as a gain. I believe this supports the idea that one unit decrease of switching cost
has a stronger impact on the participation decision than the increase of benefit
in the identical amount.
4.1 Analysis of the Findings in 3 Using the Strategic Framework
In this section, I will analyze the findings stated in “3. Reference Data: Findings from
Existing Policies” by applying the strategic framework for policy marketing introduced
in the previous section.
(a) “Cash Receipt System” in South Korea
CRS is introduced to capture cash transactions for tax purposes, and the policy itself
does neither offer much benefit for each participant nor does it present values that are
charming enough to attract the general public to participate. Therefore, we can locate
the starting point in the area of low benefits and low acceptance level on the plot of the
strategic framework. And for CRS, what is considered to be the most powerful strategy
among all the efforts made to raise the participation rate is the active use of the
incentive (benefit) strategy, characterized by income tax deduction, lottery system, and
monetary reward for violation report. The lottery system, in particular, was later
abolished after the level of participation rose substantially high. Therefore, as depicted
15 According to the prospect theory, a behavioral economic theory proposed by Daniel
Kahneman and Amos Tversky, people evaluate losses and gains expected from making a decision using certain heuristics (1979). And “heuristics”, in psychology, are defined as certain rules that determine how people form judgments and make decisions. These rules work consistently with logic, probability, or rational choice theory for most cases, but they can also lead to systematic deviations from what are considered as rational choices. These errors are called “cognitive bias” (Lewis 2008: 43).

36
in (a) of Figure 9, the high introductory benefit strategy is perceived to be the major tool
that was used to boost the participation rate.
(b) “e-Tax Invoice System” in South Korea
At the beginning, how ETS first appeared to the businesses, which are used to the paper-
type tax invoice, may be expressed with the words “burdensome” and “difficult to
follow”. Not only it was low in the aspect of benefits or acceptance level, but also did it
pose high switching costs (high learning costs and equipment costs in particular). How
the Korean government coped with the barriers was to extensively raise non-switching
costs (this would have an identical effect with “reducing switching costs”) by imposing
strong penalties for not participating. There had been some political resistance during
the initial period, particularly from small businesses, and the policymakers gave one
year “learning period” until they become used to the “new rule”. The penalties for
nonparticipants were weak at the beginning and the government made it gradually
strong as the participation level grew. Now most businesses under the regulations are
demonstrating a high level of compliance to the directives of the policy, and they now
report that the benefits of using the e-Tax invoice surpass that of the paper-type invoice.
All in all, the switching cost strategy is found to be the strongest factor that helped ETS
penetrate into the business environment. The marketing scheme for ETS within this
framework is illustrated in (b) of Figure 9.
(c) “COOL BIZ” in Japan
Let us first consider the case of SEL as the mother form of CB. Due to the fact that SEL
was a policy pursuing environmental sustainability, which is a value easily understood
and readily accepted by the public, it is conjectured that the acceptance level for SEL
may have been at least at a moderate level. However, the style of outfit suggested by the
policy was found “unstylish” and “hard to follow” by many, which had posed a great
impediment (high switching cost) to participation, and for the public, the acceptance
level and the size of the benefits associated with participation were not great enough to
cover the costs. The fact that CB picked up the essence of SEL and revolutionized the
outfit suggestion so that it would be consistent with the preference people have toward
fashion, is found to be corresponding to the strategy of reducing switching costs. As
illustrated in (c) of Figure 9, lowering barriers to participation (switching cost strategy)

37
followed by a slight increase in the acceptance level (branding strategy) is considered to
have had a major impact on the substantial growth in participation rate.
(d) “The Plastic Bag Reduction Campaign” in Japan
As it was the case for CB, PRC is a policy purposed to protect the environment, and
therefore, it is speculated that the initial position of the policy on the plot within the
proposed framework is at a moderate or higher level in the degree of acceptance.
Meanwhile, potential participants were facing barriers (switching cost), such as the
burden of carrying My Bag and expressing the intent to reject the use of plastic bags at
each time of purchase. And in the midst of all the marketing strategies adopted to raise
the participation level, what appear to be the major contributing factors are the efforts
to eliminate the burden of addressing the rejection by making the shopping places
campaign-friendly environment (low switching cost strategy) and raise the cost of not
participating in the campaign by taking the initiative to charge money on plastic bags
(high non-switching cost strategy). Under that foundation, a slight increase in the level
of benefits (benefit strategy), which would include providing trash bags and local
currency, is deemed to have had a major impact on the participation rate growth. The
strategic scheme for PRC analyzed in this part is illustrated in (d) of Figure 9.

38
Figure 9: Analysis of marketing strategies of the four policies introduced in 3
within the context of the strategic framework
The implications derived from the analysis of the findings are listed as follows:
As it was discussed in the strategic framework, eliminating or reducing the
switching cost to the largest possible extent needs to precede all other
strategies for the maximum results.
After applying the switching costs strategy to the maximum extent, the way to
design the strategy mix will depend on its current position on the proposed plot
and on the relative cost of raising one unit of acceptance level/benefit level. For
a policy of which initial position is low in both acceptance level and benefit and
the relative cost of raising acceptance level is high, implementing the high
introductory benefit strategy is recommended.
39
5. Policy Marketing Analysis and Strategy Planning for the Social Security and Tax
Number System
In this section, I will employ the strategic framework of policy marketing introduced in
the previous chapters to perform marketing analysis and strategy planning of STN.
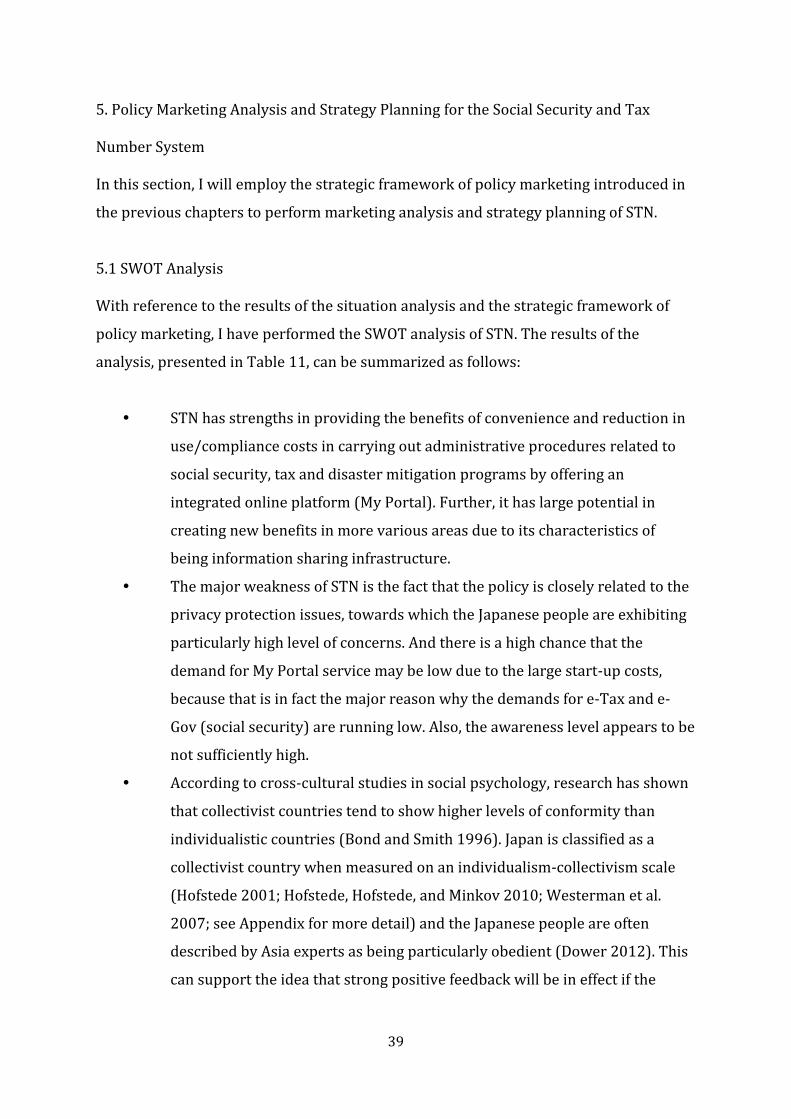
5.1 SWOT Analysis
With reference to the results of the situation analysis and the strategic framework of
policy marketing, I have performed the SWOT analysis of STN. The results of the
analysis, presented in Table 11, can be summarized as follows:
STN has strengths in providing the benefits of convenience and reduction in
use/compliance costs in carrying out administrative procedures related to
social security, tax and disaster mitigation programs by offering an
integrated online platform (My Portal). Further, it has large potential in
creating new benefits in more various areas due to its characteristics of
being information sharing infrastructure.
The major weakness of STN is the fact that the policy is closely related to the
privacy protection issues, towards which the Japanese people are exhibiting
particularly high level of concerns. And there is a high chance that the
demand for My Portal service may be low due to the large start-up costs,
because that is in fact the major reason why the demands for e-Tax and e-
Gov (social security) are running low. Also, the awareness level appears to be
not sufficiently high.
According to cross-cultural studies in social psychology, research has shown
that collectivist countries tend to show higher levels of conformity than
individualistic countries (Bond and Smith 1996). Japan is classified as a
collectivist country when measured on an individualism-collectivism scale
(Hofstede 2001; Hofstede, Hofstede, and Minkov 2010; Westerman et al.
2007; see Appendix for more detail) and the Japanese people are often
described by Asia experts as being particularly obedient (Dower 2012). This
can support the idea that strong positive feedback will be in effect if the

40
number of participants increases so high that the behavior of participating in
STN challenges the current norm (nonparticipation) in Japanese society.
Meanwhile, theory of international marketing addresses that a culture’s
behavioral attitude can be measured in terms of attitude toward change, and
societies that are resistant to change are usually less willing to adopt new
products or product processes (Kotabe and Helsen 2010: 118). And the
Japanese society is oftentimes identified by cultural studies as “peculiarly
change-resistant” (Hofstede 2001; Hofstede, Hofstede, and Minkov 2010;
Dower 2012). In this understanding, we can conjecture that the social
switching cost faced by the Japanese people for participating in STN may not
be small.
Due to the large penetration of the internet and social network websites, the
latest trends show that Japanese people have become less sensitive toward
the privacy protection issues than they were before. Therefore, there is a
chance that the implementation of STN may not be as difficult as it was for
the Juki-net.
Nevertheless, there always is a chance that the level of concerns about
privacy invasions rises up when the implementation is close at hand.

41
Table 11: SWOT analysis of Social Security and Tax Number System
Positive factors Negative factors
Internal Factors
Benefits Provides an online platform (My Portal) for administrative matters related to social security, tax, and disaster mitigation programs, which promote convenience and reduction in use/compliance costs
Switching costs
High switching costs (costs for IC card reader and electronic ID), the main bottleneck for penetration of e-Tax, exist in the same way for STN
Benefits Can deliver push-type, personalized services to users
Awareness level
Level of awareness is not high
Benefits
Has large potential in creating new benefits in more various areas due to its characteristics of being information sharing infrastructure Attitude
Japanese people are exhibiting particularly high level of concerns over privacy invasions, and the notion of “national identification number” carries relatively negative connotations for Japanese people in general (government monitoring, monitored society, etc)
Benefits Not many example cases have been provided to illustrate how it can be used to meet the needs of the people
External Factors
Social Interde-
pendence
The level of social interdependence and the magnitude of peer effect are found high in Japan; it is expected that the network effect will exert positive impact on the participation level
Attitude toward change
(social switching cost)
People have gotten used to the administrative routines that require no number for a long time, and it is expected that it would require extraordinary efforts to change such habitual patterns. And the Japanese society is often said to be exhibiting high level of resistance to change
Attitude
Due to the large penetration of the internet and social network websites, Japanese people have become less sensitive about the privacy protection issues
Awareness Level
Since there is no active discussion about the privacy issues, we cannot expect to see the awareness level grow as a side effect
Others Not much opposition from small businesses
Attitude There always is a chance that the level of concerns about privacy invasions further rises before the policy is introduced
Others Most political parties are supporting the idea of introducing STN
Others The local governments at the Shi/Ku/Chou/Son level are showing interest and willingness to support
42
5.2 Strategic Model
The ultimate purpose of the policy marketing is to raise the participation level to the
highest possible level. And as we employ the policy marketing model introduced in the
previous chapters as a strategic tool to accomplish that purpose, our objective takes a
more specific form: it is to design strategies so that “the participation level for STN
reaches critical mass”. The value of critical mass for STN is not particularly known, but
we can presume that it is determined by the relative size of the magnitude of peer effect
and the degree of resistance to change in the Japanese society.
And within the context of the strategy model, the current position of STN can be
described as in Figure 10. (a) of Figure 10 illustrates the hypothetical demand curve of
the participation toward STN, extrapolated based upon the results of the SWOT analysis,
and the resulting level of participation, denoted by . The fact that there are two
different levels of private switching costs, denoted by and , indicates that the
users of e-Tax or e-Gov face lower switching costs ( ) because they have already made
investments in completing the preliminary procedures for online platform use and
paying the costs for purchasing the IC card and the electronic ID. In other words, the
difference between and refers to the costs related to the prearrangements
required for using the online platform of the government services. The point on (b) of
Figure, denoted by ⓪, is to mark the current level of attitude toward participation (A)
and benefits from participation (B) for individual in the Japanese society and its relative
position to the level ( ) required to achieve critical mass (the threshold level
where positive network effect is triggered). To sum up the current situation with the
use of the model, the level of AB is not sufficiently high (or is not sufficiently low) to
elicit participation demand from new users, and those who form the participant
network will mostly be composed of the existing users of the currently available online
platform (e-Tax or e-Gov).16
16 The reasoning is based upon the assumption that the distribution of demand for e-Tax or
e-Gov is identical to the distribution of demand for My Portal.

43
Figure 10: Current position of Social Security and Tax Number System
within the context of the strategic framework (based on Lee (2013))17
Next, as illustrated in Figure 11, the strategic model suggests performing the
following series of strategies: low switching cost strategy, targeting strategy, high
introductory strategy and branding strategy (strategies listed in the order of execution).
First, after examining the level of switching costs faced by each new participant, it is
recommended to design plans to reduce the costs to the possible extent while giving
consideration to the budget constraint. And once the degree of reduction in switching
costs is determined, identify the group of people with high demand for participation and
set them as targets. Then, the efforts to raise B (benefits from participating in STN) and
A (attitude toward participating in STN) ill be followed. As shown in (b) of Figure 11,
the level of AB required to achieve critical mass ( ) is reduced from to
due to the discount in the switching costs, and therefore, the target increase will be
from to .
As for the branding strategy, which aims to raise the acceptance level toward
the participation in STN (A), increasing one unit of the acceptance level for STN is in fact
difficult to accomplish and expected to be high in costs—both monetarily and time-
17 Refer to the reference article for the detailed description of the model illustrated in (a) of
Figure 10 and 11.

44
wise.18 Therefore, putting a higher emphasis on the high introductory benefit strategy,
while performing the branding strategy at a moderate level (“⓪⟶①” in (b) of Figure
11), would become a key tactic. As the name suggests, the high introductory benefit
strategy refers to the plan that provides monetary incentives to each individual
participant during the introductory period (rapid and momentary raise of B), and
abolish it after the participation level reaches at a higher level at in (a) of Figure 11.
Once the participation level reaches , we do not expect to see the participant network
for STN shrink even after AB decreases from to , because it would be still
better for them to remain in the system than exit after having paid the entire switching
costs.
Figure 11: Goal (target) position of Social Security and Tax Number System
within the context of the strategic framework (based on Lee (2013))
18 The cost ratio of A and B is expressed by the magnitude of slope of the isocost line
denoted by .

45
5.3 Recommendations
With reference to the scheme discussed in 5.2, the framework of the marketing plans for
STN has been developed as in Table 12. The framework consists of three tasks, which
are: (i) Enhancement of awareness level, (ii) Enhancement of practice level and (iii)
enhancement of the effects generated by (i) and (ii). Starting from the next section, I will
focus on explaining the task of (ii) (the parts marked by the bold box in Table 12), which
particularly deals with the factors that would influence the participation behavior, since
it is the part pertaining directly to the major interest of this report.

46
Table 12: Recommended Tasks for Social Security and Tax Number System
Tasks
Plans
Level of emphasis 19 in each time frame (L/M/H)
Sub-tasks Introductory Post
introductory Pre -
I Enhancement of awareness
level
- Sell the name ”My Number” H H L
- Sell the specific contents (what is suggested to do; what are the benefits; how much monetary incentives are provided for how long; how to use My Portal; in what areas the number can be used)
M H H
II Enhancement
of practice level
Cost Eliminate or reduce switching costs H H Impose monetary/nonmonetary penalties (if possible) - (L)
Targeting (achieving critical mass)
Designate e-Tax users, beneficiaries of the social security services, income tax payers, and corporations as major target groups
H M
Benefit
Provide monetary incentives H Gradual or immediate abolition
Provide additional nonmonetary benefits H H Apply constraints in receiving some benefits when the number is not used - (L) Enhance the system so that it could provide more benefits in terms of convenience H H
Acceptance level (branding)
Create positive brand image H H
Create an image that not participating in the policy is not catching up with the latest trend
L H
Expectation Foster expectation that participation level will go up H M
III Enhancement of the effects
generated by I and II
Third party cooperation
Introductory period: municipal governments, tax offices, financial institutions and other institutions that are involved with taxation and social security service (which would include health care services and nursing homes)
Post introductory period: enterprises in communication industries and other applicable institutions that deal with electronic money
H H
Communication Manage communication channels that individuals can reach easily, such as websites, e-mails, or phone calls
H H
Expand application areas
Develop more micro-level example cases with the help of the cooperative partners H H
19 “L” refers to “low”, “M” to “medium”, and “H” to “high” in the intensity of emphasis respectively.
47
5.3.1 Strategy Mix and Planning
In this section, I will discuss the specific planning that I have developed within the
context of the strategy mix introduced in 5.2.
Eliminating/reducing switching costs
As discussed in the previous sections, the highest cost factors for STN are identified to
be the administrative procedures and the monetary costs required to prepare for the IC
card, IC card reader, and the electronic ID; hence, the plan is designed mainly to
eliminate or reduce such costs.
I have structured the plan into two parts: one is for the case of low budget and
the other is for the case of high budget (Table 13). For the low budget case, the plan is
focusing on reducing the monetary or nonmonetary burden involving the use of the
online platforms to a feasible extent, given the current system. If the plan is
implemented, citizens can instantly start using My Portal without having to bear
monetary costs or paying several visits to local government offices. The plan for the case
of high budget case takes one step further; it suggests that, instead of designating the IC
card as the only medium for the electronic ID, a new system for the electronic ID be
developed so that it can be downloaded on PC or mobile phones. If it is made possible,
IC card reader will no longer pose impediment to the demand for My Portal, and further,
users will gain access to My Portal from their mobile phones.
The switching cost strategies do not only involve eliminating or reducing the
costs for switching to participate but also include the tactics of raising the costs for not
switching. I have also devised a plan of “high non-switching cost strategy” for STN and
the details are illustrated in Table 14. Nevertheless, I would be in fact hesitant to
recommend this strategy, because it has potential in causing the adverse political
actions, especially in the case of STN. If the situation allows that the plan be considered,
I would recommend that it is implemented some time after the participation is spread
to a substantial degree, by which the social acceptance level toward the STN would have
been much higher than the current level.

48
Table 13: Planning of the low switching cost strategy
Current situation
Suggestion
Low budget High budget
Details
Issuance fee is charged for the IC card ⤏ No fee (determined as of March 2012)
Same as the case of low budget
The IC card can be issued at the designated counter of local government offices only
⤏ Establish more options for the IC card registration such as:
each individual goes through a certain ID confirmation process by making phone calls or using the internet and obtain the card in the mail
Same as the case of low budget
IC card reader needs to be purchased individually (priced at around 2000 JPY or above) in order to use My Portal
⤏
For a limited period (first 1 or 2 years), provide one reader per household at free of charge upon request (Individuals make a request by making phone call or submitting request online and the readers are delivered to each household)
Develop a new electronic ID system, so that the IC card is no longer required for carrying the electronic ID.
The electronic ID (for individual use) is charged at the minimum of 500 JPY/3 years
⤏
Provide it at no charge for a limited period of time (first few years)
On My Portal, evaluate the available functions and services based on the importance of ID verification, and for services requiring relatively low level ID verification, make them accessible if correct ID and password information are obtained.
Same as the case of low budget except that provide the ID for individual use at no charge permanently
The electronic ID (for individual use) can be issued on IC card at the designated counter of local government offices only
⤏
Make it a standard that the first IC card comes with the electronic ID (the registration process would include the necessary processes required for the electronic ID), so that it is not necessary to visit another counter just for the e-ID
Develop a new electronic ID system, through which the ID can be downloaded on PC or mobile phones
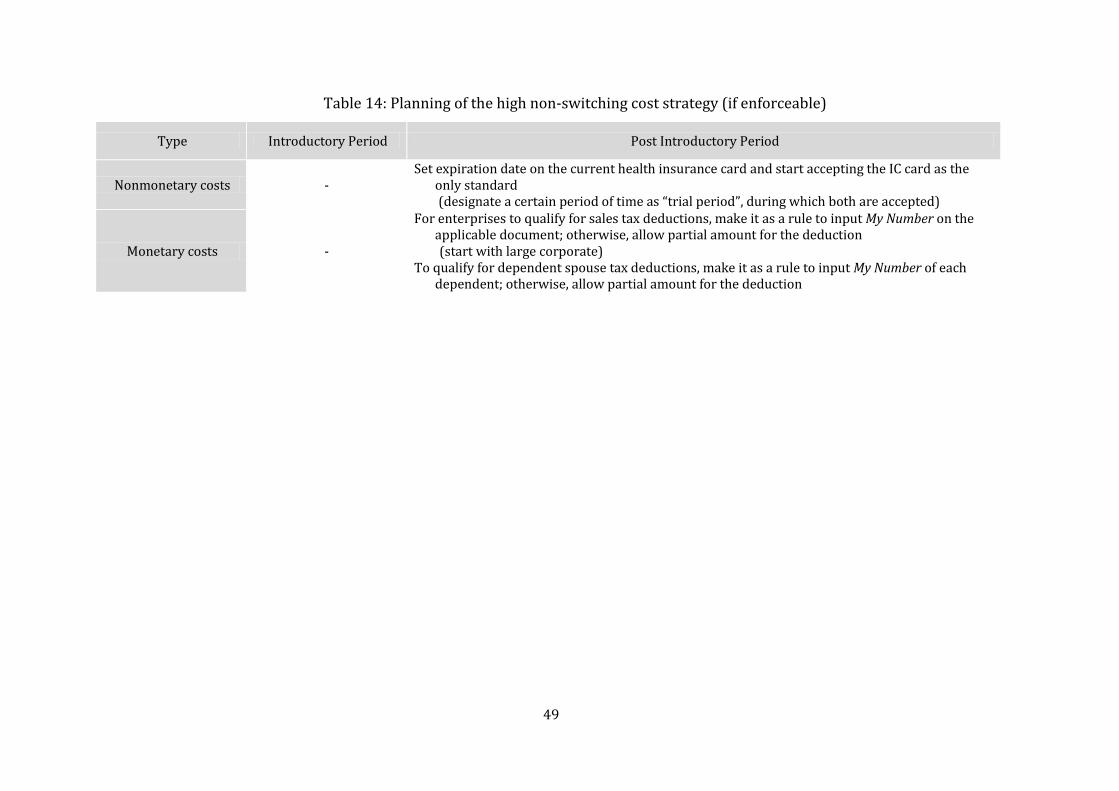
49
Table 14: Planning of the high non-switching cost strategy (if enforceable)
Type Introductory Period Post Introductory Period
Nonmonetary costs - Set expiration date on the current health insurance card and start accepting the IC card as the
only standard (designate a certain period of time as “trial period”, during which both are accepted)
Monetary costs -
For enterprises to qualify for sales tax deductions, make it as a rule to input My Number on the applicable document; otherwise, allow partial amount for the deduction (start with large corporate)
To qualify for dependent spouse tax deductions, make it as a rule to input My Number of each dependent; otherwise, allow partial amount for the deduction

50
Targeting (achieving critical mass)
The targeting strategy involves identifying the groups of potential participants with
high demand for the policy, and it is significant not only in the sense that the
participation level goes up by acquiring marginal participants, but also in the idea that
the absolute size of the participation level in the introductory period would determine
whether or not critical mass would be achieved at the macro level.
With this idea in mind, I have designated three groups as the target for
marketing STN: they are (i) e-Tax users, (ii) social security service beneficiaries, and (iii)
employment income earners and corporations.
First of all, there are two reasons that e-Tax users are chosen as target: the first
reason is that they are facing significantly lower switching costs compared to others
because they have already made investments in all the procedures and tools required
for using online service counters. And secondly, the fact that they are exhibiting demand
for e-Tax service implies that they would also have high willingness to pay for other
online tools. And in fact, the services provided by e-Tax will be transferred to My Portal;
hence it is no exaggeration to expect that the users of e-Tax may continue to use the
same service provided by My Portal. According to the demographic breakdown of the e-
Tax users (Table 15), it is found that females in 20s and 30s and males in 60s (60.5% of
the entire users) are particularly taking a large share of the user group.
Table 15: Target group 1 – e-Tax users
Targets
e-Tax users
Female in 20s and 30s (41.1% among all e-Tax users*)
Male in 60s (19.4% among all e-Tax users*)
Others
Total 15.8% of those who filed for final income tax return*
(about 5.6% of the population**)
* Based on Rakuten Research Survey (2010) ** Calculated based on the data provided by National Institute of Population and Social
Security Research of Japan (2012) and National Tax Agency of Japan (2010)

51
Next, those with high demand for social security services are designated as target
for the following reasons. The benefits offered by STN are earned when one is carrying
out administrative procedures, and therefore, those who need to visit the government
office counters more often to receive the social security services are more likely to
capitalize on the benefits provided by STN (This can also mean that people who do not
need to visit the courters often may be indifferent about the services provided by STN).
In addition, the fact that people in this group are the major beneficiaries of the services
provided by the government implies that they may exhibit a high level of individual
compliance towards the directives of the government. Table 16 shows the beneficiaries
of the social security services, largely divided into the group of females in 30s and 40s
(child-caring mothers) and the group of seniors. Since the target demographic accounts
for about 44.2 percent of the population, designing a good strategy to acquire sufficient
participants from these groups is expected to contribute largely to achieving critical
mass.
Table 16: Target group 2 – Beneficiaries of the social security services
Targets
30s ~ 40s 60s ~ 70s or above
Male Male
Female Female
Total 17.3 million*
(13.5% of the population)
39.3 million*
(30.7% of the population)
Notes Active users of child-care services
provided by the social security system Active users of senior care services
provided by the social security system
* Calculated based on data provided by National Institute of Population and Social Security Research of Japan (2012)
Lastly, employment income earners and corporations are selected as target for
the following reasons: Being categorized as tax payers, they are potential consumers of
the online tax services offered by STN. And since they are both subject to the wage
withholding tax system regulations, it is expected that they will exhibit higher level of
compliance to STN than others, at least up to Behavior 2.

52
Table 17: Target group 3 – Employment income earners and corporations
Targets
Individual Corporation
Employment income earners Corporation with capital of 100 million JPY or above
Others
Corporation with capital of between 10 million and 100 million JPY
Corporation with capital of less than 10 million JPY
Total 45.5 million*
(35.5% of the population) 1.1 million**
(39.7% of the population)
Notes Parties subject to the wage withholding tax system regulations
* National Institute of Population and Social Security Research of Japan (2012) ** National Tax Agency of Japan (2010)
53
Increasing benefits
The plans for the benefit strategy I will introduce are composed of three primary
elements: increasing monetary benefits, increasing nonmonetary benefits, and reducing
benefits for nonparticipants (see Table 18).
The plans corresponding to monetary benefits, which I have previously termed
as “high introductory benefit strategy”, involves running incentive systems, such as tax
deductions, fee waivers, health insurance subsidies, and lottery system, for a designated
period. The point of this strategy is to abolish the whole plans or gradually reduce the
size of the benefits after the participation rate has reaches a sufficiently high level.
Improving nonmonetary benefits, the second component of this strategy, is the
part that requires steady and continuous efforts from the policymakers of STN. During
the introductory period, it is recommend that improvements are made in the areas of
process speed, service hours, payment options, and printing services. In particular, I
would like to stress the importance of advancing the services in terms of payment
options and printing service, because such advancement will allow the administrative
procedure to be completed at the point of the initial access, boosting the quality of the
online platform service to a level that is nearly identical to the services provided at the
actual office counters. And for the later period, I would like to suggest introducing the
electronic transfer system of supplementary documents and developing the mobile
version of My Portal, which would allow exceedingly higher level of convenience and
mobility. The details are explained in Table 18.
Lastly, I have suggested a few plans for reducing benefits of nonparticipants, as
shown in Table 18, but as I have mentioned in the previous section, such plans may
require thorough evaluation of the current level of social acceptance and extra prudence
and consideration in implementation, because implementing plans that are
disadvantageous to nonparticipants are politically risky, particularly in the case of STN.
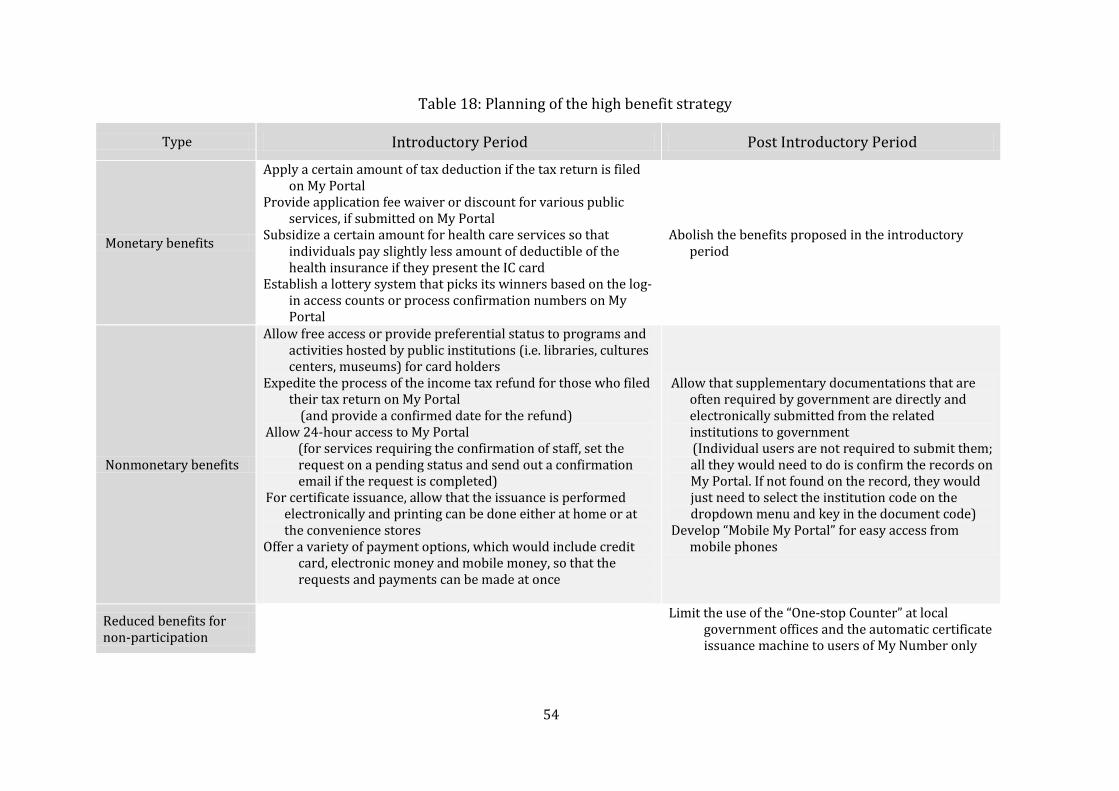
54
Table 18: Planning of the high benefit strategy
Type Introductory Period Post Introductory Period
Monetary benefits
Apply a certain amount of tax deduction if the tax return is filed on My Portal
Provide application fee waiver or discount for various public services, if submitted on My Portal
Subsidize a certain amount for health care services so that individuals pay slightly less amount of deductible of the health insurance if they present the IC card
Establish a lottery system that picks its winners based on the log-in access counts or process confirmation numbers on My Portal
Abolish the benefits proposed in the introductory period
Nonmonetary benefits
Allow free access or provide preferential status to programs and activities hosted by public institutions (i.e. libraries, cultures centers, museums) for card holders
Expedite the process of the income tax refund for those who filed their tax return on My Portal
(and provide a confirmed date for the refund) Allow 24-hour access to My Portal (for services requiring the confirmation of staff, set the
request on a pending status and send out a confirmation email if the request is completed)
For certificate issuance, allow that the issuance is performed electronically and printing can be done either at home or at the convenience stores
Offer a variety of payment options, which would include credit card, electronic money and mobile money, so that the requests and payments can be made at once
Allow that supplementary documentations that are often required by government are directly and electronically submitted from the related institutions to government
(Individual users are not required to submit them; all they would need to do is confirm the records on My Portal. If not found on the record, they would just need to select the institution code on the dropdown menu and key in the document code)
Develop “Mobile My Portal” for easy access from mobile phones
Reduced benefits for non-participation
Limit the use of the “One-stop Counter” at local
government offices and the automatic certificate issuance machine to users of My Number only

55
Increasing acceptance level (branding)
The plans for the brand attitude strategy consist of two main components: one is to
attach a positive image to the behavior of participating in STN and the other is to attach
a negative image to the behavior of “not” participating in STN.
The plans in the first category involve enhancing or creating images that are
linked to the major strengths possessed by STN. To name a few, the strengths may be
described with the words such as “convenient”, “handy”, and “easy access”. And since
My Portal is the only tool that allows citizens to autonomously manage and control their
account of the social security, tax, and disaster mitigation, the image of being “smart” or
“safe” can also be included. Together with the images mentioned above, it would be
important to send a message that many people are (will be) participating in STN since it
would stimulate the tendency to follow the behavior spread among the people (this
corresponds to the strategy of “increasing expectation level of participation rate”
mentioned in the previous chapters).
While designating the plans of positive brand image strategy as the prior
assignments, working on plans that would attach a negative image to nonparticipation
behavior may magnify the effects to include the broader public. The messages to be sent
need to mainly emphasize that the values earned by participating in STN will not be
delivered if one does not participate. And attaching the image of being “old” to
nonparticipation can help people consider that the system without the use of My
Number is no longer current. The details of the plans are explained in Table 19.

56
Table 19: Planning of the branding strategy
Plans
Details Type
Attach a positive image to participating in STN
Create new image “something close and near”, “quick and handy”, “smart”, “in latest trend”, “safe”
Naming “My Card” or “Ma I Ka” for IC card
Message to be sent Send a message that the public services have come into a form that is near and handy “Your smart lifestyle partner, My Number”
Attach a negative image to not participating in STN
Create new image “old”, “time consuming”, “not being smart”, “left behind the trend”
Naming “the former system”
Message to be sent
“Without the use of My Portal, the registration process will take much longer and I would be wasting my time”
“It is difficult to find out what services are readily available to me, without the use of My Portal”
“Many people have started using My Number already”

57
6. Concluding Thoughts
According to a recent article by the Ibaraki-Shimbun (2012), the penetration rate of
Juki-Card in Koga City reached 21.8% as of June 2012, while the average of Ibaraki
Prefecture was at 4.3%, and the national average at around 5%. Koga City explained
that the high penetration was due to their efforts in employing various small methods
that can lead to increased convenience. The very purpose and scale of Juki Card System
and STN may be different but I believe this case highlights the implication that making
sufficient efforts to meet the needs of a sufficient number of citizens using the available
tools can make a difference in the penetration level of a policy and indeed reinforces the
reliance of the recommendations presented in this report. And the reason that those
extra efforts to promote the policy become necessary is because no matter how the
policy per se is viable and beneficial for many, as quoted by Rohlfs (1979: 33), it will not
acquire users by itself without sufficient amount of start-up costs being paid until it
becomes self-sufficient.

58
REFERENCES
Bond, R. and Smith, P. (1996) 'Culture and Conformity: A Meta-Analysis of Studies Using Asch’s (1952b, 1956) Line Judgment Task'. Psychological Bulletin Vol. 119 No. 1 1996, 111-137 available from <http://www.radford.edu/~jaspelme/_private/gradsoc_articles/individualism_collectivism/conformity%20and%20culture.pdf>
Bowe, R. (2012) 'In Japan, National ID Proposal Spurs Privacy Concerns'. Electronic Frontier Foundation 13 June 2012 available from <https://www.eff.org/deeplinks/2012/06/japan-national-id-proposal-spurs-privacy-concerns>
Cabinet Secretariat of Japan (2011) ‘Implementation Schedule for the Social Security and Tax Number System’. Cabinet Secretariat of Japan [official homepage] available from <http://www.cas.go.jp/jp/seisaku/bangoseido/dai14/siryou3.pdf>
Cabinet Secretariat of Japan (2011) 'Survey on the Social Security and Tax Number System'. Cabinet Secretariat of Japan [official homepage] available from <http://www8.cao.go.jp/survey/index.html>
Cabinet Office of Japan (2009) 'Survey on COOL BIZ'. Cabinet Secretariat of Japan [official homepage] 9 July 2009 available from <http://www8.cao.go.jp/survey/tokubetu/h21/h21-cool.pdf>
Dower, J. (2012) 'The Myth of Change-Resistant Japan'. Japan Policy Research Institute Occasional Paper No. 39 May 2012 available from <http://www.jpri.org/publications/occasionalpapers/op39.html>
Harada, Y. (2011) 'Three Factors that determined Success and Failure: 'Shou Ene Look [in Japanese]' and 'COOL BIZ''. Makoto Blog - Business Media Makoto 21 July 2011 availble from <http://blogs.bizmakoto.jp/harada6stars/entry/2996.html>
Hofstede, G., Hofstede, G., and Minkov, M. (2010) Cultures and Organizations: Software of the Mind. Revised and Expanded 3rd Edition. New York: McGraw-Hill
Hofstede, G. (2001) Culture’s Consequences: Comparing Values, Behaviors, Institutions, and Organizations Across Nations. 2nd Edition. Thousand Oaks CA: Sage Publications
Japanese Chain Store Association (2012) 'Our Endeavors to Solve Environmental Issues [in Japanese]'. Japanese Chain Store Association [official homepage]. available from <http://www.jcsa.gr.jp/topics/environment/circulating.html>
Kahneman, D. and Tversky, A. (1979) 'Prospect Theory: An Analysis of Decision under Risk'. Econometrica 47 (2) March 1979, 263-291 available from <http://www.princeton.edu/~kahneman/docs/Publications/prospect_theory.pdf>
Kitamura, M. (2005) 'Strategic Policy Promotions in the Public Sector [in Japanese]'. NRI Public Management Review Vol. 29 December 2005 Nomura Research Institute available from <http://www.nri.co.jp/opinion/region/2005/pdf/ck20051202.pdf>
Knetsch, J. (2010) 'Values of Gains and Losses: Reference States and Choices of Measure'. Environmental and Resource Economics. 46 (2), 179-188
Knetsch, J. (2005) 'Gains, Losses, and the US-EPA Economic Analysis Guidelines: A Hazardous Product?'. Environmental and Resource Economics 32 (1), 91-112
Kotabe, M. and Helsen, K. (2010) Global Marketing Management. 5th Edition. New York: John Wiley & Sons Inc.
Lee, H. (2013) Policy Marketing Strategies: a Theoretical Framework and an Application to "the Social Security and Tax Number System" in Japan. Unpublished thesis. Tokyo: Hitotsubashi University

59
Lee, H. and Watanabe, S. (2013) 'e-Tax Invoice System of Korea [in Japanese]'. Zeimu Kouhou Vol. 61 No. 2 February 2013, 125-134
Lee, H. and Watanabe, S. (2012) 'Cash Receipt System of Korea [in Japanese]'. Zeimu Kouhou Vol. 60 No. 6 June 2012, 153-160
Lee, K. Shin, T. and Kim, H. (2012) About e-Tax Invoice System. [interview by H. Lee and S. Watanabe] 17 September 2012
Lewis, A. (2008) The Cambridge Handbook of Psychology and Economic Behaviour. p. 43. Cambridge: Cambridge Press
Machida City (2010) Survey on Counter Service [in Japanese]. Machida City [official homepage] available from <http://www.city.machida.tokyo.jp/shisei/gyousei/enq.files/2009counterservice_research.2010counterresearch_report.pdf>
Ministry of Internal Affairs and Communications of Japan (2012) 'Data of Administrative Procedures Performed Online as of 2010 [in Japanese]'. Ministry of Internal Affairs and Communications of Japan [official homepage] 21 March 2012 available from <http://www.soumu.go.jp/menu_news/s-news/01gyokan05_02000018.html>
Ministry of the Environment of Japan (2012) 'Plastic Bag Reduction Campaign Is in Action [in Japanese]'. Ministry of the Environment of Japan [official homepage] available from <http://www.env.go.jp/recycle/info/stop_ya/>
Ministry of the Environment of Japan (2007) 'Survey on Plastic Bag Usage and Package Material Recylcle System [in Japanese]'. Ministry of the Environment of Japan [official homepage] available from <http://www.env.go.jp/press/file_view.php?serial=9684&hou_id=8423>
Ministry of the Environment of Japan (2006) 'Guide for Team Minus 6 Project Action Plan Competition 2006 [in Japanese]'. Ministry of the Environment of Japan [official homepage] available from <http://www.env.go.jp/earth/info/kokumin18/annex2.html>
Morinobu, S. and Kobayashi, Y. (2011) The Social Security and Tax Number System in Japan [in Japanese]. Tokyo: Nikkei Publishing Inc.
National Institute of Population and Social Security Research of Japan (2012) 'Population Statistics in Japan as of 2010 [in Japanese]'. National Institute of Population and Social Security Research of Japan[official homepage] available from <http://www.ipss.go.jp/syoushika/tohkei/Popular/Popular2012.asp?chap=0>
National Tax Agency of Japan (2010) The 136th National Tax Agency Annual Statistics Report [in Japanese]. available from <http://www.nta.go.jp/kohyo/tokei/kokuzeicho/h22/h22.pdf>
National Tax Service of Korea (2012) About Cash Receipt System and e-Tax Invoice System [in Korean]. [supplementary handout for interview] September 2012
National Tax Agency of Japan (2011) 'Data of e-Tax Usage as of 2011 [in Japanese]'. National Tax Agency of Japan [official homepage] April 2012 available from <http://www.e-tax.nta.go.jp/topics/23pressrelease.pdf>
Press Net Japan (2005) 'Tokyo Electric Power Company Calculated Estimates of Power Savings by COOL BIZ [in Japanese]'. Press Net Japan [online] 8 September 2005 available from <http://www.47news.jp/CN/200509/CN2005090801003400.html>
Rakuten Research Institute (2010) Survey on Tax Return Filing [in Japanese]. 22 February 2010 available from <http://research.rakuten.co.jp/report/20100222>
Robinson, L. and Hammitt, J. (2011) 'Behavioral Economics and the Conduct of Benefit-Cost Analysis: Towards Principles and Standards'. Journal of Benefit-Cost Analysis

60
Vol. 2 Iss. 2 Article 5. available from <http://www.regulatory-analysis.com/robinson-hammitt-BE-and-BCA.pdf>
Rogers, E. (2003) Diffusions of Innovations. 5th Edition. New York: FREE PRESS Rohlfs, J. (1974) 'A Theory of Interdependent Demand for a Communications Service'.
Bell Journal of Economics and Management Science Spring 1974, p. 16 available from <http://www.stern.nyu.edu/networks/phdcourse/Rohlfs_A_theory_of_interdependent_demand.pdf>
Tamura, T. (2004) 'Japanese Feeling for Privacy'. MANUSYA: Journal of Humanities Special Issue No. 8 2004, 121-139 available from <http://www.manusya.journals.chula.ac.th/files/essay/Tamura_p121-139.pdf>
The Ibaraki-Shimbun (2012) 'Penetration rate of Juki Card in Koga City Reaches 21% [in Japanese]'. The Ibaraki-Shimbun [online] 20 August 2012 available from <http://ibarakinews.jp/news/news.php?f_jun=13453854652938>
Tokyo Metropolitan Television Broadcasting Corporation (2010) 'Penetration level of 'My Bag' in Suginami-ku [in Japanese]'. Tokyo MX News [online] 13 January 2010 available from <http://www.mxtv.co.jp/mxnews/news/201001138.html>
Westerman, J., Beekun, R., Stedham, Y., and Yamamura, J. (2007) 'Peers Versus National Culture: An Analysis of Antecedents to Ethical Decision-making'. Journal of Business Ethics Vol. 75 No. 3 October 2007, 239-252 available from <http://www.business.unr.edu/faculty/beekun/Westerman,%20Beekun,%20Stedham%20&%20Yamamura.pdf>
Yasuda, Y. and Marumo, N. (2008) 'A Measurement and Evaluation of 'My Bag' Carrying Behavior of Consumers at Retailers Charging Money for Plastic Bags [in Japanese]'. Kanto-Gakuin University Institutional Repository Annual Report: 30, March 2008, 112-132
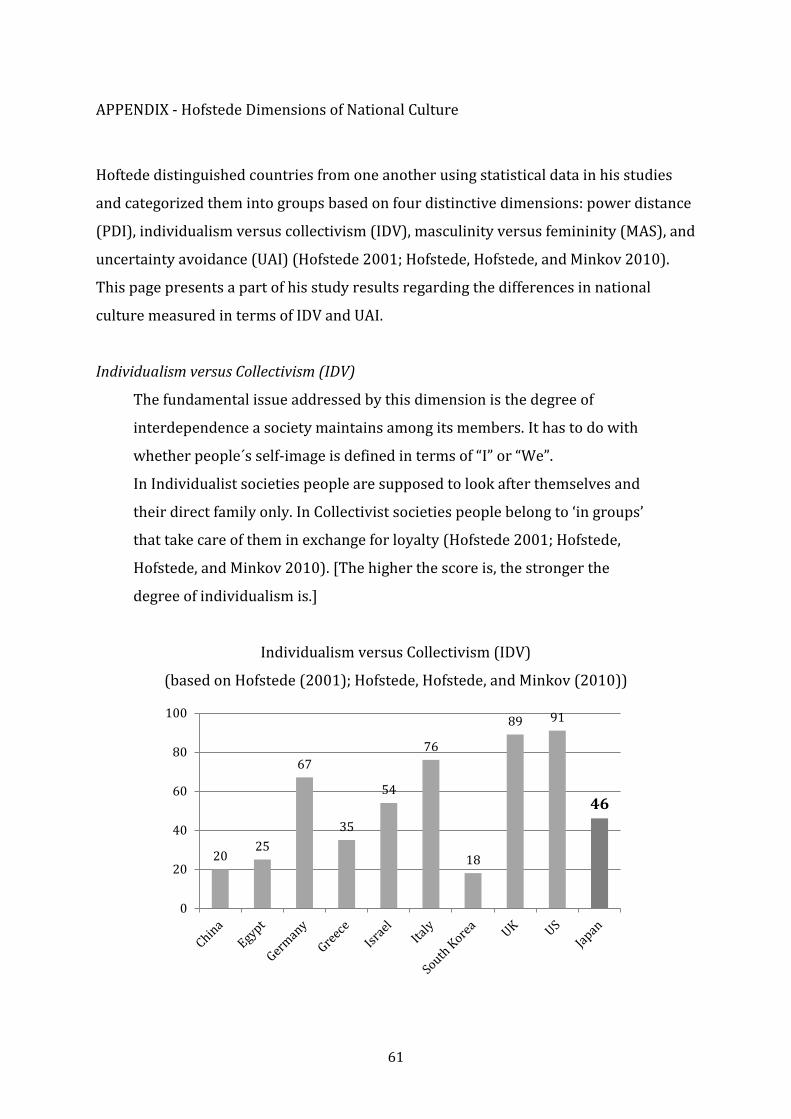
61
APPENDIX - Hofstede Dimensions of National Culture
Hoftede distinguished countries from one another using statistical data in his studies
and categorized them into groups based on four distinctive dimensions: power distance
(PDI), individualism versus collectivism (IDV), masculinity versus femininity (MAS), and
uncertainty avoidance (UAI) (Hofstede 2001; Hofstede, Hofstede, and Minkov 2010).
This page presents a part of his study results regarding the differences in national
culture measured in terms of IDV and UAI.
Individualism versus Collectivism (IDV)
The fundamental issue addressed by this dimension is the degree of
interdependence a society maintains among its members. It has to do with
whether people´s self-image is defined in terms of “I” or “We”.
In Individualist societies people are supposed to look after themselves and
their direct family only. In Collectivist societies people belong to ‘in groups’
that take care of them in exchange for loyalty (Hofstede 2001; Hofstede,
Hofstede, and Minkov 2010). [The higher the score is, the stronger the
degree of individualism is.]
Individualism versus Collectivism (IDV)
(based on Hofstede (2001); Hofstede, Hofstede, and Minkov (2010))
20 25
67
35
54
76
18
89 91
46
0
20
40
60
80
100

62
Uncertainty Avoidance (UAI)
The dimension Uncertainty Avoidance has to do with the way that a society
deals with the fact that the future can never be known: should we try to
control the future or just let it happen? This ambiguity brings with it anxiety
and different cultures have learnt to deal with this anxiety in different
ways. The extent to which the members of a culture feel threatened by
ambiguous or unknown situations and have created beliefs and institutions
that try to avoid these is reflected in the UAI score (Hofstede 2001; Hofstede,
Hofstede, and Minkov 2010). [The higher the score is, the stronger the
degree of uncertainty avoidance is.]
Uncertainty Avoidance (UAI)
(based on Hofstede (2001); Hofstede, Hofstede, and Minkov (2010))
30
80
65
112
81 75
85
35
46
92
0
20
40
60
80
100
120