lesson 4 - why do people move? · or education. some of these moves ... and what influences people...
TRANSCRIPT
OVERVIEW
In this lesson, the students learn that costs and benefits influence people’s decisions about moving. The students review U.S. Census data to discuss possible reasons why people move. They analyze the costs and benefits of moving. They are introduced to the geographic terms push and pull factors of migration. Working in groups, the students read about a family that chooses to migrate to another country. The students identify costs and benefits for the family and then determine whether push or pull factors had the greatest influence. Finally, the students look at some current data about migration to the United States.
Geography: Geographers study the forces behind the movement of people from one loca-tion to another. Some moves are voluntary, involving the search for a higher standard of living or elevation of status through jobs or education. Some of these moves are invol-untary, caused by war, natural disasters and economic or political upheaval. Geographic lit-eracy requires the students to understand the push and pull factors that lead to migration and what influences people to migrate from one place to another.
Economics: Because of unlimited wants and limited resources, people must make decisions. Economists study the factors that influence the decisions people make. By studying the costs and benefits of alternatives people have, econo-mists hope to better understand the decision-making process. As with any decision, people analyze the costs and benefits of alternatives before making a decision to migrate.
CONCEPTS
Geography Migration Immigrants Pull Factors Push Factors
Economics Costs Benefits Decision making
CONTENT STANDARDS
Geography 9. The characteristics, distribution and
migration of human populations on Earth's surface
12. The process, patterns and functions of human settlement
13. How forces of cooperation and conflict among people influence the division and control of Earth's surface
Economics 2. Marginal Cost/Marginal Benefit: Effective
decision making requires comparing the additional costs of alternatives with the additional benefits.
4. Role of Incentives: People respond predict-ably to positive and negative incentives.
OBJECTIVES
The students will:1. Read census tables and graphs to obtain
information and draw conclusions.
2. Define costs and benefits, and identify the costs and benefits that influence people’s decisions to migrate.
MIDDLE SCHOOL WORLD GEOGRAPHY: FOCUS ON ECONOMICS, © NATIONAL COUNCIL ON ECONOMIC EDUCATION, NEW YORK, N.Y. 61
Lesson 4 - Why Do People Move?
3. Define push and pull factors for migration, and identify examples.
TIME REQUIRED
60 minutes
MATERIALS
1. Visuals 4.1 and 4.2 (NOTE: Visual 4.2 and Activity 4.3 are the same.)
2. Activity 4.1 cut apart to provide a card for each group
3. One copy of Activity 4.2 for each group
4. One copy of Activities 4.3, 4.4 and 4.5 for each student
PROCEDURE
1. Ask the students to raise their hand if they have ever moved. Ask for volunteers to share the distance or number of times they have moved. Share a personal mov-ing story if the students do not volunteer enough examples. Tell the students that in this lesson, they will analyze why people move.
2. Display Visual 4.1. Draw attention to
Figure 1. If the students have reported recent moves, ask them to select the cat-egory they think they fall into. Answers will vary from same county, different county same state, different state and movers from abroad. Point out that more than half the moves are within the same county. Have the students specu-late why most people move within the same county. Answers will vary; most may move for better housing, schools, employment or similar reasons.
3. Direct the students to look at Figure 2.
Discuss the following questions: A. Which age group moves the most,
according to this chart? Ages 20 to 24 B. Why do you think this group moves
the most? Answers should reflect that
this age group usually has the most life-changing events such as gradu-ation, new job, marriage, childbirth, fewer family or job ties to a location.
C. Why do you think the oldest group, 85+, has such a low rate for moving? Answers will vary and include more ties to the community, family and friends that might make moves more difficult; less income since this age group is likely to be retired; usually space needs are decreasing rather than increasing; health issues.
4. Direct the students to Figure 3. Have the students locate the region in the United States where they live. Point out that migration is the act of moving from one place to another with the intent of staying permanently or for a relatively long period of time, and people who move into an area are called immigrants.
5. Tell the students to use Figure 3 to deter-mine where most new immigrants to their region came from and then discuss Questions A and B. The highest number of migrants moving into Northeastern, Midwestern and Western states came from Southern states. The highest number of migrants moving into the South came from the Midwest.
A. Have you met anyone who recently moved from one of these regions? Answers will vary.
B. Why did the person or family move here? Answers will vary.
6. Explain that benefits and costs influence the decisions people make. Benefits are the advantages of a particular course of action as measured by good feelings, dol-lars or number of items. Costs are the dis-advantages of a particular course of action as measured by bad feelings, dollars or numbers of items. Point out that costs and benefits may be different for different peo-ple. Use the following scenario to clarify the meaning of costs and benefits:
Suppose you are deciding what to do
LESSON 4 - WHY DO PEOPLE MOVE?
MIDDLE SCHOOL WORLD GEOGRAPHY: FOCUS ON ECONOMICS, © NATIONAL COUNCIL ON ECONOMIC EDUCATION, NEW YORK, N.Y.62
with three hours of after-school time. You could spend this time listening to music or baby-sitting for a neighbor. The neighbor will pay $4.00 an hour and really needs your help because she must visit a sick family member. However, her children are unruly and sometimes don’t listen to you when you stay with them.
7. Make two columns on the board, with “Costs” at the top of one and “Benefits” at the top of the other. Ask the students to identify the costs and benefits from the scenario. Write each in the appropri-ate column, and discuss the students' answers. Answers will vary and include the desire for extra money and good feelings as benefits and unruly children and the low wage as costs.
NOTE: The students may disagree about costs and benefits. Some may say that taking care of small children is a ben-efit because they really enjoy being with young children. Others may say it is a cost because they consider it hard work. If there is disagreement, tell the students that costs and benefits may differ because of different values, likes and dislikes.
8. Ask how many of the students might be
willing to baby-sit and why. Answers will vary. Explain that different students will respond differently to these costs and benefits, based on their financial needs or their enjoyment from spending after-school time baby-sitting.
9. Tell the students that they are going to apply the concepts of costs and benefits to the examples they have been looking at for region-to-region migrations.
10. As a class, brainstorm a list of costs and benefits that would influence people’s decisions to move from one area to another. Answers will vary. Benefits may include new or better job, bet-ter weather, friends currently liv-ing in the new location, lower taxes, beautiful environment, recreational
opportunities. Costs may include the expense of moving, climate, lack of jobs, crowded conditions, high taxes. Remind the students that what consti-tutes a cost or benefit differs depending on the values, likes and dislikes of different people. Cold weather might be a benefit for a skier and a cost for an elderly couple.
11. Explain that many factors influence people’s decisions to migrate voluntarily. Discuss the following:
• People who earn lower wages are more likely to migrate if they believe they will earn higher wages after migrating. They perceive the future benefits as great-er than the current costs.
• People who earn higher wages and live in countries with very high tax rates are more likely to migrate to reduce their tax burden. They perceive the future ben-efits as greater than the current costs.
• People who speak the language of the country to which they migrate are more likely to migrate because their current costs (learning a new language) are lower.
• People who are able to move to coun-tries where they have friends or family – or where there is a large community of others from their home country – are more likely to migrate because they have lower current costs.
• Younger people are more likely to migrate because the future benefits are greater: They will have a better job, more income and better living conditions for a longer period of time than people who migrate when they are older.
• People who value future income more than current income are more likely to migrate. They place greater value on future benefits than on current costs.
• People who are less adverse to risk are more likely to migrate.
Point out that in cases such as war, fam-ine and genocide, a great number of people will likely move. Migration is no longer voluntary.
WHY DO PEOPLE MOVE? - LESSON 4
MIDDLE SCHOOL WORLD GEOGRAPHY: FOCUS ON ECONOMICS, © NATIONAL COUNCIL ON ECONOMIC EDUCATION, NEW YORK, N.Y. 63
12. Tell the students that geographers study migration, or moving patterns of groups of people, to discover why people have moved. Local officials can use this infor-mation to plan for increases or decreases in population to various areas so they can provide services, housing, job training or tax incentives to the new migrant groups.
13. Explain that geographers group reasons for migration into two categories: push factors that drive people to move away from an area and pull factors that draw people to a certain location. Ask the stu-dents for examples of pull factors (nice weather, location of relatives) and push factors (closing of factory, drought) to make sure they understand the differences among push factors, pull factors, costs and benefits. Discuss the following:
A. What are benefits? Benefits are the advantages of a particular course of action as measured by good feelings, dollars or number of items.
B. What are costs? Costs are the dis-advantages of a particular course of action as measured by bad feelings, dollars or numbers of items.
C. Are push factors costs or benefits? Why? Costs, because they are disad-vantages of a location that would drive people to move away
(NOTE: Make sure the students under-stand that the costs of moving to a new location are not push factors; for example, having to learn a new language when you move to a new country is a cost of moving, but it isn’t a push factor because it isn’t a disadvantage of your original location that drove you to move away.)
D. Are pull factors costs or benefits? Why? Benefits, because they are advantages that would draw people to move to a particular location.
(NOTE: Make sure the students under-stand that the benefits of staying in a location are not pull factors: Not chang-ing schools is a benefit of staying in your neighborhood; it isn’t an advantage that would draw you to a new location.)
14. Tell the students that in 2002 the United Nations estimated that around 175 million people, or about 3 percent of the world’s population, resided in a country different from their country of birth. Explain that the students will work in groups to learn more about reasons for migration. Divide the students into six groups. Distribute one card from Activity 4.1 and a copy of Activity 4.2 to each group. Review the directions for Part 1 with the class.
15. Draw two columns on the board. Label one column “Push Factors for Migration” and the other “Pull Factors for Migration.” Have the students read their cards and complete Part 1 of Activity 4.2. When the groups are finished, have them share their information with the rest of the class. As the groups share, record examples of push and pull factors in the appropriate col-umns on the board. Remind the students that push factors are costs because they represent disadvantages of staying in the current location and pull factors are ben-efits because they represent advantages of moving to a new location. Push factors: Andre, persecution; Thomas, short-age of land; Alejandro, revolution; Nguyen, war; Naomi, persecution; Yuri, shortage of food and jobs. Pull factors: Andre, acceptance; Thomas, available land; Nguyen, freedom; Naomi, work, respect and education; Yuri, employment and education
16. Review the bulleted items from No. 11 on the previous page. Have the students work in the same groups as for the previous activity. Review the questions for Part 2 of Activity 4.2. Allow time for the students to finish Part 2. Have a member from each group share answers with the class.
Question A Andre: Benefits are acceptance, possi-
ble work, education for Andre, friends already there. Costs are leaving pos-sessions, family and friends; perhaps having to learn a new language and new customs; difficult travel
LESSON 4 - WHY DO PEOPLE MOVE?
MIDDLE SCHOOL WORLD GEOGRAPHY: FOCUS ON ECONOMICS, © NATIONAL COUNCIL ON ECONOMIC EDUCATION, NEW YORK, N.Y.64

Nguyen: Benefits are freedom, possi-bility of work, education for Nguyen. Costs are leaving friends and posses-sions, learning a new language, learn-ing new customs, cost of travel.
Thomas: Benefits are possibility of owing land, access to food. Costs are giving up possessions, leaving family and friends.
Naomi: Benefits are freedom, pos-sibility of work, respect, education for children, family member already there. Costs are leaving relatives and friends, learning a new language and new customs, giving up possessions
Alejandro: Benefits are safety, possi-bility of finding work. Costs are giving up possessions, learning a new lan-guage and customs.
Yuri: Benefits are possibility of work, friends already there, education for Yuri. Costs are leaving behind friends and family, transportation, possibly learning a new language, learning new customs.
Question B: Answers will vary.
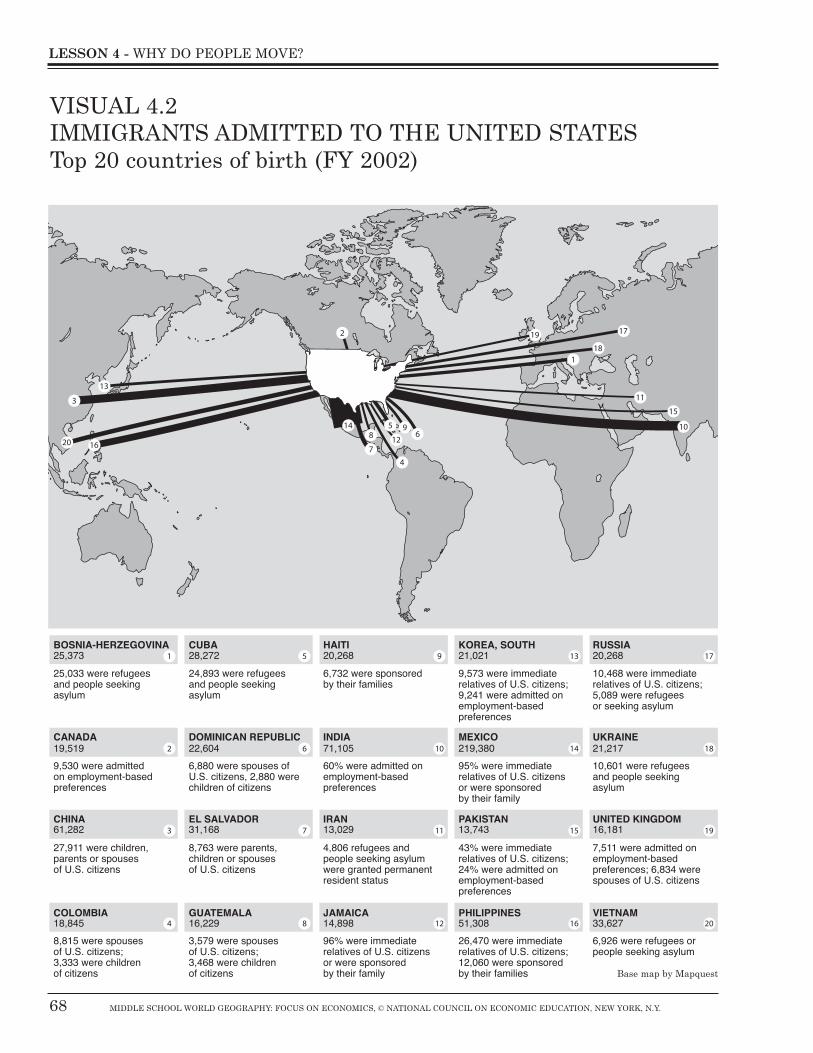
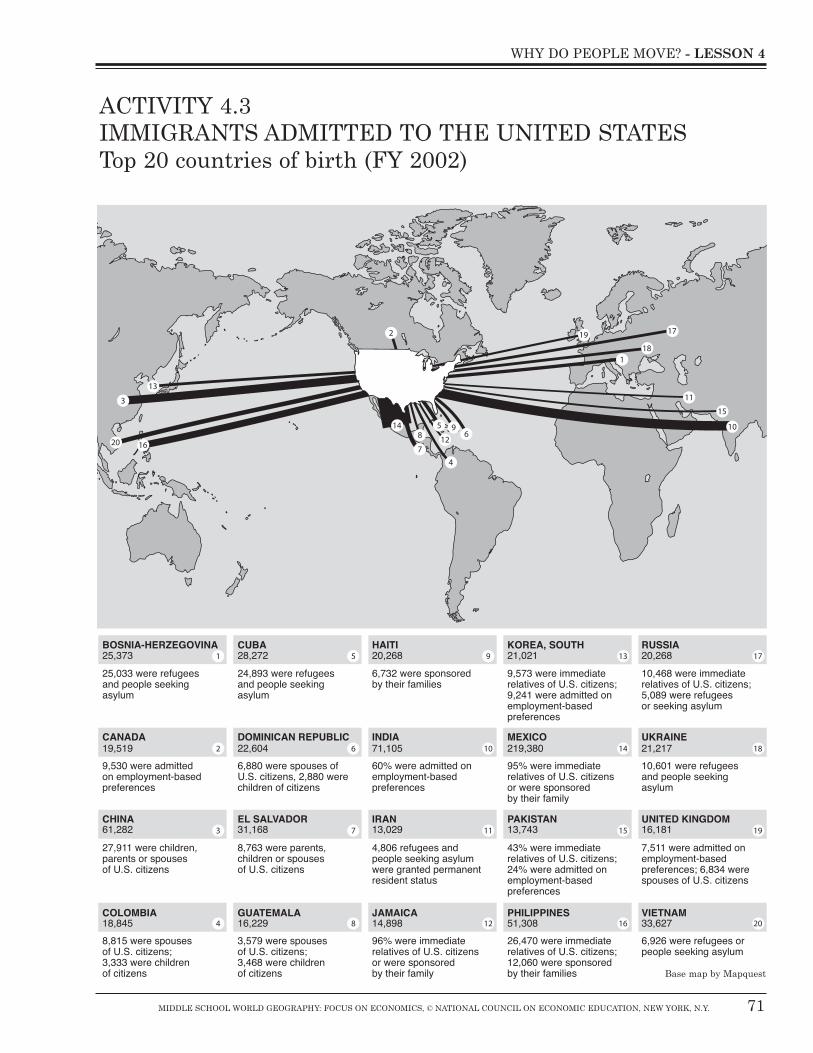
17. Display Visual 4.2 and give each student a copy of Activity 4.3. Tell the students that the immigration data were collected by the U.S. Department of Homeland Security's Office of Immigration Statistics based on the major legal-status categories available to migrants who apply to enter the United States. These categories include sponsor-ship by a relative, requests for asylum or refuge from people who want to avoid persecution in their home countries and employment-based preferences (prefer-ences given to people with skills that are in demand in the United States). Ask the students if they think these legal-status categories reflect all – or even the main – reasons why people migrate to the United States. Answers will vary, but most stu-dents will probably say no. Discuss the following questions:
A. From which country on the map did the largest number of people migrate to the United States in fiscal 2002? Mexico,
with 219,380 immigrants B. Under what legal-status category did
the majority of these people apply to enter the United States? 95% were immediate relatives of U.S. citizens or were spon-sored by their family.
C. Mexico’s per capita (per person) gross domestic product in 2003 was $9,000. Per capita GDP for the United States the same year was $37,800. Does this suggest a reason, beyond the legal-status categories, why Mexican citizens want to come to the United States? Yes, the opportunity to earn more money and have a higher standard of living is also an attraction.
D. Do you think these people migrated mainly because of push factors or pull fac-tors? Explain. Pull factors: They want-ed more income, a higher standard of living and to be with their families and relatives.
18. Give each student a copy of Activity 4.4, and, using Mexico as an example, dem-onstrate how to complete the table. Point out that the information for the first two columns comes from the map on Activity 4.3. Have the students individually or in pairs select four additional countries and complete the table, and then answer Questions B and C.
19. When the students have finished their work, allow time for them to share their answers with the class.
A. Using the map and the information on Activity 4.3, select four countries and complete the table for these countries. Answers will vary based on countries.
B. Give three examples of push factors that influence migration from one place to another. Closing of factories, drought, war
C. Give three examples of pull factors that influence migration from one place to another. Better job opportunities, relatives living in an area, education, more freedom
WHY DO PEOPLE MOVE? - LESSON 4
MIDDLE SCHOOL WORLD GEOGRAPHY: FOCUS ON ECONOMICS, © NATIONAL COUNCIL ON ECONOMIC EDUCATION, NEW YORK, N.Y. 65
LESSON 4 - WHY DO PEOPLE MOVE?
MIDDLE SCHOOL WORLD GEOGRAPHY: FOCUS ON ECONOMICS, © NATIONAL COUNCIL ON ECONOMIC EDUCATION, NEW YORK, N.Y.66
CLOSURE
20. Use the following questions to review the key points of the lesson:
A. Based on this information, what seems to be the primary reason immigrant groups come to the United States? Job or educational opportunities
B. What do you think are benefits of moving to the United States? Variety and number of job opportunities, freedom of choice of jobs, ability to move freely in the job market, variety of educa-tional opportunities, technical train-ing available at many locations, size of economy, political freedom, joining relatives, a higher standard of living
C. Would these benefits be examples of push or pull factors for migration? Why? Pull factors, because they are advan-tages that would draw people to move to the United States
D. What are costs of moving to the United States? Leaving family and friends, cost of travel, finding new housing and a new job, learning a new language
E. What are some policies that could reduce immigration to the United States? Policies that increase economic devel-opment and raise the standard of liv-ing in other countries, policies that impose limits on the number of immi-grants the United States will accept
ASSESSMENT
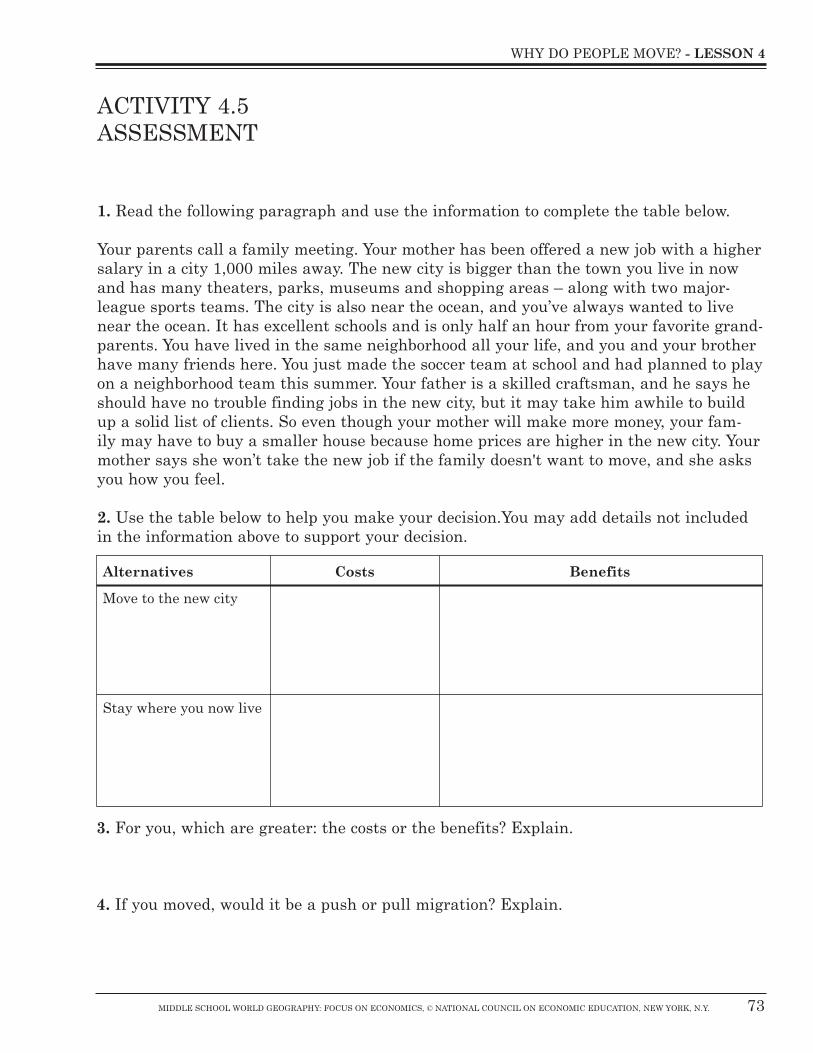
Distribute a copy of Activity 4.5 to each stu-dent. Review the instructions for the activity with the students.1, 2. Read the following paragraph and use the
information to complete the table below. . . . Use the table below to help you make
your decision.You may add details not included in the information above to sup-port your decision. Costs of moving to the new city could include losing the opportunity to play soccer at school, having to live in a smaller house and leaving friends. Benefits of moving could be living closer to grandparents, getting a better education and having access to a richer array of cultural, sports and entertainment options.
Costs of staying could include losing the opportunity to meet new friends and get a better education. It’s also possible that your mother’s career could be hurt if she doesn't take the new job. Benefits of staying could include being able to play soccer on the school team and neighborhood leagues and staying close to friends.
3. For you, which are greater: the costs or the benefits? Explain. Answers about whether costs are greater than ben-efits will vary, based on each student’s assessment of the situation.
4. If you moved, would it be a push or pull migration? Explain. Answers about whether it would be a push or pull migration will vary. Pull factors will vary and include the allure of living in a new city with new friends and new entertainment options. Push fac-tors also will vary and include lower quality schools.
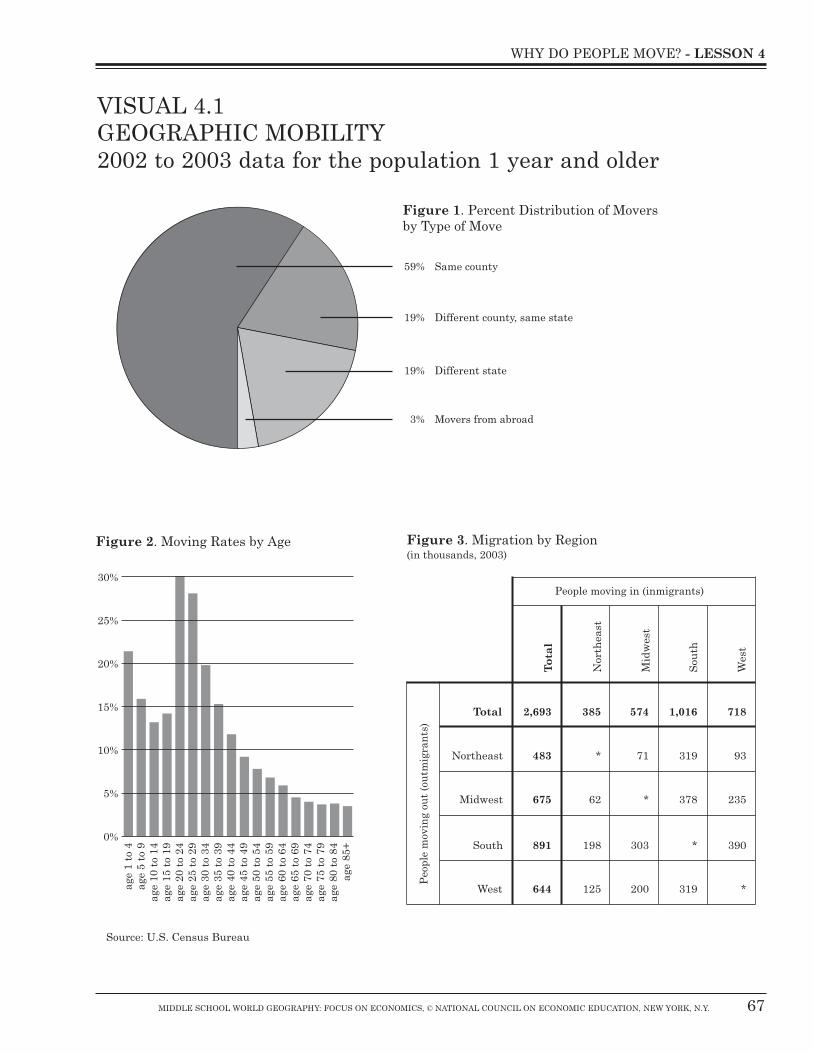
VISUAL 4.1 GEOGRAPHIC MOBILITY2002 to 2003 data for the population 1 year and older
WHY DO PEOPLE MOVE? - LESSON 4
MIDDLE SCHOOL WORLD GEOGRAPHY: FOCUS ON ECONOMICS, © NATIONAL COUNCIL ON ECONOMIC EDUCATION, NEW YORK, N.Y. 67
0%
5%
10%
15%
20%
25%
30%
age
85+
age
80 t
o 84
age
75 t
o 79
age
70 t
o 74
age
65 t
o 69
age
60 t
o 64
age
55 t
o 59
age
50 t
o 54
age
45 t
o 49
age
40 t
o 44
age
35 t
o 39
age
30 t
o 34
age
25 t
o 29
age
20 t
o 24
age
15 t
o 19
age
10 t
o 14
age
5 to
9ag
e 1
to 4
Figure 2. Moving Rates by Age
Figure 1. Percent Distribution of Movers by Type of Move
Movers from abroad
Same county
Different state
Different county, same state
3%
59%
19%
19%
People moving in (inmigrants)
Figure 3. Migration by Region (in thousands, 2003)
Peo
ple
mov
ing
out
(ou
tmig
ran
ts)
To
tal
Total
Nor
thea
st
Northeast
Mid
wes
t
Midwest
Sou
th
South
Wes
t
West
483 * 71 319 93
644 125 200 319 *
891 198 303 * 390
675 62 * 378 235
2,693 385 574 1,016 718
Source: U.S. Census Bureau
LESSON 4 - WHY DO PEOPLE MOVE?
MIDDLE SCHOOL WORLD GEOGRAPHY: FOCUS ON ECONOMICS, © NATIONAL COUNCIL ON ECONOMIC EDUCATION, NEW YORK, N.Y.68
VISUAL 4.2IMMIGRANTS ADMITTED TO THE UNITED STATES Top 20 countries of birth (FY 2002)
MERIDIANS
SHORELINES
LAKES
NORTHAMERICANPLATE
VIETNAM33,6276,926 were refugees orpeople seeking asylum
EL SALVADOR31,168
8,763 were parents, children or spouses of U.S. citizens
CHINA61,282
27,911 were children, parents or spouses of U.S. citizens
INDIA71,10560% were admitted on employment-based preferences
PAKISTAN13,743
43% were immediate relatives of U.S. citizens; 24% were admitted on employment-based preferences
PHILIPPINES51,30826,470 were immediate relatives of U.S. citizens; 12,060 were sponsored by their families
KOREA, SOUTH 21,0219,573 were immediate relatives of U.S. citizens; 9,241 were admitted on employment-based preferences
CANADA19,5199,530 were admitted on employment-based preferences
RUSSIA20,26810,468 were immediate relatives of U.S. citizens; 5,089 were refugees or seeking asylum
UKRAINE21,21710,601 were refugees and people seeking asylum
JAMAICA14,89896% were immediate relatives of U.S. citizens or were sponsored by their family
UNITED KINGDOM16,181
7,511 were admitted on employment-based preferences; 6,834 were spouses of U.S. citizens
IRAN13,029
4,806 refugees and people seeking asylum were granted permanent resident status
CUBA28,27224,893 were refugees and people seeking asylum
BOSNIA-HERZEGOVINA25,37325,033 were refugees and people seeking asylum
22,6046,880 were spouses of U.S. citizens, 2,880 were children of citizens
HAITI20,2686,732 were sponsored by their families
COLOMBIA18,8458,815 were spouses of U.S. citizens; 3,333 were children of citizens
GUATEMALA16,2293,579 were spouses of U.S. citizens; 3,468 were children of citizens
MEXICO219,38095% were immediate relatives of U.S. citizens or were sponsored by their family
UNITED STATES
Source: 2002 Yearbook of Immigration Statistics, U.S. Department of Homeland Security, Office of Immigration Statistics, October 2003
Immigrants admitted to the U.S.: top 20 countries of birth (FY 2002)
DOMINICAN REPUBLIC
1
1
2
2
3
3
4
4
5
5
6
6
7
7
8
8
9
9
10
10
11
11
12
12
13
13
14
14
15
15
16
16
17
17
18
18
19
19
20
20
Base map by Mapquest
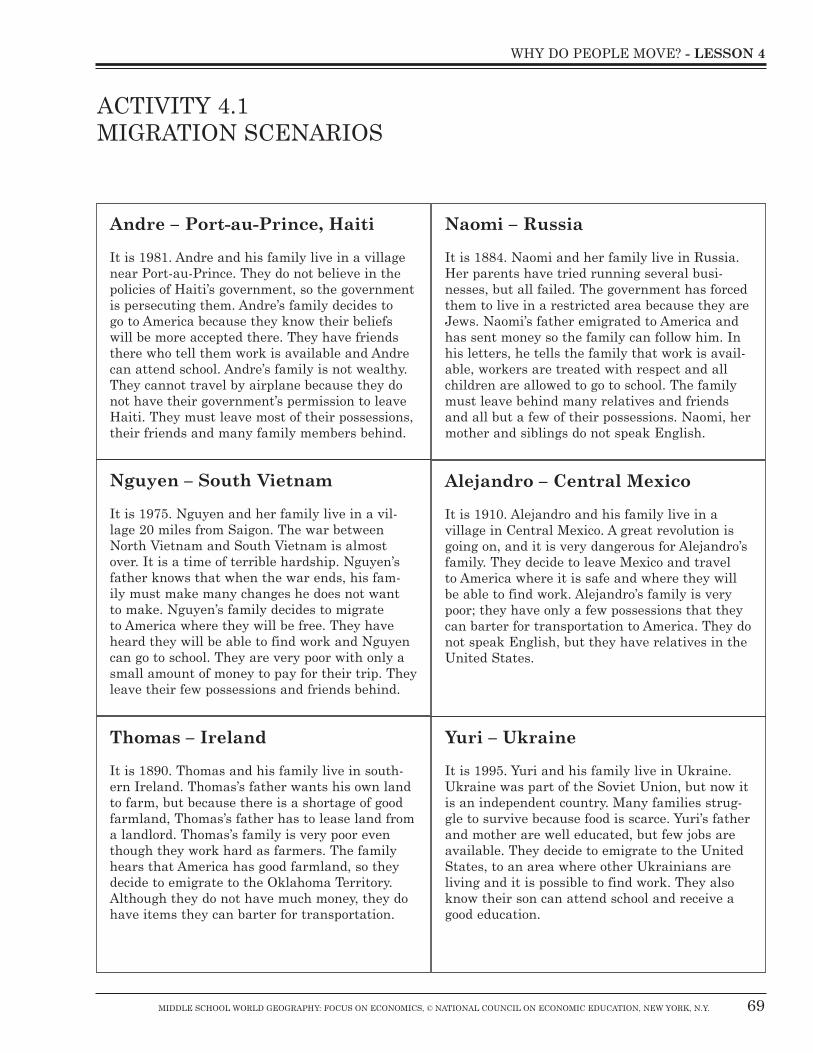
ACTIVITY 4.1MIGRATION SCENARIOS
WHY DO PEOPLE MOVE? - LESSON 4
MIDDLE SCHOOL WORLD GEOGRAPHY: FOCUS ON ECONOMICS, © NATIONAL COUNCIL ON ECONOMIC EDUCATION, NEW YORK, N.Y. 69
Andre – Port-au-Prince, Haiti
It is 1981. Andre and his family live in a village near Port-au-Prince. They do not believe in the policies of Haiti’s government, so the government is persecuting them. Andre’s family decides to go to America because they know their beliefs will be more accepted there. They have friends there who tell them work is available and Andre can attend school. Andre’s family is not wealthy. They cannot travel by airplane because they do not have their government’s permission to leave Haiti. They must leave most of their possessions, their friends and many family members behind.
Naomi – Russia
It is 1884. Naomi and her family live in Russia. Her parents have tried running several busi-nesses, but all failed. The government has forced them to live in a restricted area because they are Jews. Naomi’s father emigrated to America and has sent money so the family can follow him. In his letters, he tells the family that work is avail-able, workers are treated with respect and all children are allowed to go to school. The family must leave behind many relatives and friends and all but a few of their possessions. Naomi, her mother and siblings do not speak English.
Nguyen – South Vietnam
It is 1975. Nguyen and her family live in a vil-lage 20 miles from Saigon. The war between North Vietnam and South Vietnam is almost over. It is a time of terrible hardship. Nguyen’s father knows that when the war ends, his fam-ily must make many changes he does not want to make. Nguyen’s family decides to migrate to America where they will be free. They have heard they will be able to find work and Nguyen can go to school. They are very poor with only a small amount of money to pay for their trip. They leave their few possessions and friends behind.
Alejandro – Central Mexico
It is 1910. Alejandro and his family live in a village in Central Mexico. A great revolution is going on, and it is very dangerous for Alejandro’s family. They decide to leave Mexico and travel to America where it is safe and where they will be able to find work. Alejandro’s family is very poor; they have only a few possessions that they can barter for transportation to America. They do not speak English, but they have relatives in the United States.
Thomas – Ireland
It is 1890. Thomas and his family live in south-ern Ireland. Thomas’s father wants his own land to farm, but because there is a shortage of good farmland, Thomas’s father has to lease land from a landlord. Thomas’s family is very poor even though they work hard as farmers. The family hears that America has good farmland, so they decide to emigrate to the Oklahoma Territory. Although they do not have much money, they do have items they can barter for transportation.
Yuri – Ukraine
It is 1995. Yuri and his family live in Ukraine. Ukraine was part of the Soviet Union, but now it is an independent country. Many families strug-gle to survive because food is scarce. Yuri’s father and mother are well educated, but few jobs are available. They decide to emigrate to the United States, to an area where other Ukrainians are living and it is possible to find work. They also know their son can attend school and receive a good education.
LESSON 4 - WHY DO PEOPLE MOVE?
MIDDLE SCHOOL WORLD GEOGRAPHY: FOCUS ON ECONOMICS, © NATIONAL COUNCIL ON ECONOMIC EDUCATION, NEW YORK, N.Y.70
ACTIVITY 4.2WHY FAMILIES MIGRATE
PART 1Read the card your group was given. Remember there can be a combination of push and pull factors that influence people’s decisions to move. A. List push factors – costs or disadvantages that drive people to move away from a location – for this family.
B. List pull factors – benefits or advantages that draw people to a location – for this family.
PART 2 A. Reread the card your group was given. Make a list of any costs and benefits you can think of for this family in moving to the United States.
B. Would your group have made the same decision as the family on your card? Why?
WHY DO PEOPLE MOVE? - LESSON 4
MIDDLE SCHOOL WORLD GEOGRAPHY: FOCUS ON ECONOMICS, © NATIONAL COUNCIL ON ECONOMIC EDUCATION, NEW YORK, N.Y. 71
ACTIVITY 4.3IMMIGRANTS ADMITTED TO THE UNITED STATES Top 20 countries of birth (FY 2002)
MERIDIANS
SHORELINES
LAKES
NORTHAMERICANPLATE
VIETNAM33,6276,926 were refugees orpeople seeking asylum
EL SALVADOR31,168
8,763 were parents, children or spouses of U.S. citizens
CHINA61,282
27,911 were children, parents or spouses of U.S. citizens
INDIA71,10560% were admitted on employment-based preferences
PAKISTAN13,743
43% were immediate relatives of U.S. citizens; 24% were admitted on employment-based preferences
PHILIPPINES51,30826,470 were immediate relatives of U.S. citizens; 12,060 were sponsored by their families
KOREA, SOUTH 21,0219,573 were immediate relatives of U.S. citizens; 9,241 were admitted on employment-based preferences
CANADA19,5199,530 were admitted on employment-based preferences
RUSSIA20,26810,468 were immediate relatives of U.S. citizens; 5,089 were refugees or seeking asylum
UKRAINE21,21710,601 were refugees and people seeking asylum
JAMAICA14,89896% were immediate relatives of U.S. citizens or were sponsored by their family
UNITED KINGDOM16,181
7,511 were admitted on employment-based preferences; 6,834 were spouses of U.S. citizens
IRAN13,029
4,806 refugees and people seeking asylum were granted permanent resident status
CUBA28,27224,893 were refugees and people seeking asylum
BOSNIA-HERZEGOVINA25,37325,033 were refugees and people seeking asylum
22,6046,880 were spouses of U.S. citizens, 2,880 were children of citizens
HAITI20,2686,732 were sponsored by their families
COLOMBIA18,8458,815 were spouses of U.S. citizens; 3,333 were children of citizens
GUATEMALA16,2293,579 were spouses of U.S. citizens; 3,468 were children of citizens
MEXICO219,38095% were immediate relatives of U.S. citizens or were sponsored by their family
UNITED STATES
Source: 2002 Yearbook of Immigration Statistics, U.S. Department of Homeland Security, Office of Immigration Statistics, October 2003
Immigrants admitted to the U.S.: top 20 countries of birth (FY 2002)
DOMINICAN REPUBLIC
1
1
2
2
3
3
4
4
5
5
6
6
7
7
8
8
9
9
10
10
11
11
12
12
13
13
14
14
15
15
16
16
17
17
18
18
19
19
20
20
Base map by Mapquest

LESSON 4 - WHY DO PEOPLE MOVE?
MIDDLE SCHOOL WORLD GEOGRAPHY: FOCUS ON ECONOMICS, © NATIONAL COUNCIL ON ECONOMIC EDUCATION, NEW YORK, N.Y.72
ACTIVITY 4.4CHART OF PUSH AND PULL FACTORS OF MIGRATION
A. Using the map and the information on Activity 4.3, select four countries and complete the table for these countries. Then answer Questions B and C.
Country from which immigrants are coming to the United States
Number of immigrants coming into the United States
In your group’s opinion, is this group of immigrants responding to push or pull factors? Why?
B. Give three examples of push factors that influence migration from one place to another.
C. Give three examples of pull factors that influence migration from one place to another.
ACTIVITY 4.5ASSESSMENT
1. Read the following paragraph and use the information to complete the table below.
Your parents call a family meeting. Your mother has been offered a new job with a higher salary in a city 1,000 miles away. The new city is bigger than the town you live in now and has many theaters, parks, museums and shopping areas – along with two major-league sports teams. The city is also near the ocean, and you’ve always wanted to live near the ocean. It has excellent schools and is only half an hour from your favorite grand-parents. You have lived in the same neighborhood all your life, and you and your brother have many friends here. You just made the soccer team at school and had planned to play on a neighborhood team this summer. Your father is a skilled craftsman, and he says he should have no trouble finding jobs in the new city, but it may take him awhile to build up a solid list of clients. So even though your mother will make more money, your fam-ily may have to buy a smaller house because home prices are higher in the new city. Your mother says she won’t take the new job if the family doesn't want to move, and she asks you how you feel.
2. Use the table below to help you make your decision.You may add details not included in the information above to support your decision.
WHY DO PEOPLE MOVE? - LESSON 4
MIDDLE SCHOOL WORLD GEOGRAPHY: FOCUS ON ECONOMICS, © NATIONAL COUNCIL ON ECONOMIC EDUCATION, NEW YORK, N.Y. 73
3. For you, which are greater: the costs or the benefits? Explain.
4. If you moved, would it be a push or pull migration? Explain.
Alternatives
Move to the new city
Stay where you now live
Costs Benefits
LESSON 4 - WHY DO PEOPLE MOVE?
MIDDLE SCHOOL WORLD GEOGRAPHY: FOCUS ON ECONOMICS, © NATIONAL COUNCIL ON ECONOMIC EDUCATION, NEW YORK, N.Y.74