why people move? determinants of migration ii
TRANSCRIPT

1/17/2019
1
WHY PEOPLE MOVE? DETERMINANTS OF MIGRATION II
Mariola Pytliková
CERGE-EI,
VŠB-Technical University Ostrava, CReAM, IZA, CCP and CELSI
Info about lectures: http://home.cerge-ei.cz/pytlikova/LaborSpring19/
Office hours: Wednesdays 13.15-15.00
Contact:Email: [email protected]: 739211312
https://sites.google.com/site/pytlikovaweb/
Study Materials and Reading List
• Slides of the lectures (provided one day in advance or on the day of the class)
All materials provided on: http://home.cerge-ei.cz/pytlikova/LaborSpring19/
Compulsory Readings:
• Bodvarsson, Simpson and Sparber: "Migration Theory" in Chiswick and Miller ed. (2015): Handbook of International Migration, Vol, 1A https://www.sciencedirect.com/science/article/pii/B9780444537645000013

1/17/2019
2
Study Materials and Reading List
Other Relevant Literature:
• Gorinas, Cedric and Mariola Pytliková (2017): “Do Natives’ Attitudes Influence International Migration?” International Migration Review, Vol 51 (2), pp 416–451.
• Cai Ruohong, Feng Shuaizhang, Oppenheimer Michael and Mariola Pytlikova (2016). “Climate Variability and International Migration: The Importance of the Agricultural Linkage". Journal of Environmental Economics and Management,Vol. 79, pp. 135-151. September 2016.
• Palmer, John and Mariola Pytliková (2015): “Labor Market Laws and intra-European Migration: The Role of the State in Shaping Destination Choices”. European Journal of Population, 31(2), pp. 127-153
• Mayda, A. M.(2010): "International Migration: A panel data analysis of the determinants of bilateral flows". Journal of Population Economics, 23(4), 1249-1274.
• Karemera, Oguledo, Davis, (2000): "A gravity model analysis of international migration to North America" Applied Economics, 32(13), 1745-1755.
• F. Docquier, G. Peri, I. Ruyssen, (2014): "The cross-country determinants of potential and actual migration", International Migration Review , 48, 37-99.
WHY DO PEOPLE MIGRATE? Theory I
• ECONOMIC FACTORS:
• Wage differences (Hicks, 1932; Kuznetz and Rubin, 1954),
• Human capital model (Sjaastad,1962; Becker,1964): Move if net discounted future expected benefits>costs of migration (assumed to be proportional to distance), later formalization of the model – a starting point to most of the literature on migration determinants.
• Within the framework, migration is treated as once-and-for-all decision,
• Non-monetary gains (amenities such as better climate, stable political, religious environment etc) are not counted among migration returns

1/17/2019
3
Sjastaad’s model:
1 1
( ) ( )( , )
(1 ) (1 )
Dest Orig Dest OrigT Tt t t t
t tt t
W W CL CLC D X
i i
• Person will retire in T periods
• W… earnings per period available in Dest and Origcountry
• CL…index measuring costs of living at Dest and Origcountry
• i… discount rate
• C…costs of migration
• In discrete time, the present value of the net gain to migration is (eq1):
Sjastaad’s model:
0
( , )T
Dest Orig Dest Orig rtt t t t
t
W W CL CL e dt C D X
• Sjaastad did not specified the equations (only text with general formulations), all empirical and theoretical studies involving human capital model utilize some behavioral model similar to eq. 1 or 2,
• In continous time, the present value of the net gain to migration is (eq2):

1/17/2019
4
Sjastaad’s model:• Limitations:
• A single period model
• Individual as the unit of analysis
• Push and pulls assumed to be symmetrical
• Perfect information
• Ignorance of remittances and other factors
• Extensions:• Migrants as a consumer (Rosen, 1874; Glaeser and Shapiro, 2003)
• Migrants networks (sociology; Carrington et al (1996), also see previous lecture a paper by Adsera and Pytlikova, 2015)
• Uncertainty on migration (employment probabilities, Harris and Todaro (1970), Todaro (1969, 1976 ) – see previous lecture; incorporating social security (unemployment benefits, pensions)
• Family decision (Mincer, 1978) – see previous lecture; family diversification portfolio (Stark, 1984, 2001)
• A relative deprivation approach (Stark, 1991) – see previous lecture
• A more recent application, see e.g. Grogger and Hanson (2011), Adsera and Pytlikova(2015) –see previous lecture
WHY DO PEOPLE MIGRATE? Theory I
• ECONOMIC FACTORS:
• Wage differences (Hicks, 1932; Kuznetz and Rubin, 1954),
• Human capital model (Sjaastad,1962; Becker,1964): Move if net discounted future expected benefits>costs of migration (assumed to be proportional to distance), later formalization of the model – a starting point to most of the literature on migration determinants.
• Sjastaad’s framework includes features of gravity model by viewing distance as a proxy for migration costs
• GRAVITY MODEL:

1/17/2019
5
• Application of Newtons gravity law to migration:
• Application from Karemera et al (2010):
• i..origin, j.. destination
• Migrant flow will depend on potential supply factors Si, which is a function of population n, and factor endowments
• Potential demand factors are likewise a function of income and population, representing a pull factor in destinations
•
Gravity models
2/ij i j ijM PP d
1 2b bi o i iS b y n
1 2c cj o j jD c y n
• Combining S and D yields migration flow equation:
• Where Rij stands for factors helping or restraining migration, i=1,…,N, j=1,…,N. Taking logs on both sides, and replacing by their equivalents gives:
• Which is in fact similar to the simplest empirical form of migrant flow equation proposed by Sjastaad (1962).
Gravity models
0 1 2 3 4 5ij i j i j ij ijm n n y y c e
1 2 3/a a aij o i j ijF a S D R

1/17/2019
6
WHY DO PEOPLE MIGRATE? Theory II
•MIGRATION NETWORKS:
• migration networks: “…sets of interpersonal ties that connect migrants, former migrants, and non-migrants in origin and destination areas through ties of kinship, friendship, and shared community origin” (Massey, 1993)
• help to explain persistence in migration
• “herd behavior” effect (Bauer et al. 2002),
•NON-ECONOMIC FACTORS:
• war, love/marriage, taste for adventure
• education
• Language proximity
•OTHER FACTORS:
• the role of the state = immigration policy, immigrant rights towards employment, naturalization, welfare provision etc,
•The role of natives’ attitudes towards migrants
• ENVIRONMENT: Climate variability, natural disasters, pollution
EMPIRICAL APPLICATIONS
The role of the state:
The effect of EU enlargements and labourmarket openings on migration

1/17/2019
7
International Labour Markets
DIFFERENT TIMING OF LABOR MARKET OPENINGS wrtFREE MOVEMENT OF LABOR
1st EU enlargement towards the East – 2004 enlargement:
• UK, Ireland and Sweden have opened from day one of EU enlargement in May 2004, the rest of “old” EU members imposes restrictions to free movement of workers.• 2006 - Spain, Portugal, Greece, Italy, Finland and Iceland • 2007 – the Netherlands and Luxembourg (November2007)
• July 2008 - France• May 2009 – Belgium, Denmark and Norway• May 2011: Austria, Germany and Switzerland hold a maximum periodof restrictions.

1/17/2019
8
International Labour Markets
DIFFERENT TIMING OF LABOR MARKET OPENINGS wrtFREE MOVEMENT OF LABOR
2nd EU enlargement towards the East – 2007 enlargement:
• Bulgaria and Romania joined the EU on January 1, 2007.• Restrictions on labour markets possible until 2014;• Open doors for 2007 entrants:
• 2007 - Finland, Sweden, Cyprus, Czech Republic, Estonia, Latvia, Lithuania, Poland, Slovakia, Slovenia• 2009 - Denmark, Greece, Portugal, Spain• 2011 - Spain reimposes restrictions for workers from Romania• 2012 – Iceland, Italy• 2014 - the rest of EU holds a maximum period of restrictions
Motivation –previous evidence on effects of labor market openings
• many studies trying to forecast migration potential from CEECs prior EU enlargements:
2 different approaches: A) surveys: 6 - 30% of the CEE populations, see e.g. Wallace (1998), Fassmannand Hintermann (1997). B) econometric analysis: a long-run migration potential is usually estimated at around 2-5%, net migration potential around 2% of source countries population, see Pytlikova (2006), Dustmann et al. (2003) or Alvarez-Plata et al. (2003).
• Example of a forecast for UK: 5.000–13.000 immigrants per year to UK (Dustmann et al. 2003) Reality: around 500.000 CEE immigrants between 2004 and 2006!!!
Why so bad forecasts?

1/17/2019
9
Motivation –previous evidence
• out-of-sample historical data on migration;
• and/or past enlargement experience;
• -> extrapolation to predict East-West migration;
• in the EU context: analyses of migration flows into one destination country, specifically Germany;
• On the basis of obtained coefficients forecasts: => problems related to (double) out-of-sample forecasts and the assumption of invariance of migration behavior across a space.
Motivation for analyses
• Use actual numbers of CEE emigrants = true behavior of CEE emigrants,
• Extended time series 1995 – 2010
• Exploit a “natural experiment”: different timing of lifting of restrictions to the free movement of workers on migration
Estimate a difference-in-differences DD and triple DDD estimator on the flow of migrants from 8 CEECs and Bulgaria and Romania into 18 EEA+CH countries .

1/17/2019
10
Differences-in-Differences and DDD
1. Basic idea
2. How to estimate
3. Application on migration data – exploiting labour market openings in connection with the EU enlargements in 2004 and 2007 and migration from the new EU members to Nordic countries.
4. ”Placebo” treatment model and sensitivity analyses
Diff-in-Diff: Basic Idea
• Evaluate the impact of a program or treatment on an outcome.
• Idea of using differences to estimate causal effects
• Treatment/control groups in experimental data
• Individuals - Twins data to deal with ability bias
• would like to find “treatment” and “control” group which can be assumed to be similar all aspects except getting the treatment => This might be difficult => so often a weaker assumption:
• Assume that, in absence of treatment, differences between “treatment” and “control” group are the same over time. With this assumption we can use observations on treatment and control group pre- and post-treatment to estimate a causal effect.

1/17/2019
11
Diff-in-Diff: Basic Idea
• Basic Idea• one could use data on treatment and control group before the
treatment to estimate a “normal” difference between treatment and control group and then compare this with the difference after the receipt of treatment.
Graphically:
Diff-in-Diff: Basic Idea - graphically
m
Time
Treatment
Control
Pre-treatment Post-treatment
A
B
C
Treatment effect

1/17/2019
12
Diff-in-Diff: Basic Idea
• Standard differences estimator is AB
• But “normal” difference estimated as CB
• =>Diff-in-Diff estimate is AC
• =>a key identifying assumption here is that trends in outcome variables are the same for treatment and control groups; Thus treatment induces a deviation from this common trend.
• Although the “treatment” and “control” groups can differ (in my case destination countries) this difference is meant to be captured by the group fixed effect.
• The common trend assumption can be tested using data on with more periods.
Diff-in-Diff: Basic Idea
• Define:μjt=E(mjt)
Where j=0 is control group, j=1 is treatmentWhere t=0 is pre-treatment-period, t=1 is post-treatment-
period
• Standard ‘differences’ estimate of causal effect is estimate of:
μ11-μ01
• ‘Differences-in-Differences’ estimate of causal effect is estimate of:
(μ11-μ01)-(μ10-μ00)
How to estimate it?

1/17/2019
13
Diff-in-Diff: How to estimate it?
• 1. in differences• Can write D-in-D estimate as:
(μ11-μ10)-(μ01 -μ00)• This is simply the difference in the change of treatment and
control groups so can estimate as:
• This is simply ‘differences’ estimator applied to the difference• need of having repeated obs on the same
countries/individuals• an alternative is regression-based estimator
0 1j j jm T rea t
Diff-in-Diff: How to estimate it?
• 2. regression-based estimator
• D-in-D estimate is estimate of β3
• – graphically:
0 1 2 3 ( * )ijt j t j t ijtm Treat Post Treat Post
0 00
1 10 00
2 01 00
3 11 01 10 00
ˆlim
ˆlim
ˆlim
ˆlim
p
p
p
p

1/17/2019
14
Diff-in-Diff: Basic Idea - graphically
m
Time
Treatment
Control
Pre-treatment Post-treatment
A
B
C
0 1 2 3 ( * )ijt j t j t ijtm Treat Post Treat Post
0 1
0
0 1 2 3
0 2
Diff-in-Diff=(Diff2-Diff1)= 1 3 1 3( )
Diff1
Diff2
Diff-in-Diff: How to estimate it?
• A Comparison of the Two Methods:
• Where have repeated observations could use both methods;
• Will give the same parameter estimates
• But will give different standard errors
• “level” regression-based version assumes residuals are independent – unlikely to be a good assumption:
• One way to deal with this is clustering

1/17/2019
15
Diff-in-Diff: How to estimate it?
• Other regressors-controls can be put in as well – it helps with the assumption that treatment and control groups have the same trend - but one should think about way in which they enter the estimating equation
• E.g. if level of GDPpcj affects level of migration mij then one should include ΔGDPpcj in the differences version
• Multiple groups and time periods:
• control for each time period
• control for each “group”
• = the coefficient on the treatment dummy is the effect we want to estimate.
• Immigration flows and foreign population stock into 42 destinations from all world source countries.
• For 27 destinations data collected from national statistical offices
• for 6 OECD countries from OECD International Migration Database (Chl, Isr, Kor, Mex, Rus and Tur)
• For 9 others from Eurostat (Bul, Cro, Cyp, Est, Lv, Ltv, Mal, Rom and Slo)
• Period: 1980 to 2010.
• In this paper – focus on EEA+CH destinations and migration from CEE new EU members over time 1995-2010
• Additional control variables
◦ Economic variables
◦ Demographic variables,
◦ Distance variables:
Physical – distance in km
Linguistic proximity constructed by Adsera&Pytlikova (2016) based on Ethnologue (see the last lecture)
Neighboring dummy
• Sources: WB-WDI, ILO, OECD
• Unbalanced panel.
BACK TO OUR EXAMPLE OF CEE MIGRATIONData description

1/17/2019
16
Trends in log(emigration rate) from EU8 countries to EEA/EFTA destinations, 95-2010
-10
-50
5-1
0-5
05
-10
-50
5-1
0-5
05
-10
-50
5-1
0-5
05
1995 2000 2005 2010 1995 2000 2005 2010 1995 2000 2005 2010 1995 2000 2005 2010
1995 2000 2005 2010 1995 2000 2005 2010
AUS AUT BEL CAN CHE CYP
CZE DEU DNK ESP EST FIN
FRA GBR GRC HUN IRL ISL
ITA LTU LUX LVA MLT NLD
NOR NZL POL PRT SVK SVN
SWE USA
CZE HUN POL SVK EST LVA LTU SVN
Log(
emig
ratio
n ra
te)
Year
Graphs by 3-letter Code of Destination country i
Trends in log(emigration rate) from EU2 countries to EEA/EFTA destinations, 95-2010
-10
-50
5-1
0-5
05
-10
-50
5-1
0-5
05
-10
-50
5-1
0-5
05
1995 2000 2005 2010 1995 2000 2005 2010 1995 2000 2005 2010 1995 2000 2005 2010
1995 2000 2005 2010 1995 2000 2005 2010
AUS AUT BEL CAN CHE CYP
CZE DEU DNK ESP EST FIN
FRA GBR GRC HUN IRL ISL
ITA LTU LUX LVA MLT NLD
NOR NZL POL PRT SVK SVN
SWE USA
BGR ROM
Log
(em
igra
tion r
ate)
Year
Graphs by 3-letter Code of Destination country i

1/17/2019
17
ModelThe basic DD econometric model has the following form:
• mijt - emigration rate = gross migration flow per source country population,
• full set of year dummies, and destination and country of origin effects
• OPENij - a Labour Market Opening policy variable, to be equal to 1 if there is a freemovement of workers between a particular destination and source country, and 0otherwise.
• GDPj, GDPi, GDPi2 - GDP per capita, PPP, constant 2005 US$
• Uj, Ui - unemployment rates
• Sijt-1 is stock of immigrants per source country population
• Lingprox– linguistic proximity index
• distij is distance in km
• Neighbour
• Robust st errors clustered on the level of pair of countries
• All vars in logs except dummies and ling proximity index.
2
10 2 3 1 4 1 5
6 1 7 1 8 1 9 10 11
ln ln( ) ln( ) ln( )
ln ln ln lntijt j i t ij j t i t i
j t it ijt ij ij ijt
m OPEN GDP GDP GDP
u u s lingprox dist neighbour
Overview of policy changes with respect to lifting restrictions on the access to labor markets for workers from the new EU 2004 member states
EEA/EFTA countriesLifting restrictions on free
movement of workers
Treatments and Controls
Pre-treatment period
Post-treatment period
Austria May 2011 Control 1995-2010 -
Belgium May 2009 Treatment 1995-2008 2009-2010
Denmark May 2009 Treatment 1995-2008 2009-2010
Finland May 2006 Treatment 1995-2005 2006-2010
France July 2008 Treatment 1995-2007 2008-2010
Germany May 2011 Control 1995-2010 -
Greece May 2006 Treatment 1995-2005 2006-2010
Iceland May 2006 Treatment 1995-2005 2006-2010
Ireland May 2004 Treatment 1995-2003 2004-2010
Italy July 2006 Treatment 1995-2005 2006-2010
Luxembourg November 2007 Treatment 1995-2007 2008-2010
Netherlands May 2007 Treatment 1995-2006 2007-2010
Norway May 2009 Treatment 1995-2008 2009-2010
Portugal May 2006 Treatment 1995-2005 2006-2010
Spain May 2006 Treatment 1995-2005 2006-2010
Sweden May 2004 Treatment 1995-2003 2004-2010
Switzerland May 2011 Control 1995-2010 -
UK May 2004 Treatment 1995-2003 2004-2010
1/17/2019
18
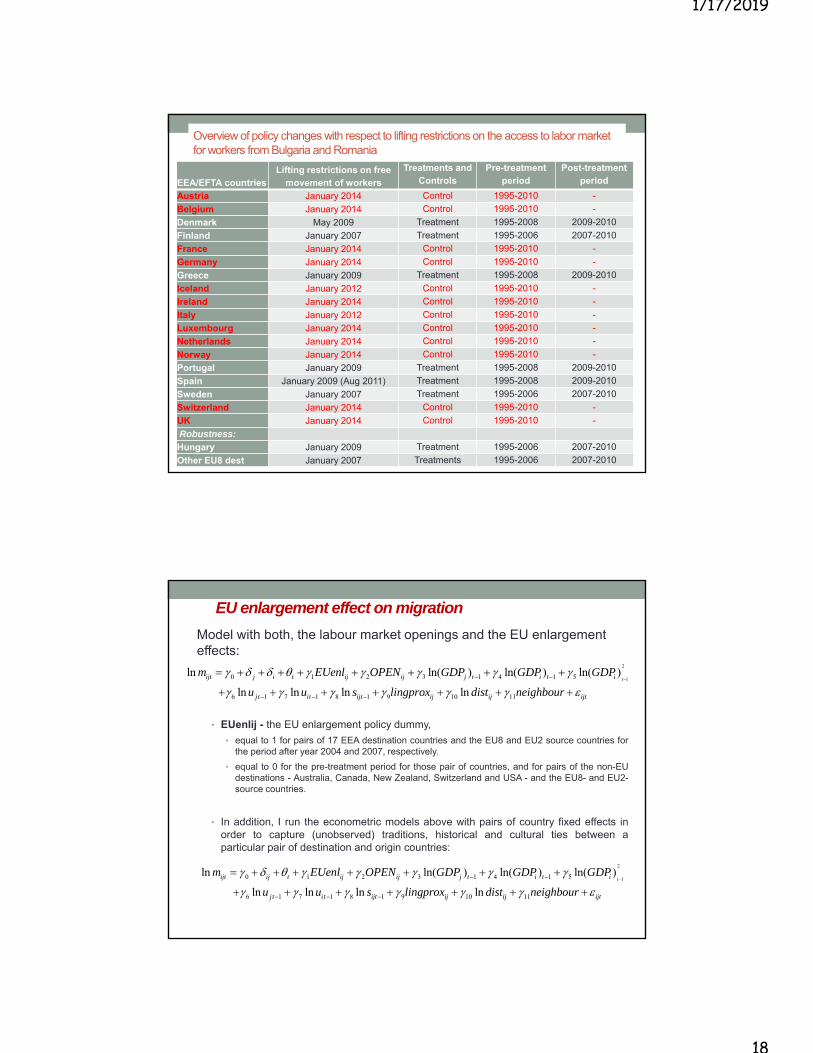
Overview of policy changes with respect to lifting restrictions on the access to labor market for workers from Bulgaria and Romania
EEA/EFTA countriesLifting restrictions on free
movement of workers
Treatments and Controls
Pre-treatment period
Post-treatment period
Austria January 2014 Control 1995-2010 -
Belgium January 2014 Control 1995-2010 -
Denmark May 2009 Treatment 1995-2008 2009-2010
Finland January 2007 Treatment 1995-2006 2007-2010
France January 2014 Control 1995-2010 -
Germany January 2014 Control 1995-2010 -
Greece January 2009 Treatment 1995-2008 2009-2010
Iceland January 2012 Control 1995-2010 -
Ireland January 2014 Control 1995-2010 -
Italy January 2012 Control 1995-2010 -
Luxembourg January 2014 Control 1995-2010 -
Netherlands January 2014 Control 1995-2010 -
Norway January 2014 Control 1995-2010 -
Portugal January 2009 Treatment 1995-2008 2009-2010
Spain January 2009 (Aug 2011) Treatment 1995-2008 2009-2010
Sweden January 2007 Treatment 1995-2006 2007-2010
Switzerland January 2014 Control 1995-2010 -
UK January 2014 Control 1995-2010 -
Robustness:
Hungary January 2009 Treatment 1995-2006 2007-2010
Other EU8 dest January 2007 Treatments 1995-2006 2007-2010
EU enlargement effect on migration
Model with both, the labour market openings and the EU enlargement effects:
• EUenlij - the EU enlargement policy dummy,
• equal to 1 for pairs of 17 EEA destination countries and the EU8 and EU2 source countries forthe period after year 2004 and 2007, respectively.
• equal to 0 for the pre-treatment period for those pair of countries, and for pairs of the non-EUdestinations - Australia, Canada, New Zealand, Switzerland and USA - and the EU8- and EU2-source countries.
• In addition, I run the econometric models above with pairs of country fixed effects inorder to capture (unobserved) traditions, historical and cultural ties between aparticular pair of destination and origin countries:
2
10 1 2 3 1 4 1 5
6 1 7 1 8 1 9 10 11
ln ln( ) ln( ) ln( )
ln ln ln lntijt j i t ij ij j t i t i
j t it ijt ij ij ijt
m EUenl OPEN GDP GDP GDP
u u s lingprox dist neighbour
2
10 1 2 3 1 4 1 5
6 1 7 1 8 1 9 10 11
ln ln( ) ln( ) ln( )
ln ln ln lntijt ij t ij ij j t i t i
j t it ijt ij ij ijt
m EUenl OPEN GDP GDP GDP
u u s lingprox dist neighbour

1/17/2019
19
Difference-in-Differences analyses of labour market openings of EU countries on migration flows from new EU10 member states, 22 destinations, years 1995-2010.
VARIABLESEU8+EU2 EU8 EU2
LMO 0.378*** 0.353*** 0.298*** 0.348*** 0.536*** 0.524*
Dest & Origin FE YES YES YES
Pair of country FE YES YES YESConstant -89.043*** -93.528*** -116.716*** -131.480*** 456.667 496.926
Observations 2,424 2,424 1,910 1,910 514 514
Adjusted R-sq0.861 0.905 0.868 0.9111 0.896 0.8976
Dependent Variable: Ln(Emigration Rate). Controls included: networks, economic and distance variables, time dummies. Robust standard errors clustered on country pairs level, *** p<0.01, ** p<0.05, * p<0.1; The sample of destinations consists of the “old” 17 EEA countries and 5 non-EU countries: Australia, Canada, New Zealand, Switzerland and the United States.
Difference-in-Differences analyses, Controls for the EU enlargement in order to separate the labour market openings effects from the EU enlargement effects, 22 destinations, years 1995-2010.
VARIABLES EU8+EU2 EU8 EU2LMO 0.290*** 0.268*** 0.248** 0.282*** 0.363** 0.353
EUenl 0.308*** 0.334*** 0.169 0.246** 0.798*** 0.818***
Dest & Origin FE YES YES YESPair of country FE YES YES YESConstant -90.909*** -96.769*** -117.518*** -133.533*** 425.877 475.934
Observations 2,424 2,424 1,910 1,910 514 514
Adjusted R-sq 0.862 0.9065 0.868 0.9116 0.899 0.9012
Dependent Variable: Ln(Emigration Rate). Controls included: networks, economic and distance variables, time dummies. Robust standard errors clustered on country pairs level, *** p<0.01, ** p<0.05, * p<0.1; The sample of destinations consists of the “old” 17 EEA countries and 5 non-EU countries: Australia, Canada, New Zealand, Switzerland and the United States.

1/17/2019
20
• similarly as in DD, but add:
• Non-experimental group of source countries:
• Russia, Croatia, Albania and Ukraine sources
• post-treatment period varies according to the different time of lifting restrictions
Triple difference (DDD) estimator –2004 EU-8
DDD analyses of labour market openings and EU enlargements; Period: 1995-2010. Experimental groups of source countries: Albania, Croatia, Russia and Ukraine.
VARIABLESEU8+EU2+4CEECs EU8+4CEECs EU2+4CEECs
LMO 0.237*** 0.338*** 0.233** 0.385*** -0.051 0.401*
EUenl 0.594*** 0.637*** 0.548*** 0.596*** 1.142*** 1.238***
Dest & Origin FE YES YES YES
Pair of country FE YES YES YES
Constant -22.903 -35.511** -4.795 -25.343 -17.699 -27.292
Observations 3,110 3,110 2,596 2,596 1,200 1,200
Adjusted R-sq 0.861 0.9081 0.864 0.9130 0.886 0.9133
Dependent Variable: Ln(Emigration Rate). Controls included: networks, economic and distance variables, time dummies. Robust standard errors clustered on country pairs level, *** p<0.01, ** p<0.05, * p<0.1; The sample of destinations consists of the “old” 17 EEA countries and 5 non-EU countries: Australia, Canada, New Zealand, Switzerland and the United States.

1/17/2019
21
TESTING VALIDITY: Placebo tests: period 1995-2003; placebo enlargement year for EU8=1997; placebo for EU2=2000
Dependent Variable: Ln(Emigration Rate). Controls included: networks, economic and distance variables, time dummies. Robust standard errors clustered on country pairs level, *** p<0.01, ** p<0.05, * p<0.1
VARIABLESEU8+EU2 EU8+EU2
LMO 0.140 0.093 0.123 0.091
EUenl 0.121 0.018
Dest & Origin FE YES YES
Pair of country FE YES YES
Constant -131.288*** -162.262*** -121.079*** -160.794***
Observations 1,239 1,239 1,239 1,239
Adjusted R-sq 0.856 0.9175 0.856 0.9175
• A positive effect of labour market openings on migration:
• migrants move to countries with greater formal labor market access over those in which their access is restricted.
• The relationships hold even in the most restrictive models with economic and distance indicators, existing immigrant stocks and country or country pair FE.
• in models without networks, the coefficients on DD and DDD are always significant positive;
• It holds also for 32 destinations
• It holds even if I control for the overall effect of the “EU entry” on migration.
• the estimated “EU entry” effect is positive and significant in all DD and DDD model specifications, and it is larger than the “labour market opening” effect.
SUMMARY:

1/17/2019
22
Labor Market Laws and intra-European Migration: The Role of the State in
Shaping Destination Choices By John Palmer and Mariola Pytlikova
European Journal of Population, 2015
Use an employment rights index collected by John Palmer to evaluate how granting employment rights law influence migration.
We study immigrants multiple choices
We study potential mechanisms behind
WE FIND:
migrants are attracted to destinations that give them greater formal labor market access.
Descreasing restrictions in one destination diverted migrants from other potential destinations.
The effect of destination labor market access is:
weaker for destinations with larger existing co-national networks, and for migrants from linguistically closer countries and from countries with higher average education.

1/17/2019
23
The role of the environment:
Climate Variability and International Migration: The Importance of the Agricultural Linkage
Ruohong Cai, Princeton University
Shuaizhang Feng, Shanghai University of Finance and Economics and IZA
Mariola Pytliková, CERGE-EI, VSB-Technical University Ostrava, KORA Copenhagen, IZA and CReAM
Michael Oppenheimer, Princeton University
BackgroundClimate change has become a global concern (IPCC, 2007).
One possible impact of the climate change is human migration (Myers, 2002;Stern, 2007; Warner et al., 2009). Among all climate-induced migrants, thosecrossing the political borders would be a matter of special concern as bothreceiving and sending countries are affected.
Yet, a very few studies on impacts of environmental factors on internationalmigration.
A need to understand the mechanisms underlying the climate-migrationrelationship in order to devise policies to identify the potential source andreceiving regions and to effectively manage migration flows.
46
1/17/2019
24
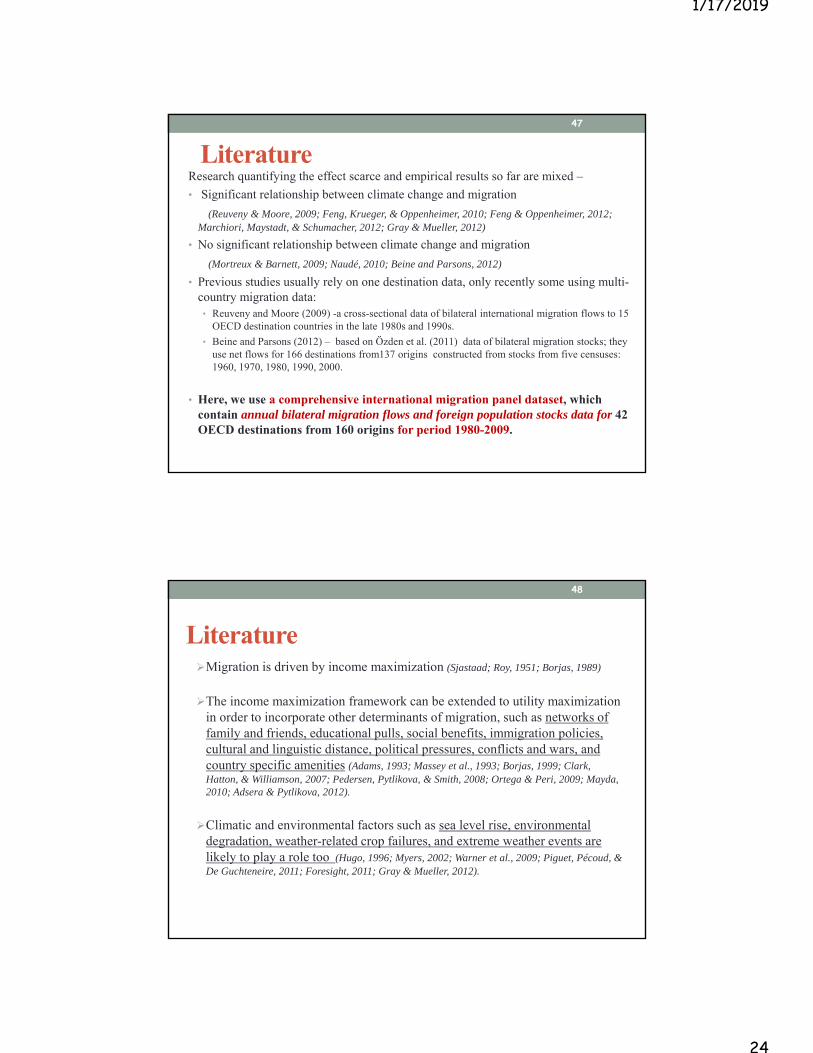
LiteratureResearch quantifying the effect scarce and empirical results so far are mixed –
• Significant relationship between climate change and migration
(Reuveny & Moore, 2009; Feng, Krueger, & Oppenheimer, 2010; Feng & Oppenheimer, 2012; Marchiori, Maystadt, & Schumacher, 2012; Gray & Mueller, 2012)
• No significant relationship between climate change and migration
(Mortreux & Barnett, 2009; Naudé, 2010; Beine and Parsons, 2012)
• Previous studies usually rely on one destination data, only recently some using multi-country migration data: • Reuveny and Moore (2009) -a cross-sectional data of bilateral international migration flows to 15
OECD destination countries in the late 1980s and 1990s.
• Beine and Parsons (2012) – based on Özden et al. (2011) data of bilateral migration stocks; they use net flows for 166 destinations from137 origins constructed from stocks from five censuses: 1960, 1970, 1980, 1990, 2000.
• Here, we use a comprehensive international migration panel dataset, which contain annual bilateral migration flows and foreign population stocks data for 42 OECD destinations from 160 origins for period 1980-2009.
47
LiteratureMigration is driven by income maximization (Sjastaad; Roy, 1951; Borjas, 1989)
The income maximization framework can be extended to utility maximization in order to incorporate other determinants of migration, such as networks of family and friends, educational pulls, social benefits, immigration policies, cultural and linguistic distance, political pressures, conflicts and wars, and country specific amenities (Adams, 1993; Massey et al., 1993; Borjas, 1999; Clark, Hatton, & Williamson, 2007; Pedersen, Pytlikova, & Smith, 2008; Ortega & Peri, 2009; Mayda, 2010; Adsera & Pytlikova, 2012).
Climatic and environmental factors such as sea level rise, environmental degradation, weather-related crop failures, and extreme weather events are likely to play a role too (Hugo, 1996; Myers, 2002; Warner et al., 2009; Piguet, Pécoud, & De Guchteneire, 2011; Foresight, 2011; Gray & Mueller, 2012).
48

1/17/2019
25
Literature
Climate may interact with region-specific factors (socio-economic and environment conditions, culture and lifestyle, social networks, and so on)
The effects of climate on human migration are likely to be heterogeneous and driven by different mechanisms.
We try to uncover some of the mechanisms in our study.
49
The agricultural channel1. Literature has detected severe effect of climatic changes on crop yields (Lobell et
al., 2008; Schlenker & Roberts, 2009; Lobell, Schlenker, & Costa-Roberts, 2011).
2. Agriculture is an important economic sector in many developing countries, where a large proportion of the population still directly depends on agriculture for a living.
3. Other channels are likely to either affect only a specific type of region (such as sea level rise that is only directly relevant to coastal regions), or tend to displace people only temporarily, such as flood or cyclones.
4. Dell et al. (2012) : GDP growth rates are negatively associated with temperature, but only for less developed countries which are more dependent on agriculture. Given that income, usually proxied by GDP per capita in empirical work, is a major determinant of international migration (Borjas, 1989), it is reasonable to expect agriculture to play an important role in the climate-migration relationship.
50

1/17/2019
26
Some theory1. We build a simple theoretical migration model in Harris&Todaro 1970’s and Borjas
1987’s models fashion.
2. Then we set up a simple production function, in which we - based on empirical findings of Dell et al. (2012) - assume that climate affects the productivity of agricultural sector but not that of non-agricultural
• According to our model, we have the following results:
• (a) adverse climate change would induce a decline in population, or outmigration from the country;
• (b) For countries that are more agriculture-dependent, an adverse climate change would trigger more outmigration.
• (c) If amenities are not adversely affected by climate, then for non-agricultural countries, changes in climate would not trigger any outmigration.
51
Empirical Model
A reduced-form model:
52
ijttiijjtitiitiitititijt yeardzxAPCPATMPPCPTMPm **ln 21210
Migration rate
Temperature Precipitation Interactive terms
Control Variables
Country-pair fixed effects
Origin country linear time trend

1/17/2019
27
Data• dataset on Immigration flows and foreign population stock into 42 OECD countries
from 160 countries.
• Collected by writing to national statistical offices (for 30 OECD countries, the rest from OECD source migration).
• Period: 1980 to 2010, unbalanced panel.
• Monthly mean temperature and total precipitation data for 1980-2010 period from NASA MERRA with a resolution of 2/3 degrees in longitude and 1/2 degrees in latitude, aggregated by country and population-weighted;
• In addition, we also constructed a measure of growing season exposed time for both between 10 and 30 °C and above 30 °C using global gridded hourly temperature data
• Share of agriculture value added, population and cereal crops from WDI
• GDP per capita from Penn world tables version 7.
• Other variables such as distance, linguistic proximity, historical past etc. from Adsera and Pytlikova (2015) and CEPII
541 °C increase in temp => 5.1% increase in migration rate from agricultural countriesCompared to only 0.4% increase in migration rate from other countries

1/17/2019
28
55
Different control variables
Different regression technique
Different dependent variable
Different samples
ConclusionsWe employ a reduced-form model to quantify the effects of weather variations
on global bilateral international migration flows.
Significant climate-induced international migration only happens in a small group of agriculture-dependent countries.
The temperature–migration relationship is non- linear and resembles the non linear temperature–yield relationship. In particular, extreme heat is bad for agricultural productivity and induces international outmigration. Therefore, among the intermediate links between weather and international migration, agriculture appears to be an important one. Our results are robust to alternative model specifications.
Climate-induced migration specifically enlarges the flow in already significant migration routes, potentially presenting challenges to major migrant-receiving countries, mostly industrialized countries.
56
1/17/2019
29
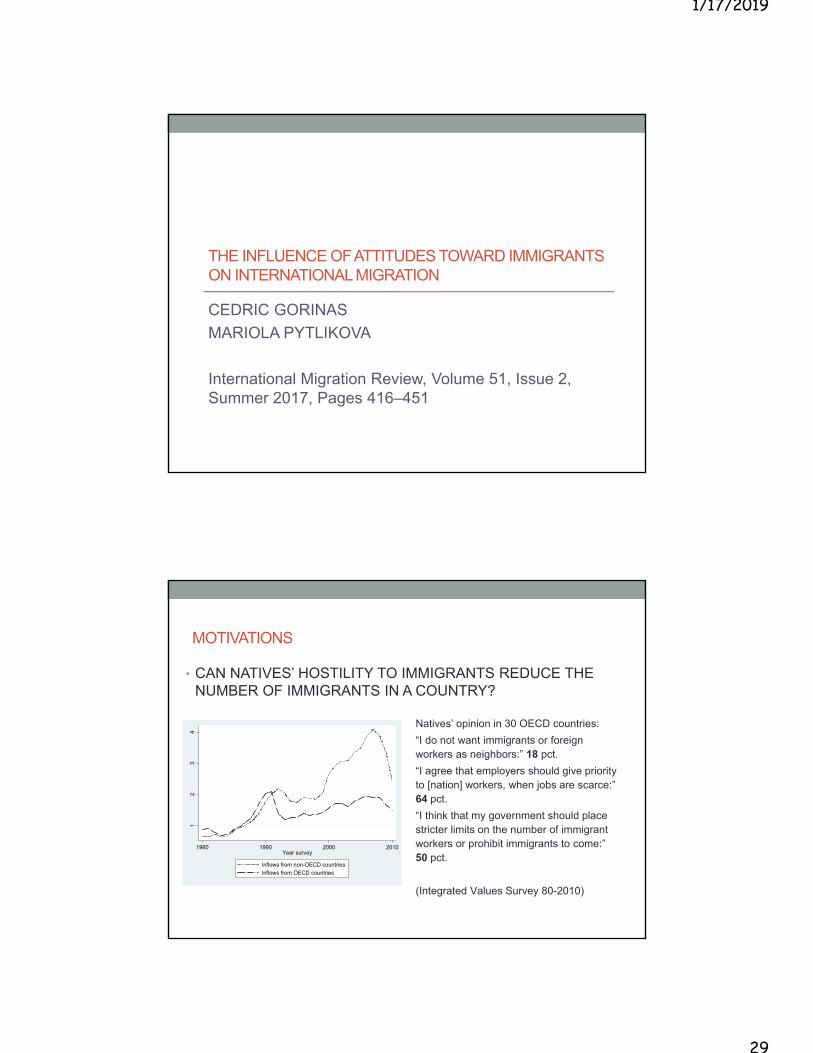
THE INFLUENCE OF ATTITUDES TOWARD IMMIGRANTS ON INTERNATIONAL MIGRATION
CEDRIC GORINAS
MARIOLA PYTLIKOVA
International Migration Review, Volume 51, Issue 2, Summer 2017, Pages 416–451
MOTIVATIONS
• CAN NATIVES’ HOSTILITY TO IMMIGRANTS REDUCE THE NUMBER OF IMMIGRANTS IN A COUNTRY?
Natives’ opinion in 30 OECD countries:
“I do not want immigrants or foreign workers as neighbors:” 18 pct.
“I agree that employers should give priority to [nation] workers, when jobs are scarce:” 64 pct.
“I think that my government should place stricter limits on the number of immigrant workers or prohibit immigrants to come:” 50 pct.
(Integrated Values Survey 80-2010)
12
34
1980 1990 2000 2010Year survey
Inflows from non-OECD countriesInflows from OECD countries

1/17/2019
30
MECHANISMS• WHY SHOULD NATIVES’ HOSTILITY AFFECT IMMIGRATION?
Attitudes influence the integration process of immigrants
• Directly: interethnic conflicts (Dustmann & Preston 2001)
• Indirectly: policies and public debate (Dustmann & Preston 2001; Facchini and Mayda 2008)
• Barriers for labor market (Waisman & Larsen 2007; Constant et al. 2009)
• Might reflect ethnic discrimination (Carlsson & Eriksson 2012)
Negative attitudes increase migration costs
Countries with more hostile natives receive fewer immigrants
THIS STUDY• IS THE FIRST STUDY TO LOOK AT WHETHER NATIVES’
ANTI-IMMIGRANT ATTITUDES CAN HINDER IMMIGRATION
• EXPLORES POSSIBLE MECHANISMSo Migration policies
o Types of migrants: e.g., labor-driven migrants
o Information channels behind mechanisms
• EXPLOITS RICH MULTIPLE-DESTINATION-AND-ORIGIN LONGITUDINAL DATA
ANTI-IMMIGRANT ATTITUDES AND INTERNATIONAL MIGRATION

1/17/2019
31
RELATED LITERATURE (1/2)
The determinants of international migration
e.g., Hicks (1932), Borjas (1999), Clark et. al (2007), Pedersen et al. (2008), Mayda (2010), Adsera & Pytlikova (2012), Ortega & Peri (2012)
Migration factors include: income differentials; employment opportunities; welfare benefits; geographic and linguistic distance; ethnic networks; immigration policies, etc.
The formation of natives’ attitudes toward immigrants
e.g., Bauer et al. (2000); Fertig & Schmidt (2002); Dustmann and Preston (2004); O’Rourke & Sinnott (2006); Facchini & Mayda (2008, 2009); Card, et al. (2012)
ANTI-IMMIGRANT ATTITUDES AND INTERNATIONAL MIGRATION
RELATED LITERATURE (2/2)Anti-Immigrant Attitudes and International Migration
Not much evidence.
• Facchini and Mayda (EP, 2008): 1 wave of the ISSP; positive correlation between net migration and pro-immigration opinions
• Wilkes et al. (IMR, 2008): the number of immigrants in a country does not influence anti-immigrant attitudes.
No study looks at anti-immigrant attitudes as a potential determinant/cost of migration
ANTI-IMMIGRANT ATTITUDES AND INTERNATIONAL MIGRATION

1/17/2019
32
DATA• Bilateral (destination-origin) data on international migration: flows and
stocks for up to 224 origin and 30 OECD receiving countries (Adsera and Pytliková, EJ, 2015)
• Survey data from the Integrated Values Survey: 30 OECD destination countries
• Averages by country for each wave. Up to 7 waves; linear interpolation for the years with no survey.
• Other time-variant covariates: GDP, U rates, distance, social redistribution, immigration policies, political pressure, etc.
ANTI-IMMIGRANT ATTITUDES AND INTERNATIONAL MIGRATION
MEASURING NATIVES’ ATTITUDES
ANTI-IMMIGRANT ATTITUDES AND INTERNATIONAL MIGRATION
Measure Survey questions from the IVS NObs.
periodM SV
No neighbor “On this list are various groups of people. Couldyou sort out any that you would not like to haveas neighbors?”(1) If a respondent mentions either“immigrants/foreign workers” or “people from adifferent race,”(0) otherwise.
28,224 1981–
2009
0.18 0.12
Labordiscrimination
“When jobs are scarce, employers should givepriority to [nation] people over immigrants. Doyou:(0) disagree or neither, or (1) agree?”
25,536 1989 –
2009
0.62 0.18
no neighbor With linear interpolation of the years with no IVSwave
150,080 1981–
2009
0.18 0.11
Labordiscrimination
With linear interpolation of the years with no IVSwave
116,480 1989 –
2009
0.62 0.18
1/17/2019
33
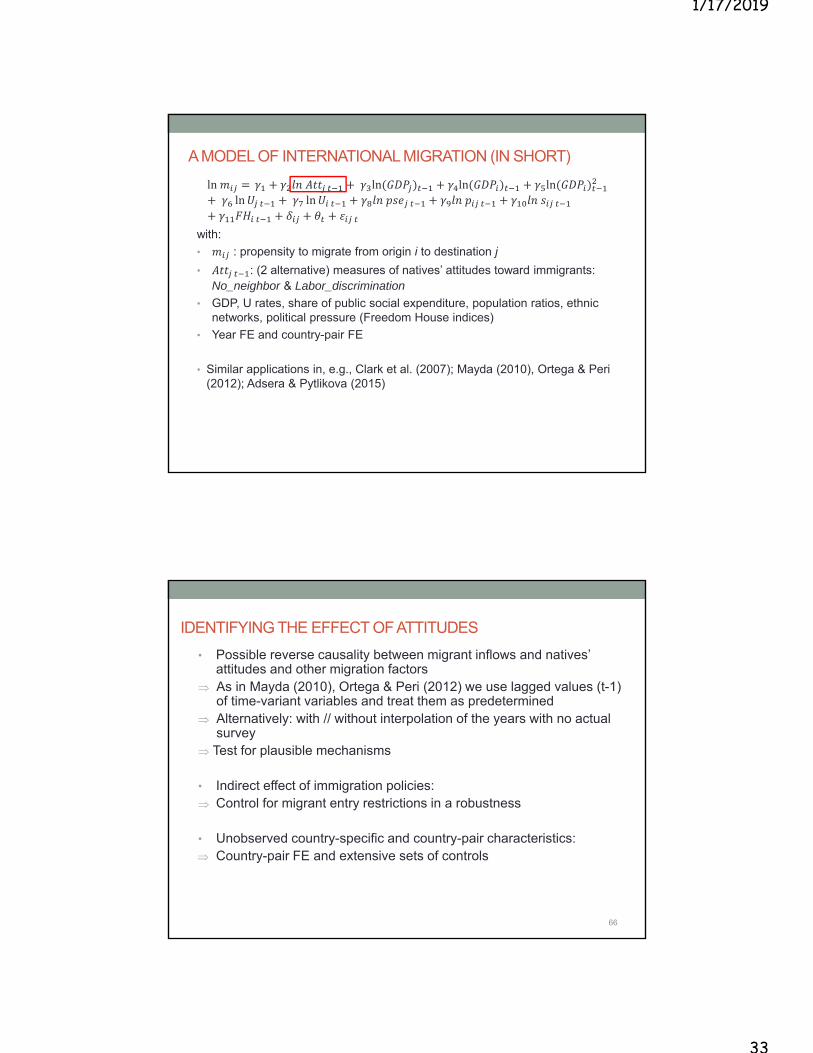
A MODEL OF INTERNATIONAL MIGRATION (IN SHORT)
ln ln ln ln ln ln
with:
• : propensity to migrate from origin i to destination j
• : (2 alternative) measures of natives’ attitudes toward immigrants: No_neighbor & Labor_discrimination
• GDP, U rates, share of public social expenditure, population ratios, ethnic networks, political pressure (Freedom House indices)
• Year FE and country-pair FE
• Similar applications in, e.g., Clark et al. (2007); Mayda (2010), Ortega & Peri(2012); Adsera & Pytlikova (2015)
ANTI-IMMIGRANT ATTITUDES AND INTERNATIONAL MIGRATION
IDENTIFYING THE EFFECT OF ATTITUDES
• Possible reverse causality between migrant inflows and natives’ attitudes and other migration factors
As in Mayda (2010), Ortega & Peri (2012) we use lagged values (t-1) of time-variant variables and treat them as predetermined
Alternatively: with // without interpolation of the years with no actual survey
Test for plausible mechanisms
• Indirect effect of immigration policies: Control for migrant entry restrictions in a robustness
• Unobserved country-specific and country-pair characteristics: Country-pair FE and extensive sets of controls
66ANTI-IMMIGRANT ATTITUDES AND INTERNATIONAL MIGRATION
1/17/2019
34
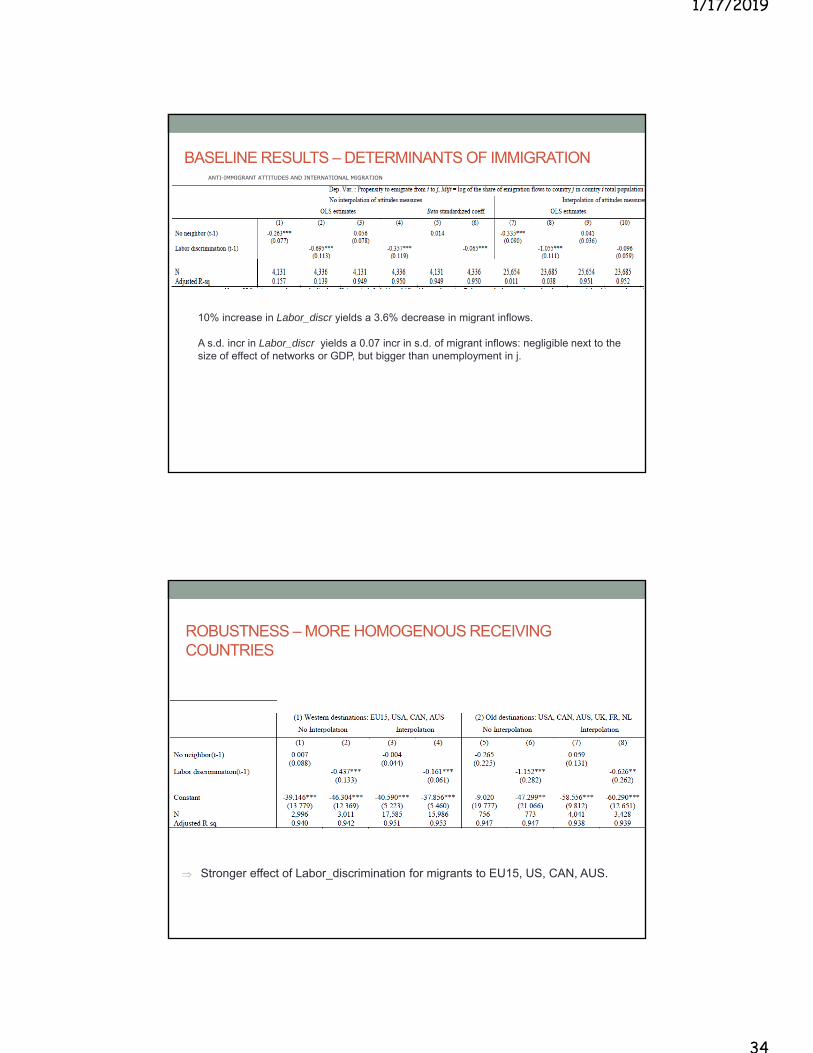
BASELINE RESULTS – DETERMINANTS OF IMMIGRATIONANTI-IMMIGRANT ATTITUDES AND INTERNATIONAL MIGRATION
10% increase in Labor_discr yields a 3.6% decrease in migrant inflows.
A s.d. incr in Labor_discr yields a 0.07 incr in s.d. of migrant inflows: negligible next to the size of effect of networks or GDP, but bigger than unemployment in j.
ROBUSTNESS – MORE HOMOGENOUS RECEIVING COUNTRIES
Stronger effect of Labor_discrimination for migrants to EU15, US, CAN, AUS.

1/17/2019
35
MECHANISMS –
1. POSSIBLE INDIRECT EFFECT OF RESTRICTIVE IMMIGRATION POLICIES
2. EFFECT OF ATTTITUDES ON DIFFERENT TYPES OF IMMIGRANTS • Proxy for labor motivation
3. INFORMATION CHANNELS• Ethnic networks
• Destination language and medias
• Out-migration
MECHANISMS – 1. INDIRECT EFFECT OF RESTRICTIVE IMMIGRATION POLICIES?
Effect persistent even when controlling for immigration policies

1/17/2019
36
MECHANISMS – 2. EFFECT OF ATTTITUDES ON DIFFERENT TYPES OF IMMIGRANTS
Economically driven immigrants react more to anti-immigrant attitudes, espec. to the likelihood of labordiscrimination
MECHANISMS – 3. INFORMATION CHANNELS
Language knowledge (media?): the most plausible information channel

1/17/2019
37
CONCLUSION
• Most robust finding:
Natives’ readiness to discriminate against immigrants, when jobs are scarce, influences the location choice of immigrants
• Directly; not only through tighter immigration policies
• Natives’ hostility to immigrants: a larger cost for immigrants
o that are economically driven (i.e., OECD migrants)
o from countries with a common language/countries linguistically closer
Political challenge: How to influence natives’ hostility when high structural demand for foreign workers?
Strengthening interpersonal trust across ethnic groups(Putnam 2007; Rustenbach 2010)
BASELINE RESULTS – DETERMINANTS OF IMMIGRATION

1/17/2019
38
• Selectivity in migration, models of migration and empirical evidence
THE NEXT LECTURES
• Immigrant performance and integration; the second generation• Immigrants and innovation; International migration and globalization • Impacts of immigration • Immigration policy • Diversity - Impacts of workforce diversity on firms and economies • Emigration and source countries; Brain drain and brain gain;
Remittances
OUR NEXT LECTURE – Tuesday 22.1.2019, 11.30-13.00