iv. environmental impact analysis k. traffic, access, and
TRANSCRIPT
City of Los Angeles Boyle Heights Mixed-Use Community Project SCH. No. 2008061123 October 2011
Page IV.K-1
WORKING DRAFT – Not for Public Review
IV. Environmental Impact Analysis K. Traffic, Access, and Parking
1. Introduction
This section analyzes the potential project impacts associated with traffic, access, and parking. The analyses in this section are based on the Traffic Impact Study for the Boyle Heights Mixed-Use Project (Traffic Study), prepared by Fehr & Peers and dated June 2011. The Los Angeles Department of Transportation (LADOT) and the Los Angeles Department of City Planning reviewed the Traffic Study prior to circulation of this Draft EIR and approved it on October 1, 2010. A copy of the LADOT Traffic Study is included as Appendix L of this Draft EIR. In addition to this analysis, a supplemental analysis is provided in Appendix O of this Draft EIR that evaluates the project’s traffic impacts against the existing baseline condition based on the opinion of the California Court of Appeal for the Sixth District on the case Sunnyvale West Neighborhood Association v. City of Sunnyvale City Council.
2. Environmental Setting a. Existing Conditions
The project site is located in the highly urbanized southwestern portion of the Boyle Heights Community. The Boyle Heights Community lies to the east of downtown Los Angeles and is formed by regionally oriented office, cultural/entertainment, retail and residential buildings; it is also located east of a large swath of industrial activity which surrounds the downtown core. The Boyle Heights Community also lies to the north of a large swath of industrial uses that is historically organized around rail lines, and at the south and west ends of residential and retail uses that comprise the majority of the Boyle Heights Community. Specifically, the project site lies at a transitional edge between industrial uses and residential/retail uses. To facilitate effective movement of vehicles throughout the project area, a network of freeway and street facilities are spread throughout the study area.1 Below is a brief description of the types of facilities available in the area:
1 As further discussed on page IV.K-9, the study area selected for the project impact analysis in the Traffic Study is approximately 4.5 miles in diameter and includes the project site as well as 94 study intersections located in multiple jurisdictions.
IV.K Traffic, Access, and Parking
City of Los Angeles Boyle Heights Mixed-Use Community Project SCH. No. 2008061123 October 2011
Page IV.K-2
WORKING DRAFT – Not for Public Review
Freeways—With a controlled number of entry points and grade-separated from city streets, freeways are intended to provide high speed regional movement.
Major Highways-Class I—Are designed to carry more than 50,000 vehicles per day, typically with six full-time through lanes, one median/left-turn lane, and two part-time parking lanes. Access to abutting uses is limited.
Major Highways-Class II—Are designed to carry 30,000 to 50,000 vehicles per day, typically with four full-time through lanes, two part-time parking lanes, and one median/left-turn lane.
Secondary Highways—Are designed to carry 20,000 to 30,000 vehicles per day, typically with four full-time through lanes, one median/left turn lane, and two full-time parking lanes. They supplement the through traffic carrying characteristics of Major Highways and are typically spaces one mile apart.
Collector Streets—Are designed to carry up to 10,000 vehicles per day, typically with two full-time through lanes, and two full time parking lanes. Collector streets allow moderate volumes of through traffic, but provide access to abutting uses.
Local Streets—Are designed primarily to provide access from abutting uses to the street network. Through traffic is discouraged.
(1) Freeway System
Primary regional access to the study area is provided by a series of freeways, which are listed below:
The Santa Monica Freeway (I-10) runs east-west and extends from the City of Santa Monica eastward past downtown Los Angeles. The freeway provides five lanes in each direction west of the I-10/SR 60 junction, three lanes in each direction between the I-10/SR 60 and I-10/I-5 junctions, and six lanes in east direction west of the I-10/I-5 junction. The interchange closest to the project site is at Boyle Avenue.
The Hollywood Freeway (US 101) runs north-south and extends from Hollywood to the I-5/US 101 junction in the vicinity of the study area. Before merging with the Santa Ana Freeway, the Hollywood Freeway provides three lanes in each direction in the vicinity of the project site. The closest interchanges are at Soto Street and Euclid Avenue.
The Golden State Highway/Santa Ana Freeway (I-5) runs north-south through the Los Angeles area from north of the San Fernando Valley to south of Santa Ana. The project site is less than one-quarter mile south of the I-5 freeway,
IV.K Traffic, Access, and Parking
City of Los Angeles Boyle Heights Mixed-Use Community Project SCH. No. 2008061123 October 2011
Page IV.K-3
WORKING DRAFT – Not for Public Review
which provides five lanes in each direction through the vicinity. The closest interchanges are near Lorena Street and Indiana Street.
Pomona Freeway (SR 60) runs east-west and extends from the East Los Angeles Interchange eastward past Pomona. In the vicinity of the study area, the Pomona Freeway provides five lanes in each direction plus auxiliary lanes. The interchanges closest to the project site are at Lorena Street and Soto Street.
(2) Local Streets
Listed below are a series of local streets that provide regional and local access to the project site (detailed street descriptions are also included in Table 4 of the Traffic Study, included as Appendix L to this Draft EIR):
(a) East/West Arterials
Whittier Boulevard—Whittier Boulevard is a Secondary Highway with two travel lanes in each direction. Parking is generally allowed on both sides of the street but limited along some segments. The posted speed limit is 35 mph.
7th Street—7th Street is designated as a Secondary Highway between Central Avenue and Soto Street. Between Soto Street and Euclid Avenue, it is designated as a Collector. It has two travel lanes in each direction from Central Avenue to Boyle Avenue, and one travel lane in each direction from Boyle Avenue to Euclid Avenue. Parking is generally allowed on both sides of the street east of Boyle Avenue of the street but limited along some segments. The posted speed limit is 35 mph.
8th Street—8th Street, which runs along the north side of the project site, is a Secondary Highway with two travel lanes in each direction from McGarry Street to Olympic Boulevard. Parking is generally allowed on both sides of the street but limited along some segments. The posted speed limit is 35 mph.
Olympic Boulevard—Olympic Boulevard, which runs along the south side of the project site, is a Class II Major Highway with two travel lanes in each direction through the study area. Parking is limited on both sides of the street in the study area. A.M. peak period parking restrictions are in place on the westbound side of the street between McGarry Street and Orme Avenue; P.M. peak period restrictions are in place on the eastbound side of the street between Dacotah Street and Indiana Street. Dedicated left-turn lanes are provided at most intersections. The posted speed limit is 40 mph.
Washington Boulevard—Washington Boulevard is a Class II Major Highway with two to three travel lanes in each direction through the study area. Parking is limited on both sides of the street. A.M. and P.M. peak period parking restrictions
IV.K Traffic, Access, and Parking
City of Los Angeles Boyle Heights Mixed-Use Community Project SCH. No. 2008061123 October 2011
Page IV.K-4
WORKING DRAFT – Not for Public Review
are in place on the westbound side of the street between McGarry Street and Santa Fe Avenue and on the eastbound side of the street between McGarry Street and Alameda Street; P.M. peak period restrictions are in place on the eastbound side of the street between Alameda Street and Santa Fe Avenue. Dedicated left-turn lanes are provided at most intersections. The posted speed limit is 40 mph.
(b) North/South Arterials
Boyle Avenue—Boyle Avenue is a four-lane highway between St. Louis Street and Short Street, which narrows to a two-lane highway north of St. Louis Street and south of Short Street. Between Whittier Boulevard and 8th Street, parking is not allowed on the eastbound side and is restricted to off-peak periods on the westbound side. Dedicated left-turn lanes are provided at most major intersections. The posted speed limit is 35 mph.
Soto Street—Soto Street is a Class II Major Highway with two travel lanes in each direction through the study area. Parking is limited along both sides of the street. A.M. peak period parking restrictions are in place on both sides of the street between Whittier Boulevard and 50th Street and on the westbound side only between Michigan Avenue and Whittier Boulevard; P.M. peak period restrictions are in place on the eastbound side of the street between Michigan Avenue and Whittier Boulevard. Dedicated left-turn lanes are provided at most intersections. The posted speed limit is 35 mph.
Marietta Street—Marietta Street is a Collector with one travel lane in each direction through the study area. Parking is available along both sides of the street. The posted speed limit is 25 mph.
Euclid Avenue—Euclid Avenue is a Collector with primarily one travel lane in each direction through the study area. Parking is available along both sides of the street, though is limited on some segments. The posted speed limit is 25 mph.
Lorena Street—Lorena Street is a Class II Major Highway with two travel lanes in each direction through the study area. Parking is limited along both sides of the street. Dedicated left-turn lanes are provided at major intersections. The posted speed limit is 35 mph.
(3) Transit
The study area is served by three local transit agencies in the form of local and express bus service. The Los Angeles County Metropolitan Transportation Authority (Metro), Montebello Bus Lines, and the El Sol shuttle provide public transit service to the study area. The Metro bus system provides 13 bus lines in the form of both rapid and local
IV.K Traffic, Access, and Parking
City of Los Angeles Boyle Heights Mixed-Use Community Project SCH. No. 2008061123 October 2011
Page IV.K-5
WORKING DRAFT – Not for Public Review
bus service in the study area; Montebello Bus Lines operates three lines, and El Sol provides one shuttle.
The following provides a brief description of the bus lines providing service in the study area:
Metro Line 18: This local bus service route travels between Koreatown and Montebello. In the study area, this route travels east and west along Whittier Boulevard and 6th Street. The peak-hour headway (i.e., the time between successive buses) is approximately five to 10 minutes.
Metro Lines 30/31: These local bus service routes travel between the Pico-Rimpau Transit Center in West Los Angeles and East Los Angeles College. The two lines are identical until they reach Boyle Heights. At Rowan Ave, Line 30 takes a northbound route along Hammel Street and Floral Drive; at Line 31 continues heading east on 1st Street. In the study area, these bus routes travel east and west along 1st Street. The peak-hour headway is approximately 13 to 18 minutes.
Metro Line 60: This local bus service route travels between downtown Los Angeles and the City of Long Beach. In the study area, this bus route travels east and west along 7th Street west of Santa Fe Avenue and north and south along Santa Fe Avenue south of 7th Street. Peak-hour headways are approximately five to 15 minutes.
Metro Line 62: This local bus service route travels between downtown Los Angeles and Hawaiian Gardens. In the study area, this bus route travels east and west along 7th Street west of Boyle Avenue; north and south along Boyle Avenue between 7th Street and Olympic Boulevard; east and west along Olympic Boulevard between Boyle Avenue and Telegraph Road and east and west along Telegraph Road south of Olympic Boulevard. The peak-hour headways are approximately 23 to 30 minutes.
Metro Lines 66 and 366: These bus service routes travel between Koreatown and Montebello’s Metrolink station. The routes are identical; however, Route 366 provides limited stops along the corridor. In the study area, the bus route travels east and west along Olympic Boulevard west of Soto Street; north and south along Soto Street between Olympic Boulevard and 8th Streets; east and west along 8th Street between Soto Street and Olympic Boulevard and east and west along Olympic Boulevard east of 8th Street. Combined A.M. peak-hour headways are approximately 1 to 3 minutes, and 5 to 7 minutes during the P.M. peak hour.
Metro Lines 251 and 252: These local buses travel between the City of Lynwood and El Sereno (251) or Cypress Park (252). In the study area, these bus routes
IV.K Traffic, Access, and Parking
City of Los Angeles Boyle Heights Mixed-Use Community Project SCH. No. 2008061123 October 2011
Page IV.K-6
WORKING DRAFT – Not for Public Review
travel north and south along Soto Street. Peak-hour headways are approximately 12 minutes between Boyle Heights and Huntington Park, 24 minutes between Cypress Park and Boyle Heights, and 24 to 36 minutes between Huntington Park and Lynwood.
Metro Line 254: This local bus service route travels between Watts and Boyle Heights. In the study area, this route travels north and south along Grande Vista Avenue north of Vernon and north and south along Lorena Street north of Grande Vista Avenue. The peak-hour headways are approximately one hour.
Metro Line 605: This local bus service route travels between the community of Boyle Heights and the LA County/USC Medical Center. In the study area, this route travels north and south along Grande Vista Avenue between Olympic Boulevard and 8th Street; east and west along 8th Street between Grande Vista Avenue and Lorena Street; north and south along Lorena Street between 8th and 4th Streets; east and west along 4th Street between Lorena and Soto Streets and north and south along Soto Street between 4th Street and Marengo Avenue. The peak-hour headways are is approximately 10 to 15 minutes.
Metro Line 620: This local shuttle route connects the community of Boyle Heights with the LA County/USC Medical Center. In the study area, this bus route travels north and south along Boyle Avenue between 1st Street and Whittier Boulevard; east and west along Whittier Boulevard between Boyle Avenue and Soto Street; north and south along Soto Street between Whittier Boulevard and 4th Street; east and west along 4th Street between Soto Street and Evergreen Avenue, north and south on Evergreen, east and west on 1st Street, and north and south on Mott Street. The peak-hour headways are approximately 16 minutes.
Metro Line 665: This local shuttle route provides service between Cal State Los Angeles, City Terrace, and Boyle Heights. Near the project site, this line travels along Olympic Boulevard between Rio Vista Avenue and Indiana Street. The peak-hour headways are approximately 30 minutes.
Metro Rapid Line 720: This Metro Rapid line provides limited-stop service between the City of Santa Monica and the City of Commerce. In the study area, this bus route travels east and west along Whittier Boulevard. The peak-hour headways are approximately 10 to 14 minutes.
Metro Rapid Line 751: This Metro Rapid line provides limited-stop service between the communities of Lynwood and Cypress Park. In the study area, this bus route travels north and south along Soto Street. The peak-hour headways are approximately 10 to 15 minutes.
Montebello Bus Line Route 40: This local bus route connects Whittier with downtown Los Angeles. In the study area, this route travels along 4th Street.
IV.K Traffic, Access, and Parking
City of Los Angeles Boyle Heights Mixed-Use Community Project SCH. No. 2008061123 October 2011
Page IV.K-7
WORKING DRAFT – Not for Public Review
Peak-hour headways are approximately 8 to 10 minutes between Downtown and Montebello, and seven to 13 minutes between Montebello and Norwalk.
Montebello Bus Line Route 50: This local bus route service connects downtown Los Angeles with La Mirada. In the study area, this route travels east and west along Washington Boulevard. Peak-hour headways are approximately 26 to 35 minutes.
Montebello Bus Line Routes 341/342: This peak-hour limited service operates two routes between downtown Los Angeles and Montebello, and a third route extends east to Whittier. In the study area, this bus lines travel east and west along 4th Street. The peak-hour headways for the combined routes are approximately 30 minutes.
East Los Angeles “El Sol” Shuttle—Union Pacific Route: This local circulator route operated by Los Angeles County provides service throughout the community of East Los Angeles. In the study area, this bus route travels north and south along Indiana Street between 1st Street and Hubbard Street as well as between Whittier Boulevard and Olympic Boulevard. Peak-hour headways are approximately one hour.
Figure 4 in the Traffic Study (see Appendix L to this Draft EIR) illustrates the existing transit routes that serve the study area, and Table 5 in the Traffic Study details the hours of operation and average peak-hour headways. Ridership and capacity information for each of the eight lines that directly serve the project site are provided in Table 6 of the Traffic Study.
At the time the traffic counts were conducted, Metro was constructing the Eastside Extension of the Metro Gold Line, a light rail line that links the Boyle Heights community with Union Station and other Metro lines that serve locations throughout the Los Angeles region. The Metro Gold Line Eastside Extension includes several station stops in Boyle Heights including stops at Soto Street/First Street and Indiana Street/Third Street, each within approximately 1.25 miles of the project site. This project was under construction at the time the traffic counts were conducted and has since been completed.
(4) Access and Circulation
As illustrated in Figure 6 of the Traffic Study (see Appendix L to this Draft EIR), Olympic Boulevard and 8th Street provide the primary east/west access to the project site. Marietta Street and Euclid Avenue provide primary direct access to the project site from the north, as both streets travel under the I-5 and SR 60 freeways, connecting the project site to the Boyle Heights neighborhoods to the north. Euclid Avenue also provides access to the US 101 freeway. Grande Vista Avenue provides primary direct access to the project
IV.K Traffic, Access, and Parking
City of Los Angeles Boyle Heights Mixed-Use Community Project SCH. No. 2008061123 October 2011
Page IV.K-8
WORKING DRAFT – Not for Public Review
site from the south connecting the project site to Downey Road. Soto Street, although it does not directly border the project site, provides primary access to the project site from the south and from the north via Olympic Boulevard and 8th Street. Vehicular access to the project site is currently provided at the following eight points: Glenn Avenue, Camulos Place, and Rosalind Place from 8th Street; Hostetter Street from Soto Street; Lydia Drive from Grande Vista Avenue; and Orme Avenue, Camulos Street, and Dacotah Street from Olympic Boulevard.
(5) Parking
Currently, parking on the project site is provided in three forms: garage spaces, surface parking lot spaces, and on-street parking spaces along internal streets. A total of 502 parking spaces are provided in existing garage parking. Approximately 586 spaces are provided in surface parking lots, and approximately 711 parking spaces are provided on internal streets. A total of approximately 1,799 parking spaces are currently provided on the project site.
(6) Pedestrian/Bicycle Facilities
(a) Pedestrian Facilities
Pedestrian facilities in the study area include sidewalks, pedestrian signals at signalized intersections, and crosswalks. Striped crosswalks are provided at most of the signalized study intersections.
(b) Bicycle Facilities
In the City of Los Angeles, three types of bicycle facilities are provided:
Class I Bike Paths—Class I bike paths are facilities with exclusive rights-of-way (separated from automobile traffic), with minimal points of conflict with motorists. Bike paths provide the highest level of safety for bicyclists, and may be used either for recreational purposes or as higher-speed commute routes.
Class II Bike Lanes—Class II bike paths provide painted striping within the paved area of streets. Bike lane stripes are intended to promote an orderly flow of traffic by establishing specific lines of demarcation between areas reserved for bicycles and lanes for motor vehicles.
Class III Bike Routes—Class III bike routes are city streets designated as generally safe for shared use between motorist and bicycles.
IV.K Traffic, Access, and Parking
City of Los Angeles Boyle Heights Mixed-Use Community Project SCH. No. 2008061123 October 2011
Page IV.K-9
WORKING DRAFT – Not for Public Review
Class III Bike Routes are the only bicycle facilities in the study area, provided at the following locations:
Lorena Street from Grande Vista Avenue to Indiana Street
East 8th Street from Boyle Avenue to Olympic Boulevard
b. Analysis of Existing Traffic Conditions
(1) Study Intersections
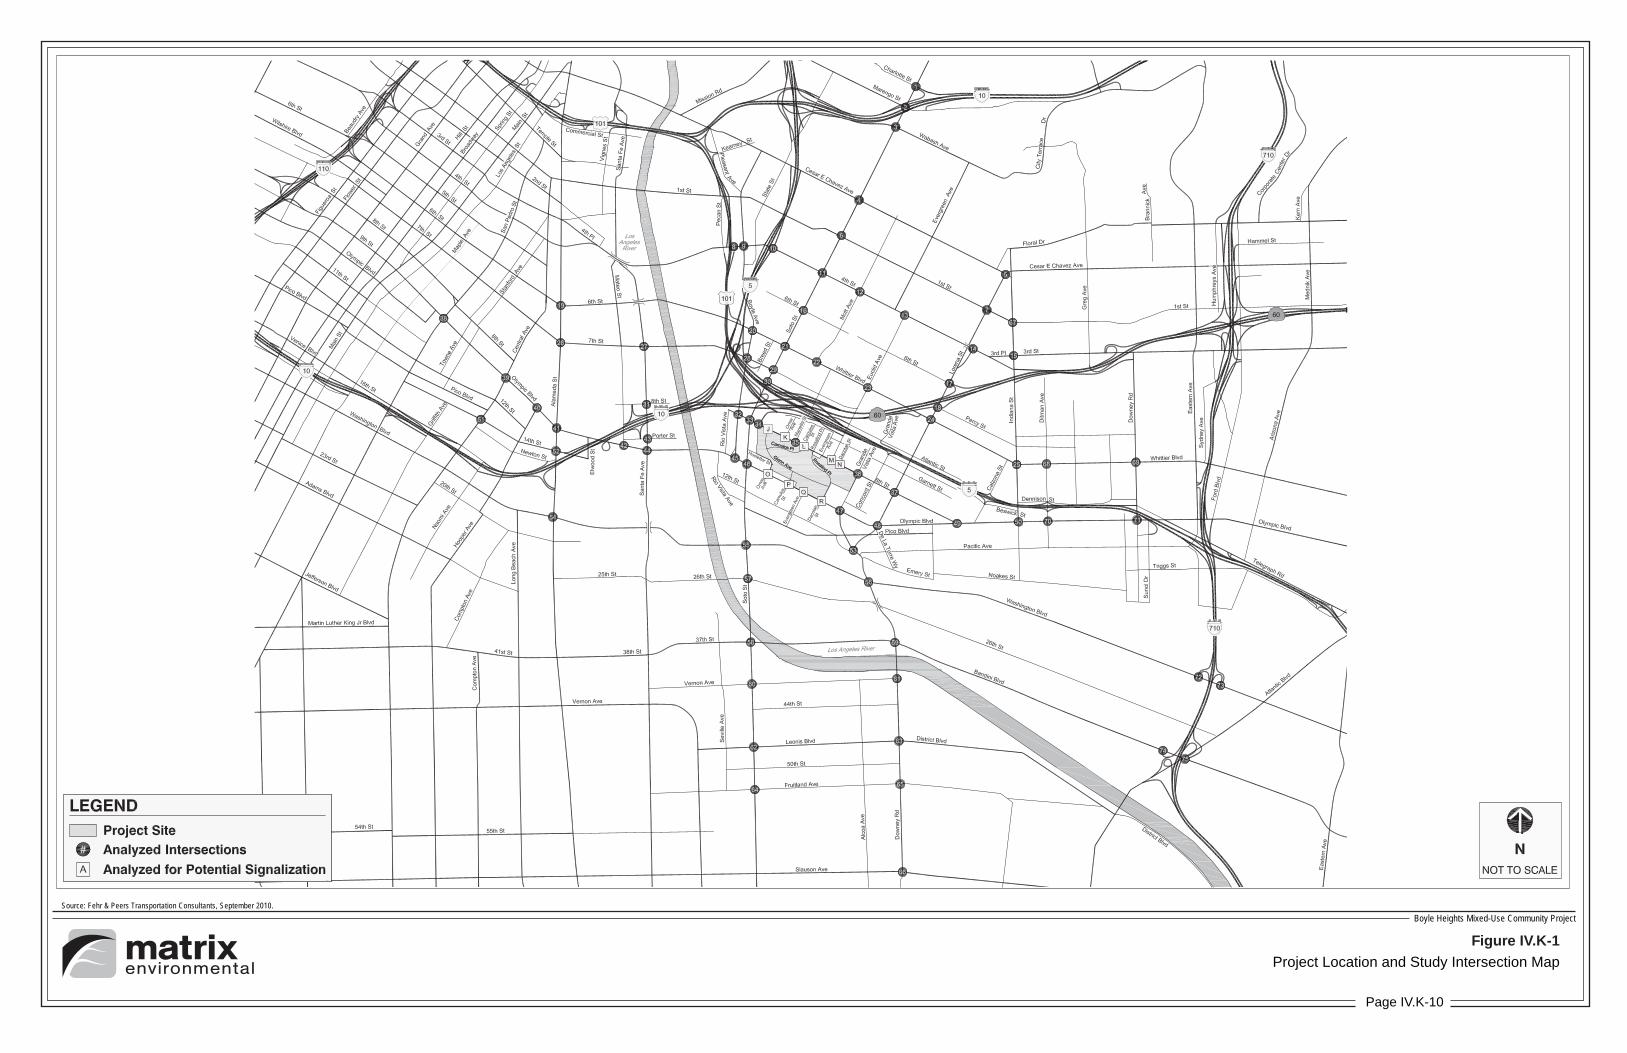
The study area selected for detailed project impact analysis in the Traffic Study was established in consultation with LADOT, and by reviewing the travel patterns and the potential for impacts from project traffic. The study area is approximately 4.5 miles in diameter and includes a total of 75 signalized study intersections. Of the 75 analyzed intersections, 53 are in the City of Los Angeles, five are in the County of Los Angeles, four are jointly controlled by the City of Los Angeles and the County of Los Angeles, 11 are in the City of Vernon (two of which are jointly controlled by the City of Vernon and the City of Maywood), and two are in the City of Commerce. An additional nine unsignalized intersections critical for site access were analyzed. All nine are located in the City of Los Angeles. Figure IV.K-1 on page IV.K-10 illustrates the location of the study intersections, which are as follows:
Signalized Intersections
1. Soto Street & Charlotte Street/I-10 Westbound Ramps (City of Los Angeles/Caltrans)
2. Soto Street & Marengo Street (City of Los Angeles)
3. Soto Street & Wabash Avenue/I-10 Eastbound Off-Ramp(City of Los Angeles/Caltrans)
4. Soto Street & Cesar Chavez Avenue (City of Los Angeles)
5. Lorena Street & Cesar Chavez Avenue (City of Los Angeles)
6. Soto Street & 1st Street (City of Los Angeles)
7. Lorena Street & 1st Street (City of Los Angeles)
8. US 101 NB Off-Ramp & 4th Street (City of Los Angeles/Caltrans)
9. Boyle Avenue & 4th Street (City of Los Angeles)
Page
Figure IV.K-1
Project Location and Study Intersection Map
Source: Fehr & Peers Transportation Consultants, September 2010.Boyle Heights Mixed-Use Community Project
Page IV.K-10
IV.K Traffic, Access, and Parking
City of Los Angeles Boyle Heights Mixed-Use Community Project SCH. No. 2008061123 October 2011
Page IV.K-11
WORKING DRAFT – Not for Public Review
10. I-5 NB Ramps & 4th Street (City of Los Angeles/Caltrans)
11. Soto Street & 4th Street (City of Los Angeles)
12. Mott Street & 4th Street (City of Los Angeles)
13. Euclid Avenue & 4th Street (City of Los Angeles)
14. Lorena Street & 4th Street (City of Los Angeles)
15. Indiana Street & 3rd Pl/3rd Street (City of Los Angeles/County of Los Angeles)
16. Soto Street & 6th Street (City of Los Angeles)
17. Lorena Street & SR 60 WB Ramps (City of Los Angeles/Caltrans)
18. Lorena Street & SR 60 EB Ramps (City of Los Angeles/Caltrans)
19. Alameda Street & 6th Street (City of Los Angeles)
20. Boyle Avenue & Whittier Boulevard (City of Los Angeles)
21. Soto Street & Whittier Boulevard (City of Los Angeles)
22. Mott Street & Whittier Boulevard (City of Los Angeles)
23. Euclid Avenue & Whittier Boulevard (City of Los Angeles)
24. Lorena Street & Whittier Boulevard (City of Los Angeles)
25. Indiana Street & Whittier Boulevard (City of Los Angeles/County of Los Angeles)
26. Alameda Street & 7th Street (City of Los Angeles)
27. Santa Fe Avenue & 7th Street (City of Los Angeles)
28. Boyle Avenue & 7th Street (City of Los Angeles)
29. Soto Street & 7th Street (City of Los Angeles)
30. Soto Street & US 101 NB ON-Ramp/ I-5 (City of Los Angeles/Caltrans)
31. Santa Fe Avenue & 8th Street (City of Los Angeles)
32. Boyle Avenue & 8th Street (City of Los Angeles)
33. Soto Street & 8th Street (City of Los Angeles)
IV.K Traffic, Access, and Parking
City of Los Angeles Boyle Heights Mixed-Use Community Project SCH. No. 2008061123 October 2011
Page IV.K-12
WORKING DRAFT – Not for Public Review
34. I-5 SB On-Ramp & 8th Street (City of Los Angeles)
35. Marietta Street & 8th Street (City of Los Angeles)
36. Grande Vista Avenue & 8th Street (City of Los Angeles)
37. Lorena Street & 8th Street (City of Los Angeles)
38. San Pedro Street & Olympic Boulevard (City of Los Angeles)
39. Central Avenue & Olympic Boulevard (City of Los Angeles)
40. Hooper Avenue & Olympic Boulevard (City of Los Angeles)
41. Alameda Street & Olympic Boulevard (City of Los Angeles)
42. Olympic Boulevard & Mateo Street (City of Los Angeles)
43. Santa Fe Avenue & Porter Street (City of Los Angeles)
44. Santa Fe Avenue & Olympic Boulevard (City of Los Angeles)
45. Boyle Avenue & Olympic Boulevard (City of Los Angeles)
46. Soto Street & Olympic Boulevard (City of Los Angeles)
47. Grande Vista Avenue & Olympic Boulevard (City of Los Angeles)
48. Lorena Street & Olympic Boulevard (City of Los Angeles)
49. 8th Street & Olympic Boulevard (City of Los Angeles)
50. Indiana Street & Olympic Boulevard (City of Los Angeles/County of Los Angeles)
51. Central Avenue & 14th Street (City of Los Angeles)
52. Alameda Avenue & 14th Street (City of Los Angeles)
53. Lorena Street/Union Pacific Avenue & Grande Vista Avenue (City of Los Angeles)
54. Alameda Street & Washington Boulevard (City of Los Angeles)
55. Soto Street & Washington Boulevard (City of Los Angeles)
56. Grande Vista Avenue & Washington Boulevard (City of Los Angeles/City of Vernon)
IV.K Traffic, Access, and Parking
City of Los Angeles Boyle Heights Mixed-Use Community Project SCH. No. 2008061123 October 2011
Page IV.K-13
WORKING DRAFT – Not for Public Review
57. Soto Street & 26th Street (City of Vernon)
58. Soto Street & Bandini Boulevard/37th Street (City of Vernon)
59. Downey Road & Bandini Boulevard (County of Los Angeles)
60. Soto Street & Vernon Avenue (City of Vernon)
61. Downey Road & Vernon Avenue (City of Vernon)
62. Soto Street & Leonis Boulevard (City of Vernon)
63. Downey Road & Leonis Boulevard (City of Vernon)
64. Soto Street & Fruitland Avenue (City of Vernon)
65. Downey Road & Fruitland Avenue (City of Vernon/City of Maywood)
66. Downey Road & Slauson Avenue (City of Vernon/City of Maywood)
67. 1st Street & Indiana Street (City of Los Angeles/County of Los Angeles)
68. Dittman Avenue & Whittier Boulevard (County of Los Angeles)
69. Downey Road & Whittier Boulevard (County of Los Angeles)
70. Dittman Avenue & Olympic Boulevard (County of Los Angeles)
71. Downey Road & Olympic Boulevard (County of Los Angeles)
72. I-710 Southbound Ramps & Washington Boulevard (City of Commerce)
73. I-710 Northbound Ramps & Washington Boulevard (City of Commerce)
74. I-710 Southbound Off-Ramp & Bandini Boulevard (City of Vernon)
75. I-710 Northbound Ramps/Atlantic Boulevard & Bandini Boulevard (City of Vernon)
Unsignalized Intersections2
J. Glen Avenue & 8th Street (City of Los Angeles)
2 All unsignalized study intersections are controlled by stop signs on minor approach.
IV.K Traffic, Access, and Parking
City of Los Angeles Boyle Heights Mixed-Use Community Project SCH. No. 2008061123 October 2011
Page IV.K-14
WORKING DRAFT – Not for Public Review
K. Orme Avenue & 8th Street (City of Los Angeles)
L. Camulos Place/Camulos Street & 8th Street (City of Los Angeles)
M. Euclid Avenue & 8th Street (City of Los Angeles)
N. Dacotah Street & 8th Street (City of Los Angeles)
O. Orme Avenue & Olympic Boulevard (City of Los Angeles)
P. Camulos Street & Olympic Boulevard (City of Los Angeles)
Q. Evergreen Avenue & Olympic Boulevard (City of Los Angeles)
R. Dacotah Street & Olympic Boulevard (City of Los Angeles)
Intersection turning movement counts for the morning and afternoon peak periods were collected in May 2008 and March 2009. Traffic counts were taken for typical morning (7:00 to 9:00 A.M.) and afternoon (4:00 to 6:00 P.M.) peak periods during weekdays while school was in session. This time period and season represents the busiest time of the year for total traffic conditions in the study area. Although the actual peak hours vary slightly from intersection to intersection, in the study area the existing overall peak morning and afternoon commute time periods were most often from 7:15 to 8:15 A.M. and 4:45 to 5:45 P.M., respectively. The existing lane configurations at the intersections and the traffic counts are provided in Appendices A and B in the Traffic Study (included as Appendix L to this Draft EIR), respectively.
(a) Intersections Affected by Metro Gold Line Eastside Extension Construction
At the time counts were collected, four intersections were under construction to accommodate the Metro Gold Line Eastside Extension: Nos. 6, 7, 15, and 67. Thus, partial lane closures were in effect at Intersections 6, 7, and 15 when traffic counts were collected. To adjust for pre-construction traffic conditions, P.M. peak-hour counts collected for the preparation of the Gold Line Eastside Extension EIR were utilized. A 1 percent annual ambient growth rate was used to grow the Year 2000 counts to 2008 levels. Because A.M. peak-hour counts were not available, the ratio between the 2008 A.M. and P.M. counts was applied to the Year 2000 P.M. peak-hour counts to develop an A.M. peak-hour count. The Year 2000 counts and the tables used to factor the counts are provided in Appendix B in the Traffic Study (included as Appendix L to this Draft EIR). Intersection 67 was substantially completed when traffic counts were collected, so the existing traffic volumes were used without modification.
IV.K Traffic, Access, and Parking
City of Los Angeles Boyle Heights Mixed-Use Community Project SCH. No. 2008061123 October 2011
Page IV.K-15
WORKING DRAFT – Not for Public Review
(b) Intersections Affected by Truck Traffic
Additionally, because many of the study intersections are located in industrial areas, truck traffic makes up a greater percentage of overall traffic at these intersections than is typically the case in non-industrial areas. In locations where trucks were determined to be at least 5 percent of total traffic volume, a 2.0 passenger-car equivalency (PCE) factor was applied to the truck portion of the traffic flow to account for the congesting effects of truck traffic in the Level of Service (LOS) analysis discussed below. Table 7 in the Traffic Study (see Appendix L to this Draft EIR) lists the intersections where truck PCE factors were applied, and the A.M. and P.M. peak-hour truck percentages that were determined from the traffic counts.
(c) Level of Service Methodology
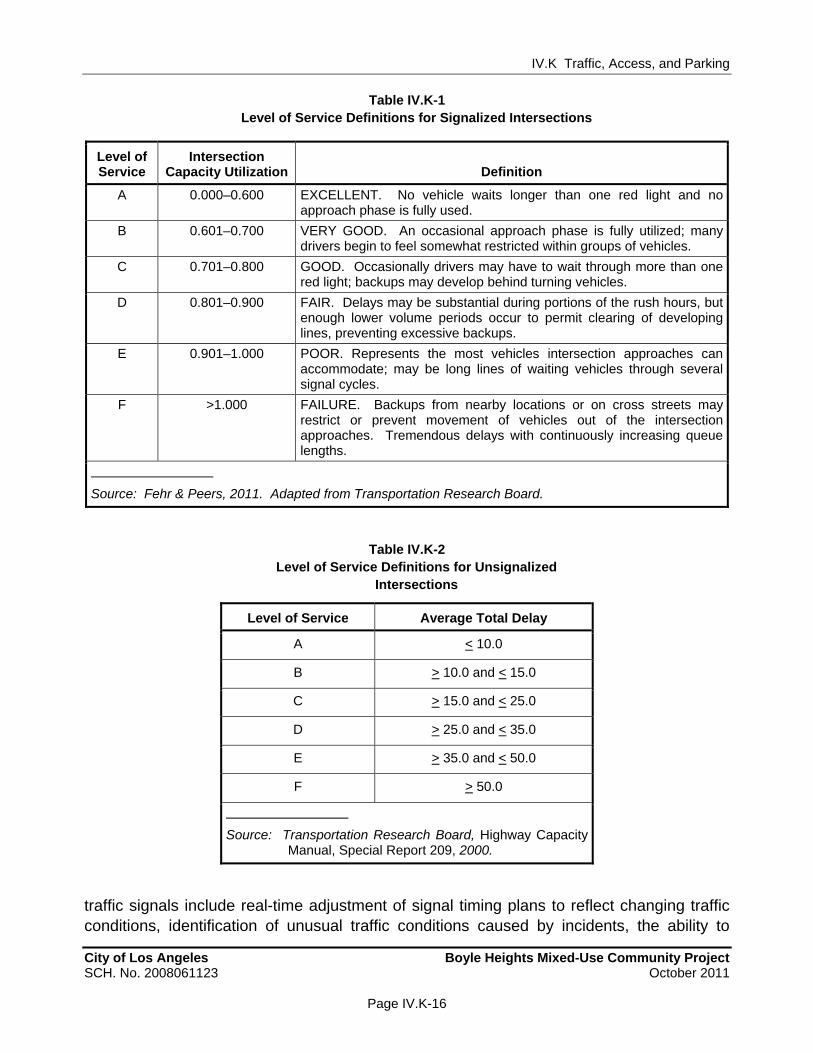
LOS is a qualitative measure used to describe the condition of traffic flow on the street system, ranging from excellent conditions at LOS A to overloaded conditions at LOS F. LOS for signalized intersections is defined below in Table IV.K-1 on page IV.K-16.
Per LADOT methodology, existing and future operations for the signalized study intersections were analyzed using the Critical Movement Analysis (CMA) method of intersection capacity calculation. The CMA methodology determines the peak-hour intersection volume-to-capacity (V/C) ratio by comparing existing traffic volumes to standard per-lane street capacities. The V/C ratio is then used to determine the corresponding LOS based on the definitions in Table IV.K-1. The “CalcaDB” CMA analysis software developed by the LADOT was used to analyze the study intersections under full or partial jurisdiction of the City of Los Angeles.
Unsignalized intersections critical for site access were analyzed using the Two-Way Stop Controlled methodology from the 2000 Highway Capacity Manual (HCM). The 2000 HCM Two-Way Stop Controlled methodology determines the average vehicle delay of the worst approach during the peak hour to find the corresponding LOS, as defined below in Table IV.K-2 on page IV.K-16. Per the traffic study guidelines from the LADOT, signal warrant analysis was also conducted, testing the 8-Hour, 4-Hour, and Peak-Hour Vehicular Volume signal warrants.
(d) Computer Traffic Signal Control
The City of Los Angeles’ Automated Traffic Surveillance and Control (ATSAC) System represents an advanced system in computer control of traffic signals. It was first put into operation in June 1984 in the Coliseum area of the City of Los Angeles to anticipate the expected increase in traffic due to the Summer Olympic Games, and has since been expanded to other parts of the City. The advantages of ATSAC-controlled
IV.K Traffic, Access, and Parking
City of Los Angeles Boyle Heights Mixed-Use Community Project SCH. No. 2008061123 October 2011
Page IV.K-16
WORKING DRAFT – Not for Public Review
Table IV.K-1 Level of Service Definitions for Signalized Intersections
Level of Service
Intersection Capacity Utilization Definition
A 0.000–0.600 EXCELLENT. No vehicle waits longer than one red light and no approach phase is fully used.
B 0.601–0.700 VERY GOOD. An occasional approach phase is fully utilized; many drivers begin to feel somewhat restricted within groups of vehicles.
C 0.701–0.800 GOOD. Occasionally drivers may have to wait through more than one red light; backups may develop behind turning vehicles.
D 0.801–0.900 FAIR. Delays may be substantial during portions of the rush hours, but enough lower volume periods occur to permit clearing of developing lines, preventing excessive backups.
E 0.901–1.000 POOR. Represents the most vehicles intersection approaches can accommodate; may be long lines of waiting vehicles through several signal cycles.
F >1.000 FAILURE. Backups from nearby locations or on cross streets may restrict or prevent movement of vehicles out of the intersection approaches. Tremendous delays with continuously increasing queue lengths.
Source: Fehr & Peers, 2011. Adapted from Transportation Research Board.
Table IV.K-2 Level of Service Definitions for Unsignalized
Intersections
Level of Service Average Total Delay
A < 10.0
B > 10.0 and < 15.0
C > 15.0 and < 25.0
D > 25.0 and < 35.0
E > 35.0 and < 50.0
F > 50.0
Source: Transportation Research Board, Highway Capacity Manual, Special Report 209, 2000.
traffic signals include real-time adjustment of signal timing plans to reflect changing traffic conditions, identification of unusual traffic conditions caused by incidents, the ability to
IV.K Traffic, Access, and Parking
City of Los Angeles Boyle Heights Mixed-Use Community Project SCH. No. 2008061123 October 2011
Page IV.K-17
WORKING DRAFT – Not for Public Review
implement special purpose short-term signal timing changes in response to incidents, and the ability to identify signal equipment malfunctions quickly. LADOT estimates that implementation of this system improves intersection capacity by an average of 7 percent.
In addition to ATSAC, the Adaptive Traffic Control System (ATCS) has been tested and implemented along major travel corridors in the City of Los Angeles. ATCS is a computer-based traffic signal control program that provides fully responsive traffic signal control based on real-time traffic conditions. It automatically adjusts and optimizes traffic signal timing in response to current traffic demands on the entire signal network such that the number of stops and the amount of delay is minimized along with improved traffic signal coordination throughout the network. LADOT estimates that implementation of this system improves intersection capacity by an additional 3 percent over those operating under ATSAC alone.
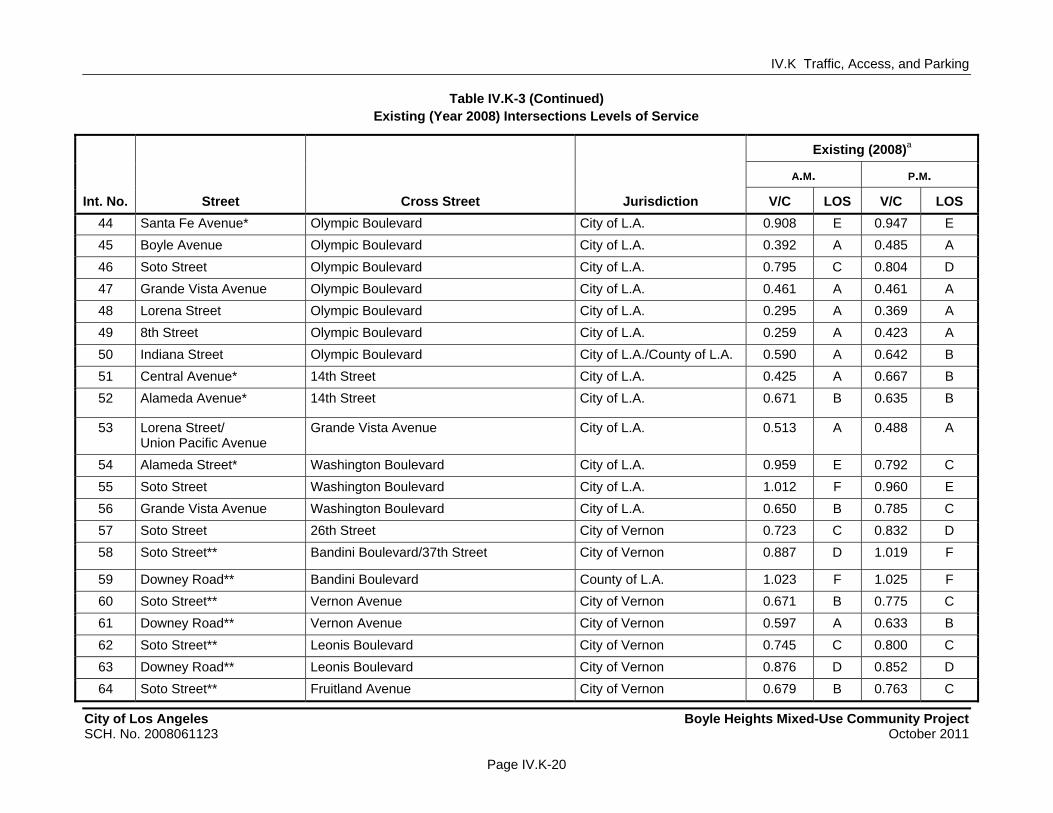
Of the 57 signalized study intersections in the City of Los Angeles (or dual City/County intersections), 43 are currently controlled by both the ATSAC system and the ATCS. In accordance with the LADOT procedures, a capacity increase of 10 percent (0.10 V/C adjustment) was applied to reflect the benefits of the combined ATSAC/ATCS control at these intersections. Additionally, 14 of the study intersections operate under the ATSAC system only. In accordance with standard LADOT procedures, a capacity increase of 7 percent (0.07 V/C adjustment) was applied to reflect the benefits of ATSAC control at those intersections. To be conservative, no intersections outside the City of Los Angeles were adjusted to reflect capacity increases due to the implementation of signal control systems. While the County of Los Angeles does operate a computer traffic signal control system, County of Los Angeles traffic study guidelines do not provide specific criteria in terms of V/C adjustments to account for the increase in intersection capacity from the computer control system. Furthermore, computer traffic signal control systems have not been implemented in the Cities of Vernon, Maywood, and Commerce. Therefore, no V/C adjustments were made at these analyzed intersections.
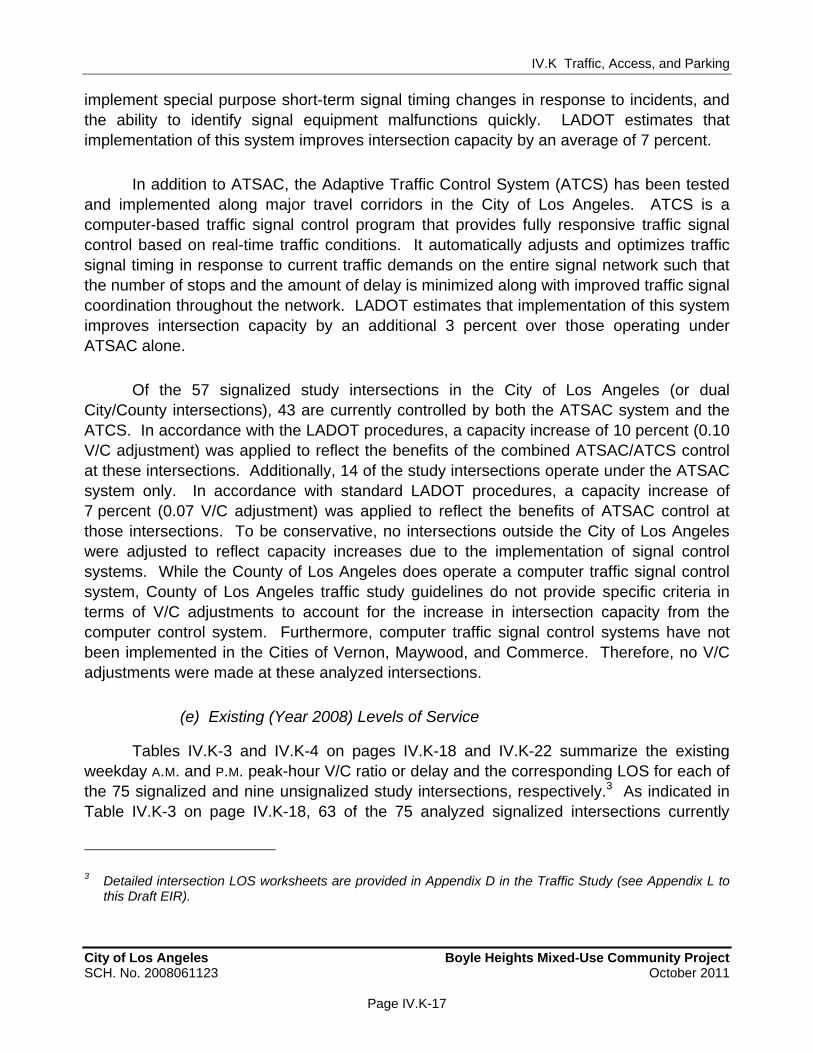
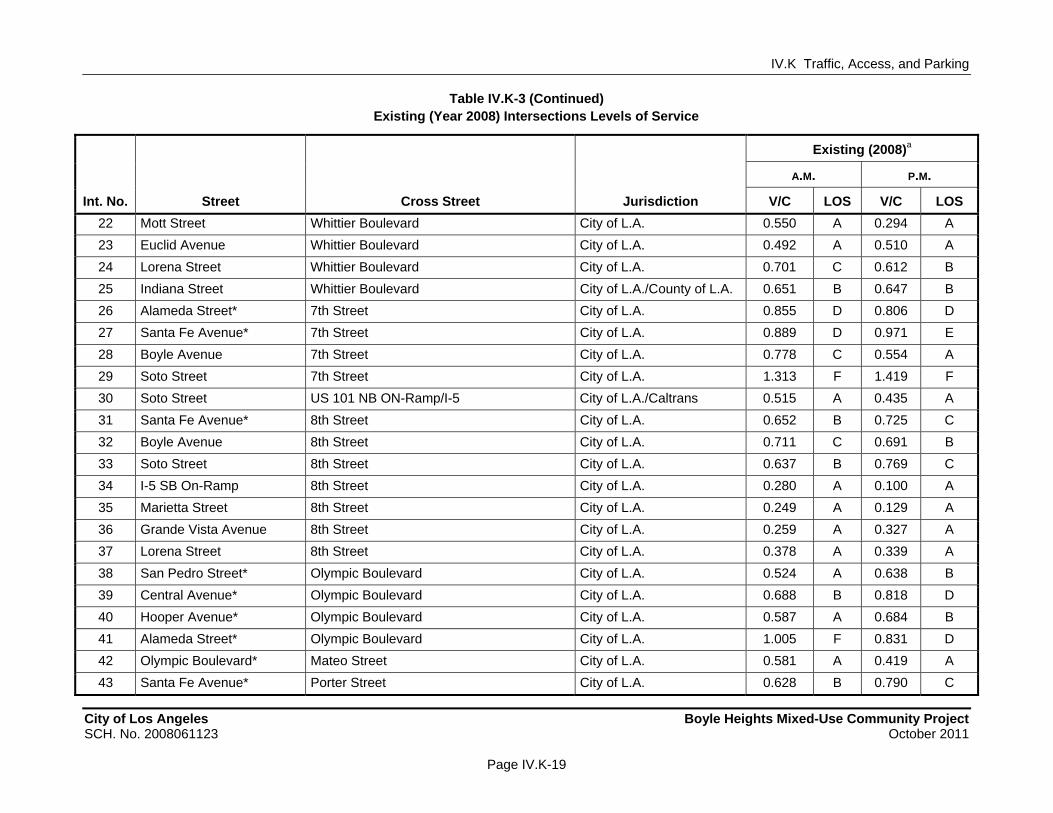
(e) Existing (Year 2008) Levels of Service
Tables IV.K-3 and IV.K-4 on pages IV.K-18 and IV.K-22 summarize the existing weekday A.M. and P.M. peak-hour V/C ratio or delay and the corresponding LOS for each of the 75 signalized and nine unsignalized study intersections, respectively.3 As indicated in Table IV.K-3 on page IV.K-18, 63 of the 75 analyzed signalized intersections currently
3 Detailed intersection LOS worksheets are provided in Appendix D in the Traffic Study (see Appendix L to this Draft EIR).

IV.K Traffic, Access, and Parking
City of Los Angeles Boyle Heights Mixed-Use Community Project SCH. No. 2008061123 October 2011
Page IV.K-18
WORKING DRAFT – Not for Public Review
Table IV.K-3 Existing (Year 2008) Intersections Levels of Service
Existing (2008)a
A.M. P.M.
Int. No. Street Cross Street Jurisdiction V/C LOS V/C LOS
1 Soto Street Charlotte Street/I-10 Westbound Ramps City of L.A./Caltrans 0.971 E 0.888 D
2 Soto Street Marengo Street City of L.A. 0.820 D 0.700 B
3 Soto Street Wabash Avenue/I-10 Eastbound Off-Ramp City of L.A./Caltrans 0.654 B 0.623 B
4 Soto Street Cesar Chavez Avenue City of L.A. 0.562 A 0.579 A
5 Lorena Street Cesar Chavez Avenue City of L.A. 0.430 A 0.611 B
6 Soto Street 1st Street City of L.A. 0.753 C 0.863 D
7 Lorena Street 1st Street City of L.A. 0.495 A 0.679 B
8 US 101 NB Off-Ramp 4th Street City of L.A./Caltrans 0.535 A 0.319 A
9 Boyle Avenue 4th Street City of L.A. 0.413 A 0.445 A
10 I-5 NB Ramps 4th Street City of L.A./Caltrans 0.727 C 0.740 C
11 Soto Street 4th Street City of L.A. 0.616 B 0.666 B
12 Mott Street 4th Street City of L.A. 0.605 B 0.493 A
13 Euclid Avenue 4th Street City of L.A. 0.262 A 0.420 A
14 Lorena Street 4th Street City of L.A. 0.462 A 0.589 A
15 Indiana Street 3rd Place/3rd Street City of L.A./County of L.A. 1.045 F 1.009 F
16 Soto Street 6th Street City of L.A. 0.426 A 0.472 A
17 Lorena Street SR 60 WB Ramps City of L.A./Caltrans 0.528 A 0.534 A
18 Lorena Street SR 60 EB Ramps City of L.A./Caltrans 0.372 A 0.430 A
19 Alameda Street* 6th Street City of L.A. 0.671 B 0.727 C
20 Boyle Avenue Whittier Boulevard City of L.A. 0.526 A 0.559 A
21 Soto Street Whittier Boulevard City of L.A. 0.549 A 0.566 A
IV.K Traffic, Access, and Parking
Table IV.K-3 (Continued) Existing (Year 2008) Intersections Levels of Service
City of Los Angeles Boyle Heights Mixed-Use Community Project SCH. No. 2008061123 October 2011
Page IV.K-19
WORKING DRAFT – Not for Public Review
Existing (2008)a
A.M. P.M.
Int. No. Street Cross Street Jurisdiction V/C LOS V/C LOS
22 Mott Street Whittier Boulevard City of L.A. 0.550 A 0.294 A
23 Euclid Avenue Whittier Boulevard City of L.A. 0.492 A 0.510 A
24 Lorena Street Whittier Boulevard City of L.A. 0.701 C 0.612 B
25 Indiana Street Whittier Boulevard City of L.A./County of L.A. 0.651 B 0.647 B
26 Alameda Street* 7th Street City of L.A. 0.855 D 0.806 D
27 Santa Fe Avenue* 7th Street City of L.A. 0.889 D 0.971 E
28 Boyle Avenue 7th Street City of L.A. 0.778 C 0.554 A
29 Soto Street 7th Street City of L.A. 1.313 F 1.419 F
30 Soto Street US 101 NB ON-Ramp/I-5 City of L.A./Caltrans 0.515 A 0.435 A
31 Santa Fe Avenue* 8th Street City of L.A. 0.652 B 0.725 C
32 Boyle Avenue 8th Street City of L.A. 0.711 C 0.691 B
33 Soto Street 8th Street City of L.A. 0.637 B 0.769 C
34 I-5 SB On-Ramp 8th Street City of L.A. 0.280 A 0.100 A
35 Marietta Street 8th Street City of L.A. 0.249 A 0.129 A
36 Grande Vista Avenue 8th Street City of L.A. 0.259 A 0.327 A
37 Lorena Street 8th Street City of L.A. 0.378 A 0.339 A
38 San Pedro Street* Olympic Boulevard City of L.A. 0.524 A 0.638 B
39 Central Avenue* Olympic Boulevard City of L.A. 0.688 B 0.818 D
40 Hooper Avenue* Olympic Boulevard City of L.A. 0.587 A 0.684 B
41 Alameda Street* Olympic Boulevard City of L.A. 1.005 F 0.831 D
42 Olympic Boulevard* Mateo Street City of L.A. 0.581 A 0.419 A
43 Santa Fe Avenue* Porter Street City of L.A. 0.628 B 0.790 C
IV.K Traffic, Access, and Parking
Table IV.K-3 (Continued) Existing (Year 2008) Intersections Levels of Service
City of Los Angeles Boyle Heights Mixed-Use Community Project SCH. No. 2008061123 October 2011
Page IV.K-20
WORKING DRAFT – Not for Public Review
Existing (2008)a
A.M. P.M.
Int. No. Street Cross Street Jurisdiction V/C LOS V/C LOS
44 Santa Fe Avenue* Olympic Boulevard City of L.A. 0.908 E 0.947 E
45 Boyle Avenue Olympic Boulevard City of L.A. 0.392 A 0.485 A
46 Soto Street Olympic Boulevard City of L.A. 0.795 C 0.804 D
47 Grande Vista Avenue Olympic Boulevard City of L.A. 0.461 A 0.461 A
48 Lorena Street Olympic Boulevard City of L.A. 0.295 A 0.369 A
49 8th Street Olympic Boulevard City of L.A. 0.259 A 0.423 A
50 Indiana Street Olympic Boulevard City of L.A./County of L.A. 0.590 A 0.642 B
51 Central Avenue* 14th Street City of L.A. 0.425 A 0.667 B
52 Alameda Avenue* 14th Street City of L.A. 0.671 B 0.635 B
53 Lorena Street/ Union Pacific Avenue
Grande Vista Avenue City of L.A. 0.513 A 0.488 A
54 Alameda Street* Washington Boulevard City of L.A. 0.959 E 0.792 C
55 Soto Street Washington Boulevard City of L.A. 1.012 F 0.960 E
56 Grande Vista Avenue Washington Boulevard City of L.A. 0.650 B 0.785 C
57 Soto Street 26th Street City of Vernon 0.723 C 0.832 D
58 Soto Street** Bandini Boulevard/37th Street City of Vernon 0.887 D 1.019 F
59 Downey Road** Bandini Boulevard County of L.A. 1.023 F 1.025 F
60 Soto Street** Vernon Avenue City of Vernon 0.671 B 0.775 C
61 Downey Road** Vernon Avenue City of Vernon 0.597 A 0.633 B
62 Soto Street** Leonis Boulevard City of Vernon 0.745 C 0.800 C
63 Downey Road** Leonis Boulevard City of Vernon 0.876 D 0.852 D
64 Soto Street** Fruitland Avenue City of Vernon 0.679 B 0.763 C
IV.K Traffic, Access, and Parking
Table IV.K-3 (Continued) Existing (Year 2008) Intersections Levels of Service
City of Los Angeles Boyle Heights Mixed-Use Community Project SCH. No. 2008061123 October 2011
Page IV.K-21
WORKING DRAFT – Not for Public Review
Existing (2008)a
A.M. P.M.
Int. No. Street Cross Street Jurisdiction V/C LOS V/C LOS
65 Downey Road** Fruitland Avenue City of Vernon/ City of Maywood
0.560 A 0.541 A
66 Downey Road** Slauson Avenue City of Vernon/ City of Maywood
0.713 C 0.747 C
67 1st Street Indiana Street City of L.A./County of L.A. 0.373 A 0.590 A
68 Dittman Avenue** Whittier Boulevard County of L.A. 0.567 A 0.612 B
69 Downey Road** Whittier Boulevard County of L.A. 0.548 A 0.605 B
70 Dittman Avenue** Olympic Boulevard County of L.A. 0.573 A 0.557 A
71 Downey Road** Olympic Boulevard County of L.A. 0.715 C 0.687 B
72 I-710 Southbound Ramps**
Washington Boulevard City of Commerce 0.674 B 0.554 A
73 I-710 Northbound Ramps** Washington Boulevard City of Commerce 0.569 A 0.527 A
74 I-710 Southbound Off-Ramp**
Bandini Boulevard City of Vernon 0.681 B 0.455 A
75 I-710 Northbound Ramps/ Atlantic Boulevard**
Bandini Boulevard City of Vernon 1.224 F 1.345 F
All signalized intersections operate under ATSAC and ATSC systems unless otherwise noted.
*Intersection is operating under ATSAC system only.
**Intersection does not operate under ATSAC or ATCS systems. a V/C ratios and LOS calculated using CMA methodology as recommended by LADOT.
Source: Fehr & Peers, 2011.

IV.K Traffic, Access, and Parking
City of Los Angeles Boyle Heights Mixed-Use Community Project SCH. No. 2008061123 October 2011
Page IV.K-22
WORKING DRAFT – Not for Public Review
Table IV.K-4 Existing (2008) Unsignalized Level of Service & Signal Warrant Results
Peak-Hour Operating Conditions Signal Warrant
A.M. P.M. 8-Hour 4-Hour Peak Hour
Int. Intersection Delay LOS Delay LOS 1A 1B 1C 2 3
J Glen Avenue & 8th Streeta 21.3 C 17.3 C No No No No No
K Orme Avenue & 8th Streeta 13.6 B 13.7 B No No No No No
L Camulos Place/Camulos Street & 8th Streeta
13.6 B 13.7 B No No No No No
M Euclid Avenue & 8th Streeta 25.1 D 23.3 C No No No Yes No
N Dacotah Street & 8th Streeta 11.4 B 12.7 B No No No No No
O Orme Avenue & Olympic Boulevarda — F — F No No No No No
P Camulos Street & Olympic Boulevarda 36.2 E — F No No No No No
Q Evergreen Avenue & Olympic Boulevarda 28.2 D — F No No No Yes Yes
R Dacotah Street & Olympic Boulevarda 35.6 E 68.5 F No No No No No
– = Oversaturated conditions. Delay cannot be calculated. a Intersection is controlled by stop signs on minor approach. Delay is based on worst approach.
Source: Fehr & Peers, 2011.
IV.K Traffic, Access, and Parking
City of Los Angeles Boyle Heights Mixed-Use Community Project SCH. No. 2008061123 October 2011
Page IV.K-23
WORKING DRAFT – Not for Public Review
operate at an acceptable LOS D or better during both peak periods. The following 12 signalized intersections are currently operating at LOS E or F (unacceptable levels) during one or both of the A.M. and P.M. peak periods:
1. Soto Street & Charlotte Street/I-10 Westbound Ramps (A.M. peak hour)
15. Indiana Street & 3rd Place/3rd Street (both peak hours)
27. Santa Fe Avenue & 7th Street (P.M. peak hour)
29. Soto Street & 7th Street (both peak hours)
41. Alameda Street & Olympic Boulevard (A.M. peak hour)
44. Santa Fe Avenue & Olympic Boulevard (both peak hours)
54. Alameda Street & Washington Boulevard (A.M. peak hour)
55. Soto Street & Washington Boulevard (both peak hours)
57. Soto Street & 26th Street (P.M. peak hour)
58. Soto Street & Bandini Boulevard/37th Street (P.M. peak hour)
59. Downey Road & Bandini Boulevard (both peak hours)
75. I-710 Northbound Ramps/Atlantic Boulevard & Bandini Boulevard (both peak hours)
Signal warrant analysis was also conducted for the existing unsignalized intersections.4 As indicated in Table IV.K-4 on page IV.K-22, the following two intersections currently meet warrants:
M. Euclid Avenue & 8th Street (4-hour)
Q. Evergreen Avenue & Olympic Boulevard (peak hour, 4-hour)
In addition to the LOS results detailed above, Appendix G in the Traffic Study (see Appendix L of this Draft EIR) provides LOS analyses for intersections located in the County
4 Signal warrant worksheets are provided in Appendix E in the Traffic Study (see Appendix L to this Draft EIR).
IV.K Traffic, Access, and Parking
City of Los Angeles Boyle Heights Mixed-Use Community Project SCH. No. 2008061123 October 2011
Page IV.K-24
WORKING DRAFT – Not for Public Review
of Los Angeles as well as the City of Vernon using the preferred analysis methodology of the jurisdiction.
(2) Freeways
Existing freeway traffic volumes were obtained primarily from the California Freeway Performance Measurement System (PeMS). Freeway traffic volumes at some locations were obtained from Caltrans’ annual average daily traffic database on California State highways. Where a 2008 count was not available, traffic counts were grown by 1 percent per year to reflect 2008 operating conditions. The analyzed locations were selected in accordance with the Transportation Impact Analysis (TIA) Guidelines outlined for the Los Angeles County Congestion Management Program (CMP) analysis, discussed further below under the Regulatory Framework heading.
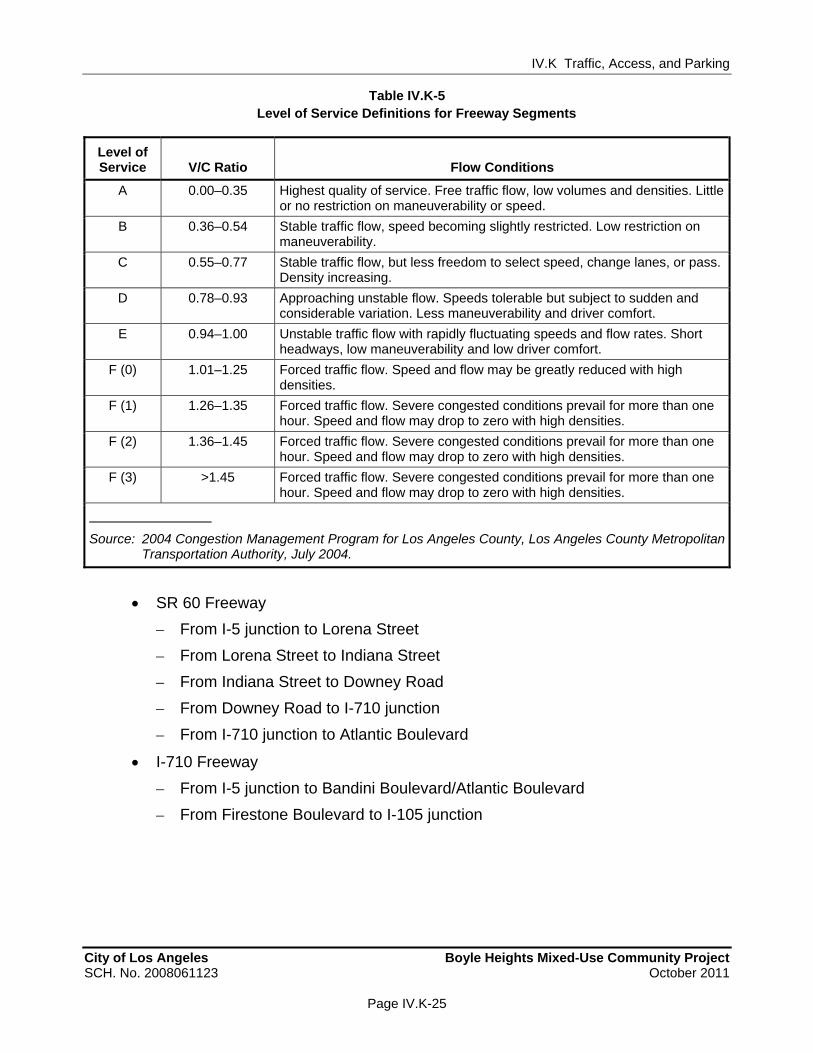
LOS for freeways is based on the measured flow past a point on a “screenline” compared to the estimated capacity of that section of the freeway. Capacity is calculated by multiplying the lane capacity by the number of lanes in each segment. In accordance with CMP guidelines, the lane capacities are assumed to be 2,000 vehicles per hour (vph) per freeway mainline lane and 1,000 vph for HOV and auxiliary lanes. The LOS definitions for freeway segments are presented in Table IV.K-5 on page IV.K-25.
Existing A.M. and P.M. peak-hour freeway traffic volumes are presented in Tables IV.K-15 and IV.K-16 on pages IV.K-80 and IV.K-82. As indicated in these tables, the following freeway segments operate at LOS E or F during one or both peak hours and in one or both directions under existing conditions:
I-5 Freeway
– All 13 analyzed segments
I-10 Freeway
– From I-110 junction to San Pedro Street
– From San Pedro Street to Central Avenue
– From Central Avenue to Alameda Street
– From Alameda Street to Santa Fe Avenue
US 101 Freeway
– From I-110 junction to Spring Street
– From Spring Street to Alameda Street
– From Central Avenue to Alameda Street
– From Alameda Street to Vignes Street
IV.K Traffic, Access, and Parking
City of Los Angeles Boyle Heights Mixed-Use Community Project SCH. No. 2008061123 October 2011
Page IV.K-25
WORKING DRAFT – Not for Public Review
SR 60 Freeway
– From I-5 junction to Lorena Street
– From Lorena Street to Indiana Street
– From Indiana Street to Downey Road
– From Downey Road to I-710 junction
– From I-710 junction to Atlantic Boulevard
I-710 Freeway
– From I-5 junction to Bandini Boulevard/Atlantic Boulevard
– From Firestone Boulevard to I-105 junction
Table IV.K-5 Level of Service Definitions for Freeway Segments
Level of Service V/C Ratio Flow Conditions
A 0.00–0.35 Highest quality of service. Free traffic flow, low volumes and densities. Little or no restriction on maneuverability or speed.
B 0.36–0.54 Stable traffic flow, speed becoming slightly restricted. Low restriction on maneuverability.
C 0.55–0.77 Stable traffic flow, but less freedom to select speed, change lanes, or pass. Density increasing.
D 0.78–0.93 Approaching unstable flow. Speeds tolerable but subject to sudden and considerable variation. Less maneuverability and driver comfort.
E 0.94–1.00 Unstable traffic flow with rapidly fluctuating speeds and flow rates. Short headways, low maneuverability and low driver comfort.
F (0) 1.01–1.25 Forced traffic flow. Speed and flow may be greatly reduced with high densities.
F (1) 1.26–1.35 Forced traffic flow. Severe congested conditions prevail for more than one hour. Speed and flow may drop to zero with high densities.
F (2) 1.36–1.45 Forced traffic flow. Severe congested conditions prevail for more than one hour. Speed and flow may drop to zero with high densities.
F (3) >1.45 Forced traffic flow. Severe congested conditions prevail for more than one hour. Speed and flow may drop to zero with high densities.
Source: 2004 Congestion Management Program for Los Angeles County, Los Angeles County Metropolitan Transportation Authority, July 2004.
IV.K Traffic, Access, and Parking
City of Los Angeles Boyle Heights Mixed-Use Community Project SCH. No. 2008061123 October 2011
Page IV.K-26
WORKING DRAFT – Not for Public Review
c. Regulatory Framework
(1) Congestion Management Program
The Congestion Management Program (CMP) is a state-mandated program enacted by the state legislature to address the increasing concern that urban congestion is affecting the economic vitality of the state and diminishing the quality of life in some communities. The CMP provides the analytical basis for transportation decisions through the State Transportation Improvement Program.
Metro is the local CMP agency for Los Angeles County and has established a countywide approach to implement the statutory requirements of the CMP in their 2004 CMP for Los Angeles County. The countywide approach includes designating a highway network that includes all state highways and principal arterials within the County and monitoring traffic conditions on the designated transportation network, performance measures to evaluate current and future system performance, promotion of alternative transportation methods, analysis of the impact of land use decisions on the transportation network, and mitigation to reduce impacts on the network. If LOS standards deteriorate, then local jurisdictions must prepare a deficiency plan to be in conformance with the countywide plan.
The Transportation Impact Analysis (TIA) Guidelines outlined in the 2004 CMP for Los Angeles County require that, when an EIR is prepared for a project, traffic and transit analyses must be conducted for select regional facilities based on the quantity of project traffic expected to utilize these facilities. The CMP guidelines for determining the study area of the analysis for CMP arterial monitoring intersections and for freeway monitoring locations are:
All CMP arterial monitoring intersections, including monitored on- or off-ramp intersections, where the proposed project will add 50 or more trips during either the A.M. or P.M. weekday peak hours of adjacent street traffic; and
Mainline freeway monitoring locations where the project will add 150 or more trips, in either direction, during either the A.M. or P.M. weekday peak hours.
The CMP arterial monitoring location closest to the project site is the intersection of Alameda Street & Washington Boulevard.
The following six freeway segments are classified as CMP monitoring stations in the study area:
IV.K Traffic, Access, and Parking
City of Los Angeles Boyle Heights Mixed-Use Community Project SCH. No. 2008061123 October 2011
Page IV.K-27
WORKING DRAFT – Not for Public Review
I-5 at Stadium Way (Station 1004)
I-5 at Ferris Avenue/Atlantic Boulevard (Station 1003)
SR-60 east of Indiana Street (Station 1027)
US-101 north of Vignes Street (Station 1036)
I-710 south of SR-60 (Station 1081)
I-710 north of I-105 (Station 1080)
While these are the only freeway CMP monitoring stations in the study area, the freeway analysis has been expanded to include all segments between the following boundaries:
I-5 between Stadium Way and Atlantic Boulevard
I-10 between the I-110 junction and the I-5 junction
US 101 between the I-110 junction and the I-5/SR 60 junction
SR 60 between the I-5 junction and the I-710 junction
I-710 between the I-5 junction and the I-105 junction
(2) Los Angeles Municipal Code
(a) Traffic
With regard to construction traffic, Section 41.40 of the Los Angeles Municipal Code (LAMC) limits construction activities to the hours from 7:00 A.M. to 9:00 P.M. on weekdays and from 8:00 A.M. to 6:00 P.M. on Saturdays. No construction is permitted on Sundays or national holidays.
(b) Parking
Section 12.21(A)4 (Off-Street Automobile Parking Requirements) of the Los Angeles Municipal Code (LAMC) sets forth parking requirements for development projects based on the types and amount of land uses. The following parking ratios are required by Section 12.21(A)4 and are applicable to the proposed project:
Apartment Dwelling Unit (Rental)—For units with less than three habitable rooms, at least one automobile parking space per unit; for units with three
IV.K Traffic, Access, and Parking
City of Los Angeles Boyle Heights Mixed-Use Community Project SCH. No. 2008061123 October 2011
Page IV.K-28
WORKING DRAFT – Not for Public Review
habitable rooms, at least 1.5 automobile parking spaces per unit; and for units with more than three habitable rooms, at least two automobile parking spaces per unit. No additional guest parking is required.
Condominium Dwelling Unit (For Sale)—For all units, at least two automobile parking spaces are required per unit by the Department of City Planning Residential Parking Policy on Division of Land - No. AA2000-1. In addition, at least 0.25 guest automobile parking spaces are required per unit in parking non-congested areas.
General Office—Two automobile parking spaces per 1,000 sf of floor area.
Medical/Dental Office—One automobile parking space per 200 sf of floor area (five spaces per 1,000 sf).
General Retail—Four automobile parking spaces per 1,000 sf of floor area.
Restaurant—One automobile parking space per 100 sf of floor area (10 spaces per 1,000 sf).
Health Club—One automobile parking space per 100 sf of floor area (10 spaces per 1,000 sf).
Library—One automobile parking space per 500 sf of floor area (two spaces per 1,000 sf) (code requirement for institutions).
Community Room—One automobile parking space per 35 sf of assembly floor area (code requirement for auditoriums without fixed seats).
Day Care Facility—Day care is not a defined use in the LAMC. A rate of four parking spaces per 1,000 sf of floor area was used based on a review of data from other jurisdictions’ zoning codes and the Institute of Transportation Engineers’ Parking Generation, 3rd Edition.
Based on the assumptions employed in the Traffic Study’s parking analysis regarding the distribution of housing units (i.e., the number of studio, one-bedroom, two-bedroom and three-bedroom for-sale/rental units), the project would require a total of 10,903 to 11,003 spaces under LAMC Section 12.21(A)4, depending on the final distribution of land uses.5
5 The precise mix of the types of residential units to be provided in the project has not yet been determined. Therefore, an estimated distribution of housing units was developed for purposes of the Traffic Study’s parking analysis. The actual distribution of housing units (i.e., the number of studio, one-bedroom,
(Footnote continued on next page)
IV.K Traffic, Access, and Parking
City of Los Angeles Boyle Heights Mixed-Use Community Project SCH. No. 2008061123 October 2011
Page IV.K-29
WORKING DRAFT – Not for Public Review
3. Project Impacts
a. Methodology
(1) Construction Traffic
The analysis of construction traffic included a determination of the number of construction-related trips (i.e., construction worker trips and construction truck trips) that would occur as a result of the proposed project. The impacts of these estimated numbers of trips on the existing roadway system were then assessed. In addition, the proposed project’s potential to affect access, transit access, and on-street parking during construction was assessed. The analysis was based upon the phased construction proposed as part of the application. As discussed in Section II, Project Description, of this Draft EIR, project development would occur in a series of five phases such that existing and/or new housing would always be available on-site.
(2) Operational Traffic—Intersections
As discussed above, the analysis of existing and future (2030) traffic conditions for the study intersections was based on the LOS methodology and significance criteria adopted by the LADOT. Analyses of intersections located in other jurisdictions, using preferred methodology of the respective jurisdiction, are provided in the appendices of the Traffic Study (see Appendix L to this Draft EIR).
Pursuant to LADOT methodology, traffic conditions at all signalized intersection have been analyzed using the CMA methodology. LADOT evaluates project impacts by comparing the Future (2030) Base conditions with the Future (2030) With Project conditions, where the baseline scenario contains ambient growth applied to existing traffic counts as well as the assignment of related project traffic in the study area. Unsignalized intersections critical for site access were analyzed using the unsignalized intersection methodologies developed in the 2000 HCM. A signal warrant analysis was also conducted for the unsignalized intersections, testing the 8-Hour, 4-Hour, and peak-hour vehicular volume signal warrants consistent with current LADOT policy.
two-bedroom, and three-bedroom for-sale/rental units) that ultimately could be constructed may vary from that used in this analysis. To the extent that it does, the parking requirements would vary accordingly. Please see Tables 38 and 39 in the Traffic Study (included as Appendix L to this Draft EIR) for a breakdown of the assumptions employed for purposes of the parking analysis and a detailed calculation of parking requirements under the LAMC.
IV.K Traffic, Access, and Parking
City of Los Angeles Boyle Heights Mixed-Use Community Project SCH. No. 2008061123 October 2011
Page IV.K-30
WORKING DRAFT – Not for Public Review
The methodology for developing the Future (2030) Base conditions and the Future (2030) With Project conditions is described as follows and is further discussed in the Traffic Study provided in Appendix L of this Draft EIR.
(a) Future (2030) Base Conditions
The Future (2030) Base conditions considers the effects of regional growth and of other developments either proposed, approved, or under construction in the study area.
(i) Travel Demand Model Development and Validation
A detailed travel demand forecasting model was developed for the project using the Southern California Association of Governments’ (SCAG) Regional Transportation Plan (RTP) 2004.6 The SCAG model includes a highway and transit network for the region, and predicts travel demand under future conditions based on regional socioeconomic growth forecasts. The development of the project’s focused travel demand model consisted of several modifications to the SCAG regional model to enable it to estimate traffic more accurately in the Boyle Heights Mixed-Use Community area. These modifications consisted primarily of adding more traffic analysis zones (TAZs) to the model zonal structure and roadway network detail in the study area. Though a large regional model such as SCAG’s is primarily intended to forecast traffic on regionally significant roadway facilities (highways and freeways), the modifications made to the SCAG model have refined the model’s representation of the transportation network and travel patterns in the project study area, improving the model’s predictive ability to forecast traffic on the lower functional class facilities (arterials and collectors) in the study area. The SCAG model was selected as the basis for this analysis because, as the region’s Metropolitan Planning Organization (MPO), SCAG is tasked with developing the “model of record” for the region.
To validate the model, roadway traffic volumes from the base year focused model were compared to the existing traffic counts to ensure that the model produced traffic forecasts that reasonably matched empirically collected traffic counts. The focused model exceeded all relevant validation criteria, and was accepted by the LADOT for use in the Traffic Study. A detailed description of the model development and calibration/validation
6 SCAG’s 2008 RTP was still under development when the model for this study was developed, so the 2004 RTP model was used. Additionally the 2004 RTP model was the base model used in the development of the ongoing Boyle Heights Community Plan update. Therefore, for reasons of consistency and availability, the Traffic Study used the 2004 SCAG model as the base. Because the results of the model were validated when compared to actual traffic conditions, the model can be relied upon to present an accurate assessment of future traffic conditions.
IV.K Traffic, Access, and Parking
City of Los Angeles Boyle Heights Mixed-Use Community Project SCH. No. 2008061123 October 2011
Page IV.K-31
WORKING DRAFT – Not for Public Review
process, and the criteria used to assess model performance, is provided in Appendix H of the Traffic Study, which is included in Appendix L to this Draft EIR.
(ii) Future Year Network and Trip Table Development
The TAZ and highway network refinements developed in the validated base year model were then applied to the Year 2030 SCAG model. In addition to these refinements, modifications to the Year 2030 trip tables and highway network were made to account for related projects and future baseline roadway improvements in the study area. These modifications are described in detail below.
Related Projects
As indicated in Section III, Environmental Setting, of this Draft EIR, in consultation with LADOT staff, County of Los Angeles staff, City of Vernon staff, City of Commerce staff, and City of Maywood staff, a total of 37 related projects have been identified within a two-mile radius of the project site. Please see Table III-1 and Figure III-1 in Section III, Environmental Setting, of this Draft EIR for a list of the related projects and a related project location map, respectively.
Since the SCAG model contains general ambient socioeconomic growth projections, in order to ensure that all the specific related projects were accounted for in the growth projected in the SCAG model, a TAZ-by-TAZ comparison was made between the base year and Year 2030 model trip tables to ensure that the growth in trips generated by and attracted to each TAZ was sufficient to include the trip-generation estimates for the related projects. Differences, if any, were addressed so that the trip generation to and from each TAZ in question accounted for at least the growth projected by the related projects. If the growth projected in the model was greater than that reflected in the related projects for a particular TAZ, then the growth reflected in the SCAG model trip table was retained. This methodology means that trips were only added to the model to represent future growth, but there was no subtraction of trips, even if there were no future projects proposed for a particular TAZ. In some cases, such as the adjacent Sear’s project, this methodology results in significant amounts of new development included in the model that may not in fact ever occur. The analysis is conservative, and so could overstate the actual traffic impacts of the project.
Table 12 in the Traffic Study (see Appendix L to this Draft EIR) provides trip-generation estimates for the related projects. These trip-generation estimates were
IV.K Traffic, Access, and Parking
City of Los Angeles Boyle Heights Mixed-Use Community Project SCH. No. 2008061123 October 2011
Page IV.K-32
WORKING DRAFT – Not for Public Review
calculated using a combination of previous study findings as well as the trip-generation rates contained in Trip Generation, 7th Edition.7 Trip distribution and traffic assignment for related projects were performed by the travel demand model.
Future (2030) Baseline Roadway Network
The roadway network for the Future (2030) Base conditions in the study area will be affected by the following regional improvement plans and programmed improvements.
Regional Improvement Plans
SCAG Regional Transportation Plan and Regional Transportation Improvement Program
The Regional Transportation Plan (RTP), prepared by SCAG, is a planning document required under State and federal statutes. The RTP forecasts long-term transportation demands, and identifies policies, actions, and funding sources to accommodate these demands. The RTP contemplates construction of new transportation facilities, transportation system management (TSM) strategies, transportation demand management (TDM) strategies, and land-use strategies. The Regional Transportation Improvement Program (RTIP) (2006), also prepared by SCAG and based on the RTP, lists all the regional funded and programmed improvements in the next seven years. This RTIP provides updates to the list of regionally funded/programmed improvements in the next improvement cycle. The improvements included in the RTP have committed funding. The SCAG Year 2030 model is the tool by which the facilities proposed in the RTP and RTIP are analyzed for effectiveness. Several regional facility improvements contained in the SCAG Year 2030 highway network are adjacent to the study area. These improvements include:
I-710 Corridor Program: The I-710 corridor program, as modeled, would consist of four exclusive truck lanes, 10 mixed-flow lanes, interchange improvements, and arterial improvements. The four exclusive truck lanes would run along the I-710 from the ports of Long Beach/ Los Angeles to an intermodal rail yard near downtown Los Angeles. The 10 mixed-flow lanes would run from the ports to the SR 60 junction.
I-710/I-210 Connector: The I-710/I-210 Connector, as modeled would consist of six mixed-flow lanes and two HOV lanes, which would extend the I-710 from its current terminus at Valley Boulevard, to the I-210 freeway in Pasadena.
7 Institute of Transportation Engineers (ITE), 2003.
IV.K Traffic, Access, and Parking
City of Los Angeles Boyle Heights Mixed-Use Community Project SCH. No. 2008061123 October 2011
Page IV.K-33
WORKING DRAFT – Not for Public Review
I-5 Corridor Improvements: The I-5 Corridor Improvements, as modeled, would extend one HOV lane in each direction from the I-710 freeway to the I-605 freeway.
Metro Long Range Transportation Plan
Metro’s Long Range Transportation Plan (LRTP) is a strategic document that serves as a framework for meeting the current and projected mobility needs of Los Angeles County. The LRTP recommends highway, HOV, bus, rail, and travel demand management improvements, and identifies Metro’s funding sources and implementation schedules over the 20-year period.
Measure R
In the November, 2008 election, voters of the County of Los Angeles passed a half-cent sales tax increase to fund transportation projects. The sales tax went into effect July 1, 2009, and will be in place for 30 years. The projects listed above are specified on the Measure R project list, and as such, will receive funding from this measure.
Local Improvement Plans
The following plans recommend a number of improvements that would enhance the transportation system in the study area. Of the recommendations contained in the plans, the following planned and funded improvements would alter the specified intersection configurations and street segments in the study area. Other recommendations contained in the plans were not included in the Traffic Study analysis because they were determined to have no effect on the analyzed intersections, or improvements were not funded at the time the analysis was prepared.
Boyle Heights Area Freeway Access Study (City of Los Angeles)
– Roundabout at Lorena Street/Indiana Street & Cesar E Chavez Avenue: A roundabout would be constructed at the currently signalized intersection of Lorena Street/Indiana Street & Cesar E. Chavez Avenue.
East Downtown Truck Access Study (City of Los Angeles)
– Alameda Street & Washington Boulevard: The intersection would be widened to add a right-turn only lane for northbound and southbound Alameda Street, so that both approaches would consist of a left-turn only lane, two through lanes, and one right-turn only lane.
IV.K Traffic, Access, and Parking
City of Los Angeles Boyle Heights Mixed-Use Community Project SCH. No. 2008061123 October 2011
Page IV.K-34
WORKING DRAFT – Not for Public Review
City of Vernon General Plan
– Connection of 26th Street to Atlantic Boulevard: 26th Street would be extended from its earlier terminus west of the I-710 freeway, underneath the freeway to a newly constructed connection to Atlantic Boulevard. This project was not completed at the time the traffic counts were conducted, but has since been completed.
Other Improvements (City of Los Angeles)
– Vacation of 14th Street between Naomi Avenue and Central Avenue: 14th Street between Naomi Avenue and Central Avenue would be vacated. The intersection of Central Avenue & 14th Street would become a T-intersection. The vacation would require the following improvements at the intersection of Central Avenue & Olympic Boulevard:
Install left-turn phasing for the southbound and westbound approaches;
Restripe south leg of the intersection to provide a northbound right-turn only lane;
Install a northbound right-turn arrow to operate concurrently with the westbound left-turn arrow; and
Install Closed-Circuit (CCTV) Camera.
– 8th Street Resurfacing: 8th Street is scheduled for resurfacing, and new striping will be installed at the intersection of Boyle Avenue and 8th Street. The westbound approach of 8th Street at Boyle Avenue would accommodate one left-turn only lane, and one right-turn only lane (currently one through/left and one through/right lane).
(iii) Level of Service Methodology
The same LOS methodology described above for the Existing Conditions analysis was used to analyze Future Base (Year 2030) operating conditions at all but one of the study intersections. As discussed above, Intersection 5, Lorena Street/Indiana Street & Cesar E. Chavez Avenue, is proposed to be improved with the installation of a roundabout. Accordingly, the SIDRA software package was utilized for the analysis of level of service of the proposed roundabout.
(iv) Computer Traffic Signal Control
In accordance with direction from LADOT, all signalized intersections are assumed to operate under both the ATSAC and ATCS systems under Future Base (Year 2030) conditions. Therefore, a capacity increase of 10 percent (a V/C adjustment of 0.10) has been applied to all signalized intersections located in the City of Los Angeles.
IV.K Traffic, Access, and Parking
City of Los Angeles Boyle Heights Mixed-Use Community Project SCH. No. 2008061123 October 2011
Page IV.K-35
WORKING DRAFT – Not for Public Review
(v) Development of the Forecast Volumes
After inputting the trip table and highway network modifications detailed above, the development of the forecast volumes for this analysis followed the approach presented in National Cooperative Highway Research Program (NCHRP) Report 255 (Transportation Research Board, 1982). This method is the accepted professional standard for preparing traffic forecasts for urbanized area planning applications. The NCHRP Report 255 approach involves post-processing model data and applying the growth to existing counts collected in the field. For further detail regarding this approach, please refer to page 40 of the Traffic Study included as Appendix L of this Draft EIR.
(b) Future (2030) With Project Conditions
The horizon for this analyses is Year 2030, corresponding with the buildout year of the proposed project. The development of project trip generation estimates as well as the development of the Future with Project travel demand model and traffic forecasts are detailed below.
(i) Future With Project Roadway Network
The project proposes several modifications to the internal roadway network within the project site. While it is anticipated that internal roadways would primarily serve project traffic, the modifications proposed are likely to draw some area traffic through the project site because the roadway improvements reconnect with the street grid north and south of the project site. Under existing conditions, connectivity is much more limited. The following list summarizes, the roadway improvements proposed for the project that have been incorporated into the travel demand model network (see also Figure 6 in the Traffic Study, included as Appendix L to this Draft EIR):
New north-south connections between 8th Street and Olympic Boulevard at Orme Avenue, Camulos Street, Euclid Avenue/Evergreen Avenue, and Dacotah Street;
New southerly legs at 8th Street and Mott Street, Marietta Street, Rosalind Avenue, and Evergreen Avenue that continue the street grid north of 8th Street into the project site; and
Newly signalized intersections at 8th Street & Euclid Avenue, Camulos & Olympic Boulevard, and Euclid Avenue/Evergreen Avenue & Olympic Boulevard.
IV.K Traffic, Access, and Parking
City of Los Angeles Boyle Heights Mixed-Use Community Project SCH. No. 2008061123 October 2011
Page IV.K-36
WORKING DRAFT – Not for Public Review
(ii) Analyzed Project Development Scenarios
As discussed in Section II, Project Description, of this Draft EIR, the project would allow for some flexibility in uses to respond to changing market demands and best meet the needs of the community. Specifically, the project would include floor area caps of up to 150,000 square feet of office space and up to 200,000 square feet of retail space, out of the total 300,000 commercial square feet. For the purposes of this analysis, conceptual development scenarios have been defined to demonstrate hypothetical land use mixes that could occur under the project in which either the proposed office space or the proposed retail space is maximized (hereinafter the “Maximum Office scenario” and “Maximum Retail scenario,” respectively), as shown in Table II-2 in Section II, Project Description, of this Draft EIR. For the purposes of this analysis, and in order to present a conservative analysis, 15,000 sf of day care have been analyzed separately from the remaining total commercial square footage, due to the differences in trip-generation characteristics of such a use in comparison to the other commercial uses contemplated as part of the project. Where appropriate, quantitative analyses are provided for either the maximum office or the maximum retail scenario, depending on which land use mix yields the most conservative analysis.
The project would also include up to 25,000 sf of civic uses. It is anticipated that the civic uses would be determined as part of the planning process. For purposes of this analysis, the civic uses have been assumed to be a library and multi-purpose community room.
(iii) Project Trip Generation
For most proposed project land uses, the trip-generation rates found in Trip Generation, 7th Edition, (ITE, 2003) were utilized to develop trip-generation estimates. The exceptions were passive and active open space land uses, for which rates from A Brief Guide of Vehicular Traffic Generation Rates for the San Diego Region (SANDAG, April 2003) were utilized, and the community room, for which trip-generation estimates were developed based on anticipated use. For the purposes of this evaluation, it was assumed that the community room would be a facility that is subdivided and would have the trip patterns described on page 46 of the Traffic Study (see Appendix L to this Draft EIR). These varying trip patterns represent assumptions about the likely peak usage of the community room. Actual use would vary day to day depending on the type and schedule of activities in the community room. To be conservative, all 4,400 residential units were evaluated as apartment units, since the ITE trip-generation rates for apartments are higher than those for condominiums. Retail space was analyzed using the ITE Shopping Center land use (#820). Table 15 in the Traffic Study details the source for each trip-generation rate, as well as the daily, and the A.M. and P.M. peak-hour trip-generation rates and in and out splits. These trip rates, in combination with trip credits, were used to estimate the
IV.K Traffic, Access, and Parking
City of Los Angeles Boyle Heights Mixed-Use Community Project SCH. No. 2008061123 October 2011
Page IV.K-37
WORKING DRAFT – Not for Public Review
number of trips generated by the proposed project. Credits for internal trip capture, pass-by trips (per LADOT policy), and transit/TDM trip generation were applied to each of the land use components of the proposed project. Credits were also applied based on the existing number of units that will be removed from the project site. Specifically, trip-generation credits were applied in the following order:
Internally Captured Trips: The estimates for internal capture followed the methodology for determining trip generation in a Multi-Use Development, outlined in Trip Generation Handbook, 2nd Edition (ITE, 2004). This methodology is an approach for calculating the number of internal trips between pairs of land uses, including retail, office, and residential land uses. Based on empirical observations in the ITE studies, average rates for internal trip-making were developed. Appendix I in the Traffic Study (see Appendix L to this Draft EIR) details the internal trip capture rates applied in this analysis.
Pass-By Trips: Pass-by trips are trips already traveling on an arterial that divert to visit a particular land use on that arterial. Pass-by trips, even though they involve a visit to a nearby land use, are not new trips generated by that land use, because they were already traveling on the street. In accordance with LADOT policy, pass-by trip credits were applied to the following two land uses:
– Shopping Center (30 percent pass-by credit)
– Medical-Dental Office Building (10 percent pass-by credit)
External Transit, Walk, and Bike Trips: In discussions with LADOT, it was determined that a transit, walk, and bike credit of 20 percent was appropriate to apply to the trip-generation estimates, to reflect the high quality of transit service that currently serves the project site, including the proximity of the project to the Metro Rapid line on Soto Street, and the high usage of transit, and non-motorized modes such as walking and bicycling currently experienced in the study area.
The credits were applied additively, meaning that each credit was applied to the net remaining trips after the preceding credit was applied. This prevents the assignment of excessive credit. For example, the pass-by trip credit was applied after the internal trip credit because it would only be appropriate to apply to external trips.
Additionally, as detailed in the Traffic Study included as Appendix L to this Draft EIR, available research indicates that the overall trip reductions used in the trip-generation estimates for the project are consistent with the research results, and, in fact, could be considered conservative, especially given the size and location of the project.
IV.K Traffic, Access, and Parking
City of Los Angeles Boyle Heights Mixed-Use Community Project SCH. No. 2008061123 October 2011
Page IV.K-38
WORKING DRAFT – Not for Public Review
(iv) Project Trip Distribution
The distribution of project trips was obtained using the travel demand model developed for the project. As discussed above, the model is a sub-area model built on the SCAG regional travel demand model. The project trip distribution was checked and verified against distribution patterns presented in the Los Angeles County CMP. The generalized project distribution pattern, derived from the model output, is illustrated in Figure 7 in the Traffic Study (see Appendix L to this Draft EIR). As indicated in the figure, approximately 23 percent of project trips are distributed to the north, including 13 percent on freeways; 27 percent of project trips are distributed to the south, including 8 percent on freeways; 20 percent of project trips are distributed to the east, including 10 percent on freeways; and 30 percent of project trips are distributed to the west, including 20 percent on freeways.
(v) Project Trip Assignment
Using the 2030 Future with Project highway networks for the A.M. and P.M. peak hours, the Future with Project trip tables were assigned using the travel demand model developed for the project. To account for the attractiveness of the new signalized intersections at the project perimeter, a manual adjustment to the model output has been applied to the post-processed intersection turning movement volumes, shifting southbound through and left traffic volumes from Orme Avenue & Olympic Boulevard (Intersection O) to the east to the intersection of Camulos Street & Olympic Boulevard (Intersection P), as well as shifting southbound through and left volumes at Dacotah Street & Olympic Boulevard (Intersection R) to the west at the intersection of Euclid Avenue/Evergreen Avenue & Olympic Boulevard (Intersection Q). Southbound right volumes at both locations would not be expected to shift, as those moves would not conflict with eastbound Olympic Boulevard traffic, and so drivers making these particular moves would not experience significantly more delay at the unsignalized locations compared with signalized intersections, so would be unlikely to shift to the signalized locations. Projected peak-hour turning movements at the analyzed intersections are presented in tabular form in Appendix C in the Traffic Study (see Appendix L to this Draft EIR). For further discussion of the trip assignment methodology, please see page 58 of the Traffic Study.
(3) Regional Transportation System (Freeway) Analysis
The potential impacts of the proposed project on these CMP monitoring locations were analyzed in accordance with the TIA procedures outlined for the Los Angeles County 2004 CMP analysis. For freeway monitoring locations, existing peak-hour traffic volumes were established based on PeMS data as described previously in this section beginning on page IV.K-24. Traffic volumes for the Future (2030) Base and Future (2030) with Project were forecast using the travel demand model discussed previously on page IV.K-35. Similar to intersections, LOS is used to describe the existing and future traffic conditions for

IV.K Traffic, Access, and Parking
City of Los Angeles Boyle Heights Mixed-Use Community Project SCH. No. 2008061123 October 2011
Page IV.K-39
WORKING DRAFT – Not for Public Review
freeway segments. The LOS definitions for freeway segments are presented in Table IV.K-5 on page IV.K-25.
The freeway system analysis determines if project-generated trips would exceed the CMP thresholds requiring additional analysis of CMP freeway or intersection locations. If such CMP analysis is needed, the project’s traffic volumes are compared to the significance threshold to determine whether the project would result in a significant impact on CMP facilities.
(4) Neighborhood Intrusion
In accordance with the guidelines outlined in the Los Angeles CEQA Thresholds Guide,8 the analysis of neighborhood intrusion impacts is based upon three conditions being present, which create the circumstances under which there could be a significant impact on local streets in a neighborhood:
Sufficient congestion on arterial corridors such that motorists traveling along the corridor may desire to divert to a parallel route through a residential neighborhood. Unless congestion is severe, travel along arterial streets is generally faster than through neighborhoods, since arterial streets typically provide greater capacities, higher travel speeds, less driveway access, fewer stop signs, etc. For the purposes of this analysis, projected congested conditions of LOS E or F at key intersections along an arterial corridor were considered to represent congested conditions sufficient to cause motorists to seek alternative routes.
Sufficient project traffic projected to be added to the arterial corridors selected under the first criterion, such that the volume that may shift to an alternative route could exceed the minimum significance threshold of 120 or more daily trips. The majority of vehicles on an arterial corridor tend to remain on that corridor even under congested conditions, with only a small portion of motorists inclined to seek alternative routes. Therefore, corridors to which the project may add 1,200 or more daily trips were examined, assuming that at most only 10 percent of these trips may shift to alternative routes on average across a 24-hour period (the proportion that may shift could be higher than 10 percent during congested peak periods of the day but much less than 10 percent or almost none during uncongested non-peak periods of the day).
Availability of local neighborhood street(s) providing a parallel route of travel.
8 City of Los Angeles, 2006.
IV.K Traffic, Access, and Parking
City of Los Angeles Boyle Heights Mixed-Use Community Project SCH. No. 2008061123 October 2011
Page IV.K-40
WORKING DRAFT – Not for Public Review
If one or more of these factors is absent, significant neighborhood traffic impacts would not be anticipated.
(5) Public Transit
As discussed above, Metro, Montebello Bus Lines, and the El Sol shuttle operate in the study area. Of the 15 lines that operate in the study area, eight lines operate in the immediate vicinity of the project site. Because these lines would most directly be affected by the project-generated transit ridership, these lines have been evaluated in this transit impact analysis.
The analysis of the project’s potential impacts on transit is based on the methodology provided in the 2004 CMP. As discussed above, a transit/TDM credit has been applied to the trip-generation estimates for the project, reflecting the level of transit accessibility at the project site, the level of pedestrian connectivity to transit lines that the project would provide, and the existing high level of transit utilization in the study area. Based on the CMP guidelines, transit trips expected to result from the proposed project were estimated based on the number of vehicular trips shifted to transit. This methodology assumes an average vehicle occupancy (AVO) factor of 1.40 in order to estimate the number of person trips to and from the project. Table 30 in the Traffic Study (see Appendix L to this Draft EIR) lists the distribution percentages used to assign the inbound and outbound transit trips to the various transit lines that serve the project site. Distribution was based on an evaluation of the geographic trip distribution patterns illustrated in Figure 6 of the Traffic Study and described above, as well as the location of major regional transit hubs and transfer locations.
(6) Access and Circulation
Per Traffic Study Policies and Procedures (LADOT, December 2010), the analysis of access impacts analyzes whether unsignalized intersections critical to project site access meet signal warrants based on the significance criteria below. Those that do meet warrants would be considered for the installation of traffic signals. LADOT directs that this methodology be used to evaluate site access impacts.
While not required by LADOT, an additional access impact evaluation has been conducted in accordance with the Los Angeles CEQA Thresholds Guide, which has not yet been updated to reflect LADOT’s preferred methodology.
IV.K Traffic, Access, and Parking
City of Los Angeles Boyle Heights Mixed-Use Community Project SCH. No. 2008061123 October 2011
Page IV.K-41
WORKING DRAFT – Not for Public Review
(7) Parking
Because the proposed project is an urban infill mixed-use development that would include neighborhood-serving retail, office, civic, and open space uses, is located in a transit rich and dependent community, and would include pedestrian-friendly features to promote walkability and reduce the need for parking spaces, lower parking ratios than those set forth in LAMC are appropriate for the project. Accordingly, a parking demand analysis was conducted for each phase of the project to determine the amount of parking that would be needed to adequately serve the multiple land uses proposed as part of the project. The parking demand analysis took into consideration the potential for shared use of parking spaces between different land uses, anticipated use of transit, and the expected internal trip-making between land uses within the project site (much of which would be by non-automotive modes such as walking and bicycling). The parking analysis was conducted using the Urban Land Institute (ULI) model and demand rates by land use set forth in Shared Parking, Second Edition (ULI and the International Council of Shopping Centers, 2005), which is based on numerous national studies.
Most zoning codes provide peak parking ratios for individual land uses. While this appropriately recognizes that separate land uses generate different parking demands on an individual basis, it does not reflect the fact that the combined peak parking demand, when a mixture of land uses shares the same parking supply, can be substantially less than the sum of the individual demands. ULI describes shared parking as follows:
Shared parking is defined as parking space that can be used to serve two or more individual land uses without conflict or encroachment. The opportunity to implement shared parking is the result of two conditions:
Variations in the peak accumulation of parked vehicles as the result of different activity patterns of adjacent or nearby land uses (by hour, by day, by season); and
Relationships among land use activities that result in people’s attraction to two or more land uses on a single auto trip to a given area or development.
Using the shared parking research, a parking model was developed that starts with peak parking demand ratios for the individual land uses and then captures the seasonal, monthly, daily, and hourly fluctuations of parking demand for various land uses found at mixed-use developments. As discussed in Section II, Project Description, of this Draft EIR, project development would occur in a series of five phases such that existing and/or new housing would always be available on-site. The greatest potential for shared use of parking supply is in Phase 1 since it includes all of the proposed office uses and the

IV.K Traffic, Access, and Parking
City of Los Angeles Boyle Heights Mixed-Use Community Project SCH. No. 2008061123 October 2011
Page IV.K-42
WORKING DRAFT – Not for Public Review
majority of the proposed retail uses. Shared use of supply would also be effective to a lesser degree in Phases 2, 3, and 4.
In addition to the seasonal, daily, and hourly fluctuations coded into the model, the parking demand ratios for each land use derived from the national research are typically calibrated to reflect local conditions. In the case of the project site, the model has been calibrated to reflect the high level of transit accessibility at the project site and the large number of residential dwelling units that will be served by the retail and office uses at the project site. The specific calibration adjustments applied to the shared parking model are detailed on pages 133 and 134 of the Traffic Study (see Appendix L to this Draft EIR).
To be conservative, the parking analysis did not take transit or internal credits for the residents, on the grounds that residents may own a car and keep it at the project site even if they use transit or other non-automotive modes for a portion of their trips to, from or within the project site.
Based on the parking demand data collected from ULI’s national research, the following residential peak parking demand ratios were applied in the shared parking model for the residential uses: 1.5 spaces per unit plus 0.15 guest spaces per unit for rented dwelling units and 1.7 spaces per unit plus 0.15 guest spaces per unit for owned condominium units. It was assumed in the analysis that 1 space per unit would be reserved for residential use and that the additional spaces per unit would be in a common shared pool of parking, as providing less than the full 1.5 or 1.7 spaces per unit as dedicated spaces would support project goals to reduce project trip generation.
(8) Pedestrian/Bicycle Safety
The methodology for the analysis of pedestrian/bicycle safety impacts includes a review of the project’s access and circulation scheme and a determination of whether the project would substantially increase the potential for pedestrian/vehicle and/or bicycle/vehicle conflicts.
(9) Consistency with Plans
The methodology for this analysis includes a review of relevant transportation regulations, plans, and policies and a determination of whether the project would conflict with these regulations, plans, and policies.
IV.K Traffic, Access, and Parking
City of Los Angeles Boyle Heights Mixed-Use Community Project SCH. No. 2008061123 October 2011
Page IV.K-43
WORKING DRAFT – Not for Public Review
(10) Project Phasing
As discussed in Section II, Project Description, of this Draft EIR, project development is proposed to occur in a series of five phases such that existing and/or new housing would always be available on-site. Table IV.K-6 on page IV.K-44 details the existing land uses to be removed, and the proposed land uses that are proposed to be constructed under each phase of the project. Figure 10 in the Traffic Study (see Appendix L to this Draft EIR) illustrates the location of each phase. The amounts of development in each phase are estimates only, with the exception that the phasing of residential construction and inclusion of affordable housing units must be consistent with the adopted relocation plan to accommodate existing residents. The phasing in actuality may vary somewhat, and could overlap, but this would not affect the basic conclusions of the analysis of the overall project impacts. Analysis was conducted for each interim year of the project (nominally years 2017, 2021, 2025, and 2028) to determine the incremental phasing of the impacts of the project identified in the analysis of project buildout in 2030, as the project builds-out.
The phasing analysis was conducted for intersections because, as further discussed below, significant project impacts on intersections were found in the Future (2030) With Project Condition and the intent of the analysis was to determine at what point these impacts would be triggered. Phasing analyses were not conducted for the CMP freeway or transit impact analyses since significant project impacts were not identified in these areas, as discussed in detail below. The phasing of the project is listed below:
Phase 1 proposes to construct the southeast portion of the project site along Olympic Boulevard between Camulos Street and Dacotah Street. Included in Phase 1 would be the construction of 959 total dwelling units, as well as 161,000 sf retail space, 75,000 sf office space, and 25,000 sf medical office. Under the Maximum Office scenario, there would be 111,000 sf retail space, and 125 sf office space constructed during this phase. The anticipated buildout for Phase 1 is 2017.
Phase 2 proposes to construct the northeast portion of the project site along 8th Street between Evergreen Avenue and Grande Vista Avenue. Included in Phase 2 would be the construction of 1,143 total dwelling units, as well as 13,000 sf retail space and 1.5 acres of active open space. The anticipated buildout for Phase 2 is 2021.
Phase 3 proposes to construct the central section of the project site along 8th Street between Orme Avenue and Evergreen Avenue. Included in Phase 3 would be the construction of 859 total dwelling units, as well as 15,000 sf day care space, 15,000 sf library space, 10,000 sf banquet space, approximately
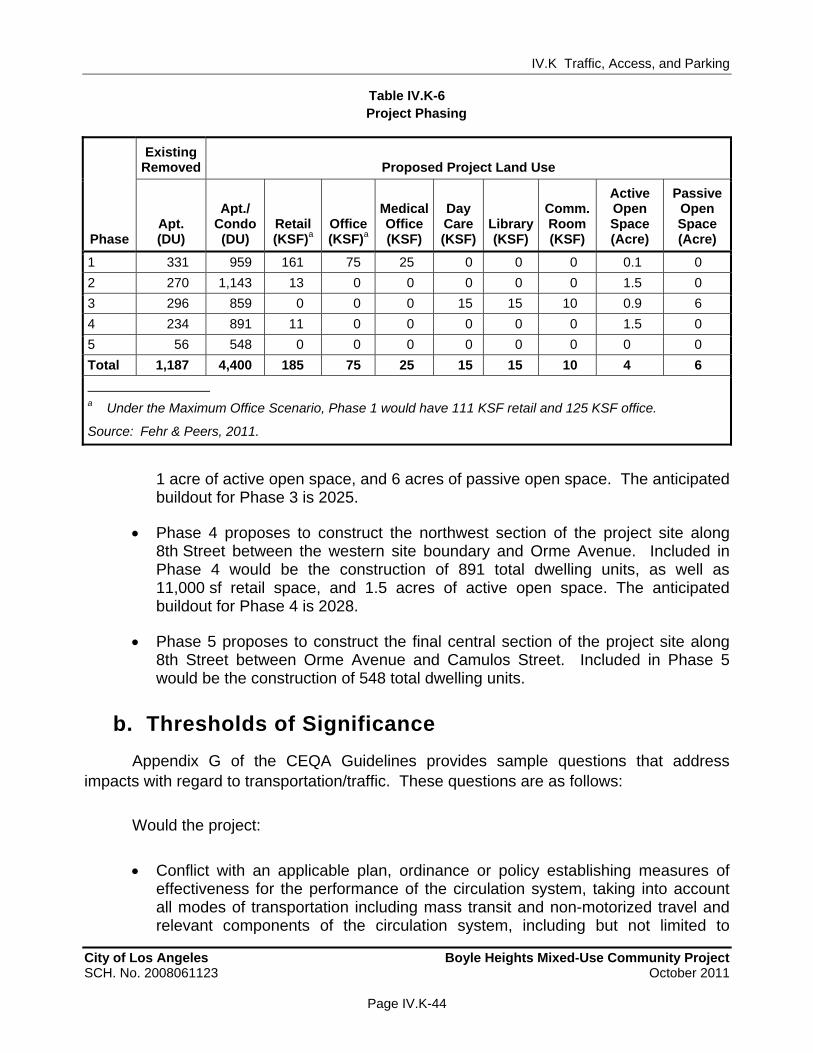
IV.K Traffic, Access, and Parking
City of Los Angeles Boyle Heights Mixed-Use Community Project SCH. No. 2008061123 October 2011
Page IV.K-44
WORKING DRAFT – Not for Public Review
1 acre of active open space, and 6 acres of passive open space. The anticipated buildout for Phase 3 is 2025.
Phase 4 proposes to construct the northwest section of the project site along 8th Street between the western site boundary and Orme Avenue. Included in Phase 4 would be the construction of 891 total dwelling units, as well as 11,000 sf retail space, and 1.5 acres of active open space. The anticipated buildout for Phase 4 is 2028.
Phase 5 proposes to construct the final central section of the project site along 8th Street between Orme Avenue and Camulos Street. Included in Phase 5 would be the construction of 548 total dwelling units.
b. Thresholds of Significance
Appendix G of the CEQA Guidelines provides sample questions that address impacts with regard to transportation/traffic. These questions are as follows:
Would the project:
Conflict with an applicable plan, ordinance or policy establishing measures of effectiveness for the performance of the circulation system, taking into account all modes of transportation including mass transit and non-motorized travel and relevant components of the circulation system, including but not limited to
Table IV.K-6 Project Phasing
Existing
Removed Proposed Project Land Use
Phase Apt. (DU)
Apt./ Condo (DU)
Retail (KSF)a
Office(KSF)a
Medical Office (KSF)
Day Care (KSF)
Library (KSF)
Comm. Room (KSF)
Active Open Space (Acre)
PassiveOpen Space (Acre)
1 331 959 161 75 25 0 0 0 0.1 0
2 270 1,143 13 0 0 0 0 0 1.5 0
3 296 859 0 0 0 15 15 10 0.9 6
4 234 891 11 0 0 0 0 0 1.5 0
5 56 548 0 0 0 0 0 0 0 0
Total 1,187 4,400 185 75 25 15 15 10 4 6
a Under the Maximum Office Scenario, Phase 1 would have 111 KSF retail and 125 KSF office.
Source: Fehr & Peers, 2011.

IV.K Traffic, Access, and Parking
City of Los Angeles Boyle Heights Mixed-Use Community Project SCH. No. 2008061123 October 2011
Page IV.K-45
WORKING DRAFT – Not for Public Review
intersections, streets, highways and freeways, pedestrian and bicycle paths, and mass transit?
Conflict with an applicable congestion management program, including but not limited to level of service standards and travel demand measures, or other standards established by the county congestion management agency for designated roads and highways?
Result in a change in air traffic patterns, including either an increase in traffic levels or a change in location that results in substantial safety risks?
Substantially increase hazards due to a design feature (e.g., sharp curves or dangerous intersections) or incompatible uses (e.g., farm equipment)?
Result in inadequate emergency access?
Conflict with adopted policies, plans, or programs regarding public transit, bicycle, or pedestrian facilities, or otherwise decrease the performance or safety of such facilities?
In the context of these questions, the City of Los Angeles CEQA Thresholds Guide includes specific factors to be considered with regard to impacts associated with Transportation. LADOT also provides established threshold criteria for some of the impact categories. In the context of each of these sources, the proposed project would be considered to have a significant impact on traffic, access, and parking if the following were to occur:
(1) Construction Traffic
Given the temporary nature of construction, LADOT considers construction-related traffic effects to be less than significant. Notwithstanding, LADOT typically requires implementation of worksite traffic control plans to ensure that any construction-related effects are minimized to the extent possible.
The City of Los Angeles CEQA Thresholds Guide does not specify a threshold of significance for a project’s impact associated with construction traffic, stating that the determination of significance shall be made on a case by case basis, considering the temporary traffic impacts, temporary loss of access, temporary loss of bus stops or rerouting of bus lines, and temporary loss of on-street parking.
Based on these considerations, for the purposes of this analysis, project construction would have a significant impact on traffic and circulation if construction activities were to: (1) cause substantial delays and disruption of existing traffic flow;
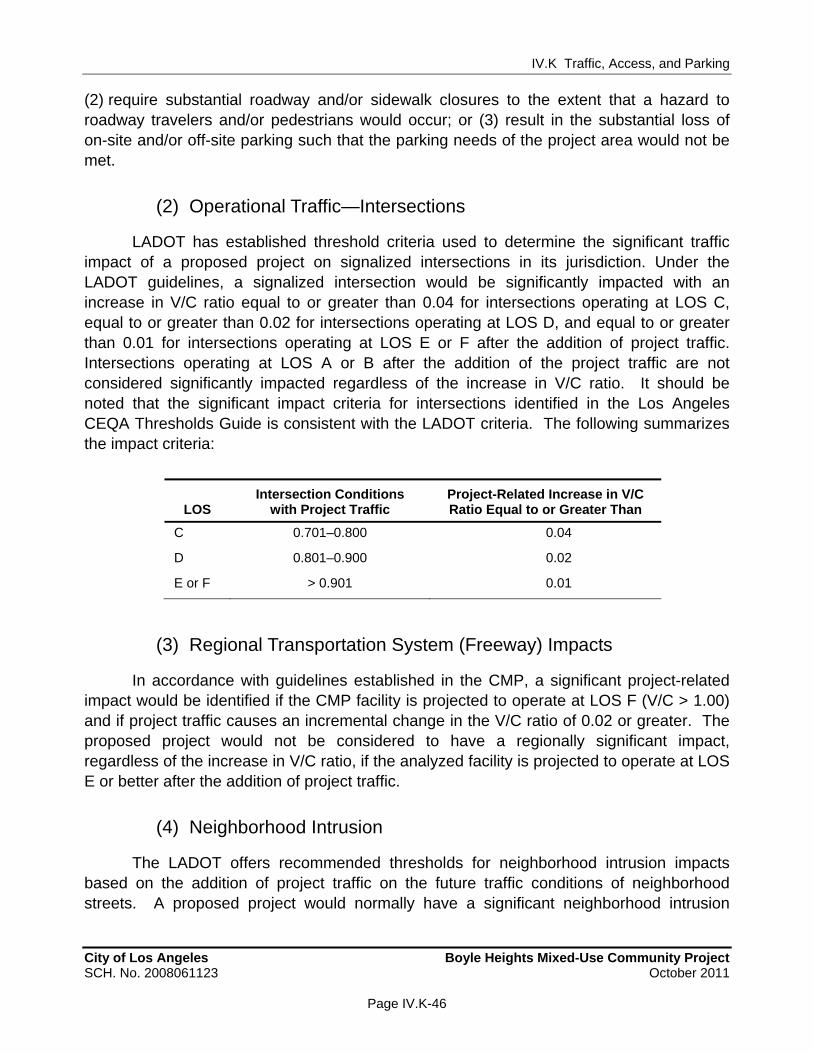
IV.K Traffic, Access, and Parking
City of Los Angeles Boyle Heights Mixed-Use Community Project SCH. No. 2008061123 October 2011
Page IV.K-46
WORKING DRAFT – Not for Public Review
(2) require substantial roadway and/or sidewalk closures to the extent that a hazard to roadway travelers and/or pedestrians would occur; or (3) result in the substantial loss of on-site and/or off-site parking such that the parking needs of the project area would not be met.
(2) Operational Traffic—Intersections
LADOT has established threshold criteria used to determine the significant traffic impact of a proposed project on signalized intersections in its jurisdiction. Under the LADOT guidelines, a signalized intersection would be significantly impacted with an increase in V/C ratio equal to or greater than 0.04 for intersections operating at LOS C, equal to or greater than 0.02 for intersections operating at LOS D, and equal to or greater than 0.01 for intersections operating at LOS E or F after the addition of project traffic. Intersections operating at LOS A or B after the addition of the project traffic are not considered significantly impacted regardless of the increase in V/C ratio. It should be noted that the significant impact criteria for intersections identified in the Los Angeles CEQA Thresholds Guide is consistent with the LADOT criteria. The following summarizes the impact criteria:
LOS Intersection Conditions
with Project Traffic Project-Related Increase in V/C Ratio Equal to or Greater Than
C 0.701–0.800 0.04
D 0.801–0.900 0.02
E or F > 0.901 0.01
(3) Regional Transportation System (Freeway) Impacts
In accordance with guidelines established in the CMP, a significant project-related impact would be identified if the CMP facility is projected to operate at LOS F (V/C > 1.00) and if project traffic causes an incremental change in the V/C ratio of 0.02 or greater. The proposed project would not be considered to have a regionally significant impact, regardless of the increase in V/C ratio, if the analyzed facility is projected to operate at LOS E or better after the addition of project traffic.
(4) Neighborhood Intrusion
The LADOT offers recommended thresholds for neighborhood intrusion impacts based on the addition of project traffic on the future traffic conditions of neighborhood streets. A proposed project would normally have a significant neighborhood intrusion
IV.K Traffic, Access, and Parking
City of Los Angeles Boyle Heights Mixed-Use Community Project SCH. No. 2008061123 October 2011
Page IV.K-47
WORKING DRAFT – Not for Public Review
impact if project traffic increases the average daily traffic (ADT) volume on a local residential street in an amount equal to or greater than:
ADT increase > 120 trips if final ADT9 < 1,000
ADT increase > 12 percent if final ADT > 1,000 and < 2,000
ADT increase > 10 percent if final ADT > 2,000 and < 3,000
ADT increase > 8 percent if final ADT > 3,000
(5) Public Transit
The City of Los Angeles CEQA Thresholds Guide does not specify a threshold of significance for a project’s impact on transit system capacity, stating that the determination of significance shall be made on a case by case basis, considering the projected number of additional transit passengers expected with implementation of the proposed project and available transit capacity. For purposes of this analysis, impacts on public transit would be considered significant if the project were to add substantial new ridership to the transit lines operating in excess of their capacity or if the project would conflict with adopted policies, plans, or programs supporting alternative transportation.
(6) Access and Circulation
Although LADOT does not provide specific criteria for assessing unsignalized intersections for significant impacts, unsignalized intersections integral to the project site’s access and circulation are analyzed for potential signalization based on the following criteria:
Does the project add traffic to the intersection?
Does the intersection operate at LOS E or F under Future with Project conditions?
Does the intersection meet signal warrants under Future with Project conditions?
9 In each case, final ADT is defined as total projected future daily volume including project, ambient, and related project growth.
IV.K Traffic, Access, and Parking
City of Los Angeles Boyle Heights Mixed-Use Community Project SCH. No. 2008061123 October 2011
Page IV.K-48
WORKING DRAFT – Not for Public Review
It should be noted that the satisfaction of a traffic signal warrant does not in itself require the installation of a signal. The decision of whether a traffic signal should be installed is made according to the discretion of the LADOT district office.
In addition, based on the City of Los Angeles CEQA Thresholds Guide, site access impacts would occur when the following is met:
A project would normally have a significant project access impact if the intersection(s) nearest the primary site access is/are projected to operate at LOS E or F during the A.M. or P.M. peak hour, under cumulative plus project conditions.
(7) Parking
Appendix G of the CEQA Guidelines does not include a sample threshold of significance for parking impacts.10 The threshold of significance with respect to parking is set forth in the City of Los Angeles CEQA Thresholds Guide, which states that a project would normally have a significant impact on parking if the project provides less parking than needed as determined through an analysis of demand from the project. Therefore, for purposes of this analysis, impacts to parking would be considered significant if the number of spaces required to accommodate project activities exceeds the number of parking spaces provided.
(8) Pedestrian/Bicycle Safety
The City of Los Angeles CEQA Thresholds Guide states that the determination of significance shall be on a case-by-case basis, considering the following factors:
The amount of pedestrian activity at project access points.
Design features/physical configurations that affect the visibility of pedestrians and bicyclists to drivers entering and exiting the site, and the visibility of cars to pedestrians and bicyclists.
The type of bicycle facility the project driveway(s) crosses and the level of utilization.
10 The prior checklist question regarding inadequate parking capacity was deleted in 2010 pursuant to a number of amendments to the CEQA Guidelines that went into effect on March 18, 2010.
IV.K Traffic, Access, and Parking
City of Los Angeles Boyle Heights Mixed-Use Community Project SCH. No. 2008061123 October 2011
Page IV.K-49
WORKING DRAFT – Not for Public Review
The physical conditions of the site and surrounding area, such as curves, slopes, walls, landscaping or other barriers, that could result in vehicle/pedestrian, vehicle/bicycle or vehicle/vehicle impacts.
Based on these factors, impacts to pedestrians and bicycles would be considered significant if project development would substantially increase hazards to bicyclists or pedestrians.
(9) Consistency with Plans
The City of Los Angeles CEQA Thresholds Guide does not specify a threshold of significance for a project’s consistency with relevant transportation plans and policies. Therefore, for purposes of this analysis, significant impacts related to consistency with plans would result if the project would conflict with the implementation of adopted transportation programs, plans, and policies.
c. Project Design Features
The street system internal to the project site would consist of public and private streets, and would be developed as needed through the phased development of the project, and in accordance with the applicable design guidelines and emergency vehicle access requirements. As shown in Figure II-14 in Section II, Project Description, of this Draft EIR, the project site would be served primarily by three main internal north/south streets: Euclid Avenue/Evergreen Avenue, Orme Avenue, and Camulos Streets. Glenn Avenue would serve as the main east/west internal street. Most of the retail and office uses would be accessed primarily off Euclid Avenue/Evergreen Avenue. Direct access to retail uses fronting Olympic Boulevard may be provided. Glenn Avenue would provide access to most of the open spaces uses in the project.
The project as proposed would maintain site access at the eight locations currently provided at the project site, but would add access at eight additional locations: Orme Avenue, Marietta Street, Evergreen Avenue, Euclid Avenue, Dacotah Street, and Fresno Street from 8th Street; new access from Grande Vista Avenue on an unnamed street; and access on Euclid Avenue from Olympic Boulevard.
In addition, the project would provide bus stop amenities and new bus stops along the site perimeter, as shown in Figure II-14 in Section II, Project Description, of this Draft EIR, thus improving access to public transportation services in the area. The project would also include a system of bicycle routes and pedestrian paths throughout the site to encourage alternative modes of transportation. Specifically, the internal street network would be designed to accommodate shared vehicular and bicycle traffic, equivalent to the

IV.K Traffic, Access, and Parking
City of Los Angeles Boyle Heights Mixed-Use Community Project SCH. No. 2008061123 October 2011
Page IV.K-50
WORKING DRAFT – Not for Public Review
City of Los Angeles’ Class III bike lane designation. Landscaped pathways would also be introduced throughout the site to connect the various project elements and foster a pedestrian-friendly environment, which would include wide sidewalks, narrow streets, street trees & landscaped pathways between buildings, improved street and pedestrian lighting, and decorative awnings and street lamps within the retail/office areas.
The majority of project parking would be provided in a series of subterranean, semi-subterranean, and/or aboveground parking structures integrated within the building designs. The parking structures would generally consist of two to three subterranean levels (maximum of four subterranean levels), typically combined with one level of aboveground parking. In some locations, subterranean parking may be provided on a city block basis, providing shared parking for buildings located on each block. Additionally, a stand-alone parking structure with up to eight levels (two subterranean and up to six above grade levels) would be developed in the southeast portion of the site to serve the proposed retail uses. Most of the parking structure driveways and loading areas would be located along alleys on the side or rear of the buildings to minimize visual and physical disruptions to the pedestrian environment. On-street parking would also be provided. The proposed Specific Plan requires that shared parking analyses be conducted before the commencement of construction for each phase of the project, which will determine the parking supply required to serve the needs of the land uses proposed for that phase. As currently proposed, an estimated total of 9,048 parking spaces (8,515 structure spaces and 533 on-street spaces) would be provided on-site, ultimately based on demand associated with the land use mix developed. By phase, 2,852 spaces are proposed for Phase 1, 1,451 spaces are proposed for Phase 2, 2,321 spaces are proposed for Phase 3, 1,271 spaces are proposed for Phase 4, and 1,153 spaces are proposed for Phase 5, based upon the current mix of uses and phasing. Over time, the parking required per the shared parking analyses may vary depending on the ultimate build-out and mix of uses.
In addition, sustainability project features would be implemented by incorporation of the features into the conditions of approval for the project, mitigation measures, or pursuant to the regulations or design criteria required by the Specific Plan. A matrix summarizing these and other sustainable design features that would be implemented by the project is contained in Table II-3 in Section II, Project Description, of this Draft EIR.
IV.K Traffic, Access, and Parking
City of Los Angeles Boyle Heights Mixed-Use Community Project SCH. No. 2008061123 October 2011
Page IV.K-51
WORKING DRAFT – Not for Public Review
d. Analysis of Project Impacts
(1) Construction
(a) Proposed Truck Staging Area and Truck Haul Traffic
(i) Staging Area
Trucks would stage on-site within the construction areas (off-street) and/or at an ancillary off-site parking lot procured on a temporary basis as needed. Staging would occur off-street as much as possible.
(ii) Haul Activity
The proposed haul activity time periods for project construction are from 7:00 A.M. to 5:00 P.M., Monday through Friday (10-hour day). It is forecast that approximately 2,800 cubic yards (cy) of earth material would be exported to a landfill site over the course of a work day. The project proposes to use Double Bottom Dump trucks (capacity of 14 cy). At approximately 14 cy per truck, this translates into 200 loads per day. Assuming four loads per truck per day, a total of 50 trucks would be required and the peak haul truck traffic would generate 400 trips per day (200 inbound + 200 outbound = 400 total trips). On an average hourly basis, assuming a uniform distribution of haul trips over the workday, these daily trip totals would translate to approximately 40 trips per hour.
It is estimated that Phases 1 through 3 would have a demolition and earthwork schedule of approximately nine months for each phase, Phase 4 would have a demolition and earthwork schedule of approximately eight months, and Phase 5 would have a demolition and earthwork schedule of approximately seven months. Construction periods could overlap.
(iii) Proposed Haul Truck Routes
It is anticipated that soils and materials from the excavation and demolition of all phases of the project will be hauled to the Puente Hills Landfill (2800 Workman Mill Road, Whittier California) and/or the Nu-Way Live Oak Landfill (13623 Live Oak Lane, Baldwin Park, California). Following sorting for recycling, construction debris would be disposed of at the Chiquita Canyon Landfill in Castaic.
The proposed haul truck routes are described below:
Chiquita Canyon Landfill—The haul trucks exiting the project site would travel west on Olympic Boulevard, turn right on Soto Street heading north, and turn
IV.K Traffic, Access, and Parking
City of Los Angeles Boyle Heights Mixed-Use Community Project SCH. No. 2008061123 October 2011
Page IV.K-52
WORKING DRAFT – Not for Public Review
right at the I-5 Northbound ramp at Soto Street. They would exit the I-5 onto SR-126 to the Chiquita Canyon Landfill. The return to the project site would travel on the same haul route.
Puente Hills Landfill—The haul trucks exiting the project site would travel west on Olympic Boulevard, turn right on Soto Street heading north, and turn right at the SR 60 Eastbound on ramp at Soto Street. They would exit the freeway at the Crossroad Parkway (South) to Puente Hills Landfill. The return to the project site would travel on the same haul route.
Nu-Way Live Oak Landfill—The haul trucks exiting the project site would travel west on Olympic Boulevard, turn right on Soto Street heading north, and turn right at the SR 60 Eastbound on ramp at Soto Street, proceeding to I-605 South to exit the freeway at Arrow Highway, and turn right at Live Oak Lane to Nu-Way Live Oak Landfill, Baldwin Park, California. The return to the project site would travel on the same haul route.
(iv) Construction Truck Traffic
The number of truck trips during construction phases would fluctuate depending on the construction activity scheduled for a particular day. During the construction of concrete structures, approximately 60 trucks per day on pour days would be expected, with 10 trucks on days between pour days. After all structural concrete work has been completed, an average of 15 trucks per day is anticipated. All phases are expected to have similar levels of construction truck traffic. During the peak construction activity, approximately 60 daily truck deliveries would be expected (60 inbound + 60 outbound = 120 total trips). On an average hourly basis, assuming a uniform distribution of trips over the workday, these daily trip totals would translate to approximately 12 trips per hour (6 inbound and 6 outbound).
(v) Impact Analysis
The estimated level of haul truck traffic, in conjunction with the mitigation measures proposed below, is not expected to result in a significant traffic impact. The proposed routes would utilize Olympic Boulevard and Soto Street to access the freeways, both of which are classified as Major Highway Class II in the City of Los Angeles’ General Circulation Plan and are designed to accommodate the estimated level of truck traffic. However, it is conservatively assumed that the truck traffic would result in a temporary, short-term adverse impact prior to mitigation.
(b) Construction Worker Traffic
Construction worker traffic would depend on not only the level of effort during various construction phases, but also on the mode and time of travel of the workers. The
IV.K Traffic, Access, and Parking
City of Los Angeles Boyle Heights Mixed-Use Community Project SCH. No. 2008061123 October 2011
Page IV.K-53
WORKING DRAFT – Not for Public Review
hours of construction would require most workers to be on-site before the A.M. peak period, but some could potentially depart during the P.M. peak period. As shown in Table 47 in the Traffic Study (see Appendix L to this Draft EIR), it is estimated that daily workers would range from 45 to 90 workers during demolition of Phases 1 through 5, 40 to 70 workers during site preparation and excavation of Phases 1 through 5, and 300 to 500 workers during construction of Phases 1 through 5. Conservatively, assuming that 25 percent of the construction employees would enter or leave the project site during the peak hours, this translates to a range of 10 trips to 125 trips during peak periods.
The number of worker trips is expected to be substantially less than the peak-hour trip generation associated with the proposed project once it is in operation. Therefore, traffic-related impacts associated with the worker trips would be far less than those identified above for project operation. However, given the level of baseline traffic at some of the study intersections near the project site, it is possible that the combination of pour truck/delivery truck traffic and employee traffic during construction periods of each phase could cause temporary adverse impacts at some intersections during the construction period prior to mitigation.
(c) Construction Worker Parking
Parking for construction workers will be provided in the construction area of the phase of the project under construction (not in the remaining existing residential parking areas of the project site), or at a designated off-site off-street parking lot.
Because worker parking will be provided in the construction area of the phase of the project under construction, or at a designated lot, construction activities are not expected to create an on-site or off-site parking impact.
(d) Roadway and Sidewalk Access
(i) Off-Site
Potential impacts associated with physical construction of the project (e.g., partial lane closures) would be limited to those locations immediately adjacent to the project site. Development facing Olympic Boulevard and 8th Street could have short-term impacts at localized, individual building locations, for curb cuts, curb landscaping, etc. Substantial lane closures would not be required along these locations. However, construction of the curb cuts and access roadways and driveways would occur prior to the completion of the development they would be serving. During the construction of pedestrian streetscape features, temporary sidewalk closures along the perimeter sidewalks around the project site could occur. These are not expected to create any hazards or other significant adverse impacts.
IV.K Traffic, Access, and Parking
City of Los Angeles Boyle Heights Mixed-Use Community Project SCH. No. 2008061123 October 2011
Page IV.K-54
WORKING DRAFT – Not for Public Review
(ii) On-Site
During construction, portions of roads and sidewalks internal to the project site will be closed as grading and construction of the modified street network occurs. In addition to serving the uses of the project site, most of the internal roads are designated as pedestrian routes to school for the Garza Primary Center on the southwest corner of the project site, and Christopher Dena Elementary School on the southeast. Closures to the roads and sidewalks through the project site could affect access to these schools on a temporary basis, and lengthen the walking time to the schools, but these closures are not expected to have a significant impact on access or create any hazards.
(iii) Impact Analysis
With the mitigation measures beginning on page IV.K-95, access impacts should be limited in their intensity and duration. However, it is conservatively assumed that the access closures would result in temporary, short-term adverse impacts prior to mitigation.
(e) Summary of Construction Impacts
Overall, the impact on the transportation system from construction activities would be temporary in nature and would cause an intermittent reduction in street and intersection operating capacity and access to adjacent uses near the project site. Impacts on traffic conditions associated with construction of projects are typically considered temporary, short-term adverse impacts. LADOT has not established a significance threshold for such impacts. Nonetheless, based on the three significance thresholds that have been identified above, it is not expected that the project would: (1) cause “substantial” delays and disruption of existing traffic flow; (2) require substantial roadway and/or sidewalk closures to the extent that a “hazard” to roadway travelers and/or pedestrians would occur; or (3) result in the substantial loss of on-site and/or off-site parking such that the parking needs of the project area would not be met.
With regard to causing a substantial inconvenience to auto travelers, bus riders or parkers, it has been concluded that delays from additional construction traffic and/or construction activities at other locations are not expected to be substantial. Construction traffic impacts on roadway operations are considered to be potentially short-term adverse impacts, prior to mitigation, and mitigation measures are recommended below. But with the imposition of mitigation, construction impacts would not be considered significant.
With regard to potential hazardous conditions, project construction is not expected to create hazards for roadway travelers, so long as commonly practiced safety procedures for construction are followed. Such procedures have been incorporated into the mitigation measures for construction impacts.
IV.K Traffic, Access, and Parking
City of Los Angeles Boyle Heights Mixed-Use Community Project SCH. No. 2008061123 October 2011
Page IV.K-55
WORKING DRAFT – Not for Public Review
During construction, an adequate number of parking spaces would be available at all times (on-site and/or off-site parking spaces). Therefore, project construction would result in a less than significant impact with regard to the availability of on-site and off-site parking spaces.
(2) Operation
(a) Intersections
The analysis of project traffic impacts on the study intersections is based on a comparison of the Future (2030) Base traffic conditions against the Future (2030) With Project traffic conditions.
(i) Future (2030) Base Conditions
As discussed above, the Future (2030) Base traffic condition considers the effects of regional growth and of other developments either proposed, approved, or under construction in the study area. PCE factors were also applied to account for truck traffic in the study area.
Table IV.K-7 on page IV.K-56 shows the V/C ratios and corresponding LOS during the A.M. and P.M. peak hours for the 75 signalized study intersections in the Future Base (Year 2030) traffic conditions. As indicated therein, 49 of the 75 analyzed intersections are projected to operate at an acceptable LOS D or better during both beak periods, while 26 of the intersections are projected to operate at LOS E or F during one or both peak hours. In addition to the 12 intersections that operate at LOS E or F during one or both peak hours under Existing (2008) Conditions, the following 14 intersections would operate at LOS E or F in either one or both peak hours:
2. Soto Street & Marengo Street (both peak hours)
6. Soto Street & 1st Street (both peak hours)
10. I-5 Northbound Ramps & 4th Street (P.M. peak hour)
14. Lorena Street & 4th Street (P.M. peak hour)
24. Lorena Street & Whittier Boulevard (P.M. peak hour)
26. Alameda Street & 7th Street (A.M. peak hour)
28. Boyle Avenue & 7th Street (A.M. peak hour)
32. Boyle Avenue & 8th Street (both peak hours)
43. Santa Fe Avenue & Porter Street (P.M. peak hour)
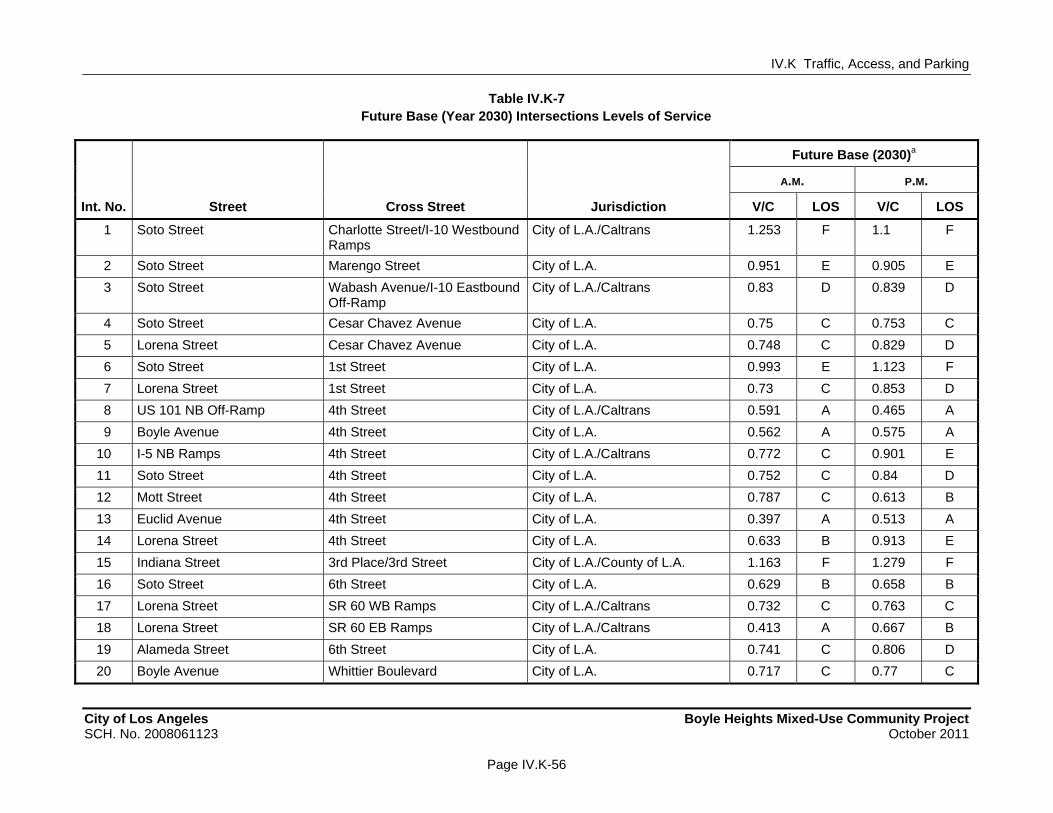
IV.K Traffic, Access, and Parking
City of Los Angeles Boyle Heights Mixed-Use Community Project SCH. No. 2008061123 October 2011
Page IV.K-56
WORKING DRAFT – Not for Public Review
Table IV.K-7 Future Base (Year 2030) Intersections Levels of Service
Future Base (2030)a
A.M. P.M.
Int. No. Street Cross Street Jurisdiction V/C LOS V/C LOS
1 Soto Street Charlotte Street/I-10 Westbound Ramps
City of L.A./Caltrans 1.253 F 1.1 F
2 Soto Street Marengo Street City of L.A. 0.951 E 0.905 E
3 Soto Street Wabash Avenue/I-10 Eastbound Off-Ramp
City of L.A./Caltrans 0.83 D 0.839 D
4 Soto Street Cesar Chavez Avenue City of L.A. 0.75 C 0.753 C
5 Lorena Street Cesar Chavez Avenue City of L.A. 0.748 C 0.829 D
6 Soto Street 1st Street City of L.A. 0.993 E 1.123 F
7 Lorena Street 1st Street City of L.A. 0.73 C 0.853 D
8 US 101 NB Off-Ramp 4th Street City of L.A./Caltrans 0.591 A 0.465 A
9 Boyle Avenue 4th Street City of L.A. 0.562 A 0.575 A
10 I-5 NB Ramps 4th Street City of L.A./Caltrans 0.772 C 0.901 E
11 Soto Street 4th Street City of L.A. 0.752 C 0.84 D
12 Mott Street 4th Street City of L.A. 0.787 C 0.613 B
13 Euclid Avenue 4th Street City of L.A. 0.397 A 0.513 A
14 Lorena Street 4th Street City of L.A. 0.633 B 0.913 E
15 Indiana Street 3rd Place/3rd Street City of L.A./County of L.A. 1.163 F 1.279 F
16 Soto Street 6th Street City of L.A. 0.629 B 0.658 B
17 Lorena Street SR 60 WB Ramps City of L.A./Caltrans 0.732 C 0.763 C
18 Lorena Street SR 60 EB Ramps City of L.A./Caltrans 0.413 A 0.667 B
19 Alameda Street 6th Street City of L.A. 0.741 C 0.806 D
20 Boyle Avenue Whittier Boulevard City of L.A. 0.717 C 0.77 C
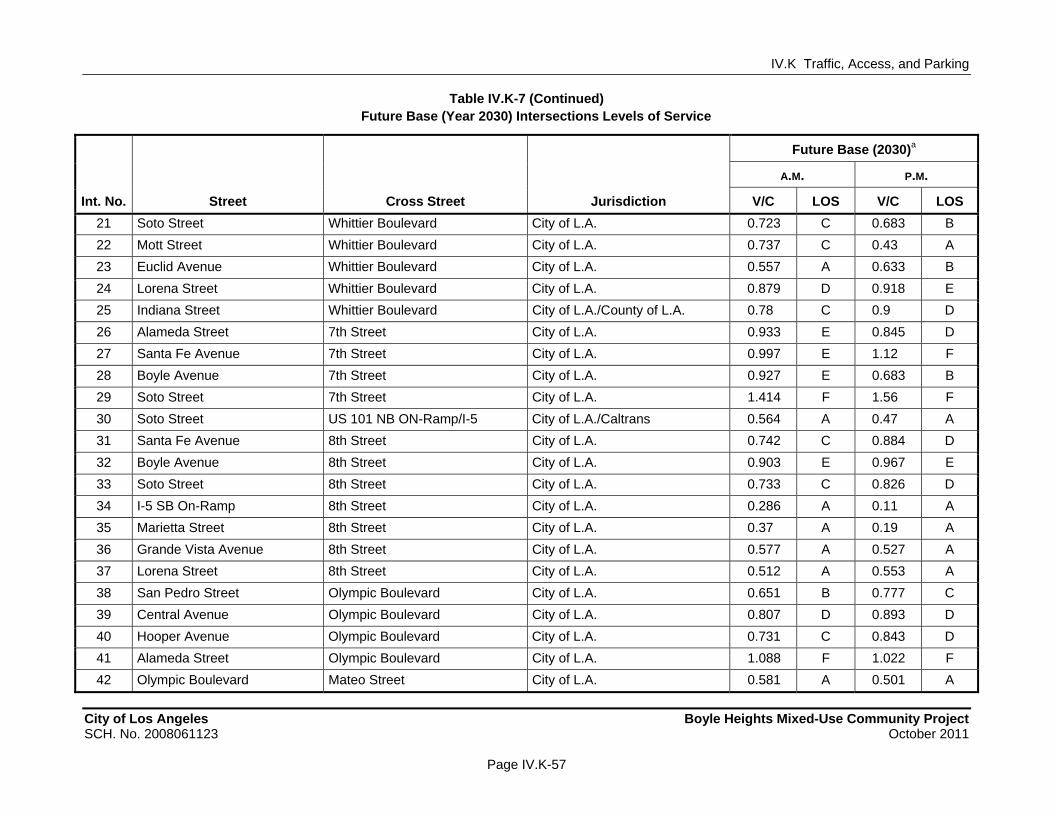
IV.K Traffic, Access, and Parking
Table IV.K-7 (Continued) Future Base (Year 2030) Intersections Levels of Service
City of Los Angeles Boyle Heights Mixed-Use Community Project SCH. No. 2008061123 October 2011
Page IV.K-57
WORKING DRAFT – Not for Public Review
Future Base (2030)a
A.M. P.M.
Int. No. Street Cross Street Jurisdiction V/C LOS V/C LOS
21 Soto Street Whittier Boulevard City of L.A. 0.723 C 0.683 B
22 Mott Street Whittier Boulevard City of L.A. 0.737 C 0.43 A
23 Euclid Avenue Whittier Boulevard City of L.A. 0.557 A 0.633 B
24 Lorena Street Whittier Boulevard City of L.A. 0.879 D 0.918 E
25 Indiana Street Whittier Boulevard City of L.A./County of L.A. 0.78 C 0.9 D
26 Alameda Street 7th Street City of L.A. 0.933 E 0.845 D
27 Santa Fe Avenue 7th Street City of L.A. 0.997 E 1.12 F
28 Boyle Avenue 7th Street City of L.A. 0.927 E 0.683 B
29 Soto Street 7th Street City of L.A. 1.414 F 1.56 F
30 Soto Street US 101 NB ON-Ramp/I-5 City of L.A./Caltrans 0.564 A 0.47 A
31 Santa Fe Avenue 8th Street City of L.A. 0.742 C 0.884 D
32 Boyle Avenue 8th Street City of L.A. 0.903 E 0.967 E
33 Soto Street 8th Street City of L.A. 0.733 C 0.826 D
34 I-5 SB On-Ramp 8th Street City of L.A. 0.286 A 0.11 A
35 Marietta Street 8th Street City of L.A. 0.37 A 0.19 A
36 Grande Vista Avenue 8th Street City of L.A. 0.577 A 0.527 A
37 Lorena Street 8th Street City of L.A. 0.512 A 0.553 A
38 San Pedro Street Olympic Boulevard City of L.A. 0.651 B 0.777 C
39 Central Avenue Olympic Boulevard City of L.A. 0.807 D 0.893 D
40 Hooper Avenue Olympic Boulevard City of L.A. 0.731 C 0.843 D
41 Alameda Street Olympic Boulevard City of L.A. 1.088 F 1.022 F
42 Olympic Boulevard Mateo Street City of L.A. 0.581 A 0.501 A
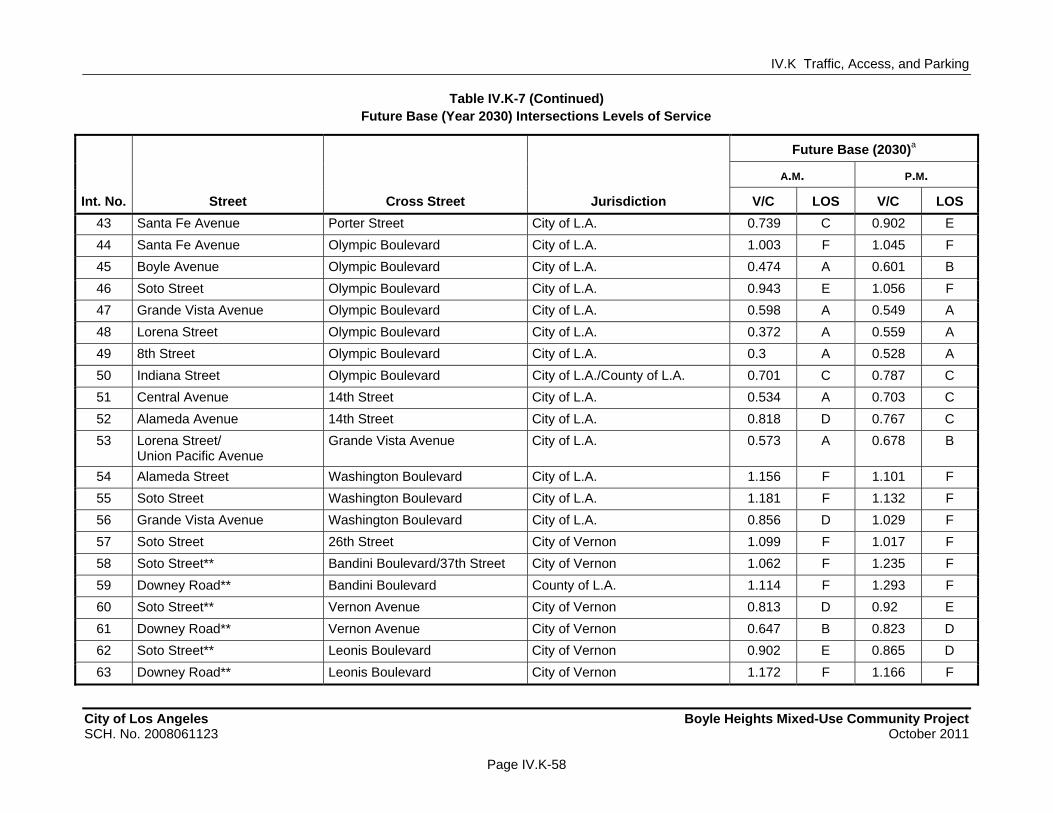
IV.K Traffic, Access, and Parking
Table IV.K-7 (Continued) Future Base (Year 2030) Intersections Levels of Service
City of Los Angeles Boyle Heights Mixed-Use Community Project SCH. No. 2008061123 October 2011
Page IV.K-58
WORKING DRAFT – Not for Public Review
Future Base (2030)a
A.M. P.M.
Int. No. Street Cross Street Jurisdiction V/C LOS V/C LOS
43 Santa Fe Avenue Porter Street City of L.A. 0.739 C 0.902 E
44 Santa Fe Avenue Olympic Boulevard City of L.A. 1.003 F 1.045 F
45 Boyle Avenue Olympic Boulevard City of L.A. 0.474 A 0.601 B
46 Soto Street Olympic Boulevard City of L.A. 0.943 E 1.056 F
47 Grande Vista Avenue Olympic Boulevard City of L.A. 0.598 A 0.549 A
48 Lorena Street Olympic Boulevard City of L.A. 0.372 A 0.559 A
49 8th Street Olympic Boulevard City of L.A. 0.3 A 0.528 A
50 Indiana Street Olympic Boulevard City of L.A./County of L.A. 0.701 C 0.787 C
51 Central Avenue 14th Street City of L.A. 0.534 A 0.703 C
52 Alameda Avenue 14th Street City of L.A. 0.818 D 0.767 C
53 Lorena Street/ Union Pacific Avenue
Grande Vista Avenue City of L.A. 0.573 A 0.678 B
54 Alameda Street Washington Boulevard City of L.A. 1.156 F 1.101 F
55 Soto Street Washington Boulevard City of L.A. 1.181 F 1.132 F
56 Grande Vista Avenue Washington Boulevard City of L.A. 0.856 D 1.029 F
57 Soto Street 26th Street City of Vernon 1.099 F 1.017 F
58 Soto Street** Bandini Boulevard/37th Street City of Vernon 1.062 F 1.235 F
59 Downey Road** Bandini Boulevard County of L.A. 1.114 F 1.293 F
60 Soto Street** Vernon Avenue City of Vernon 0.813 D 0.92 E
61 Downey Road** Vernon Avenue City of Vernon 0.647 B 0.823 D
62 Soto Street** Leonis Boulevard City of Vernon 0.902 E 0.865 D
63 Downey Road** Leonis Boulevard City of Vernon 1.172 F 1.166 F
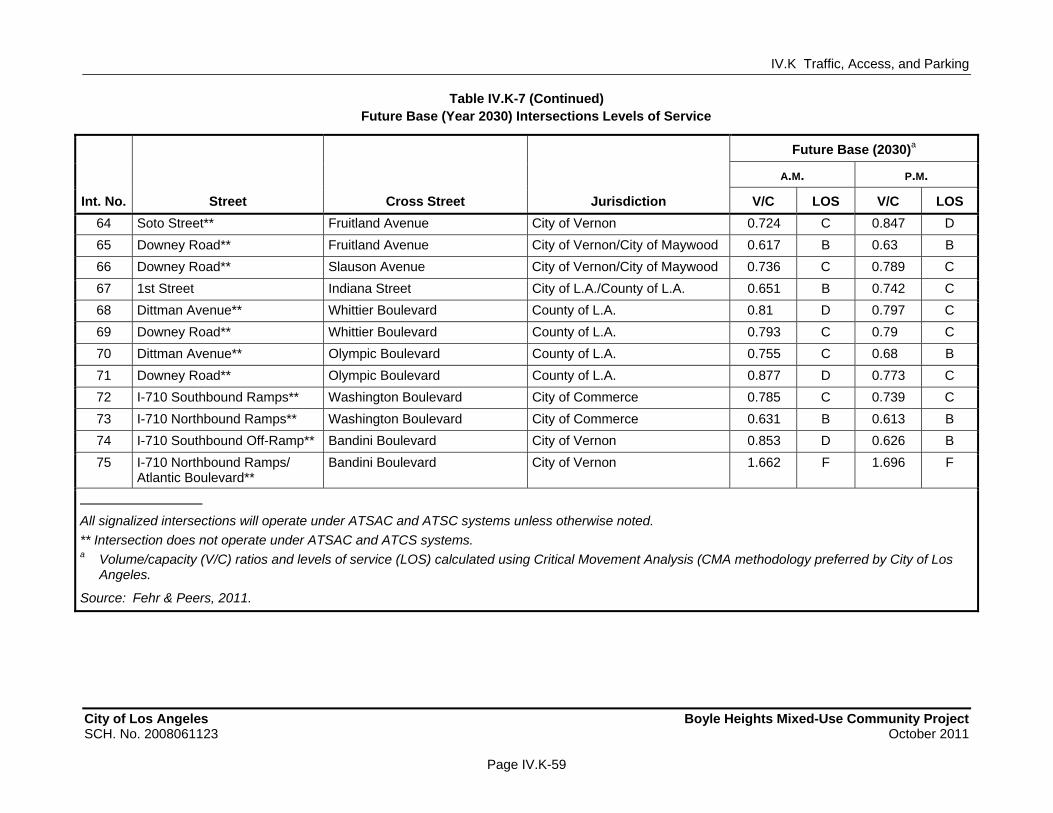
IV.K Traffic, Access, and Parking
Table IV.K-7 (Continued) Future Base (Year 2030) Intersections Levels of Service
City of Los Angeles Boyle Heights Mixed-Use Community Project SCH. No. 2008061123 October 2011
Page IV.K-59
WORKING DRAFT – Not for Public Review
Future Base (2030)a
A.M. P.M.
Int. No. Street Cross Street Jurisdiction V/C LOS V/C LOS
64 Soto Street** Fruitland Avenue City of Vernon 0.724 C 0.847 D
65 Downey Road** Fruitland Avenue City of Vernon/City of Maywood 0.617 B 0.63 B
66 Downey Road** Slauson Avenue City of Vernon/City of Maywood 0.736 C 0.789 C
67 1st Street Indiana Street City of L.A./County of L.A. 0.651 B 0.742 C
68 Dittman Avenue** Whittier Boulevard County of L.A. 0.81 D 0.797 C
69 Downey Road** Whittier Boulevard County of L.A. 0.793 C 0.79 C
70 Dittman Avenue** Olympic Boulevard County of L.A. 0.755 C 0.68 B
71 Downey Road** Olympic Boulevard County of L.A. 0.877 D 0.773 C
72 I-710 Southbound Ramps** Washington Boulevard City of Commerce 0.785 C 0.739 C
73 I-710 Northbound Ramps** Washington Boulevard City of Commerce 0.631 B 0.613 B
74 I-710 Southbound Off-Ramp** Bandini Boulevard City of Vernon 0.853 D 0.626 B
75 I-710 Northbound Ramps/ Atlantic Boulevard**
Bandini Boulevard City of Vernon 1.662 F 1.696 F
All signalized intersections will operate under ATSAC and ATSC systems unless otherwise noted.
** Intersection does not operate under ATSAC and ATCS systems. a Volume/capacity (V/C) ratios and levels of service (LOS) calculated using Critical Movement Analysis (CMA methodology preferred by City of Los
Angeles.
Source: Fehr & Peers, 2011.
IV.K Traffic, Access, and Parking
City of Los Angeles Boyle Heights Mixed-Use Community Project SCH. No. 2008061123 October 2011
Page IV.K-60
WORKING DRAFT – Not for Public Review
46. Soto Street & Olympic Boulevard (both peak hours)
56. Grande Vista Avenue & Washington Boulevard (P.M. peak hour)
60. Soto Street & Vernon Avenue (P.M. peak hour)
62. Soto Street & Leonis Boulevard (A.M. peak hour)
63. Downey Road & Leonis Boulevard (both peak hours)
As indicated in Table IV.K-8 on page IV.K-61, four of the nine unsignalized intersections are projected to operate at an acceptable LOS D or better, while five are projected to operate at LOS E or F. In addition to the four intersections (O. Orme Avenue & Olympic Boulevard; P. Camulos Street & Olympic Boulevard; Q. Evergreen Avenue & Olympic Boulevard; and R. Dacotah Street & Olympic Boulevard) that operate at LOS E or F during one or both peak hours under Existing (2008) conditions, the following intersection is projected to operate at LOS E or F during both peak hours under Future Base (Year 2030) conditions:
M. Euclid Avenue & 8th Street (both peak hours)
Signal warrant analysis was run for Future Base (Year 2030) conditions. As indicated in Table IV.K-10, in addition to the two intersections (M. Euclid Avenue & 8th Street and Q. Evergreen Avenue & Olympic Boulevard) that meet signal warrants under Existing (Year 2008) conditions, the following three intersections are projected to meet signal warrants under Future Base (Year 2030) conditions:
O. Orme Avenue & Olympic Boulevard (peak hour, 4-hour)
P. Camulos Street & Olympic Boulevard (peak hour, 4-hour)
R. Dacotah Street & Olympic Boulevard (peak hour, 4-hour, 8-hour)
In addition to the LOS results detailed above, Appendix G to the Traffic Study included as Appendix L of this Draft EIR provides LOS analyses for intersections located in the County of Los Angeles as well as the City of Vernon using the preferred analysis methodology of that jurisdiction.
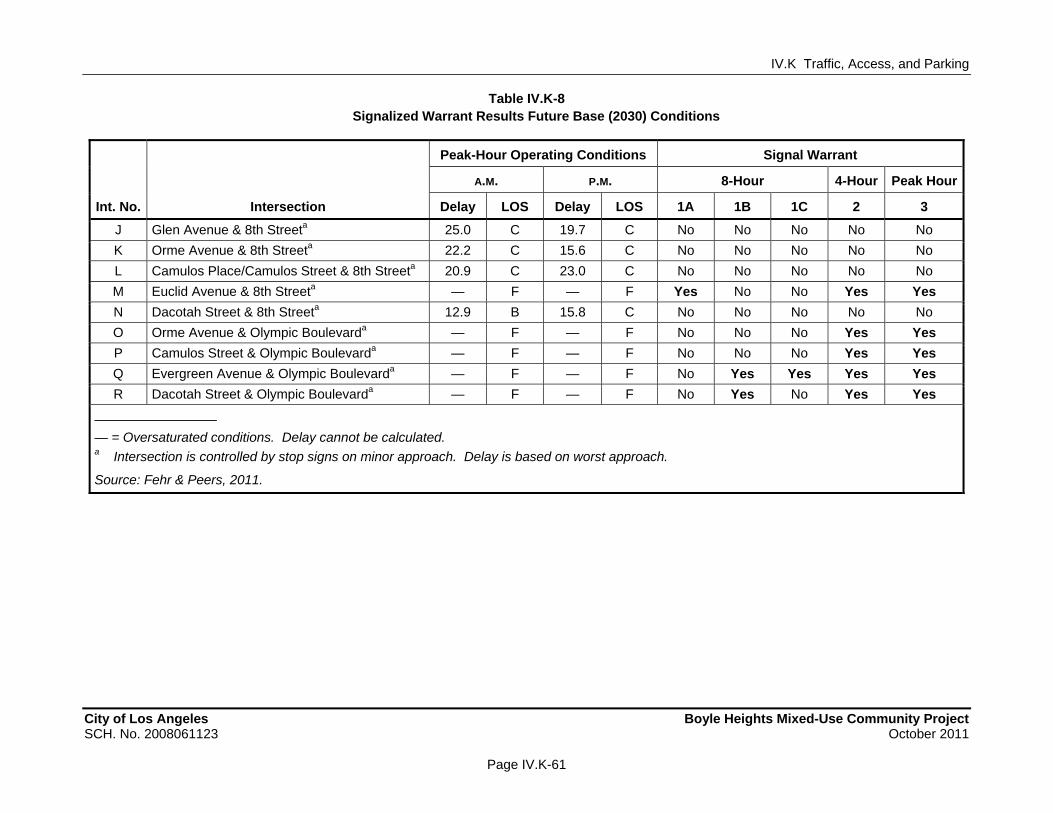
IV.K Traffic, Access, and Parking
City of Los Angeles Boyle Heights Mixed-Use Community Project SCH. No. 2008061123 October 2011
Page IV.K-61
WORKING DRAFT – Not for Public Review
Table IV.K-8 Signalized Warrant Results Future Base (2030) Conditions
Peak-Hour Operating Conditions Signal Warrant
A.M. P.M. 8-Hour 4-Hour Peak Hour
Int. No. Intersection Delay LOS Delay LOS 1A 1B 1C 2 3
J Glen Avenue & 8th Streeta 25.0 C 19.7 C No No No No No
K Orme Avenue & 8th Streeta 22.2 C 15.6 C No No No No No
L Camulos Place/Camulos Street & 8th Streeta 20.9 C 23.0 C No No No No No
M Euclid Avenue & 8th Streeta — F — F Yes No No Yes Yes
N Dacotah Street & 8th Streeta 12.9 B 15.8 C No No No No No
O Orme Avenue & Olympic Boulevarda — F — F No No No Yes Yes
P Camulos Street & Olympic Boulevarda — F — F No No No Yes Yes
Q Evergreen Avenue & Olympic Boulevarda — F — F No Yes Yes Yes Yes
R Dacotah Street & Olympic Boulevarda — F — F No Yes No Yes Yes
— = Oversaturated conditions. Delay cannot be calculated. a Intersection is controlled by stop signs on minor approach. Delay is based on worst approach.
Source: Fehr & Peers, 2011.
IV.K Traffic, Access, and Parking
City of Los Angeles Boyle Heights Mixed-Use Community Project SCH. No. 2008061123 October 2011
Page IV.K-62
WORKING DRAFT – Not for Public Review
(ii) Future (2030) With Project Conditions
Project Trip Generation
The methodology for determining the project’s trip generation, including credits applied for internally captured trips, pass-by trips, and external transit, walking, and bike trips, is described above on page IV.K-36 and in the Traffic Study included as Appendix L to this Draft EIR. As shown in Table IV.K-9 on page IV.K-63, based on this methodology, the Maximum Office scenario is projected to generate approximately 25,209 daily trips, including 1,975 A.M. peak-hour trips and 2,464 P.M. peak-hour trips. As discussed above on page IV.K-36, the Maximum Office scenario includes a total of 150,000 square feet of office space, inclusive of medical office, and 135,000 sf of combined retail space. With credits for the existing uses to be removed, the Maximum Office scenario is projected to generate a net of about 19,382 daily trips, including 1,507 A.M. and 1,927 P.M. peak-hour trips. As shown in Table IV.K-10 on page IV.K-65, the Maximum Retail scenario is projected to generate approximately 25,467 daily trips, including 1,926 A.M. peak-hour trips and 2,471 P.M. peak-hour trips. As discussed above on page IV.K-36, the Maximum Retail scenario includes a total of 100,000 sf of total office space, inclusive of medical office, and 185,000 sf of combined retail space. With credits for the existing uses to be removed, the Maximum Retail scenario is projected to generate a net of about 19,640 daily trips, including 1,458 A.M. and 1,934 P.M. peak-hour trips.
The net A.M. peak-hour trip generation for the Maximum Office scenario and the net P.M. peak-hour trip generation for the Maximum Retail scenario were selected for analysis because they represent the peak trip generation for the project.
Future Levels of Service
Based on the project trip assignment methodology described earlier in this section beginning on page IV.K-38, the Future (2030) With Project conditions at the 75 signalized study intersections are summarized in Table IV.K-11 on page IV.K-67. Detailed LOS worksheets are provided in Appendix D to the Traffic Study (see Appendix L to this Draft EIR).on page IV.K-72. As indicated in Table IV.K-11, 46 of the 75 signalized study intersections are projected to operate at an acceptable LOS D or better during both peak periods under Future (2030) With Project conditions, while 29 of the intersections are projected to operate at LOS E or F during one or both peak hours. In addition to the 26 intersections that operate at LOS E or F during one or both peak hours under Future Base (Year 2030) conditions, the following three intersections are projected to operate at LOS E or F in either the A.M., the P.M. or during both peak hours under Future with Project (Year 2030) conditions:
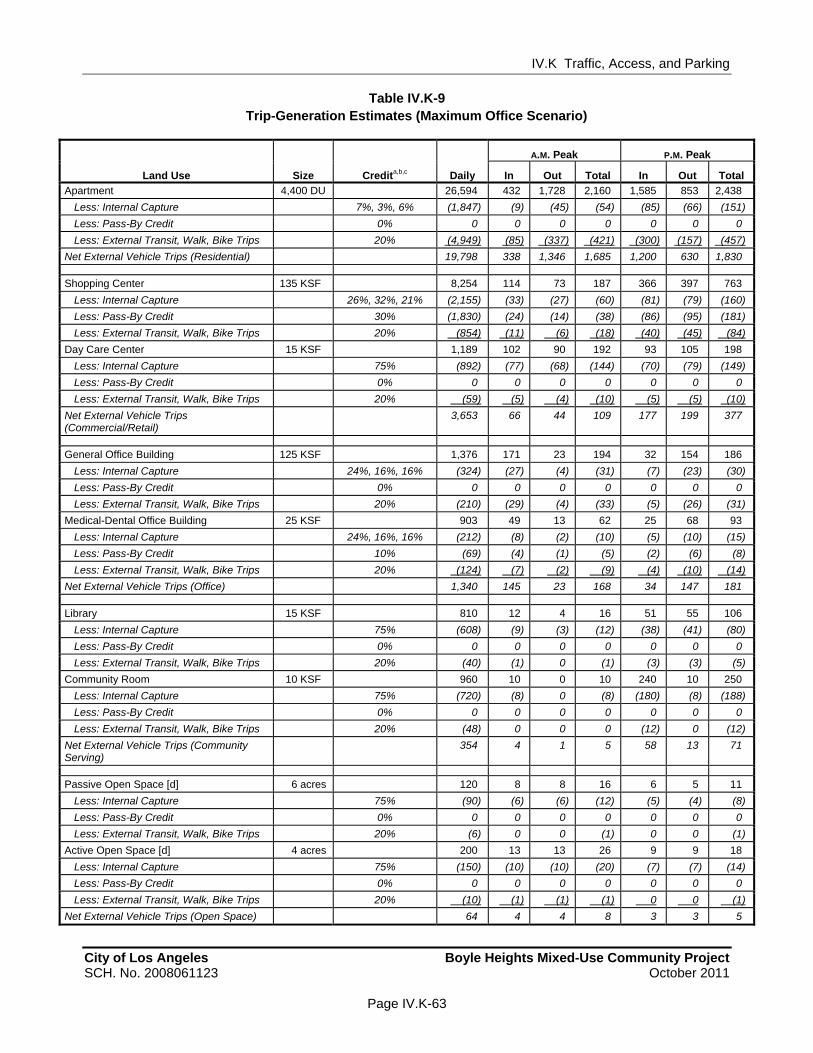
IV.K Traffic, Access, and Parking
City of Los Angeles Boyle Heights Mixed-Use Community Project SCH. No. 2008061123 October 2011
Page IV.K-63
WORKING DRAFT – Not for Public Review
Table IV.K-9 Trip-Generation Estimates (Maximum Office Scenario)
A.M. Peak P.M. Peak
Land Use Size Credita,b,c Daily In Out Total In Out Total
Apartment 4,400 DU 26,594 432 1,728 2,160 1,585 853 2,438
Less: Internal Capture 7%, 3%, 6% (1,847) (9) (45) (54) (85) (66) (151)
Less: Pass-By Credit 0% 0 0 0 0 0 0 0
Less: External Transit, Walk, Bike Trips 20% (4,949) (85) (337) (421) (300) (157) (457)
Net External Vehicle Trips (Residential) 19,798 338 1,346 1,685 1,200 630 1,830
Shopping Center 135 KSF 8,254 114 73 187 366 397 763
Less: Internal Capture 26%, 32%, 21% (2,155) (33) (27) (60) (81) (79) (160)
Less: Pass-By Credit 30% (1,830) (24) (14) (38) (86) (95) (181)
Less: External Transit, Walk, Bike Trips 20% (854) (11) (6) (18) (40) (45) (84)
Day Care Center 15 KSF 1,189 102 90 192 93 105 198
Less: Internal Capture 75% (892) (77) (68) (144) (70) (79) (149)
Less: Pass-By Credit 0% 0 0 0 0 0 0 0
Less: External Transit, Walk, Bike Trips 20% (59) (5) (4) (10) (5) (5) (10)
Net External Vehicle Trips (Commercial/Retail)
3,653 66 44 109 177 199 377
General Office Building 125 KSF 1,376 171 23 194 32 154 186
Less: Internal Capture 24%, 16%, 16% (324) (27) (4) (31) (7) (23) (30)
Less: Pass-By Credit 0% 0 0 0 0 0 0 0
Less: External Transit, Walk, Bike Trips 20% (210) (29) (4) (33) (5) (26) (31)
Medical-Dental Office Building 25 KSF 903 49 13 62 25 68 93
Less: Internal Capture 24%, 16%, 16% (212) (8) (2) (10) (5) (10) (15)
Less: Pass-By Credit 10% (69) (4) (1) (5) (2) (6) (8)
Less: External Transit, Walk, Bike Trips 20% (124) (7) (2) (9) (4) (10) (14)
Net External Vehicle Trips (Office) 1,340 145 23 168 34 147 181
Library 15 KSF 810 12 4 16 51 55 106
Less: Internal Capture 75% (608) (9) (3) (12) (38) (41) (80)
Less: Pass-By Credit 0% 0 0 0 0 0 0 0
Less: External Transit, Walk, Bike Trips 20% (40) (1) 0 (1) (3) (3) (5)
Community Room 10 KSF 960 10 0 10 240 10 250
Less: Internal Capture 75% (720) (8) 0 (8) (180) (8) (188)
Less: Pass-By Credit 0% 0 0 0 0 0 0 0
Less: External Transit, Walk, Bike Trips 20% (48) 0 0 0 (12) 0 (12)
Net External Vehicle Trips (Community Serving)
354 4 1 5 58 13 71
Passive Open Space [d] 6 acres 120 8 8 16 6 5 11
Less: Internal Capture 75% (90) (6) (6) (12) (5) (4) (8)
Less: Pass-By Credit 0% 0 0 0 0 0 0 0
Less: External Transit, Walk, Bike Trips 20% (6) 0 0 (1) 0 0 (1)
Active Open Space [d] 4 acres 200 13 13 26 9 9 18
Less: Internal Capture 75% (150) (10) (10) (20) (7) (7) (14)
Less: Pass-By Credit 0% 0 0 0 0 0 0 0
Less: External Transit, Walk, Bike Trips 20% (10) (1) (1) (1) 0 0 (1)
Net External Vehicle Trips (Open Space) 64 4 4 8 3 3 5
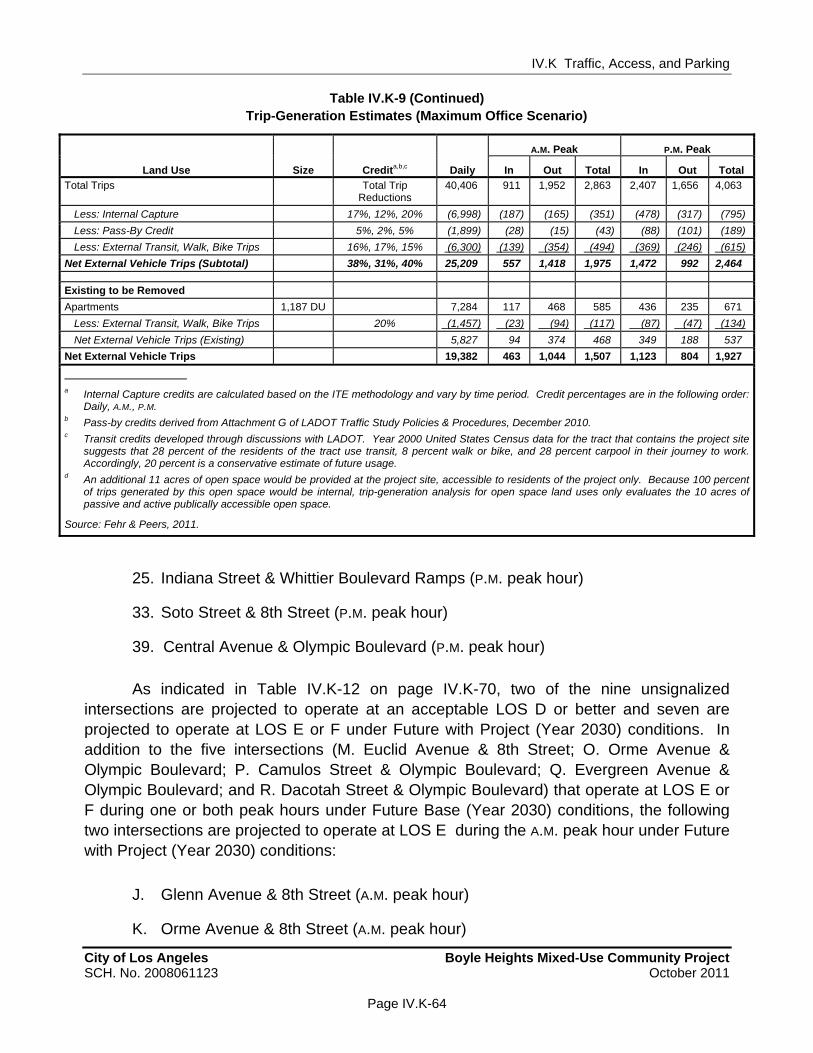
IV.K Traffic, Access, and Parking
Table IV.K-9 (Continued) Trip-Generation Estimates (Maximum Office Scenario)
City of Los Angeles Boyle Heights Mixed-Use Community Project SCH. No. 2008061123 October 2011
Page IV.K-64
WORKING DRAFT – Not for Public Review
A.M. Peak P.M. Peak
Land Use Size Credita,b,c Daily In Out Total In Out Total
Total Trips Total Trip Reductions
40,406 911 1,952 2,863 2,407 1,656 4,063
Less: Internal Capture 17%, 12%, 20% (6,998) (187) (165) (351) (478) (317) (795)
Less: Pass-By Credit 5%, 2%, 5% (1,899) (28) (15) (43) (88) (101) (189)
Less: External Transit, Walk, Bike Trips 16%, 17%, 15% (6,300) (139) (354) (494) (369) (246) (615)
Net External Vehicle Trips (Subtotal) 38%, 31%, 40% 25,209 557 1,418 1,975 1,472 992 2,464
Existing to be Removed
Apartments 1,187 DU 7,284 117 468 585 436 235 671
Less: External Transit, Walk, Bike Trips 20% (1,457) (23) (94) (117) (87) (47) (134)
Net External Vehicle Trips (Existing) 5,827 94 374 468 349 188 537
Net External Vehicle Trips 19,382 463 1,044 1,507 1,123 804 1,927
a Internal Capture credits are calculated based on the ITE methodology and vary by time period. Credit percentages are in the following order: Daily, A.M., P.M.
b Pass-by credits derived from Attachment G of LADOT Traffic Study Policies & Procedures, December 2010. c Transit credits developed through discussions with LADOT. Year 2000 United States Census data for the tract that contains the project site
suggests that 28 percent of the residents of the tract use transit, 8 percent walk or bike, and 28 percent carpool in their journey to work. Accordingly, 20 percent is a conservative estimate of future usage.
d An additional 11 acres of open space would be provided at the project site, accessible to residents of the project only. Because 100 percent of trips generated by this open space would be internal, trip-generation analysis for open space land uses only evaluates the 10 acres of passive and active publically accessible open space.
Source: Fehr & Peers, 2011.
25. Indiana Street & Whittier Boulevard Ramps (P.M. peak hour)
33. Soto Street & 8th Street (P.M. peak hour)
39. Central Avenue & Olympic Boulevard (P.M. peak hour)
As indicated in Table IV.K-12 on page IV.K-70, two of the nine unsignalized intersections are projected to operate at an acceptable LOS D or better and seven are projected to operate at LOS E or F under Future with Project (Year 2030) conditions. In addition to the five intersections (M. Euclid Avenue & 8th Street; O. Orme Avenue & Olympic Boulevard; P. Camulos Street & Olympic Boulevard; Q. Evergreen Avenue & Olympic Boulevard; and R. Dacotah Street & Olympic Boulevard) that operate at LOS E or F during one or both peak hours under Future Base (Year 2030) conditions, the following two intersections are projected to operate at LOS E during the A.M. peak hour under Future with Project (Year 2030) conditions:
J. Glenn Avenue & 8th Street (A.M. peak hour)
K. Orme Avenue & 8th Street (A.M. peak hour)

IV.K Traffic, Access, and Parking
City of Los Angeles Boyle Heights Mixed-Use Community Project SCH. No. 2008061123 October 2011
Page IV.K-65
WORKING DRAFT – Not for Public Review
Table IV.K-10 Trip-Generation Estimates (Maximum Retail Scenario)
A.M. Peak P.M. Peak
Land Use Size Credita,b,c Daily In Out Total In Out Total
Apartments 4,400 DU 26,594 432 1,728 2,160 1,585 853 2,438
Residential Condominium/Townhouse 0 DU 0 0 0 0 0 0 0
Less: Internal Capture 8%, 3%, 7% (2,213) (11) (45) (56) (91) (81) (172)
Less: Pass-By Credit 0% 0 0 0 0 0 0 0
Less: External Transit, Walk, Bike Trips 20% (4,876) (84) (337) (421) (299) (154) (453)
Net External Vehicle Trips (Residential) 19,505 337 1,346 1,683 1,195 618 1,813
Shopping Center 185 KSF 10,130 138 88 226 451 489 940
Less: Internal Capture 24%, 32%, 21% (2,447) (39) (33) (72) (99) (98) (197)
Less: Pass-By Credit 30% (2,305) (30) (17) (46) (106) (117) (223)
Less: External Transit, Walk, Bike Trips 20% (1,076) (14) (8) (22) (49) (55) (104)
Day Care Center 15 KSF 1,189 102 90 192 93 105 198
Less: Internal Capture 75% (892) (77) (68) (144) (70) (79) (149)
Less: Pass-By Credit 0% 0 0 0 0 0 0 0
Less: External Transit, Walk, Bike Trips 20% (59) (5) (4) (10) (5) (5) (10)
Net External Vehicle Trips (Commercial/Retail)
4,540 75 48 124 215 240 455
General Office Building 75 KSF 826 102 14 116 19 93 112
Less: Internal Capture 23%, 22%, 19% (194) (23) (3) (26) (6) (15) (21)
Less: Pass-By Credit 0% 0 0 0 0 0 0 0
Less: External Transit, Walk, Bike Trips 20% (126) (16) (2) (18) (3) (16) (18)
Medical-Dental Office Building 25 KSF 903 49 13 62 25 68 93
Less: Internal Capture 23%, 22%, 19% (212) (11) (3) (14) (8) (11) (19)
Less: Pass-By Credit 10% (69) (4) (1) (5) (2) (6) (7)
Less: External Transit, Walk, Bike Trips 20% (124) (7) (2) (9) (3) (10) (13)
Net External Vehicle Trips (Office) 1,004 90 16 106 22 103 127
Library 15 KSF 810 12 4 16 51 55 106
Less: Internal Capture 75% (608) (9) (3) (12) (38) (41) (80)
Less: Pass-By Credit 0% 0 0 0 0 0 0 0
Less: External Transit, Walk, Bike Trips 20% (40) (1) 0 (1) (3) (3) (5)
Community Room 10 KSF 960 10 0 10 240 10 250
Less: Internal Capture 75% (720) (8) 0 (8) (180) (8) (188)
Less: Pass-By Credit 0% 0 0 0 0 0 0 0
Less: External Transit, Walk, Bike Trips 20% (48) 0 0 0 (12) 0 (12)
Net External Vehicle Trips (Community Serving)
354 4 1 5 58 13 71
Passive Open Space [d] 6 acres 120 8 8 16 6 5 11
Less: Internal Capture 75% (90) (6) (6) (12) (5) (4) (8)
Less: Pass-By Credit 0% 0 0 0 0 0 0 0
Less: External Transit, Walk, Bike Trips 20% (6) 0 0 (1) 0 0 (1)
Active Open Space [d] 4 acres 200 13 13 26 9 9 18
Less: Internal Capture 75% (150) (10) (10) (20) (7) (7) (14)
Less: Pass-By Credit 0% 0 0 0 0 0 0 0
Less: External Transit, Walk, Bike Trips 20% (10) (1) (1) (1) 0 0 (1)
Net External Vehicle Trips (Open Space) 64 4 4 8 3 3 5
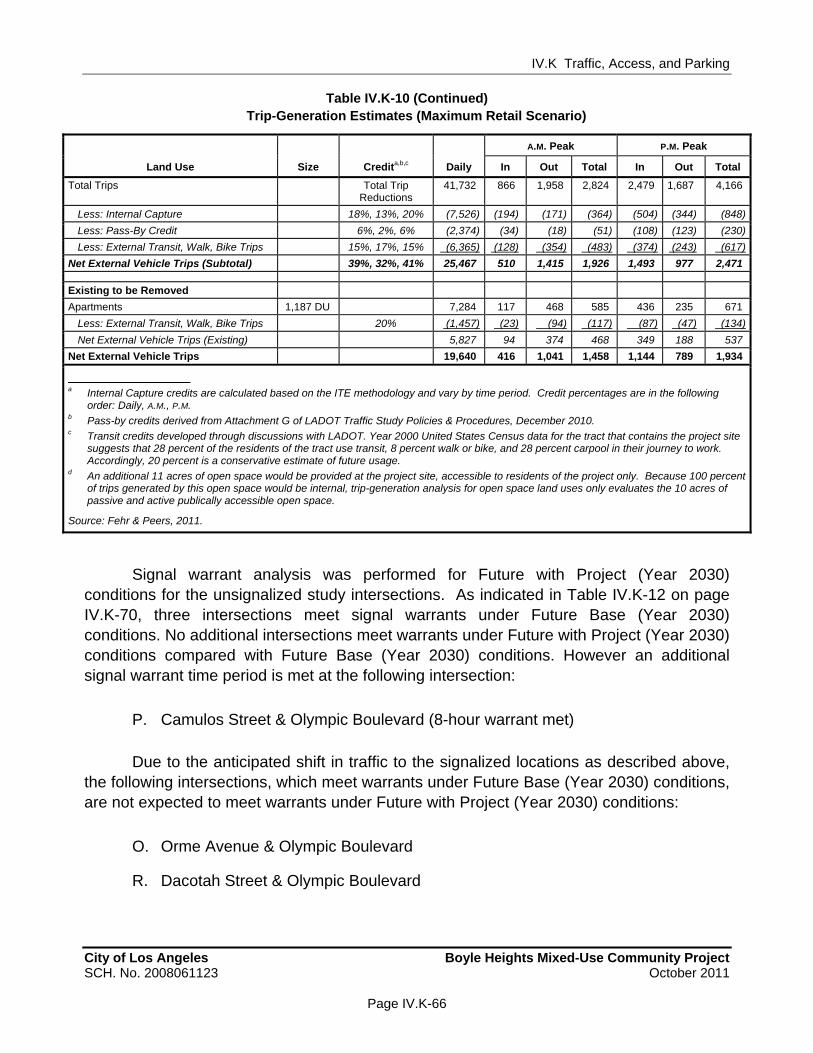
IV.K Traffic, Access, and Parking
Table IV.K-10 (Continued) Trip-Generation Estimates (Maximum Retail Scenario)
City of Los Angeles Boyle Heights Mixed-Use Community Project SCH. No. 2008061123 October 2011
Page IV.K-66
WORKING DRAFT – Not for Public Review
A.M. Peak P.M. Peak
Land Use Size Credita,b,c Daily In Out Total In Out Total
Total Trips Total Trip Reductions
41,732 866 1,958 2,824 2,479 1,687 4,166
Less: Internal Capture 18%, 13%, 20% (7,526) (194) (171) (364) (504) (344) (848)
Less: Pass-By Credit 6%, 2%, 6% (2,374) (34) (18) (51) (108) (123) (230)
Less: External Transit, Walk, Bike Trips 15%, 17%, 15% (6,365) (128) (354) (483) (374) (243) (617)
Net External Vehicle Trips (Subtotal) 39%, 32%, 41% 25,467 510 1,415 1,926 1,493 977 2,471
Existing to be Removed
Apartments 1,187 DU 7,284 117 468 585 436 235 671
Less: External Transit, Walk, Bike Trips 20% (1,457) (23) (94) (117) (87) (47) (134)
Net External Vehicle Trips (Existing) 5,827 94 374 468 349 188 537
Net External Vehicle Trips 19,640 416 1,041 1,458 1,144 789 1,934
a Internal Capture credits are calculated based on the ITE methodology and vary by time period. Credit percentages are in the following
order: Daily, A.M., P.M. b Pass-by credits derived from Attachment G of LADOT Traffic Study Policies & Procedures, December 2010. c Transit credits developed through discussions with LADOT. Year 2000 United States Census data for the tract that contains the project site
suggests that 28 percent of the residents of the tract use transit, 8 percent walk or bike, and 28 percent carpool in their journey to work. Accordingly, 20 percent is a conservative estimate of future usage.
d An additional 11 acres of open space would be provided at the project site, accessible to residents of the project only. Because 100 percent of trips generated by this open space would be internal, trip-generation analysis for open space land uses only evaluates the 10 acres of passive and active publically accessible open space.
Source: Fehr & Peers, 2011.
Signal warrant analysis was performed for Future with Project (Year 2030) conditions for the unsignalized study intersections. As indicated in Table IV.K-12 on page IV.K-70, three intersections meet signal warrants under Future Base (Year 2030) conditions. No additional intersections meet warrants under Future with Project (Year 2030) conditions compared with Future Base (Year 2030) conditions. However an additional signal warrant time period is met at the following intersection:
P. Camulos Street & Olympic Boulevard (8-hour warrant met)
Due to the anticipated shift in traffic to the signalized locations as described above, the following intersections, which meet warrants under Future Base (Year 2030) conditions, are not expected to meet warrants under Future with Project (Year 2030) conditions:
O. Orme Avenue & Olympic Boulevard
R. Dacotah Street & Olympic Boulevard
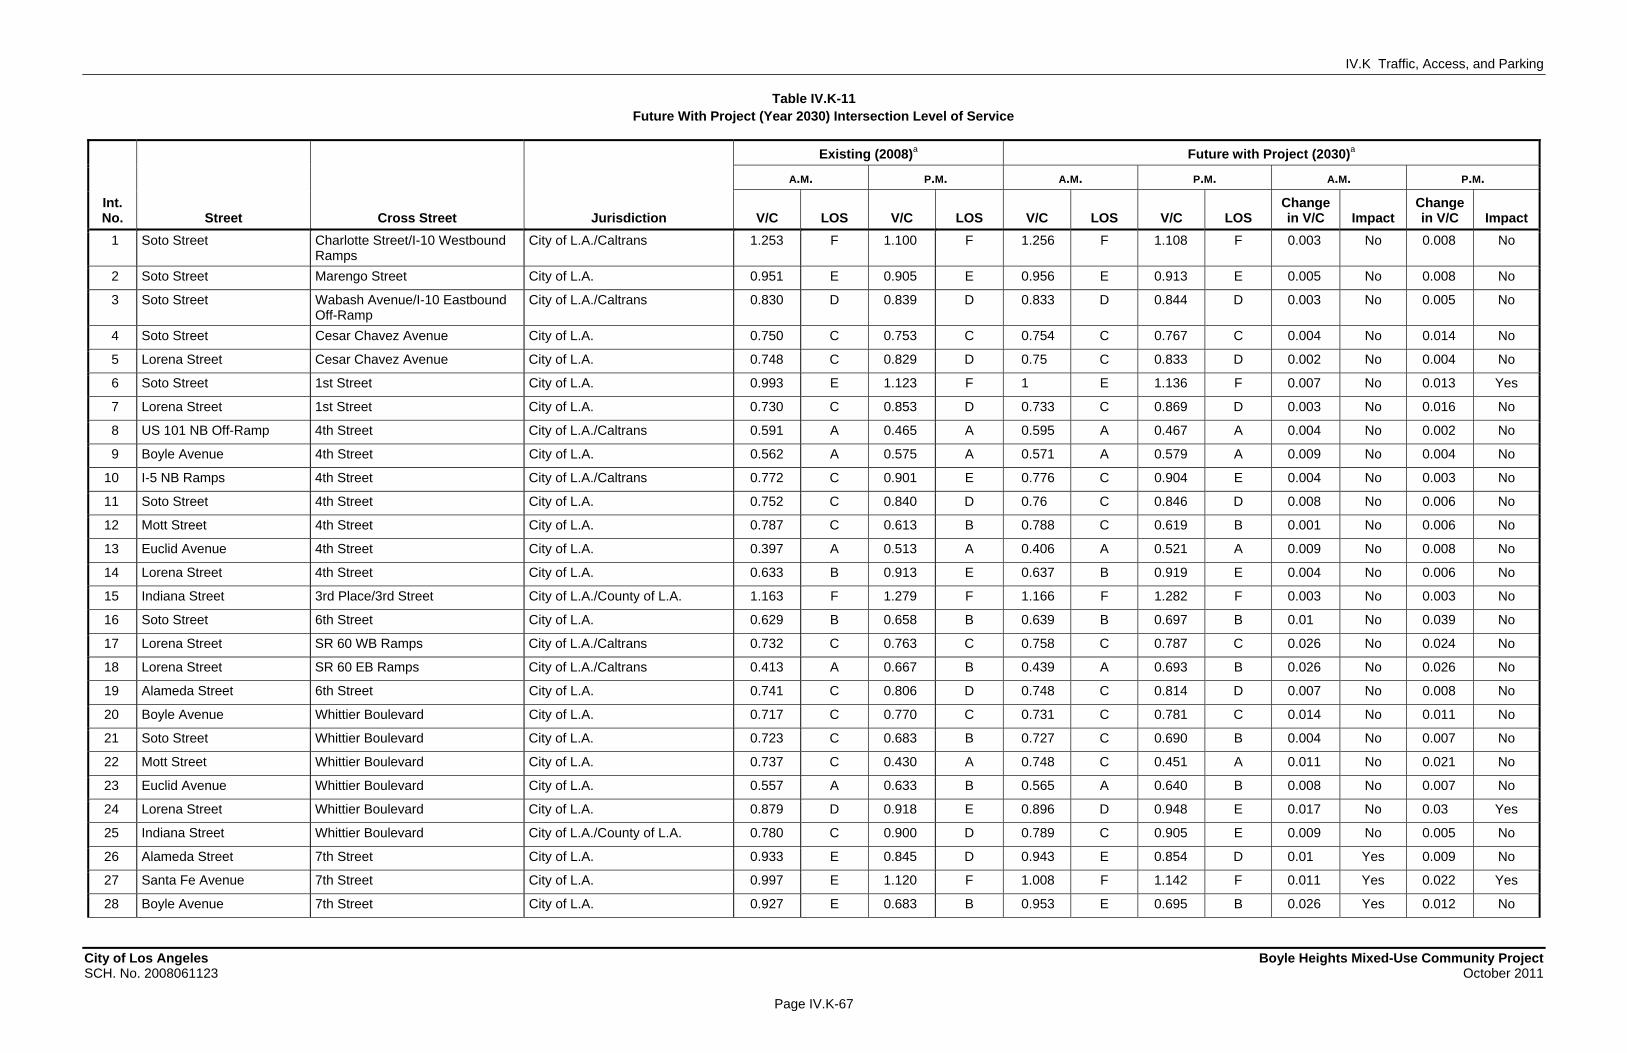
IV.K Traffic, Access, and Parking
City of Los Angeles Boyle Heights Mixed-Use Community Project SCH. No. 2008061123 October 2011
Page IV.K-67
WORKING DRAFT – Not for Public Review
Table IV.K-11 Future With Project (Year 2030) Intersection Level of Service
Existing (2008)a Future with Project (2030)a
A.M. P.M. A.M. P.M. A.M. P.M.
Int. No. Street Cross Street Jurisdiction V/C LOS V/C LOS V/C LOS V/C LOS
Change in V/C Impact
Change in V/C Impact
1 Soto Street Charlotte Street/I-10 Westbound Ramps
City of L.A./Caltrans 1.253 F 1.100 F 1.256 F 1.108 F 0.003 No 0.008 No
2 Soto Street Marengo Street City of L.A. 0.951 E 0.905 E 0.956 E 0.913 E 0.005 No 0.008 No
3 Soto Street Wabash Avenue/I-10 Eastbound Off-Ramp
City of L.A./Caltrans 0.830 D 0.839 D 0.833 D 0.844 D 0.003 No 0.005 No
4 Soto Street Cesar Chavez Avenue City of L.A. 0.750 C 0.753 C 0.754 C 0.767 C 0.004 No 0.014 No
5 Lorena Street Cesar Chavez Avenue City of L.A. 0.748 C 0.829 D 0.75 C 0.833 D 0.002 No 0.004 No
6 Soto Street 1st Street City of L.A. 0.993 E 1.123 F 1 E 1.136 F 0.007 No 0.013 Yes
7 Lorena Street 1st Street City of L.A. 0.730 C 0.853 D 0.733 C 0.869 D 0.003 No 0.016 No
8 US 101 NB Off-Ramp 4th Street City of L.A./Caltrans 0.591 A 0.465 A 0.595 A 0.467 A 0.004 No 0.002 No
9 Boyle Avenue 4th Street City of L.A. 0.562 A 0.575 A 0.571 A 0.579 A 0.009 No 0.004 No
10 I-5 NB Ramps 4th Street City of L.A./Caltrans 0.772 C 0.901 E 0.776 C 0.904 E 0.004 No 0.003 No
11 Soto Street 4th Street City of L.A. 0.752 C 0.840 D 0.76 C 0.846 D 0.008 No 0.006 No
12 Mott Street 4th Street City of L.A. 0.787 C 0.613 B 0.788 C 0.619 B 0.001 No 0.006 No
13 Euclid Avenue 4th Street City of L.A. 0.397 A 0.513 A 0.406 A 0.521 A 0.009 No 0.008 No
14 Lorena Street 4th Street City of L.A. 0.633 B 0.913 E 0.637 B 0.919 E 0.004 No 0.006 No
15 Indiana Street 3rd Place/3rd Street City of L.A./County of L.A. 1.163 F 1.279 F 1.166 F 1.282 F 0.003 No 0.003 No
16 Soto Street 6th Street City of L.A. 0.629 B 0.658 B 0.639 B 0.697 B 0.01 No 0.039 No
17 Lorena Street SR 60 WB Ramps City of L.A./Caltrans 0.732 C 0.763 C 0.758 C 0.787 C 0.026 No 0.024 No
18 Lorena Street SR 60 EB Ramps City of L.A./Caltrans 0.413 A 0.667 B 0.439 A 0.693 B 0.026 No 0.026 No
19 Alameda Street 6th Street City of L.A. 0.741 C 0.806 D 0.748 C 0.814 D 0.007 No 0.008 No
20 Boyle Avenue Whittier Boulevard City of L.A. 0.717 C 0.770 C 0.731 C 0.781 C 0.014 No 0.011 No
21 Soto Street Whittier Boulevard City of L.A. 0.723 C 0.683 B 0.727 C 0.690 B 0.004 No 0.007 No
22 Mott Street Whittier Boulevard City of L.A. 0.737 C 0.430 A 0.748 C 0.451 A 0.011 No 0.021 No
23 Euclid Avenue Whittier Boulevard City of L.A. 0.557 A 0.633 B 0.565 A 0.640 B 0.008 No 0.007 No
24 Lorena Street Whittier Boulevard City of L.A. 0.879 D 0.918 E 0.896 D 0.948 E 0.017 No 0.03 Yes
25 Indiana Street Whittier Boulevard City of L.A./County of L.A. 0.780 C 0.900 D 0.789 C 0.905 E 0.009 No 0.005 No
26 Alameda Street 7th Street City of L.A. 0.933 E 0.845 D 0.943 E 0.854 D 0.01 Yes 0.009 No
27 Santa Fe Avenue 7th Street City of L.A. 0.997 E 1.120 F 1.008 F 1.142 F 0.011 Yes 0.022 Yes
28 Boyle Avenue 7th Street City of L.A. 0.927 E 0.683 B 0.953 E 0.695 B 0.026 Yes 0.012 No

IV.K Traffic, Access, and Parking
Table IV.K-11 (Continued) Future With Project (Year 2030) Intersection Level of Service
City of Los Angeles Boyle Heights Mixed-Use Community Project SCH. No. 2008061123 October 2011
Page IV.K-68
WORKING DRAFT – Not for Public Review
Existing (2008)a Future with Project (2030)a
A.M. P.M. A.M. P.M. A.M. P.M.
Int. No. Street Cross Street Jurisdiction V/C LOS V/C LOS V/C LOS V/C LOS
Change in V/C Impact
Change in V/C Impact
29 Soto Street 7th Street City of L.A. 1.414 F 1.560 F 1.432 F 1.578 F 0.018 Yes 0.018 Yes
30 Soto Street US 101 NB ON-Ramp/I-5 City of L.A./Caltrans 0.564 A 0.470 A 0.576 A 0.475 A 0.012 No 0.005 No
31 Santa Fe Avenue 8th Street City of L.A. 0.742 C 0.884 D 0.751 C 0.887 D 0.009 No 0.003 No
32 Boyle Avenue 8th Street City of L.A. 0.903 E 0.967 E 0.987 E 1.091 F 0.084 Yes 0.124 Yes
33 Soto Street 8th Street City of L.A. 0.733 C 0.826 D 0.826 D 0.951 E 0.093 Yes 0.125 Yes
34 I-5 SB On-Ramp 8th Street City of L.A. 0.286 A 0.110 A 0.364 A 0.164 A 0.078 No 0.054 No
35 Marietta Street 8th Street City of L.A. 0.37 A 0.190 A 0.445 A 0.324 A 0.075 No 0.134 No
36 Grande Vista Avenue 8th Street City of L.A. 0.577 A 0.527 A 0.652 B 0.609 B 0.075 No 0.082 No
37 Lorena Street 8th Street City of L.A. 0.512 A 0.553 A 0.547 A 0.589 A 0.035 No 0.036 No
38 San Pedro Street Olympic Boulevard City of L.A. 0.651 B 0.777 C 0.657 B 0.784 C 0.006 No 0.007 No
39 Central Avenue Olympic Boulevard City of L.A. 0.807 D 0.893 D 0.84 D 0.922 E 0.033 Yes 0.029 Yes
40 Hooper Avenue Olympic Boulevard City of L.A. 0.731 C 0.843 D 0.775 C 0.886 D 0.044 Yes 0.043 Yes
41 Alameda Street Olympic Boulevard City of L.A. 1.088 F 1.022 F 1.145 F 1.075 F 0.057 Yes 0.053 Yes
42 Olympic Boulevard Mateo Street City of L.A. 0.581 A 0.501 A 0.643 B 0.540 A 0.062 No 0.039 No
43 Santa Fe Avenue Porter Street City of L.A. 0.739 C 0.902 E 0.748 C 0.920 E 0.009 No 0.018 Yes
44 Santa Fe Avenue Olympic Boulevard City of L.A. 1.003 F 1.045 F 1.118 F 1.142 F 0.115 Yes 0.097 Yes
45 Boyle Avenue Olympic Boulevard City of L.A. 0.474 A 0.601 B 0.526 A 0.641 B 0.052 No 0.04 No
46 Soto Street Olympic Boulevard City of L.A. 0.943 E 1.056 F 1.006 F 1.150 F 0.063 Yes 0.094 Yes
47 Grande Vista Avenue Olympic Boulevard City of L.A. 0.598 A 0.549 A 0.647 B 0.621 B 0.049 No 0.072 No
48 Lorena Street Olympic Boulevard City of L.A. 0.372 A 0.559 A 0.385 A 0.581 A 0.013 No 0.022 No
49 8th Street Olympic Boulevard City of L.A. 0.300 A 0.528 A 0.313 A 0.544 A 0.013 No 0.016 No
50 Indiana Street Olympic Boulevard City of L.A./County of L.A. 0.701 C 0.787 C 0.708 C 0.811 D 0.007 No 0.024 Yes
51 Central Avenue 14th Street City of L.A. 0.534 A 0.703 C 0.535 A 0.723 C 0.001 No 0.02 No
52 Alameda Avenue 14th Street City of L.A. 0.818 D 0.767 C 0.828 D 0.792 C 0.01 No 0.025 No
53 Lorena Street/ Union Pacific Avenue
Grande Vista Avenue City of L.A. 0.573 A 0.678 B 0.588 A 0.678 B 0.015 No 0 No
54 Alameda Street Washington Boulevard City of L.A. 1.156 F 1.101 F 1.16 F 1.106 F 0.004 No 0.005 No
55 Soto Street Washington Boulevard City of L.A. 1.181 F 1.132 F 1.198 F 1.155 F 0.017 Yes 0.023 Yes
56 Grande Vista Avenue Washington Boulevard City of L.A. 0.856 D 1.029 F 0.88 D 1.066 F 0.024 Yes 0.037 Yes
57 Soto Street 26th Street City of Vernon 1.099 F 1.017 F 1.106 F 1.031 F 0.007 No 0.014 Yes
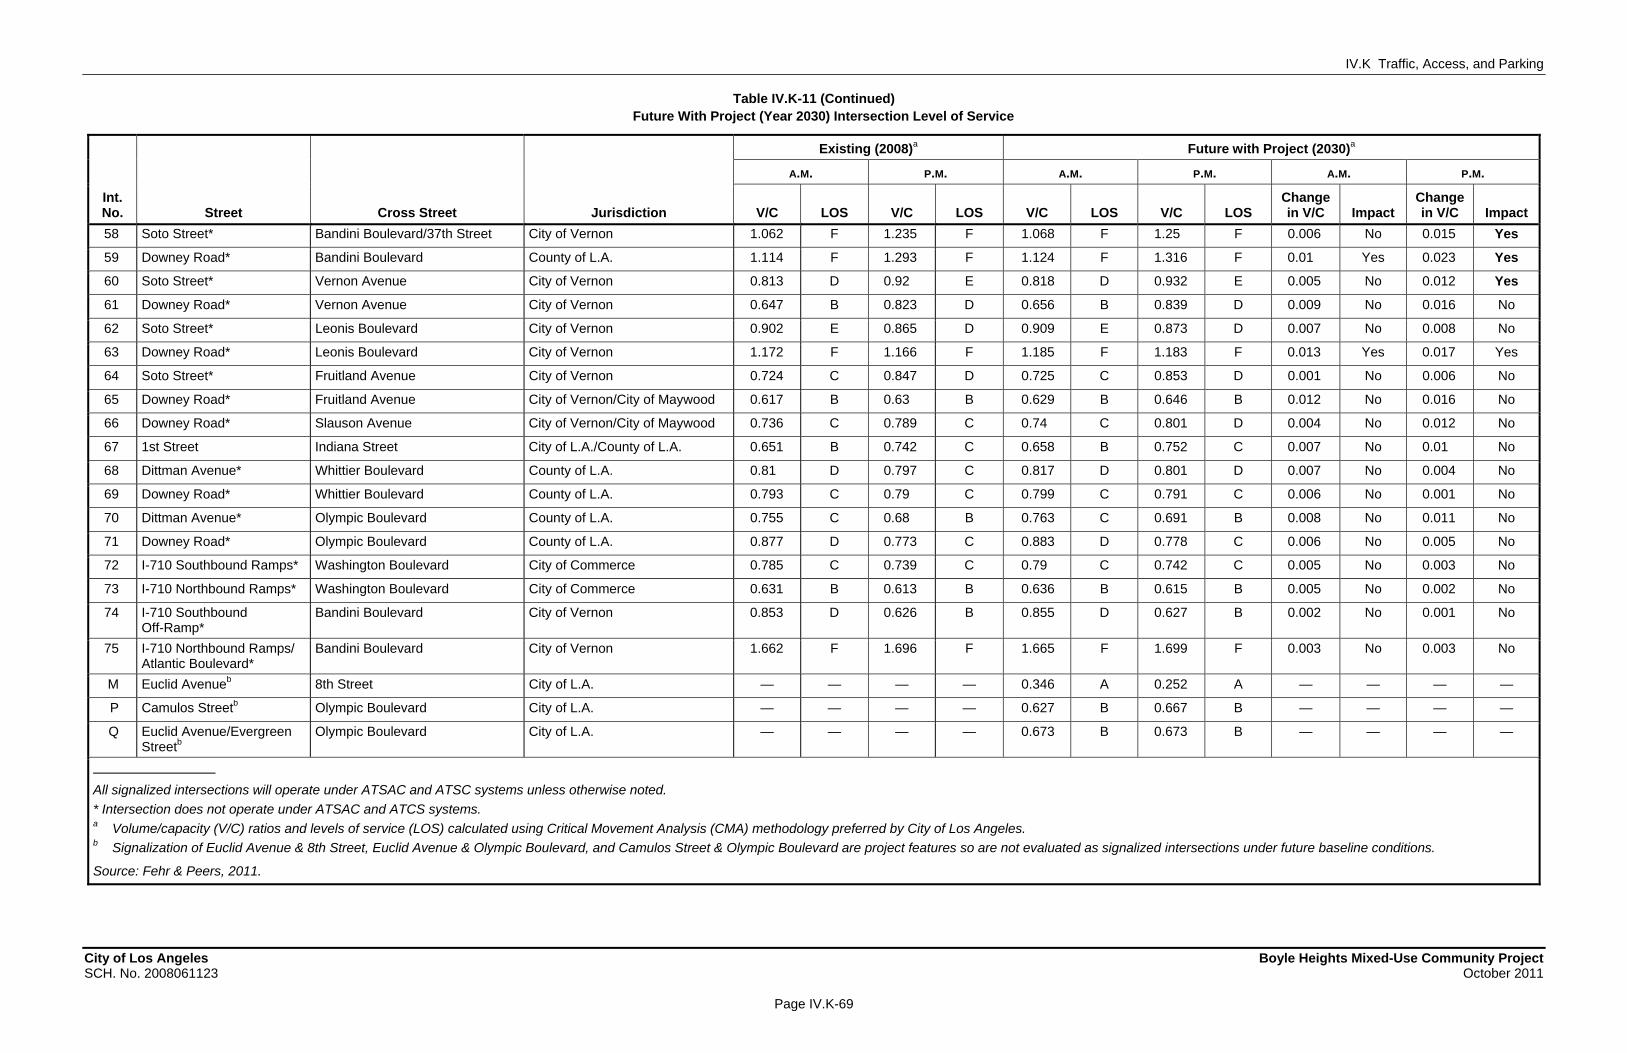
IV.K Traffic, Access, and Parking
Table IV.K-11 (Continued) Future With Project (Year 2030) Intersection Level of Service
City of Los Angeles Boyle Heights Mixed-Use Community Project SCH. No. 2008061123 October 2011
Page IV.K-69
WORKING DRAFT – Not for Public Review
Existing (2008)a Future with Project (2030)a
A.M. P.M. A.M. P.M. A.M. P.M.
Int. No. Street Cross Street Jurisdiction V/C LOS V/C LOS V/C LOS V/C LOS
Change in V/C Impact
Change in V/C Impact
58 Soto Street* Bandini Boulevard/37th Street City of Vernon 1.062 F 1.235 F 1.068 F 1.25 F 0.006 No 0.015 Yes
59 Downey Road* Bandini Boulevard County of L.A. 1.114 F 1.293 F 1.124 F 1.316 F 0.01 Yes 0.023 Yes
60 Soto Street* Vernon Avenue City of Vernon 0.813 D 0.92 E 0.818 D 0.932 E 0.005 No 0.012 Yes
61 Downey Road* Vernon Avenue City of Vernon 0.647 B 0.823 D 0.656 B 0.839 D 0.009 No 0.016 No
62 Soto Street* Leonis Boulevard City of Vernon 0.902 E 0.865 D 0.909 E 0.873 D 0.007 No 0.008 No
63 Downey Road* Leonis Boulevard City of Vernon 1.172 F 1.166 F 1.185 F 1.183 F 0.013 Yes 0.017 Yes
64 Soto Street* Fruitland Avenue City of Vernon 0.724 C 0.847 D 0.725 C 0.853 D 0.001 No 0.006 No
65 Downey Road* Fruitland Avenue City of Vernon/City of Maywood 0.617 B 0.63 B 0.629 B 0.646 B 0.012 No 0.016 No
66 Downey Road* Slauson Avenue City of Vernon/City of Maywood 0.736 C 0.789 C 0.74 C 0.801 D 0.004 No 0.012 No
67 1st Street Indiana Street City of L.A./County of L.A. 0.651 B 0.742 C 0.658 B 0.752 C 0.007 No 0.01 No
68 Dittman Avenue* Whittier Boulevard County of L.A. 0.81 D 0.797 C 0.817 D 0.801 D 0.007 No 0.004 No
69 Downey Road* Whittier Boulevard County of L.A. 0.793 C 0.79 C 0.799 C 0.791 C 0.006 No 0.001 No
70 Dittman Avenue* Olympic Boulevard County of L.A. 0.755 C 0.68 B 0.763 C 0.691 B 0.008 No 0.011 No
71 Downey Road* Olympic Boulevard County of L.A. 0.877 D 0.773 C 0.883 D 0.778 C 0.006 No 0.005 No
72 I-710 Southbound Ramps* Washington Boulevard City of Commerce 0.785 C 0.739 C 0.79 C 0.742 C 0.005 No 0.003 No
73 I-710 Northbound Ramps* Washington Boulevard City of Commerce 0.631 B 0.613 B 0.636 B 0.615 B 0.005 No 0.002 No
74 I-710 Southbound Off-Ramp*
Bandini Boulevard City of Vernon 0.853 D 0.626 B 0.855 D 0.627 B 0.002 No 0.001 No
75 I-710 Northbound Ramps/ Atlantic Boulevard*
Bandini Boulevard City of Vernon 1.662 F 1.696 F 1.665 F 1.699 F 0.003 No 0.003 No
M Euclid Avenueb 8th Street City of L.A. — — — — 0.346 A 0.252 A — — — —
P Camulos Streetb Olympic Boulevard City of L.A. — — — — 0.627 B 0.667 B — — — —
Q Euclid Avenue/Evergreen Streetb
Olympic Boulevard City of L.A. — — — — 0.673 B 0.673 B — — — —
All signalized intersections will operate under ATSAC and ATSC systems unless otherwise noted.
* Intersection does not operate under ATSAC and ATCS systems. a Volume/capacity (V/C) ratios and levels of service (LOS) calculated using Critical Movement Analysis (CMA) methodology preferred by City of Los Angeles. b Signalization of Euclid Avenue & 8th Street, Euclid Avenue & Olympic Boulevard, and Camulos Street & Olympic Boulevard are project features so are not evaluated as signalized intersections under future baseline conditions.
Source: Fehr & Peers, 2011.

IV.K Traffic, Access, and Parking
City of Los Angeles Boyle Heights Mixed-Use Community Project SCH. No. 2008061123 October 2011
Page IV.K-70
WORKING DRAFT – Not for Public Review
Table IV.K-12 Signal Warrant Results Future with Project Conditions (2030)
Peak-Hour Operating Conditions Signal Warrant
A.M. P.M. 8-Hour 4-Hour Peak Hour
Int. No. Intersection Delay LOS Delay LOS 1A 1B 1C 2 3
J Glen Avenue & 8th Streeta 39.6 E 34.1 D No No No No No
K Orme Avenue & 8th Streeta 36.9 E 26.1 D No No No No No
L Camulos Place/Camulos Street & 8th Streeta 29.9 D 29.0 D No No No No No
M Euclid Avenue & 8th Streeta — F — F Yes No Yes Yes Yes
N Dacotah Street & 8th Streeta 18.5 C 33.6 D No No No No No
O Orme Avenue & Olympic Boulevarda — F — F No No No No No
P Camulos Street & Olympic Boulevarda — F — F No Yes Yes Yes Yes
Q Evergreen Avenue & Olympic Boulevarda — F — F Yes Yes Yes Yes Yes
R Dacotah Street & Olympic Boulevarda 79.6 F — F No No No No No
— = Oversaturated conditions. Delay cannot be calculated. a Intersection is controlled by stop signs on minor approach. Delay is based on worst approach.
Source;
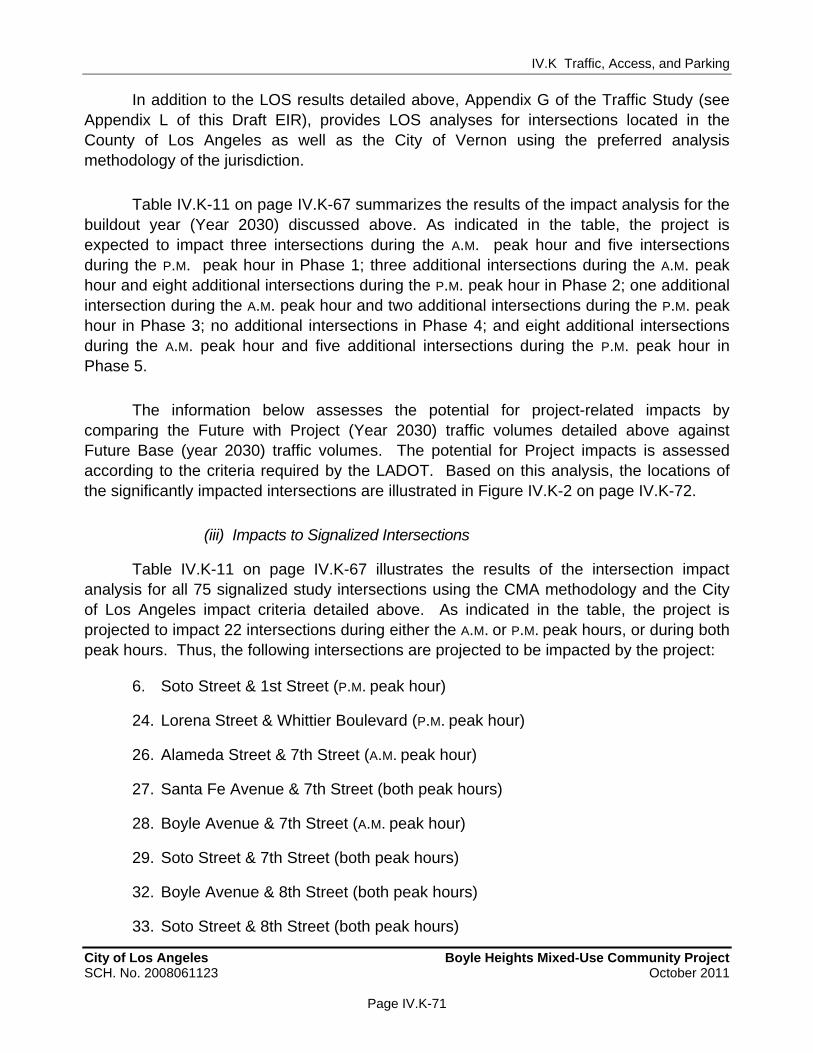
IV.K Traffic, Access, and Parking
City of Los Angeles Boyle Heights Mixed-Use Community Project SCH. No. 2008061123 October 2011
Page IV.K-71
WORKING DRAFT – Not for Public Review
In addition to the LOS results detailed above, Appendix G of the Traffic Study (see Appendix L of this Draft EIR), provides LOS analyses for intersections located in the County of Los Angeles as well as the City of Vernon using the preferred analysis methodology of the jurisdiction.
Table IV.K-11 on page IV.K-67 summarizes the results of the impact analysis for the buildout year (Year 2030) discussed above. As indicated in the table, the project is expected to impact three intersections during the A.M. peak hour and five intersections during the P.M. peak hour in Phase 1; three additional intersections during the A.M. peak hour and eight additional intersections during the P.M. peak hour in Phase 2; one additional intersection during the A.M. peak hour and two additional intersections during the P.M. peak hour in Phase 3; no additional intersections in Phase 4; and eight additional intersections during the A.M. peak hour and five additional intersections during the P.M. peak hour in Phase 5.
The information below assesses the potential for project-related impacts by comparing the Future with Project (Year 2030) traffic volumes detailed above against Future Base (year 2030) traffic volumes. The potential for Project impacts is assessed according to the criteria required by the LADOT. Based on this analysis, the locations of the significantly impacted intersections are illustrated in Figure IV.K-2 on page IV.K-72.
(iii) Impacts to Signalized Intersections
Table IV.K-11 on page IV.K-67 illustrates the results of the intersection impact analysis for all 75 signalized study intersections using the CMA methodology and the City of Los Angeles impact criteria detailed above. As indicated in the table, the project is projected to impact 22 intersections during either the A.M. or P.M. peak hours, or during both peak hours. Thus, the following intersections are projected to be impacted by the project:
6. Soto Street & 1st Street (P.M. peak hour)
24. Lorena Street & Whittier Boulevard (P.M. peak hour)
26. Alameda Street & 7th Street (A.M. peak hour)
27. Santa Fe Avenue & 7th Street (both peak hours)
28. Boyle Avenue & 7th Street (A.M. peak hour)
29. Soto Street & 7th Street (both peak hours)
32. Boyle Avenue & 8th Street (both peak hours)
33. Soto Street & 8th Street (both peak hours)
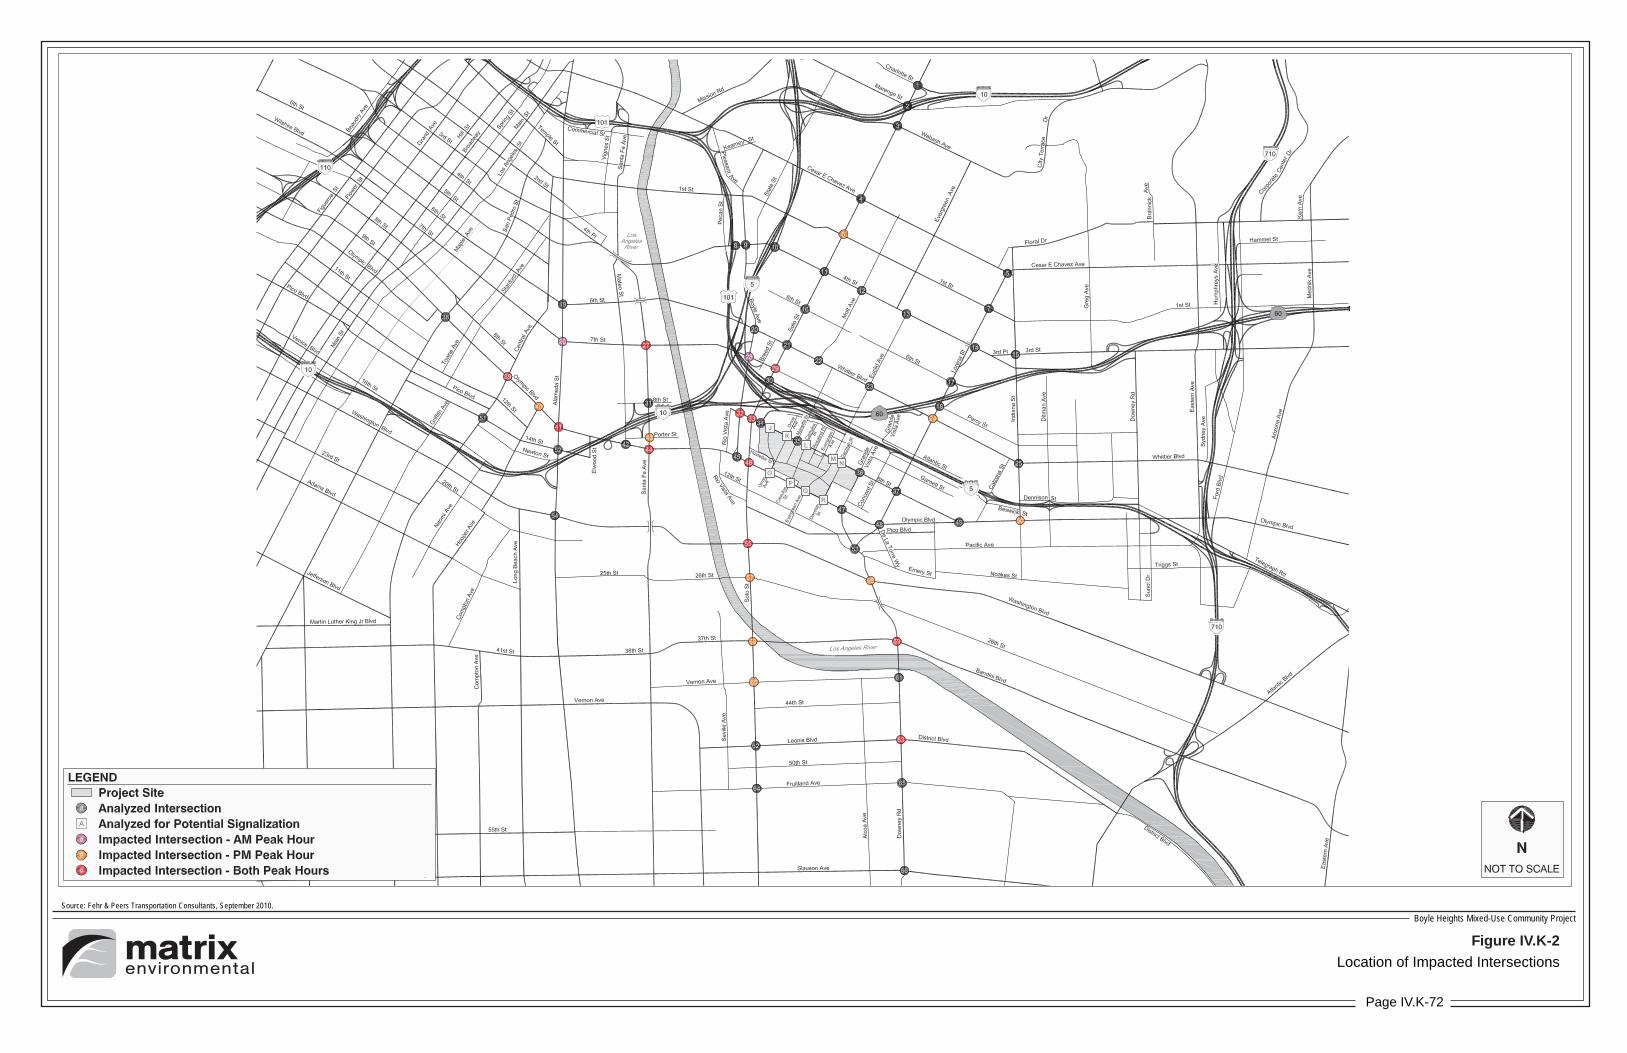
Page
Figure IV.K-2
Location of Impacted Intersections
Source: Fehr & Peers Transportation Consultants, September 2010.Boyle Heights Mixed-Use Community Project
Page IV.K-72
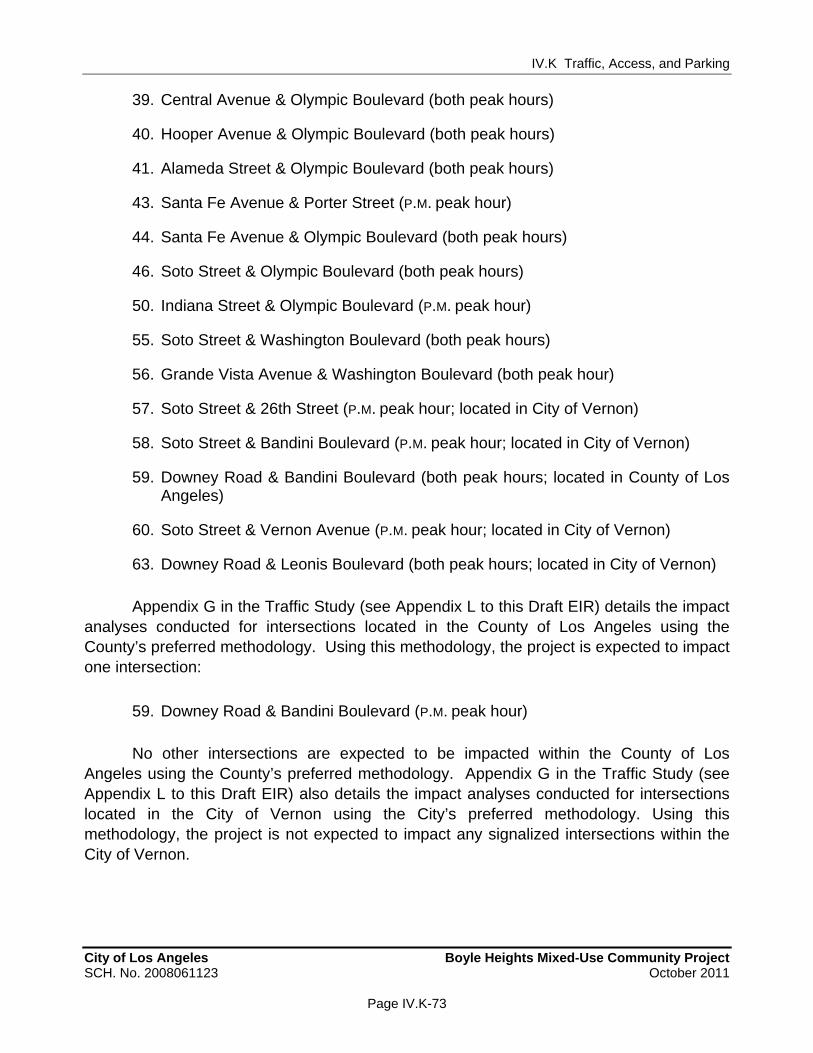
IV.K Traffic, Access, and Parking
City of Los Angeles Boyle Heights Mixed-Use Community Project SCH. No. 2008061123 October 2011
Page IV.K-73
WORKING DRAFT – Not for Public Review
39. Central Avenue & Olympic Boulevard (both peak hours)
40. Hooper Avenue & Olympic Boulevard (both peak hours)
41. Alameda Street & Olympic Boulevard (both peak hours)
43. Santa Fe Avenue & Porter Street (P.M. peak hour)
44. Santa Fe Avenue & Olympic Boulevard (both peak hours)
46. Soto Street & Olympic Boulevard (both peak hours)
50. Indiana Street & Olympic Boulevard (P.M. peak hour)
55. Soto Street & Washington Boulevard (both peak hours)
56. Grande Vista Avenue & Washington Boulevard (both peak hour)
57. Soto Street & 26th Street (P.M. peak hour; located in City of Vernon)
58. Soto Street & Bandini Boulevard (P.M. peak hour; located in City of Vernon)
59. Downey Road & Bandini Boulevard (both peak hours; located in County of Los Angeles)
60. Soto Street & Vernon Avenue (P.M. peak hour; located in City of Vernon)
63. Downey Road & Leonis Boulevard (both peak hours; located in City of Vernon)
Appendix G in the Traffic Study (see Appendix L to this Draft EIR) details the impact analyses conducted for intersections located in the County of Los Angeles using the County’s preferred methodology. Using this methodology, the project is expected to impact one intersection:
59. Downey Road & Bandini Boulevard (P.M. peak hour)
No other intersections are expected to be impacted within the County of Los Angeles using the County’s preferred methodology. Appendix G in the Traffic Study (see Appendix L to this Draft EIR) also details the impact analyses conducted for intersections located in the City of Vernon using the City’s preferred methodology. Using this methodology, the project is not expected to impact any signalized intersections within the City of Vernon.

IV.K Traffic, Access, and Parking
City of Los Angeles Boyle Heights Mixed-Use Community Project SCH. No. 2008061123 October 2011
Page IV.K-74
WORKING DRAFT – Not for Public Review
(iv) Unsignalized Intersections
As shown in Table IV.K-12 on page IV.K-70, seven of the nine unsignalized study intersections are projected to operate at LOS E or F during one or both peak hours under Future with Project (Year 2030) conditions. As previously discussed, signal warrant analyses were conducted for the nine unsignalized study intersections to determine the need for potential signalization pursuant to the threshold criteria. The results of the signal warrant analysis are summarized in Table IV.K-13 on page IV.K-75. Based on this analysis, the following three unsignalized intersections are projected to meet signal warrants under Future with Project (Year 2030) conditions:
M. Euclid Avenue & 8th Street
P. Camulos Street & Olympic Boulevard
Q. Evergreen Avenue & Olympic Boulevard
It should be noted that the satisfaction of a traffic signal warrant does not in itself require the installation of a signal. The decision of whether a traffic signal should be installed is made according to the discretion of the LADOT district office. Notwithstanding, it is concluded that impacts to the three unsignalized intersections above would be significant and mitigation is required.
(v) Project Phasing Analysis
As discussed above, because significant project impacts on intersections were found in the Future (2030) With Project Condition, the following phasing analysis was conducted to determine at what point in project implementation these impacts would be triggered. The following discussion summarizes this analysis, which can be found in its entirety in Section 7 of the Traffic Study (see Appendix L to this Draft EIR).
Trip-generation estimates for each phase of the project were developed with a factoring process whereby the final trip-generation estimates for the project were split among the phases based on the development quantity of each land use contained in that phase. Table 27 in the Traffic Study details the percentages that each phase makes up of the total buildout of the project, and the resulting net trips generated by each phase. As shown therein, Phase 1 is projected to generate approximately 462 net new trips in the A.M. (Maximum Office Scenario) and 734 trips in the P.M. peak hour (Maximum Retail Scenario). Phase 2 is projected to generate about 341 additional trips in the A.M. peak hour and 379 additional trips in the P.M. peak hour. Phase 3 is projected to generate approximately 259 additional trips in the A.M. and 332 additional trips in the P.M. peak hour. Phase 4 is projected to generate about 257 additional trips in the A.M. peak hour and 287 additional
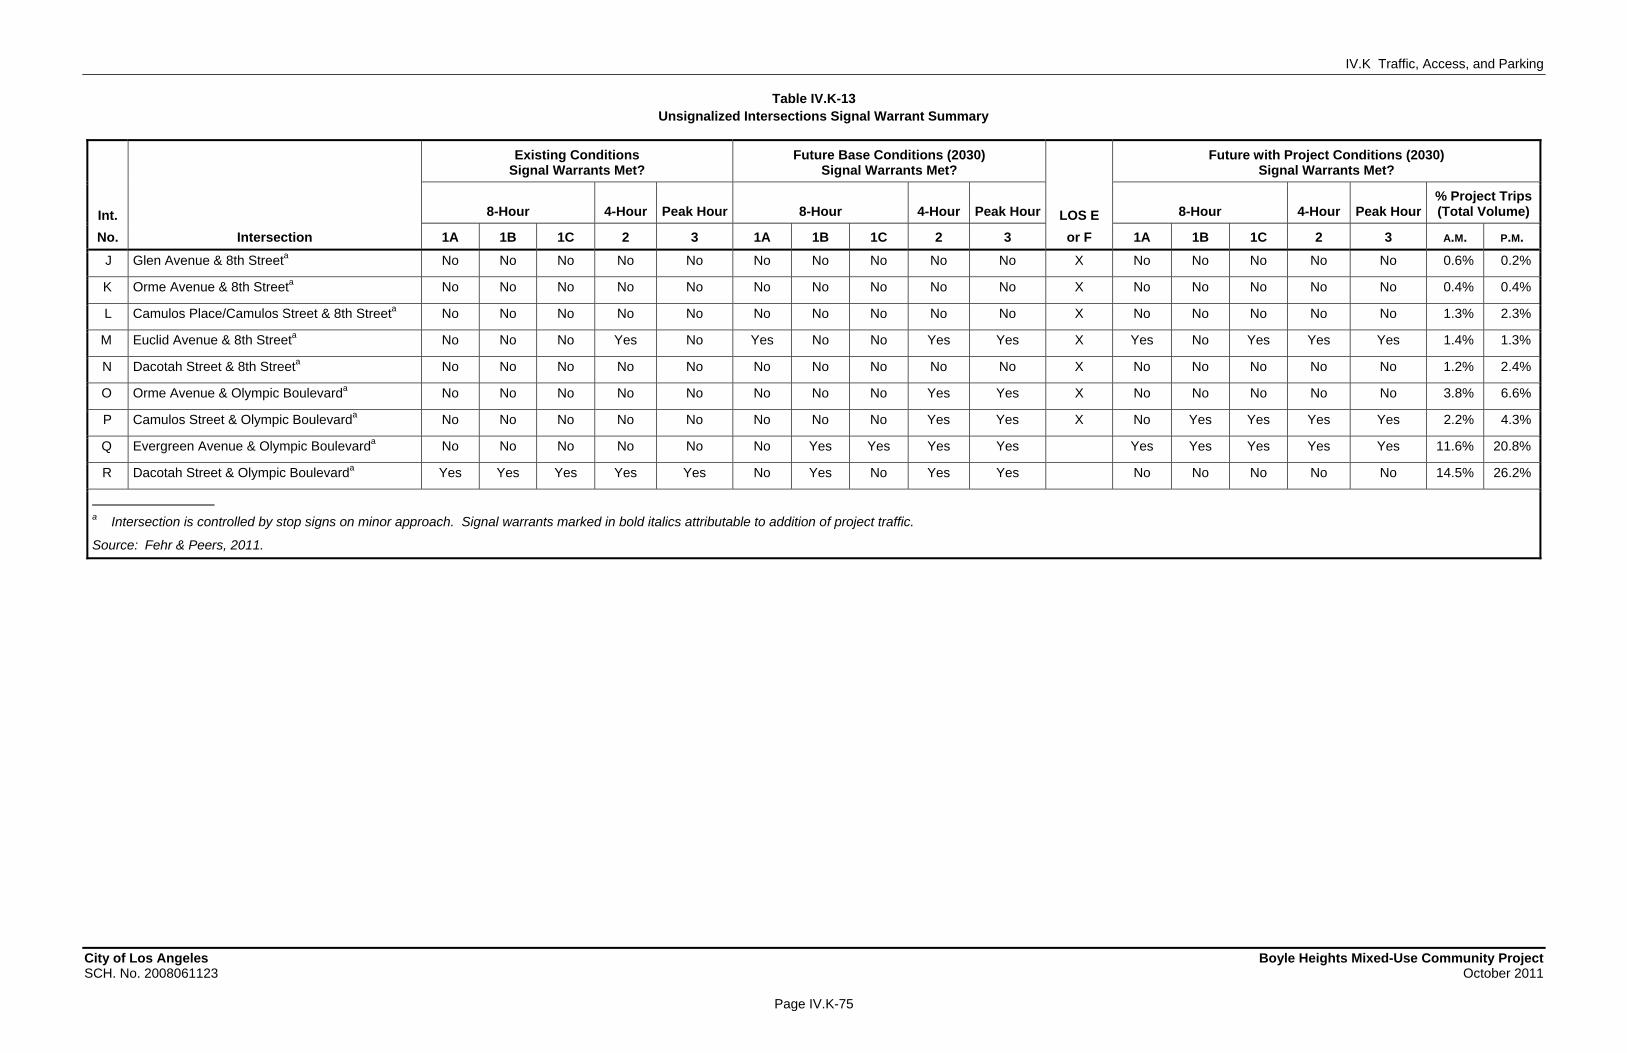
IV.K Traffic, Access, and Parking
City of Los Angeles Boyle Heights Mixed-Use Community Project SCH. No. 2008061123 October 2011
Page IV.K-75
WORKING DRAFT – Not for Public Review
Table IV.K-13 Unsignalized Intersections Signal Warrant Summary
Existing Conditions
Signal Warrants Met? Future Base Conditions (2030)
Signal Warrants Met? Future with Project Conditions (2030)
Signal Warrants Met?
Int. 8-Hour 4-Hour Peak Hour 8-Hour 4-Hour Peak Hour LOS E 8-Hour 4-Hour Peak Hour% Project Trips(Total Volume)
No. Intersection 1A 1B 1C 2 3 1A 1B 1C 2 3 or F 1A 1B 1C 2 3 A.M. P.M.
J Glen Avenue & 8th Streeta No No No No No No No No No No X No No No No No 0.6% 0.2%
K Orme Avenue & 8th Streeta No No No No No No No No No No X No No No No No 0.4% 0.4%
L Camulos Place/Camulos Street & 8th Streeta No No No No No No No No No No X No No No No No 1.3% 2.3%
M Euclid Avenue & 8th Streeta No No No Yes No Yes No No Yes Yes X Yes No Yes Yes Yes 1.4% 1.3%
N Dacotah Street & 8th Streeta No No No No No No No No No No X No No No No No 1.2% 2.4%
O Orme Avenue & Olympic Boulevarda No No No No No No No No Yes Yes X No No No No No 3.8% 6.6%
P Camulos Street & Olympic Boulevarda No No No No No No No No Yes Yes X No Yes Yes Yes Yes 2.2% 4.3%
Q Evergreen Avenue & Olympic Boulevarda No No No No No No Yes Yes Yes Yes Yes Yes Yes Yes Yes 11.6% 20.8%
R Dacotah Street & Olympic Boulevarda Yes Yes Yes Yes Yes No Yes No Yes Yes No No No No No 14.5% 26.2%
a Intersection is controlled by stop signs on minor approach. Signal warrants marked in bold italics attributable to addition of project traffic.
Source: Fehr & Peers, 2011.
IV.K Traffic, Access, and Parking
City of Los Angeles Boyle Heights Mixed-Use Community Project SCH. No. 2008061123 October 2011
Page IV.K-76
WORKING DRAFT – Not for Public Review
trips in the P.M. peak hour. Phase 5 is projected to generate approximately 188 additional trips in the A.M. and 201 additional trips in the P.M. peak hour.
To account for overall ambient growth of traffic in the study area, the trip tables for each interim year model were adjusted to reflect expected traffic conditions in the analysis year for each model. An overall annual growth rate was calculated by comparing the SCAG 2030 trip tables to the SCAG base year trip tables. The interim year models were then developed by factoring the 2030 trip table by the annual growth rate multiplied by the required number of years. For example, the 2017 trip table was developed by factoring the 2030 trip table down by 13 years of the annual growth rate. An exception to this process was made for the model zones that contain related projects. To be conservative in this analysis, it was assumed that all related projects would be active by the first phase of the project (Year 2017). Given that many of these projects, such as the Sear’s project, are unlikely to be completed in that time frame, the estimated impacts are likely overstated. Based on the trip-generation estimates, the project zones for each interim year model were adjusted to match the net inbound and outbound trips for each phase. The Future with Project (Year 2030) model roadway network was adjusted to account for the portion of the proposed roadway network that would be in place at the time of completion of each phase of the project. After inputting the trip table and highway network modifications, the development of the forecast volumes for this analysis followed the approach outlined above for the project analysis.
In accordance with direction provided by LADOT, the Future Base traffic volumes for each interim year were developed by subtracting project-only traffic volumes from the Future with Project traffic volumes. Future Base, Future with Project, and project-only traffic volumes for each interim phase are provided in tabular form in Appendix C in the Traffic Study (see Appendix L to this Draft EIR). The Future Base and Future with Project traffic volumes for each interim phase (Years 2017, 2021, 2025, and 2028) were evaluated using the same LOS methodologies discussed above for the project analysis, including the application of PCE factors to account for truck traffic and the same assumptions regarding future computer traffic signal controls.
Intersection impacts for the interim years have been evaluated according to the same significant impact criteria identified above for the project analysis. Tables 28 to 31 in the Traffic Study (see Appendix L to this Draft EIR) summarize the A.M. and P.M. peak-hour V/C ratios and corresponding LOS for Future Base and Future with Project conditions at all 75 signalized study intersections for the four interim phases. Detailed LOS worksheets are provided in Appendix D of the Traffic Study. Table IV.K-14 on page IV.K-77 summarizes the impact analysis by phase, indicating the interim year in which each intersection impact is projected to occur. Table IV.K-14 also includes the results of the impact analysis for the buildout year (Year 2030) discussed previously.

IV.K Traffic, Access, and Parking
City of Los Angeles Boyle Heights Mixed-Use Community Project SCH. No. 2008061123 October 2011
Page IV.K-77
WORKING DRAFT – Not for Public Review
Table IV.K-14 Summary of Impacted Intersections by Phase
Phase Triggered (A.M. Peak Hour) Phase Triggered (P.M. Peak Hour)
Int. No. Intersection
Phase I
PhaseII
Phase III
Phase IV
PhaseV
PhaseI
Phase II
Phase III
Phase IV
PhaseV
6 Soto Street & 1st Street X
24 Lorena Street & Whittier Boulevard
X
26 Alameda Street & 7th Street
X
27 Santa Fe Avenue& 7th Street
X X
28 Boyle Avenue & 7th Street
X
29 Soto Street & 7th Street
X X
32 Boyle Avenue & 8th Street
X X
33 Soto Street & 8th Street
X X
39 Central Avenue & Olympic Boulevard
X X
40 Hooper Avenue & Olympic Boulevard
X X
41 Alameda Street & Olympic Boulevard
X X
43 Santa Fe Avenue & Porter Street
X
44 Santa Fe Avenue & Olympic Boulevard
X X
46 Soto Street & Olympic Boulevard
X X
50 Indiana Street & Olympic Boulevard
X
55 Soto Street & Washington Boulevard
X X
Source: Fehr & Peers, 2011.
As indicated in Table IV.K-14, the project is expected to impact three intersections during the A.M. peak hour, and five intersections during the P.M. peak hour in Phase 1, three additional intersections during the A.M. peak hour and eight additional intersections during the P.M. peak hour in Phase 2, one additional intersection during the A.M. peak hour and two additional intersections during the P.M. peak hour in Phase 3, no additional intersections in Phase 4, and eight additional intersections during the A.M. peak hour and
IV.K Traffic, Access, and Parking
City of Los Angeles Boyle Heights Mixed-Use Community Project SCH. No. 2008061123 October 2011
Page IV.K-78
WORKING DRAFT – Not for Public Review
five additional intersections during the P.M. peak hour in Phase 5. Tables 33 and 34 in the Traffic Study (see Appendix L to this Draft EIR) indicate the percentage of project trips within each phase that would need to be generated in order to trigger the impacts identified in the buildout of phase. For example, up to one-quarter of the A.M. peak-hour project trips generated in Phase 1 would trigger the impact at the intersection of Santa Fe Avenue & Olympic Boulevard (Intersection 44). Between one-quarter and one-half of the project trips generated in Phase 1 would trigger the impact the intersection of Alameda Street & Olympic Boulevard (Intersection 41), as well as the intersection of Soto Street & Olympic Boulevard (Intersection 46). Tables 33 and 34 can therefore be used to determine at what point within a phase a particular mitigation measure must be implemented.
The locations of each phase, and the proposed project roadway network changes with each phase, are expected to have some effect on the intersection impacts that are triggered by the phase. Therefore, the impacts associated with each phase of the project as analyzed above are expected to be tied to each phase. However, the land uses built within each phase are less critical in determining the overall number of impacted intersections in the particular phase than the trips generated within the phase. For example, if less retail and office space were constructed in Phase I than currently planned for that phase, more dwelling units could be built. As long as the overall trip generation for that phase would not be projected to exceed 462 net new A.M. peak-hour trips (approximately 31 percent of the total net new trips at buildout), and 734 net new P.M. peak-hour trips (approximately 38 percent of the total net new trips at buildout) as presented in Table 27 of the Traffic Study (see Appendix L to this Draft EIR), no new intersection impacts would be triggered. Therefore, in apportioning mitigation, although the build out of the project would need to maintain the same approximate phasing order and location as analyzed in the Traffic Study, within each phase, there is flexibility in the land uses that are built out, as long as the net new trips for the phase do not exceed the number of trips presented in Table 27 in the Traffic Study.
In terms of timing of phases, as long as the buildout for each phase is completed during the analyzed year or earlier, the phasing LOS analysis represents a conservative analysis of project-related impacts. In any event, the analysis of the completed project provides a worst case scenario of the aggregate of all project related traffic impacts regardless of phasing.
(b) Regional Transportation System
As previously noted, the CMP arterial monitoring location closest to the project site is the intersection of Alameda Street & Washington Boulevard. Based on the project-only model assignment, only 11 trips are projected to be added to the intersection during the A.M. peak hour, and 14 trips in the P.M. peak hour. Because it is estimated that fewer than 50 weekday peak-hour trips would travel through the CMP monitoring location of Alameda
IV.K Traffic, Access, and Parking
City of Los Angeles Boyle Heights Mixed-Use Community Project SCH. No. 2008061123 October 2011
Page IV.K-79
WORKING DRAFT – Not for Public Review
Street & Washington Boulevard, no further CMP intersection analysis is required. Thus, the following discussion focuses on CMP freeway segments.
(i) Future (2030) Base Conditions
Future Base (Year 2030) and Future with Project (Year 2030) A.M. and P.M. peak-hour freeway traffic volumes are presented in Tables IV.K-15 and IV.K-16 on pages IV.K-80 and IV.K-82. As indicated therein, there are no additional segments not already operating at LOS E or F under Existing conditions projected to operate at LOS E or F under Future Base (Year 2030) conditions. However, the following freeway segments are projected to operate at LOS E or F under an additional peak hour and in an additional direction under Future Base (Year 2030) conditions:
I-5 from SR 110 junction to North Broadway (southbound during A.M. peak hour)
SR 60 from Downey Road to I-710 junction (westbound during A.M. peak hour)
I-710 from I-5 junction to Atlantic Boulevard (southbound during A.M. peak hour)
I-710 from I-5 Firestone Boulevard to I-105 junction (southbound during A.M. peak hour)
(ii) Future (2030) With Project Conditions
As indicated in Tables IV.K-15 and IV.K-16 on pages IV.K-80 and IV.K-82, there are no additional segments not already projected to operate at LOS E or F under Future Base (Year 2030) conditions projected to operate at LOS E or F under Future with Project (Year 2030) conditions, nor are there segments projected to operate at LOS E or F under an additional peak hour or in an additional direction under Future with Project (Year 2030) conditions. Therefore, according to the significance thresholds identified, project impacts on the analyzed freeway segments would be less than significant.
(c) Neighborhood Intrusion
As mentioned above, the project is projected to generate approximately 19,640 daily vehicle trips including 1,933 P.M. peak-hour vehicle trips. Using the travel demand methodology described above, the number of trips that may be added to any particular arterial corridor was projected. Since the model provides peak-hour but not daily assignments, daily project trips were estimated by multiplying the afternoon peak-hour project trips by a factor of 10. Based on the model output, 1,200 or more daily trips are projected to be added by the project on the following corridors, which are also illustrated in Figure IV.K-3 on page IV.K-84.

IV.K Traffic, Access, and Parking
City of Los Angeles Boyle Heights Mixed-Use Community Project SCH. No. 2008061123 October 2011
Page IV.K-80
WORKING DRAFT – Not for Public Review
Table IV.K-15 CMP Freeway Analysis—A.M. Peak Hour
Existing (2008) Future Base (2030) Future with Project (2030)
Freeway Segment Direction No. of Lanes Capacity Demand D/C LOS Demand D/C LOS
Project Only (2030) Demand D/C LOS
Change in D/C Impact?
a I-5 at NB 5 10,000 9,005 0.901 D 9,015 0.902 D 35 9,050 0.905 D 0.003 —
Stadium Way SB 5 10,000 9,219 0.922 D 9,410 0.941 E 31 9,441 0.944 E 0.003 — a I-5 from Stadium Way NB 5 10,000 9,440 0.944 E 9,450 0.945 E 35 9,485 0.949 E 0.004 —
to SR-110 junction SB 5 10,000 10,741 1.074 F(0) 10,960 1.096 F(0) 31 10,991 1.099 F(0) 0.003 — a I-5 from SR-110 junction NB 4 8,000 5,936 0.742 C 5,946 0.743 C 35 5,981 0.748 C 0.005 —
to North Broadway SB 3 6,000 5,476 0.913 D 5,486 0.914 D 26 5,512 0.919 D 0.005 — b I-5 from North Broadway NB 5 10,000 9,047 0.905 D 9,057 0.906 D 46 9,103 0.910 D 0.004 —
Main Street SB 5 10,000 8,022 0.802 D 8,032 0.803 D 36 8,068 0.807 D 0.004 — a I-5 from Main Street NB 5 10,000 7,951 0.795 D 7,961 0.796 D 52 8,013 0.801 D 0.005 —
to I-10 junction SB 4 8,000 5,132 0.642 C 5,540 0.693 C 34 5,574 0.697 C 0.004 — b I-5 from I-10 Junction NB 5 10,000 8,078 0.808 D 8,280 0.828 D 53 8,333 0.833 D 0.005 —
to Cesar E. Chavez Avenue SB 5 10,000 8,058 0.806 D 9,360 0.936 E 36 9,396 0.940 E 0.004 — b I-5 from Cesar E. Chavez Avenue NB 5 10,000 8,239 0.824 D 8,450 0.845 D 54 8,504 0.850 D 0.005 — a to Fourth Street [SB 5 10,000 7,929 c F 9,240 c F 36 9,276 c F 0.004 — b I-5 from Fourth Street NB 5 10,000 7,865 0.787 D 8,100 0.810 D 47 8,147 0.815 D 0.005 — a to SR 60 junction SB 5 10,000 7,929 c F 9,170 c F 28 9,198 c F 0.003 — a I-5 from SR-60 junction NB 5 10,000 8,140 0.814 D 8,550 0.855 D 53 8,603 0.860 D 0.005 —
to Lorena St SB 5 10,000 8,016 0.802 D 8,870 0.887 D 4 8,874 0.887 D 0.000 — a I-5 from Lorena St NB 5 10,000 8,070 c F 8,410 c F 52 8,462 c F 0.005 —
to Indiana St SB 5 10,000 9,462 0.946 E 10,100 1.010 F(0) 167 10,267 1.027 F(0) 0.017 — a I-5 from Indiana St NB 5 10,000 7,936 c F 8,420 c F 54 8,474 c F 0.005 —
to Downey Rd SB 5 10,000 7,804 0.780 D 8,770 0.877 D 193 8,963 0.896 D 0.019 — b I-5 from Downey Rd NB 5 10,000 7,762 c F 8,060 c F 53 8,113 c F 0.005 —
to I-710 junction SB 5 10,000 7,355 0.736 C 8,340 0.834 D 193 8,533 0.853 D 0.019 — a I-5 from I-710 junction NB 4 8,000 6,475 0.809 D 6,600 0.825 D 26 6,626 0.828 D 0.003 —
to Atlantic Bl SB 4 8,000 7,078 0.885 D 7,640 0.955 E 107 7,747 0.968 E 0.013 — a I-10 from I-110 Junction EB 4 8,000 7,408 0.926 D 7,530 0.941 E 56 7,586 0.948 E 0.007 —
to San Pedro Street WB 4 8,000 8,007 1.001 F(0) 8,800 1.100 F(0) 94 8,894 1.112 F(0) 0.012 — a I-10 from San Pedro Street EB 5 10,000 6,772 0.677 C 6,900 0.690 C 57 6,957 0.696 C 0.006 —
to Central Ave WB 5 10,000 7,082 0.708 C 7,880 0.788 D 85 7,965 0.797 D 0.009 — a I-10 from Central Ave EB 5 10,000 8,701 0.870 D 8,770 0.877 D 58 8,828 0.883 D 0.006 — b to Alameda Street WB 5 10,000 11,922 1.192 F(0) 12,930 1.293 F(1) 78 13,008 1.301 F(1) 0.008 — a I-10 from Alameda Street EB 5 10,000 5,576 0.558 C 5,650 0.565 C 12 5,662 0.566 C 0.001 —
to Santa Fe Ave WB 5 10,000 10,241 1.024 F(0) 11,130 1.113 F(0) 66 11,196 1.120 F(0) 0.007 —
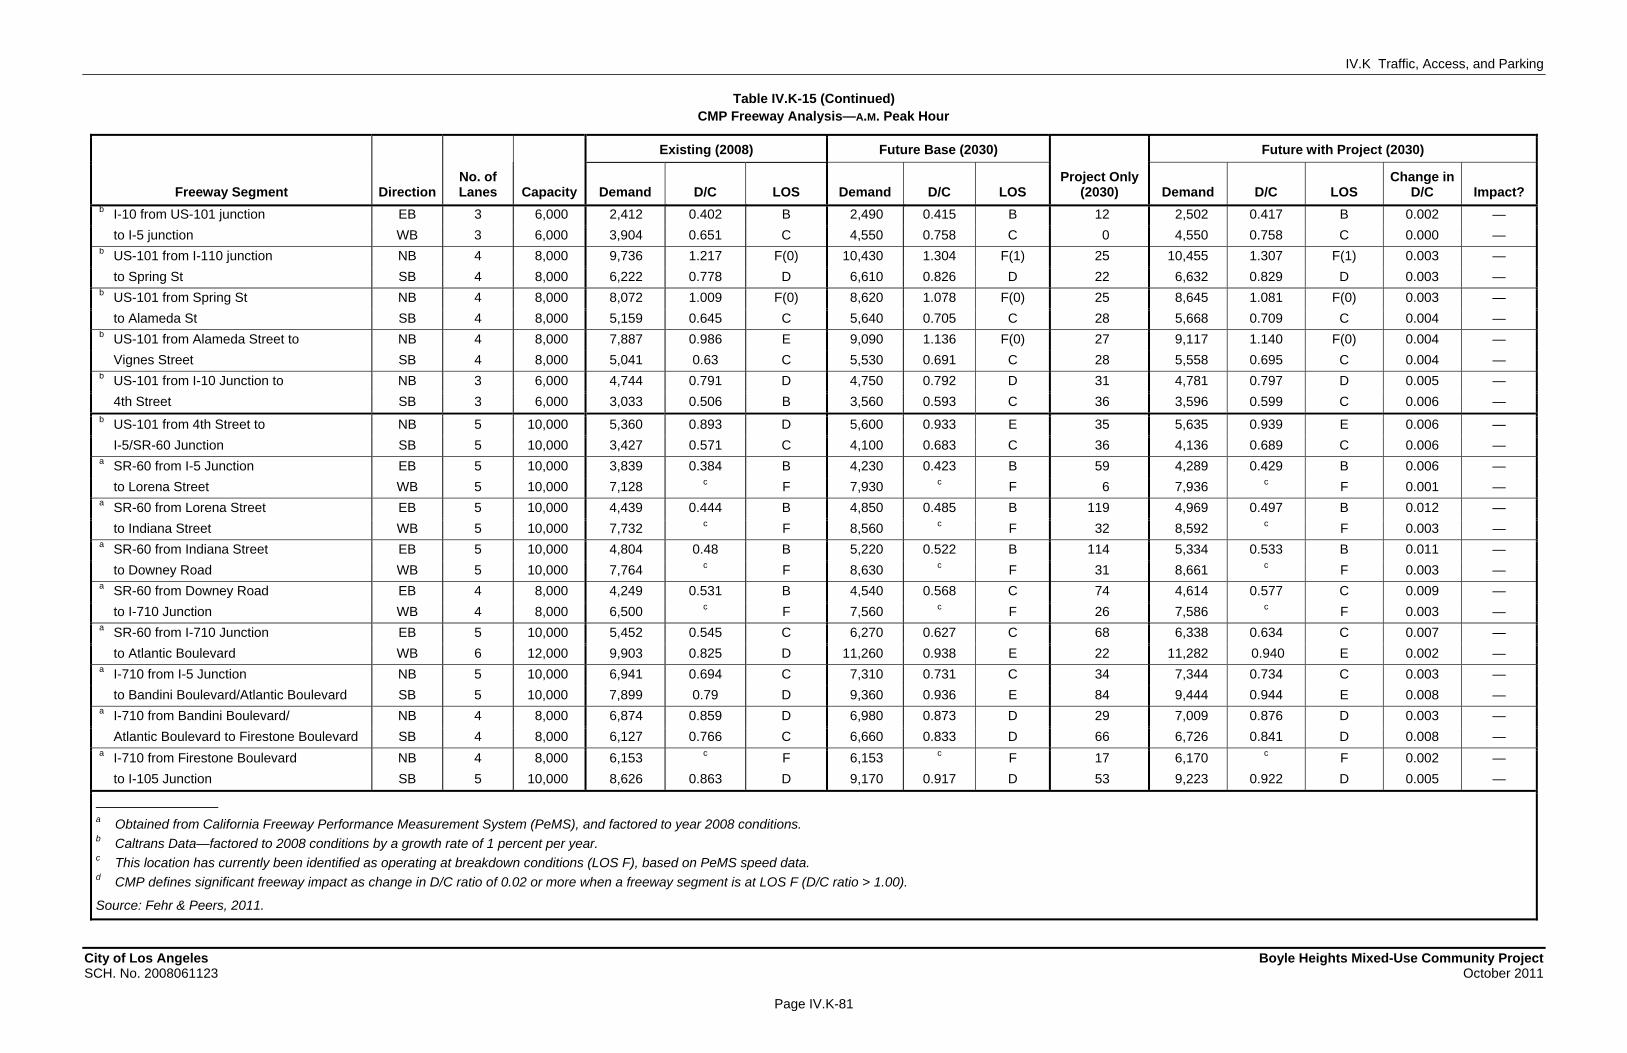
IV.K Traffic, Access, and Parking
Table IV.K-15 (Continued) CMP Freeway Analysis—A.M. Peak Hour
City of Los Angeles Boyle Heights Mixed-Use Community Project SCH. No. 2008061123 October 2011
Page IV.K-81
WORKING DRAFT – Not for Public Review
Existing (2008) Future Base (2030) Future with Project (2030)
Freeway Segment Direction No. of Lanes Capacity Demand D/C LOS Demand D/C LOS
Project Only (2030) Demand D/C LOS
Change in D/C Impact?
b I-10 from US-101 junction EB 3 6,000 2,412 0.402 B 2,490 0.415 B 12 2,502 0.417 B 0.002 —
to I-5 junction WB 3 6,000 3,904 0.651 C 4,550 0.758 C 0 4,550 0.758 C 0.000 — b US-101 from I-110 junction NB 4 8,000 9,736 1.217 F(0) 10,430 1.304 F(1) 25 10,455 1.307 F(1) 0.003 —
to Spring St SB 4 8,000 6,222 0.778 D 6,610 0.826 D 22 6,632 0.829 D 0.003 — b US-101 from Spring St NB 4 8,000 8,072 1.009 F(0) 8,620 1.078 F(0) 25 8,645 1.081 F(0) 0.003 —
to Alameda St SB 4 8,000 5,159 0.645 C 5,640 0.705 C 28 5,668 0.709 C 0.004 — b US-101 from Alameda Street to NB 4 8,000 7,887 0.986 E 9,090 1.136 F(0) 27 9,117 1.140 F(0) 0.004 —
Vignes Street SB 4 8,000 5,041 0.63 C 5,530 0.691 C 28 5,558 0.695 C 0.004 — b US-101 from I-10 Junction to NB 3 6,000 4,744 0.791 D 4,750 0.792 D 31 4,781 0.797 D 0.005 —
4th Street SB 3 6,000 3,033 0.506 B 3,560 0.593 C 36 3,596 0.599 C 0.006 — b US-101 from 4th Street to NB 5 10,000 5,360 0.893 D 5,600 0.933 E 35 5,635 0.939 E 0.006 —
I-5/SR-60 Junction SB 5 10,000 3,427 0.571 C 4,100 0.683 C 36 4,136 0.689 C 0.006 — a SR-60 from I-5 Junction EB 5 10,000 3,839 0.384 B 4,230 0.423 B 59 4,289 0.429 B 0.006 —
to Lorena Street WB 5 10,000 7,128 c F 7,930 c F 6 7,936 c F 0.001 — a SR-60 from Lorena Street EB 5 10,000 4,439 0.444 B 4,850 0.485 B 119 4,969 0.497 B 0.012 —
to Indiana Street WB 5 10,000 7,732 c F 8,560 c F 32 8,592 c F 0.003 — a SR-60 from Indiana Street EB 5 10,000 4,804 0.48 B 5,220 0.522 B 114 5,334 0.533 B 0.011 —
to Downey Road WB 5 10,000 7,764 c F 8,630 c F 31 8,661 c F 0.003 — a SR-60 from Downey Road EB 4 8,000 4,249 0.531 B 4,540 0.568 C 74 4,614 0.577 C 0.009 —
to I-710 Junction WB 4 8,000 6,500 c F 7,560 c F 26 7,586 c F 0.003 — a SR-60 from I-710 Junction EB 5 10,000 5,452 0.545 C 6,270 0.627 C 68 6,338 0.634 C 0.007 —
to Atlantic Boulevard WB 6 12,000 9,903 0.825 D 11,260 0.938 E 22 11,282 0.940 E 0.002 — a I-710 from I-5 Junction NB 5 10,000 6,941 0.694 C 7,310 0.731 C 34 7,344 0.734 C 0.003 —
to Bandini Boulevard/Atlantic Boulevard SB 5 10,000 7,899 0.79 D 9,360 0.936 E 84 9,444 0.944 E 0.008 — a I-710 from Bandini Boulevard/ NB 4 8,000 6,874 0.859 D 6,980 0.873 D 29 7,009 0.876 D 0.003 —
Atlantic Boulevard to Firestone Boulevard SB 4 8,000 6,127 0.766 C 6,660 0.833 D 66 6,726 0.841 D 0.008 — a I-710 from Firestone Boulevard NB 4 8,000 6,153 c F 6,153 c F 17 6,170 c F 0.002 —
to I-105 Junction SB 5 10,000 8,626 0.863 D 9,170 0.917 D 53 9,223 0.922 D 0.005 —
a Obtained from California Freeway Performance Measurement System (PeMS), and factored to year 2008 conditions. b Caltrans Data—factored to 2008 conditions by a growth rate of 1 percent per year. c This location has currently been identified as operating at breakdown conditions (LOS F), based on PeMS speed data. d CMP defines significant freeway impact as change in D/C ratio of 0.02 or more when a freeway segment is at LOS F (D/C ratio > 1.00).
Source: Fehr & Peers, 2011.
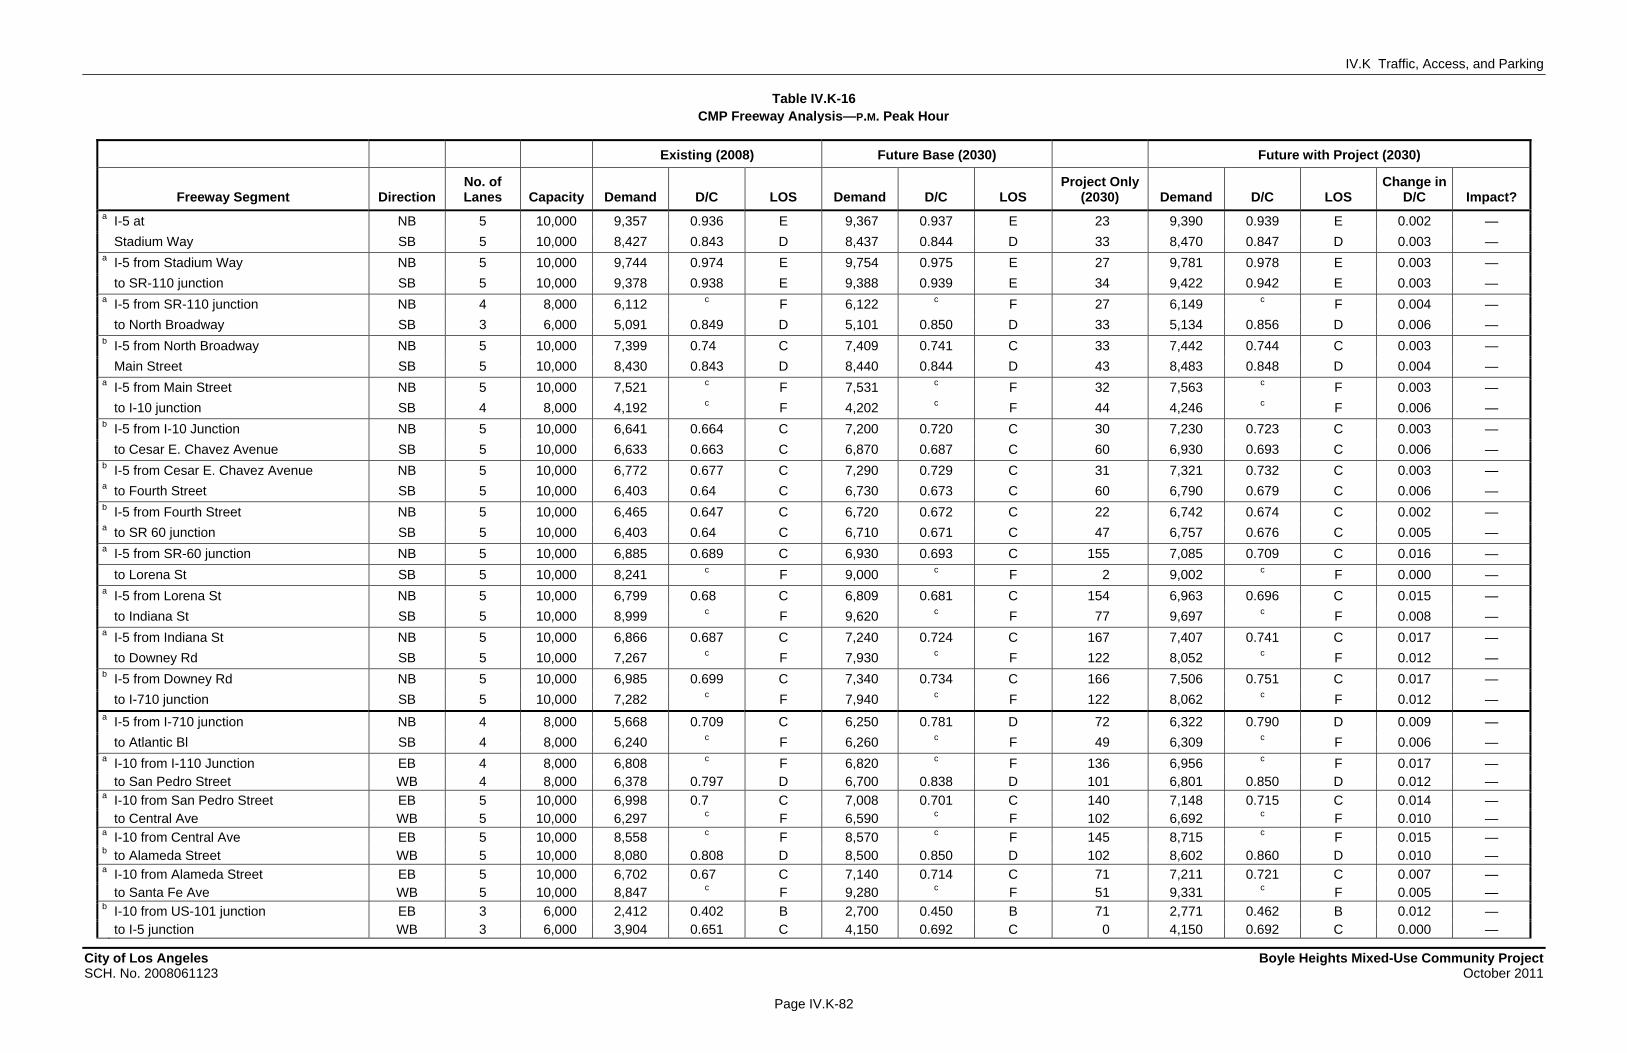
IV.K Traffic, Access, and Parking
City of Los Angeles Boyle Heights Mixed-Use Community Project SCH. No. 2008061123 October 2011
Page IV.K-82
WORKING DRAFT – Not for Public Review
Table IV.K-16 CMP Freeway Analysis—P.M. Peak Hour
Existing (2008) Future Base (2030) Future with Project (2030)
Freeway Segment Direction No. of Lanes Capacity Demand D/C LOS Demand D/C LOS
Project Only (2030) Demand D/C LOS
Change in D/C Impact?
a I-5 at NB 5 10,000 9,357 0.936 E 9,367 0.937 E 23 9,390 0.939 E 0.002 —
Stadium Way SB 5 10,000 8,427 0.843 D 8,437 0.844 D 33 8,470 0.847 D 0.003 — a I-5 from Stadium Way NB 5 10,000 9,744 0.974 E 9,754 0.975 E 27 9,781 0.978 E 0.003 —
to SR-110 junction SB 5 10,000 9,378 0.938 E 9,388 0.939 E 34 9,422 0.942 E 0.003 — a I-5 from SR-110 junction NB 4 8,000 6,112 c F 6,122 c F 27 6,149 c F 0.004 —
to North Broadway SB 3 6,000 5,091 0.849 D 5,101 0.850 D 33 5,134 0.856 D 0.006 — b I-5 from North Broadway NB 5 10,000 7,399 0.74 C 7,409 0.741 C 33 7,442 0.744 C 0.003 —
Main Street SB 5 10,000 8,430 0.843 D 8,440 0.844 D 43 8,483 0.848 D 0.004 — a I-5 from Main Street NB 5 10,000 7,521 c F 7,531 c F 32 7,563 c F 0.003 —
to I-10 junction SB 4 8,000 4,192 c F 4,202 c F 44 4,246 c F 0.006 — b I-5 from I-10 Junction NB 5 10,000 6,641 0.664 C 7,200 0.720 C 30 7,230 0.723 C 0.003 —
to Cesar E. Chavez Avenue SB 5 10,000 6,633 0.663 C 6,870 0.687 C 60 6,930 0.693 C 0.006 — b I-5 from Cesar E. Chavez Avenue NB 5 10,000 6,772 0.677 C 7,290 0.729 C 31 7,321 0.732 C 0.003 — a to Fourth Street SB 5 10,000 6,403 0.64 C 6,730 0.673 C 60 6,790 0.679 C 0.006 — b I-5 from Fourth Street NB 5 10,000 6,465 0.647 C 6,720 0.672 C 22 6,742 0.674 C 0.002 — a to SR 60 junction SB 5 10,000 6,403 0.64 C 6,710 0.671 C 47 6,757 0.676 C 0.005 — a I-5 from SR-60 junction NB 5 10,000 6,885 0.689 C 6,930 0.693 C 155 7,085 0.709 C 0.016 —
to Lorena St SB 5 10,000 8,241 c F 9,000 c F 2 9,002 c F 0.000 — a I-5 from Lorena St NB 5 10,000 6,799 0.68 C 6,809 0.681 C 154 6,963 0.696 C 0.015 —
to Indiana St SB 5 10,000 8,999 c F 9,620 c F 77 9,697 c F 0.008 — a I-5 from Indiana St NB 5 10,000 6,866 0.687 C 7,240 0.724 C 167 7,407 0.741 C 0.017 —
to Downey Rd SB 5 10,000 7,267 c F 7,930 c F 122 8,052 c F 0.012 — b I-5 from Downey Rd NB 5 10,000 6,985 0.699 C 7,340 0.734 C 166 7,506 0.751 C 0.017 —
to I-710 junction SB 5 10,000 7,282 c F 7,940 c F 122 8,062 c F 0.012 — a I-5 from I-710 junction NB 4 8,000 5,668 0.709 C 6,250 0.781 D 72 6,322 0.790 D 0.009 —
to Atlantic Bl SB 4 8,000 6,240 c F 6,260 c F 49 6,309 c F 0.006 — a I-10 from I-110 Junction EB 4 8,000 6,808 c F 6,820 c F 136 6,956 c F 0.017 — to San Pedro Street WB 4 8,000 6,378 0.797 D 6,700 0.838 D 101 6,801 0.850 D 0.012 — a I-10 from San Pedro Street EB 5 10,000 6,998 0.7 C 7,008 0.701 C 140 7,148 0.715 C 0.014 — to Central Ave WB 5 10,000 6,297 c F 6,590 c F 102 6,692 c F 0.010 — a I-10 from Central Ave EB 5 10,000 8,558 c F 8,570 c F 145 8,715 c F 0.015 — b to Alameda Street WB 5 10,000 8,080 0.808 D 8,500 0.850 D 102 8,602 0.860 D 0.010 — a I-10 from Alameda Street EB 5 10,000 6,702 0.67 C 7,140 0.714 C 71 7,211 0.721 C 0.007 — to Santa Fe Ave WB 5 10,000 8,847 c F 9,280 c F 51 9,331 c F 0.005 — b I-10 from US-101 junction EB 3 6,000 2,412 0.402 B 2,700 0.450 B 71 2,771 0.462 B 0.012 — to I-5 junction WB 3 6,000 3,904 0.651 C 4,150 0.692 C 0 4,150 0.692 C 0.000 —
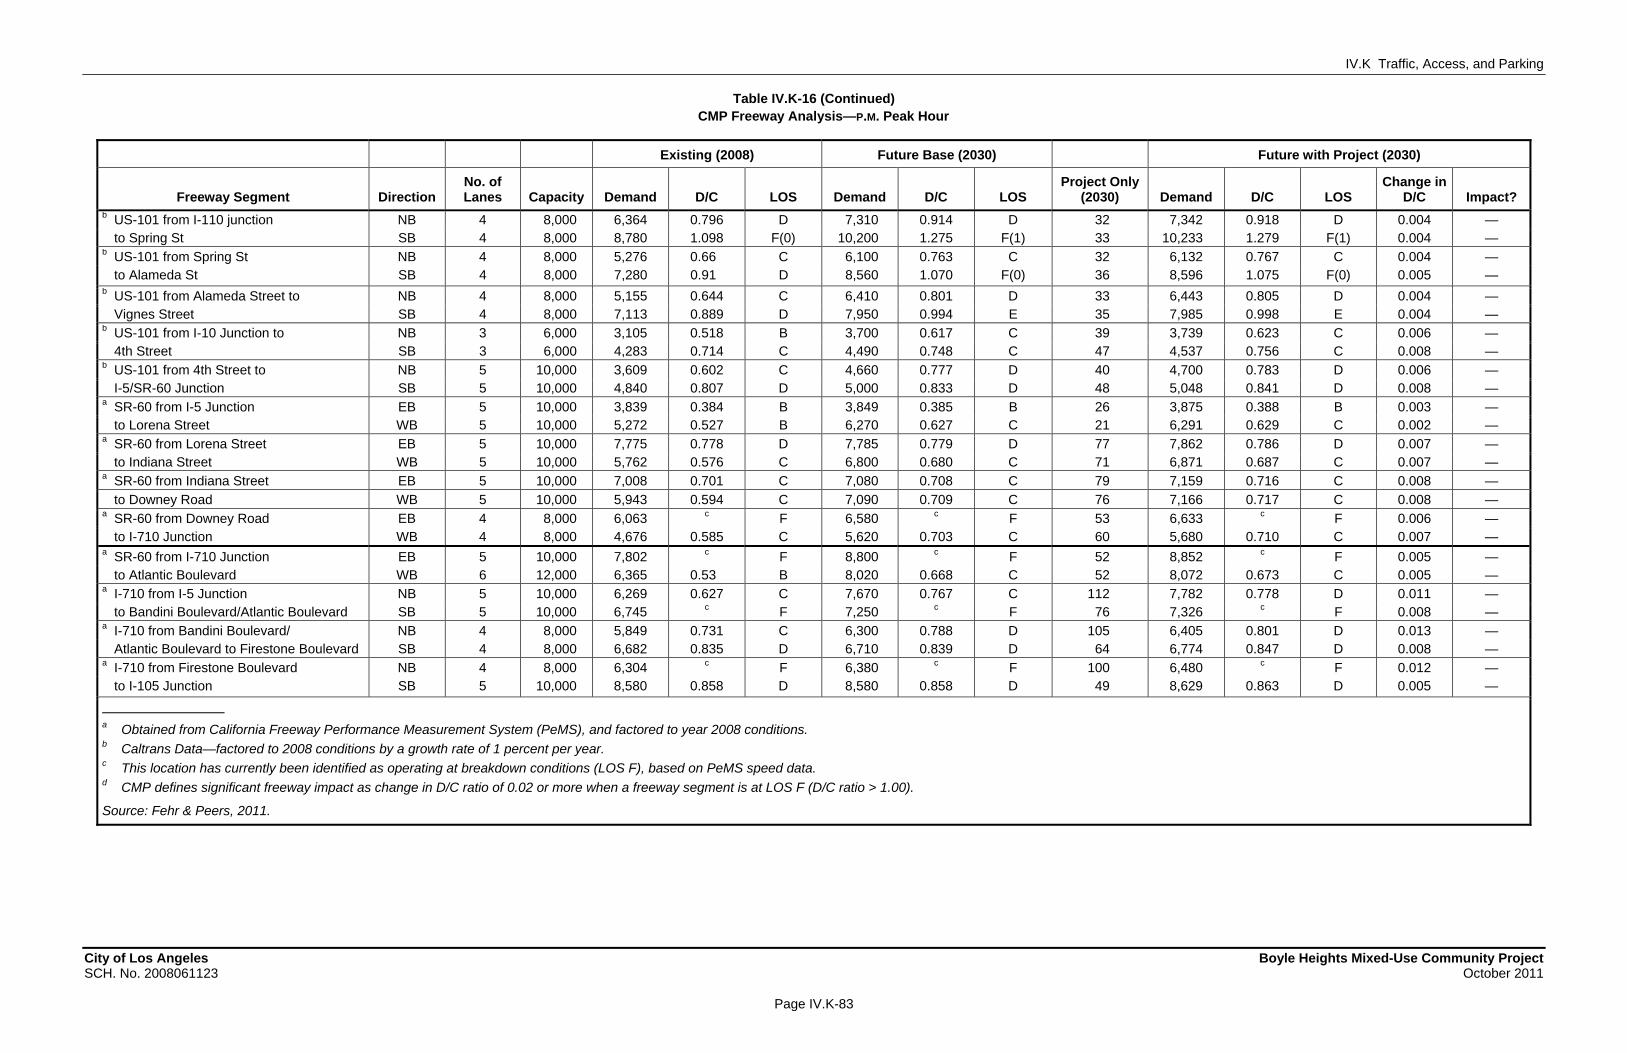
IV.K Traffic, Access, and Parking
Table IV.K-16 (Continued) CMP Freeway Analysis—P.M. Peak Hour
City of Los Angeles Boyle Heights Mixed-Use Community Project SCH. No. 2008061123 October 2011
Page IV.K-83
WORKING DRAFT – Not for Public Review
Existing (2008) Future Base (2030) Future with Project (2030)
Freeway Segment Direction No. of Lanes Capacity Demand D/C LOS Demand D/C LOS
Project Only (2030) Demand D/C LOS
Change in D/C Impact?
b US-101 from I-110 junction NB 4 8,000 6,364 0.796 D 7,310 0.914 D 32 7,342 0.918 D 0.004 — to Spring St SB 4 8,000 8,780 1.098 F(0) 10,200 1.275 F(1) 33 10,233 1.279 F(1) 0.004 — b US-101 from Spring St NB 4 8,000 5,276 0.66 C 6,100 0.763 C 32 6,132 0.767 C 0.004 — to Alameda St SB 4 8,000 7,280 0.91 D 8,560 1.070 F(0) 36 8,596 1.075 F(0) 0.005 — b US-101 from Alameda Street to NB 4 8,000 5,155 0.644 C 6,410 0.801 D 33 6,443 0.805 D 0.004 — Vignes Street SB 4 8,000 7,113 0.889 D 7,950 0.994 E 35 7,985 0.998 E 0.004 — b US-101 from I-10 Junction to NB 3 6,000 3,105 0.518 B 3,700 0.617 C 39 3,739 0.623 C 0.006 — 4th Street SB 3 6,000 4,283 0.714 C 4,490 0.748 C 47 4,537 0.756 C 0.008 — b US-101 from 4th Street to NB 5 10,000 3,609 0.602 C 4,660 0.777 D 40 4,700 0.783 D 0.006 — I-5/SR-60 Junction SB 5 10,000 4,840 0.807 D 5,000 0.833 D 48 5,048 0.841 D 0.008 — a SR-60 from I-5 Junction EB 5 10,000 3,839 0.384 B 3,849 0.385 B 26 3,875 0.388 B 0.003 — to Lorena Street WB 5 10,000 5,272 0.527 B 6,270 0.627 C 21 6,291 0.629 C 0.002 — a SR-60 from Lorena Street EB 5 10,000 7,775 0.778 D 7,785 0.779 D 77 7,862 0.786 D 0.007 — to Indiana Street WB 5 10,000 5,762 0.576 C 6,800 0.680 C 71 6,871 0.687 C 0.007 — a SR-60 from Indiana Street EB 5 10,000 7,008 0.701 C 7,080 0.708 C 79 7,159 0.716 C 0.008 —
to Downey Road WB 5 10,000 5,943 0.594 C 7,090 0.709 C 76 7,166 0.717 C 0.008 — a SR-60 from Downey Road EB 4 8,000 6,063 c F 6,580 c F 53 6,633 c F 0.006 — to I-710 Junction WB 4 8,000 4,676 0.585 C 5,620 0.703 C 60 5,680 0.710 C 0.007 — a SR-60 from I-710 Junction EB 5 10,000 7,802 c F 8,800 c F 52 8,852 c F 0.005 — to Atlantic Boulevard WB 6 12,000 6,365 0.53 B 8,020 0.668 C 52 8,072 0.673 C 0.005 — a I-710 from I-5 Junction NB 5 10,000 6,269 0.627 C 7,670 0.767 C 112 7,782 0.778 D 0.011 — to Bandini Boulevard/Atlantic Boulevard SB 5 10,000 6,745 c F 7,250 c F 76 7,326 c F 0.008 — a I-710 from Bandini Boulevard/ NB 4 8,000 5,849 0.731 C 6,300 0.788 D 105 6,405 0.801 D 0.013 — Atlantic Boulevard to Firestone Boulevard SB 4 8,000 6,682 0.835 D 6,710 0.839 D 64 6,774 0.847 D 0.008 — a I-710 from Firestone Boulevard NB 4 8,000 6,304 c F 6,380 c F 100 6,480 c F 0.012 — to I-105 Junction SB 5 10,000 8,580 0.858 D 8,580 0.858 D 49 8,629 0.863 D 0.005 —
a Obtained from California Freeway Performance Measurement System (PeMS), and factored to year 2008 conditions. b Caltrans Data—factored to 2008 conditions by a growth rate of 1 percent per year. c This location has currently been identified as operating at breakdown conditions (LOS F), based on PeMS speed data. d CMP defines significant freeway impact as change in D/C ratio of 0.02 or more when a freeway segment is at LOS F (D/C ratio > 1.00).
Source: Fehr & Peers, 2011.
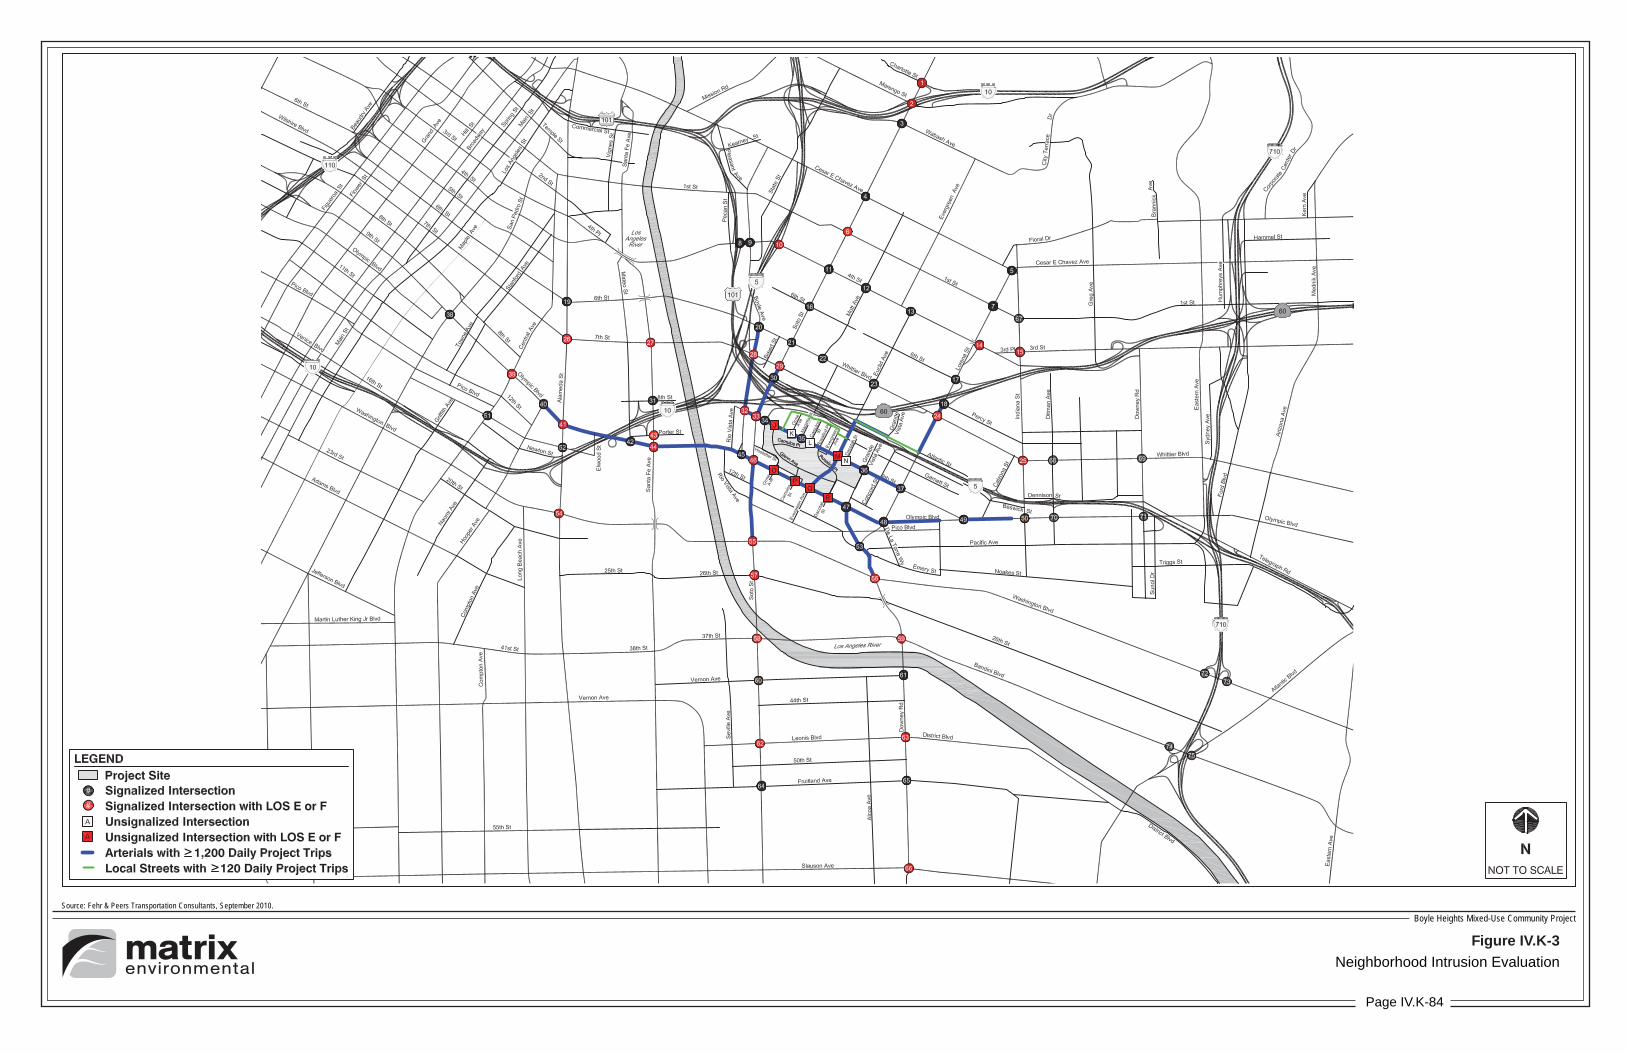
Page
Figure IV.K-3
Neighborhood Intrusion Evaluation
Source: Fehr & Peers Transportation Consultants, September 2010.Boyle Heights Mixed-Use Community Project
Page IV.K-84
IV.K Traffic, Access, and Parking
City of Los Angeles Boyle Heights Mixed-Use Community Project SCH. No. 2008061123 October 2011
Page IV.K-85
WORKING DRAFT – Not for Public Review
Olympic Boulevard—Hooper Avenue to Esperanza Street
Olympic Boulevard—8th Street to Indiana Street
8th Street—Boyle Avenue to Lorena Street
Atlantic Street—Grande Vista Avenue to Euclid Avenue
Boyle Avenue—8th Street to I-10 Eastbound Off-Ramp
Soto Street—8th Street to US 101 Northbound On-Ramp/I-5 & SR 60 Off-Ramp
Soto Street—Olympic Boulevard to Washington Boulevard
Euclid Avenue—Olympic Boulevard to Atlantic Street
Grande Vista Avenue—Olympic Boulevard to Washington Boulevard
Lorena Street—Atlantic Street to SR 60 Eastbound Ramps
The presence of congested future base conditions and the availability of local street(s) providing a parallel route of travel in the vicinity of congested portions of the corridors were then investigated for each of the corridors. Of the corridors listed above, potential significant neighborhood intrusion impacts are expected to occur at the following three (please see Section 6 of the Traffic Study (Appendix L to this Draft EIR) for additional detail regarding this analysis):
Mott Street between 8th Street and Garnett Street
Garnett Street between Mott Street and Euclid Avenue
Atlantic Street between Euclid Avenue and Lorena Street
As discussed in the Traffic Study, the proposed project is expected to add more than 120 daily trips on these residential street corridors. By definition, a signification neighbored intrusion impact would occur at these locations, and mitigation is required. A detailed mitigation program that proposes mitigation measures at these locations is presented below under the Mitigation Measures heading.
(d) Public Transit
Based on application of the previously described transit credits, the Maximum Office scenario would generate approximately 6,780 daily transit person trips, including about 528 (163 inbound, 365 outbound) A.M. peak-hour trips and 673 P.M. peak-hour trips. The
IV.K Traffic, Access, and Parking
City of Los Angeles Boyle Heights Mixed-Use Community Project SCH. No. 2008061123 October 2011
Page IV.K-86
WORKING DRAFT – Not for Public Review
Maximum Retail scenario would generate about 6,871 daily transit person trips, including approximately 512 A.M. peak-hour trips and 676 (402 inbound, 274 outbound) P.M. peak-hour trips. Consistent with the vehicular trip generation detailed throughout this analysis, the transit analysis analyzed the A.M. peak hour from the Maximum Office scenario, and the P.M. peak hour from the Maximum Retail scenario, which represent worst case conditions.
Table IV.K-17 on page IV.K-87 below lists the residual capacity on the transit lines that directly serve the project site, and the estimated project transit trips on each line, based on the transit trip generation and distribution described earlier in this section. Based on the residual capacity, which was calculated using a capacity of 50 riders per bus (40 seated, 10 standing), the addition of project generated transit trips to the lines that directly serve the project site would not cause the passenger load on any of the transit lines to exceed the capacity of those lines. Therefore, it can be concluded that the project would not add substantial new ridership to the transit lines operating in excess of their capacity.
While not required to reduce significant impacts, as part of the mitigation program the project proposes to enhance transit service to key lines that serve the project site as a means to encourage transit use. These service enhancements include:
Provision of one additional bus to enhance service along the Olympic Boulevard/Boyle Avenue/7th Street corridors in the study area
Provision of one additional bus to enhance service along the Olympic Boulevard corridor in the study area
Provision of one additional bus to enhance service along the Soto Street corridor in the study area
A detailed description of each of these components can be found under the Mitigation Measures heading, below. In addition to these transit improvements, the project would greatly increase pedestrian and bicycle connectivity through the implementation of the proposed internal roadway improvements at the project site. The project would also provide improvements to existing bus stops (wider sidewalks and amenities) on the perimeter of the project site as a project feature. Therefore, it can be concluded that the project would not conflict with adopted policies, plans, or programs supporting alternative transportation, and impacts to public transit services would be less than significant.
(e) Access and Circulation
As described above under the Methodology heading, there are two methodologies for analyzing site access and circulation impacts. LADOT’s methodology analyzes whether unsignalized intersections critical to project site access meet signal warrants. The decision
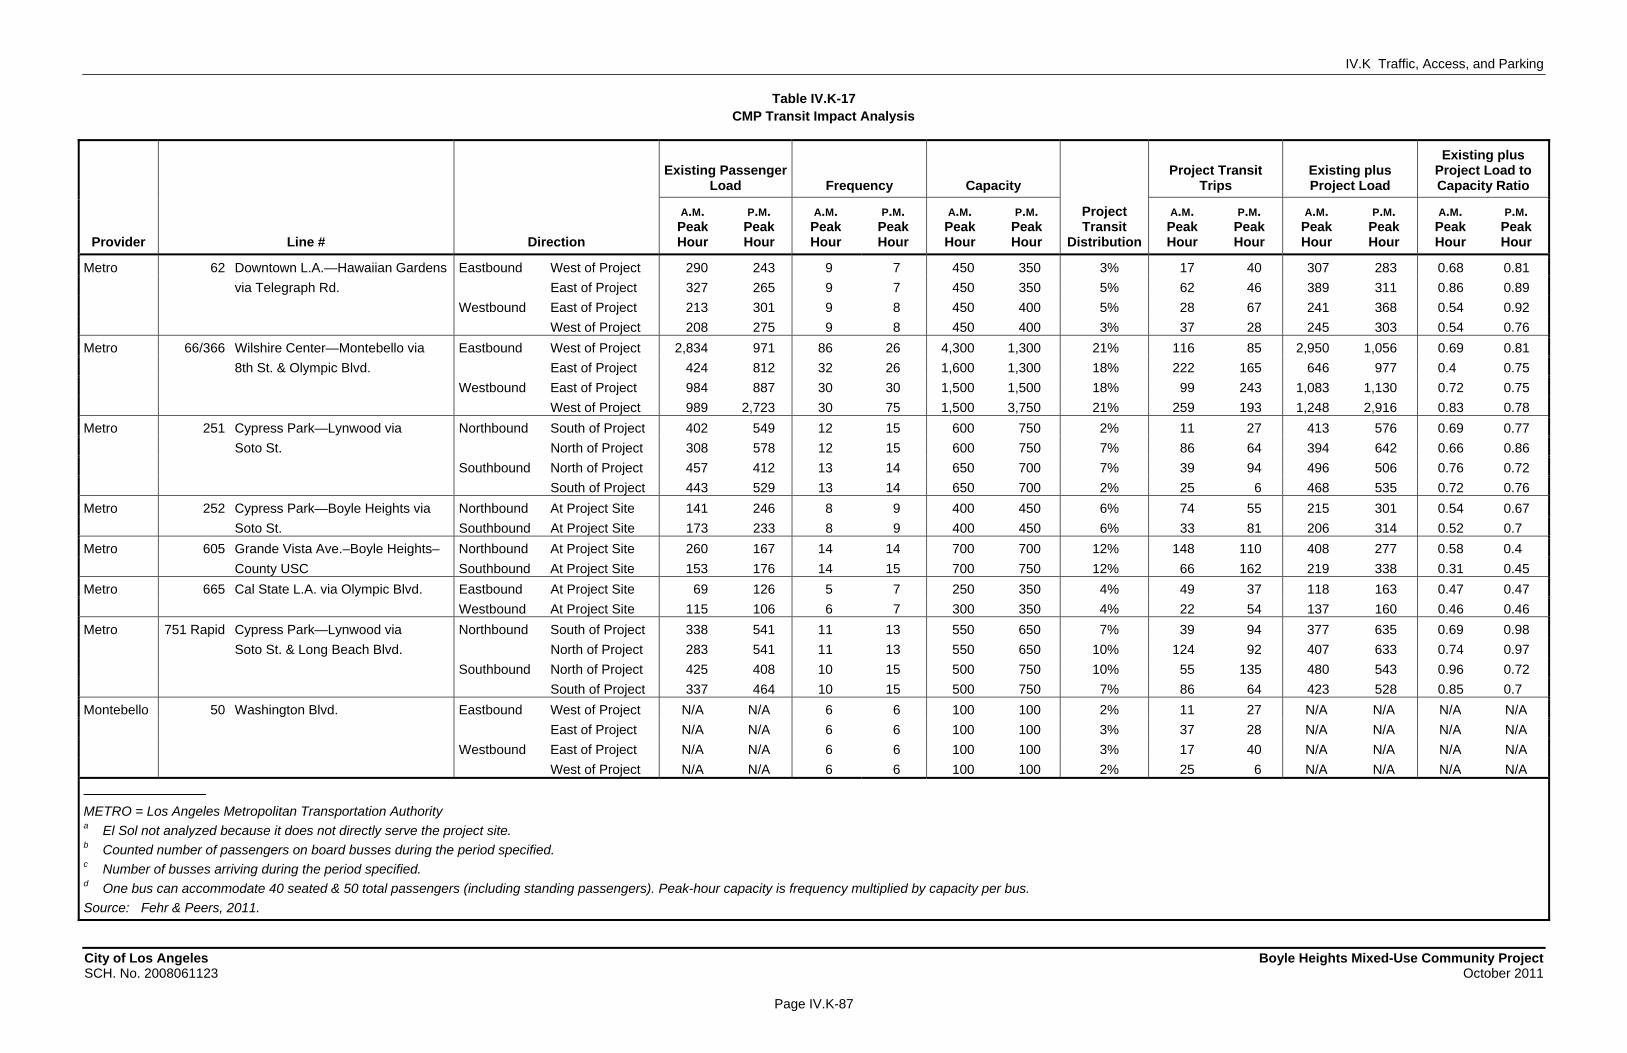
IV.K Traffic, Access, and Parking
City of Los Angeles Boyle Heights Mixed-Use Community Project SCH. No. 2008061123 October 2011
Page IV.K-87
WORKING DRAFT – Not for Public Review
Table IV.K-17 CMP Transit Impact Analysis
Existing Passenger
Load Frequency Capacity Project Transit
Trips Existing plus Project Load
Existing plus Project Load to Capacity Ratio
Provider Line # Direction
A.M. Peak Hour
P.M. Peak Hour
A.M. Peak Hour
P.M. Peak Hour
A.M. Peak Hour
P.M. Peak Hour
Project Transit
Distribution
A.M. Peak Hour
P.M. Peak Hour
A.M. Peak Hour
P.M. Peak Hour
A.M. Peak Hour
P.M. Peak Hour
Metro 62 Downtown L.A.—Hawaiian Gardens Eastbound West of Project 290 243 9 7 450 350 3% 17 40 307 283 0.68 0.81
via Telegraph Rd. East of Project 327 265 9 7 450 350 5% 62 46 389 311 0.86 0.89
Westbound East of Project 213 301 9 8 450 400 5% 28 67 241 368 0.54 0.92
West of Project 208 275 9 8 450 400 3% 37 28 245 303 0.54 0.76
Metro 66/366 Wilshire Center—Montebello via Eastbound West of Project 2,834 971 86 26 4,300 1,300 21% 116 85 2,950 1,056 0.69 0.81
8th St. & Olympic Blvd. East of Project 424 812 32 26 1,600 1,300 18% 222 165 646 977 0.4 0.75
Westbound East of Project 984 887 30 30 1,500 1,500 18% 99 243 1,083 1,130 0.72 0.75
West of Project 989 2,723 30 75 1,500 3,750 21% 259 193 1,248 2,916 0.83 0.78
Metro 251 Cypress Park—Lynwood via Northbound South of Project 402 549 12 15 600 750 2% 11 27 413 576 0.69 0.77
Soto St. North of Project 308 578 12 15 600 750 7% 86 64 394 642 0.66 0.86
Southbound North of Project 457 412 13 14 650 700 7% 39 94 496 506 0.76 0.72
South of Project 443 529 13 14 650 700 2% 25 6 468 535 0.72 0.76
Metro 252 Cypress Park—Boyle Heights via Northbound At Project Site 141 246 8 9 400 450 6% 74 55 215 301 0.54 0.67
Soto St. Southbound At Project Site 173 233 8 9 400 450 6% 33 81 206 314 0.52 0.7
Metro 605 Grande Vista Ave.–Boyle Heights– Northbound At Project Site 260 167 14 14 700 700 12% 148 110 408 277 0.58 0.4
County USC Southbound At Project Site 153 176 14 15 700 750 12% 66 162 219 338 0.31 0.45
Metro 665 Cal State L.A. via Olympic Blvd. Eastbound At Project Site 69 126 5 7 250 350 4% 49 37 118 163 0.47 0.47
Westbound At Project Site 115 106 6 7 300 350 4% 22 54 137 160 0.46 0.46
Metro 751 Rapid Cypress Park—Lynwood via Northbound South of Project 338 541 11 13 550 650 7% 39 94 377 635 0.69 0.98
Soto St. & Long Beach Blvd. North of Project 283 541 11 13 550 650 10% 124 92 407 633 0.74 0.97
Southbound North of Project 425 408 10 15 500 750 10% 55 135 480 543 0.96 0.72
South of Project 337 464 10 15 500 750 7% 86 64 423 528 0.85 0.7
Montebello 50 Washington Blvd. Eastbound West of Project N/A N/A 6 6 100 100 2% 11 27 N/A N/A N/A N/A
East of Project N/A N/A 6 6 100 100 3% 37 28 N/A N/A N/A N/A
Westbound East of Project N/A N/A 6 6 100 100 3% 17 40 N/A N/A N/A N/A
West of Project N/A N/A 6 6 100 100 2% 25 6 N/A N/A N/A N/A
METRO = Los Angeles Metropolitan Transportation Authority a El Sol not analyzed because it does not directly serve the project site. b Counted number of passengers on board busses during the period specified. c Number of busses arriving during the period specified. d One bus can accommodate 40 seated & 50 total passengers (including standing passengers). Peak-hour capacity is frequency multiplied by capacity per bus.
Source: Fehr & Peers, 2011.

IV.K Traffic, Access, and Parking
City of Los Angeles Boyle Heights Mixed-Use Community Project SCH. No. 2008061123 October 2011
Page IV.K-88
WORKING DRAFT – Not for Public Review
of whether a traffic signal should be installed is made according to the direction of the LADOT district office. Based on the analysis above, the following three intersections along the perimeter of the project site would have the potential to meet the established criteria and potentially create a significant impact:
M. Euclid Avenue & 8th Street
P. Camulos Street & Olympic Boulevard
Q. Evergreen Avenue & Olympic Boulevard
Therefore, impacts to site access pursuant to LADOT methodology are considered significant and would require mitigation. As discussed below under the Mitigation Measures heading, the mitigation program for the project proposes to signalize these three intersections in order to reduce potential impacts to a less than significant level.
Pursuant to the methodology outlined in the City of Los Angeles CEQA Thresholds Guide, site access impacts would normally occur if the intersection(s) nearest the primary site access is/are projected to operate at LOS E or F during the A.M. or P.M. peak hour, under cumulative plus project conditions. As indicated in Table IV.K-12 on page IV.K-70, the following intersections along the perimeter of the project site are projected to experience LOS E or F conditions:
J. Glen Avenue & 8th Street (A.M. peak hour)
K. Orme Avenue & 8th Street (A.M. peak hour)
M. Euclid Avenue & 8th Street (both peak hours)
O. Orme Avenue & Olympic Boulevard (both peak hours)
P. Camulos Street & Olympic Boulevard (both peak hours)
Q. Evergreen Avenue & Olympic Boulevard (both peak hours)
R. Dacotah Street & Olympic Boulevard (both peak hours)
However, at all of these intersections, traffic on the through streets (8th Street and Olympic Boulevard) would be uncontrolled, and motorists on both of those streets would therefore not experience delay. The delay and the resulting LOS E or F conditions reported in Table IV.K-12 would be experienced only by motorists on these north-south cross streets waiting to cross or turn left at 8th Street or Olympic Boulevard. The City of Los Angeles CEQA Thresholds Guide also provides that “[i]f an unsignalized intersection is projected to operate at LOS C, D, E or F” the proper approach is to “re-analyze the
IV.K Traffic, Access, and Parking
City of Los Angeles Boyle Heights Mixed-Use Community Project SCH. No. 2008061123 October 2011
Page IV.K-89
WORKING DRAFT – Not for Public Review
intersection using the signalized intersection methodology to determine the significance of impacts…” While installing a traffic signal at each of these intersections would minimize delay for motorists on the cross streets, it would increase delay for motorists travelling on 8th Street and Olympic Boulevard. The City of Los Angeles, like most cities, has a hierarchical street system, whereby traffic flow and access along primary corridors is prioritized over traffic flow and access for small, locally serving streets. To maintain traffic flow on arterials, the number of signalized intersections is limited.
As discussed below, the following intersections would be signalized as part of the mitigation program:
M. Euclid Avenue & 8th Street
P. Camulos Street & Olympic Boulevard
Q. Evergreen Avenue & Olympic Boulevard
These three intersections would serve as the primary access points for the project, providing minimal delay to through traffic on 8th Street and Olympic Boulevard, as well as the traffic accessing the project site. As shown in Table IV.K-11 on page IV.K-67, intersections M, P, and Q would operate at an acceptable LOS after signalization, therefore no access impact would be expected.
The delay experienced by motorists on the remaining unsignalized cross streets (Intersections J, K, O, and R) detailed in this section is acceptable given the role that these streets play in the overall street hierarchy. Only a handful of motorists would experience this delay, because most would use the signalized intersections for project access. Therefore, project access impacts pursuant to City of Los Angeles CEQA Thresholds Guide methodology would be less than significant.
(f) Parking
Since the proposed project is an urban infill mixed-use development (that would include neighborhood serving retail, office, civic, and open space uses) located in a transit rich and dependent community including pedestrian-friendly features to promote walkability and reduce the need for parking spaces, thus lower parking ratios than those set forth in LAMC are appropriate for the project. The estimated total peak parking demands for the project are substantially lower than the parking supply estimated to be required by City Code (8,389 demand versus 10,903 code for the Maximum Office scenario and 8,445 demand versus 11,003 code for the Maximum Retail scenario). As shown in Table IV.K-18 on page IV.K-90, the estimated peak parking demands are also lower than the
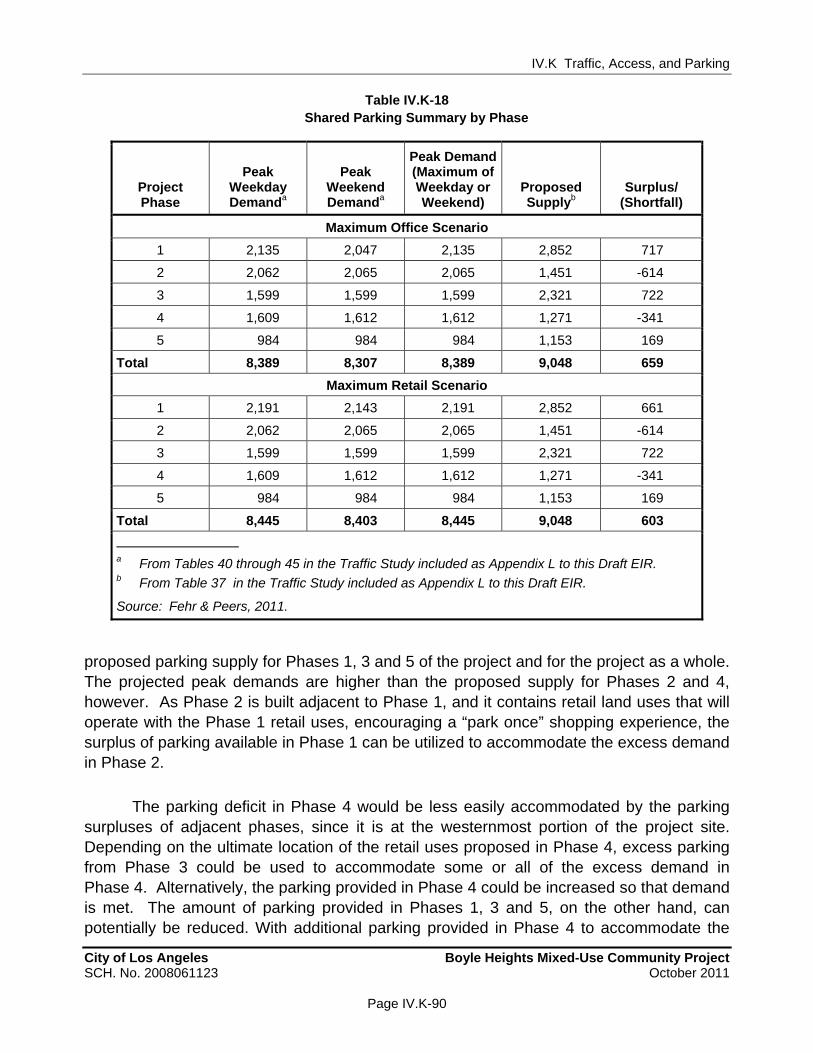
IV.K Traffic, Access, and Parking
City of Los Angeles Boyle Heights Mixed-Use Community Project SCH. No. 2008061123 October 2011
Page IV.K-90
WORKING DRAFT – Not for Public Review
Table IV.K-18 Shared Parking Summary by Phase
Project Phase
Peak Weekday Demanda
Peak Weekend Demanda
Peak Demand (Maximum of Weekday or Weekend)
Proposed Supplyb
Surplus/ (Shortfall)
Maximum Office Scenario
1 2,135 2,047 2,135 2,852 717
2 2,062 2,065 2,065 1,451 -614
3 1,599 1,599 1,599 2,321 722
4 1,609 1,612 1,612 1,271 -341
5 984 984 984 1,153 169
Total 8,389 8,307 8,389 9,048 659
Maximum Retail Scenario
1 2,191 2,143 2,191 2,852 661
2 2,062 2,065 2,065 1,451 -614
3 1,599 1,599 1,599 2,321 722
4 1,609 1,612 1,612 1,271 -341
5 984 984 984 1,153 169
Total 8,445 8,403 8,445 9,048 603
a From Tables 40 through 45 in the Traffic Study included as Appendix L to this Draft EIR. b From Table 37 in the Traffic Study included as Appendix L to this Draft EIR.
Source: Fehr & Peers, 2011.
proposed parking supply for Phases 1, 3 and 5 of the project and for the project as a whole. The projected peak demands are higher than the proposed supply for Phases 2 and 4, however. As Phase 2 is built adjacent to Phase 1, and it contains retail land uses that will operate with the Phase 1 retail uses, encouraging a “park once” shopping experience, the surplus of parking available in Phase 1 can be utilized to accommodate the excess demand in Phase 2.
The parking deficit in Phase 4 would be less easily accommodated by the parking surpluses of adjacent phases, since it is at the westernmost portion of the project site. Depending on the ultimate location of the retail uses proposed in Phase 4, excess parking from Phase 3 could be used to accommodate some or all of the excess demand in Phase 4. Alternatively, the parking provided in Phase 4 could be increased so that demand is met. The amount of parking provided in Phases 1, 3 and 5, on the other hand, can potentially be reduced. With additional parking provided in Phase 4 to accommodate the
IV.K Traffic, Access, and Parking
City of Los Angeles Boyle Heights Mixed-Use Community Project SCH. No. 2008061123 October 2011
Page IV.K-91
WORKING DRAFT – Not for Public Review
projected demands, no parking impact would occur. Therefore it can be concluded that no significant parking impact would occur. If no additional parking is provided in Phase 4, then a localized parking impact could occur for that Phase, depending on how far away available parking in Phase 3 is located. As noted above, as a project design feature dictated in the Community Design Guidelines to be adopted for the project area, shared parking analyses will be conducted before the commencement of construction for each phase of the project, which will determine the parking supply required to serve the needs of the land uses contained in that phase. With implementation of this design feature, impacts to parking, including under Phase 4, would be less than significant.
(g) Pedestrian/Bicycle Safety
The project would greatly increase pedestrian and bicycle connectivity through the implementation of the proposed internal roadway improvements at the project site. The project would also provide improvements to existing bus stops (wider sidewalks and amenities) on the perimeter of the project site as a project feature. The internal street network would be designed to maximize connectivity and enhance pedestrian, bicycle, and transit amenities to encourage walking, biking, and transit. Amenities would include:
Wide sidewalks;
Narrow streets;
Street trees & landscaped pathways between buildings;
Improved street and pedestrian lighting;
Decorative awnings and street lamps within the retail/office areas of the project site;
Most parking structures and loading areas accessed via alleys on the side or rear of the buildings to minimize visual and physical disruptions to the pedestrian environment;
Improved bus shelters, lighting and landscaping, and additional bus stops would be added to the perimeter of the project site; and
The internal street network would be designed to accommodate shared vehicular and bicycle traffic, equivalent to the City of Los Angeles’ Class III bike route designation. On-site bicycle parking would also be provided.
The project access locations would be designed in accordance with applicable design guidelines to ensure adequate sight distance and bicycle and pedestrian safety. No hazard issues are expected to result due to the access locations. Signalized intersections
IV.K Traffic, Access, and Parking
City of Los Angeles Boyle Heights Mixed-Use Community Project SCH. No. 2008061123 October 2011
Page IV.K-92
WORKING DRAFT – Not for Public Review
at site access locations would be upgraded to provide fully compliant Americans with Disabilities Act (ADA) ramps, pedestrian signals, and marked crossings. Therefore, the project would not substantially increase the potential for pedestrian/vehicle and/or bicycle/vehicle conflicts, and impacts to pedestrian and bicycle safety would be less than significant.
(h) Consistency with Plans
(i) Congestion Management Program
As analyzed above, the project would not result in significant impacts to the CMP intersection and freeway monitoring locations located in the vicinity of the project site. Moreover, the project would not result in significant impacts to public transportation in the area. Rather, the project’s numerous pedestrian-, bicycle-, and transit-friendly design features would support local and regional plans and policies that encourage alternative transportation. Therefore, the project would be consistent with the CMP.
(ii) Los Angeles Municipal Code
As discussed above, the Maximum Office scenario would require a total of 10,903 spaces under LAMC parking requirements, and the Maximum Retail scenario would require a total of 11,003 spaces. Both figures are greater than the 9,048 spaces proposed to be provided by the project, but do not take into account the shared parking demand, which is significantly lower. Furthermore, the proposed project requests approval of the Boyle Heights Mixed-Use Specific Plan which would establish site-specific parking standards for the project based on the shared parking demand above that would supersede existing LAMC requirements. Therefore, with approval of the requested Specific Plan, impacts to LAMC consistency would be less than significant.
4. Cumulative Impacts
a. Construction
The construction of 37 related projects is anticipated in the project area. These 37 related projects are dispersed throughout the project area and draw upon a workforce from all parts of the Los Angeles region. The majority of the construction workers are anticipated to arrive and depart the individual construction sites during off-peak hours (i.e., arrive prior to 7:00 A.M. and depart between 3:00 to 4:00 P.M.), thereby avoiding generating trips during the A.M. and P.M. peak traffic periods. In addition, the haul truck routes for the related projects would be approved by LADOT according to the location of the individual construction site and the ultimate destination. LADOT’s established review process would take into consideration overlapping construction projects and would balance
IV.K Traffic, Access, and Parking
City of Los Angeles Boyle Heights Mixed-Use Community Project SCH. No. 2008061123 October 2011
Page IV.K-93
WORKING DRAFT – Not for Public Review
haul routes to minimize the impacts of cumulative hauling on any particular roadway. Although the project would result in less than significant construction-related traffic impacts related to construction worker trips and truck trips, cumulative impacts are concluded to be significant and unavoidable due to the potential for concurrent construction of the related projects in the vicinity of the project site in conjunction with the project itself.
b. Operation
The traffic models utilized in the above analysis incorporated forecasted traffic increases due to regional growth through the project’s future buildout year of 2030. As indicated previously, the Future Base 2030 Condition accounts for 2030 growth projections based on SCAG’s 2008 Regional Transportation Plan as well as the related projects identified in Section III, Environmental Setting, of this Draft EIR.
Therefore, cumulative impacts on intersections, the regional transportation (freeway) system, and access have been analyzed and incorporated. As concluded within the relative discussions above, after implementation of the project design features along with the proposed Mitigation Program, the project would result in significant impacts on 22 study intersections prior to mitigation. Nevertheless, it is anticipated that the individual related projects would be required to reduce potentially significant traffic impacts to the extent feasible. However, as no such guarantee exists in order to ensure that every project implements the required mitigation measures, it is conservatively concluded that cumulative development would yield a significant cumulative impact on intersection and roadway operations.
With regard to public transit, similar to the project, the related projects would generate an overall increase in transit riders. This effect is a positive impact and is consistent with City land use and transportation policies to reduce traffic. The increased transit ridership associated with the project and related projects are not expected to exceed the capacity of transit systems. Furthermore, as part of the mitigation program discussed below, the project proposes to enhance transit service to key lines that serve the project site as a means to encourage transit use, including providing funding for additional buses. Thus, the project’s incremental contribution would not be significant, and cumulative impacts to transit would be less than significant.
With regard to parking and emergency access, it is anticipated that future related projects would be subject to City review to ensure that adequate parking and access would be maintained in the project vicinity. Therefore, cumulative impacts related to these issues would be less than significant.

IV.K Traffic, Access, and Parking
City of Los Angeles Boyle Heights Mixed-Use Community Project SCH. No. 2008061123 October 2011
Page IV.K-94
WORKING DRAFT – Not for Public Review
5. Project Design Features and Mitigation Measures
a. Project Design Features
Project Design Feature K-1: The street system internal to the project site shall consist of public and private streets, and shall be developed as needed by the Applicant or its successor through the phased development of the project, and in accordance with the applicable design guidelines and emergency vehicle access requirements.
Project Design Feature K-2: Site access shall be maintained at the eight locations currently provided at the project site, but shall add access at eight additional locations: Orme Avenue, Marietta Street, Evergreen Avenue, Euclid Avenue, Dacotah Street, and Fresno Street from 8th Street; new access from Grande Vista Avenue on an unnamed street; and access on Euclid Avenue from Olympic Boulevard. A new roadway through the project site shall link Evergreen Avenue at Olympic Boulevard to Euclid Avenue at 8th Street. Both the intersection of Evergreen Avenue/Olympic Boulevard and Euclid Avenue/8th Street shall be signalized. An additional traffic signal shall be installed at the intersection of Camulos Street/Olympic Boulevard.
Project Design Feature K-3: Bus stop amenities and new bus stops along the site perimeter shall be provided. The Applicant or its successor shall coordinate with the Los Angeles Department of Transportation (LADOT) to design new bus stops and amenities in accordance with LADOT design requirements.
Project Design Feature K-4: A system of bicycle routes and pedestrian paths throughout the site shall be provided. Specifically, the internal street network shall be designed to accommodate shared vehicular and bicycle traffic, equivalent to the City of Los Angeles’ Class III bike lane designation. Landscaped pathways shall also be introduced throughout the site to connect the various project elements and foster a pedestrian-friendly environment, which would include wide sidewalks, narrow streets, street trees and landscaped pathways between buildings, improved street and pedestrian lighting, and decorative awnings and street lamps within the retail/office areas.
Project Design Feature K-5: A shared parking analyses shall be conducted by the Applicant or its successor before the commencement of construction for each phase of the project, which will determine the parking supply required to serve the needs of the land uses proposed for that phase.
IV.K Traffic, Access, and Parking
City of Los Angeles Boyle Heights Mixed-Use Community Project SCH. No. 2008061123 October 2011
Page IV.K-95
WORKING DRAFT – Not for Public Review
b. Mitigation Measures
(1) Construction
The following mitigation measures are recommended to reduce construction traffic impacts to a less than significant level.
Mitigation Measure K-1: The Applicant shall prepare a construction traffic management plan, including street closure information, detour plans, haul routes, and staging plans satisfactory to the City of Los Angeles. The construction traffic management plan shall include the following elements:
Provisions to configure construction parking to minimize traffic interference to the extent feasible;
Provisions for temporary traffic control during all phases of construction activities to improve traffic flow on public roadways (e.g., flag persons);
Scheduling construction activities that affect traffic flow on public roadways to off-peak hours to the extent feasible;
Rerouting construction trucks off congested streets to the extent feasible;
Consolidating construction truck deliveries;
Provision of dedicated turn lanes for movement of construction trucks and equipment on- and offsite, to the extent feasible;
Construction-related vehicles shall not park on any residential street;
No construction activity shall block access to any residence or place of business, without prior consent or compensation;
Provision of safety precautions for pedestrians and bicyclists through such measures as alternate routing, and protection barriers;
All contractors shall be required to participate in a common carpool registry during all periods of contract performance monitored and maintained by the Applicant;
All construction-related deliveries, other than concrete and earthwork-related deliveries, shall be restricted to non-peak travel periods to the extent feasible;
Construction vehicle travel through neighboring jurisdictions other than the City of Los Angeles shall be conducted in accordance
IV.K Traffic, Access, and Parking
City of Los Angeles Boyle Heights Mixed-Use Community Project SCH. No. 2008061123 October 2011
Page IV.K-96
WORKING DRAFT – Not for Public Review
with the standard rules and regulations established by the respective jurisdictions where such jurisdictions would be subject to construction impacts. These include allowable operating times for construction activities, truck haul routes, clearance requirements, etc.;
Prior to the issuance of any permit for the project, required permits for the truck haul routes shall be obtained from the City of Los Angeles;
Obtain a Caltrans transportation permit for use of oversized transport vehicles on Caltrans facilities; and
Submit a traffic management plan to Caltrans for approval to avoid potential access restrictions to and from Caltrans facilities.
Mitigation Measure K-2: The Applicant shall develop and submit a Construction Period Pedestrian Routing Plan prior to commencement of construction that identifies safe walking routes to the schools along construction affected streets within and adjacent to the project site. The Plan would, at a minimum, require the following:
Follow generally accepted construction safety standards to separate pedestrians from construction activity.
Maintain sidewalk access along one side of the roadway at a minimum during all demolition and construction phases as feasible. During construction periods when sidewalk access along roadways is not possible, alternative temporary pedestrian pathways shall be constructed to ensure safe and convenient pedestrian routes to both schools are maintained throughout the construction phases.
Provide adequate signage to guide pedestrians on the preferred routes to school.
Designate appropriate truck routes and haul schedules to minimize truck traffic on construction period pedestrian routes during times of peak pedestrian activity.
Mitigation Measure K-3: Prior to construction, the Applicant shall contact the L.A.USD Transportation Branch regarding potential impact to school bus routes and operations. At a minimum, the following precautions shall be implemented to reduce impacts on adjacent schools:
Access for school buses shall be maintained on street right-of-ways during construction.
During project construction, construction vehicles shall comply with the provisions of the California Vehicle Code, including stopping when encountering school buses using red flashing lights.
IV.K Traffic, Access, and Parking
City of Los Angeles Boyle Heights Mixed-Use Community Project SCH. No. 2008061123 October 2011
Page IV.K-97
WORKING DRAFT – Not for Public Review
Project contractors shall maintain on-going communication with school administration at affected schools, providing sufficient notice to forewarn students and parents/guardians when existing pedestrian and vehicle routes to school may be impacted.
If necessary, appropriate traffic controls (signs and temporary signals) shall be installed to ensure pedestrian and vehicular safety during construction.
No staging or parking of construction-related vehicles, including worker-transport vehicles, shall be permitted on streets adjacent to school sites.
Crossing guards shall be provided when safety of students may be compromised by construction-related activities at impacted school crossings.
(2) Operation
(a) Intersections
A phased mitigation program was developed for the intersections that would be significantly impacted by the project. The types of mitigations developed include a project-level TDM program as well as physical improvements. Since sustainability, smart growth, and the reduction of greenhouse gas emissions have become prime concerns for the City in addition to traditional traffic flow considerations, in accordance with LADOT’s Traffic Study Policies and Procedures (December 2010), the project’s mitigation program has been developed to first focus on minimizing the demand for trips by single-occupant vehicles through trip reduction strategies and by encouraging other modes of travel like public transit.
(a) Travel Demand Management (TDM) Program
Mitigation Measure K-4: A project-level Transportation Demand Management (TDM) program for the project shall be prepared and approved during the recordation of final project maps. The TDM program shall include a series of TDM elements including the following:
Site Design—The internal street network shall be designed to maximize connectivity and enhance pedestrian, bicycle, and transit amenities to encourage walking, biking, and transit. Amenities shall include:
– Wide sidewalks
– Narrow streets
– Street trees & landscaped pathways between buildings
IV.K Traffic, Access, and Parking
City of Los Angeles Boyle Heights Mixed-Use Community Project SCH. No. 2008061123 October 2011
Page IV.K-98
WORKING DRAFT – Not for Public Review
– Improved street and pedestrian lighting
– Decorative awnings and street lamps within the retail/office areas of the project site
– Most parking structures and loading areas accessed via alleys on the side or rear of the buildings to minimize visual and physical disruptions to the pedestrian environment
– Improved bus shelters, lighting and landscaping, and additional bus stops would be added to the perimeter of the project site.
– The internal street network shall be designed to accommodate shared vehicular and bicycle traffic, equivalent to the City of Los Angeles’ Class III bike route designation. On-site bicycle parking shall also be provided.
Shared Parking—The TDM program shall include a shared parking plan.
Transit Pass Discount Program—The TDM program shall implement a transit pass discount program.
Parking Strategies—The TDM program shall implement parking strategies, including compliance with the State parking cash out law (if applicable), and unbundling the site’s parking spaces.
Rideshare Programs—The TDM program may require a rideshare program if determined to be feasible.
(b) Transit System Improvements
As determined in the CMP analysis above, the project is not expected to impact the regional transit system. However, several transit improvements are recommended that would enhance the overall transit system serving the project site and surrounding area, improving connectivity between the project, the surrounding Boyle Heights neighborhood, and activity centers such as downtown Los Angeles and County/USC Medical Center. The proposed transit improvements would also partially mitigate impacted intersections along the transit corridors described below.
The project Applicant shall work with Metro to ensure that the following enhanced services are provided in a timely manner consistent with the project’s development schedule. The project Applicant shall also record a covenant and agreement, to the satisfaction of LADOT, to guarantee the provisions of the transit improvements.
Mitigation Measure K-5: Olympic Boulevard/Boyle Avenue/7th Street Corridors (Metro Line 62)—The project shall provide one additional bus to be
IV.K Traffic, Access, and Parking
City of Los Angeles Boyle Heights Mixed-Use Community Project SCH. No. 2008061123 October 2011
Page IV.K-99
WORKING DRAFT – Not for Public Review
operated by Metro. The additional bus would supplement the existing bus transit service on the existing Metro Line 62 during the weekday A.M. and P.M. peak periods. The project shall compensate for total operations and maintenance costs for the new bus during peak hours (7:00 to 10:00 A.M. and 3:00 to 6:00 P.M.) for the first three years. Farebox revenues, state/federal transit subsidies, shall be credited against O&M costs.
Mitigation Measure K-6: Olympic Boulevard Corridor (Metro Line 66/366)—The project shall provide one additional bus to be operated by Metro. The additional bus would supplement the existing bus transit service along the Olympic Boulevard corridor during the weekday A.M. and P.M. peak periods. It should be noted that Olympic Boulevard is classified as a Primary Transit Priority corridor in the City of Los Angeles’ General Circulation Plan in the immediate vicinity of the project site. The project shall compensate for total operations and maintenance (O&M) costs for the new bus during peak hours (7:00 to 10:00 A.M. and 3:00 to 6:00 P.M.) for the first three years. Farebox revenues, state/federal transit subsidies, shall be credited against O&M costs.
Mitigation Measure K-7: Soto Street Corridor (Metro Line 251)—The project shall provide one additional bus to be operated by Metro. The additional bus would supplement the existing bus transit service along Soto Street during the weekday A.M. and P.M. peak periods. The project shall compensate for total operations and maintenance (O&M) costs for the new bus during peak hours (7:00 to 10:00 A.M. and 3:00 to 6:00 P.M.) for the first three years. Farebox revenues, state/federal transit subsidies, shall be credited against O&M costs.
While these mitigation measures are not required to reduce significant impacts, it should be noted that they are subject to Metro’s approval and commitment to implement the specified improvements. Should Metro decide not to implement these improvements, project impacts would not be further reduced and the beneficial effects on transit capacity and intersections along the affected transit corridors would not be achieved.
(c) Physical Intersection Improvements
The following list details the physical mitigation measures and signal phase modifications recommended to mitigate intersection impacts in the study area. Conceptual intersection mitigation measures have been designed to meet the requirements of LADOT and the Los Angeles County Department of Public Works, based on the jurisdiction responsible for the intersection.
IV.K Traffic, Access, and Parking
City of Los Angeles Boyle Heights Mixed-Use Community Project SCH. No. 2008061123 October 2011
Page IV.K-100
WORKING DRAFT – Not for Public Review
Mitigation Measure K-8: Soto Street & 8th Street—The project shall add an eastbound left-turn only lane so that the 8th Street eastbound approach would have a left-turn only lane, one through lane, and one through/right lane. This improvement would shift the westbound departure lanes north to accommodate the new eastbound right-turn lane. The roadway has a 58.5-foot cross-section on the western leg of the intersection, so the improvement could be accommodated within the existing cross section. However, on-street parking would need to be restricted in additional locations on the north and south sides of 8th Street. It is estimated that three spaces would be eliminated on the north side of 8th Street west of Soto Street, and four spaces would be eliminated on the south side of 8th Street west of Soto Street. A total of seven street parking spaces would be eliminated to accommodate this improvement.
Mitigation Measure K-9: Central Avenue & Olympic Boulevard—The project shall add a westbound left-turn only lane so that the Olympic Boulevard westbound approach would have two left-turn only lanes, one through lane, and one through/right lane. This improvement would shift the eastbound departure lanes south to accommodate the westbound left turn only lane. The roadway has an 80-foot cross section on the eastern leg of the intersection, which could accommodate the improvement within the existing cross section.
Mitigation Measure K-10: Santa Fe Avenue & Olympic Boulevard—The project shall add a westbound left-turn only lane so that the Olympic Boulevard westbound approach would have one left-turn only lane, two through lanes, and one right-turn only lane. This improvement would shift the eastbound departure lanes south to accommodate the westbound right-turn only lane. This mitigation would require that a new 10-foot sidewalk be reconstructed on the north side of Olympic Boulevard. The project shall also add a southbound left-turn only lane so that the Santa Fe Avenue southbound approach would have two left-turn only lanes, one through lane, and one through/right lane. It would require that the 12-foot sidewalk on the east side of Santa Fe Avenue be reduced to 10 feet.
Mitigation Measure K-11: Soto Street & Washington Boulevard—The project shall add an eastbound left-turn only lane so that the Washington Boulevard eastbound approach would have two left-turn only lanes, two through lanes, and one right-turn only lane. This improvement would shift the westbound departure lanes north to accommodate the additional left-turn only lane. The roadway has an 80-foot cross section on the western leg of the intersection, which could accommodate the improvement within the existing cross section. This improvement would create a 5-foot offset between the westbound approach and departure lanes.

IV.K Traffic, Access, and Parking
City of Los Angeles Boyle Heights Mixed-Use Community Project SCH. No. 2008061123 October 2011
Page IV.K-101
WORKING DRAFT – Not for Public Review
Mitigation Measure K-12: Downey Road & Bandini Boulevard—The project shall add an eastbound left-turn only lane so that the Bandini Boulevard eastbound approach would have two left-turn only lanes, one through lanes, and one through-right lane. This improvement would shift the westbound departure lanes north to accommodate the additional eastbound left-turn only lane. The roadway has an 86-foot cross section on the western leg of the intersection, which could accommodate the improvement within the existing cross section. This improvement would require that the signal phasing be revised to operate left-turns as lead/lag phasing to avoid truck left-turn conflicts.
(d) Signal Phase Modifications
Mitigation Measure K-13: Boyle Avenue & 8th Street—The project shall add a protected southbound left-turn only signal phase and a westbound right-turn overlap phase, which would run concurrently. This improvement would include the installation of appropriate signal heads, signal arms, as well as adjustments to the signal control plan to implement this additional phase.
(e) Signal System Upgrades
Mitigation Measure K-14: The project shall implement signal system upgrades in the study area by upgrading the signal controllers and installing CCTV cameras at the locations identified below (which include impacted and non-impacted intersections):
Signal Controller Upgrades (Impacted Intersections)
28. Boyle Avenue & 7th Street
32. Boyle Avenue & 8th Street
40. Hooper Avenue & Olympic Boulevard
41. Alameda Street & Olympic Boulevard
Signal Controller Upgrades (Non-Impacted Intersections)
8. US 101 Northbound Off-Ramp & 4th Street
10. I-5 Northbound Ramp & 4th Street
13. Euclid Avenue & 4th Street
17. Lorena Street & SR 60 Westbound Ramps
18. Lorena Street & SR 60 Eastbound Ramps
34. I-5 Southbound On-Ramp & 8th Street
35. Marietta Street & 8th Street
28. Lorena Street & 8th Street
IV.K Traffic, Access, and Parking
City of Los Angeles Boyle Heights Mixed-Use Community Project SCH. No. 2008061123 October 2011
Page IV.K-102
WORKING DRAFT – Not for Public Review
29. San Pedro St & Olympic Boulevard
45. Boyle Avenue & Olympic Boulevard
48. Lorena Street & Olympic Boulevard
49. 8th Street & Olympic Boulevard
51. Central Avenue & 14th Street
52. Alameda Street & 14th Street
53. Lorena Street/Union Pacific Avenue & Grande Vista Avenue
54. Alameda Street & Washington Boulevard
CCTV Camera Installation (Impacted Intersections)
44. Santa Fe Avenue & Olympic Boulevard (controller upgrade not needed)
55. Soto Street & Washington Boulevard (controller upgrade not needed)
CCTV Camera Installation (Non-Impacted Intersections)
21. Soto Street & Whittier Boulevard
34. San Pedro St & Olympic Boulevard
(f) Signalization of Unsignalized Intersections
Mitigation Measure K-15: The project shall fund the installation of traffic signals at the following locations if the identified criteria are met and LADOT determines that the proposed improvements are desired:
M. Euclid Avenue & 8th Street
P. Camulos Street & Olympic Boulevard
Q. Evergreen Avenue & Olympic Boulevard
(b) Neighborhood Intrusion
The implementation of a neighborhood traffic management plan, funded by the project up to the amount detailed above, would mitigate the project’s neighborhood intrusion impact to a level below significance. However, because the implementation of the neighborhood traffic management plan requires consensus amongst stake holders before implementation, there is the potential that a preferred plan may not be agreed upon by the community. If such a situation were to occur, the project’s neighborhood impacts would be unmitigable, and would be considered significant and unavoidable.
Mitigation Measure K-16: Pursuant to the schedule established in the final adopted subphasing program, the Applicant shall provide a funding
IV.K Traffic, Access, and Parking
City of Los Angeles Boyle Heights Mixed-Use Community Project SCH. No. 2008061123 October 2011
Page IV.K-103
WORKING DRAFT – Not for Public Review
mechanism, up to $200,000, acceptable to LADOT for the before and after studies conducted by the Applicant’s traffic engineer, necessary City staff support for development of Neighborhood Traffic Management Plan(s) (NTMP), and for subsequent implementation of traffic calming measures contained in the plan(s). Of the $200,000, $160,000 shall be allocated to the neighborhood bounded by I-5 freeway to the north, 8th Street to the south, Grande Vista Street to the east, and Mott Street to the west, and $40,000 shall be allocated to the neighborhood bounded by Atlantic Street between Euclid Avenue and Lorena Street. Each NTMP process shall include three public workshops that shall take place over a maximum four-month time period. Each workshop shall be rescheduled a maximum of one time if a quorum of the Committee (described below) is not present in person or by proxy. Failure to deliver a quorum for two consecutive meetings duly called and approved by the Committee shall constitute a declaration of non-interest in the process and the process shall cease, and all unused funds allocated to that neighborhood shall be returned to the Applicant or its successors. The following steps shall be implemented:
1. Data Collection—Based on the schedule in the final subphasing mitigation program for the project, the transportation consultant for the Applicant or its successors shall collect and submit to LADOT appropriate traffic data (average daily trips, speed data, intersection turning movement counts, roadway characteristics, etc.) for each of the neighborhoods. Data shall be collected no less than thirty (30) days prior to the issuance of the first Termination Notice pursuant to the Resident Retention Plan.
2. Kick-off Neighborhood Workshops—Based on the schedule in the final project subphasing mitigation program, the transportation consultant for the Applicant or its successors shall hold a “Kick-off Workshop” meeting with the residents for each of the impacted neighborhoods. Working with the Council Office, residents in the boundaries of the impacted neighborhoods shall be invited to participate in the workshops. Public notice of each workshop shall be provided by mailing to owners and occupants within the following geographic boundaries: (1) the neighborhood bounded by the I-5 freeway to the north, 8th Street to the south, Grande Vista Street to the east, and Mott Street to the west, excluding any addresses fronting Marietta Street, Euclid Avenue, Concord Street, and 8th Street, which have a higher street classification than local, and so would not be streets where neighborhood traffic management measures are typically implemented (however, speed humps are currently installed on Marietta Street in between 8th Street and Garnet Street); and (2) Atlantic Street between Euclid Avenue and Lorena Street. At the Kick-off

IV.K Traffic, Access, and Parking
City of Los Angeles Boyle Heights Mixed-Use Community Project SCH. No. 2008061123 October 2011
Page IV.K-104
WORKING DRAFT – Not for Public Review
Workshop, each neighborhood shall select a committee of seven members by a consensus of the neighbors present at the meeting. If less than seven members of the neighborhood attend the Kick-off Workshop, the meeting will be rescheduled. If less than seven members attend the rescheduled Kick-off Workshop, that shall constitute a declaration of non-interest in the process and the process shall cease and all funds allocated to that neighborhood shall be returned to the applicant.
A majority of the Committee members must be present at each of the workshops for the Neighborhood Transportation Management Plan. The agenda for the Kick-off Workshop shall include the following:
i. Identify the process to be used to develop the Neighborhood Traffic Management Plan
ii. Identify the non-restrictive control measures and non-restrictive improvement choices for the neighborhood
iii. Discuss the existing and anticipated traffic issues in the neighborhood
iv. Match the types of improvements with the types of problems that each measure addresses
v. Identify the types of improvements that the neighbors are likely to support
3. Draft Plan—Based on the data and input from the Kick-off Workshop, the transportation consultant for the Applicant or its successors shall develop a draft plan to implement for the neighborhood. The transportation consultant for the Applicant shall review the proposed measures with the appropriate City agency (LADOT, Bureau of Engineering, Street Services and Sanitation, etc.) to confirm the feasibility of the measures.
4. Neighborhood Workshop 2—Upon completion of a draft plan, Neighborhood Workshop 2 shall be held to get reaction to the draft plan and suggestions for modifications to the plan from the residents.
5. Revised Plan—Based on input obtained during Neighborhood Workshop 2, the transportation consultant for the Applicant or its successors shall revise the draft plan for the neighborhood. The transportation consultant for the Applicant shall review the revised plan with the appropriate City agency (LADOT, Bureau of Engineering, Street Services and Sanitation, etc.) to confirm the feasibility of the measures.
6. Neighborhood Workshop 3—Upon completion of the revised plan, Neighborhood Workshop 3 shall be held to finalize the plan. The
IV.K Traffic, Access, and Parking
City of Los Angeles Boyle Heights Mixed-Use Community Project SCH. No. 2008061123 October 2011
Page IV.K-105
WORKING DRAFT – Not for Public Review
plan shall be finalized based on the consensus of the residents present at Neighborhood Workshop 3.
7. Information Brochure—The transportation consultant for the Applicant or its successors shall prepare an information brochure that summarizes the final plan approved in Neighborhood Workshop 3 and a process for the neighborhood to approve or reject the plan. LADOT shall cause the information brochure to be mailed to all households in the neighborhood at issue.
8. Approval/Rejection of the Plan—If a majority of the households in the neighborhood approve of the plan, the Applicant or its successors shall implement the traffic management plan on a temporary basis based on the schedule in the final project subphasing mitigation program. If a majority of the households do not approve of the plan, the measures in the plan shall not be implemented, the process shall be declared over and all remaining funds for that neighborhood shall be returned to the Applicant or its successors.
9. Approval of Final Plan—If step 8 above resulted in the approval of the plan and temporary measures were implemented, six months after the implementation of the temporary measures, LADOT shall cause a second survey of households in the neighborhood at issue to determine the level of interest in making the temporary traffic measures in the plan permanent. If a majority of households in the neighborhood approve of permanent implementation of the measures, the traffic measures shall be made permanent. If a majority of the households do not approve of the traffic measures, the measures shall be removed.
Upon completion of steps 1 through 9 above, the Applicant’s or its successor’s responsibility for the NTMP shall be deemed complete and any remaining funds allocated for that neighborhood shall be returned to the applicant.
6. Level of Significance After Mitigation
a. Construction
With implementation of Mitigation Measures K-1 through K-3, construction-related project traffic impacts would be less than significant. Cumulative construction-related traffic impacts would be considered significant and unavoidable.
IV.K Traffic, Access, and Parking
City of Los Angeles Boyle Heights Mixed-Use Community Project SCH. No. 2008061123 October 2011
Page IV.K-106
WORKING DRAFT – Not for Public Review
b. Operation
(1) Intersections
As shown in Table IV.K-19 on page IV.K-107, the proposed mitigation measures are projected to reduce the project impacts at 16 of the 22 impacted intersections to a level below significance. The exceptions would be the following six locations:
24. Lorena Street & Whittier Boulevard (P.M. peak hour remains unmitigated)
41. Alameda Street & Olympic Boulevard (Both peak hours remain unmitigated)
44. Santa Fe Avenue & Olympic Boulevard (P.M. peak hour remains unmitigated)
46. Soto Street & Olympic Boulevard (Both peak hours remain unmitigated)
56. Grande Vista Avenue & Washington Boulevard (P.M. peak hour remain unmitigated)
63. Downey Road & Leonis Boulevard/District Boulevard (Both peak hours remain unmitigated)
Residual significant impacts would remain at these six locations during the peak period indicated. However, per the analysis conducted in Appendix G to the Traffic study (see Appendix L of this Draft EIR), Intersection 63, which is located in the City of Vernon, would not be considered an impacted intersection according to City of Vernon impact criteria.
In summary, with implementation of the project’s proposed mitigation program, the project’s significant impacts would be reduced to a level below significance at 16 of the 22 impacted intersections. Of the six intersections not fully mitigated, two intersections would be fully mitigated during one peak hour and partially mitigated during the other peak hour, and the other four intersections would be partially mitigated during both peak periods.
It should also be noted that, as discussed in Section VI, Other CEQA Considerations, of this Draft EIR, Mitigation Measures K-10 (Santa Fe Avenue & Olympic Boulevard) requires the reduction of a pedestrian sidewalk from 12 feet to 10 feet. LADOT guidelines provide for a sidewalk width of 10 feet to 12 feet with a minimum of 9 feet. Olympic Boulevard is designated as a Major Highway Class II, and Santa Fe Avenue is designated as a Secondary Highway. According to Street Designations and Standards in the City of Los Angeles General Plan, a Major Highway Class II has a 12-foot sidewalk standard, and a Secondary Highway has a 10-foot sidewalk standard. Mitigation Measure K-10 would not be consistent with the sidewalk standard in the General Plan for Major
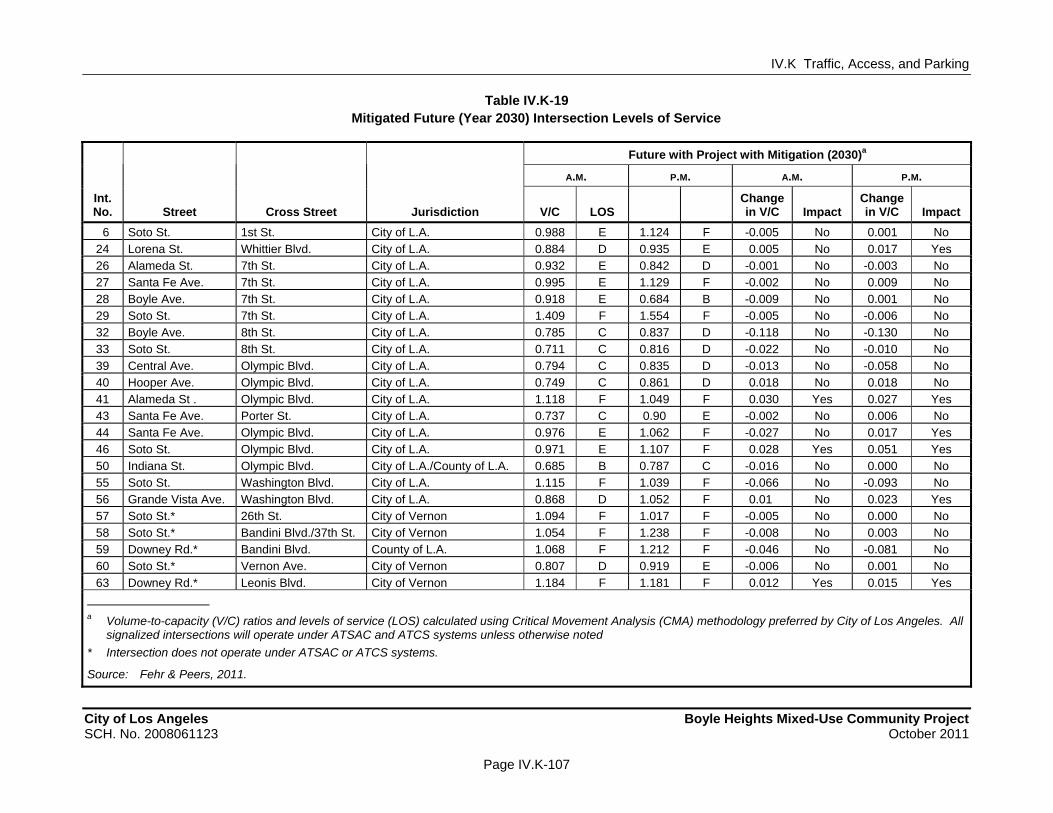
IV.K Traffic, Access, and Parking
City of Los Angeles Boyle Heights Mixed-Use Community Project SCH. No. 2008061123 October 2011
Page IV.K-107
WORKING DRAFT – Not for Public Review
Table IV.K-19 Mitigated Future (Year 2030) Intersection Levels of Service
Future with Project with Mitigation (2030)a
A.M. P.M. A.M. P.M.
Int. No. Street Cross Street Jurisdiction V/C LOS
Change in V/C Impact
Change in V/C Impact
6 Soto St. 1st St. City of L.A. 0.988 E 1.124 F -0.005 No 0.001 No
24 Lorena St. Whittier Blvd. City of L.A. 0.884 D 0.935 E 0.005 No 0.017 Yes 26 Alameda St. 7th St. City of L.A. 0.932 E 0.842 D -0.001 No -0.003 No 27 Santa Fe Ave. 7th St. City of L.A. 0.995 E 1.129 F -0.002 No 0.009 No 28 Boyle Ave. 7th St. City of L.A. 0.918 E 0.684 B -0.009 No 0.001 No 29 Soto St. 7th St. City of L.A. 1.409 F 1.554 F -0.005 No -0.006 No 32 Boyle Ave. 8th St. City of L.A. 0.785 C 0.837 D -0.118 No -0.130 No 33 Soto St. 8th St. City of L.A. 0.711 C 0.816 D -0.022 No -0.010 No
39 Central Ave. Olympic Blvd. City of L.A. 0.794 C 0.835 D -0.013 No -0.058 No 40 Hooper Ave. Olympic Blvd. City of L.A. 0.749 C 0.861 D 0.018 No 0.018 No 41 Alameda St . Olympic Blvd. City of L.A. 1.118 F 1.049 F 0.030 Yes 0.027 Yes 43 Santa Fe Ave. Porter St. City of L.A. 0.737 C 0.90 E -0.002 No 0.006 No 44 Santa Fe Ave. Olympic Blvd. City of L.A. 0.976 E 1.062 F -0.027 No 0.017 Yes 46 Soto St. Olympic Blvd. City of L.A. 0.971 E 1.107 F 0.028 Yes 0.051 Yes
50 Indiana St. Olympic Blvd. City of L.A./County of L.A. 0.685 B 0.787 C -0.016 No 0.000 No 55 Soto St. Washington Blvd. City of L.A. 1.115 F 1.039 F -0.066 No -0.093 No 56 Grande Vista Ave. Washington Blvd. City of L.A. 0.868 D 1.052 F 0.01 No 0.023 Yes 57 Soto St.* 26th St. City of Vernon 1.094 F 1.017 F -0.005 No 0.000 No 58 Soto St.* Bandini Blvd./37th St. City of Vernon 1.054 F 1.238 F -0.008 No 0.003 No 59 Downey Rd.* Bandini Blvd. County of L.A. 1.068 F 1.212 F -0.046 No -0.081 No 60 Soto St.* Vernon Ave. City of Vernon 0.807 D 0.919 E -0.006 No 0.001 No
63 Downey Rd.* Leonis Blvd. City of Vernon 1.184 F 1.181 F 0.012 Yes 0.015 Yes a Volume-to-capacity (V/C) ratios and levels of service (LOS) calculated using Critical Movement Analysis (CMA) methodology preferred by City of Los Angeles. All
signalized intersections will operate under ATSAC and ATCS systems unless otherwise noted
* Intersection does not operate under ATSAC or ATCS systems.
Source: Fehr & Peers, 2011.
IV.K Traffic, Access, and Parking
City of Los Angeles Boyle Heights Mixed-Use Community Project SCH. No. 2008061123 October 2011
Page IV.K-108
WORKING DRAFT – Not for Public Review
Highway Class II, but would be consistent with the standard for Secondary Highways. Accordingly, peak hour pedestrian counts were conducted at this location (presented in Appendix L of this Draft EIR). Given the volume of pedestrian traffic (less than two pedestrians crossing in each direction every minute), it was concluded that no secondary impact would occur at this intersection due to the reduction of the sidewalk from its current width. As such, the proposed improvements requiring either the temporary (i.e., during peak periods) or permanent loss of curbside parking areas and pedestrian sidewalk would not result in significant parking or pedestrian access impacts.
It should also be noted that, as discussed in Section VI, Other CEQA Considerations, of this Draft EIR, Mitigation Measures K-10 (Santa Fe Avenue & Olympic Boulevard) requires the reduction of a pedestrian sidewalk from 12 feet to 10 feet. LADOT guidelines provide for a sidewalk width of 10 feet to 12 feet with a minimum of 9 feet. Olympic Boulevard is designated as a Major Highway Class II, and Santa Fe Avenue is designated as a Secondary Highway. According to Street Designations and Standards in the City of Los Angeles General Plan, a Major Highway Class II has a 12-foot sidewalk standard, and a Secondary Highway has a 10-foot sidewalk standard. Mitigation Measure K-10 would not be consistent with the sidewalk standard in the General Plan for Major Highway Class II, but would be consistent with the standard for Secondary Highways. Accordingly, peak hour pedestrian counts were conducted at this location (presented in Appendix L of this Draft EIR). Given the volume of pedestrian traffic (less than two pedestrians crossing in each direction every minute), it was concluded that no secondary impact would occur at this intersection due to the reduction of the sidewalk from its current width. As such, the proposed improvements requiring either the temporary (i.e., during peak periods) or permanent loss of curbside parking areas and pedestrian sidewalk would not result in significant parking or pedestrian access impacts.
(2) Neighborhood Intrusion
Implementation of the neighborhood intrusion mitigation program described above could be expected to reduce the neighborhood intrusion impacts to less than significant levels. However, if no consensus is reached amongst the neighbors and/or LADOT and no measures are implemented, a significant traffic intrusion impact in the neighborhoods identified above could remain.