is japan really a “buy”? the corporate governance...
TRANSCRIPT
Is Japan really a “Buy”? The corporate governance, cash holdings, and economic performance of Japanese companies
Kazuo Kato [email protected]
Meng Li
Douglas J. Skinner [email protected]
April 2016
Abstract
We investigate whether Japan’s much touted governance reforms improve its firms’ management of cash, economic performance, and valuation. Consistent with an improvement in governance since 2000, Japanese firms hold less cash and increase payouts to shareholders. Improvements in performance are associated with reductions in (excess) cash, reductions in the influence of the banks that traditionally sit at the center of horizontal keiretsu, and increases in the holdings of management and foreign investors. The market valuation of Japanese firms’ cash holdings was lower than for US firms during the 1990s but increases to levels closer to those of US firms in the 2000s. Collectively, the evidence suggests that performance improves in those Japanese companies that reform their governance practices. These findings have implications for other Asian economies, such as China, India, and Korea, where there are ongoing discussions of whether improved governance can increase firm performance and valuation.
__________________________________________________ Kato is from the Osaka University of Economics; Li is from Jindal School of Management, UT-Dallas; Skinner is from University of Chicago, Booth School of Business. We appreciate comments from Julian Franks (NBER discussant), Yasushi Hamao, Akihiro Noguchi, Ronan Powell (JBFA editor), Akinobu Shuto, Dan Simunic, Tomomi Takada, Arnt Verriest, two anonymous referees, and workshop participants at Arkansas, Boston College, Harvard Business School (IMO conference), Melbourne, Minnesota Empirical Conference, Nagoya, NBER Japan Project, Southern Methodist University, Tilburg, and USC. Kato acknowledges financial support from the Japanese Society for the Promotion of Science, Granted-in-Aid for Science Research C21530485.
1
1. Introduction
In the weeks after Japan’s 2011 earthquake and tsunami and the ensuing negative
shock to equity prices, a great deal of attention focused on whether Japanese equities were
cheap.1 This is not a new perspective. At least since French and Poterba (1991), it has been
clear that common valuation metrics for Japanese firms often differ systematically from
those of firms in other countries. At the time French and Poterba first wrote their paper,
Japanese equity prices seemed too high based on P/E multiples. Since the “bubble” in
Japanese real estate and equity prices burst in 1990, Japanese equities have looked cheap by
conventional measures. Over the last two decades, price-to-book multiples for Japanese
firms have often been well below those of U.S. firms, with many below 1.2
Japanese firms are known for holding high levels of cash. Rajan and Zingales (1995)
examine cash holdings of companies across the G7, and find that Japanese firms held
substantially more cash than their G7 counterparts. Because large holdings of cash are
generally viewed as symptomatic of poor governance, this evidence is consistent with the
more general view that Japanese companies are poorly governed.
Japan’s corporate governance problems have received a great deal of attention. 3
Some argue that Japan’s poor governance was responsible for its economic performance
during the “lost decade” (Morck and Nakamura, 2001) and helps explain the low relative
valuations of its public companies. As Japan’s economic problems deepened during the mid
1 See, for example, “Buffett casts vote of confidence on Japan,” Financial Times, March 21, 2011. Buffett is quoted as saying that “(i)t will take some time to rebuild but it will not change the economic future of Japan…If I owned Japanese stocks, I would certainly not be selling them ... (f)requently, something out of the blue like this, an extraordinary event, really creates a buying opportunity.” 2 Milhaupt (2006) cites data showing that in 2000, approximately 13% of 779 non-financial firms on the Tokyo Stock Exchange were trading below their “bust up” values (measured as cash and cash equivalents plus investment securities minus debt). 3 The recent debacle at Olympus has again focused international attention on the governance practices of Japanese companies (for example, see “Pressure on Japan to probe Olympus,” Financial Times, October 25, 2011, as well as Michael Woodford’s book, “Exposure,” which describes the scandal in detail and relates it to governance problems in Japan (Woodford, 2012)).
2
to late 1990s, its government made a series of changes designed to remake its corporate
sector and financial system, including corporate governance reforms, which we describe
further in Section 2. The jury is still out on whether these reforms have led to substantive
changes in Japan’s corporate governance practices and the performance of its corporate
sector. While in some ways things have improved—the importance of the banks and the
keiretsu system generally have declined—in other ways it seems that the old ways of doing
business in Japan remain firmly in place.4 Corporate governance reform continues to be
discussed as part of Prime Minister Abe’s economic policies for pulling Japan out of its
ongoing economic problems.5
Our paper investigates whether there has been any progress in reforming the
governance of Japanese companies and, if so, whether this translates into improvements in
economic performance. There is little systematic evidence on these questions. They are
important not just in Japan, but in other markets that have adopted or are considering
Western-style governance practices—including China, Korea, and India—with the
expectation that this will improve the performance of the corporate sector and boost
economic growth. To do this, we examine whether Japanese companies increased their
payouts and reduced their cash holdings, whether this results in improved performance and
valuations, and whether these effects are related to firm characteristics likely to be associated
with governance, such as the nature of firms’ shareholders.
This approach has a number of advantages in assessing the effectiveness of
corporate governance reforms in Japan. First, our use of cash holdings and payout policy
4 Milhaupt (2006, p. 3) writes that “(o)ver the past decade, the formal institutional environment for Japanese corporate governance has been reformed significantly and at an accelerated pace…Yet, despite substantial legal reform and decade after Japan’s economic problems emerged, there has been no sea change in Japanese corporate governance practices.” 5 See, for example, “Shinzo Abe, shareholder activist,” The Economist, June 6, 2015.
3
provides a relatively direct way of assessing corporate governance reform in Japan.
Although one can measure corporate governance using various metrics and indices, these
measures generally have limitations because, first, corporate governance is multi-dimensional
and so not subject to direct measurement and, second, different corporate governance
structures are likely to be optimal for different firms (e.g., Larcker et al., 2007). This is
especially true in Japan, which allows firms to adopt either a western-style model or a more
traditional Japanese model, as we discuss further in Section 2.
Second, the management of cash has become a flashpoint for disagreements between
corporate managers and investors. As we discuss further in Section 2, the corporate finance
literature (e.g., Jensen, 1986; LaPorta et al., 2000) views managers’ tendency to hold excessive
levels of cash in the companies they manage as an important agency problem, and evidence
shows that high levels of cash are more likely in countries with weaker investor protection,
and that this has consequences for valuations. Activist investors frequently cite firms’ cash
balances as an example of poor governance, and engage with firms to force increased cash
payouts (Klein and Zur, 2009). The management of cash has become a common focus of
battles between external, activist investors and management over the last decade in Japan.6
We provide evidence that Japanese companies, on average and in aggregate, reduce
their cash holdings and increase their payouts after 2000, but that there is a good deal of
cross-sectional variation in these trends. Japanese firms still retain a lot of cash. The median
Japanese non-financial firm held about 15% of assets as cash in 2011, similar to the numbers
for the early 1990s (the median is 13% over 1990-1992). However, using regressions that
control for the effect of firm characteristics on cash holdings, we find that Japanese
managers have, on average, reduced their holdings of cash since 2000, by 3%-4% of assets. 6 See “A Clash over Cash,” The Economist, May 16, 2002. For a more extensive discussion of activist investing in Japan, see Buchanan et al. (2012), Hamao et al. (2011), and Uchida and Xu (2008).
4
To provide a benchmark for assessing the Japanese experience, we also report on the
cash holdings of US firms. US firms increased their cash holdings substantially over the last
two decades (Dittmar and Mahrt-Smith, 2007; Bates et al., 2009; Pinkowitz et al., 2016).
Consequently, although Japanese firms have historically held high levels of cash compared to
firms in other countries, Japanese and U.S. firms now hold roughly comparable levels of
cash, with the median U.S. firm holding cash of around 10-11% of assets over 2003 to 2008
(the number stays at around 11% over 2009-2011).7
Consistent with the idea that governance improves in Japan, Japanese managers now
manage cash more like their western counterparts: empirical models of cash holdings that
explain cash for U.S. firms are increasingly useful for Japanese firms. We find adjusted R-
squareds of around 30% for U.S. firms in the 1990s and 2000s; for Japanese firms, the
adjusted R-squared increases from 17% in the 1990s to around 32% in the 2000s.
Coefficient signs and magnitudes are similar for U.S. and Japanese firms in the 2000s; this is
not the case in the 1990s. This suggests that cash holdings for Japanese firms now depend
on largely the same economic factors that drive cash holdings for US firms, consistent with
similarly effective governance (Dittmar et al., 2003).
When we use these regressions to control for the effect of firm characteristics that
vary through time and across firms, we find that Japanese firms still hold more cash than
U.S. firms. A Japan dummy in the cash holdings regressions is consistently positive and
significant, and implies that, after conditioning on firm characteristics, Japanese firms hold
around 13%-14% more cash (as a fraction of assets) than similar U.S. firms over 2004-2007,
a result that is not greatly affected by the financial crisis.
7 Our conclusions are robust to different treatments of marketable securities, including excluding marketable securities from “cash” for Japanese firms and including them for US firms. US firms’ holdings of marketable securities increase significantly since the early 1990s while Japanese firms’ holdings of marketable securities, significant in the 1990s, essentially disappear around 2001.

5
Japanese firms have very different dividend policies from those of firms in most
other countries. While the fraction of dividend payers in major western economies declines
over the last 25 years (Fama and French, 2001, DeAngelo et al., 2008; Denis and Osobov,
2008; Floyd et al., 2015), over 80% of Japanese industrials continue to pay dividends.
However, these dividends are small compared to those of U.S. dividend payers. Our
evidence shows that the median Japanese dividend-payer pays out dividends that represent
0.6% of assets over the sample period compared to 1.8% for the typical U.S. firm.
Similar to what has occurred in the U.S. and elsewhere, stock repurchases have
become an important way for Japanese firms to return cash to stockholders. Japanese firms
have been able to make stock repurchases since the mid-1990s, a practice that was effectively
prohibited under the Commercial Code and securities exchange laws prior to this time. We
find that beginning around 1997, a substantial minority of Japanese firms (in the 10% to
30% range over 1999 to 2011) makes repurchases, and that the large majority of these firms
also pay dividends (as in the US, few firms only repurchase).
Repurchases contribute to strong growth in aggregate real payouts for Japanese
firms, from around ¥3 trillion in 1999 to around ¥10 trillion in 2008 (1991 real yen)
although dividends play a bigger role in the growth of payouts (of these totals, aggregate
dividends grow from ¥2.4 trillion to ¥6.5 trillion, or at a compound annual real rate of
11.7%). Firms that repurchase and pay dividends account for the bulk of this growth, and
tend to be the largest firms. As a fraction of assets or earnings, these firms pay out roughly
two to three times as much cash as firms that only pay dividends, suggesting a bifurcation of
payout policy (and perhaps capital management more generally) across firms.
We use residuals from regression models that explain cash holdings to measure
Japanese firms’ excess cash. For three non-overlapping periods (1994-2001, 2001-2007, and
6
2007-2011), we sort firms into deciles based on this excess cash measure. We then report
transition matrices which show how firms’ excess cash changes over these periods, and
analyze the relation between these changes and firm performance, measured using ROA and
Tobin’s Q. For the period most likely to benefit from reform, 2001-2007, changes in excess
cash are inversely related to changes in performance (this result also holds in 2007-2011, but
only for Q).
For these same periods, we estimate regressions that explain changes in firm
performance using both changes in excess cash and changes in cash payouts. For both
2001-2007 and 2007-2011, changes in performance are negatively related to changes in
excess cash and positively related to changes in cash payouts; these results are both
economically and statistically significant. These findings are consistent with the idea that
improved governance, as manifested in improved management of cash, is associated with
improved corporate performance.
To tie these results more closely to governance, we show that changes in
performance, changes in excess cash, and changes in cash payouts are related to changes in
ownership characteristics in ways consistent with improvements in governance helping to
explain the changes. We find that ownership characteristics likely to be associated with good
governance (foreign ownership, management ownership, ownership by financial institutions)
tend to be related to decreases in excess cash and increases in payout, while the opposite is
true of bank loans, which is likely to proxy for the influence of banks, and so associated with
poor governance. Further, these ownership characteristics are directly related to changes in
firm performance in ways consistent with our expectations (changes in foreign ownership,
management ownership, and financial ownership are positively related to improvements in
performance, while changes in bank loans are negatively related). During the 2001-2007
7
period most likely to benefit from reform, we find an economically significant relation
between improvements in performance and declines in excess cash. We also show that
performance improves more in firms for which the influence of banks (as measured by bank
ownership and loans) declines and the ownership of foreign investors and managers
increases. These results support the idea that governance reforms lead to improved capital
management and performance for firms that adopt them.
Following previous work on governance (Dittmar and Mahrt-Smith, 2007; Pinkowitz
et al., 2006) we also provide evidence on differences between the market valuation of cash
for US and Japanese firms. The market valuation of cash for Japanese firms is lower than
for US firms in the 1990s, consistent with poorer governance in Japan, but increases to
comparable levels during the 2000s, consistent with improved governance.
Our analysis is inherently cross-sectional, which makes it hard to make strong causal
statements about the relations between firms’ ownership characteristics, cash holdings,
payout policies, and performance. Nevertheless, to date there is virtually no evidence on
whether the reforms that have been widely discussed in the wake of Japan’s long-standing
economic problems have actually had any effect. While Japanese firms are known to have
different dividend policies from firms in other major countries (Dewenter and Warther,
1998), there is little evidence on the extent to which Japanese firms repurchase or on the
overall level of payouts by Japanese firms. We present evidence of a relationship between
changes in cash holdings, payout policy, and firm performance, as well as of a relation
between these changes and changes in ownership characteristics that capture elements of
Japan’s unusual keiretsu (“main bank”) corporate system that is often blamed for its
economic problems. As such, our evidence sheds light on the important questions of
8
whether corporate Japan has actually reformed and whether such reforms improve
performance.
Our research has implications that go beyond Japan. We ask whether western-style
governance is effective in economies with underlying institutions that differ from those of
western economies such as the U.S. and U.K. Japan has certain “institutional rigidities,”
such as a powerful business lobby (Keidanren) and a judiciary that opposes shareholder rights,
which impede the ability of reforms to achieve their goals.8 Similar institutional rigidities
exist in other Asian economies. In China, the prevalence of state-owned enterprises makes it
difficult for shareholder-based governance to be effective; in Korea, the prevalence and
influence of the large corporate groups (chaebol) are a powerful force that resists change; in
India, there are similar issues with “pyramidal” business groups.9 Our evidence indicates
that reforms in governance can improve performance in spite of these rigidities.
Section 2 provides a summary of the governance literature as it pertains to the
management of cash, discusses governance reform in Japan, and presents our empirical
predictions. Section 3 details our sample and data. Section 4 presents our evidence on the
relation between Japanese firms’ cash holdings, payout policy, and governance. As an
alternative approach to assessing governance reform, Section 5 provides the evidence on
whether the valuation of cash holdings improves for Japanese firms. Section 6 concludes.
8 For evidence on how these rigidities have hindered western-style investor activism in Japan, see Buchanan et al. (2012) and Hamao et al. (2011). Keidanren is an organization that represents the interests of the Japanese corporate sector and that has representation from over 1,300 Japanese companies as well as industry and local economic associations, with the self-stated goal of supporting the “self-sustaining development of the Japanese economy and improvement in the quality of life for the Japanese people” (http://www.keidanren.or.jp/en/profile/pro001.html last accessed April 27, 2016). It is widely seen as being resistant to governance reform. In discussing recent efforts to reform Japanese corporate governance, the Economist wrote “Past efforts at reform have been stonewalled by Keidanren, Japan’s big-business lobby,” see “Corporate governance in Japan: A revolution in the making,” The Economist, May 3, 2014. 9 See, for example, Nakamura and Fruin (2012) on China, and Khanna and Palepu (2000) and Bertrand et al. (2002) on India. Nakamura and Fruin discuss the implications of the Japanese experience for governance in China and other emerging Asian economies. On the similarity of these problems in Japan and Korea, see for example, “Corporate savings in Asia: A $2.5 trillion problem,” The Economist, September 27, 2014.
9
2. Theory and empirical predictions
2.1 Cash holdings and corporate governance
“Corporate governance deals with the ways in which suppliers of finance to
corporations assure themselves of getting a return on their investment. How do the
suppliers of finance get managers to return some of the profits to them?” (Shleifer and
Vishny (1997, p. 737). A large literature points to managers’ tendency to hold excessive cash
in their firms as an important agency problem. Jensen (1986) and La Porta et al. (2000),
among others, argue that managers have incentives to over-retain cash to divert resources
for pet projects, engage in empire building, or otherwise benefit themselves at the expense of
outside shareholders. As Myers and Rajan (1998) point out, high levels of corporate liquidity
(relative to other types of investment such as assets in place) make shareholders especially
vulnerable to managers’ tendency to waste corporate resources, which makes governance
especially important for firms with large cash holdings.
Dittmar et al. (2003) report that firms in countries with poor shareholder protection
hold up to twice as much cash as those in countries where shareholders are better protected.
Kalcheva and Lins (2007) and Lee and Powell (2011) report similar evidence. Pinkowitz et
al. (2006) and Kalcheva and Lins (2007) show that the value of cash holdings is lower in
countries with poorer investor protection relative to those with stronger protection and,
conversely, that the value of dividends is higher in these countries. Dittmar and Mahrt-
Smith (2007) show that the market valuation of cash holdings is lower for firms with poor
governance and that poorly governed firms waste cash and exhibit weaker operating
performance. Chen et al. (2012) provide evidence that the cash holdings of Chinese
companies declined after an exogenous shock that improved governance.
There is consistent evidence that activist investors, especially hedge funds, target
10
firms that have agency problems related to excess cash. Brav et al. (2008) report that
activists increase value by taking various actions, including increasing payouts. Brav et al.
(2010) focus on hedge fund activists, and show that these investors focus on ‘value’ firms
with low relative valuations, sound operating cash flows, and low dividend payouts; that is,
on “cash cows” that suffer from agency costs of free cash flow. Klein and Zur (2009) show
that hedge fund activists target firms with agency problems related to cash, and that they
achieve sustainable improvements in performance by forcing these firms to increase payouts.
Becht et al. (2015) report evidence on shareholder activism around the world,
including the US, Europe, and Asia. Their Asian subsample includes mostly Japanese firms.
Their evidence shows that while successful activist campaigns generate positive returns
around the world, activists in Asia are much less likely to succeed compared to those in
Europe and the US. This is generally consistent with the evidence from Japan. Hamao et al.
(2011) and Uchida and Xu (2008) focus on activism in Japan, and show that activists target
firms with high cash balances and low payouts to shareholders, with limited success. This
evidence is consistent with the idea that institutional rigidities in Asia make it difficult for
activists to effect change in the firms they target.
The arguments and evidence summarized above make it clear that high levels of cash
holdings (and low levels of shareholder payouts) are generally associated with managerial
agency problems and poor governance.10 As we discuss next, Japanese firms are well known
for high cash holdings, poor financial performance, and poor governance, which explains
why the Japanese Government and its regulators have consistently pushed for improvements
in governance. This also motivates our focus on Japan, which we see as a useful setting for
10 This is not to say that all firms with high cash balances perform poorly. As Pinkowitz et al. (2016) discuss, US multinationals, including prominent technology firms such as Apple, Google, and Microsoft, are known to hold high levels of cash, in part for tax reasons. Apple has been subject to activist pressure to reduce its cash holdings (for example, see “Einhorn squeezes Apple for its cash,” Wall Street Journal, February 11, 2013).
11
examining the link between governance and cash holdings, payout policy, and firm
performance.
2.2 Corporate governance reform in Japan
The Japanese economy has performed persistently poorly over the last two decades.
One of the alleged culprits has been Japan’s unusual and (some argue) ineffective corporate
governance. Fukao (2003) blames the lost decade on weak governance of Japanese banks
and insurance companies, while Hoshi and Kashyap (2001) discuss the Japanese financial
system and its link to economic performance, especially during the 1990s. Morck and
Nakamura (2001) argue that Japanese corporate governance helps explain the poor
economic performance of its corporate sector.
An important distinguishing feature of the Japanese system is the role of the “main
bank” system and the related keiretsu structure (Aoki et al., 1994; Hoshi and Kashyap, 2001;
Morck and Nakamura, 2004). Under this system, creditors, especially banks, play an
important role in governance, employees (including management) are seen as an important
stakeholders, and shareholders’ rights are relatively less important than in western
economies.
A large number of authors discuss and analyze corporate governance reforms in
Japan. These reforms are complex and multifaceted, and span the mid-1990s through the
early 2000s. Some of these reforms occur organically as a result of other changes in the
economy. The crisis in the banking sector in the mid-1990s, which was due mainly to the
bursting of the bubble in stock and real estate prices that occurred earlier in the decade and
that resulted in a very substantial non-performing loan problem, led the government to inject
capital into the banks and force them to divest their large holdings of shares in non-financial
public companies (Hoshi and Kashyap, 2001; Nakamura, 2006). This led, in turn, to an
12
increase in the share holdings of individual and institutional investors, both domestic and
foreign. Because of the increase in shares held by outsiders, managers of non-financial firms
faced pressure to improve their disclosures and governance practices (Nakamura, 2006).
In addition, as discussed by Hoshi and Kashyap (2001, Ch. 7), the period from the
end of the ‘high growth’ period in Japan in the early 1970s through to the “Big Bang” in
1996, can be characterized as a period of deregulation (also known as liberalization) of the
financial sector. They describe how changes during this period changed the nature of
Japanese corporate governance, mainly due to reduced importance of bank loans in
financing companies (changes in the Commercial Code liberalized industrial companies’
ability to access debt markets and issue bonds) and more generally in weakening the strong
links between banks and industrial companies that were a hallmark of the keiretsu structures
that had hitherto dominated Japanese corporate finance.11
The Japanese Government made a series of changes in the Commercial Code (CC)
from 1993 to 2002 that brought regulation of the capital markets closer to the Western
model and were designed to improve the governance of Japanese companies.12 The most
important of these changes are as follows:
• Beginning in 1997, the CC formally authorized the issuance of stock options.
Milhaupt (2006) cites survey evidence, which shows that the number of companies issuing
stock options to employees or managers increased from 0 in 1997 to 463 in 2001.
11 Hoshi and Kashyap (2001, pp. 289-290) indicate that the Japanese Big Bang “... should be viewed as the last stage of a gradual deregulation that started in the late 1970s” that “completed the transformation of the Japanese financial system from a heavily regulated bank-centered system…to a liberalized, market-based system.” The stated goal of the Big Bang was to make the markets “fair, free, and global.” 12 The discussion that follows draws on discussions of Japanese corporate governance reform in Araki (2005), Gilson and Milhaupt (2005), Patrick (2004), Milhaupt (2006), and Shishido (2001).
13
• As described in detail in Appendix B, a sequence of legal changes during the 1990s
and early 2000s removed restrictions on share repurchases. As we show below, this has
resulted in a very significant increase in the use of repurchases by Japanese firms.
• In 2000, the Civil Rehabilitation Act, modeled loosely on the U.S. Chapter 11
process, was passed, which allowed for more flexible and efficient corporate reorganizations.
This law introduced a debtor-in-possession system and allowed ‘pre-packaged’ bankruptcies
for the first time.
• In 1997, merger procedures were liberalized and in 1999, the CC was further revised
to allow share-for-share exchanges and to eliminate the prohibition on the use of holding
company structures. A further change in 2000 provided enhanced flexibility for separating
business units from parent companies. These changes opened the door for an increase in
M&A activity (prior to these changes, M&A generally, and especially hostile M&A
transactions, were essentially precluded under Japanese law). These changes also promoted
the use of spin-offs, divestitures, and other forms of corporate restructuring. Milhaupt
(2006) discusses the fact that Japan saw one of the first hostile M&A bids in 2000, and
presents data that show a large increase in M&A activity from 1997 to 2000.
• The costs of filing derivative lawsuits brought by shareholders against the
management of companies was substantially reduced, which increased the number of such
lawsuits significantly.
• There were several reforms to the statutory auditor system, which had the effect of
strengthening their role in governance (the role of statutory auditors, as is also true under the
traditional German governance model, is to monitor the board’s compliance with the law
and certificate of incorporation). These included extensions in the term of the auditors,
14
expansion of their responsibilities, and increases in the number and required qualifications of
these auditors. By 2005, at least half of the board of auditors must be outside auditors.13
• A major change in the CC in 2002 allowed firms to opt out of the traditional
statutory auditor board model in favor of a US-style committee system of board governance.
In lieu of statutory auditors, firms establish board committees for audit, nomination, and
compensation, each of which must have more than three members, the majority of whom
must be external, non-employee directors. Milhaupt (2006) cites survey evidence, which
shows a large increase in the number of firms that reduce board size (number of directors)
to less than ten and which add outside directors.
• Over the period from around 1997 to the early 2000s, accounting standards and
disclosure requirements were significantly revised to bring them into line with international
standards, including requiring cash flow statements, the introduction of deferred tax
accounting, consolidated financial statements, mark-to-market accounting for marketable
securities, the reporting of pension obligations on balance sheets, quarterly reporting, among
other changes (e.g., Urasaki, 2014). Japan instituted the Accounting Standards Board of
Japan, a private standard-setter modeled on the US FASB, in 2001. Legislation in 2003
enhanced the ability of the Financial Supervisory Agency (FSA) to oversee the accounting
and auditing industry.
At least three conclusions are evident from this discussion. First, changes in
Japanese corporate governance were relatively slow moving and were linked to other
changes, such as overall liberalization of the financial system and the banking crisis that
began around 1997. Second, many of these changes, most notably the fact that companies
13 These auditors are not to be confused with external auditors, such as the Big 4 audit firms. The external audit process functions in Japan in much the same way as it does elsewhere in the world, including in the US and UK, although there are some differences (Skinner and Srinivasan, 2012).
15
could ‘opt in’ to a western-style governance model, meant that there was likely to be
considerable variation in the extent to which companies adopted governance reforms as well
as the nature of the changes that they made.14 Third, the changing nature of the financial
system likely induced certain changes in the governance model, the most obvious example
being the declining influence of the banks in governance of industrial companies.
These points help justify our focus on cash holdings and payout policy as measures
of governance. Because there is no single preferred or required governance model, and
because firms endogenously choose different models best suited to their characteristics, it
would be hard to create a measure of governance that adequately captures governance
quality or to use such a measure to gauge how governance changes over this period. Nor is
it possible to identify a single point in time when these reforms occur. Moreover, as
discussed in Section 2.1 above, there is a substantial body of theory and evidence that
supports a relation between the management of cash holdings and corporate governance.
2.3 Empirical predictions
In spite of the large literature on the effectiveness of governance reforms in Japan,
there is little empirical evidence on whether Japan’s governance reforms improve corporate
performance and increase returns to stockholders, although some recent work provides
evidence on investor activism in Japan. Hamao et al. (2011) report mixed evidence on the
ability of activist investors to reform Japanese companies between 1998 and 2009, and
widespread adoption of poison pills since 2006; see also Uchida and Xu (2008) and
Buchanan et al. (2012).
14 Patrick (2004, p. 27) concludes his discussion of Japanese corporate governance reform by stating that “…there is no monolithic Japanese corporate governance system today and there will not be one in the future. Different firms will have different corporate governance systems, depending on their histories, ownership patterns, and leaders,” and that “…the variance of corporate governance arrangements will be substantially wider than in the past (emphasis added).”

16
Our main empirical prediction is that the reforms of the late 1990s had two
observable effects on Japanese companies: (1) to improve capital management practices by
lowering excess cash and increasing payouts to shareholders, and (2) to improve operating
performance. Notice that the mechanism we posit is that reforms lead to improvements in
both capital management and operating performance; we are not arguing that the channel is
from governance to capital management to performance.15 These are essentially the same
arguments that form the basis for investor activism, as described above. Because most
reforms were not mandatory, there is likely to be variation in the extent to which they are
adopted by firms, which allows us to exploit cross-sectional as well as time-series variation.
We use the approach of Opler et al. (1999) to model cash holdings,. Dittmar et al.
(2003) use the extent to which this type of cash holdings model fits the data as a measure of
governance—because this model captures how cash holdings vary with the economic forces
(such as investment opportunities and precautionary demand for cash) that affect cash, the
fit of the model can be used to assess governance quality. Following this approach, we
expect that this model will work better for Japanese firms in the period after governance
reform.
Based on these arguments, we expect an inverse relation between changes in excess
cash holdings and firm performance in the 2001-2007 period when reforms are most likely
to take effect. Because we posit that this inverse relation is due to governance reform, we do
not expect to observe this relation in other periods (Japanese firms in the 1990s) or settings
(for US firms). Our use of cash holdings as a measure of governance quality for Japanese
companies is supported by recent evidence in Aoyagi and Ganelli (2014). These authors
15 In other words, the reforms have separate effects on capital management and operating performance. However, under the Jensen (1986) free cash flow argument, forcing managers to disgorge excess cash limits their ability to engage in value-destroying investments, which improves performance.
17
show that the cash holdings of Japanese firms are inversely related to the “Proprietary
Bloomberg Score,” which they describe as a comprehensive governance index applicable to
Japanese companies.16
We also test predictions about how these effects are likely to vary across firms as a
function of ownership structure. Based on previous research on the keiretsu structure of
Japanese firms (Weinstein and Yafeh, 1998; Morck and Nakamura, 1999; Pinkowitz and
Williamson, 2001), we expect that firms more strongly aligned with these corporate groups
are more likely to improve their capital management policies and firm performance when the
influence of the banks that sit at the center of these groups declines.
We also report results from tests of whether the market’s valuation of cash improves
for Japanese firms in the post-reform period. Following Pinkowitz et al. (2006) and Dittmar
and Mahrt-Smith (2007), we estimate cross-sectional regressions of firm value on various
determinants, including cash holdings. These authors argue that lower coefficients on cash
in these regressions are indicative of poorer governance. We investigate whether coefficients
on cash are lower for Japanese firms relative to US firms in the period before reform, and
whether this coefficient increases after the reforms are in place.
3. Sample and data
We first compare the cash holdings of Japanese and US firms. The US is often held
out as a model for Japanese governance (Nakamura, 2011) and is commonly used as a
benchmark in cross-country governance studies (Doidge et al., 2004; Aggarwal et al., 2008).
Our data are from WorldScope, collected via Thomson Reuters DataStream (Japanese and
US firms), and from Nikkei Financial Quest and Nikkei Quick (Japanese firms).17 The sample
16 This index includes measures of board size, percentage of outside directors, disclosure quality.
18
includes Japanese firms listed on the Tokyo Stock Exchange and JASDAQ, and US firms
listed on the NYSE, AMEX, and NASDAQ from 1990 to 2011. This period includes the
bursting of the bubble in Japan, which began its economic malaise and so is a suitable
starting point for our study. We drop observations with missing total assets and exclude
utilities, transportation, and financial firms. Data for Japanese repurchases comes from
Nikkei Quest, supplemented with data drawn directly from financial statements.
Bates et al. (2009) define cash as the sum of cash and marketable securities in their
study of the cash holdings of US firms. Because of possible differences in Japanese firms’
use of marketable securities, we exclude marketable securities and measure cash holdings
simply as cash divided by total assets.18 To be consistent, we do the same for US firms. We
replicate all of our analyses using the sum of cash and marketable securities in place of cash
and discuss substantive differences below; our main inferences are not sensitive to the
treatment of marketable securities. In the next section we discuss how Japanese firms’
holdings of marketable securities change over our sample period.
We define keiretsu firms as those that belong to one of the largest six large horizontal
keiretsu, also known as enterprise groups (Dewenter and Warther, 1998). We obtain these
data from Industrial Groupings in Japan (IGJ, 2001), a standard source of these data, and
classify firms as keiretsu firms if they are classified in IGJ as horizontal keiretsu firms with
inclination scores of 2-4. Our results are robust to variations of this definition.
We also obtain data on the ownership characteristics of Japanese firms. We measure
the fractional holdings of financial institutions (both total and within the firm’s keiretsu),
17 We also compute certain variables for the US firms using Compustat as a robustness check. For the cash holdings variable, we obtain larger sample sizes using Compustat for US firms and Nikkei for Japanese firms than are available on WorldScope. Our inferences are not affected by the source of the data. 18 Pinkowitz and Williamson (2001) also exclude marketable securities to measure cash for Japanese firms.
19
foreign ownership, and management ownership. These data are from Nikkei beginning in
2001.
4. Evidence
4.1 Differences between Japanese and US industrial firms, 1990-2011
We begin by comparing the cash holdings, profitability, and valuation of Japanese
and US companies since 1990. Table 1, Panel A reports means and medians for cash
deflated by total assets, cash and marketable securities deflated by total assets, profitability
(EBIT/lagged TA), price-to-book ratios, and price-earnings ratios by country and year.19
For Japanese firms, the mean ratio of cash/assets is 17.2% (median 15.0%) in 1990,
substantially higher than for US firms for which the mean is 6.9% (median 2.8%), consistent
with Rajan and Zingales (1995). The cash holdings of Japanese companies decline through
1997, when the average reaches 11.2% (median 8.8%). After this, average cash holdings
increase to 17.2% (median 13.1%) in 2005, higher than for US firms but by a smaller margin
(the mean for US firms in 2005 is 16.0% and the median is 9.6%). The numbers then
fluctuate before increasing to 18% (15%) in 2010 and 2011.20 So Japanese firms still hold
more cash than US firms but the differences are smaller than in the early 1990s, due largely
to an increase in the holdings of US firms (Aoyagi and Ganelli (2014), provide evidence that
Japanese firms hold more cash than their G7 counterparts over 2004-2012). We revisit this
conclusion below, however, using regressions that control for the effect of firm
characteristics.
19 Cash deflated by total assets and (cash + marketable securities) deflated by total assets are winsorized at 0 and 1, ROA at -1 and 1, price-to-book ratios at 0 and 30, and P/E ratios at the 1% and 99% percentiles. Bold numbers for Japanese firms indicate significant differences from the corresponding number for US firms at the 1% level or better under two-tailed tests. 20 Median cash ratios of Japanese are significantly higher than those for US firms (at the 1% level, two tailed) for the full time period. Mean cash ratios are not significantly different from those of US firms in 1996, 2000-2003, 2006, and 2009 but are significantly higher in all other years.

20
Figure 1 plots mean and median ratios of cash/total assets for Japanese firms as well
as the asset-weighted ratio (aggregate cash divided by aggregate assets). The asset-weighted
ratio is consistently below the mean and median, indicating lower cash holdings for the
largest Japanese firms. The increasing divergence of the three series in Figure 1 reflects a
substantial increase in the dispersion of cash holdings across Japanese firms after 2000. This
approximately coincides with the introduction of the governance reforms, consistent with
our argument that the reforms increased the cross-sectional dispersion of governance.
When we include marketable securities along with cash (Panel A, Table 1) the
conclusions change, largely because of differential trends in holdings of marketable
securities. US firms increase their holdings of marketable securities from 1998 to 2007 to a
mean (median) of 15% (5%) of assets after which they fall to 10% (1%) by 2011 (not
reported in tables). In contrast, Japanese firms hold around 5% (3%) of assets as marketable
securities through 1997 after which there is a sharp decline to around 1% (0%) in 2001, with
little subsequent change.21
The increase in US firms’ holdings of marketable securities for most of our sample
period means that conclusions about the level of cash holdings reverse when we include
marketable securities. Beginning in the mid to late 1990s, US firms’ holdings of cash and
marketable securities exceed those of Japanese firms by increasingly large amounts and
continue to do so through most of the rest of the period. US firms’ mean (median) holdings
of cash and marketable securities are consistently around 30% (21%-25%) over 2000-2007
compared to 17%-18% (13%) for Japanese firms. One possibility is that while US firms
21 There are two non-mutually exclusive explanations for the decline in Japanese firms’ holdings of marketable securities from 1997 to the early 2000s. First, the decline reflects the general unwinding of corporate cross-holdings that begins in the mid-1990s (Miyajima and Kuroki, 2007). Second, the decline in 2001 could reflect Japanese firms’ response to the introduction of mark-to-market accounting for these securities: many Japanese firms reclassified their equity holdings as long-term in this year, apparently to avoid mark-to-market treatment that became effective for 2001 fiscal year-ends (Urasaki, 2014).
21
treat marketable securities as being akin to cash and short-term liquidity, Japanese firms’
holdings were more strategic, including the cross-holdings that form part of the keiretsu
structures. If this is the case, it seems appropriate to exclude marketable securities for
Japanese firms (this choice doesn’t matter very much after 2001, when most Japanese firms
hold essentially no marketable securities). This logic also implies that the appropriate
comparison is between cash holdings for Japanese firms and cash and marketable securities
for US firms, in which case we would conclude that US firms hold more short-term liquidity
than Japanese firms in every year except 1990 and 1991. In any event, these univariate
comparisons are not very meaningful, as discussed below. We conduct all of our primary
analyses of the relation between changes in excess cash and firm performance (reported
below) including and excluding marketable securities for Japanese firms, without any
meaningful changes in inferences.
We use accounting profitability (ROA = EBIT on lagged total assets) to compare the
performance of Japanese and US firms. Japanese firms are substantially less profitable than
US firms for most of this period. Median ROA is significantly lower for Japanese firms in all
years except 2001, 2008, and 2011 when the differences are not significant. Mean ROA is
also significantly lower for most of the 1990s, although ROA becomes more volatile for US
firms during the 1990s due to increasing left-skewness in the earnings cross-section, a trend
that continues during the 2000s.22 Japanese firms do not display the tendency of US firms to
22 This increasing left skewness is due to at least two related phenomenon. First, as discussed by Fama and French (2004), there has been a systematic shift in the nature of US publicly-traded firms, with firms tending to go public earlier in their life cycles. Second, US firms are reporting losses at an increasing rate (Hayn, 1995; Klein and Marquardt, 2006), and these losses tend to increase in size over time.
22
report large write-downs and losses, and generally show much less cross-sectional dispersion
in profitability.23
To try and hold size and sample composition roughly constant, we also compare the
profitability of the largest 1,500 US and Japanese firms (not reported in tables). Large US
firms are about twice as profitable as Japanese firms, with mean (and median) ROA of about
10% compared to 4.7% (4.2%) for Japanese firms. These differences are fairly consistent
during the full period of our study.
To get a sense for whether Japanese firms are “cheap” in terms of conventional
benchmarks, we also compare price-to-book (P/B) and price-earnings (P/E) ratios for
Japanese and US firms. P/B ratios are persistently lower for Japanese firms. During the
1990s, P/B ratios for US firms average 3.40 (median 2.13) while those for Japanese firms
average 2.36 (median 1.86). [The decade-by-decade numbers are not shown in tables.]
During the 2000s the differences widen to 3.50 (2.09) for US firms versus 1.84 (1.00) for
Japanese firms.
After reaching a peak in 1994, when the mean (median) P/E ratio was 92 (51)—the
phenomenon that French and Poterba (1991) study—P/E ratios for Japanese firms decline.
While partly due to a decline in Japanese equity prices, this is also due to a consistent
increase in Japanese firms’ EPS, in part due to the fact that Japanese accounting rules
changed significantly over this period.24 P/E ratios for US firms show little trend, with the
median varying in a tight range around 20 and the mean varying between approximately 30
and 40. P/E ratios for Japanese and US companies are similar over 2003 through 2011.
23 Some argue that earnings management (particularly to avoid losses and earnings decreases) is more prevalent in Japan (e.g., Suda and Shuto, 2005). 24 French and Poterba (1991) discuss the fact that the high P/E ratios they observed in the 1980s for Japanese companies were partly driven by differences in accounting pushing down EPS numbers, including the fact that most financial statements in Japan were not consolidated. These accounting differences had largely disappeared by the early 2000s, which could explain at least part of the upward trend in Japanese P/E ratios.

23
In Panel B of Table 1 we compare net working capital (excluding cash), industry
sigma, R&D intensity, leverage, capital expenditures, and operating cash flows. Along with
P/B ratios, these are the important determinants of cash holdings (Opler et al., 1999; Bates
et al., 2009). To economize on space, we report means and medians for each set of firms by
decade (1990s and 2000-2011); we provide variable definitions in Appendix A.25
Japanese and US firms differ in a number of respects likely to affect cash. First,
Japanese firms have lower P/B ratios (above) and R&D intensity throughout most of the
sample period. While median R&D intensity is always close to zero, means are 5.4% and
8.8% for US firms versus 1.0% and 1.7% for Japanese firms over the 1990s and 2000s,
respectively. (All differences across countries are statistically significant at the 5% level or
better.) Second, Japanese firms are considerably less volatile than US firms: median industry
sigma is 7.1% and 10.8% for US firms compared to only 2.2% and 4.2% for Japanese firms,
with similar inferences for means. Other things equal, these differences imply that Japanese
firms would hold less cash than US firms (growth opportunities and volatility tend to be
positively associated with cash holdings).26
Third, Japanese firms generally are less levered and have lower operating cash flows,
lower capital expenditures, and less working capital than US firms. (Mean leverage for US
firms is 0.185 and 0.168 versus 0.127 and 0.094 for Japanese firms across the two decades,
respectively, with similar inferences for medians; median operating cash flows are 0.097 and
0.088 for US firms versus 0.047 and 0.058 for Japanese firms, with slightly different
inferences for means; mean capex for US firms is 0.070 and 0.050 versus 0.045 and 0.036 for
25 For each decade we report medians of the annual means and medians. 26 Statements about the relation between firm characteristics and cash holdings are based on previous research on cash holdings; for example, see Bates et al. (2009), Pinkowitz et al. (2016) or Opler et al. (1999). Pinkowitz et al. (2016) estimate this model using a large sample of firms drawn from a large cross-section of countries and find that cash holdings are positively related to industry volatility, P/B, and R&D and negatively related to firm size, capital expenditures, cash flows, net working capital, and leverage.

24
Japanese firms, with similar inferences for medians; mean net working capital is 0.271 and
0.211 for US firms versus 0.188 and 0.152 for Japanese firms, with similar inferences for
medians.) Because these characteristics are generally negatively related to cash holdings, they
help explain why Japanese firms hold more cash than US firms.
To compare the cash holdings of Japanese and US firms conditional on firm
characteristics, we use variants of the model from Opler et al. (1999). Based on the
transactions costs and precautionary demands for cash, Opler et al. model cash holdings as a
function of firm size, a dividend-payer dummy, leverage, price-to-book, industry sigma, net
working capitals, R&D intensity, capital expenditures, and cash flow, to which we add
profitability and a loss dummy. We use fitted residuals from these regressions later in the
paper to measure Japanese firms’ excess cash holdings, a key variable in our analysis.
We first estimate panel regressions for each country, both for the full period (1990-
2011) and by decade (1990-1999 and 2000-2011), and report the results in Table 2, Panel A.
This allows us to assess whether the economic determinants of cash differ across Japanese
and US firms, as well as how these determinants change over time in each country. If
Japanese firms’ governance improves after the reforms, we expect to see improvements in
their management of cash in the 2000s, in which case the regressors should do a better job
of explaining cash (Dittmar et al., 2003). When we estimate the regressions for the full time
period we include dummies for 2001-2007 and 2008-2011 to see how cash holdings change
after 2000 after conditioning on firm characteristics (and separating the crisis period).
Second, we estimate cross-sectional regressions that pool US and Japanese firms
each year, and report the results in Table 2, Panel B. These regressions include a Japan
dummy to assess whether the cash holdings of Japanese companies differ from those of US
companies conditional on the other variables, and a dummy for Japanese keiretsu firms. We
25
also estimate these regressions using cash and marketable securities instead of cash as the
dependent variable (not reported in tables) and discuss those results when different.27
Table 2 Panel A reports the first set of regressions. For US firms, the adjusted R-
squareds are 32% for 1990-1999, 33% for 2000-2011, and 34% for the overall period.
Consistent with prior research, cash holdings are positively related to industry sigma, market-
to-book, and R&D intensity, and negatively related to size, dividend payment, leverage, net
working capital, capital expenditures, and cash flow. The significance and magnitude of
regression coefficients are mostly consistent across sub-periods. The time dummies are
insignificant for US firms, indicating that cash holdings for these firms do not change in the
2000s once we account for changes in firm characteristics (consistent with Bates et al., 2009).
When we estimate the US firm regressions using cash and marketable securities as the
dependent variable (not reported in tables), explanatory power increases, with R-squareds
close to 50%. Coefficients on key variables increase in absolute value. The fact that these
models work better for cash and marketable securities than cash suggests that US firms view
marketable securities as part of short-term liquidity and manage the sum of these amounts.28
The opposite is true for Japanese firms, as discussed next.
For Japanese firms the time dummies are reliably negative for both periods, with
coefficients of -3.4% for 2001-2007 and 2008-2011. This indicates that, on average,
Japanese firms reduce cash holdings after 2000 once we condition on firm characteristics,
consistent with governance reforms having some effect.
27 We estimate these regressions in a number of other ways as well, including requiring that firms have observations for all years in the relevant subperiod as well as requiring that they have observations for at least three years in the relevant subperiod. Results are not sensitive to these sampling requirements and are available upon request. We cluster standard errors by firm and year. 28 This is also consistent with how the financial press portrays the cash holdings of US firms. For example, the press refers to the more than $200 billion of cash and marketable securities on Apple’s balance sheet (including long-term marketable securities) simply as “cash.”
26
The model does not explain cash as well for Japanese firms in the 1990s. For 1990-
1999, the adjusted R-squared is 17%, about half that for US firms in the same period. The
industry sigma variable, which is important for US firms, does not load for Japanese firms.29
In the 2000s, the adjusted R-squared for Japanese firms nearly doubles, to 32%, essentially
the same as for US firms, with industry sigma strongly significant in the expected direction.
This shift suggests that Japanese firms manage cash in a more disciplined way (or at least
more like US firms) in the post reform period, consistent with improved governance.30
When we instead estimate these regressions using cash and marketable securities for
Japanese firms (not reported in tables), the R-squareds decline, opposite to what we observe
for US firms, to 23% (versus 29%) for the full period and to 10% (versus 16%) for the 1990s
and 27% (32%) for the 2000s. This suggests that cash is the more relevant variable for
Japanese firms.
Table 2, Panel B reports the annual cross-sectional regressions that include both US
and Japanese firms as well as intercept dummies for Japanese and Japanese keiretsu firms.
The idea is to compare the cash holdings of Japanese firms in general, as well as keiretsu firms
in particular, to those of US firms conditional on firm characteristics. For brevity we only
tabulate coefficients on the Japan and keiretsu intercept dummies along with number of
29 In addition, the coefficient on the dividend payer dummy is positive for Japanese firms in the 1990s (t = 4.5), opposite to the result for US firms, for which the coefficient is strongly and consistently negative. Because dividends paid by Japanese firms are typically much smaller than those of US firms (see next section), this suggests that while dividends help mitigate free cash flow problems in US firms, they do not do so for Japanese firms, instead serving a more perfunctory role. 30 To ensure these results are not due to underlying differences between US and Japanese firms, we also estimate these regressions for a sample of matched-pairs of US and Japanese firms. To implement this, in each year we match a Japanese firm with a US counterpart in the same industry, within 10% of size, and with the closest ROA. The overall results are similar to those reported: for US firms, the cash holdings regression R-squares are 35.2% and 29.8% in the 1990s and 2000s, respectively; for Japanese firms, the R-squares are 19.0% and 42.8%, respectively. Thus, results for the Japanese firms are more strongly consistent with relatively weak governance in the 1990s and improved governance in the 2000s.

27
observations and R-squareds.31
The coefficient on the Japan intercept is large and reliably positive in all years,
indicating that Japanese firms hold more cash than US firms after conditioning on firm
characteristics. The differences are large in the early 1990s, ranging from 17% to 20% of
assets over 1990-1994. The differences are less pronounced over 1995 to 2001 but remain in
the 10% to 14% range. The differences remain in the 12% to 15% range for the rest of the
sample period, indicating that Japanese firms consistently hold more cash than US firms
after conditioning on firm characteristics. The coefficient on the keiretsu dummy is reliably
negative in all years except 1998 and 1999, which indicates that these firms hold 2% to 3%
less cash than other Japanese firms over most of the period (Pinkowitz and Williamson,
2001, report a similar finding).
We have also estimated these regressions using cash and marketable securities as the
dependent variable (not reported in tables). 32 Because US firms have larger holdings of
marketable securities for most of the sample period (Table 1), differences are smaller but
remain significant: Japanese firms still hold more liquidity. A more appropriate specification
may be to use cash for Japanese firms and cash and marketable securities for US firms,
which biases against finding that Japanese firms hold more liquidity. The results from this
specification (not reported in tables) show that, conditional on firm characteristics, Japanese
firms still hold significantly more liquidity than US firms in all years except 1996, 1997, and
1999. The differences are around 12%-15% in the early 1990s and increase from 5% in 2000
31 Pinkowitz et al. (2016) use a similar approach to compare the cash holdings of US and non-US firms. In most cases, the sign and significance of the coefficients is consistent with that for the regressions reported in Panel A, although for those variables where there was some inconsistency between the results for the US and Japanese firms, the coefficients are less significant. 32 As another robustness analysis, we estimate these regressions using the matched pairs of US and Japanese firms described earlier. The results of this analysis show consistent results for the Japanese intercept dummy (which displays coefficient values very similar to those reported in Table 2) but smaller and less significant negative coefficients on the keiretsu intercept dummy.
28
and 2001 to 9% in 2007 and 13% in 2010 and 2011. Thus, the conclusion that Japanese
firms typically hold more cash than US firms is robust to the treatment of marketable
securities, and holds up even when we stack the deck by including marketable securities for
US but not Japanese firms. This finding is consistent with the evidence in Aoyagi and
Ganelli (2014), who also report that Japanese firms hold more cash than firms in other G7
countries.
4.2 Payout policy for Japanese firms
To analyze the payout policy of Japanese firms in a meaningful way it is necessary to
consider both dividends and repurchases. Restrictions on repurchases in Japan were
gradually lifted beginning in the mid-1990s, as discussed in more detail in Appendix B.
There is little systematic evidence on stock repurchases for Japanese firms.
Figure 2 shows aggregate dividends and repurchases by Japanese firms, measured in
constant 1991 yen. Payouts are stagnant during the 1990s but increase strongly after 2000,
consistent with improved overall governance. Repurchases for Japanese firms begin at ¥33
billion in 1996 and grow quickly to ¥739 billion in 2001, ¥1.4 trillion in 2002, ¥2.6 trillion in
2003, and reach ¥3.8 trillion in 2007. Dividends are largely flat over 1991 to 2000, varying
between ¥2.2 trillion and ¥2.5 trillion with no obvious trend. However, over 2001 to 2008
they grow strongly, from ¥2.7 trillion to ¥6.4 trillion, before declining with the crisis. Total
payouts triple over this period, from ¥3.0 trillion in 2000 to ¥9.9 trillion in 2008, with
dividends accounting for 58% of the increase.
Figure 3 reports the fraction of Japanese firms that pay dividends, repurchase, and
that both pay dividends and repurchase by year. The fraction of dividend-payers is above
90% in 1991 but drifts downward over the 1990s, falling to just less than 80% by 2002.
After this, the fraction of dividend-payers fluctuates around 80%. This fraction is much
29
higher than in other major economies, including the US (Denis and Osobov, 2008; Floyd et
al., 2015). However, dividends paid by Japanese firms are smaller than those paid in other
countries. Our data (not reported) show that annual dividends for the median Japanese firm
represent about 0.6% of assets compared to 1.8% of assets for US firms (these amounts do
not vary greatly across the sample period).
Figure 3 also shows that the fraction of Japanese firms that repurchase increases
from close to 0 in 1997 to around 10% from 1999 to 2001 and then fluctuates between 14%
and 30% over 2002 to 2011. Few firms repurchase without also paying dividends. Similar to
the concentration in payouts in the US (DeAngelo et al., 2004), the growth in payouts
evident in Figure 2 is concentrated in firms that both pay dividends and repurchase, which
tend to be the largest firms.33 Overall, Figures 2 and 3 show that Japanese firms increased
payouts substantially during the 2000s, both through increases in dividends and through the
introduction of repurchases. This increase is mainly driven by larger firms, consistent with
the view that improved governance is not uniform.
4.3 The relation between excess cash, payout policy, and firm performance
We next provide evidence on whether reductions in (excess) cash holdings translate
into improved performance. We first use the cash holdings regressions to sort sample firms
into excess cash deciles. To do this, we use the fitted residuals from the Table 2, Panel A
regressions, estimated separately for the 1990s and 2000s, to measure excess cash. We use
decile ranks based on this measure to investigate whether changes in excess cash are
associated with changes in firm performance, measured using both ROA and Tobin’s Q.34
33 Firms that both repurchase and pay dividends are larger than those that only pay dividends, which in turn are substantially larger than non-payers. These data not reported in tables. 34 To avoid the possibility of a mechanical relation between changes in excess cash and ROA we use total assets at the beginning of the period as the denominator for ROA, so it is not affected by changes in cash during the period. We also use return on equity (ROE) to measure performance, with similar results, as well as replicating
30
We predict that declines (increases) in excess cash are associated with improved (worsened)
performance in the post reform period.
We report the results of this analysis in Table 3. We analyze transitions in excess
cash over three periods. For each period, we sort firms into excess cash deciles in the initial
year and then re-sort in the final year, and report transition matrices for 1994-2001, 2001-
2007, and 2007-2011. Although time period choices are inevitably arbitrary, we view 2001 as
representing the transition to the post-reform period of the 2000s (2001 also coincides with
the availability of data on the ownership structure of Japanese firms, which we utilize in the
next subsection). We expect our prediction—that changes in excess cash and performance
are inversely related—will hold in 2001-2007 (when the results of reform should be evident)
but not in 1994-2001 (the heart of the economic malaise). Because 2007-2011 is also a post-
reform period, there may be a negative relation in this period as well although the relation is
likely clouded by the effects of the global financial crisis.
Table 3 reports the transition matrices (the percentages are based on rows, and so
sum to 100 across rows). Each row comprises observations in a given excess cash decile for
the initial year, from 1 to 10, where 1 denotes the lowest excess cash decile and 10 the
highest excess cash decile. The columns comprise deciles defined in the same way for the
last year. Observations on the diagonal thus represent firms in the same excess cash decile
in the first and last years (no change). Observations above the diagonal represent firms for
which excess cash holdings increase in relative terms, so that firms move up deciles, and
all of the analysis in this sub-section using cash and marketable securities in place of cash, once again with similar results. In addition, as a robustness check we have estimated the cash holdings regressions used to generate the excess cash measure after excluding the cash flow and ROE which measure performance (this avoids any possible relationship between variables used to predict cash holdings and the outcome measure used in these tests).
31
conversely for observations below the diagonal. This analysis requires firms to have data in
the first and last years of each period and we lose observations accordingly.
If membership in excess cash deciles were independent over time, we would see 10%
in all cells. Instead, Table 3 shows clustering in cells on the diagonal and just off the
diagonal and particularly in the extremes, indicating that firms’ levels of excess cash holdings
are persistent over time, consistent with excess cash levels being a relatively “sticky”
characteristic that reflects firm governance.
The key test links changes in excess cash to changes in firm performance. For each
period, we divide firms into those for which excess cash worsens (improves), as indicated by
increases (decreases) in decile membership over the period. Table 3 reports the results of
this analysis—we compare the change in performance (ROA and Tobin’s Q) over each
transition period for firms with increases and decreases in excess cash.35
For 1994-2001, there is little evidence of a relation between changes in excess cash
holdings and firm performance. The mean (median) change in ROA is -0.6% (0.1%) for
firms with increases in excess cash and -0.9% (-0.7%) for firms with decreases in excess cash,
numbers that are not different at conventional significance levels. The mean (median)
change in Tobin’s Q is -0.17 (-0.18) for firms with increases in excess cash and -0.30 (-0.26)
for firms with decreases in excess cash; the differences in means is not statistically significant
while the difference in medians is significant, but in the wrong direction (firms with lower
excess cash experience a larger decrease in performance).
Consistent with our predictions, we find a negative relation between changes in
excess cash and performance over 2001-2007. For this period, there is an overall
improvement in performance, with a mean (median) increase in ROA of 1.9% (1.9%). For 35 The changes in ROA and Tobin’s Q exhibit correlations of 0.49, 0.36, and 0.29 for the three periods, respectively.
32
firms for which excess cash declines, the mean (median) change in ROA is 3.0% (2.6%),
compared to 0.9% (1.4%) for firms for which excess cash holdings increase, with differences
significant at better than 1%. The results for Tobin’s Q are similar: firms with lower excess
cash experience a mean (median) increase in Q of 0.07 (0.09) compared to changes in Q of -
0.11 (0.07) for firms with higher excess cash, differences that are also significant at 1%.
There is weaker evidence of a negative relation over 2007-2011, as expected. For the
sample as a whole, mean (median) ROA declines by -1.9% (-1.7%) due to the effects of the
global financial crisis. The mean (median) change in ROA is -2.0% (-1.7%) for firms with
increases in excess cash versus -1.2% (-1.2%) for firms with decreases in excess cash,
differences that are statistically significant in the predicted direction but only at the 10% level
(two-tailed).36 Results are stronger when we use Tobin’s Q. As for ROA, there is an overall
decline in Q. But this decline is smaller for firms that reduce excess cash (the mean and
median declines are -0.28 and -0.18, respectively) compared to those that increase excess
cash (the mean and median declines are -0.33 and -0.22); the mean difference is significant at
the 10% level while the median difference is significant at the 1% level.
Another way of assessing the relation between changes in excess cash and changes in
performance is to use continuous measures of both variables, and to include changes in
payouts in the analysis. To do this, for each period we regress changes in ROA (and Tobin’s
Q) on changes in excess cash and changes in payout, where the latter is measured as the
change in total cash payout (deflated by total assets) from the initial year to the final year.
This tests our prediction that declines in excess cash and increases in cash payouts are
associated with improved performance. Because dividends represent a stronger
36 When we replicate this analysis using cash and marketable securities rather than cash, the differences in changes in ROA are again highly significant for 2001-2007 and significant at the 5% level over 2007-2011. Results are generally slightly stronger if we use ROE in place of ROA.
33
commitment than repurchases (e.g., Brav et al., 2005; Grullon and Michaely, 2002; Skinner,
2008), we separate changes in dividends and repurchases.
The results are in Table 4. For ROA in the first sub-period, the coefficient on the
change in excess cash is not significant, as expected in the absence of reform (and consistent
with the results in Table 3). The change in payout is positive and significant (1.23, t = 2.30),
which implies that higher profitability is associated with higher payouts. The overall R-
squared is 1.1%. When we separate payouts into dividends and repurchases, the coefficient
on dividends is large and highly significant (6.82, t = 6.68) while that on repurchases is not
significant; the R-squared increases to 12.2%. This tells us that, on average, managers of
Japanese firms increase dividends when earnings increase, as expected under conventional
models of dividend policy (e.g., Fama and Babiak, 1968).
The results for Tobin’s Q in the first period indicate that changes in excess cash are
positively related to performance, with the coefficient on excess cash positive and strongly
significant. This is opposite to what we expect under the governance story but could reflect
the fact that better performing firms built cash reserves during this period. As with ROA,
the change in Q is positively related to dividends, suggesting again that better performance is
associated with increased dividends. The adjusted R squared is 7.4%.
The results for 2001 to 2007 are consistent with what we expect if the governance
reforms are effective for some firms over this period. For ROA in this period, the
coefficient on the change in excess cash is -0.15 (t = -5.86) while that on the change in
payouts is 0.78 (t = 6.75), indicating that improved performance is associated with lower
excess cash and increased payouts. The R-squared is 3.8%. The coefficient on excess cash
implies that a decline in excess cash of 2% of assets (close to the median) is associated with
an increase in profitability of around 30 basis points, which we view as a plausible
34
magnitude. When we separate payout into dividends and repurchases, the R-squared
increases to 10.9%. The coefficient on dividends of 4.50 (t = 14.6) implies a payout ratio of
0.22, while that on repurchases is again insignificant. The coefficient on excess cash remains
negative and highly significant, with a coefficient of -0.14 (t = -5.83).37
The results for Tobin’s Q over 2001 to 2007 also support our prediction that
changes in excess cash are negatively related to changes in performance. For both
specifications, the coefficient on the change in excess cash is negative and highly significant
(the t-statistics exceed 6 in absolute value). There is again a strongly positive relation
between the change in performance and the change in dividends. The R-squareds for these
regressions are 1.8% and 2.2%, respectively.
Over 2007-2011, the negative relation between changes in performance and excess
cash holdings is no longer significant in the ROA regressions. The coefficient on payouts
remains positive (0.34 t = 4.37) but the R-squared is only 0.8%. The dividend/repurchases
split again improves explanatory power, to 5.8%, with the coefficient on dividends smaller
than in prior periods but still highly significant (2.52, t = 12.0). In contrast, the Tobin’s Q
results continue to show a negative relation between changes in performance and changes in
excess cash, with t-statistics in excess of 3 in absolute value.
These results support the view that improvements in the governance practices of
Japanese firms are associated with improved corporate performance. To more directly tie
these results to governance, we next examine how these relations relate to changes in
ownership characteristics of Japanese firms using data that is available beginning in 2001.
37 Causality potentially operates in both directions for payouts: firms pay higher dividends because they are more profitable; improved governance likely causes better performance and higher dividends.
35
4.4 Changes in performance, cash holdings, payout policy, and ownership structure of Japanese firms
There is a large literature on Japanese governance (Aoki et al., 1994; Dewenter and
Warther, 1998; Hoshi et al., 1990; Kang et al., 2000; Kaplan, 1994; Morck and Nakamura,
2001, 2004; Pinkowitz and Williamson, 2001; Weinstein and Yafeh, 1998). The traditional
Japanese keiretsu system is characterized by high levels of bank ownership and lending,
interlocking boards, and intragroup equity cross-holdings, among other features. We next
examine how changes in the ownership structure of Japanese companies affect the relation
between performance, excess cash, and payout policy.
Table 5, Panel A reports mean (median) values for the ownership characteristics of
Japanese firms from 2001 to 2011. To measure the influence of financial institutions (banks
and insurance companies), we report total ownership by financial institutions, ownership by
financial institutions within a given keiretsu, and bank loans deflated by assets. The general
view from the Japanese governance literature is that the stronger the within-keiretsu influence
of banks, especially the main banks, the weaker is governance (e.g., Weinstein and Yafeh,
1998; Pinkowitz and Williamson, 2001). We also include the levels of management and
foreign ownership, which we expect are associated with better governance and firm
performance (although causality will likely run in both directions).
Consistent with the reforms taking effect over 2001 to 2007, ownership by financial
institutions declines during the 2000s. Average ownership by all financial institutions is 21%
(median, 18%) in 2001 and declines to 15% by 2011 (median, 13%).38 We report three
columns of numbers for within-keiretsu financial ownership to further examine changes in
38 Our numbers are broadly consistent with those for the Japanese market as a whole, as reported, for example, in the Tokyo Stock Exchange Fact Book (2011). This publication reports that ownership by financial institutions in listed Japanese companies, measured on an aggregate market capitalization basis, declines from 42.1% in March 1998 to 30.6% in March 2010, with ownership by city and regional banks declining from 14.8% to 4.3%.
36
the influence of the main banks: overall mean, fraction of non-zero observations (which
effectively shows the fraction of keiretsu firms), and median ownership for non-zero
observations. The overall mean declines from 2.1% in 2001 to 0.8% in 2009-2011. This is
driven by a decline in financial institutions’ influence within keiretsu and a decline in the
fraction of keiretsu firms (non-zero observations). The fraction of non-zero observations
declines from 24% in 2001 to 14% in 2011. Within this declining fraction of firms, median
ownership of financial institutions declines from 7.6% in 2001 to 4.6% in 2011. Also
consistent with the declining influence of banks, bank loans as a fraction of assets declines
from 26% (median, 24%) of assets in 2001 to 21% (median, 16%) by 2007 and thereafter.
Collectively, these results indicate a decline in the influence of the main banks, most of
which occurs from 2001 to 2007, consistent with our focus on this period as being most
important in understanding the effects of governance reform.
The level of foreign ownership increases over the same period, consistent with
foreign investors being attracted to Japanese equities by their low relative valuations and the
prospects for reform. Mean foreign ownership increases from 5% (median, 1%) in 2001 to
9% (5%) in 2006 and 2007, before declining somewhat after this, perhaps due to the crisis.
We also report management ownership, which can reflect management
entrenchment or alternatively be viewed as indicative of better incentive alignment (Morck et
al., 1988). This variable shows little trend, with the mean (median) consistently around 9%-
10%.
Table 5, Panel B, reports correlations between these ownership characteristics, firm
performance (ROA and Tobin’s Q), excess cash, payouts, and firm size in 2001. ROA is
correlated with dividends (0.45), foreign ownership (0.20), management ownership (0.21),
and bank loans (-0.29). Tobin’s Q is positively related to ROA (0.30), dividends (0.18),
37
foreign ownership (0.26), and management ownership (0.09). These correlations are
consistent with our hypothesis that higher payout is an indicator of good governance and so
positively associated with performance, that foreign ownership and management ownership
are positively associated with good governance, and that bank loans are negatively associated
with good governance. Further consistent with these interpretations, the dividend variable is
positively associated with foreign ownership (0.22), management ownership (0.18), and
negatively associated with bank loans (-0.43). 39 Performance and dividends are each
negatively related to within-keiretsu financial ownership (-0.06 and -0.10, respectively),
consistent with this variable being indicative of poor governance.
Overall financial ownership is positively associated with foreign ownership (0.22),
strongly positively associated with financial ownership within the keiretsu (0.41), as expected
given the overlapping construction of these variables, and negatively associated with
managerial ownership (-0.36), making it unclear whether this variable is capturing good or
bad governance. The within-keiretsu financial ownership variable is less negatively associated
with managerial ownership (-0.27) and much less positively associated with foreign
ownership (0.03) than the overall financial ownership variable, suggesting that it is financial
ownership within a keiretsu that adversely affects governance. This makes sense if external
financial institutions play a monitoring role while within-keiretsu institutions shield incumbent
management from reforms.
Not surprisingly, ownership characteristics are strongly related to firm size.
Ownership by financial institutions is positively associated with size (0.66), as is within-
keiretsu financial ownership (0.34) and foreign ownership (0.32) while management
39 The relation between repurchases and these ownership variables is weak. This is expected because payouts are only useful in governance if they represent a commitment to pay out future cash, which is the case for dividends but not repurchases.
38
ownership is negatively related to size (-0.42). Size is positively related to excess cash (0.10)
and negatively related to dividends (-0.14), providing some evidence that governance is
poorer for larger firms.40
Table 6 reports regressions of changes in firm performance, again measured using
ROA and Tobin’s Q, on changes in excess cash, changes in dividends and repurchases, and
changes in the ownership characteristics. We estimate these regressions for the 2001-2007
and 2007-2011 subperiods for which we have ownership data.
The inclusion of the ownership variables has little effect on the excess cash and cash
payout variables. For both ROA and Tobin’s Q, the coefficients on the change in excess
cash for 2001-2007 continue to be reliably negative, with roughly the same coefficient
magnitudes and significance as before. For 2007-2011, the coefficients on excess cash are
insignificant in the ROA specifications but negative and significant at the 1% level in the
Tobin’s Q specifications, consistent with the Table 4 results. For the ROA specification, the
dividend payout variable remains positive and significant in both periods, but is not
significant when we measure performance using Tobin’s Q.
The ownership variables add significantly to the explanatory power of the
regressions: for the ROA regressions, the R-squared increases from 3.8% to 13.4% for 2001-
2007 and from 0.8% to 10.6% for 2007-2011; for the Tobin’s Q regressions, the R-squared
increases from 2.2% to 11.4% for 2001-2007 and from 0.4% to 2.9% for 2007-2011. There
are similar increases for the regressions that separate the dividend and repurchase variables.
40 Size is also related to changes in the ownership variables over 2001-2007, which is also not surprising given the fact that historically many large firms are strongly aligned with keiretsu groups. Size is negatively related to the change in financial ownership (-0.289) and financial ownership within keiretsu (-0.310), positively related to the change in foreign ownership (0.325) and management ownership (0.259), and negatively related to the change in bank loans (-0.159). Size is positively associated with improvements in ROA (0.099) and changes in dividends and overall payout (0.054 and 0.043) and negatively associated with changes in excess cash (-0.069). All of these correlations are statistically significant at the 1% level. We have also included size in the Table 4 and Table 6 regressions; our results are largely consistent across different firm size categories.
39
Consistent with the idea that foreign ownership is related to good/improving
governance, the change in foreign ownership is positively associated with the change in
performance over 2001-2007 for the ROA specification, and for both periods for the
Tobin’s Q specification (these results hold at the 1% level or better).41 The change in total
financial ownership is positively related to performance in both periods for both the ROA
and Tobin’s Q specifications, consistent with financial institutions playing a monitoring role.
In contrast, the change in financial ownership within the keiretsu, where the monitoring role
may conflict with an entrenchment role of banks, is not related to performance under either
measure. The change in management ownership is positively related to performance in
2001-2007 using the ROA measure and in both periods for Tobin’s Q, suggesting that this
variable captures improved incentive alignment as opposed to entrenchment. Finally, the
change in bank loans is strongly negatively related to performance in both periods using the
ROA measure and for 2001-2007 for Tobin’s Q, consistent with the argument that main
bank influence adversely affects governance and hence performance.
These results confirm and extend the earlier findings showing that firms that lower
their holdings of excess cash improve their performance. Improvements in performance are
stronger for those firms with higher levels of foreign ownership, management ownership,
ownership by financial institutions generally (but not those within the keiretsu), and lower
levels of bank loans. The results hold consistently over 2001-2007 for both the ROA and
Tobin’s Q measures, and generally also hold over 2007-2011 when we use Tobin’s Q. These
results support our interpretation that improved governance explains variation in the
41 We cannot determine if increased foreign ownership is the cause or the result of improved performance; it is likely that both effects are occurring. Hamao et al. (2011) and Uchida and Xu (2008) describe how some foreign (US) investors push for improvements in governance in Japanese firms. A prominent example is Steel Partners, an activist US hedge fund that invested in Japan over this period, with mixed results (e.g., see “Message in a bottle of sauce,” The Economist, November 29, 2007).

40
improved performance of Japanese firms and its relation to changes in the management of
cash.
5. Cash holdings, governance, and valuation
The evidence in Section 4 shows that lower excess cash translates into better
performance. We next examine whether improvements in governance are reflected in
changes in the market valuation of cash. Dittmar and Mahrt-Smith (2007) and Pinkowitz et
al. (2006) find that cash holdings are valued less in countries/firms where governance is
poor, the interpretation being that managers can more easily expropriate or mismanage cash
when investor protection/governance is weak, which reduces its value.
We investigate two predictions derived from our main argument: (a) to the extent
that Japanese companies are less well governed, cash is less highly valued in Japanese firms
than US firms, (b) to the extent that governance in Japan improves after 2000, any such
differences will decline in this period.
We use two specifications, both based on Fama and French (1998). The first follows
Pinkowitz et al. (2006):
Vi,t = α + β1.Post-Reformt + β2.Ei,t + β3.dEi,t + β4.dEi,t+1 + β5.dNAi,t + β6.dNAi,t+1 + β7.RDi,t +
β8.dRDi,t + β9.dRDi,t+1 + β10.Di,t + β11.dDi,t + β12.dDi,t+1 + β13.dVi,t + β14.Ci,t + β15.Ci,t.Post-
Reformt + εi,t … (1)
where dXt denotes changes in X from t-1 to t, V is the market value of equity plus
the book value of debt, E denotes earnings (EBIT), NA denotes net assets (total assets
minus cash), RD is research and development expense, D is common dividends, and C is
cash.42 Our focus is on the coefficient on cash (β14), which we expect is smaller for Japanese
42 We have replicated the analyses in this section using cash and marketable securities in place of cash, with similar (somewhat stronger) results.
41
firms than U.S. firms in the 1990s, and to increase for Japanese firms after 2000. We test the
latter prediction by interacting Ci,t with a post-reform dummy set to 1 from 2001 to 2007 and
0 otherwise.
The second specification follows Dittmar and Mahrt-Smith (2007):
Vi,t = α + β1.Post-Reformt + β2.Ei,t + β3.dEi,t + β4.dEi,t+2 + β5.RDi,t + β6.dRDi,t + β7.dRDi,t+2 +
β8.Di,t + β9.dDi,t + β10.dDi,t+2 + β11.dNAi,t + β12.dNAi,t+2 + β13.dVi,t+2 + β14.Ci,t + β15.Ci,t.Post-
Reformt + εi,t … (2)
Here, all variables are deflated by NAt, and dXi,t denotes changes from t-2 to t. Our
focus is again on β14 and β15, with the expectation that β14 will be smaller for Japanese firms
and that β15 will be positive for Japanese firms as the cash coefficient increases post reforms.
We report results in Table 7. We estimate each regression over 1990-2007 by
country, with two-way clustering of standard errors. To ensure that our results are not driven
by differences or changes in the characteristics of US and Japanese firms, or changes in the
compositions of the sets of firms in each country over time, we match each Japanese
firm/year to a US firm in the same year and industry, within 10% of size, and with the
closest ROA. This results in a 5,405 firm/years for each country for the Pinkowitz et al.
(2006) specification and 4,513 firm/years for the Dittmar and Mahrt-Smith (2007)
specification, which has more onerous data requirements.
We first discuss results for the Pinkowitz et al. (2006) specification. For the US, the
R-squared is 33.6% while for Japan it is 47.3%, with coefficients on most variables taking
expected signs. Consistent with our prediction, the coefficient on cash is higher for US
firms than Japanese firms in the 1990s: the coefficient for US firms is 4.25 (t = 6.71)
compared to 0.57 (t = 2.82) for Japanese firms, numbers that are statistically different at
better than 1% (t = 5.24). In addition, the coefficient for Japanese firms increases by 1.27 (t
42
= 3.30) in 2001-2007, consistent with improved governance, and the overall coefficient on
cash is no longer significantly different across US and Japanese firms.43 Also consistent with
our arguments, the coefficient on the dividend level is positive and significant for US firms (t
= 4.03) but not for Japanese firms. We expect a positive coefficient if dividends serve a
value-enhancing role, for example by mitigating the agency costs of free cash flow. Because
the dividends paid by most Japanese firms are small, they are less likely to play this role.
We obtain similar results for the Dittmar and Mahrt-Smith (2007) specification. For
US firms, the R-squared is 47.8% while for Japan it is 67.1%, with coefficients on most
variables taking expected signs. Over 1990-2000 the coefficient on cash for US firms is 4.61
(t = 4.33) compared to 1.41 (t = 6.87) for Japanese firms, numbers that are reliably different
at better than 1% (t = 3.07). The coefficient on cash for Japanese firms increases by 0.51 in
2001-2007, with the increase significant at the 5% level (t = 2.00). Once again, the
coefficient on dividends is positive for US (t = 2.85) but not Japanese firms.
6. Summary and Conclusions
We investigate whether the governance practices of Japanese companies, as
manifested in their holdings of cash and payout policy, improve over the past two decades,
and focus in particular in the period since 2000, which represents a regime shift that
improves governance in Japan. While cash holdings are now roughly the same for US and
Japanese companies (and US firms hold more cash and marketable securities), when we
condition on firm characteristics Japanese firms still hold more cash than US firms (even
when we include marketable securities). However, Japanese firms hold 3% to 4% less cash
43 These results are robust to a specification that replaces cash with the change in cash as well as to the use of a non-matched sample that includes all available firm/years. We have also estimated these models using annual cross-sections by country (after omitting the period dummy). The coefficients on cash are always larger for US than Japanese firms over 1990 to 2000 (differences are statistically significant in all but one year), and with the differences noticeably smaller (and significant in only three years) over 2001-2007.
43
(as a fraction of assets) than in the 1990s and collectively have substantially increased their
payout to shareholders since the late 1990s.
Consistent with the idea that improvements in governance manifest themselves in
lower cash, there is an inverse relation between changes in the (excess) cash holdings of
Japanese firms and improvements in their performance since 2000.
Ownership characteristics generally associated with good governance, such as foreign
and managerial ownership, increase after 2000, while the influence of financial institutions,
including those within keiretsu, declines. We show that these changes are related to
improvements in firm performance, as well as to changes in excess cash holdings and payout
policy, in ways we might expect if they are picking up the relevant attributes of governance.
The market valuation of cash differs significantly for Japanese and US firms. In the 1990s,
when governance in Japan is relatively poor, the market valuation of cash is lower for
Japanese firms compared to their US counterparts, consistent with market participants
discounting their cash holdings due to concerns about governance. These differences
disappear after 2000, consistent with improved governance in Japan.
Our findings support two broad conclusions. First, governance practices in the
average Japanese firm, as manifested in their management of cash holdings and payouts to
shareholders, improve since the 1990s. There is evidence that Japanese firms that pay both
dividends and repurchases now distribute substantial amounts of cash to shareholders on a
regular basis. Second, Japanese firms that improve their management of cash and/or
increase payouts enjoy improved performance. These changes are linked to changes in the
ownership characteristics of Japanese firms in ways consistent with them being driven by
improvements in governance.
44
This evidence offers hope that additional improvements in the governance of
Japanese companies can further improve corporate performance and perhaps help reboot
private sector economic performance, an important part of the Abe Government’s plan for
pulling Japan out of its longstanding economic malaise. Given the recent interest of Chinese
regulators in governance reforms, as well as similar governance problems in India and
Korea, our findings have implications that go well beyond Japan.
45
Appendix A: Variable definitions
Size = natural log of total assets
Leverage = ratio of long-term debt to total assets
ROE = net income deflated by lagged shareholders’ equity
ROA = EBIT deflated by lagged total assets
Tobin’s Q = (Total assets – book value of equity + market value of equity) deflated by total
assets.
Net working capital = current assets minus current liabilities minus cash plus short term
loans deflated by total assets
R&D = research and development expenditures deflated by sales
Capital expenditures = capital expenditures deflated by total assets
Cash flow = funds from operations deflated by total assets
Industry sigma = following Bates et al. (2009), we construct industry sigma as the mean of
the standard deviations of EBIT/assets over the past 10 years for firms in a given industry.
We define industry using the industry group variable (WC06011) from WorldScope. We use a
three-digit code for miscellaneous industry and two-digit codes for all other industries.
46
Appendix B: Repurchases in Japan: Institutional details and measurement
Beginning in 1994, Japan gradually lifted restrictions on firms’ ability to repurchase
shares. In 1994, Japan modified the law to allow repurchases but only by permanently
retiring shares using retained earnings. However, because of uncertainty about the tax
treatment of such retirements, managers did not actually use this method until November
1995.44
The special law for stock retirement in June 1997 further liberalized the rules for
stock repurchases by removing restrictions over their timing. Under the 1994 regime, firms
could only consider plans to make repurchases once a year, at the annual shareholders’
meeting, and these plans were subject to shareholder approval. Under the special law, once
managers obtained approval from shareholders to set up a maximum amount and number of
shares for repurchases in the corporate articles, managers could then make repurchases
decisions (amount and timing) without shareholder approval. The subsequent amendment
of this special law in 1998 and the enactment of the law for evaluation of land in 1999
expanded the components of shareholders’ equity that were available to fund repurchases:
the former included legal capital surplus; the latter added revaluation reserves from land.45
Related laws liberalized firms’ ability to make repurchased shares available for management
incentive compensation, including stock options.
44 The Japanese Tax Code treats repurchases as a return of net assets to shareholders, that is, the payment is a combination of contributed capital and retained earnings. Similar to the tax treatment of dividends, the Tax Code could recognize that part of the payout corresponding to retained earnings as taxable income. As a result, shareholders receiving cash from such repurchases would pay both capital gains and income taxes, effectively being taxed twice. Because of this treatment, in June 1995, the Japanese tax office announced its intention to exclude repurchases by listed firms from dividend taxation. The corresponding amendment of the Tax Code was enacted in November 1995. 45 In general, Japanese law (Commercial Code) has very detailed restrictions regarding firms’ ability to make dividends and repurchases that are based on various components of shareholders’ equity. These restrictions are similar in spirit to corporate laws in US states, as well as debt covenants in loan agreements, that typically restrict firms’ ability to pay dividends to retained earnings or some fraction thereof. The difference is that Japanese legal and accounting practices mean that Japanese firms have numerous categories of capital, retained earnings, and reserves within shareholders’ equity on the balance sheet.
47
The 2001 modified Commercial Code further expanded firms’ ability to make
repurchases. First, for the first time the treasury stock method was permitted. Second,
minimum capital restrictions over firms’ ability to pay out cash as either dividends or
repurchases were relaxed. Under the previous law, firms with insufficient capital needed to
increase legal retained earnings before making payouts. Under the modified law, firms for
which the sum of legal retained earnings and legal capital surplus, instead of legal retained
earnings alone, exceeded one quarter of capital stock were exempt from this requirement.
Third, firms that met the above capital requirements could reduce the excess portion of the
legal capital surplus and add it to retained earnings. Previously, the reduction in legal capital
surplus was admitted either to offset loss carry forwards or to increase in capital stock.
Further legal changes in 2006 effectively lifted all remaining restrictions on managers’
ability to return cash to shareholders, including repurchases.
Most of the data we use for the study are from Worldscope. However, Worldscope does
not separate purchases and sales of common and preferred stock, making it difficult to
properly measure repurchases. Consequently, we measure repurchases for Japanese firms
using data from Nikkei Quick that covers the relevant corporate news releases, supplemented
as necessary by data drawn directly from firms’ financial statements (managers of Japanese
firms report repurchases in disclosures that are required under the securities laws and by the
stock exchanges).
48
REFERENCES Aggarwal, R., I. Erel, R. Stulz, and R. Williamson. 2008. Differences in governance
practices between US and foreign firms: Measurement, causes, and consequences. Review of Financial Studies 22: 3131-3169.
Araki, T. 2005. Corporate governance reforms, labor law developments, and the future of
Japan’s practice-dependent stakeholder model. Japan Labor Law Review 2: 26-57. Aoyagi, C., and G. Ganelli. 2014. Unstash the cash! Corporate governance reform in Japan.
IMF working paper, August. Aoki, M., H. Patrick, and P. Sheard. 1994. The Japanese Main Bank System: An
Introductory Overview. In The Japanese Main Bank System. Masahiko Aoki and Hugh Patrick (eds.), Oxford University Press.
Bates, T. W., K. M. Kahle, and R. M. Stulz. 2009. Why do US firms hold so much more
cash than they used to? Journal of Finance 64: 1985-2021. Becht, M., J. Franks, L. Mayer, and H. Wagner. 2015. The returns to hedge fund activism:
An international study. Working paper, January. Available at http://papers.ssrn.com/sol3/papers.cfm?abstract_id=2376271.
Bertrand, M., P. Mehta, and S. Mullainathan. 2002. Ferreting out tunneling: An application
to Indian business groups. Quarterly Journal of Economics 117: 121-148. Brav, A., J. R. Graham, C. R. Harvey, and R. Michaely. 2005. Payout policy in the 21st
century. Journal of Financial Economics 77: 483-528. Brav, A., W. Jiang, and H. Kim. 2010. Hedge fund activism: A review. Foundations and
Trends in Finance 4: 185-246. Brav, A., W. Jiang, Partnoy, and Thomas. 2008. Hedge fund activism, corporate
governance, and firm performance. Journal of Finance 63: 1729-1775. Buchanan, J., D. H. Chai, and S. Deakin. 2012. Hedge fund activism in Japan: the limits of
shareholder primacy. Cambridge University Press, Cambridge, UK. Chen, Q., Chen, X., Schipper, K., Xu, Y., and J. Xue. 2012. The sensitivity of corporate
cash holdings to corporate governance. Review of Financial Studies 25: 3610-3644. DeAngelo, H., L. DeAngelo, and D. J. Skinner. 2004. Are dividends disappearing?
Dividend concentration and the consolidation of earnings. Journal of Financial Economics 72: 425-456.
DeAngelo, H., L. DeAngelo, and D. J. Skinner. 2008. Corporate Payout Policy. Foundations
and Trends in Finance 3: 95-287.
49
Denis, D. J., and I. Osobov. 2008. Why do firms pay dividends? International evidence on the determinants of dividend policy. Journal of Financial Economics 89: 62-82.
Dewenter, K. L., and V. A. Warther. 1998. Dividends, asymmetric information, and agency
conflicts: Evidence from a comparison of the dividend policies of Japanese and US firms. Journal of Finance 53: 879-904.
Dittmar, A., and J. Mahrt-Smith. 2007. Corporate governance and the value of cash
holdings. Journal of Financial Economics 83: 599-634. Dittmar, A., J. Mahrt-Smith, and H. Servaes. 2003. International corporate governance and
corporate cash holdings. Journal of Financial and Quantitative Analysis 38: 111-133. Doidge, C., G. A. Karolyi, and R. M. Stulz. 2004. Why are foreign firms listed in the US
worth more? Journal of Financial Economics 71: 205-238. Fama, E. F., and H. Babiak. 1968. Dividend policy: An empirical analysis. Journal of the
American Statistical Association 63: 1132-1161. Fama, E., French, K., 1998. Taxes, financing decisions, and firm value. Journal of Finance 53,
819–843. Fama, E. F., and K. R. French. 2001. Disappearing dividends: Changing firm characteristics
or lower propensity to pay? Journal of Financial Economics 60: 3-43. Fama, E. F., and K. R. French. 2004. New lists: Fundamentals and survival rates. Journal of
Financial Economics 73: 229-269. Floyd, E., N. Li, and D. J. Skinner. 2015. Payout policy through the financial crisis: The
growth of repurchases and the resilience of dividends. Journal of Financial Economics 118: 299-316.
French, K.R., and J.M. Poterba. 1991. Were Japanese stock prices too high? Journal of
Financial Economics 29: 337-363. Fukao, M. 2003. Japan’s Lost Decade and its Financial System. The World Economy Vol. 26
No. 3. March 2003: 365-384. Gilson, R. J., and C. J. Milhaupt. 2005. Choice as regulatory reform: The case of Japanese
corporate governance. American Journal of Comparative Law 53: 343-377. Grullon, G., and R. Michaely. 2002. Dividends, share repurchases and the substitution
hypothesis. Journal of Finance 57: 1649-1684. Hamao, Y., K. Kutsuna, and P. Matos. 2011. U.S.-style activism in Japan: The first ten
years. Working paper, USC and Kobe University. February 5. Available at http://papers.ssrn.com/sol3/papers.cfm?abstract_id=1785281.
50
Hayn, C., 1995. The information content of losses. Journal of Accounting and Economics 20: 125-153.
Hoshi, T., and A. K. Kashyap. 2001. Corporate Financing and Governance in Japan: The Road to
the Future. Cambridge, Mass.: The MIT Press. Hoshi, T., A. Kashyap, and D. Scharfstein. 1990. The role of banks in reducing the costs of
financial distress in Japan. Journal of Financial Economics 27: 67-88. Jensen, M.C. 1986. Agency costs of free cash flow, corporate finance, and takeovers.
American Economic Review 76: 323-329. Kalcheva, I., and K. V. Lins. 2007. International evidence on cash holdings and expected
agency problems. Review of Financial Studies 20: 1087-1112. Kang, J., A. Shivdasani, T. Yamada. 2000. The effect of bank relations on investment
decisions: An investigation of Japanese takeover bids. Journal of Finance 55: 2197-2218.
Kaplan, S. N. 1994. Top executive rewards and firm performance: A comparison of Japan
and the US Journal of Political Economy 102: 510-548. Khanna, T., and K. Palepu. 2000. Is group affiliation profitable in emerging markets? An
analysis of diversified Indian business groups. Journal of Finance 55: 867-891. Klein, A., and C. Marquardt. 2006. Fundamentals of Accounting Losses, The Accounting
Review 81: 179-206. Klein, A., and E. Zur. 2009. Entrepreneurial shareholder activism: Hedge funds and other
private investors. Journal of Finance 64: 187-229. Larcker, D., S. Richardson, I. Tuna. 2007. Corporate governance, accounting outcomes, and
organizational performance. The Accounting Review 82: 963-1008. LaPorta, R., F. Lopez-de-Silanes, A. Shleifer, and R.W. Vishny. 2000. Agency problems and
dividend policies around the world. Journal of Finance 55: 1-33. Lee, E., and R. Powell. 2011. Excess cash holdings and shareholder value. Accounting and
Finance 51: 549-574. Milhaupt, C.J. 2006. A lost decade for Japanese corporate governance reform? What’s
changed, what hasn’t, and why. In: M. Blomstrom and S. LaCroix (eds.). Institutional Change in Japan. Routledge, 2006.
Miyajima, H., and F. Kuroki. 2007. The unwinding of cross-shareholding in Japan: Causes,
effects, and implications. In M. Aoki, G. Jackson, and H. Miyajima (eds). Corporate governance in Japan: Institutional change and organizational diversity. Oxford University Press.
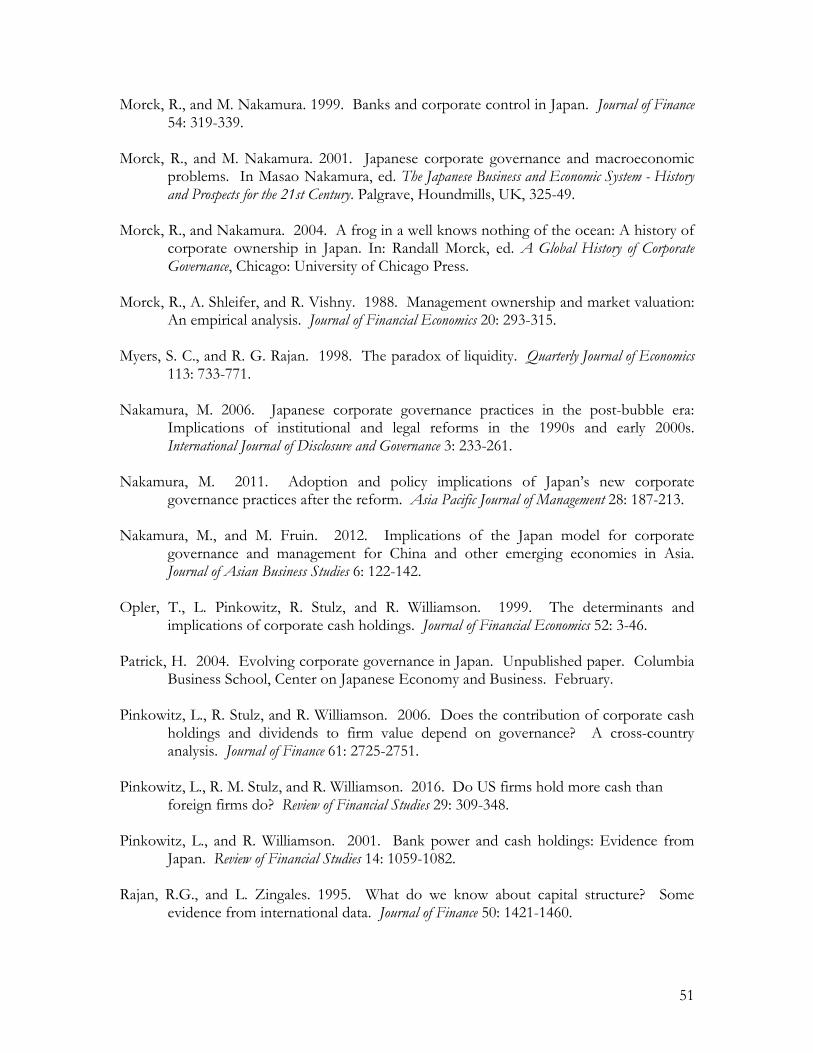
51
Morck, R., and M. Nakamura. 1999. Banks and corporate control in Japan. Journal of Finance 54: 319-339.
Morck, R., and M. Nakamura. 2001. Japanese corporate governance and macroeconomic
problems. In Masao Nakamura, ed. The Japanese Business and Economic System - History and Prospects for the 21st Century. Palgrave, Houndmills, UK, 325-49.
Morck, R., and Nakamura. 2004. A frog in a well knows nothing of the ocean: A history of
corporate ownership in Japan. In: Randall Morck, ed. A Global History of Corporate Governance, Chicago: University of Chicago Press.
Morck, R., A. Shleifer, and R. Vishny. 1988. Management ownership and market valuation:
An empirical analysis. Journal of Financial Economics 20: 293-315. Myers, S. C., and R. G. Rajan. 1998. The paradox of liquidity. Quarterly Journal of Economics
113: 733-771. Nakamura, M. 2006. Japanese corporate governance practices in the post-bubble era:
Implications of institutional and legal reforms in the 1990s and early 2000s. International Journal of Disclosure and Governance 3: 233-261.
Nakamura, M. 2011. Adoption and policy implications of Japan’s new corporate
governance practices after the reform. Asia Pacific Journal of Management 28: 187-213. Nakamura, M., and M. Fruin. 2012. Implications of the Japan model for corporate
governance and management for China and other emerging economies in Asia. Journal of Asian Business Studies 6: 122-142.
Opler, T., L. Pinkowitz, R. Stulz, and R. Williamson. 1999. The determinants and
implications of corporate cash holdings. Journal of Financial Economics 52: 3-46. Patrick, H. 2004. Evolving corporate governance in Japan. Unpublished paper. Columbia
Business School, Center on Japanese Economy and Business. February. Pinkowitz, L., R. Stulz, and R. Williamson. 2006. Does the contribution of corporate cash
holdings and dividends to firm value depend on governance? A cross-country analysis. Journal of Finance 61: 2725-2751.
Pinkowitz, L., R. M. Stulz, and R. Williamson. 2016. Do US firms hold more cash than
foreign firms do? Review of Financial Studies 29: 309-348. Pinkowitz, L., and R. Williamson. 2001. Bank power and cash holdings: Evidence from
Japan. Review of Financial Studies 14: 1059-1082. Rajan, R.G., and L. Zingales. 1995. What do we know about capital structure? Some
evidence from international data. Journal of Finance 50: 1421-1460.
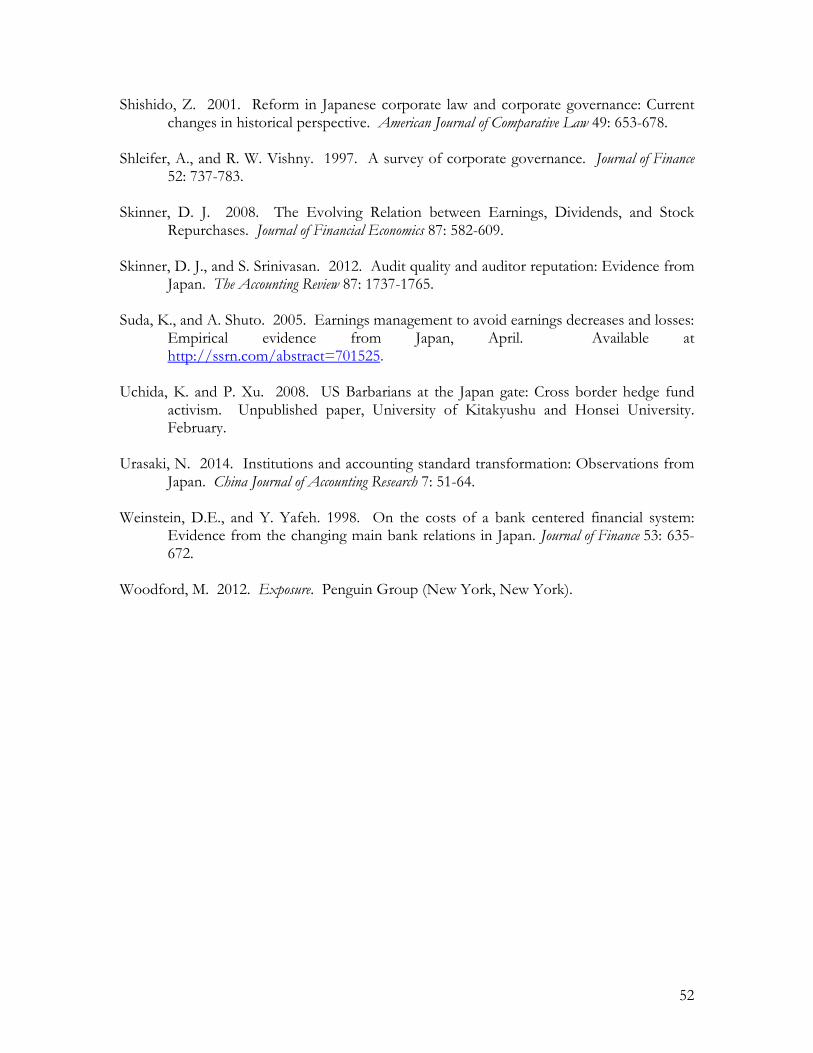
52
Shishido, Z. 2001. Reform in Japanese corporate law and corporate governance: Current changes in historical perspective. American Journal of Comparative Law 49: 653-678.
Shleifer, A., and R. W. Vishny. 1997. A survey of corporate governance. Journal of Finance
52: 737-783. Skinner, D. J. 2008. The Evolving Relation between Earnings, Dividends, and Stock
Repurchases. Journal of Financial Economics 87: 582-609. Skinner, D. J., and S. Srinivasan. 2012. Audit quality and auditor reputation: Evidence from
Japan. The Accounting Review 87: 1737-1765. Suda, K., and A. Shuto. 2005. Earnings management to avoid earnings decreases and losses:
Empirical evidence from Japan, April. Available at http://ssrn.com/abstract=701525.
Uchida, K. and P. Xu. 2008. US Barbarians at the Japan gate: Cross border hedge fund
activism. Unpublished paper, University of Kitakyushu and Honsei University. February.
Urasaki, N. 2014. Institutions and accounting standard transformation: Observations from
Japan. China Journal of Accounting Research 7: 51-64. Weinstein, D.E., and Y. Yafeh. 1998. On the costs of a bank centered financial system:
Evidence from the changing main bank relations in Japan. Journal of Finance 53: 635-672.
Woodford, M. 2012. Exposure. Penguin Group (New York, New York).
53
54
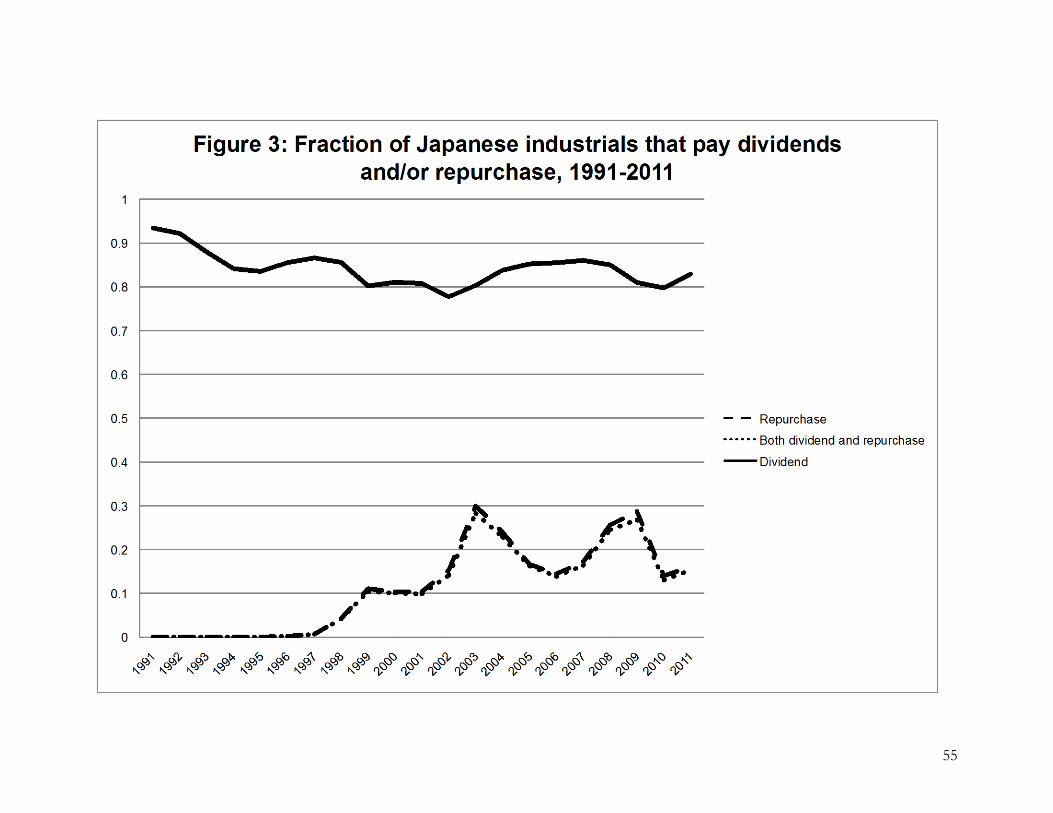
55
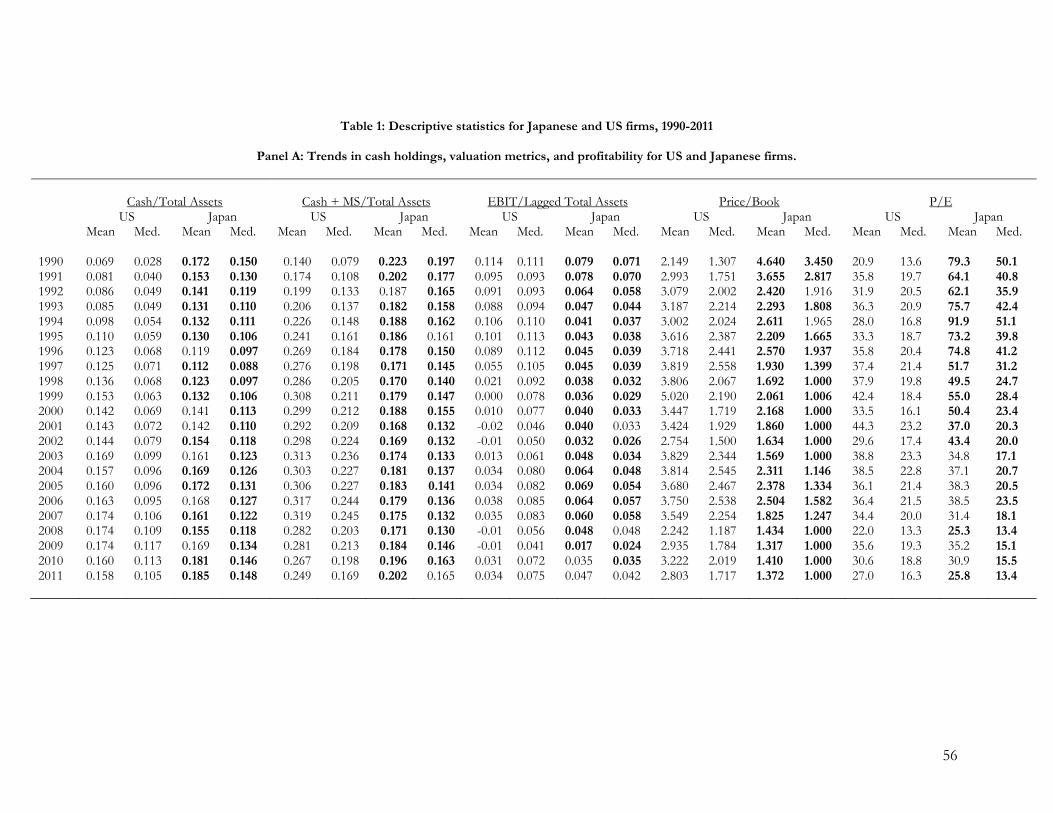
56
Table 1: Descriptive statistics for Japanese and US firms, 1990-2011
Panel A: Trends in cash holdings, valuation metrics, and profitability for US and Japanese firms.
Cash/Total Assets Cash + MS/Total Assets EBIT/Lagged Total Assets Price/Book P/E US Japan US Japan US Japan US Japan US Japan Mean Med. Mean Med. Mean Med. Mean Med. Mean Med. Mean Med. Mean Med. Mean Med. Mean Med. Mean Med. 1990 0.069 0.028 0.172 0.150 0.140 0.079 0.223 0.197 0.114 0.111 0.079 0.071 2.149 1.307 4.640 3.450 20.9 13.6 79.3 50.1 1991 0.081 0.040 0.153 0.130 0.174 0.108 0.202 0.177 0.095 0.093 0.078 0.070 2.993 1.751 3.655 2.817 35.8 19.7 64.1 40.8 1992 0.086 0.049 0.141 0.119 0.199 0.133 0.187 0.165 0.091 0.093 0.064 0.058 3.079 2.002 2.420 1.916 31.9 20.5 62.1 35.9 1993 0.085 0.049 0.131 0.110 0.206 0.137 0.182 0.158 0.088 0.094 0.047 0.044 3.187 2.214 2.293 1.808 36.3 20.9 75.7 42.4 1994 0.098 0.054 0.132 0.111 0.226 0.148 0.188 0.162 0.106 0.110 0.041 0.037 3.002 2.024 2.611 1.965 28.0 16.8 91.9 51.1 1995 0.110 0.059 0.130 0.106 0.241 0.161 0.186 0.161 0.101 0.113 0.043 0.038 3.616 2.387 2.209 1.665 33.3 18.7 73.2 39.8 1996 0.123 0.068 0.119 0.097 0.269 0.184 0.178 0.150 0.089 0.112 0.045 0.039 3.718 2.441 2.570 1.937 35.8 20.4 74.8 41.2 1997 0.125 0.071 0.112 0.088 0.276 0.198 0.171 0.145 0.055 0.105 0.045 0.039 3.819 2.558 1.930 1.399 37.4 21.4 51.7 31.2 1998 0.136 0.068 0.123 0.097 0.286 0.205 0.170 0.140 0.021 0.092 0.038 0.032 3.806 2.067 1.692 1.000 37.9 19.8 49.5 24.7 1999 0.153 0.063 0.132 0.106 0.308 0.211 0.179 0.147 0.000 0.078 0.036 0.029 5.020 2.190 2.061 1.006 42.4 18.4 55.0 28.4 2000 0.142 0.069 0.141 0.113 0.299 0.212 0.188 0.155 0.010 0.077 0.040 0.033 3.447 1.719 2.168 1.000 33.5 16.1 50.4 23.4 2001 0.143 0.072 0.142 0.110 0.292 0.209 0.168 0.132 -0.02 0.046 0.040 0.033 3.424 1.929 1.860 1.000 44.3 23.2 37.0 20.3 2002 0.144 0.079 0.154 0.118 0.298 0.224 0.169 0.132 -0.01 0.050 0.032 0.026 2.754 1.500 1.634 1.000 29.6 17.4 43.4 20.0 2003 0.169 0.099 0.161 0.123 0.313 0.236 0.174 0.133 0.013 0.061 0.048 0.034 3.829 2.344 1.569 1.000 38.8 23.3 34.8 17.1 2004 0.157 0.096 0.169 0.126 0.303 0.227 0.181 0.137 0.034 0.080 0.064 0.048 3.814 2.545 2.311 1.146 38.5 22.8 37.1 20.7 2005 0.160 0.096 0.172 0.131 0.306 0.227 0.183 0.141 0.034 0.082 0.069 0.054 3.680 2.467 2.378 1.334 36.1 21.4 38.3 20.5 2006 0.163 0.095 0.168 0.127 0.317 0.244 0.179 0.136 0.038 0.085 0.064 0.057 3.750 2.538 2.504 1.582 36.4 21.5 38.5 23.5 2007 0.174 0.106 0.161 0.122 0.319 0.245 0.175 0.132 0.035 0.083 0.060 0.058 3.549 2.254 1.825 1.247 34.4 20.0 31.4 18.1 2008 0.174 0.109 0.155 0.118 0.282 0.203 0.171 0.130 -0.01 0.056 0.048 0.048 2.242 1.187 1.434 1.000 22.0 13.3 25.3 13.4 2009 0.174 0.117 0.169 0.134 0.281 0.213 0.184 0.146 -0.01 0.041 0.017 0.024 2.935 1.784 1.317 1.000 35.6 19.3 35.2 15.1 2010 0.160 0.113 0.181 0.146 0.267 0.198 0.196 0.163 0.031 0.072 0.035 0.035 3.222 2.019 1.410 1.000 30.6 18.8 30.9 15.5 2011 0.158 0.105 0.185 0.148 0.249 0.169 0.202 0.165 0.034 0.075 0.047 0.042 2.803 1.717 1.372 1.000 27.0 16.3 25.8 13.4
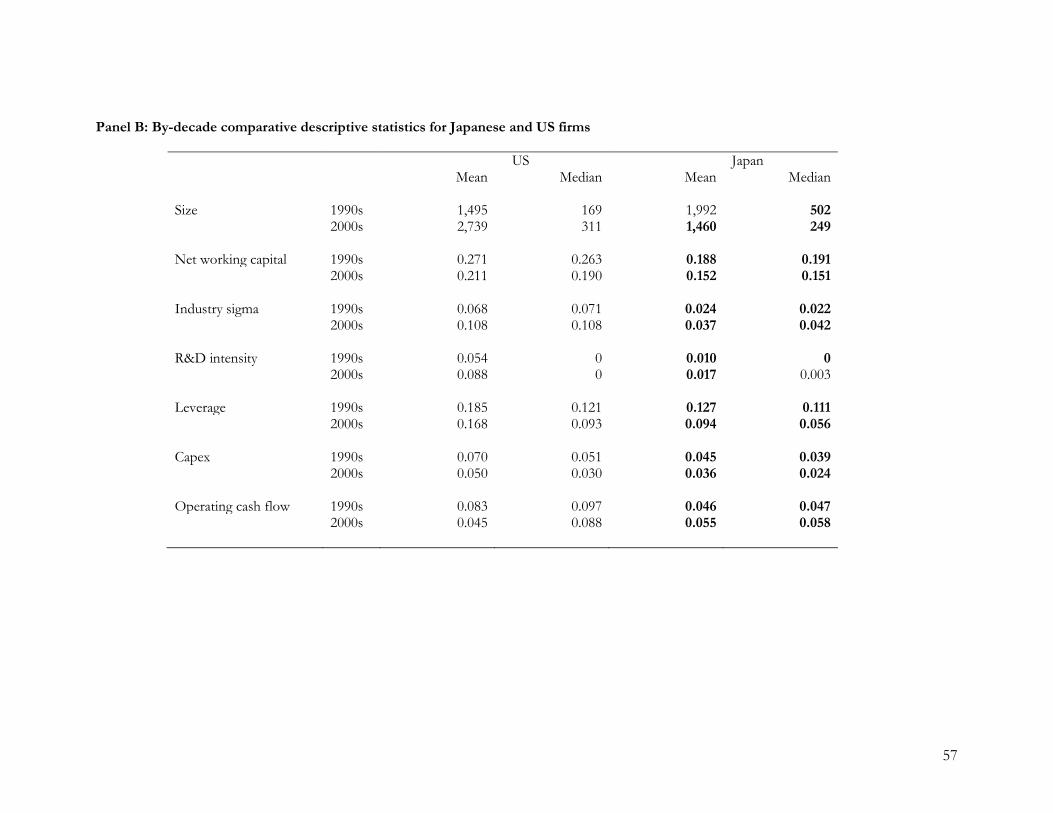
57
Panel B: By-decade comparative descriptive statistics for Japanese and US firms
US Japan Mean Median Mean Median Size 1990s 1,495 169 1,992 502 2000s 2,739 311 1,460 249 Net working capital 1990s 0.271 0.263 0.188 0.191 2000s 0.211 0.190 0.152 0.151 Industry sigma 1990s 0.068 0.071 0.024 0.022 2000s 0.108 0.108 0.037 0.042 R&D intensity 1990s 0.054 0 0.010 0 2000s 0.088 0 0.017 0.003 Leverage 1990s 0.185 0.121 0.127 0.111 2000s 0.168 0.093 0.094 0.056 Capex 1990s 0.070 0.051 0.045 0.039 2000s 0.050 0.030 0.036 0.024 Operating cash flow 1990s 0.083 0.097 0.046 0.047 2000s 0.045 0.088 0.055 0.058
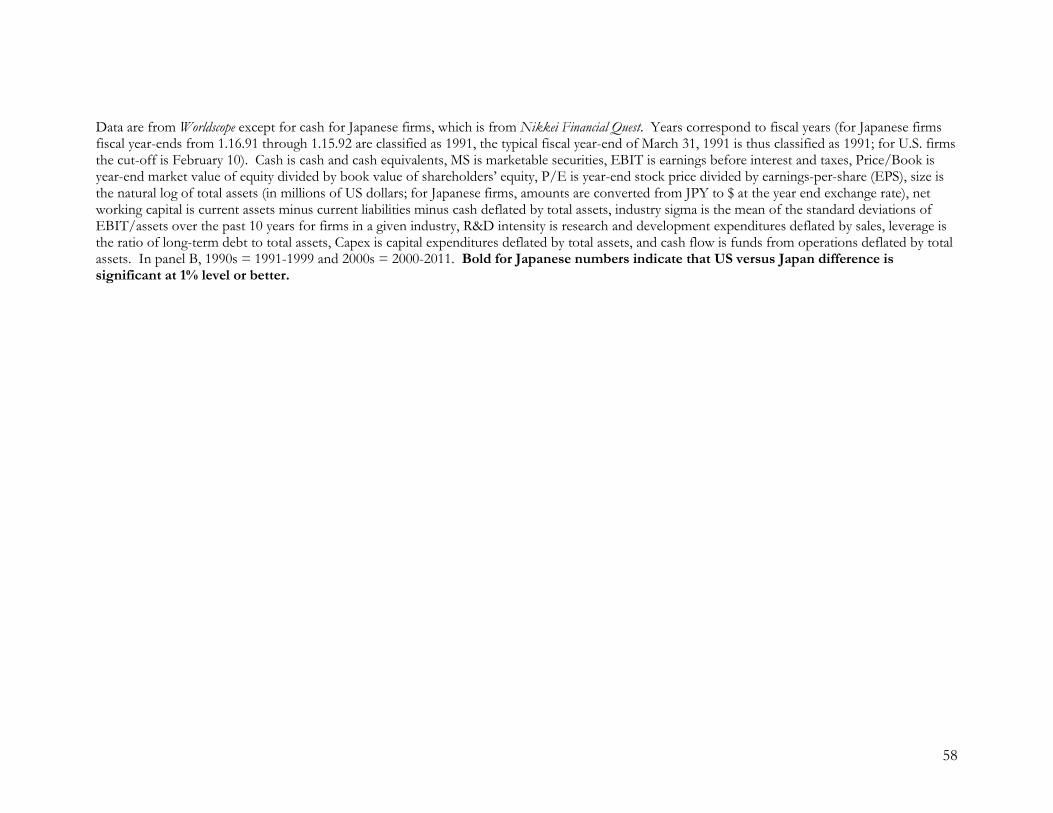
58
Data are from Worldscope except for cash for Japanese firms, which is from Nikkei Financial Quest. Years correspond to fiscal years (for Japanese firms fiscal year-ends from 1.16.91 through 1.15.92 are classified as 1991, the typical fiscal year-end of March 31, 1991 is thus classified as 1991; for U.S. firms the cut-off is February 10). Cash is cash and cash equivalents, MS is marketable securities, EBIT is earnings before interest and taxes, Price/Book is year-end market value of equity divided by book value of shareholders’ equity, P/E is year-end stock price divided by earnings-per-share (EPS), size is the natural log of total assets (in millions of US dollars; for Japanese firms, amounts are converted from JPY to $ at the year end exchange rate), net working capital is current assets minus current liabilities minus cash deflated by total assets, industry sigma is the mean of the standard deviations of EBIT/assets over the past 10 years for firms in a given industry, R&D intensity is research and development expenditures deflated by sales, leverage is the ratio of long-term debt to total assets, Capex is capital expenditures deflated by total assets, and cash flow is funds from operations deflated by total assets. In panel B, 1990s = 1991-1999 and 2000s = 2000-2011. Bold for Japanese numbers indicate that US versus Japan difference is significant at 1% level or better.

59
Table 2: OLS regressions of cash holdings on predicted determinants for U.S. and Japanese non-financial firms, 1990-2011. Panel A: Panel regressions estimated separately for U.S. and Japanese firms U.S.:
1990-2011 U.S.:
1990-1999 U.S.:
2000-2011 Japan:
1990-2011 Japan:
1990-1999 Japan:
2000-2011 Int. 0.236**
(0.009) 0.205** (0.010)
0.244** (0.011)
0.359** (0.028)
0.190** (0.025)
0.359** (0.017)
Year 2001-2007 -0.001 (0.004)
-0.034** (0.011)
Year 2008-2011 0.001 (0.005)
-0.034** (0.013)
Size -0.013** (0.001)
-0.011** (0.001)
-0.014** (0.001)
-0.019** (0.002)
-0.004* (0.002)
-0.023** (0.001)
Div. pay dummy -0.026** (0.004)
-0.036** (0.004)
-0.017** (0.004)
0.008* (0.004)
0.018** (0.004)
0.005 (0.005)
Leverage -0.182** (0.007)
-0.177** (0.011)
-0.182** (0.009)
-0.183** (0.018)
-0.090** (0.036)
-0.210** (0.017)
ROE 0.021** (0.004)
0.015** (0.006)
0.022** (0.006)
0.040** (0.006)
0.028** (0.011)
0.039** (0.006)
Loss dummy -0.000 (0.003)
0.001 (0.005)
-0.001 (0.004)
0.001 (0.003)
-0.008 (0.006)
0.003 (0.003)
Market/Book 0.003** (0.000)
0.003** (0.000)
0.003** (0.000)
0.006** (0.001)
0.002* (0.001)
0.007** (0.001)
Ind. Sigma 0.578** (0.045)
0.742** (0.109)
0.557** (0.044)
1.817** (0.196)
0.556 (0.371)
1.934** (0.180)
Net WC -0.239** (0.009)
-0.213** (0.016)
-0.249** (0.010)
-0.223** (0.012)
-0.197** (0.027)
-0.225** (0.012)
R&D 0.132** (0.011)
0.119** (0.018)
0.136** (0.013)
0.504** (0.045)
0.475** (0.114)
0.488** (0.047)
Capex -0.326** (0.022)
-0.315** (0.030)
-0.328** (0.028)
-0.532** (0.037)
-0.451** (0.095)
-0.549** (0.036)
Cash Flow -0.045** (0.013)
-0.023 (0.012)
-0.051** (0.016)
0.114** (0.023)
0.176 (0.102)
0.124** (0.0223)
Obs. 36,521 13,262 23,259 37,322 5,464 31,858 Adj. R-square 0.342 0.319 0.329 0.294 0.165 0.316
The dependent variable is cash/total assets. Size is the natural log of total assets, leverage is ratio of long-term debt to total assets, ROE is net income deflated by lagged stockholders’ equity, net working capital is current assets minus current liabilities minus cash deflated by total assets, R&D is research and development expenditures deflated by sales, capital expenditures is capital expenditures deflated by total assets, and cash flow is funds from operations deflated by total assets. The dividend-payer dummy is set to 1 for dividend-payers and 0 otherwise. The loss dummy is set to 1 for firms with negative net income and 0 otherwise. We construct industry sigma as the mean of the standard deviations of EBIT/assets over the past 10 years for firms in a given industry. We define industry by using industry group variable (WC06011) from WorldScope. We use three-digit code for miscellaneous industry and two-digit code for all other industries. Two-way clustered standard errors in parentheses. ** (*) denotes statistical significant at the 1% (5%) level.
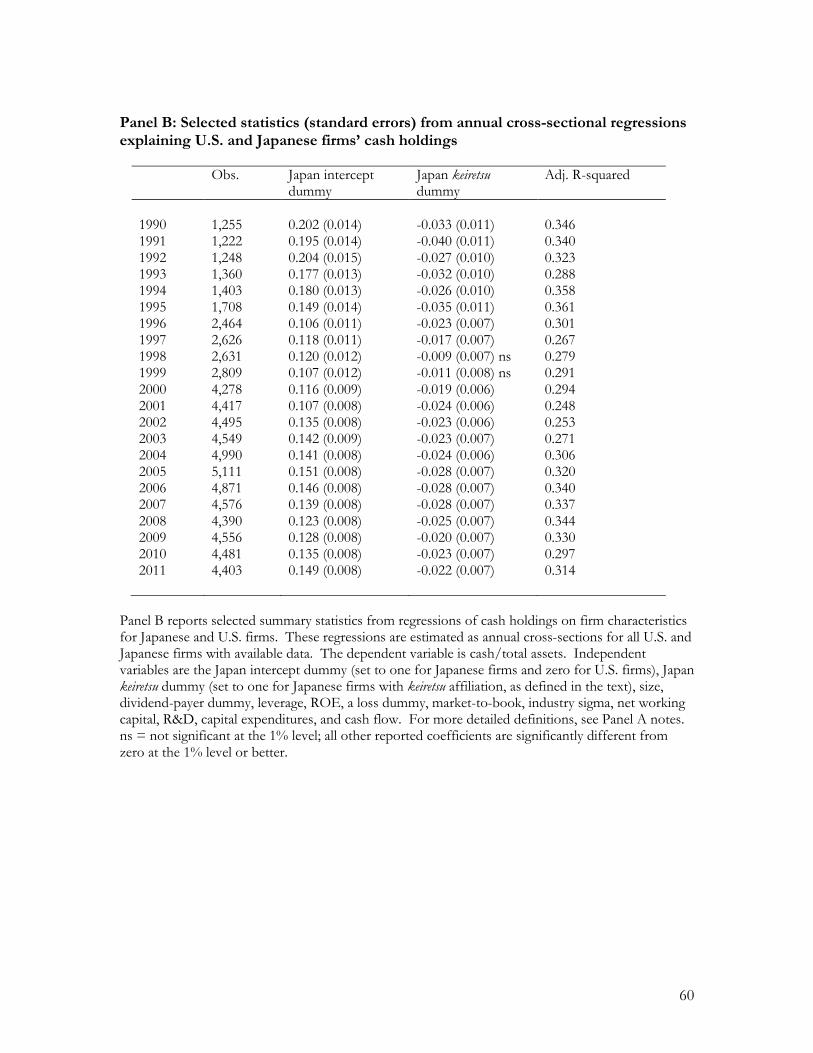
60
Panel B: Selected statistics (standard errors) from annual cross-sectional regressions explaining U.S. and Japanese firms’ cash holdings
Obs. Japan intercept
dummy Japan keiretsu dummy
Adj. R-squared
1990 1,255 0.202 (0.014) -0.033 (0.011) 0.346 1991 1,222 0.195 (0.014) -0.040 (0.011) 0.340 1992 1,248 0.204 (0.015) -0.027 (0.010) 0.323 1993 1,360 0.177 (0.013) -0.032 (0.010) 0.288 1994 1,403 0.180 (0.013) -0.026 (0.010) 0.358 1995 1,708 0.149 (0.014) -0.035 (0.011) 0.361 1996 2,464 0.106 (0.011) -0.023 (0.007) 0.301 1997 2,626 0.118 (0.011) -0.017 (0.007) 0.267 1998 2,631 0.120 (0.012) -0.009 (0.007) ns 0.279 1999 2,809 0.107 (0.012) -0.011 (0.008) ns 0.291 2000 4,278 0.116 (0.009) -0.019 (0.006) 0.294 2001 4,417 0.107 (0.008) -0.024 (0.006) 0.248 2002 4,495 0.135 (0.008) -0.023 (0.006) 0.253 2003 4,549 0.142 (0.009) -0.023 (0.007) 0.271 2004 4,990 0.141 (0.008) -0.024 (0.006) 0.306 2005 5,111 0.151 (0.008) -0.028 (0.007) 0.320 2006 4,871 0.146 (0.008) -0.028 (0.007) 0.340 2007 4,576 0.139 (0.008) -0.028 (0.007) 0.337 2008 4,390 0.123 (0.008) -0.025 (0.007) 0.344 2009 4,556 0.128 (0.008) -0.020 (0.007) 0.330 2010 4,481 0.135 (0.008) -0.023 (0.007) 0.297 2011 4,403 0.149 (0.008) -0.022 (0.007) 0.314
Panel B reports selected summary statistics from regressions of cash holdings on firm characteristics for Japanese and U.S. firms. These regressions are estimated as annual cross-sections for all U.S. and Japanese firms with available data. The dependent variable is cash/total assets. Independent variables are the Japan intercept dummy (set to one for Japanese firms and zero for U.S. firms), Japan keiretsu dummy (set to one for Japanese firms with keiretsu affiliation, as defined in the text), size, dividend-payer dummy, leverage, ROE, a loss dummy, market-to-book, industry sigma, net working capital, R&D, capital expenditures, and cash flow. For more detailed definitions, see Panel A notes. ns = not significant at the 1% level; all other reported coefficients are significantly different from zero at the 1% level or better.
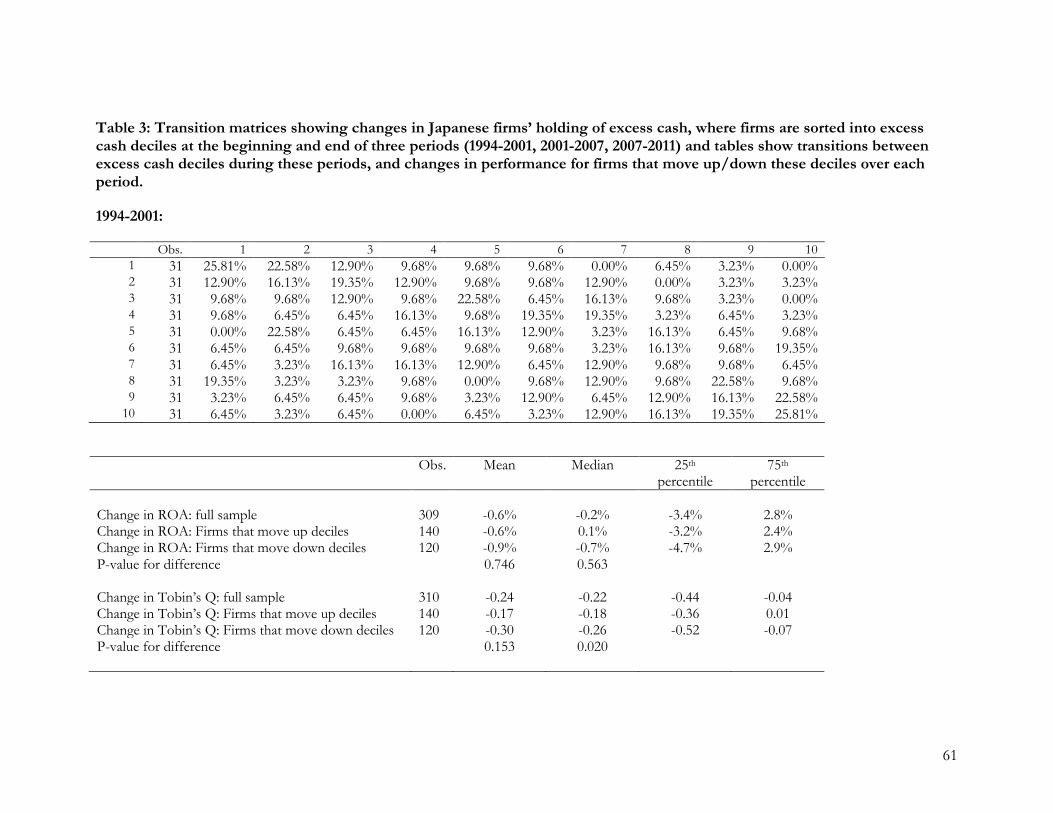
61
Table 3: Transition matrices showing changes in Japanese firms’ holding of excess cash, where firms are sorted into excess cash deciles at the beginning and end of three periods (1994-2001, 2001-2007, 2007-2011) and tables show transitions between excess cash deciles during these periods, and changes in performance for firms that move up/down these deciles over each period. 1994-2001:
Obs. 1 2 3 4 5 6 7 8 9 10 1 31 25.81% 22.58% 12.90% 9.68% 9.68% 9.68% 0.00% 6.45% 3.23% 0.00% 2 31 12.90% 16.13% 19.35% 12.90% 9.68% 9.68% 12.90% 0.00% 3.23% 3.23% 3 31 9.68% 9.68% 12.90% 9.68% 22.58% 6.45% 16.13% 9.68% 3.23% 0.00% 4 31 9.68% 6.45% 6.45% 16.13% 9.68% 19.35% 19.35% 3.23% 6.45% 3.23% 5 31 0.00% 22.58% 6.45% 6.45% 16.13% 12.90% 3.23% 16.13% 6.45% 9.68% 6 31 6.45% 6.45% 9.68% 9.68% 9.68% 9.68% 3.23% 16.13% 9.68% 19.35% 7 31 6.45% 3.23% 16.13% 16.13% 12.90% 6.45% 12.90% 9.68% 9.68% 6.45% 8 31 19.35% 3.23% 3.23% 9.68% 0.00% 9.68% 12.90% 9.68% 22.58% 9.68% 9 31 3.23% 6.45% 6.45% 9.68% 3.23% 12.90% 6.45% 12.90% 16.13% 22.58%
10 31 6.45% 3.23% 6.45% 0.00% 6.45% 3.23% 12.90% 16.13% 19.35% 25.81% Obs. Mean Median 25th
percentile 75th
percentile Change in ROA: full sample 309 -0.6% -0.2% -3.4% 2.8% Change in ROA: Firms that move up deciles 140 -0.6% 0.1% -3.2% 2.4% Change in ROA: Firms that move down deciles 120 -0.9% -0.7% -4.7% 2.9% P-value for difference 0.746 0.563 Change in Tobin’s Q: full sample 310 -0.24 -0.22 -0.44 -0.04 Change in Tobin’s Q: Firms that move up deciles 140 -0.17 -0.18 -0.36 0.01 Change in Tobin’s Q: Firms that move down deciles 120 -0.30 -0.26 -0.52 -0.07 P-value for difference 0.153 0.020
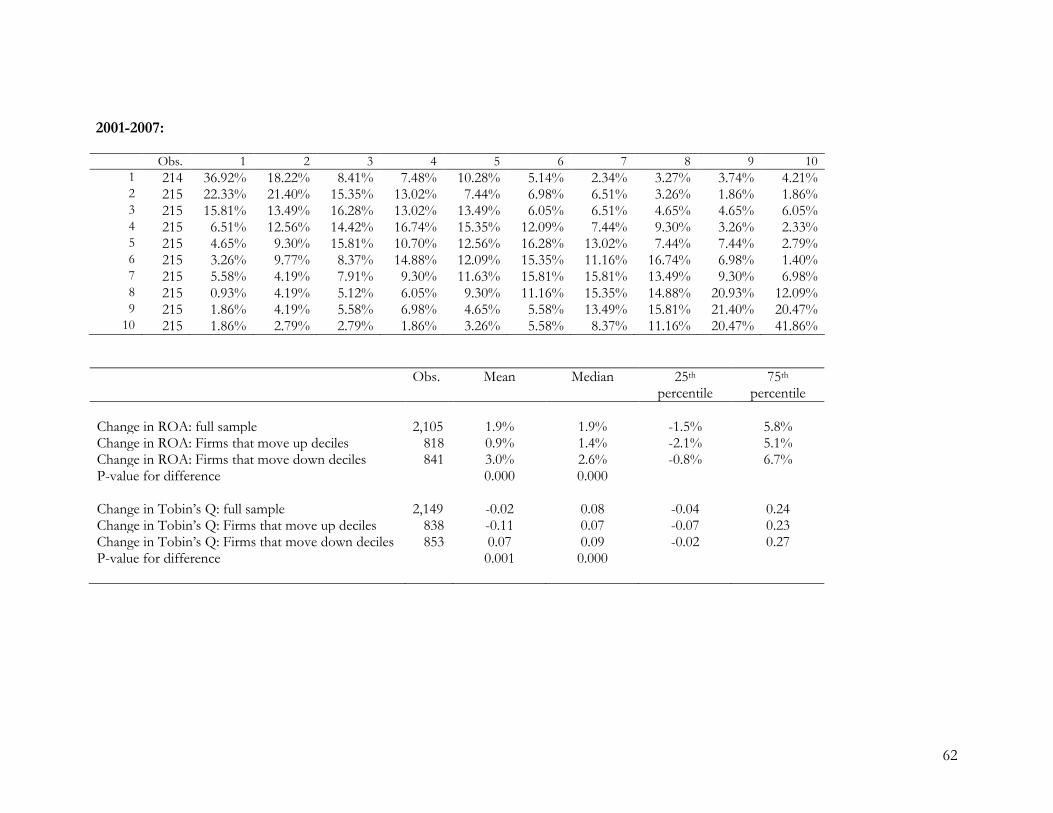
62
2001-2007:
Obs. 1 2 3 4 5 6 7 8 9 10 1 214 36.92% 18.22% 8.41% 7.48% 10.28% 5.14% 2.34% 3.27% 3.74% 4.21% 2 215 22.33% 21.40% 15.35% 13.02% 7.44% 6.98% 6.51% 3.26% 1.86% 1.86% 3 215 15.81% 13.49% 16.28% 13.02% 13.49% 6.05% 6.51% 4.65% 4.65% 6.05% 4 215 6.51% 12.56% 14.42% 16.74% 15.35% 12.09% 7.44% 9.30% 3.26% 2.33% 5 215 4.65% 9.30% 15.81% 10.70% 12.56% 16.28% 13.02% 7.44% 7.44% 2.79% 6 215 3.26% 9.77% 8.37% 14.88% 12.09% 15.35% 11.16% 16.74% 6.98% 1.40% 7 215 5.58% 4.19% 7.91% 9.30% 11.63% 15.81% 15.81% 13.49% 9.30% 6.98% 8 215 0.93% 4.19% 5.12% 6.05% 9.30% 11.16% 15.35% 14.88% 20.93% 12.09% 9 215 1.86% 4.19% 5.58% 6.98% 4.65% 5.58% 13.49% 15.81% 21.40% 20.47%
10 215 1.86% 2.79% 2.79% 1.86% 3.26% 5.58% 8.37% 11.16% 20.47% 41.86% Obs. Mean Median 25th
percentile 75th
percentile Change in ROA: full sample 2,105 1.9% 1.9% -1.5% 5.8% Change in ROA: Firms that move up deciles 818 0.9% 1.4% -2.1% 5.1% Change in ROA: Firms that move down deciles 841 3.0% 2.6% -0.8% 6.7% P-value for difference 0.000 0.000 Change in Tobin’s Q: full sample 2,149 -0.02 0.08 -0.04 0.24 Change in Tobin’s Q: Firms that move up deciles 838 -0.11 0.07 -0.07 0.23 Change in Tobin’s Q: Firms that move down deciles 853 0.07 0.09 -0.02 0.27 P-value for difference 0.001 0.000

63
2007-2011:
Obs. 1 2 3 4 5 6 7 8 9 10 1 236 49.58% 23.31% 11.02% 6.36% 2.54% 1.69% 2.12% 0.42% 1.69% 1.27% 2 236 18.64% 25.85% 16.95% 12.71% 11.44% 5.08% 3.81% 2.12% 2.12% 1.27% 3 236 8.05% 18.22% 16.95% 18.64% 12.71% 9.75% 4.66% 5.51% 2.97% 2.54% 4 237 5.06% 13.08% 18.57% 16.46% 16.88% 10.55% 8.44% 6.33% 4.22% 0.42% 5 236 5.51% 5.51% 13.98% 14.83% 13.14% 16.10% 15.25% 8.90% 5.51% 1.27% 6 236 4.24% 4.24% 8.90% 11.02% 13.56% 15.68% 19.07% 10.59% 8.47% 4.24% 7 237 3.38% 4.64% 4.64% 10.55% 8.86% 16.03% 14.77% 18.57% 11.81% 6.75% 8 236 1.27% 1.69% 2.97% 5.08% 9.75% 13.56% 18.22% 22.88% 17.37% 7.20% 9 236 2.12% 1.27% 2.97% 1.69% 8.47% 6.78% 8.05% 17.80% 30.08% 20.76%
10 237 2.11% 2.11% 2.95% 2.95% 2.53% 4.64% 5.91% 6.75% 15.61% 54.43% Obs. Mean Median 25th
percentile 75th
percentile Change in ROA: full sample 2,292 -1.9% -1.7% -4.8% 1.1% Change in ROA: Firms that move up deciles 875 -2.0% -1.7% -4.8% 1.0% Change in ROA: Firms that move down deciles 829 -1.2% -1.2% -4.4% 1.5% P-value for difference 0.064 0.078 Change in Tobin’s Q: full sample 2,363 -0.32 -0.20 -0.40 -0.09 Change in Tobin’s Q: Firms that move up deciles 901 -0.33 -0.22 -0.41 -0.10 Change in Tobin’s Q: Firms that move down deciles 848 -0.28 -0.18 -0.37 -0.07 P-value for difference 0.063 0.000 For each year (beginning and end of each of the three periods), observations are sorted into deciles based on excess cash. Excess cash is measured using the fitted residuals from the same type of cash holdings regressions described in Table 2, Panel A, estimated for the 1990s and 2000s separately. The cells of the matrices report the number of firms in a given excess cash row/column at the beginning/end of each period, expressed as a percentage of row totals. The tables below each matrix report on changes in ROA from the beginning to the end of each period for firms that move up (down) deciles from the beginning to the end of each period, as well as two-tailed p-values for differences of means and medians tests. We use two sample Wilcoxon rank sums tests to test differences in medians. ROA is EBIT divided by lagged total assets. Tobin’s Q = (Total assets – book value of equity + market value of equity) deflated by total assets.
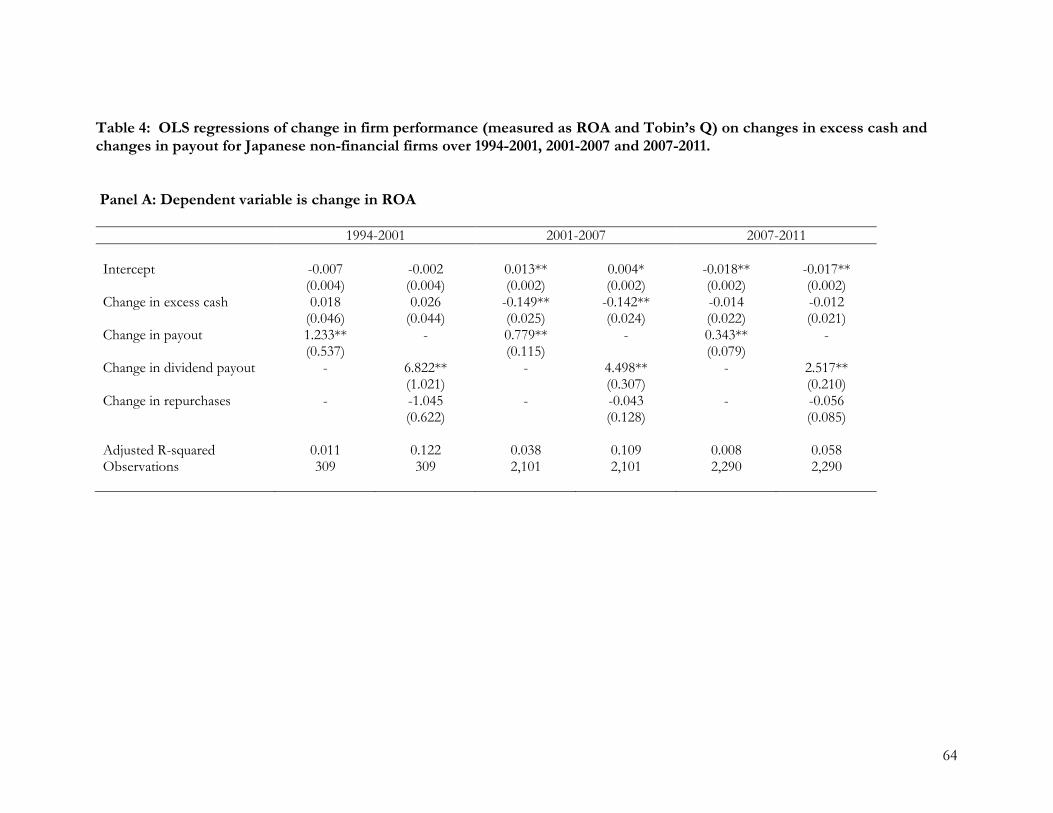
64
Table 4: OLS regressions of change in firm performance (measured as ROA and Tobin’s Q) on changes in excess cash and changes in payout for Japanese non-financial firms over 1994-2001, 2001-2007 and 2007-2011. Panel A: Dependent variable is change in ROA 1994-2001 2001-2007 2007-2011 Intercept -0.007
(0.004) -0.002 (0.004)
0.013** (0.002)
0.004* (0.002)
-0.018** (0.002)
-0.017** (0.002)
Change in excess cash 0.018 (0.046)
0.026 (0.044)
-0.149** (0.025)
-0.142** (0.024)
-0.014 (0.022)
-0.012 (0.021)
Change in payout 1.233** (0.537)
- 0.779** (0.115)
- 0.343** (0.079)
-
Change in dividend payout
- 6.822** (1.021)
- 4.498** (0.307)
- 2.517** (0.210)
Change in repurchases
- -1.045 (0.622)
- -0.043 (0.128)
- -0.056 (0.085)
Adjusted R-squared 0.011 0.122 0.038 0.109 0.008 0.058 Observations 309 309 2,101 2,101 2,290 2,290
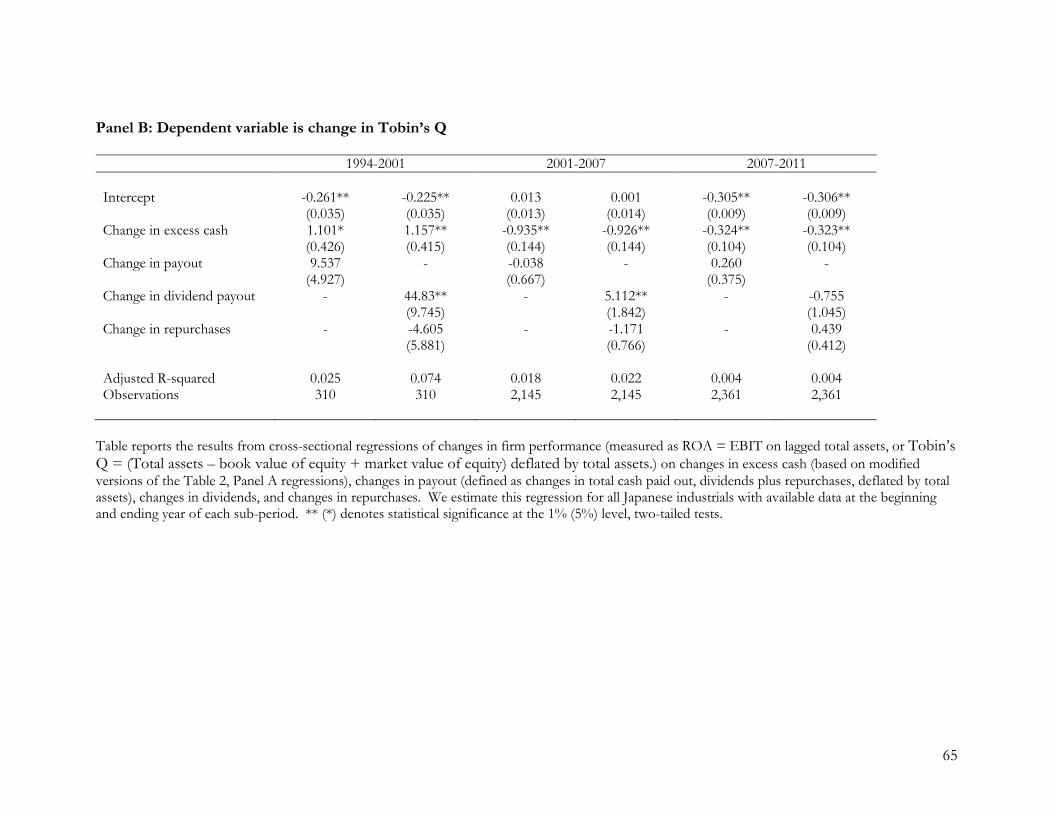
65
Panel B: Dependent variable is change in Tobin’s Q 1994-2001 2001-2007 2007-2011 Intercept -0.261**
(0.035) -0.225** (0.035)
0.013 (0.013)
0.001 (0.014)
-0.305** (0.009)
-0.306** (0.009)
Change in excess cash 1.101* (0.426)
1.157** (0.415)
-0.935** (0.144)
-0.926** (0.144)
-0.324** (0.104)
-0.323** (0.104)
Change in payout 9.537 (4.927)
- -0.038 (0.667)
- 0.260 (0.375)
-
Change in dividend payout
- 44.83** (9.745)
- 5.112** (1.842)
- -0.755 (1.045)
Change in repurchases
- -4.605 (5.881)
- -1.171 (0.766)
- 0.439 (0.412)
Adjusted R-squared 0.025 0.074 0.018 0.022 0.004 0.004 Observations 310 310 2,145 2,145 2,361 2,361
Table reports the results from cross-sectional regressions of changes in firm performance (measured as ROA = EBIT on lagged total assets, or Tobin’s Q = (Total assets – book value of equity + market value of equity) deflated by total assets.) on changes in excess cash (based on modified versions of the Table 2, Panel A regressions), changes in payout (defined as changes in total cash paid out, dividends plus repurchases, deflated by total assets), changes in dividends, and changes in repurchases. We estimate this regression for all Japanese industrials with available data at the beginning and ending year of each sub-period. ** (*) denotes statistical significance at the 1% (5%) level, two-tailed tests.
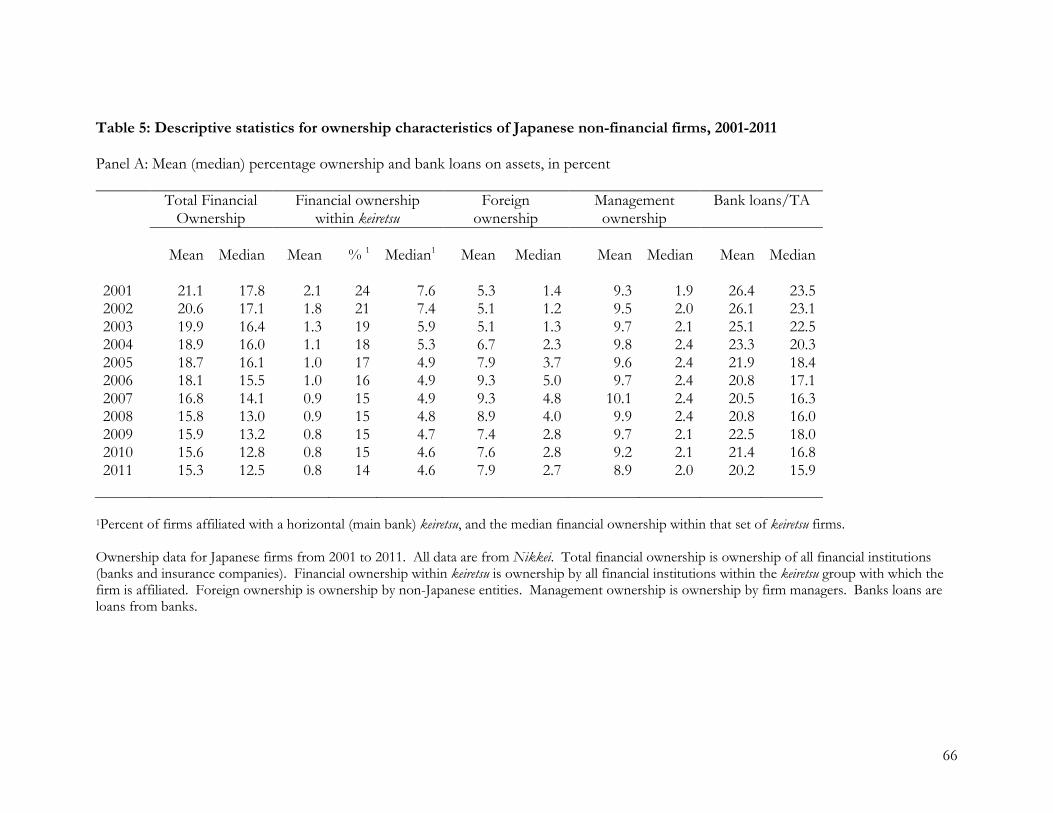
66
Table 5: Descriptive statistics for ownership characteristics of Japanese non-financial firms, 2001-2011 Panel A: Mean (median) percentage ownership and bank loans on assets, in percent Total Financial
Ownership Financial ownership
within keiretsu Foreign
ownership Management ownership
Bank loans/TA
Mean Median Mean % 1 Median1 Mean Median Mean Median Mean Median 2001 21.1 17.8 2.1 24 7.6 5.3 1.4 9.3 1.9 26.4 23.5 2002 20.6 17.1 1.8 21 7.4 5.1 1.2 9.5 2.0 26.1 23.1 2003 19.9 16.4 1.3 19 5.9 5.1 1.3 9.7 2.1 25.1 22.5 2004 18.9 16.0 1.1 18 5.3 6.7 2.3 9.8 2.4 23.3 20.3 2005 18.7 16.1 1.0 17 4.9 7.9 3.7 9.6 2.4 21.9 18.4 2006 18.1 15.5 1.0 16 4.9 9.3 5.0 9.7 2.4 20.8 17.1 2007 16.8 14.1 0.9 15 4.9 9.3 4.8 10.1 2.4 20.5 16.3 2008 15.8 13.0 0.9 15 4.8 8.9 4.0 9.9 2.4 20.8 16.0 2009 15.9 13.2 0.8 15 4.7 7.4 2.8 9.7 2.1 22.5 18.0 2010 15.6 12.8 0.8 15 4.6 7.6 2.8 9.2 2.1 21.4 16.8 2011 15.3 12.5 0.8 14 4.6 7.9 2.7 8.9 2.0 20.2 15.9
1Percent of firms affiliated with a horizontal (main bank) keiretsu, and the median financial ownership within that set of keiretsu firms. Ownership data for Japanese firms from 2001 to 2011. All data are from Nikkei. Total financial ownership is ownership of all financial institutions (banks and insurance companies). Financial ownership within keiretsu is ownership by all financial institutions within the keiretsu group with which the firm is affiliated. Foreign ownership is ownership by non-Japanese entities. Management ownership is ownership by firm managers. Banks loans are loans from banks.
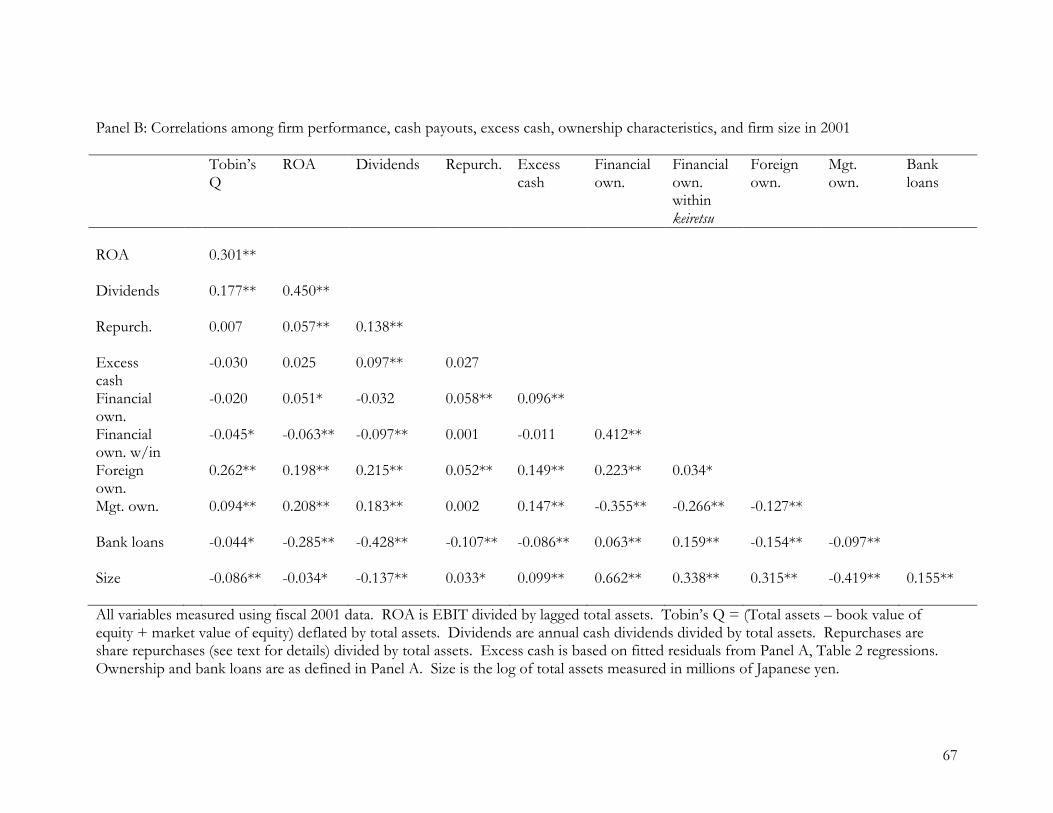
67
Panel B: Correlations among firm performance, cash payouts, excess cash, ownership characteristics, and firm size in 2001 Tobin’s
Q ROA Dividends Repurch. Excess
cash Financial own.
Financial own. within keiretsu
Foreign own.
Mgt. own.
Bank loans
ROA
0.301**
Dividends
0.177** 0.450**
Repurch.
0.007 0.057** 0.138**
Excess cash
-0.030 0.025 0.097** 0.027
Financial own.
-0.020 0.051* -0.032 0.058** 0.096**
Financial own. w/in
-0.045* -0.063** -0.097** 0.001 -0.011 0.412**
Foreign own.
0.262** 0.198** 0.215** 0.052** 0.149** 0.223** 0.034*
Mgt. own.
0.094** 0.208** 0.183** 0.002 0.147** -0.355** -0.266** -0.127**
Bank loans -0.044* -0.285** -0.428** -0.107** -0.086** 0.063** 0.159** -0.154** -0.097** Size -0.086** -0.034* -0.137** 0.033* 0.099** 0.662** 0.338** 0.315** -0.419** 0.155** All variables measured using fiscal 2001 data. ROA is EBIT divided by lagged total assets. Tobin’s Q = (Total assets – book value of equity + market value of equity) deflated by total assets. Dividends are annual cash dividends divided by total assets. Repurchases are share repurchases (see text for details) divided by total assets. Excess cash is based on fitted residuals from Panel A, Table 2 regressions. Ownership and bank loans are as defined in Panel A. Size is the log of total assets measured in millions of Japanese yen.

68
Table 6: OLS regressions of change in firm performance (measured as ROA and Tobin’s Q) on changes in excess cash, changes in payout, and changes in ownership characteristics for Japanese non-financial firms over 2001-2007 and 2007-2011. Panel A: Change in ROA as dependent variable 2001-2007 2007-2011 Intercept 0.007*
(0.003) 0.002
(0.003) -0.012** (0.002)
-0.012** (0.002)
Change in excess cash -0.127** (0.025)
-0.125** (0.025)
0.016 (0.021)
0.015 (0.020)
Change in payout 0.673** (0.113)
na 0.272** (0.075)
na
Change in dividend payout
na 3.567** (0.318)
na 1.913** (0.207)
Change in repurchases
na 0.080 (0.126)
na -0.019 (0.082)
Change in fin. ownership 0.121** (0.028)
0.103** (0.027)
0.185** (0.036)
0.167** (0.035)
Change in foreign ownership 0.116** (0.026)
0.089** (0.026)
0.020 (0.027)
0.009 (0.026)
Change in fin. own. in keiretsu 0.073 (0.083)
0.055 (0.081)
-0.163 (0.234)
-0.104 (0.230)
Change in mgt. ownership 0.162** (0.030)
0.153** (0.029)
0.034 (0.026)
0.024 (0.025)
Change in bank loans -0.197** (0.018)
-0.162** (0.018)
-0.273** (0.018)
-0.245** (0.019)
Adjusted R-squared 0.134 0.174 0.106 0.133 Observations 1,945 1,945 2,279 2,279
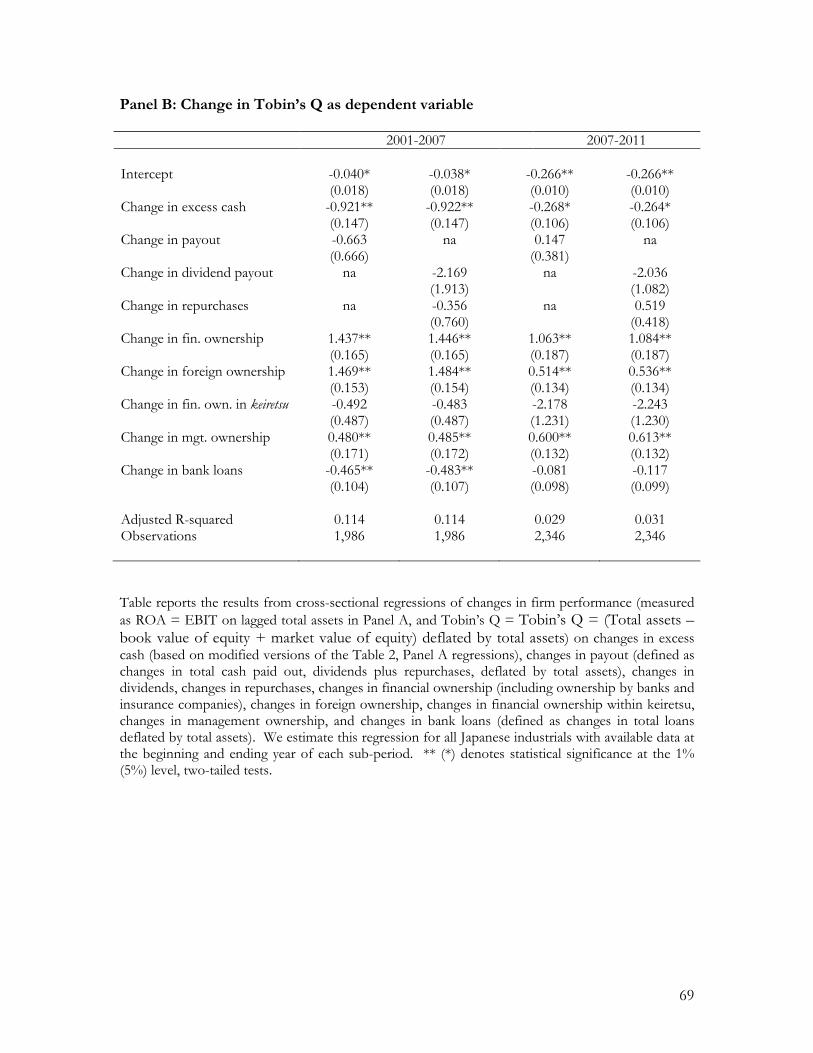
69
Panel B: Change in Tobin’s Q as dependent variable 2001-2007 2007-2011 Intercept -0.040*
(0.018) -0.038* (0.018)
-0.266** (0.010)
-0.266** (0.010)
Change in excess cash -0.921** (0.147)
-0.922** (0.147)
-0.268* (0.106)
-0.264* (0.106)
Change in payout -0.663 (0.666)
na 0.147 (0.381)
na
Change in dividend payout
na -2.169 (1.913)
na -2.036 (1.082)
Change in repurchases
na -0.356 (0.760)
na 0.519 (0.418)
Change in fin. ownership 1.437** (0.165)
1.446** (0.165)
1.063** (0.187)
1.084** (0.187)
Change in foreign ownership 1.469** (0.153)
1.484** (0.154)
0.514** (0.134)
0.536** (0.134)
Change in fin. own. in keiretsu -0.492 (0.487)
-0.483 (0.487)
-2.178 (1.231)
-2.243 (1.230)
Change in mgt. ownership 0.480** (0.171)
0.485** (0.172)
0.600** (0.132)
0.613** (0.132)
Change in bank loans -0.465** (0.104)
-0.483** (0.107)
-0.081 (0.098)
-0.117 (0.099)
Adjusted R-squared 0.114 0.114 0.029 0.031 Observations 1,986 1,986 2,346 2,346 Table reports the results from cross-sectional regressions of changes in firm performance (measured as ROA = EBIT on lagged total assets in Panel A, and Tobin’s Q = Tobin’s Q = (Total assets – book value of equity + market value of equity) deflated by total assets) on changes in excess cash (based on modified versions of the Table 2, Panel A regressions), changes in payout (defined as changes in total cash paid out, dividends plus repurchases, deflated by total assets), changes in dividends, changes in repurchases, changes in financial ownership (including ownership by banks and insurance companies), changes in foreign ownership, changes in financial ownership within keiretsu, changes in management ownership, and changes in bank loans (defined as changes in total loans deflated by total assets). We estimate this regression for all Japanese industrials with available data at the beginning and ending year of each sub-period. ** (*) denotes statistical significance at the 1% (5%) level, two-tailed tests.
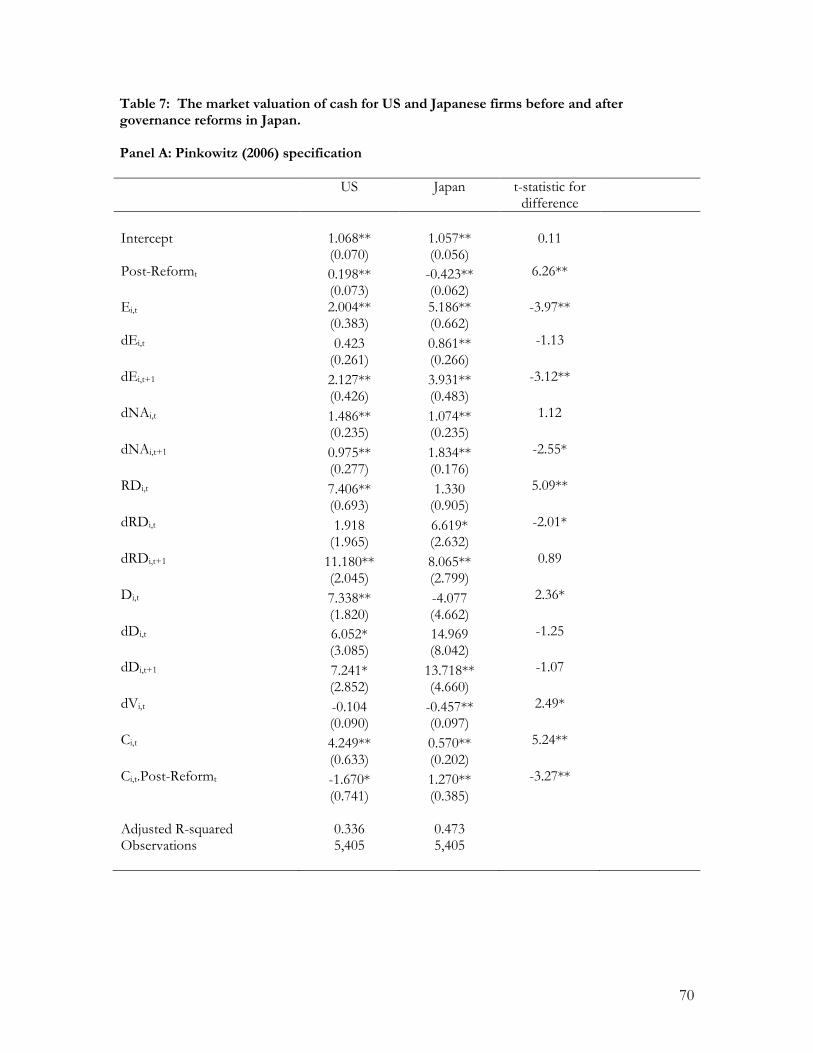
70
Table 7: The market valuation of cash for US and Japanese firms before and after governance reforms in Japan. Panel A: Pinkowitz (2006) specification US Japan t-statistic for
difference
Intercept 1.068**
(0.070) 1.057** (0.056)
0.11
Post-Reformt 0.198** (0.073)
-0.423** (0.062)
6.26**
Ei,t 2.004** (0.383)
5.186** (0.662)
-3.97**
dEi,t 0.423 (0.261)
0.861** (0.266)
-1.13
dEi,t+1 2.127** (0.426)
3.931** (0.483)
-3.12**
dNAi,t 1.486** (0.235)
1.074** (0.235)
1.12
dNAi,t+1 0.975** (0.277)
1.834** (0.176)
-2.55*
RDi,t 7.406** (0.693)
1.330 (0.905)
5.09**
dRDi,t 1.918 (1.965)
6.619* (2.632)
-2.01*
dRDi,t+1 11.180** (2.045)
8.065** (2.799)
0.89
Di,t 7.338** (1.820)
-4.077 (4.662)
2.36*
dDi,t 6.052* (3.085)
14.969 (8.042)
-1.25
dDi,t+1 7.241* (2.852)
13.718** (4.660)
-1.07
dVi,t -0.104 (0.090)
-0.457** (0.097)
2.49*
Ci,t 4.249** (0.633)
0.570** (0.202)
5.24**
Ci,t.Post-Reformt -1.670* (0.741)
1.270** (0.385)
-3.27**
Adjusted R-squared 0.336 0.473 Observations 5,405 5,405
71
The table reports estimates of the following regression, which is based on the specification in Pinkowitz et al. (2006):
Vi,t = α + β1.Post-Reformt + β2.Ei,t + β3.dEi,t + β4.dEi,t+1 + β5.dNAi,t + β6.dNAi,t+1 + β7.RDi,t +
β8.dRDi,t + β9.dRDi,t+1 + β10.Di,t + β11.dDi,t + β12.dDi,t+1 + β13.dVi,t + β14.Ci,t + β15.Ci,t.Post-Reformt + εi,t
where dXt denotes changes in X from t-1 to t, V is the market value of equity plus the book value of debt, E denotes earnings (EBIT), NA denotes net assets (total assets minus cash), RD is research and development expense, D is common dividends, C is cash, and Post-Reform is a dummy variable coded 1 for 2001-2007 and 0 in other years. Data are from Worldscope and Nikkei Financial Quest. Each Japanese firm/year observation is matched to a US firm in the same industry and year with size within 10% and closest ROA; we retain all firms with successful matches and available data. Standard errors with two-way clustering in parentheses. ** (*) denotes statistical significance at the 1% (5%) level, two-tailed tests.
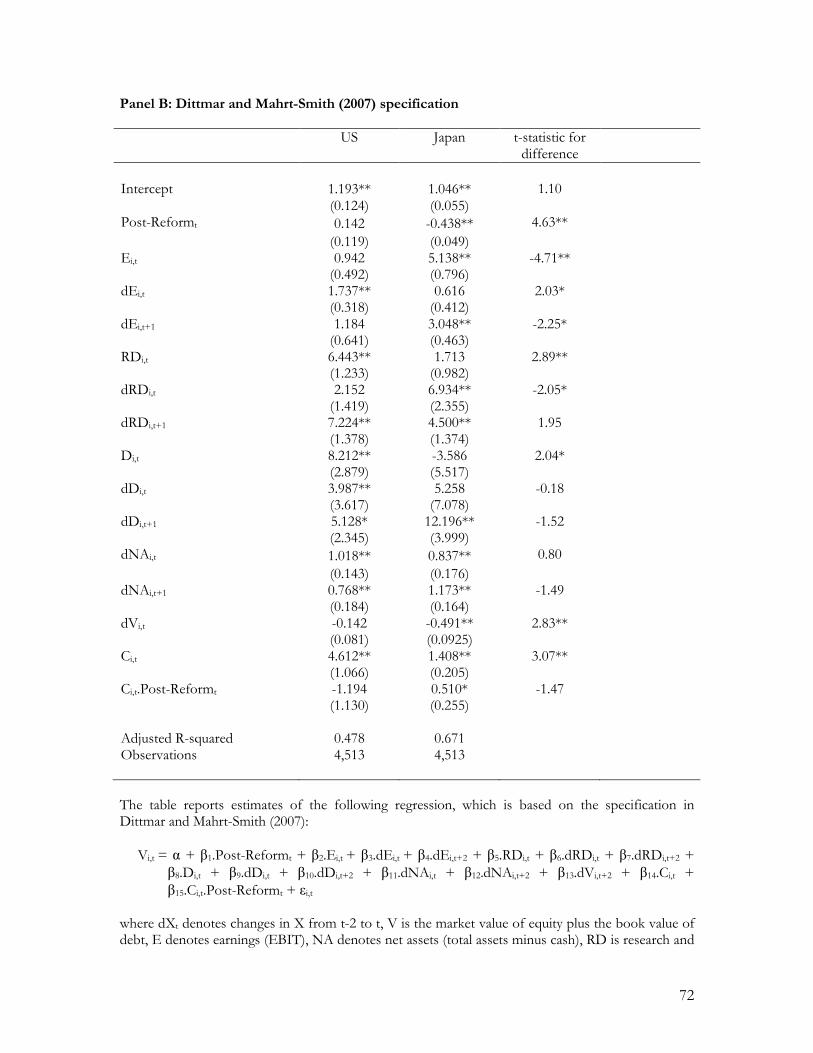
72
Panel B: Dittmar and Mahrt-Smith (2007) specification US Japan t-statistic for
difference
Intercept 1.193** 1.046** 1.10
(0.124) (0.055) Post-Reformt 0.142 -0.438** 4.63**
(0.119) (0.049) Ei,t 0.942 5.138** -4.71**
(0.492) (0.796) dEi,t 1.737** 0.616 2.03*
(0.318) (0.412) dEi,t+1 1.184 3.048** -2.25*
(0.641) (0.463) RDi,t 6.443** 1.713 2.89**
(1.233) (0.982) dRDi,t 2.152 6.934** -2.05*
(1.419) (2.355) dRDi,t+1 7.224** 4.500** 1.95
(1.378) (1.374) Di,t 8.212** -3.586 2.04*
(2.879) (5.517) dDi,t 3.987** 5.258 -0.18
(3.617) (7.078) dDi,t+1 5.128* 12.196** -1.52
(2.345) (3.999) dNAi,t 1.018** 0.837** 0.80
(0.143) (0.176) dNAi,t+1 0.768** 1.173** -1.49
(0.184) (0.164) dVi,t -0.142 -0.491** 2.83**
(0.081) (0.0925) Ci,t 4.612** 1.408** 3.07**
(1.066) (0.205) Ci,t.Post-Reformt -1.194 0.510* -1.47
(1.130) (0.255) Adjusted R-squared 0.478 0.671 Observations 4,513 4,513 The table reports estimates of the following regression, which is based on the specification in Dittmar and Mahrt-Smith (2007):
Vi,t = α + β1.Post-Reformt + β2.Ei,t + β3.dEi,t + β4.dEi,t+2 + β5.RDi,t + β6.dRDi,t + β7.dRDi,t+2 +
β8.Di,t + β9.dDi,t + β10.dDi,t+2 + β11.dNAi,t + β12.dNAi,t+2 + β13.dVi,t+2 + β14.Ci,t + β15.Ci,t.Post-Reformt + εi,t
where dXt denotes changes in X from t-2 to t, V is the market value of equity plus the book value of debt, E denotes earnings (EBIT), NA denotes net assets (total assets minus cash), RD is research and
73
development expense, D is common dividends, C is cash, and Post-Reform is a dummy variable coded 1 for 2001-2007 and 0 in other years. Data are from Worldscope and Nikkei Financial Quest. Each Japanese firm/year observation is matched to a US firm in the same industry and year with size within 10% and closest ROA; we retain all firms with successful matches and available data. Standard errors with two-way clustering in parentheses. ** (*) denotes statistical significance at the 1% (5%) level, two-tailed tests.