is japan really a “buy”? the ... - new york university
TRANSCRIPT

Is Japan Really a “Buy”? The Corporate Governance, Cash Holdings,
and Economic Performance of Japanese Companies
Kazuo Kato, Meng Li, and Douglas J. Skinner
April 2011; revised, November 2011
Abstract Over the past ten years there has been much discussion about whether corporate governance in Japan has improved and, if so, whether this has translated into improved corporate performance. We investigate whether observed changes in Japanese firms’ cash holdings and payout policy are consistent with improved governance practices. To do this, we benchmark Japanese firms against U.S. firms. We find mixed evidence on whether Japanese governance has improved overall, in that the cash holdings of Japanese firms are still systematically higher than those of U.S. firms. However, we also find that for Japanese firms there is an inverse relation between changes in (excess) cash holdings and changes in performance, consistent with improvements in governance being associated with improved performance. Further, we find that the market valuation of cash holdings was systematically lower for Japanese firms than U.S. firms in the 1990s, consistent with poorer governance, but that this difference largely reverses in the 2000s. Overall, our evidence suggests that governance practices in Japan have improved for some firms, and that when governance does improve it is associated with improvements in performance and valuation.
___________________________________________________
Kato is from the Osaka University of Economics; Li and Skinner are from the University of Chicago, Booth School of Business. We appreciate comments from Tomomi Takada and participants at the University of Minnesota Empirical Conference. Li and Skinner acknowledge financial support from the University of Chicago, Booth School of Business.

1
1. Introduction
In the weeks after Japan’s recent earthquake and tsunami and the ensuing shock to equity
prices, a great deal of attention focused on whether Japanese equities were “cheap.”1 This is not
a new perspective. At least since French and Poterba (1991), it has been clear that common
valuation metrics for Japanese firms often differ systematically from those of firms in other
countries. At the time French and Poterba wrote their paper, Japanese equity prices seemed too
high. Since the “bubble” in Japanese real estate and equity prices burst in 1990, the reverse has
been true—Japanese equities have looked cheap by conventional measures. Over the last two
decades, Japanese price-to-book multiples have often been well below those of U.S. firms, with
many below 1. So interest in buying Japanese equities is not new, and many non-Japanese
(foreign) investors have been tempted to buy Japanese equities given their relative valuations.2
Figure 1 plots the Nikkei 225 from 1984 to the present, which reinforces this point.
The unusually high cash holdings of Japanese firms have long drawn the attention of
academic researchers. Rajan and Zingales (1995) examine the cash holdings of companies
across the G7, and find that Japanese firms hold substantially more cash than their G7
counterparts in 1991. Pinkowitz and Williamson (2001) argue that Japan’s main bank system
exacerbates this problem because the banks induce their industrial affiliates to hold excessive
amounts of cash as a way of expropriating wealth, a result that reinforces earlier findings on the
role of main banks in Japan (Weinstein and Yafeh, 1998). Because large holdings of cash are
1 See, for example, “Buffett casts vote of confidence on Japan,” Financial Times, March 21, 2011. Buffett is quoted as saying that “(i)t will take some time to rebuild but it will not change the economic future of Japan…If I owned Japanese stocks, I would certainly not be selling them...Frequently, something out of the blue like this, an extraordinary event, really creates a buying opportunity.” 2 Milhaupt (2003) cites data showing that in 2000, approximately 13% of 779 non-financial firms on the Tokyo Stock Exchange were trading below their “bust up” values (measured as cash and cash equivalents plus investment securities minus debt).

2
generally viewed as symptomatic of poor governance, this evidence is consistent with the more
general view that Japanese companies tend to be poorly governed.
We connect these ideas to examine whether recent corporate governance reforms in Japan
have resulted in improvements in firm performance. The Japanese economy has performed
persistently poorly over the last two decades. One of the alleged culprits has been Japan’s
unusual and (some argue) ineffective corporate governance.3 Our goal is to assess whether there
has been any progress in reforming the governance of Japanese companies and, if so, whether
this translates into improvements in economic performance. To do this, we examine whether the
cash holdings of Japanese companies have declined over the past two decades and whether this
has resulted in improved performance. Support for this position could legitimize the argument
for “buying Japan” because it would imply that investors could “unlock” value by improving the
governance practices of Japanese firms. Alternatively, it could also be that there are legitimate
and intractable reasons that Japanese equities are persistently “cheap” using conventional
metrics.
An important distinguishing factor of the Japanese financial system is the role of the
“main bank” system and the related keiretsu structure (Aoki et al., 1994; Hoshi and Kashyap,
2001). Under this system, creditors, especially banks, play an important role in governance, and
shareholders’ rights are less important. Since the late 1990s, however, when the Japanese
Government introduced an extensive set of reforms designed to remake its financial system (the
“Big Bang”), corporate governance has moved towards a more shareholder-focused model with
the goal of improving economic performance (Aoki, 2007; Milhaupt, 2006; Patrick, 2004).
3 Fukao (2003) and Hoshi and Kashyap (2001) discuss the Japanese financial system and its link to economic performance, especially during the 1990s. Morck and Nakamura (1999) argue that Japanese corporate governance helps explain the poor economic performance of the Japanese corporate sector.

3
The jury is still out on whether these reforms have led to substantive changes in Japan’s
corporate governance practices and the performance of its corporate sector. While in some ways
things have improved—the importance of the banks and the keiretsu system generally have
declined—in other ways it seems that the old ways of doing business in Japan remain firmly in
place.4 Some changes that were touted earlier in the 2000s (such as the decline of the keiretsu
system and corporate cross-holdings of shares) have partially reversed as managers sought to
protect themselves from an increasingly active market for corporate control, especially from
foreign investors (e.g., the rise of defensive mechanisms such as poison pills, a rebound in cross-
holdings for defensive purposes).5
We examine the cash holdings of Japanese firms, along with their cash payouts to
stockholders, as a concrete way of assessing whether corporate governance has improved. This
approach has a number of advantages in assessing the effectiveness of corporate governance
reforms in Japan. First, this provides a relatively clean way of assessing corporate governance
reform in Japan. Although one can measure corporate governance using various metrics and
indices, these measures generally have limitations because, first, corporate governance is multi-
dimensional and so not subject to direct measurement and, second, because different corporate
governance structures are likely to be optimal for different firms (e.g., Larcker et al., 2007). This
is especially true in Japan, which allows firms to adopt either a western-style model or a more
traditional Japanese model (Milhaupt, 2003).
4 Milhaupt (2003, p. 3) writes that “Over the past decade, the formal institutional environment for Japanese corporate governance has been reformed significantly and at an accelerated pace…Yet, despite substantial legal reform and decade after Japan’s economic problems emerged, there has been no sea change in Japanese corporate governance practices.” 5 Hamao et al. (2010) provide evidence on the returns to foreign investor activism in Japan between 1998 and 2009. They report largely mixed evidence on the ability of activist investors to reform Japanese companies, and widespread adoption of poison pills since 2006. The recent debacle at Olympus has again focused international attention on the governance practices of Japanese companies (for example, see “Pressure on Japan to probe Olympus,” Financial Times, October 25, 2011).

4
Second, and perhaps more important, the management of cash has become a flashpoint
for disagreements between corporate managers and investors. Jensen (1986) discusses the
agency costs of free cash flow, under which managers of firms that generate strong free cash
flows have a tendency to over-retain cash that is then expropriated or simply wasted on bad
projects. LaPorta et al. (2000) find support for this idea using data drawn from a large cross-
section of firms from different countries, by showing that dividend payouts decline more
strongly in growth opportunities for firms in countries with stronger investor protection. Dittmar
et al. (2003), Pinkowitz et al. (2006), Dittmar and Mahrt-Smith (2007), Harford et al. (2008),
among others, also focus on cash holdings and dividend policy as a way of assessing the quality
of governance practices across firms and countries. Consistent with this view, activist investors
frequently cite firms’ cash balances as an example of poor governance, and lobby firms to
increase these payouts (e.g., Klein and Zur, 2009). The management of cash has become a
common focus of battles between external, activist investors and management over the last
decade in Japan.6
Japanese firms still retain a lot of cash. The median Japanese non-financial firm held
about 11% of assets in cash in the last three years of our sample period (2006-2008), only
slightly less than the 12% median for early 1990s (1990-1992). Using regressions that control
for the effect of firm characteristics on cash holdings, we find that Japanese managers have, on
average, decreased their holdings of cash over the past decade but that the decrease is modest, on
the order of 2% of assets.
To provide a benchmark for assessing the Japanese experience, we also report evidence
on the cash holdings and payout practices of U.S. firms. U.S. firms have increased their holdings 6 See “A Clash over Cash,” The Economist, May 16, 2002. For a more extensive discussion of activist investing in Japan, see Hamao et al. (2010). Chen et al. (2010) examine how governance affects the cash holdings of Chinese firms.

5
of cash substantially over the last two decades (Dittmar and Mahrt-Smith, 2007; Bates et al.,
2009). Consequently, although Japanese firms have historically held high levels of cash
compared to firms in other countries, we find that Japanese and U.S. firms now hold roughly
comparable levels of cash, with the median U.S. firm holding cash of around 10-11% of assets
over 2003 to 2008.
Consistent with the idea that Japanese managers now manage cash more like their
western counterparts, empirical models of cash holdings that do a good job of explaining cash for
U.S. firms are increasingly useful for Japanese firms. We find adjusted R-squareds of over 30%
for U.S. firms in the 1990s and 2000s; for Japanese firms, the adjusted R-squared increases from
11% in the 1990s to around 25% in the 2000s. In addition, coefficient signs and magnitudes are
similar for U.S. and Japanese firms in the 2000s; this is not the case in the 1990s. Similar to
previous studies (Pinkowitz and Williamson, 2001), we find that Japanese firms that are part of
keiretsu groups hold less cash than other Japanese firms but more cash than U.S. firms.
When we use these regression models to control for changes in firm characteristics
through time and differences across firms, we find that Japanese firms still hold consistently
more cash than U.S. firms. A Japan dummy in the cash holdings regressions is consistently
positive and significant, and implies that, after conditioning on firm characteristics, Japanese
firms hold around 10% more cash (as a fraction of assets) than similar U.S. firms, although this
difference is smaller than it was in the early 1990s. Japanese keiretsu firms hold 4% to 5% less
cash (as a fraction of assets) than other Japanese firms but still more than U.S. firms.
Japanese firms have very different dividend policies from those of firms in most other
countries. While the fraction of dividend payers in major western economies declines over the
last 25 years (Fama and French, 2001, Denis and Osobov, 2008), over 80% of Japanese

6
industrials continue to pay dividends. However, these dividends are small compared to those of
U.S. dividend payers. In the early 1990s, the median Japanese dividend-payer paid annual
dividends of just over 0.5% of total assets, compared to a median of over 2.0% for U.S. firms.
During the 2000s, Japanese dividend-payers increased the magnitude of their payouts to close to
1% of total assets, which is still around half of the level for U.S. companies.
Similar to what has occurred in the U.S. and other western countries, stock repurchases
have become an important way for Japanese firms to return cash to stockholders. Japanese firms
have been able to make stock repurchases since the late 1990s, a practice that was effectively
prohibited under the Commercial Code and securities exchange laws prior to this time. Our
empirical tests, however, do not analyze repurchases directly because of the difficulty of
measuring repurchases for Japanese companies.7
We use the regression models that explain cash holdings as the basis for measures of
firms’ excess cash and assess the persistence of firms’ excess cash levels over time. For three
non-overlapping periods (1994-1999, 1999-2004, and 2004-2008), we sort firms into deciles
based on excess cash, which we measure as the residual from the cash regressions. We then
report transition matrices which show how firms’ excess cash changes over these periods. This
analysis shows that firms’ excess cash levels tend to be persistent, that the persistence is larger
for Japanese firms than U.S. firms, and that the persistence is more pronounced for Japanese
firms with high levels of excess cash. These are the firms that we posit have the most serious
governance problems.
7 There are a number of complications with measuring repurchases in Japan, which makes this task even more complicated than with U.S. data. Similar to the U.S., it is possible to get gross stock purchases although this includes purchases of preferred stock. The larger problem, however, is adjusting to get net stock purchases, which is a much cleaner measure of repurchases (Fama and French, 2001). This exercise is further complicated by the need to adjust for the fact that subsidiaries are often publicly-traded in Japan. We are currently looking to obtain these data from Japanese firms’ financial statements.
7
We then analyze whether changes in excess cash during these periods are associated with
changes in performance. For Japanese firms we find an inverse relation between changes in
holdings of (excess) cash and changes in firm performance (ROE, ROA). This is consistent with
our argument that firms that lower cash holdings do so because of improved governance, and that
this is associated with improved performance. We also find that firm performance improves for
keiretsu firms over these periods, although there is no evidence of any interaction between this
effect and changes in cash holdings.
We also investigate whether there has been a change in investors’ valuation of the cash
holdings of Japanese firms. Following the idea that cash holdings are more vulnerable to
expropriation or waste by managers (Myers and Rajan, 1998), Pinkowitz et al. (2006) and
Dittmar and Mahrt-Smith (2007) provide evidence that investors systematically discount the cash
holdings of poorly governed firms. We adapt this approach to our setting and find that: (i)
investors’ valuations of Japanese firms’ cash holdings were systematically lower than those of
U.S. firms in the 1990s, consistent with Japanese firms being poorly governed during that period,
and (ii) the valuation of cash for Japanese firms, on average, improves in the 2000s to the extent
that differences relative to U.S. firms largely disappear. This is consistent with the idea that, on
average, the governance practices of Japanese firms improve over time, resulting in better
management of cash and so higher cash valuations, consistent with our evidence on cash
holdings and firm performance.
The next section provides details of sample selection and data. Section 3 provides the
empirical analysis on cash holdings while Section 4 provides evidence on the valuation of cash
holdings. Section 5 concludes.

8
2. Sample and data
Our sample and data are from WorldScope, collected via Thomson Reuters DataStream.
The initial sample includes all Japanese firms listed on the Tokyo Stock Exchange and JASDAQ
(Japanese OTC market), and all U.S. firms listed on the NYSE, AMEX, and NASDAQ. The
sample period is from 1980 to 2008 although certain data requirements described below
effectively limit our sample to 1990 to 2008. Because our sample period begins in 1990, it
encompasses the early 1990s bursting of the bubble in Japan, which began the economic malaise,
and so is a suitable starting point for our study (see Figure 1).8 We delete observations with
missing total assets. We exclude firms from the utilities, transportation, and financial industries
because their cash holdings and payout policies are likely to differ from those of industrials.
Bates et al. (2009) define cash as the sum of cash and marketable securities in their study
of U.S. firms. Because of possible differences in Japanese firms’ use of marketable securities,
we exclude marketable securities and measure cash holdings simply as cash divided by total
assets.9 To be consistent, we do the same for U.S. firms.
8 “Traditional” governance practices were still in place in the early 1990s, including almost exclusive reliance by firms on bank financing, the importance of the main bank/keiretsu system, substantial corporate cross-holdings, etc. Reforms began in the mid to late 1990s as the economic problems deepened and there was universal recognition of the need for reform (e.g., Hoshi and Kashyap, 2001). 9 Pinkowitz and Wiliamson (2001) also exclude holdings of marketable securities in measuring cash for Japanese firms. There is an upward trend in U.S. firms’ holdings of marketable securities, from less than 5% of assets in the early 1990s to 8-10% of assets in the mid 2000s. Japanese firms tend to hold a lower fraction of marketable securities than U.S. firms, especially after 2000 when the median Japanese firm held less than 1% of assets as marketable securities.

9
3. Evidence on cash holdings and corporate performance
3.1 Univariate comparisons of Japanese and U.S. firms
To compare the cash holdings, payout policy, performance, and valuations of Japanese
and U.S. companies, Table 1 presents means and medians for the key variables by country and
year for the full panel. We also report certain of these series in figures.10
We first report on cash holdings (Table 1, Panel A). Bates et al. (2009) report a large
increase in the extent to which U.S. firms hold cash from 1980 to 2006 (see also Dittmar and
Mahrt-Smith, 2007). This same trend is evident in our data. In 1990, the mean (median) cash
holdings of U.S. firms represented 6.9% (2.8%) of assets. This number increases steadily over
the sample period, reaching 17.4% (10.9%) in 2008.
For Japanese firms, mean (median) cash holdings were 16.0% (13.8%) in 1990,
substantially higher than those of U.S. firms [of 6.9% (2.8%)], consistent with the evidence in
Rajan and Zingales (1995). After 1990 there is a decline in the cash holdings of Japanese
companies through 1997 and 1998 when the average reaches around 11% (median 9%). After
this, there is a modest increase to a mean (median) of 13.9% (10.8%) in 2008, numbers not
dissimilar to those of U.S. companies. In fact, for 2007 and 2008, we cannot reject the null that
the median cash holdings of U.S. and Japanese firms, both at 11%, are the same (differences in
means tests for many of the years in the 2000s also fail to reject the null). These results indicate
that the tendency for Japanese firms to hold systematically more cash that their U.S. counterparts
no longer holds. We revisit this conclusion below, however, once we look at regressions that
control for the effect of various firm characteristics on their cash holdings.
10 To control for outliers that may impact our results, return-to-asset ratios and return-to-equity ratios that are greater than 1 (less than -1) are set to 1 (-1). Leverage and cash-to-assets ratios that are greater than 1 (less than 0) are set to 1 (0). Market-to-book ratios that are greater than 30 (less than 1) are set to 30 (1).

10
We next compare the dividend policies of U.S. and Japanese firms; see Table 1, Panel B,
and Figure 2. As expected based on Fama and French (2001), there is a consistent decline in the
fraction of U.S. dividend-payers over most of this period, from 55% in 1990 to around 20% in
2002. However, after 2002 the fraction of dividend-payers increases steadily, to around 30% in
2007 and 2008.11 The fraction of dividend-payers in Japan is much higher than that in the U.S.
throughout the sample period. This fraction is over 90% in the early 1990s, falls slowly to
around 80% in the late 1990s and to 78% by 2002, before increasing to 87% in 2008. These
trends (through the early 2000s) are similar to those reported by Denis and Osobov (2008) in
their comparison of payout policy across the G7.
Although a much higher fraction of Japanese firms pay dividends, those dividends are
substantially smaller than those paid by U.S. firms. Table 1, Panel C, and Figure 3 report the
mean and median size of dividends, computed as (annual) common cash dividends deflated by
total assets (these numbers are computed across the set of dividend payers only). In 1990 the
mean (median) annual dividend paid by U.S. firms was around 3% (2%) of total assets. At the
same time, Japanese firms were paying a dividend of 0.7% (0.6%) of total assets. The size of the
dividends paid by U.S. firms falls steadily during the 1990s with the median reaching a low of
1.4% in 2003. After that, however, there is a modest increase, with the median reaching 2% in
2008. The dividends of Japanese firms are largely flat through the 1990s, although the mean
trends upwards somewhat beginning in the late 1990s. There is clearer evidence of an increase
for Japanese firms over the 2000s, with the mean increasing to over 1% in 2007 and the median
reaching around 0.9% by 2008. Nevertheless, it is clear that the size of dividends paid by
11See Floyd et al. (2011) for more discussion of recent trends in the payout policy of U.S. firms.

11
Japanese firms remains well below those of their U.S. counterparts, with U.S. firms’ dividends
consistently at least twice the size of those for Japanese firms.
We next use accounting profitability (ROA) to compare the economic performance of
Japanese and U.S. firms (ROA is defined as EBIT on lagged total assets). The comparative
ROA numbers are reported in Table 1, Panel D, and Figure 4. There are at least two important
features of these numbers. First, the cross-section of profitability has become increasingly
skewed for U.S. firms, in part because of the increasing rate of losses. In the early 1990s, mean
and median ROA varies between 9% and 11%. However, these series diverge by increasing
amounts as the 1990s progress, due largely to increasing left-skewness in the earnings cross-
section, a trend that continues through the 2000s.12 In contrast, to the extent skewness is evident
for Japanese firms, it is right-skewness rather than left skewness—Japanese firms do not display
the tendency of U.S. firms to report large write-downs and losses.
Second, it is clear that Japanese firms are less profitable that their U.S. counterparts
through the 1990s. In 1990 and 1991, median ROA for Japanese firms is around 7%. From
1992 through 1994, however, as the post-crash recession took hold, median ROA falls to less
than 4%, and then to around 3% by 2002. After 2002, there is steady increase in median ROA as
the Japanese economy improves, so that median ROA reaches nearly 6% by 2007. During the
1990s, U.S. firms’ median ROA consistently exceeds 8%, well above that for Japanese firms.
There is a decline in 2001 due to the U.S. recession, followed by a rebound to around 8% over
2004 through 2007. So U.S. firms continue to outperform Japanese firms, but the gap is not as
12This increasing left skewness is due to at least two related phenomenon. First, as discussed by Fama and French (2004), there has been a systematic shift in the nature of U.S. publicly-traded firms, with firms tending to go public earlier in their life cycles. Second, U.S. firms are reporting losses at an increasing rate (Hayn, 1995; Klein and Marquardt, 2006), and these losses tend to increase in size over time. In our data, U.S. firms report losses in 28% of firm/years in the 1990s and 38% of firm/years in the 2000s; corresponding numbers for Japanese firms are 17% and 19%, respectively.

12
wide as was the case in the 1990s. Further, the profitability of Japanese firms displays much less
cross-sectional variability than for U.S. firms.
Consistent with the idea that Japanese companies appear undervalued relative to U.S.
companies, market-to-book ratios are systematically lower for Japanese firms. Over the 1990s,
market-to-book ratios for U.S. companies average 3.60 (median 2.16) while those for Japanese
companies average 2.49 (median 1.72). During the 2000s, the difference widens, with
corresponding numbers of 3.40 (2.06) for U.S. companies and 1.97 (1.06) for Japanese
companies. Differences are highly statistically significant. These differences are unlikely to be
fully attributable to accounting differences, as discussed further below.13
The time-series of P/E ratios for Japanese firms also makes it easy to understand why
foreign investors have become increasingly interested in these firms (see Figure 5A). After
reaching a peak in 1994, when the mean (median) P/E ratio was 90 (50), P/E ratios for Japanese
firms decline consistently. While partly due to a decline in Japanese equity prices (Figure 1),
this is also due to a consistent increase in Japanese firms’ EPS, perhaps due to the fact that
Japanese accounting rules changed significantly over this period as part of the overall effort to
reform corporate governance. Many rules changed in the late 1990s and early 2000s, with most
changes intended to align Japanese accounting with U.S. and U.K. GAAP rules (Japan is yet to
adopt IFRS).14
P/E ratios for U.S. firms (Figure 5B) show little trend, with the median varying in a tight
range around 20 and the mean varying over a wider range between approximately 30 and 40.
13 The greater propensity for U.S. firms to record accounting write-downs, restructuring charges, etc., (which drives the differential skewness of the ROA numbers), causes, through double-entry, a corresponding decline in book values, skewing market-to-book ratios upwards. 14 French and Poterba (1991) discuss the fact that the high P/E ratios they observed in the 1980s for Japanese companies was partly driven by differences in accounting pushing down EPS numbers, including the fact that most financial statements in Japan were not consolidated. These accounting differences had largely disappeared by the early 2000s, which possibly explains at least part of this trend.

13
Because of the persistent fall in the P/E ratios of Japanese firms, mean and median P/E ratios for
Japanese and U.S. companies are similar over 2003 through 2008 (differences in means are
insignificant for 2003 through 2007 and in some years, such as 2001, are significantly higher for
U.S. firms).
To summarize, in the early 1990s, Japanese industrials looked very different to their U.S.
counterparts, with higher holdings of cash, higher P/E ratios but lower market-to-book ratios,
substantially lower profitability, and smaller dividends (in terms of amounts paid). However, by
the mid to late 2000s Japanese and U.S. companies looked more similar: U.S. firms had
increased their holdings of cash, while Japanese companies had improved their profitability and
increased their dividends modestly. P/E ratios for Japanese companies are now largely in-line
with those of U.S. firms. However, market-to-book ratios of Japanese companies are still lower
than those of U.S. firms, and profitability is still 200 to 300 basis points lower than that of U.S.
firms. And, as we see next, once we control for changes in firm characteristics, cash holdings
are still substantially higher for Japanese firms.
3.2 Cash Regressions
Our primary interest is in whether there have been systematic changes in Japanese firms’
payout policies and cash balances (our proxy for corporate governance improvements) that are
related to changes in these firms’ economic performance. To model cash balances, we follow
Opler et al. (1999) and Bates et al. (2009). Based on the transactions costs and precautionary
demands for cash,15 these papers model cash holdings as a function of firm size, a dividend-
payer dummy, leverage, profitability, a loss dummy, market-to-book, the fraction of closely-held
15 These arguments date to Keynes (1936). The idea behind the transactions costs argument is that raising funds or liquidating assets involves transactions costs that can be avoided by holding cash. The precautionary demand argument says that cash is valuable because it can be used to finance investments if alternative sources of funding become unavailable or too costly.

14
shares, industry sigma, net working capitals, R&D intensity, capital expenditures, and cash
flow.16
Following Bates et al. (2009), we construct industry sigma as the mean of the standard
deviations of cash flow/assets over the past 10 years for firms in a given industry. We define
industry using the industry group variable (WC06011) from WorldScope. We use a three-digit
code for miscellaneous industry and two-digit codes for all other industries. Because this
computation requires ten years of past cash flow data, industry sigma could not be calculated for
observations before 1990. As a result, most of our analyses include a sample period from 1990
to 2008.
We use two types of estimation. First, we estimate regressions separately for each
country, both for the overall period (1990-2008) and by decade (1990-1999 and 2000-2008);
these results are reported in Table 2. This allows us to assess whether the economic
determinants of cash holdings differ significantly across Japanese and U.S. firms, as well as to
gauge how these determinants changes over time in each country. When we estimate the
regressions for the full time period, we include dummies for 2000-2003 and 2004-2008 to see
how cash balances change in each country after 2000 after conditioning on firm characteristics.
Second, we estimate annual pooled cross-sectional regressions for all U.S. and Japanese
companies with data available in a given year (Table 3). These regressions include a Japan
intercept dummy to assess whether the cash holdings of Japanese companies are systematically
different from those of U.S. companies conditional on the other variables.
16 We measure size as the natural log of total assets, leverage as the ratio of long-term debt to total assets, ROE as net income deflated by lagged total assets, net working capital as current assets minus current liabilities minus cash, R&D as research and development expenditures deflated by sales, capital expenditures as capital expenditures deflated by lagged total assets, and cash flow as funds from operations deflated by lagged total assets.

15
For the Japanese firms, the Table 2 regressions also include a measure of keiretsu
inclination. As discussed in Section 1, the extent to which Japanese firms are affiliated with
corporate groups is likely to systematically affect corporate policies such as cash holdings and
payouts. The direction of this effect is not clear, however. On one hand, some authors argue that
firms in these groups have less severe information and agency problems, which implies they are
likely to hold less cash and distribute more cash to shareholders (e.g., Hoshi and Kashyap, 2001;
Dewenter and Warther, 1998). On the other hand, other authors argue that the banks that sit at
the heart of these groups use their influence to cause keiretsu firms to hold excessive cash
balances as part of a systematic expropriation of external holders (e.g., Pinkowitz and
Williamson, 2001; Weinstein and Yafeh, 1998).
Following Dewenter and Warther (1998), we define keiretsu firms as those that belong to
one of the largest six large horizontal keiretsu, also known as enterprise groups.17 We obtain
these data from Industrial Groupings in Japan (IGJ, 2001), a standard source of these data, and
classify firms as either keiretsu firms (if they are classified in IGJ as horizontal keiretsu firms
with inclination scores of 2-4) or not (otherwise).18 We assume that keiretsu affiliation does not
change over the sample period.
Table 2 reports the first set of regression estimates. As indicated above, for each country
regressions are estimated for the full period as well as for two sub-periods (with two-way
clustering of standard errors). For U.S. firms, these regressions have R-squares of 30.5% for
1990-1999, 32.0% for 2000-2008, and 33.1% for the overall period. Coefficients on key
17 See Hoshi and Kashyap (2001, pp. 10-12) for more discussion of the nature of these groups. 18 IGJ measures inclination based on five factors: (i) the characteristics and historical background of the groups and/or the company; (ii) sources and amount of bank loans, (iii) board of directors sent by and/or sent to nucleus and/or other group companies, (iv) the company attitude towards the group, (v) the company connections with other groups and/or non-group companies. Measured inclination ranges from 0 (none) to 5 (for “nucleus” firms that have the strongest group affiliations). IGJ has not released updated data since 2001.

16
variables are mostly in-line with those of Opler et al. (1999) and Bates et al. (2009). Cash
holdings are positively related to industry sigma, market-to-book, R&D intensity, and cash flow,
and negatively related to size, dividend payment, leverage, net working capital, and capital
expenditures. These findings are largely consistent with the transactions costs and precautionary
demands for cash. The significance and magnitude of regression coefficients are mostly
consistent across sub-periods (one notable exception is the coefficient on industry sigma, which
is substantially lower in the second sub-period). The period dummies (for 2000-2003 and 2004-
2008) are positive and significant in the full period regression, indicating that U.S. firms
increased their propensity to hold cash in the 2000s by about 1% to 2% of assets after controlling
for firm characteristics.
The model does not explain cash balances as well for Japanese firms in the 1990s. For
1990-1999, the adjusted R-squared is 11.1%, about a third of that for U.S. firms. The only
variables that are significant in this regression are dividend payer (which is reliably positive,
opposite to the result for U.S. firms), ROE (reliably positive, consistent with the result for U.S.
firms), R&D intensity (reliably positive, also consistent), and capex (reliably negative, also
consistent). The keiretsu dummy is reliably negative, indicating that group firms hold about 3%
less cash than other firms.
Results are more similar to those for U.S. firms in the second sub-period. For this period
the adjusted R-squared increases to 25.4% and the coefficients on size, leverage, market-to-book,
industry sigma, net working capital, R&D, capex, and cash flow are consistent with those for
U.S. firms, in terms of sign and significance of coefficients. Once again, the dividend-payer
variable is positive rather than negative—in Japan, dividend-payers have higher, not lower, cash
balances (although recall that Japanese dividends are typically much smaller than those paid in

17
the U.S., and that a large majority of Japanese firms pay dividends). Thus, Japanese firms with
more cash are more likely to pay dividends, but these dividends are small enough not to affect
cash holdings materially. The coefficient on industry sigma is also much larger than it is for U.S.
firms in the 2000s, suggesting that the precautionary demand is more important for Japanese
firms. Finally, consistent with results for the 1990s, the coefficient on the keiretsu dummy is
negative and highly significant, indicating that keiretsu firms tend to hold cash that represents
about 3% less of assets than other Japanese firms.19
Overall, this evidence indicates that the determinants of cash for Japanese firms become
more similar to those of U.S. firms in the 2000s than they were in the 1990s. One interpretation
is that Japanese managers are now more conscious of the need to manage cash effectively, so
their cash holdings are more sensitive to firm characteristics that measure the economic
determinants of cash holdings, consistent with the view that governance practices have improved
in Japan. In addition, the 2004-2008 period dummy in the full period regression is significantly
negative, indicating a modest decline (of around 2% of assets) in the average cash holdings of
Japanese firms once we condition on firm characteristics.
Table 3 reports on the second set of cash regressions. Here, we estimate a single
regression in each annual cross-section with all available U.S. and Japanese firms, with dummies
for Japanese firms and keiretsu firms (the keiretsu variable is set to zero for U.S. firms). The
idea is to compare the cash holdings of Japanese firms in general, as well as keiretsu firms in
particular, to those of U.S. firms after conditioning on other firm characteristics that affect cash
holdings. To economize on the numbers we report, Table 3 only reports the coefficients on these
19 The results for the keiretsu variable are similar to those in Pinkowitz and Williamson (2001), who also find a significantly negative coefficient on a keiretsu dummy variable in cross-sectional cash regressions.

18
two intercept dummy variables.20 For ease of comparison, Figure 6 plots the coefficients on the
Japan intercept dummies as well as the sum of these coefficients and the keiretsu dummies, to
show how the cash holdings of Japanese firms and Japanese keiretsu firms, respectively,
compare to U.S. firms (i.e., the figure plots the differences versus U.S. firms).
The coefficient on the Japan intercept dummy is reliably positive in all years, indicating
that Japanese firms hold more cash than U.S. firms. The differences are largest in the early
1990s, when the coefficients indicate that Japanese firms held substantially more cash than U.S.
firms, with differences ranging from 15% to 19% of total assets. These differences then decline
from 1996 through 2001, reaching a low of 3.5% in 2001, but then rebound to 11%-12% over
2003 to 2007. There is no obvious evidence here in favor of the hypothesis that Japanese firms
reduce their holdings of cash as corporate governance improves over the past decade: while there
was a steady decline in cash holdings over 1994 to 2001, a good part of this reverses over 2003-
2007 although cash holdings over the period are still substantially lower than during the early
1990s. Consistent with the previous results, the coefficient on the keiretsu dummy is reliably
negative in all years with some time variation: keiretsu firms hold 3% to 5% less cash than other
Japanese firms over most of the time period (with smaller differences in the later 1990s and early
2000s) but still hold more cash than U.S. firms.
The differences in the cash holdings of the U.S. and Japanese firms implied by these
regressions are larger than the univariate differences reported in Table 1, suggesting that changes
in firm characteristics across the two countries help explain the smaller differences evident there.
These results indicate that Japanese firms, on average, still hold substantially more cash than
20 In most cases, the sign and significance of the coefficients is roughly consistent with that for the regressions reported in Table 2, although for those variables where there was some inconsistency between the results for the U.S. and Japanese firms, the coefficients are less significant. For example, in Table 2 the coefficient on the dividend-payer dummy is negative for U.S. firms and positive for Japanese firms, so it is not surprising that the results on this variable are less significant in the pooled cross-sectional regressions.

19
U.S. firms, even given the fact that U.S. firms have increased their cash holdings significantly
since 1990.
3.3 Excess cash and the relation to firm performance
Based on our working assumption that Japanese firms’ management of cash is a proxy for
the quality of their corporate governance, we next report on two aspects of changes in firms’
management of cash. First, we use the regression models discussed above to sort sample firms
into deciles based on their holdings of excess cash in each year. To do this, we use the residuals
from the regressions reported in Table 2 (estimated for U.S. and Japanese firms separately for the
full time period, without the time dummies) to proxy for excess cash. We then look to see how
stable this characteristic is—do firms consistently, over a period of years, hold high or low levels
of excess cash? If they persistently hold high levels of excess cash, that would indicate relatively
poor governance. Conversely, firms that improve their management of cash (excess cash
declines over time) likely do so because of improved governance.
Second, we look to see whether changes in excess cash (measured as movements across
excess cash deciles over time) are associated with changes in firm performance (measured as
changes in ROA and ROE). We expect to see that declines in excess cash holdings are related to
improvements in performance for Japanese firms. We also condition these results on whether
the Japanese firms are part of keiretsu, as defined above.
We report the results of these analyses in Tables 4 and 5. Panel A of Table 4 presents
excess cash transition matrices for U.S. firms while Panel B reports the same matrices for
Japanese firms. To perform this analysis, we sort firms into excess cash deciles in an initial year
and then re-sort in the final year of each period. We report transitions for three periods, 1994-

20
1999, 1999-2004, and 2004-2008. Although these time periods are arbitrary, we think they make
sense as a way of assessing the “stickiness” of firms’ cash policies over the sample period while
economizing on the number of analyses. The transition matrices report percentages based on the
rows, and so add to 100 across rows. Each row comprises observations in a given excess cash
decile for the initial year, from 1 to 10, where 1 denotes the lowest excess cash and 10 the
highest excess cash. The columns comprise deciles defined in the same way in the last year.
Thus, observations on the diagonal are those that are in the same decile in the first and last years.
Observations above the diagonal are those for which excess cash increases so that firms move up
the deciles. For example, observations in row 2, column 3 move from decile 2 in the first year to
decile 3 in the last year. This analysis requires that firms have available data in the first and last
years of each period; for this reason, especially in the earlier period, we have relatively few
observations.
If membership in excess cash deciles is independent over time, we would see percentages
of 10 in all cells. However, looking at the numbers in Table 4, we in fact see clustering, most
notably in cells on the diagonal and just off the diagonal, indicating that firms’ relative levels of
excess cash tend to persist over time. To get a more parsimonious way of comparing the
matrices, we focus on the extremes of high and low excess cash, and sum the percentages in the
nine extreme north-west (low excess cash) and south-east (high excess cash) cells. For example,
for U.S. firms over 1994-1999, this number is 117 for the nine low excess cash cells (firms in
deciles 1, 2, or 3 in both years) and 124 in the nine high excess cash cells (firms in deciles 8, 9,
or 10 in both years). This is more than expected by chance (90 = 9 x 10) and so indicates
“stickiness” at both extremes. Numbers are similar at the high end of excess cash for U.S. firms
for 1999-2004 and 2004-2008 (totals are 131 and 129, respectively) and get somewhat higher

21
than this at the low end (totals are 168 and 145), which indicates increased persistence at low
levels of excess cash.
Consistent with the view of Japanese firms’ cash management practices discussed in
Section 1, the persistence of excess cash tends to be more pronounced for Japanese firms,
especially at high levels of excess cash. For these firms, at the low (high) end of excess cash the
percentages are 156 (217), 151 (169), and 202 (191) for the three periods, respectively. These
numbers are noticeably higher than those for U.S. firms in 5 of 6 cases. Moreover, this is always
true for the high excess cash deciles, indicating that Japanese firms with high levels of excess
cash tend to continue that practice over time, more so than U.S. firms in the same situation, and
(usually) more so than Japanese firms with low excess cash levels. These firms (Japanese firms
with high excess cash) are the ones that we posit as having poor governance practices.
We next link changes in excess cash to firm performance. For each country and each
transition period, we divide observations into those for which excess cash increases or decreases,
measured based on whether firms move up or down the deciles from the first year to the last
year. If improvements in cash management practices (lower excess cash) result from
improvements in governance, we expect this to translate into improved performance, and vice
versa. We expect any such effect to be more pronounced for Japanese firms, for which we argue
that cash management practices and corporate performance have both been relatively poor due to
poor governance. Table 4 also reports the results of this analysis—in particular, we report the
change in profitability (measured as ROA and ROE) over the transition period for the two groups
(higher and lower excess cash).
There is little evidence of any relation between excess cash transitions and changes in
performance for U.S. firms. For two of the three transition periods (1999-2004 and 2004-2008),

22
the changes are similar across the two groups (increases and decreases in deciles) and differences
are not statistically significant. For the first period (1994-1999) the differences are significant
and show, contrary to expectations, that firms that moved down the deciles (lower excess cash)
performed worse than firms that moved up the deciles.
The results for Japanese firms suggest that firms that improve their cash management
practices enjoy better performance than firms for which cash management gets worse. In all
three periods, firms that move down the deciles (that lower excess cash) display changes in
performance that exceed those for firms that move up the deciles. In the most recent period
(2004 through 2008), firms that move up the deciles report a mean change in ROA (ROE) of -
1.4% (-2.8%) versus 0.4% (-0.2%) for firms that move down the deciles, a difference significant
at the 5% (10%) level (two tailed). Results are stronger in the second period (1999 through
2004), with differences in ROA (ROE) significant at 5% (1%). In the earliest period, these
differences are not significant for ROA but are significant at 1% for ROE (although there are
relatively few observations in the first transition period).21
The Table 4 results show that, consistent with our predictions, there is an inverse relation
between changes in excess cash and changes in performance for Japanese firms. Table 5
examines how this result varies across keiretsu and non-keiretsu firms in Japan by regressing the
change in performance for a given period on the change in excess cash decile, the keiretsu
dummy, and an interaction between these variables. Based on the evidence above, we expect a
negative coefficient on the change in excess cash decile. The interaction term tests whether this
effect is systematically different for keiretsu firms, a possibility given their different governance
characteristics. We estimate these regressions for the two performance measures (ROA and
21Differences in medians tests (two-sample Wilcoxon rank sums) are also statistically significant at the 5 level or better for 1999-2004 and 2004-2008 and at the 10 level or better for 1994-1999.

23
ROE), for the three time periods, and for the full period pooled. We multiply coefficients by 100
so they can be interpreted as percentages.
The Table 5 results for ROA confirm the findings from Table 4: there is an inverse
relation between changes in excess cash and changes in performance for Japanese firms. The
coefficient on the change in excess cash decile is negative and statistically significant for the
second and third sub-periods (1999-2004 and 2004-2008) as well as overall, with t-statistics of -
2.27, -2.36, and -3.27, respectively. The coefficients seem reasonable in economic terms. The
overall coefficient is -0.33, implying that moving down five excess cash deciles (holding less
excess cash) improves performance by 165 basis points. These regressions also indicate that
keiretsu firms generally improve their performance relative to non-keiretsu firms over the second
and third sub-periods, by 131 basis points (t = 1.65) and 159 basis points (t = 2.68), respectively,
as well as overall (by 140 basis points, t = 3.16). This is evidence that keiretsu firms have
performed better than other Japanese firms since 1999.22 There is little evidence of an
interaction between the cash and keiretsu effects.
The Table 5 results for ROE are similar but not as strong as those for ROA.23 The
coefficient on the change in excess cash decile is negative and significant for the overall period
and the second sub-period (1999-2004) but not in either of the other periods. In the third sub-
period, the keiretsu variable is again reliably positive, with a coefficient of .038 (t = 2.90), as
well as being significant for the overall period. The interaction term is significantly negative
22 One possible explanation for this is that foreign investors are more likely to invest in keiretsu firms and then push for improvements in governance and performance, an idea we will test in the next version of the paper. 23 We place less weight on the ROE numbers (which are based on bottom-line earnings) relative to ROA (which are based on EBIT) for two reasons. First, ROE includes the effect of taxes, which is likely to muddy the waters in terms of measuring economic performance. Second, and more important, ROE reflects the effects of extraordinary items, which in Japan includes a larger set of non-operating items than in the U.S., which also distorts the usefulness of net income and hence ROE as a measure of economic performance.

24
overall but only significant in the first sub-period (t = -2.13), similar to the results for ROA,
suggesting a relation between cash holdings and performance for the keiretsu firms.
Overall, these results are consistent with our view that poor cash management practices
are indicative of poor governance in Japanese firms, and that improvements in cash management
(lower excess cash) are associated with improved corporate performance. Thus, while the
evidence in Tables 2 and 3 provides somewhat mixed evidence on whether the cash management
practices of Japanese firms improve over time, the evidence in Tables 4 and 5 shows that cross-
sectional variation in Japanese firms’ holdings of cash is inversely related to changes in
performance—for those Japanese firms that improve their cash management practices by holding
less excess cash there are improvements in performance.
4. Cash holdings, governance, and valuation
Our basic research question is whether the relatively high cash holdings of Japanese
companies reflect poor governance practices, whether these practices improve over the last ten
years, and, to the extent they have, whether this has translated into improved corporate
performance. The evidence in Section 3 shows that Japanese companies tend to hold relatively
large amounts of cash and that changes in cash holdings are inversely related to improvements in
corporate performance, consistent with the idea that improvements in governance, as manifested
in lower holdings of excess cash, are related to improved performance. A number of papers
investigate the relation between governance and cash holdings in a different way by examining
whether the relation between firm value and cash holdings varies as a function of governance
quality (e.g., Dittmar and Mahrt-Smith, 2007; Pinkowitz et al., 2006). More specifically, these
papers examine whether variation in the quality of governance is related to variation in the

25
valuation of cash holdings (and dividend policy). These papers generally find that cash holdings
(dividend payouts) are valued at lower (higher) amounts in countries/firms where governance is
poor, suggesting that cash holdings are more easily expropriated by managers when governance
is weak and that dividends help solve this problem.
We adapt this approach to our setting and investigate two predictions: (a) to the extent
that cash holdings in Japanese companies are unusually high because of poor governance, we
expect cash to be valued more highly in U.S. firms than Japanese firms, (b) to the extent that
governance in Japan improves over time, we expect any such differences to decline from the
1990s to the 2000s. We do not examine the relative valuation of dividends in these countries
because our earlier evidence indicates that the large majority of Japanese companies pay modest
dividends, so it is not clear that dividends in Japan are large enough to help resolve agency
problems.24
To perform this analysis we follow previous research and use two different regression
specifications, both of which are based on the approach in Fama and French (1998). In our case,
rather than estimating the regressions using panel data, we estimate the regressions by year and
country because our predictions are about differences between U.S. and Japanese companies and
how these differences evolve over time. The first specification follows the cash level
specification of Pinkowitz et al. (2006):25
Vi,t = α + β1Ei,t + β2dEi,t + β3dEi,t+1 + β4dNAi,t + β5dNAi,t+1 + β6RDi,t + β7dRDi,t + β8dRDi,t+1 +
β9Di,t + β10dDi,t + β11dDi,t+1 + β12dVi,t + β13Ci,t + εi,t … (1) 24 Consistent with this, our Table 2 regressions show that while cash holdings are negatively related to dividend payment for U.S. firms, implying that dividend-payers tend to hold less cash (in part because they are better governed and pay dividends), the opposite holds for Japanese firms, implying that dividends in these firms are generally too small to help resolve agency problems. As is clear from Table 1, the large majority of Japanese firms pay dividends, but these dividends tend to be small. 25 This is what Pinkowitz et al. (2006) refer to as their “level of cash” specification. They also use a “change in cash” specification. We have also estimated a version of their changes specification with similar results to those of the specifications discussed in the text.

26
where dXt denotes changes in X from t-1 to t, V denotes firm value, measured as the market
value of equity plus the book value of debt, E denotes earnings (EBIT), NA denotes net assets
(total assets minus cash), RD is research and development expense, D is common dividends, and
C is cash holdings. Our focus in this regression is on β13, which we expect to be smaller for
Japanese firms than U.S. firms, and to increase for Japanese firms as governance improves over
the sample period. Because this specification requires one year lead values, we can only
estimate (1) through 2007.
The second specification follows Dittmar and Mahrt-Smith (2007):
Vi,t = α + β1Ei,t + β2dEi,t + β3dEi,t+2 + β4RDi,t + β5dRDi,t + β6dRDi,t+2 + β7Di,t + β8dDi,t +
β9dDi,t+2 + β10dNAi,t + β11dNAi,t+2 + β12dVi,t+2 + β13Ci,t + εi,t … (2)
Here, all variables are deflated by NAt, and dXi,t denotes changes in X from t-2 to t. Thus, this
specification requires an extra lead year of data relative to (1), which means we can only
estimate (2) through 2006. Our focus is again on β13 for which we have the same expectations as
for (1). We use cash in this specification rather than excess cash because, as discussed in Section
3, the fit of our cash model varies over time and between countries, which would then affect
inferences from this model (i.e., there would be systematically more measurement error in the
excess cash variable for Japanese firms in the 1990s, clouding interpretation of trends in
coefficients on excess cash in the value regressions).
We report the results of these analyses in Table 6. To economize on the numbers in
tables, we report only the cash coefficients (with robust t-statistics) on cash for U.S. and
Japanese firms, along with tests for differences between these coefficients by year. The first two
columns report the cash coefficients from model (1) above; these numbers are also plotted in
Figure 7. For U.S. firms, the coefficients move around over time but are reliably positive at the

27
1% level or better in 15 of 18 years, and vary in roughly the 1 to 3 range over the sample period
without any obvious trend. In contrast, the coefficients for Japanese firms during the 1990s are
smaller than 1 and in most cases not significantly different from 0.26 Moreover, differences
between the coefficients for U.S. and Japanese firms are statistically significant (with those for
U.S. firms reliably larger) for all but two years over 1990 to 1999. Overall, these numbers
support our view that Japanese firms were less well-governed than U.S. firms in the 1990s and
that this manifests itself in investors pricing the cash holdings of Japanese firms at a discount to
those of U.S. firms.
Beginning in 2000, coefficients for the Japanese firms increase to around 1 or more, and
are consistently reliably greater than 1. Moreover, the coefficients for U.S. firms are no longer
consistently higher than those of Japanese firms (coefficients for U.S. firms are significantly
higher than those of Japanese firms in 2000, 2003, and 2006; differences are insignificant in
2001, 2002, 2004, and 2007; the difference is significantly larger for Japanese firms in 2005).
This evidence suggests that the governance of Japanese firms improves from the 1990s to the
2000s to levels comparable to those of U.S. firms.
The next two columns of Table 6 report cash coefficients from our estimations of (2) (the
Dittmar and Mahrt-Smith model). The overall conclusions here are similar to those from the first
specification: the coefficients on cash tend to be higher for U.S. firms than Japanese firms, with a
discernible upward trend for Japanese firms beginning around 1997 (see Figure 8). For U.S.
firms, the coefficients vary between 1.52 (t = 4.68) and 3.77 (t = 7.27) over 1990 to 1997, but
then show some tendency to increase, with numbers of 4 or larger in 1998 and 1999 and 2004 to
2006. For Japanese firms, the numbers vary from 0.51 (t = 3.63) to 1.69 (t = 8.25) over the
26 When the coefficients are significantly different from zero, they are also reliably less than 1; for example, the coefficients for 1993, 1994, and 1995 are 0.53 (t = 4.31), 0.28 (t = 2.38), and 0.34 (t = 3.21).

28
1990s, numbers that are significantly lower (at 5% or better) than those for U.S. firms in 7 of 10
years. The numbers for Japanese firms are generally higher in the 2000s, with values between
2.15 and 2.99 over 2003 to 2006. Coefficients for U.S. firms are significantly higher than for
Japanese firms in 3 of 7 years over 2000-2006, with the magnitude of the differences in favor of
U.S. firms but by smaller amounts than in the 1990s.
Overall, the evidence from these regressions is largely consistent with our predictions:
the valuation of the cash of Japanese firms is low during the 1990s, both in absolute terms and
relative to that of U.S. firms, but improves in the 2000s, to levels comparable to those of U.S.
firms. (We have also examined whether these results different for keiretsu and non-keiretsu
Japanese firms, but find little evidence of consistent or reliable differences.) This complements
the evidence from Section 4, where we find that Japanese firms’ management of cash changes
systematically from the 1990s to the 2000s, to more closely resemble how U.S. firms manage
cash, and that improvements in Japanese firms’ management of excess cash are associated with
improvements in performance.
5. Summary
We investigate whether the governance practices of Japanese companies, as manifested in
their holdings of cash, have improved over the past two decades, and whether any such
improvements translate into improved economic performance. We find that, in general, some of
the differences between Japanese and U.S. companies that were evident during the 1990s have
become less pronounced over the past 10 years but that important differences remain. While
overall levels of cash holdings are now roughly the same for U.S. and Japanese companies, when
we condition on firm characteristics we find that Japanese firms still hold substantially more cash

29
than U.S. firms. We do find, however, that regressions of the determinants of firms’ cash
holdings developed using U.S. data (e.g., Opler et al., 1999; Bates et al., 2009) fit Japanese firms
better in the 2000s than in the 1990s, suggesting that Japanese managers now pay more attention
to the economic determinants of their firms’ cash holdings, consistent with improved
governance.
Although the large majority of Japanese companies continue to pay dividends, and the
size of those dividends has increased for some Japanese firms, dividends paid by the median
Japanese dividend-payer are still about half as large as those of the median U.S. dividend payer.
Further, while the performance (profitability) of Japanese firms has improved since the 1990s, it
is still 200 to 300 bps below that of U.S. firms. And while P/E ratios of Japanese firms have
steadily declined over time and are now roughly comparable to those of U.S. firms, market-to-
book ratios of Japanese firms are still much lower than those of U.S. firms, with medians of
around 1 during the 2000s (compared to at least 2 for U.S. firms in these years).
We find mixed evidence on whether the cash management practices of Japanese firms
have improved over time, perhaps because governance has improved for some firms but not
others. Consistent with this, we find that levels of excess cash display greater persistence for
Japanese firms than U.S. firms, and that this tendency is stronger for high levels of excess cash,
which we associate with poor governance. Further, and consistent with the idea that
improvements in governance manifest themselves in lower holdings of cash, we find an inverse
relation between the (excess) cash holdings of Japanese firms and changes in their performance.
This result does not hold for U.S. firms, which we argue are generally better governed. Further,
we find that the valuations of cash holdings for Japanese firms were systematically lower than
those of U.S. firms in the 1990s, consistent with the idea that these firms were, on average,

30
poorly governed during this period. The valuation of cash holdings of Japanese firms increases
from the 1990s to the 2000s, to levels comparable to those of U.S. firms, consistent with an
improvement in governance.
Overall, our findings support two conclusions. First, there is mixed evidence about
whether governance practices in the average Japanese firm improve over the last 10 years, at
least as manifested in their management of cash holdings. Second, those Japanese firms that are
able to improve their management of cash enjoy both an improvement in performance and
improved valuation of cash holdings. This evidence generally then supports the ideas that there
has been some improvement in the governance practices of Japanese companies and that this
translates into improved performance. This evidence offers hope that further improvements in
the governance of Japanese companies will improve corporate performance and perhaps
stimulate overall economic performance in Japan.

31
!"
#!!!"
$!!!!"
$#!!!"
%!!!!"
%#!!!"
&!!!!"
&#!!!"
'!!!!"
'#!!!"
$('()'"
$('()#"
$('()*"
$('()+"
$('())"
$('(),"
$('(,!"
$('(,$"
$('(,%"
$('(,&"
$('(,'"
$('(,#"
$('(,*"
$('(,+"
$('(,)"
$('(,,"
$('(!!"
$('(!$"
$('(!%"
$('(!&"
$('(!'"
$('(!#"
$('(!*"
$('(!+"
$('(!)"
$('(!,"
$('($!"
$('($$"
!"#$%&'()'*"++&"',,-.'/01$0%2'(345'67'8967:&%',;((<'

32
!"!!!#
!"$!!#
!"%!!#
!"&!!#
!"'!!#
!"(!!#
!")!!#
!"*!!#
!"+!!#
!",!!#
$"!!!#
$,,!# $,,$# $,,%# $,,&# $,,'# $,,(# $,,)# $,,*# $,,+# $,,,# %!!!# %!!$# %!!%# %!!&# %!!'# %!!(# %!!)# %!!*# %!!+#
!"#$%&
'(&)(*+,+*-'
*./#
0-"1(
!+23"-(45(!"#$%&'(&)(6+,+*-'*(7#0-"15(89(:1&;+*(;+'-<(#'*(=#/#'-1-(:*#1>-*(;+'-<(?"@1A(BCCD.4DDE(

33
!"
!#!!$"
!#!%"
!#!%$"
!#!&"
!#!&$"
!#!'"
!#!'$"
!#!("
!#!($"
%))!" %))%" %))&" %))'" %))(" %))$" %))*" %))+" %))," %)))" &!!!" &!!%" &!!&" &!!'" &!!(" &!!$" &!!*" &!!+" &!!,"
!"#"$%
&$'()*
+
,"-./%+01+23456/67#%+'"8%+39+$"#"$%&$'+93/+:;+6&$+<656&%'%+=/4'>+?@@ABCAAD+
-."/012"
-."/03412"
56"/012"
56"/03412"

34
!"#"$"%
!"#"&"%
"#"""%
"#"&"%
"#"$"%
"#"'"%
"#"("%
"#)""%
"#)&"%
"#)$"%
)**"% )**)% )**&% )**+% )**$% )**,% )**'% )**-% )**(% )***% &"""% &"")% &""&% &""+% &""$% &"",% &""'% &""-% &""(%
!"#$%&'()*+,--./
$)#0$
12-34.$56$!"#$784$9:$,;/$<,=,;.>.$?4@>A$BCCDEFDDG$
./%0123%
./%014523%
67%0123%
67%014523%

35
!"!!!#
$!"!!!#
%!"!!!#
&!"!!!#
'!"!!!#
(!"!!!#
)!"!!!#
*!"!!!#
+!"!!!#
,!"!!!#
$!!"!!!#
$,,!# $,,$# $,,%# $,,&# $,,'# $,,(# $,,)# $,,*# $,,+# $,,,# %!!!# %!!$# %!!%# %!!&# %!!'# %!!(# %!!)# %!!*# %!!+#
!"#$%&
'($
)*+,-.$/01$2.&3$&34$5.4*&3$!"#$-&'(6$7(-$8&9&3.6.$:(59&3*.6;$<==>?@>>A$

36
!"!!!#
$!"!!!#
%!"!!!#
&!"!!!#
'!"!!!#
(!"!!!#
)!"!!!#
*!"!!!#
+!"!!!#
,!"!!!#
$!!"!!!#
$,,!# $,,$# $,,%# $,,&# $,,'# $,,(# $,,)# $,,*# $,,+# $,,,# %!!!# %!!$# %!!%# %!!&# %!!'# %!!(# %!!)# %!!*# %!!+#
!"#$%&
'($
)*+,-.$/01$2.&3$&34$5.4*&3$!"#$%&'(6$7(-$89$)*-56:$;<<=>?==@$

37
!"
!#!$"
!#!%"
!#!&"
!#!'"
!#("
!#($"
!#(%"
!#(&"
!#('"
!#$"
())!"())("())$"())*"())%"())+"())&"()),"())'"()))"$!!!"$!!("$!!$"$!!*"$!!%"$!!+"$!!&"$!!,"$!!'"
!"#$%&'(
)*+,-.(/0(!"#$($123*4+#(15(6"7"4.#.(8.*-.9#,("43(414:8.*-.9#,(;-<#(-.2"=>.(91(?@(;-<#("A.-(B143*=14*4+(14(;-<(B$"-"B9.-*#=B#C(
DEEF:GFFH(
-./.0121"030451671829":7;2"
<1671829":7;2"

38
!"#
$#
"#
%#
&#
'#
(#
)#
"**$# "**"# "**%# "**&# "**'# "**(# "**)# "**+# "**,# "***# %$$$# %$$"# %$$%# %$$&# %$$'# %$$(# %$$)# %$$+#
!"#$%&'()'*+&,-"&./0'+.'-102'3&4&30'5%+6'1..$13'7".8+9"/:'&/'13;'<=>>?@'413$&'%&#%&00"+.0'5+%'A1B1.&0&'1.C'DE'F%60'
-.#/0123##
45#6123#

39
!"
#"
$"
%"
&"
'"
("
#))!" #))#" #))$" #))%" #))&" #))'" #))(" #))*" #))+" #)))" $!!!" $!!#" $!!$" $!!%" $!!&" $!!'" $!!("
!"#$%&'()'*+&,-"&./0'+.'-102'3&4&30'5%+6'1..$13'7"861%'1.9':12%/;<6"/2'413$&'%&#%&00"+.0'5+%'=1>1.&0&'1.9'?<'@%60'
'
,-"./01"
23"./01"

TABLE 1 Univariate statistics for U.S. and Japanese industrial firms, 1990 to 2008
Panel A: Cash/TA U.S. Firms: Japanese firms:
Year Mean Median Mean Median Difference in means
Difference in medians
1990 0.069 0.028 0.160 0.138 0.000 0.000 1991 0.081 0.040 0.146 0.124 0.000 0.000 1992 0.086 0.049 0.136 0.113 0.000 0.000 1993 0.085 0.049 0.126 0.107 0.000 0.000 1994 0.098 0.054 0.128 0.107 0.000 0.000 1995 0.110 0.059 0.125 0.104 0.000 0.000 1996 0.123 0.068 0.115 0.095 0.067 0.000 1997 0.125 0.071 0.107 0.085 0.000 0.000 1998 0.136 0.068 0.110 0.087 0.000 0.000 1999 0.153 0.063 0.120 0.096 0.000 0.000 2000 0.142 0.069 0.131 0.102 0.019 0.000 2001 0.143 0.072 0.135 0.104 0.094 0.000 2002 0.144 0.079 0.151 0.113 0.154 0.000 2003 0.169 0.099 0.158 0.119 0.042 0.000 2004 0.157 0.096 0.161 0.117 0.467 0.000 2005 0.160 0.096 0.160 0.120 0.987 0.000 2006 0.163 0.095 0.150 0.114 0.006 0.000 2007 0.174 0.106 0.142 0.112 0.000 0.114 2008 0.174 0.109 0.139 0.108 0.000 0.713
Total 0.139 0.075 0.137 0.108 0.118 0.000 1990-1999 0.113 0.056 0.126 0.104 0.000 0.000 2000-2008 0.158 0.091 0.148 0.112 0.000 0.000
Sample comprises all U.S. and Japanese listed firms with non-missing total assets in a given year from WorldScope. Sample excludes firms from the utilities, transportation, and financial industries. These numbers are winsorized at 1.0.

41
TABLE 1 Univariate statistics for U.S. and Japanese industrial firms, 1990 to 2008
Panel B: Fraction of Dividend Payers
Year U.S. Firms
Japanese firms
P-value for difference
1990 0.550 0.945 0.000 1991 0.500 0.940 0.000 1992 0.483 0.926 0.000 1993 0.460 0.887 0.000 1994 0.374 0.850 0.000 1995 0.351 0.842 0.000 1996 0.292 0.859 0.000 1997 0.259 0.870 0.000 1998 0.234 0.851 0.000 1999 0.224 0.802 0.000 2000 0.212 0.817 0.000 2001 0.206 0.811 0.000 2002 0.204 0.778 0.000 2003 0.243 0.793 0.000 2004 0.266 0.824 0.000 2005 0.284 0.848 0.000 2006 0.291 0.858 0.000 2007 0.302 0.866 0.000 2008 0.307 0.867 0.000
Total 0.295 0.846 0.000 1990-1999 0.337 0.870 0.000 2000-2008 0.254 0.830 0.000
Sample comprises all U.S. and Japanese listed firms with non-missing total assets in a given year from WorldScope. Sample excludes firms from the utilities, transportation, and financial industries.

42
TABLE 1 Univariate statistics for U.S. and Japanese industrial firms, 1990 to 2008
Panel C: Dividends/TA U.S. Firms: Japanese firms:
Year Mean Median Mean Median Difference in means
Difference in medians
1990 0.031 0.020 0.007 0.006 0.000 0.000 1991 0.027 0.019 0.006 0.006 0.000 0.000 1992 0.027 0.019 0.007 0.006 0.000 0.000 1993 0.028 0.019 0.007 0.006 0.000 0.000 1994 0.025 0.017 0.007 0.006 0.000 0.000 1995 0.027 0.017 0.006 0.006 0.000 0.000 1996 0.027 0.016 0.006 0.006 0.000 0.000 1997 0.026 0.017 0.007 0.006 0.000 0.000 1998 0.023 0.016 0.007 0.006 0.000 0.000 1999 0.023 0.015 0.008 0.006 0.000 0.000 2000 0.021 0.015 0.008 0.006 0.000 0.000 2001 0.021 0.014 0.009 0.006 0.000 0.000 2002 0.022 0.014 0.008 0.006 0.000 0.000 2003 0.022 0.014 0.008 0.006 0.000 0.000 2004 0.030 0.015 0.008 0.006 0.000 0.000 2005 0.031 0.016 0.009 0.007 0.000 0.000 2006 0.031 0.018 0.010 0.007 0.000 0.000 2007 0.035 0.018 0.011 0.008 0.000 0.000 2008 0.040 0.020 0.012 0.009 0.000 0.000
Total 0.027 0.017 0.008 0.006 0.000 0.000 1990-1999 0.026 0.017 0.007 0.006 0.000 0.000 2000-2008 0.028 0.016 0.009 0.007 0.000 0.000
Sample comprises all U.S. and Japanese listed firms with non-missing total assets in a given year from WorldScope. Sample excludes firms from the utilities, transportation, and financial industries. These numbers are computed across dividend-paying firms only

43
TABLE 1 Univariate statistics for U.S. and Japanese industrial firms, 1990 to 2008
Panel D: ROA (EBIT/TA) U.S. Firms: Japanese firms:
Year Mean Median Mean Median Difference in means
Difference in medians
1990 0.114 0.111 0.079 0.071 0.000 0.000 1991 0.095 0.093 0.078 0.070 0.000 0.000 1992 0.091 0.092 0.064 0.058 0.000 0.000 1993 0.088 0.094 0.047 0.044 0.000 0.000 1994 0.106 0.110 0.041 0.037 0.000 0.000 1995 0.101 0.113 0.043 0.038 0.000 0.000 1996 0.089 0.112 0.045 0.039 0.000 0.000 1997 0.055 0.105 0.045 0.039 0.030 0.000 1998 0.020 0.091 0.038 0.032 0.001 0.000 1999 -0.001 0.078 0.036 0.029 0.000 0.000 2000 0.009 0.077 0.040 0.033 0.000 0.000 2001 -0.024 0.046 0.040 0.033 0.000 0.000 2002 -0.009 0.050 0.032 0.026 0.000 0.000 2003 0.013 0.061 0.048 0.034 0.000 0.000 2004 0.033 0.080 0.064 0.048 0.000 0.000 2005 0.034 0.082 0.069 0.054 0.000 0.000 2006 0.038 0.085 0.064 0.057 0.000 0.000 2007 0.036 0.083 0.060 0.058 0.000 0.000 2008 -0.006 0.056 0.048 0.048 0.000 0.008
Total 0.038 0.084 0.051 0.044 0.000 0.000 1990-1999 0.066 0.100 0.049 0.044 0.000 0.000 2000-2008 0.0135 0.069 0.052 0.044 0.000 0.000
Sample comprises all U.S. and Japanese listed firms with non-missing total assets in a given year from WorldScope. Sample excludes firms from the utilities, transportation, and financial industries. These numbers are winsorized at 1.0 and -1.0.

44
TABLE 1 Univariate statistics for U.S. and Japanese industrial firms, 1990 to 2008
Panel E: Market/Book Ratio U.S. Firms: Japanese firms:
Year Mean Median Mean Median Difference in means
Difference in medians
1990 2.149 1.307 4.640 3.450 0.000 0.000 1991 2.993 1.751 3.655 2.817 0.000 0.000 1992 3.079 2.002 2.420 1.916 0.000 0.060 1993 3.187 2.214 2.293 1.808 0.000 0.000 1994 3.002 2.024 2.611 1.965 0.000 0.263 1995 3.616 2.387 2.209 1.665 0.000 0.000 1996 3.718 2.441 2.570 1.937 0.000 0.000 1997 3.819 2.558 1.930 1.399 0.000 0.000 1998 3.806 2.067 1.692 1.000 0.000 0.000 1999 5.020 2.190 2.061 1.006 0.000 0.000 2000 3.447 1.719 2.168 1.000 0.000 0.000 2001 3.424 1.929 1.860 1.000 0.000 0.000 2002 2.754 1.500 1.634 1.000 0.000 0.000 2003 3.829 2.344 1.569 1.000 0.000 0.000 2004 3.814 2.545 2.311 1.146 0.000 0.000 2005 3.680 2.467 2.378 1.334 0.000 0.000 2006 3.750 2.538 2.504 1.582 0.000 0.000 2007 3.549 2.254 1.825 1.247 0.000 0.000 2008 2.242 1.187 1.434 1.000 0.000 0.000
Total 3.498 2.105 2.177 1.318 0.000 0.000 1990-1999 3.601 2.157 2.485 1.724 0.000 0.000 2000-2008 3.401 2.063 1.969 1.061 0.000 0.000
Sample comprises all U.S. and Japanese listed firms with non-missing total assets in a given year from WorldScope. Sample excludes firms from the utilities, transportation, and financial industries. These numbers are winsorized at 1.0 and 30.0.

45
TABLE 1 Univariate statistics for U.S. and Japanese industrial firms, 1990 to 2008
Panel F: P/E Ratios U.S. Firms: Japanese firms:
Year Mean Median Mean Median Difference in means
Difference in medians
1990 20.953 13.569 79.885 50.095 0.000 0.000 1991 35.897 19.727 64.630 40.771 0.000 0.000 1992 31.937 20.542 62.864 35.870 0.000 0.000 1993 36.433 20.870 76.651 42.412 0.000 0.000 1994 28.060 16.789 93.354 51.132 0.000 0.000 1995 33.394 18.657 74.165 39.850 0.000 0.000 1996 35.885 20.392 75.691 41.173 0.000 0.000 1997 37.470 21.439 52.166 31.219 0.000 0.000 1998 38.053 19.774 50.204 24.719 0.000 0.000 1999 42.630 18.388 55.754 28.438 0.000 0.000 2000 33.575 16.071 50.935 23.402 0.000 0.000 2001 44.462 23.205 37.272 20.264 0.001 0.000 2002 29.617 17.409 43.852 20.014 0.000 0.000 2003 38.849 23.284 35.114 17.116 0.070 0.000 2004 38.647 22.796 37.491 20.728 0.583 0.000 2005 36.142 21.395 38.581 20.519 0.152 0.013 2006 36.535 21.476 38.653 23.507 0.192 0.000 2007 34.418 20.011 31.586 18.125 0.111 0.000 2008 22.020 13.262 25.524 13.442 0.016 0.537
Total 34.989 19.668 49.442 25.551 0.000 0.000 1990-1999 34.770 19.063 66.846 37.010 0.000 0.000 2000-2008 35.228 20.326 37.305 19.608 0.001 0.000
Sample comprises all U.S. and Japanese listed firms with non-missing total assets in a given year from WorldScope. Sample excludes firms from the utilities, transportation, and financial industries. These numbers are winsorized at the 99th percentiles by country.

46
TABLE 2 OLS regressions of firms’ cash holdings (cash/ta) on set of predicted determinants for U.S. and
Japanese industrial firms with available data over 1990-2008.
U.S.: 1990-2008
U.S.: 1990-1999
U.S.: 2000-2008
Japan: 1990-2008
Japan: 1990-1999
Japan: 2000-2008
Int. 0.242
(21.3) 0.180 (11.3)
0.273 (23.0)
0.227 (2.11)
0.097 (2.11)
0.248 (9.11)
Year 2000-2003 0.015 (3.66)
-0.13 (-1.47)
Year 2004-2008 0.017 (3.64)
-.020 (-2.18)
Size -0.013 (-9.88)
-0.010 (-7.85)
-0.014 (-8.34)
-0.012 (-4.60)
0.001 (0.17)
-0.015 (-6.50)
Div. pay dummy -.037 (-8.46)
-0.038 (-7.26)
-0.033 (-5.39)
0.019 (3.46)
0.026 (4.07)
0.015 (2.42)
Leverage -0.172 (-19.5)
-0.164 (-12.7)
-0.170 (-15.0)
-0.128 (-4.75)
-0.055 (-1.07)
-0.156 (-5.69)
ROE 0.016 (2.16)
0.008 (1.04)
0.019 (1.73)
0.019 (1.89)
0.052 (2.16)
0.010 (1.10)
Loss dummy -0.007 (-1.65)
-0.006 (-1.55)
-0.007 (-1.20)
0.001 (0.39)
0.002 (0.20)
0.003 (0.73)
Market/Book 0.002 (5.08)
0.003 (4.81)
0.002 (3.63)
0.007 (4.83)
0.002 (1.40)
0.008 (5.06)
Closely held -0.003 (-0.30)
-0.004 (-0.36)
0.002 (0.20)
0.032 (2.67)
0.027 (1.10)
0.034 (2.76)
Ind. Sigma 0.177 (5.25)
0.567 (5.48)
0.159 (5.88)
0.812 (4.62)
-0.141 (-0.38)
0.796 (4.54)
Net WC -0.228 (-17.1)
-0.177 (-8.22)
-0.258 (-21.0)
-0.070 (-4.34)
-0.034 (-1.24)
-0.080 (-4.88)
R&D 0.208 (16.3)
0.176 (10.3)
0.221 (14.4)
0.514 (10.20)
0.317 (2.26)
0.517 (9.26)
Capex -0.345 (-11.0)
-0.306 (-6.75)
-0.367 (-9.20)
-0.557 (-7.67)
-0.444 (-3.10)
-0.591 (-7.54)
Cash Flow 0.073 (6.12)
0.076 (5.39)
0.074 (4.60)
0.273 (5.95)
0.227 (1.31)
0.288 (6.01)
Keiretsu dummy na na na -0.028 (-6.72)
-0.031 (-4.27)
-0.027 (-6.38)
Obs. 22,095 9,684 12,411 12,736 2,779 9,957 Adj. R-square 0.331 0.305 0.320 0.223 0.114 0.254
We measure size as the natural log of total assets, leverage as the ratio of long-term debt to total assets, ROE as net income deflated by lagged stockholders’ equity, net working capital as current assets minus current liabilities minus

47
cash deflated by total assets, R&D as research and development expenditures deflated by sales, capital expenditures as capital expenditures deflated by total assets, and cash flow as funds from operations deflated by total assets. The dividend-payer dummy is set to 1 for dividend-payers and 0 otherwise. The loss dummy is set to 1 for firms with negative net income and 0 otherwise. Closely held is the fraction of shares held by insiders; in Japan, it is measured as the fraction of shares held by the ten largest shareholders. We construct industry sigma as the mean of the standard deviations of cash flow/assets over the past 10 years for firms in a given industry. We define industry by using industry group variable (WC06011) from WorldScope. We use three-digit code for miscellaneous industry and two-digit code for all other industries. Due to the requirement of cash flow data in the past 10 years, industry sigma could not be calculated for observations before 1990. The keiretsu dummy is set to 1 for firms with relatively high inclination to the largest six horizontal “enterprise” groups in Japan, measured in 2001, and sourced from Industrial Groupings in Japan (2001); see text for more detail. We report t-statistics in parentheses (standard errors are computed after clustering by firm and year).

48
TABLE 3 Selected summary statistics from annual cross-sectional regressions explaining U.S. and Japanese
firms’ cash holdings
Obs. Adj. R-squared Japan intercept dummy (t-stat)
Keiretsu intercept
dummy (t-stat)
1990 934 0.255 0.145 (8.02) -0.035 (-2.42) 1991 916 0.285 0.164 (9.44) -0.045 (-3.31) 1992 926 0.274 0.190 (10.7) -0.045 (-3.40) 1993 997 0.237 0.170 (10.5) -0.046 (-3.71) 1994 996 0.335 0.181 (10.3) -0.044 (-3.37) 1995 1,184 0.321 0.150 (8.46) -0.055 (-3.96) 1996 1,550 0.264 0.097 (6.44) -0.028 (-2.96) 1997 1,652 0.224 0.094 (6.46) -0.024 (-2.39) 1998 1,667 0.252 0.101 (6.45) -0.020 (-1.90) 1999 1,697 0.293 0.063 (3.83) -0.022 (-1.80) 2000 2,094 0.278 0.069 (4.77) -0.027 (-2.93) 2001 2,257 0.233 0.035 (2.57) -0.033 (-3.68) 2002 2,509 0.206 0.089 (7.35) -0.039 (-4.80) 2003 2,534 0.278 0.113 (9.13) -0.048 (-5.69) 2004 2,878 0.269 0.116 (10.4) -0.046 (-5.58) 2005 2,931 0.287 0.123 (11.0) -0.048 (-5.85) 2006 2,685 0.332 0.112 (10.3) -0.040 (-5.21) 2007 2,437 0.340 0.111 (9.61) -0.041 (-5.18) 2008 2,285 0.322 0.084 (6.95) -0.038 (-4.75)
The table reports selected summary statistics from regressions of cash holdings on firm characteristics for Japanese and U.S. firms. These regressions are estimated as annual cross-sections for all U.S. and Japanese firms with available data. The dependent variable is cash/total assets. Independent variables are the Japan intercept dummy (set to one for Japanese firms and zero for U.S. firms), size, dividend-payer dummy, leverage, ROE, a loss dummy, market-to-book, the percentage of closely held shares, industry sigma, net working capital, R&D, capital expenditures, and cash flow. For more detailed definitions, see Table 2 notes.

49
TABLE 4 Transition matrices showing changes in firms’ holding of excess cash, where firms are sorted into excess cash deciles at the beginning and end of three periods (1994-1999, 1999-2004, 2004-2008) and tables show transitions between excess cash deciles during these periods. Panel A: U.S. Firms U.S. Firms, 1994-1999
Obs. 1 2 3 4 5 6 7 8 9 10 1 79 17.07 29.27 17.07 7.32 4.88 9.76 2.44 2.44 9.76 0.00 2 81 8.82 2.94 23.53 23.53 11.76 5.88 8.82 2.94 11.76 0.00 3 80 6.82 6.82 4.55 22.73 11.36 15.91 13.64 9.09 6.82 2.27 4 80 3.23 16.13 19.35 19.35 22.58 6.45 9.68 3.23 0.00 0.00 5 80 2.50 5.00 10.00 7.50 20.00 22.50 15.00 10.00 7.50 0.00 6 80 0.00 0.00 5.26 13.16 18.42 21.05 21.05 10.53 5.26 5.26 7 80 10.00 12.50 7.50 5.00 2.50 17.50 20.00 10.00 7.50 7.50 8 80 0.00 0.00 5.26 5.26 21.05 21.05 21.05 10.53 10.53 5.26 9 80 4.76 7.14 9.52 4.76 2.38 7.14 19.05 26.19 16.67 2.38 10 81 4.55 2.27 2.27 11.36 15.91 2.27 9.09 18.18 22.73 11.36
Obs. Mean ROA change
Median ROA change
Mean ROE change
Median ROE change
Firms that move up 150 -0.3% -0.7% 1.0% 0.0% Firms that move down 149 -5.3% -1.8% -6.1% -2.1% P-value for diff. 0.030 0.314 0.030 0.263
U.S. Firms, 1999-2004
Obs. 1 2 3 4 5 6 7 8 9 10 1 129 33.33 16.67 15.38 3.85 2.56 3.85 8.97 5.13 7.69 2.56 2 129 24.39 17.07 17.07 9.76 6.10 6.10 3.66 9.76 2.44 3.66 3 130 12.70 11.11 20.63 11.11 11.11 7.94 9.52 1.59 4.76 9.52 4 129 2.99 19.40 11.94 11.94 11.94 8.96 7.46 11.94 7.46 5.97 5 130 4.35 10.14 7.25 17.39 7.25 14.49 13.04 10.14 10.14 5.80 6 129 6.49 5.19 11.69 15.58 14.29 15.58 10.39 9.09 5.19 6.49 7 129 2.53 8.86 2.53 8.86 20.25 17.72 7.59 6.33 12.66 12.66 8 130 4.55 4.55 4.55 12.12 12.12 13.64 19.70 21.21 3.03 4.55 9 129 1.30 5.19 7.79 6.49 11.69 6.49 11.69 20.78 18.18 10.39
10 130 2.78 8.33 8.33 6.94 6.94 5.56 8.33 12.50 12.50 27.78
Obs. Mean ROA Median Mean ROE Median

50
change ROA change
change ROE change
Firms that move up 238 2.4% -1.6% 3.9% -1.8% Firms that move down 289 2.4% -1.5% 2.2% -1.9% P-value for diff. 0.99 0.79 0.67 0.69
U.S. Firms, 2004-2008
Obs. 1 2 3 4 5 6 7 8 9 10 1 166 23.88 20.90 8.96 10.45 5.97 2.99 1.49 8.96 7.46 8.96 2 167 16.00 21.33 13.33 16.00 4.00 4.00 8.00 8.00 4.00 5.33 3 167 8.99 10.11 21.35 11.24 14.61 5.62 4.49 8.99 6.74 7.87 4 167 14.81 4.94 9.88 16.05 14.81 4.94 9.88 8.64 12.35 3.70 5 167 5.62 5.62 11.24 22.47 11.24 12.36 13.48 5.62 4.49 7.87 6 167 5.95 11.90 5.95 11.90 10.71 14.29 11.90 13.10 10.71 3.57 7 167 3.70 2.47 11.11 9.88 16.05 13.58 18.52 11.11 8.64 4.94 8 167 1.23 7.41 6.17 7.41 11.11 12.35 14.81 16.05 14.81 8.64 9 167 8.00 6.67 8.00 2.67 6.67 17.33 9.33 13.33 17.33 10.67
10 167 12.16 9.46 0.00 2.70 9.46 9.46 8.11 9.46 13.51 25.68
Obs. Mean ROA change
Median ROA change
Mean ROE change
Median ROE change
Firms that move up 283 -3.3% -2.9% -7.8% -4.1% Firms that move down 310 -4.8% -2.4% -4.0% -4.5% P-value for diff. 0.46 0.71 0.31 0.92
Panel B: Japanese Firms
Japanese Firms, 1994-1999
Obs. 1 2 3 4 5 6 7 8 9 10 1 19 44.44 11.11 5.56 5.56 11.11 5.56 11.11 5.56 0.00 0.00 2 20 9.09 27.27 18.18 27.27 9.09 0.00 9.09 0.00 0.00 0.00 3 19 6.67 20.00 13.33 13.33 0.00 26.67 13.33 0.00 6.67 0.00 4 20 0.00 12.50 18.75 18.75 12.50 18.75 12.50 6.25 0.00 0.00 5 19 14.29 14.29 7.14 7.14 28.57 7.14 0.00 14.29 0.00 7.14 6 20 0.00 15.38 15.38 0.00 15.38 15.38 15.38 7.69 7.69 7.69 7 19 0.00 6.25 0.00 6.25 0.00 25.00 31.25 25.00 6.25 0.00 8 20 0.00 0.00 0.00 12.50 12.50 0.00 12.50 12.50 37.50 12.50 9 19 0.00 0.00 0.00 9.09 9.09 0.00 0.00 27.27 36.36 18.18
10 20 0.00 0.00 9.09 0.00 0.00 9.09 9.09 9.09 54.55 9.09
Obs. Mean ROA Median Mean ROE Median

51
change ROA change
change ROE change
Firms that move up 53 -2.2% -2.2% -9.3% -3.8% Firms that move down 45 -0.9% -0.6% -0.5% -1.0% P-value for diff. 0.125 0.077 0.004 0.015
Japanese Firms, 1999-2004
Obs. 1 2 3 4 5 6 7 8 9 10 1 40 28.13 21.88 18.75 6.25 9.38 9.38 3.13 3.13 0.00 0.00 2 40 14.71 14.71 23.53 26.47 2.94 5.88 5.88 2.94 2.94 0.00 3 40 8.82 8.82 11.76 14.71 26.47 8.82 2.94 11.76 2.94 2.94 4 41 12.12 21.21 12.12 9.09 12.12 21.21 3.03 6.06 3.03 0.00 5 40 2.94 14.71 5.88 26.47 17.65 14.71 8.82 2.94 2.94 2.94 6 40 11.11 5.56 13.89 19.44 13.89 8.33 19.44 5.56 2.78 0.00 7 41 3.13 21.88 12.50 12.50 9.38 9.38 15.63 9.38 6.25 0.00 8 40 8.82 2.94 8.82 5.88 11.76 5.88 8.82 14.71 23.53 8.82 9 40 2.78 5.56 11.11 2.78 11.11 2.78 5.56 19.44 33.33 5.56
10 41 3.03 0.00 3.03 3.03 6.06 6.06 15.15 15.15 12.12 36.36
Obs. Mean ROA change
Median ROA change
Mean ROE change
Median ROE change
Firms that move up 125 0.6% 1.0% 0.9% 2.7% Firms that move down 149 2.4% 2.6% 8.0% 4.1% P-value for diff. 0.040 0.003 0.006 0.001
Japanese Firms, 2004-2008
Obs. 1 2 3 4 5 6 7 8 9 10 1 120 53.54 16.16 9.09 4.04 6.06 3.03 3.03 1.01 0.00 4.04 2 121 24.11 27.68 19.64 10.71 3.57 7.14 2.68 1.79 1.79 0.89 3 121 4.35 23.48 23.48 17.39 11.30 3.48 6.96 4.35 2.61 2.61 4 121 7.14 11.61 11.61 18.75 16.07 16.07 9.82 5.36 1.79 1.79 5 121 4.39 7.02 11.40 13.16 15.79 15.79 9.65 13.16 7.02 2.63 6 121 3.74 1.87 8.41 11.21 22.43 13.08 14.95 14.95 7.48 1.87 7 121 2.54 3.39 5.08 11.02 10.17 16.95 20.34 12.71 9.32 8.47 8 121 1.87 4.67 3.74 5.61 8.41 12.15 16.82 19.63 21.50 5.61 9 121 2.73 1.82 4.55 4.55 4.55 9.09 10.00 10.00 30.00 22.73
10 121 1.90 0.95 2.86 2.86 1.90 3.81 3.81 13.33 21.90 46.67
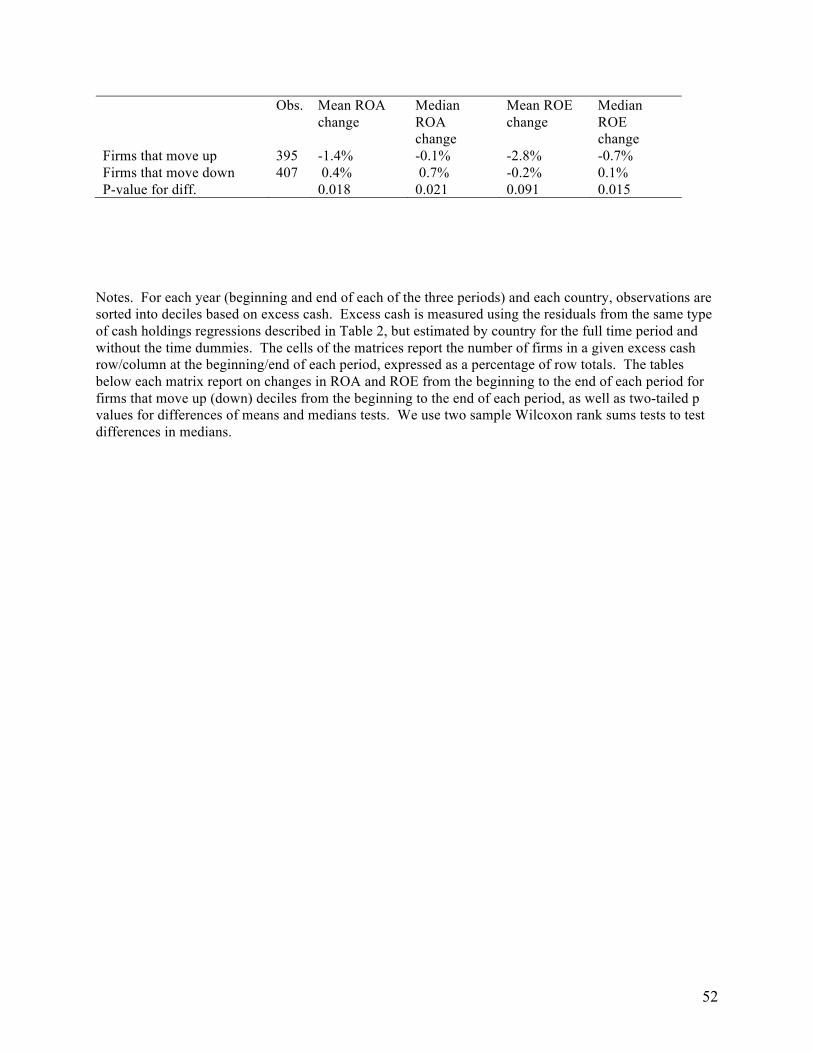
52
Obs. Mean ROA change
Median ROA change
Mean ROE change
Median ROE change
Firms that move up 395 -1.4% -0.1% -2.8% -0.7% Firms that move down 407 0.4% 0.7% -0.2% 0.1% P-value for diff. 0.018 0.021 0.091 0.015
Notes. For each year (beginning and end of each of the three periods) and each country, observations are sorted into deciles based on excess cash. Excess cash is measured using the residuals from the same type of cash holdings regressions described in Table 2, but estimated by country for the full time period and without the time dummies. The cells of the matrices report the number of firms in a given excess cash row/column at the beginning/end of each period, expressed as a percentage of row totals. The tables below each matrix report on changes in ROA and ROE from the beginning to the end of each period for firms that move up (down) deciles from the beginning to the end of each period, as well as two-tailed p values for differences of means and medians tests. We use two sample Wilcoxon rank sums tests to test differences in medians.

53
TABLE 5 OLS regressions of change in firm performance on changes in excess cash deciles, keiretsu
membership, and interaction term
Panel A: Dependent variable is change in ROA
1994-1999 1999-2004 2004-2008 Pooled Intercept -0.89
(-1.93) 1.17
(2.29) -0.54
(-1.75) -0.24
(-0.98) Change in excess cash decile -0.00
(-0.01) -0.40
(-2.27) -0.30
(-2.36) -0.33
(-3.27) Keiretsu dummy -0.52
(-0.69) 1.31
(1.65) 1.59
(2.68) 1.40
(3.16) Interaction -0.51
(-1.73) 0.15
(0.53) 0.14
(0.55) 0.02
(0.14) Adjusted R-squared 0.037 0.017 0.009 0.014 Observations 127 332 1,067 1,526
Panel B: Dependent variable is change in ROE
1994-1999 1999-2004 2004-2008 Pooled Intercept -2.61
(-1.60) 3.69
(2.38) -2.10
(-3.04) -1.00
(-1.66) Change in excess cash decile -0.87
(-1.22) -1.25
(-2.34) -0.10
(-0.35) -0.49
(-2.02) Keiretsu dummy -0.72
(-2.13) 3.26
(1.36) 3.83
(2.90) 3.54
(3.28) Interaction -2.22
(-2.13) -0.88
(-1.01) -0.68
(-1.22) -1.19
(-2.77) Adjusted R-squared 0.122 0.040 0.010 0.021 Observations 129 333 1,075 1,537
Table reports the results from regressions of changes in firm performance (measured as either ROA, EBIT on lagged total assets, or ROE, NI on lagged stockholders’ equity) on changes in excess cash decile (from Table 4), a keiretsu dummy (measured as in Tables 2 and 3), and an interaction between these variables. We estimate this regressions for all Japanese industrials with available data at the beginning and ending year of each sub-period.

54
TABLE 6 Cash coefficients (t-statistics) from “value” regressions of firm value on level of cash and other
determinants estimated annually for Japanese and U.S. industrial firms
Pinkowitz et al. (2006) specification
Dittmar and Mahrt-Smith (2007) specification
U.S. firms Japanese firms U.S. firms Japanese firms (1) (2) (3) (4) 1990 0.95 (2.67) 0.11 (0.49)*** 1.52 (4.68) 0.68 (4.35)** 1991 2.58 (3.79) 0.18 (1.13)*** 2.46 (4.62) 0.51 (3.63)*** 1992 1.59 (2.67) 0.22 (1.75)*** 3.77 (7.27) 1.42 (13.47)*** 1993 0.91 (1.46) 0.53 (4.31) 1.45 (3.65) 1.16 (11.90) 1994 0.88 (1.85) 0.28 (2.38) 2.18 (5.63) 1.66 (14.93)* 1995 3.16 (6.04) 0.34 (3.21)*** 2.96 (5.21) 1.23 (13.80)*** 1996 1.97 (3.77) -0.13 (-1.04)*** 1.68 (3.72) 1.14 (9.89) 1997 2.97 (6.84) -0.22 (-1.79)*** 2.87 (6.26) 0.90 (7.92)*** 1998 3.41 (5.97) -0.02 (-0.17)*** 4.40 (11.20) 1.12 (7.54)*** 1999 5.54 (7.87) 0.54 (2.22)*** 4.78 (9.58) 1.69 (8.25)*** 2000 2.43 (4.71) 0.87 (4.05)** 1.75 (5.05) 1.34 (9.54) 2001 0.80 (1.70) 0.74 (3.41) 2.56 (7.44) 1.60 (9.54) 2002 1.21 (3.18) 1.17 (6.37) 2.35 (7.30) 1.89 (12.03) 2003 1.86 (5.52) 1.02 (7.15)** 3.00 (12.66) 2.15 (15.04)* 2004 3.35 (9.84) 2.83 (16.82) 4.67 (18.95) 2.83 (20.94)*** 2005 2.17 (7.01) 3.01 (18.71)** 3.62 (20.92) 2.99 (25.20)** 2006 2.89 (8.80) 1.61 (11.55)*** 3.92 (19.75) 2.47 (21.55)*** 2007 1.37 (4.35) 1.68 (12.00) na na
*(**)(***) Denotes statistically significant difference between U.S. and Japanese firms at the 10%(5%)(1%) level, two-tailed.
The table reports coefficients on the cash variable (C) in the following regression specifications. Columns (1) and (2) report the estimated cash coefficients (β13) from the following regressions for US and Japanese firms, respectively, by year:
Vi,t = α + β1Ei,t + β2dEi,t + β3dEi,t+1 + β4dNAi,t + β5dNAi,t+1 + β6RDi,t + β7dRDi,t + β8dRDi,t+1 + β9Di,t + β10dDi,t + β11dDi,t+1 + β12dVi,t + β13Ci,t + εi,t
where dXt denotes changes in X from t-1 to t, V denotes firm value, measured as the market value of equity plus the book value of debt, E denotes earnings (EBIT), NA denotes net assets (total assets minus cash), RD is research and development expense, D is common dividends, and C is cash holdings. Columns (3) and (4) report the estimated cash coefficients (β13) from the following regressions for US and Japanese firms, respectively, by year:
Vi,t = α + β1Ei,t + β2dEi,t + β3dEi,t+2 + β4RDi,t + β5dRDi,t + β6dRDi,t+2 + β7Di,t + β8dDi,t + β9dDi,t+2 + β10dNAi,t + β11dNAi,t+2 + β12dVi,t+2 + β13Ci,t + εi,t
Here, all variables are deflated by NAt, and dXi,t denotes changes in X from t-2 to t.

55
REFERENCES
Aoki, M. 2007. Whither Japan’s corporate governance? In M. Aoki, G. Jackson, and H. Miyajima (eds). Corporate governance in Japan: Institutional change and organizational diversity. Oxford University Press.
Aoki, M., H. Patrick, and P. Sheard. 1994. The Japanese Main Bank System: An Introductory Overview. In The Japanese Main Bank System. Masahiko Aoki and Hugh Patrick (eds.), Oxford University Press.
Bates, T. W., K. M. Kahle, and R. M. Stulz. 2009. Why do U.S. firms hold so much more cash than they used to? Journal of Finance 64: 1985-2021.
Chen, Q., X. Chen, K Schipper, Y. Xu, and J. Xue. 2010. The sensitivity of corporate cash holdings to corporate governance. Duke University working paper, November.
Denis, D. J., and I. Osobov. 2008. Why do firms pay dividends? International evidence on the determinants of dividend policy. Journal of Financial Economics 89: 62-82.
Dewenter, K.L., and V.A. Warther. 1998. Dividends, asymmetric information, and agency conflicts: Evidence from a comparison of the dividend policies of Japanese and U.S. firms. Journal of Finance 53: 879-904.
Dittmar, A., J. Mahrt-Smith, and H. Servaes. 2003. International corporate governance and
corporate cash holdings. Journal of Financial and Quantitative Analysis 38: 111-134. Dittmar, A., and J. Mahrt-Smith. 2007. Corporate governance and the value of cash holdings.
Journal of Financial Economics 83: 599-634. Doidge, C., G. A. Karolyi, and R. M. Stulz. 2004. Why are foreign firms listed in the U.S.
worth more? Journal of Financial Economics 71: 205-238. Fama, E.F., and K.R. French. 1998. Taxes, financing decisions, and firm value, Journal of
Finance 53: 819–843.
Fama, E.F., and K. R. French. 2001. Disappearing dividends: changing firm characteristics or lower propensity to pay? Journal of Financial Economics 60: 3-43.
Fama, E.F., and K. R. French. 2004. New lists: Fundamentals and survival rates. Journal of Financial Economics 73: 229-269.
Floyd, E., N. Li, and D. J. Skinner. 2011. Payout policy through the financial crisis: The growth of repurchases and the resilience of dividends. Unpublished paper, University of Chicago, October.
French, K.R., and J.M. Poterba. 1991. Were Japanese stock prices too high? Journal of Financial Economics 29: 337-363.

56
Fukao, M. 2003. Japan’s Lost Decade and its Financial System. The World Economy Vol. 26 No. 3. March 2003: 365-384.
Hamao, Y., K. Kutsuna, and P. Matos. 2010. Foreign investor activism in Japan: the first ten
years. Working paper, U.S.C and Kobe University. June 1. Harford, J., S. Mansi, and W. Maxwell, 2008, Corporate governance and a firm’s cash holdings,
Journal of Financial Economics 87: 535–555. Hayn, C., 1995. The information content of losses. Journal of Accounting and Economics 20:
125-153.
Hoshi, T., and A. K. Kashyap. 2001. Corporate Financing and Governance in Japan: The Road to the Future. Cambridge, Mass.: The MIT Press.
Jensen, M. C. 1986. Agency costs of free cash flow, corporate finance, and takeovers. American Economic Review 76: 323-329.
Kaplan, S.N., and B.A. Minton. 1994. Appointments of outsiders to Japanese boards: Determinants and implications for managers. Journal of Financial Economics 36: 225-258.
Keynes, J. M. 1936. The general theory of employment, interest and money. London: Harcourt
Brace. Klein, A., and C. Marquardt. 2006. Fundamentals of Accounting Losses, The Accounting
Review 81: 179-206.
Klein, A., and E. Zur. 2009. Entrepreneurial shareholder activism: Hedge funds and other private investors. Journal of Finance 64: 187-229.
LaPorta, R., F. Lopez-de-Silanes, A. Shleifer, and R.W. Vishny. 2000. Agency problems and dividend policies around the world. Journal of Finance 55: 1-33.
Larcker, D., S. Richardson, I. Tuna. 2007. Corporate governance, accounting outcomes, and organizational performance. The Accounting Review 82: 963-1008.
Milhaupt, C.J. 2006. Lost decade for Japanese corporate governance reform? What’s changed,
what hasn’t, and why. In: M. Blomstrom and S. LaCroix (eds.). Institutional Change in Japan. Routledge, 2006.
Morck, R., and M. Nakamura. 1999. Japanese corporate governance and macroeconomic
problems. Available at http://papers.ssrn.com/paper.taf?abstract_id=235758. Myers, S.C., and R.G. Rajan. 1998. The paradox of liquidity. Quarterly Journal of Economics
113: 733-771. Opler, T., L. Pinkowitz, R. Stulz, and R. Williamson. 1999. The determinants and implications
of corporate cash holdings. Journal of Financial Economics 52: 3-46.

57
Patrick, H. 2004. Evolving corporate governance in Japan. Unpublished paper. Columbia
Business School. February. Pinkowitz, L., R. Stulz, and R. Williamson. 2006. Does the contribution of corporate cash
holdings and dividends to firm value depend on governance? A cross-country analysis. Journal of Finance 61: 2725-2751.
Pinkowitz, L., and R. Williamson. 2001. Bank power and cash holdings: Evidence from Japan.
Review of Financial Studies 14: 1059-1082. Rajan, R.G., and L. Zingales. 1995. What do we know about capital structure? Some evidence
from international data. Journal of Finance 50: 1421-1460. Weinstein, D.E., and Y. Yafeh. 1998. On the costs of a bank centered financial system:
Evidence from the changing main bank relations in Japan. Journal of Finance 53: 635-672.