indonesian national voter education follow up survey · pdf filenational voter education...
TRANSCRIPT

Indonesia National Voter Education
Follow Up Survey

The Asia Foundation
December 1999

Indonesia National Voter Education Follow Up Survey Report

Introduction• This report presents the findings of a national survey of Indonesia’s voters
on the impact of the voter education campaign before the June, 1999 election, as well as on issues concerning the consolidation of democracy.
• It is a follow-up to The Asia Foundation’s January, 1999 survey on voter information needs.
• The national findings volume of the report, which presents national-level data, has seven parts:
– The National Mood
– Attitudes about the Election
– Civic Education Issues
– Impact of Voter Education
– Civil Society Issues
– Regional and Decentralization Issues
– Administration of Justice and Human Rights Issues
• Volume II presents regional-level data and analyses for Java, Sumatra, Kalimantan, Sulawesi, and Irian Jaya.

Methodology
• This survey was based upon a randomly-drawn national sample of 1,008 in-person interviews in 22 of Indonesia’s 27 provinces.
– Interviewing was impossible due to security problems in East Timor, Aceh, and Maluku.
– Two provinces very small in population, Bengkulu and South-East Sulawesi, had no districts which came up in the random drawing to choose sampling points.
• The provinces from which interviewees were selected represent 98%of Indonesia’s population, so the results of the poll can be considered representative of the country as a whole.
• Sample selection and fieldwork were conducted by AC Nielsen Indonesia.

The National Sample
• Like the Foundation’s January poll, this survey is a country-wide random survey.
• It is based on a representative national sample of 800 interviews, drawn in proportion to the eligible voter population of each region.
• This yields an error margin for national-level results of +/-3.5%
• As noted above, three provinces with approximately 2% of the national population were excluded from the sample because of unrest.
• Elsewhere, every voter in the country had an equal chance of being interviewed. Thus, the survey is representative of the views of almost the entire Indonesian electorate.

Sulawesi: 56 7%
Irian Jaya: 81%Java: 488
61% Other Islands: 48
6%
Kalimantan:405%
Sumatra: 16120%
The National Sample800 Interviews
By region

Representativeness of the Sample
• Because this is a scientific survey with a sample that is truly national and random, the survey results represent all parts of the population in their correct proportions.
• Demographically, the poll results are either identical to the real population or very close to it. As a result, the survey findings correctly reflect the composition of the public in terms of gender, urban-rural balance, education, and age.
• The findings regarding public opinion are thus likely to be representative as well, within the poll’s margin of error.
• This makes the survey different from most polls published in Indonesia. Those surveys are usually limited to urban areas, ignoring the rural majority, and often unrepresentative in terms of gender, schooling, religion, age, or income.

Actual Sample
GenderMale/Female 49% / 51% 49% / 51%
AreaUrban/Rural 40% / 60% 40% / 60%
Education< Primary / Primary/ Secondary +
39% /33%/ 28%
39% /33%/ 28%
Age17-35 / 35+ 50% / 50% 50% / 50%
Representativeness of the Sample

National Sample and Oversamples
• In addition to the national random sample, we oversampled three regions.
– In Kalimantan, we oversampled 64 interviews.
– In Sulawesi, the oversample included 48 interviews.
– In Irian Jaya, the oversample consisted of 96 interviews.
• This was done in order to ensure enough interviews for detailed analysis at the regional as well as national level.
• The error margin for the results for each region varies with the size of the sample.
– For Java, where 490 interviews were conducted, the error margin is +/-5%.
– In Sumatra, where 158 interviews were conducted, the error margin is +/-8%.
– In the three oversampled regions, where the sample size is roughly 100, the error margin is +/-10%.
• When national results are presented in this report, the oversampled areas are weighted down to their correct proportion of the national population, so that they are not over-represented in the data.

National Sample and Oversamples
National Sample800
Sulawesi:48
Kalimantan: 64
Irian Jaya: 96
Oversamples208

Vol. I National Results

Part 1:The National Mood

Direction of the Country
• After the election, Indonesians think the country is headed in the right direction.
• There is general optimism concerning the direction of the country: 70% say it is headed in the right direction, just 13% in the wrong direction, and 18% are unsure.
• This positive view is very broadly shared: a solid majority of every social group in the poll -- in terms of gender, age, income, and religious group, and in urban and rural areas -- felt Indonesia was heading in the right direction.
• The mood after the election was considerably brighter than in January, when only 50% felt the country was headed in the right direction.

Direction of the CountryGenerally speaking, do you think things in Indonesia today are going in the right direction, or
do you think they are going in the wrong direction ?
70%
13%18%
50%
23%27%
0%
20%
40%
60%
80%
July '99 January '99
Right Wrong DK

Right Direction Reasons
• While Indonesians continue to perceive economic improvement as the chief reason for optimism, they also now have a clearer and more specific concept of the political gains which reformasi has brought.
• Economic recovery is the most frequently cited reason why Indonesia is headed in the right direction, mentioned by 46%, the same proportion as in January.
• However political changes -- the election, greater freedom, the formation of a new government, and anti-corruption measures -- take second place, cited by a total of 33%.
• Next comes the return of calm and the decline of political violence, mentioned by 26%.
• Reform in general -- the most frequently cited reason in the January poll for thinking the country was headed in the right direction -- took fourth place in July, mentioned by just 16%.

Right Direction ReasonsWhy do you say that ?
(Reasons given by 5% or more)
46%
33%
26%
16%
0%
10%
20%
30%
40%
50%
60%
Economy Elections, freedom,political change
Calmer situation Reforms

Wrong Direction Reasons
• Among the minority who think the country is headed in the wrong direction, the principal reason is the ongoing economic crisis, cited by 55%.
• The continuance of riots, violence, and disorder is mentioned by 45%.
• The third most common reason is politics, mentioned by 30%.
• This includes complaints of the uncertainty about the Presidential election, that the elections were unfair, that change is insufficient, that the leaders ignore the people, and about then-President Habibie’s performance in office.

Wrong Direction ReasonsWhy do you say that ?
(Reasons given by 5% or more)
55%
45%
30%
6%
0%
20%
40%
60%
Economy Riots Politics Repression

Indonesia’s Biggest Problems
• Despite the progress the country has made, Indonesians remain preoccupied with the country’s economic and political crises.
• The economy is still seen as Indonesia’s biggest problem, mentioned by 64%. The figure for January, 70%, was comparable.
• But in the post-election period politics has jumped into second place, mentioned by 41%. In January it was in third place, mentioned by 23%.
• Political issues of concern include leadership, corruption, reform of politics and of TNI, and political maneuvering.
• Violence is still seen as one of the country’s two biggest concerns by 20% of Indonesians. In January it was mentioned by 24%.
• Social issues, such as education, crime, and access to services, are mentioned by only 6% of the public.

Indonesia’s Biggest ProblemsIn your view, what is the biggest problem facing Indonesia ?
And after that, what is the next biggest problem ? (Responses combined, all those cited by 5% or more)
64%70%
41%
23% 20% 24%
6% 6%
0%
20%
40%
60%
80%
Economy Politics (general) Violence Social
July '99 January '99

Impact of the Economic Crisis
• The economic crisis seems be bottoming out, at least for a majority of Indonesians.
• For three-fifths of the public, their household economic situation improved or did not decline from January to July.
• In July, 29% of Indonesians said they could afford more than in January, and 31% said they were no worse off than six months earlier.
• However, a large part of the population -- 39% -- reported that their purchasing power had declined over the past six months.
• Indeed, those who said they were worse off than six months ago outnumbered those better off in every social group. Thus, losers from the economic situation continue to outnumber gainers, and economic pain remains broadly shared.

Impact of the Economic CrisisIf you think about what your family can afford to buy now, compared to six months ago,
please tell me which of these statements fits your family the best.
39%
31% 29%
0%
10%
20%
30%
40%
50%
Afford less No effect Afford more

Pride in Indonesia
• Almost three-fourths of Indonesians are proud of aspects of the country --though much more of its human and physical endowment than its politics.
• The people -- their friendliness and character -- is the factor in which the largest number -- 25% -- take pride, followed by the country’s geography, mentioned by 21%.
• These are followed by its culture, mentioned by 16%, its economy, mentioned by 15%, and its religions, mentioned by 11%.
• The country’s politics and history -- the conventional subjects of political nationalism -- are sources of pride to only 5% each.
• City dwellers and the better-off and better-educated cite the country’s culture and geography more often, while rural people and the lower-income and education groups mention its people more.
• This question was not asked in January because in November 1998 in-depth interviews almost no one expressed any pride in Indonesia. The July results are thus further evidence of the improved national mood.

Pride in IndonesiaGenerally speaking, what are the things about this country
you are most proud of as an Indonesian?(Responses cited by 5% or more)
25%
21%
16% 15%
11%
5% 5%
9%
27%
0%
10%
20%
30%
People
Geography
Culture
Economy
Religion
Politics
History
OtherNothing/DK

Improvements in Indonesia:July ‘99 vs. January ‘99
• Indonesians are much more conscious that things are getting better than they were six months ago.
• The change on this point is sharp compared to January: then 51% said nothing had improved in the past year, compared to 15% in July.
• Economic improvement is cited almost three times as often as in the previous poll -- 32% versus 13% -- as an area of improvement.
• Political change is mentioned half again as often -- 19% versus 12%.
• Development and reform in general receive the same mention as six months ago.
• But education -- which was not even mentioned by more than 5% then --now is cited by 6%.

Improvements in Indonesia: July ‘99 vs. January ‘99
What, if anything, has improved in Indonesia in the last year? (Responses cited by 5% or more)
32%
19%
8%
51%
15%6%
11%
0%
8%10%12%13%
0%
10%
20%
30%
40%
50%
60%
Economy Political change Development Reforms Education Nothing
July January

Freedom of Political Expression
• The new survey highlighted one major area of improvement in people’s lives: Indonesians now believe that they have acquired freedom of speech.
• The vast majority -- 83% -- said in July that people in their areas could express their opinions freely. Only 9% felt they could not do so.
• This is a big improvement since January, when 55% felt people could speak their minds, 20% said they could not, and 25% were unsure.
• It is a massive shift from the situation before May 1998, when only 28% believed that people could speak freely and 42% felt they could not.
• What is particularly impressive is that this sense of freedom is broadly shared among all people belonging to all social groups and walks of life.

Freedom of Political ExpressionDo people feel free to express their Did they feel free to express their political
opinions in the area where you live ? opinions before the events of last May ?
83%
9%
55%
20%
28%
42%
0%
20%
40%
60%
80%
100%
July January Before May '98
Yes No

Political Alienation
• The July poll also found a low level of political alienation: Indonesians believe the government does pay attention to their opinions.
• Some 69% rejected a statement that government does not care very much about what people like them think. This figure is up six points from January’s 63%.
• Only 24% agreed with it, the same proportion as in January.
• The rejection was qualified: some 46% disagreed somewhat, while only 23% rejected the statement completely.
• Nonetheless, impressive majorities across the board rejected the position that government ignored their view.
• There was no social group where a majority or even a plurality expressed the contrary view.

Political AlienationSome people say, “I don’t think the government cares very much about what people like me
think.” Do you agree or disagree? Strongly, or somewhat?
9%
15%23%
46%
9%
15%25%
38%
0%
10%
20%
30%
40%
50%
60%
70%
Agree: 24% Disagree: 69% Agree: 24% Disagree: 63%
JanuaryJuly
Strongly Somewhat

Confidence in the Future
• In the post-election period, as these positive signs registered, Indonesianswere optimistic about their country’s future.
• Fully 81% were confident of a happy future for the country as a whole, while just 11% were not.
• This is even more optimism than the previous poll registered in January, when 71% expected a happy future.
• Most of the optimism is cautious: 52% say they are fairly confident, just 29% are very confident about the future.
• But it is also very broadly shared: in every social group and region a large majority expressed confidence in the future.
• Given the economic and political problems Indonesians confront, this degree of optimism is impressive.

Confidence in the FutureHow confident are you of a happy future for Indonesia as a whole ?
Very/ Fairly: 71%
52%
Not very/ Not at all: 13%
1% 26%
45%
2%11%0%
20%
40%
60%
80%
100%
Very/ Fairly: 81% Not very/ Not at all:11%
JanuaryJuly
Very/ Not at all Fairly/ Not very
10%29%

Differences in Mood• The mood has brightened sharply among both advantaged and
disadvantaged Indonesians, but the former are more focused on politics, the latter on more immediate issues in their lives.
• In the January survey we distinguished between two categories ofIndonesians: the advantaged (men, youth, urbanites, the secondary educated, and higher income earners) and the disadvantaged (women, older and rural people, and those with low incomes and education).
• Then, the advantaged were more optimistic, more politicized, and had suffered less from the economic crisis.
• By July, much had changed: the disadvantaged were almost as optimistic as the advantaged about the country’s future, and the economic status of the majority in both groups was no longer deteriorating.
• But there remained a big difference in their thinking and concerns:
– The advantaged were much likelier to think about politics and cite it as a reason for optimism (41% vs. 22%).
– The main concerns of the disadvantaged were more immediate: subsistence, the economy, survival, and violence.
• Thus both advantaged and disadvantaged are much more optimistic, but the advantaged remain more politicized, the disadvantaged more parochial.

AdvantagedAverage
• Men• Under 35s• City dwellers• High School Educated• High Income (over Rp 350,000/mo)
Economy Politics Violence 45% 41% 18%
42% 40% 25% 50% 36% 19% 49% 38% 25% 42% 51% 15% 44% 41% 23 %
DisadvantagedAverage
• Women• Over 35s• Rural people• No or Incomplete Primary School• Low Income (below Rp 200,000/mo)
46% 22% 24%
50% 19% 26% 42% 26% 33% 43% 26% 26% 47% 19% 31% 48% 21% 22%
Differences In MoodReasons given why country headed in right direction by social group.

Summary - The National Mood• In the wake of the election, Indonesians overwhelmingly believe the country is
headed in the right direction despite its continuing problems.
• Economic recovery and political change are the main reasons for optimism.
• The economy remains the chief worry, while politics now outranks violence as the second biggest concern. But the economic situation of the majority of Indonesians is no longer worsening.
• Indonesians are now confident that they can speak their minds freely, and most believe that government pays attention to them.
• There is broadly-based confidence in the country’s future, and optimism increasedsince January on every measure in the poll.
• Optimism is up sharply among both advantaged and disadvantaged Indonesians, but the advantaged are more politicized.

Part 2:Attitude to the Elections

Voter Registration• Despite the change to in-person voter registration in the 1999 election, the survey
results confirmed that voter registration was nearly universal.
• Some 97% of respondents reported registering for the election.
• Thus, although it required extensions of the registration deadline, there was a successful shift from the old system, where voter registration committees compiled their own lists.
• This points to the success of the registration information campaigns conducted by government, NGOs, and foreign donors, which made this one focus of their efforts.

Voter RegistrationDid you register to vote in the election?
97%
3%
0%
20%
40%
60%
80%
100%
Yes No
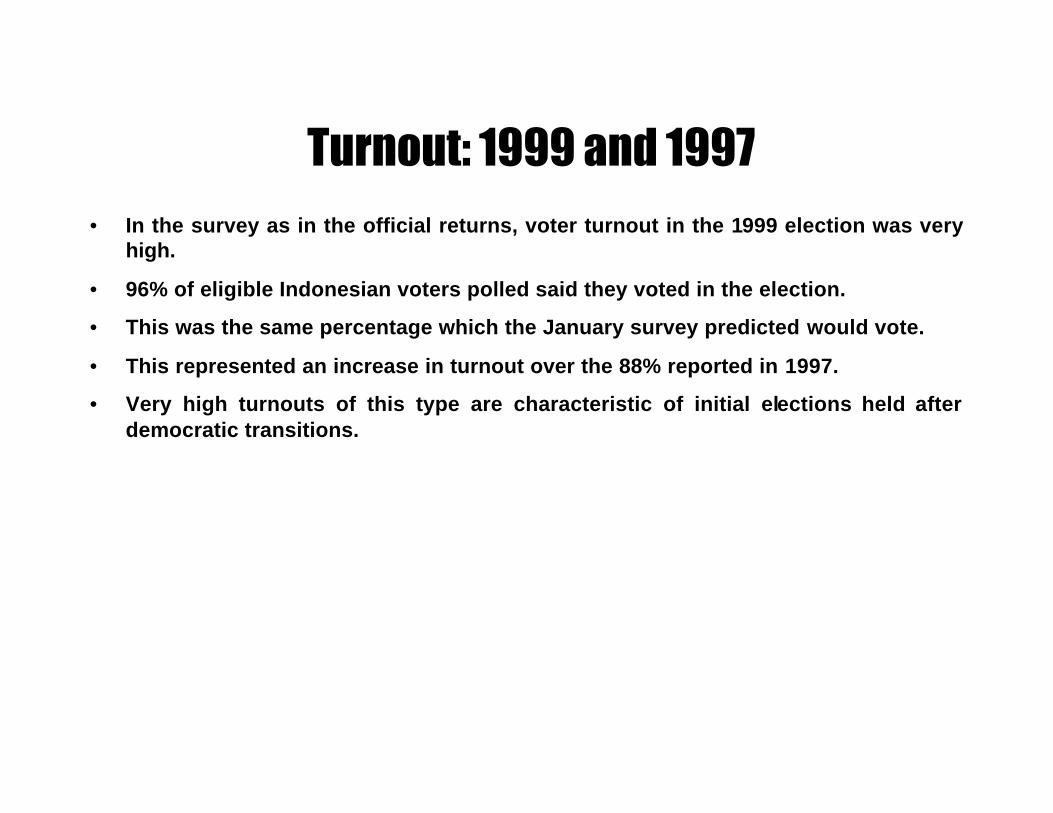
Turnout: 1999 and 1997• In the survey as in the official returns, voter turnout in the 1999 election was very
high.
• 96% of eligible Indonesian voters polled said they voted in the election.
• This was the same percentage which the January survey predicted would vote.
• This represented an increase in turnout over the 88% reported in 1997.
• Very high turnouts of this type are characteristic of initial elections held after democratic transitions.

Turnout: 1999 and 1997 Did you vote in the 1999 elections? Did you vote in the 1997
elections?
96%
5%
88%
11%
0%
20%
40%
60%
80%
100%
1999 1997
Yes No

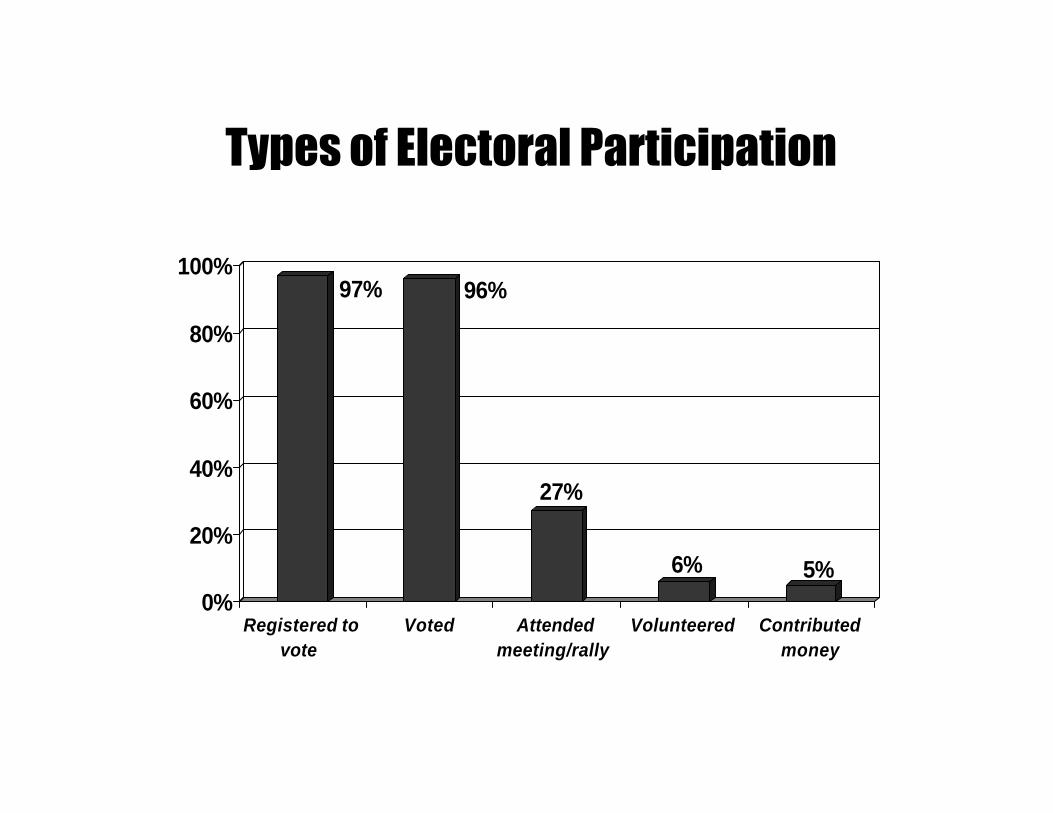
Types of Electoral Participation
• While almost everyone eligible registered and voted, participation in the election campaign in other ways, though still substantial, was considerably lower.
• 27% of the sample -- or 36 million people -- claim to have attended meetings or street rallies. Even allowing for some overclaim, this is a large figure.
• Meeting attendance was particularly high among residents of big cities (cities of over 1 million residents).
• Other forms of participation were much less frequent.
– 6% (8 million) say they worked as volunteers for parties or candidates.
– 5% (7 million) say they contributed money to parties or candidates.
Types of Electoral Participation
97% 96%
27%
6% 5%0%
20%
40%
60%
80%
100%
Registered tovote
Voted Attendedmeeting/rally
Volunteered Contributedmoney

Attention to the Election• The majority of Indonesians paid attention to the elections.
• 62% of the electorate said they followed the elections very or fairly closely.
• Of these, 48% said they followed them fairly closely, 14% very closely.
• Only 35% said they did not follow the elections closely.

Attention to the ElectionWould you say you followed the recent national elections very closely,
fairly closely, not very closely, or not closely at all?
14%
48%
22%
13%
0%
20%
40%
60%
80%
Very/Fairly Closely: 62% Not very/Not at all closely: 35%
Very/Not at all Fairly/Not very

Understand Voting and Elections• The vast majority of the electorate felt that they understood how the election
worked this year.
• 86% said they understood the voting and election process. Only 12% said they did not, and 3% were not sure.
• In every social group most voters felt confident that they understood the electoral process.
• Those who felt they understood the electoral process were much less likely to doubt the fairness of the elections than those who felt they did not.
• These findings represent impressive evidence that the campaign to educate voters regarding the mechanics of the elections was successful.

Understand Voting and ElectionIn the recent national elections, did you understand how the voting
and election process worked, or not?
86%
12%
3%0%
20%
40%
60%
80%
100%
Yes No DK

Free and Fair Elections?• There is general agreement among Indonesians that the 1999 elections were free
and fair.
• Overall 80% of the electorate said that the election was free and fair, while just 5% said that it was not and 15% were not sure.
• Large majorities of every social group and region think the vote was fair.
• There was a substantial increase in confidence in the elections since January, when 58% expected the election to be free and fair.
• The largest increases were recorded in the two groups least certain in January that the elections would be fair -- urban men under 35 and rural women over 35.
• These findings represent a resounding endorsement of the election by the Indonesian public.

Free and Fair Elections?Some people think the 1999 election was [January: will be] free and fair, some think it was not
[January: will not be], and some are not sure. How about you? Which of these opinions do you agree with?
80%
5%
15%
58%
4%
38%
0%
20%
40%
60%
80%
100%
July January
Free and Fair Not Free and Fair Not Sure
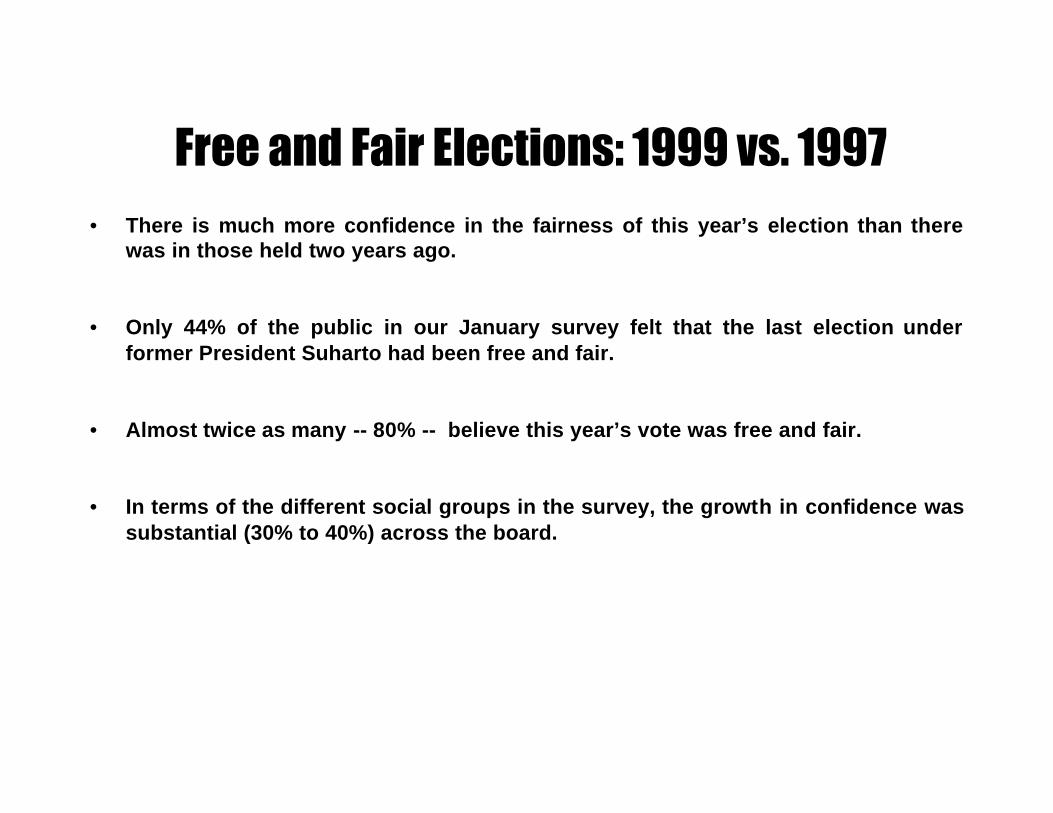
Free and Fair Elections: 1999 vs. 1997• There is much more confidence in the fairness of this year’s election than there
was in those held two years ago.
• Only 44% of the public in our January survey felt that the last election under former President Suharto had been free and fair.
• Almost twice as many -- 80% -- believe this year’s vote was free and fair.
• In terms of the different social groups in the survey, the growth in confidence was substantial (30% to 40%) across the board.

Free and Fair Elections: 1999 vs. 1997 July: Some people think the 1999 election was free and fair, some think it was not, and some are
not sure. How about you? Which of these opinions do you agree with?January: Did you think the 1997 elections were free and fair?
80%
5%
15%
44% 36%
20%
0%
20%
40%
60%
80%
100%
1999 1997
Yes, free & fair No, not free & fair DK

Election Concerns, 1999• Few of the concerns voters had about the election process beforehand
proved to be justified, according to the July survey findings.
• Our initial survey identified nine potential problem areas which concerned 9% or more of the voters, including voting roll omissions, riots, media bias, cheating in the count, violence against activists, non-secret ballots, vote selling, forced voting, and repeat voting.
• Only one of these problems, omissions from the voting roll, was reported with any frequency -- 22% of respondents mentioned it. This may have been due to the changeover to the new registration system.
• None of the others was mentioned by more than 4% of respondents as having occurred in their areas.
• 69% believed none of these problems had occurred in their areas.
• As in our first survey, perceptions of election fairness were closely tied to concerns about the election. The experience of an election with few irregularities thus helps explain why this year’s vote was seen as free and fair by the vast majority of Indonesians.

Election Concerns, 1999I’m going to mention some problems that can happen in elections.
For each one, tell me if you believe it happened [January: think it is possible] here in the election this [January: next] year.
July JanuaryPeople left off voting roll 22% 29%
Finding out how people voted 4% 15%
Riots or disorders 3% 23%
Selling of votes 3% 13%
Violence against party activists 2% 18%
Cheating in counting 1% 21%
Forcing workers to vote together 1% 11%
People voting more than once 1% 9%
News media bias favoring party 0% 22%
Threats from officials 0% 10%
None of these happened/None will happen 69% 45%

Saw Election Observers• Some 38% of the electorate saw and correctly recognized independent monitors
and observers when they went to vote.
• An additional 10% incorrectly thought they saw observers, because they did not recognize a picture of the identity card all observers wore prominently around their necks.
• 52% of the voters said they had not seen a monitor or observer, or were not sure if they had.
• Monitors were seen and recognized by 44% of the voters in the cities and 35% of those in rural areas.
• A substantial part of the electorate was thus aware of the monitoring effort being mounted at voting stations around the country.

Saw Election ObserversWhen you went to vote, did you see any independent observers or monitors checking that the
voting was fair? Were they wearing a card like this?
38%
10%
52%
0%
20%
40%
60%
Yes, wearing a card Yes, but no card No/DK

Impact of Election Observers• The monitors and observers offered a great deal of reassurance about the fairness
of the election.
• Of those who saw and correctly recognized them, fully 87% reported that they were more confident the elections would be free and fair.
• Among those voters, 32% said they were much more confident after seeing the monitors, and 55% were somewhat more confident.
• This effect was felt across the board by those who noticed the monitors, whatever social groups they belonged to.
• A mere 11% of those who reported seeing monitors said they were no more or only a little more confident in the fairness of the elections.
• The monitoring effort thus directly boosted the confidence of roughly one-third of the voters when they went to the polls -- in addition to the effects of media publicity or word-of-mouth from those who saw monitors.

Impact of Election ObserversDid seeing the observers make you much more confident, somewhat more confident, a little
more confident, or no more confident that the election would be free and fair? (Asked of those who saw observers wearing ID cards)
32%
55%
10%
1%
0%
20%
40%
60%
80%
100%
Much/Somewhat more: 87% Little more/No more: 11%
Much/No more Somewhat/Little more
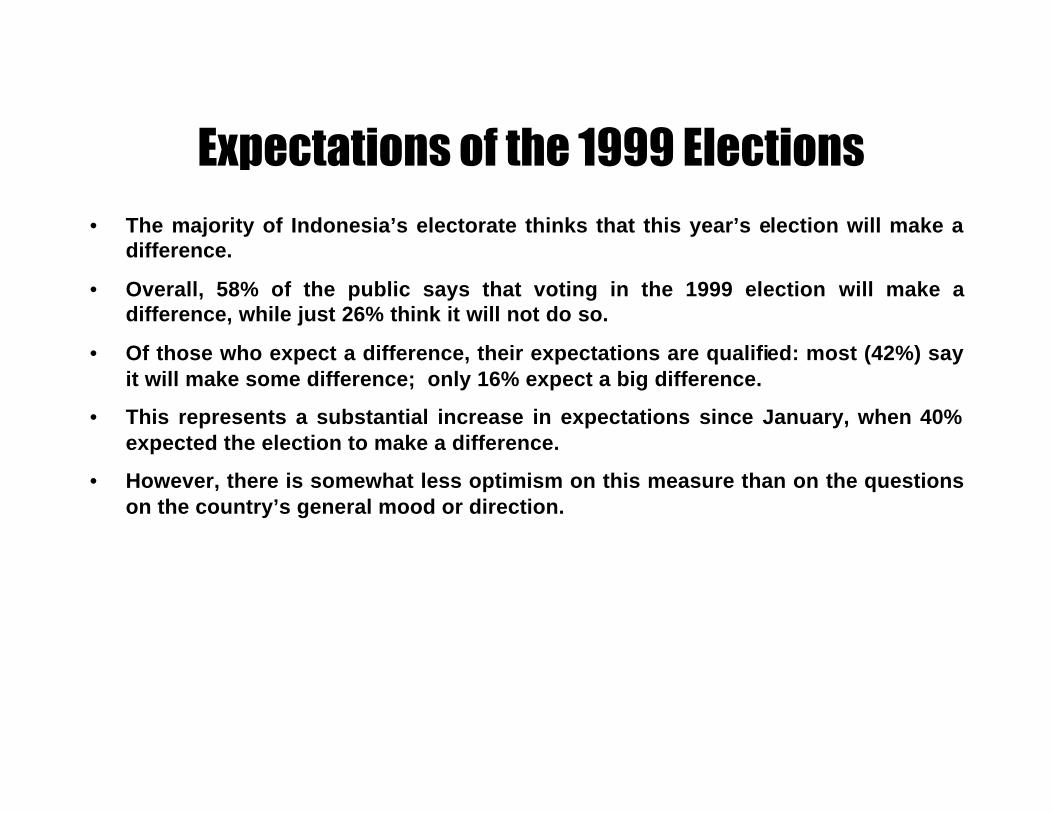
Expectations of the 1999 Elections• The majority of Indonesia’s electorate thinks that this year’s election will make a
difference.
• Overall, 58% of the public says that voting in the 1999 election will make a difference, while just 26% think it will not do so.
• Of those who expect a difference, their expectations are qualified: most (42%) say it will make some difference; only 16% expect a big difference.
• This represents a substantial increase in expectations since January, when 40% expected the election to make a difference.
• However, there is somewhat less optimism on this measure than on the questions on the country’s general mood or direction.

Expectations of the 1999 ElectionsDo you think that voting in the 1999 election will make a big difference, some difference, little
difference or no difference at all ?
16%
42%
15%
11%
14%
26%
16%
17%
0%
20%
40%
60%
Big/Some: 58% Little/No: 26% Big/ Some: 40% Little/ No: 33%
Big/ No Some/ Little
JanuaryJuly

Differences in Expectations
• Expectations about the election outcome remain substantially more positive among advantaged than among disadvantaged Indonesians, though optimism has risen considerably in both.
• In the advantaged groups (men, youth, city dwellers, high education and income) roughly two-thirds (on average, 68%) expect the election will make some or a big difference.
• Among the disadvantaged, around half (on average, 49%) share this view, or roughly 20 points less.
• However, the proportion taking an optimistic view is up quite a bit since January -- an average of 19 points among the advantaged, and 17 among the disadvantaged.
• Thus, while there has been a general shift of public opinion towards an optimistic expectation of election outcomes, disadvantaged Indonesians remain considerably more uncertain of this than those in advantaged groups.

Advantaged
• Men• Under 35s• Urban• High School Educated• High Income (over Rp 350,000/mo)
Expect Election Will Make Difference Jan Jul 45% 62% 49% 65% 47% 64% 57% 78% 50% 72%
Disadvantaged
• Women• Over 35s• Rural• No or Incomplete Primary Education• Low Income (under Rp 200,000/mo)
35% 54% 32% 50% 36% 54% 27% 42% 31% 44%
Differences In Expectations

Summary - Attitudes About the Election• Registration and voting were nearly universal, and participation in meetings
and rallies was substantial, though few gave time or money to the parties’ election campaigns.
• The majority of Indonesian voters followed the elections and most felt they knew how the process worked.
• Most of the public feels the elections were free and fair -- far more than believed that to be true of the 1997 elections.
• Apart from omissions from the voting roll, none of the irregularities voters feared before the election were observed on a large scale.
• The presence of election monitors and observers gave a substantial boost to confidence in the voting process for a large part of the electorate.
• The majority of the voters expect that this election will lead to change.
• There are stark differences in expectations about the election outcome between advantaged and disadvantaged Indonesians.

Part 3:Civic Education Issues

Characteristics of a Democratic Country• Indonesians still don’t know much about what democracy means, but they
know more than before the elections. 50% could not name any characteristics of a democratic country in July, but this was animprovement from 61% in January.
• Now, 36% associate democracy with political rights, up from 28% in January. The main themes they mention are popular sovereignty (10%) free speech (9%), and human rights and freedom (4% each).
• But the proportion who link democracy to free elections is still just 2%.
• Peace, stability, and consensus is the second major association with democracy, mentioned by 15% in July, 7% in January.
• The proportion who define democracy in terms of economic gains is down slightly from 13% to 11%.
• Thus the election period and civic education efforts have strengthened the link between democracy, popular rule, and freedom in the public mind, but there is still much to do in this area to broaden and deepen Indonesians’ understandings of the nature of democracy.

• Don’t Know / No Response: 50%
• Political Rights: 36%
– “People’s sovereignty,” “government of, by, for people”: 10%
– “Free speech,” “free expression” : 9%
– “Human rights,” “rule of law”: 4%
– “Freedom -- general”: 4%
– “Free elections,” “free political participation”: 2%
– Other: 7%
• Peace, Stability, Consensus: 15%
• Economic Gains: 11%
– “Social justice,” “help for the poor” : 6%
– “Prosperity,”, “SEMBAKO availability”: 2%
– Other: 3%
Characteristics of a Democratic CountryIf a country is called a democracy, what does that mean to you?
Anything else?

Personal Consequences of Democracy• The proportion of Indonesians with no idea of how democracy might affect
their lives also remains high at 49%, though it, too, has declined since January, when it was 63%.
• Economic gains remain the major hope, voiced by 30%, up from 24% six months ago.
• Political rights follow, mentioned by 19%, against 14% in January.
• Peace, stability, and consensus were mentioned by 14% in July, 9% in January.
• These results do suggest that more Indonesians now think democracy might change their lives than before the elections.
• Their expectations are also increasingly political: while the principal hope for democracy remains the return of prosperity, together freedom and stability are sought by a larger number.
• Thus, while electoral experience and education has begun to helpIndonesians understand that democracy offers them something, more is needed to tie it to the chance to choose, voice demands freely, and achieve the goals that they seek.

Personal Consequences of DemocracyWhat, if anything, is the most important thing that a democracy in Indonesia will bring you
personally? Anything else?
• Don’t Know / No Response: 49%
• Economic Gains: 30%
– “Prosperity,”, “SEMBAKO availability”: 16%
– “Social justice,” “help for the poor” : 7%
– “Economic recovery,” “economic stability,” “jobs”: 6%
– “Action against monopoly,” “help to small business”: 1%
• Political Rights: 19%
– “Free speech,” “free expression” : 10%
– “Free elections,” “free political participation”: 3%
– “Human rights,” “rule of law”:2%
– Other: 4%
• Peace, Stability, Consensus: 14%

Political Interest
• The general level of interest in politics remains low in Indonesia, even though the majority of the voters said they followed the elections closely.
• In our post-election survey only 38% were interested in politics -- an increase of just 5% from January -- and merely 7% were very interested.
• Interest in politics remains closely associated with knowledge of characteristics of a democracy and personal expectations of democracy.
• It is also associated with doing more in the election than just voting (attending meetings, volunteering, and giving money).
• The legacy of nearly four decades of authoritarianism which made the de-politicization of society a priority cannot be undone in a single election.
• Making politics interesting and relevant to ordinary people needs to be a continuing priority of civic education efforts. This should not be limited to formal civic education but can also involve the inclusion of civic education spots or political content in non-political TV shows or public entertainment, as well as putting public affairs into school curricula.

Political InterestHow interested are you in politics? Very interested, somewhat interested, not very interested,
or not interested at all?
7%
31%
24%
32%
6%
27%31%
22%
0%
10%
20%
30%
40%
50%
60%
Very/Somewhat:38%
Not very/Not atall: 55%
Very/Somewhat:33%
Not very/Not atall: 53%
Very/Not at all Somewhat/Not very
July January

Political Discussion
• The frequency of political discussion remains even lower than political interest in Indonesia, and it has changed little since January.
• Just 11% of Indonesians say they discuss politics with friends all the time or often -- an increase of only 1 point since our pre-election poll -- and merely 2% say they do so all the time.
• Political discussion is even more closely linked than political interest to knowledge of the characteristics of democracy and participation beyond voting.
• It thus remains important to encourage and stimulate public discussion of politics.
• This could include putting political discussion among ordinary people into TV shows, popular fiction, and plays to provide role models. It might also include encouragement for town meetings or “speak-outs” on issues in person and on TV to encourage people to raise their voices, and support for school and university debate leagues and newspapers.

Political DiscussionHow often do you discuss politics with friends? Almost all the time, often,
not very often, or almost never?
2% 9%
49%
38%
2% 8%
59%
27%
0%
20%
40%
60%
80%
100%
Often: 11% Never: 87% Often: 10% Never: 86%
Almost all the time/Never Often/Not very often
July January

Political Tolerance: Meetings• Political tolerance for unpopular parties is much broader now than in our
pre-election survey.
• 70% of Indonesians are ready to let all parties, including unpopular ones, meet in their areas now, compared to 49% before the election. In the July poll only 19% were opposed to this, while 12% were unsure.
• This issue was a major focus of civic education campaigns, and the sharp gains registered are evidence suggesting they were effective.
• Big majorities favor tolerance in all social groups, and in every region but one.
• The exception is Irian Jaya, the only region where tolerance has actually declined since the January poll. The majority there now opposes letting unpopular parties meet by a 56% to 14% margin.
• The gains on this issue are encouraging, but future civic education efforts should seek to maintain, consolidate, and expand them. And Irian Jaya must be an urgent priority area for efforts to promote tolerance.

Political Tolerance: MeetingsDo you think that all political parties, even the ones most people do not like, should be
allowed to hold meetings in your area ?
70%
19%12%
49%
25% 26%
0%
20%
40%
60%
80%
July January
Yes No DK

Political Tolerance: Personal
• Indonesians are very tolerant of political differences at the personal level.
• By the post-election period, willingness to accept a friend who supported an unpopular party was almost universal: 94% said they would do so, while just 3% said political differences would end their friendship.
• Since we did not ask this question in January, we cannot measure trends directly on this question.
• However the sharp growth in tolerant responses since January on the question on the tolerance of meetings suggests that there was probably growth in tolerance on this issue as well, since responses to the two are correlated.

Political Tolerance: PersonalSuppose a friend of yours supported a party that most people did not like.
Would you accept that, or would it end your friendship?
94%
3% 2%0%
20%
40%
60%
80%
100%
Would accept it Would endfriendship
Don’t know

Gender and Political Leadership
• Support for women’s equality in political leadership was quite high in the June poll.
• Some 70% of Indonesians felt that women should be just as active as men in political leadership, a rise of 8 points since January. Equally significant, there was no difference between the sexes on this issue.
• The proportion who felt that leaders should be mostly men was just 25% among men and 24% among women. This represented a 7 point drop among men and a one point decline among women since January.
• Substantial majorities favored women’s equality in every social group.
• Sulawesi was the only region where voters felt leadership was mostly for men, by 54% to 42%.

Gender and Political LeadershipDo you think that political leadership positions should be mostly for men or do you think that
women should be just as active as men in political leadership ?
70% 70%
25% 24%
61% 62%
32%
25%
0%
20%
40%
60%
80%
January
Women justas active
Mostly formen
Women justas active
Mostly formen
July
Men Women

Leadership Mostly for Men: Why
• The most frequently cited reason given by those who said political leadership is for men was greater political awareness, cited by 30%. They felt men are more knowledgeable, educated, and skillful at polit ics.
• Religious teaching on male leadership was mentioned by only 24% of those who felt men should lead. However, this was the top reason cited: in Sulawesi.
• The view that a woman’s place is in the home was cited by 19%.
• Only 17% of those who believed in male leadership believed in inherent male superiority. They said that politics is natural for men only.
• 4% said that women are too emotional or excitable for political leadership.

Leadership Mostly for Men: Why?(Asked only of those who said that political leadership
positions should be mostly for men) Why do you say that?
Men know more, more intelligent, better educated, better at politics/ women ignorant of politics, know less.
30%
Religious teachings / Islam, etc. 24%
Family / home responsibilities / women’s place is home 19%
Politics is natural / appropriate for men 17%
Women are more emotional, irrational, excitable, men are calmer/ inappropriate for women
4%
Don't know 6%

Women Making Their Own Choice
• A large majority of Indonesians say that married women should make up their own minds when they vote.
• Some 76% of men and 77% of women say that married women should make their own choice for voting. As with women in political leadership, there is no gender gap on this question.
• Just 23% of men and 22% of women say wives should follow their husband’s choice.
• Thus those who believe that women should choose for themselves outnumber those who do not by more than three to one.
• This is the majority view in every social group and in every region except Irian Jaya -- though even there the plurality of voters say women should make their own choices.

Women Making Their Own ChoiceDo you think a married woman should make her own choice for voting, even if it differs from
her husband, or should she follow her husband?
76% 77%
23%22%
0%
20%
40%
60%
80%
100%
Make her own choice Follow her husband
Male Female

Political Culture• Roughly half of Indonesians have a paternalistic view of the role of the
state, while a smaller share sees government as responsible to the people.
• Some 49% say that the government is like a father and the people are like a child he must look after.
• 40% say that government and people are equals, and the government must listen to the people’s criticism.
• After more than 30 years of non-democratic rule, only 4% take the view that the government is like a boss and the people like a worker who must obey.
• In most social groups the view that government is like a father held a majority or plurality over the view that government and people are equals. The exceptions were some high-end groups -- students, urban women under 35, and large-scale farmers (over 10 hectares) -- and, surprisingly, those with no or incomplete primary education.
• The paternalistic view also had a majority or plurality in all regions except Kalimantan and the Other Islands outside the five regions we focus on.

Political CultureWhich of these is closest to your view of what the government should be?
Government is father, people are children 49%Government and people are equals 40%Government is boss, people are workers 4%Don’t know, not sure 7%

Political Efficacy
• Most Indonesians do not feel that they can influence decisions made by their government.
• Just 25% of Indonesians say they have some or a lot of influence over government decisions, and only 7% think they have a lot of influence.
• Fully 61% say they have very little influence or none at all, with the remaining 18% unsure.
• This sense of impotence is shared across the board: even in the groups with the highest proportion saying they have influence, the secondary educated and students, only 38% do so.
• So even though Indonesians now feel free to speak and think government is listening to them, the image of official authority in the political culture remains one which is rather remote and unaccountable. Indonesians’ sense of political efficacy is very low.

Political EfficacyHow much influence do you think someone like you can have over government decisions – a
lot, some, very little or none at all?
7%
18%22%
39%
0%
20%
40%
60%
Very little / Not at all: 61%
A lot / Some: 25%
A lot/None at all Some/Very little

Non-Electoral Participation• Indonesians work informally together on local problems, but rarely get
involved with official political structures.
• Some 24% of the public has worked informally with others on a problem in their community or RT/RW area within the past five years, which underlines that Indonesians are not apathetic or unwilling to act publicly.
• However, only 7% have joined political parties or organizations taking political stands (and the majority of those have only done so since May 1998).
• Likewise, only 7% have served on local government bodies.
• Only 3% have contacted government officials about problems or issues. This corresponds to the sense we saw in the previous slide that the people cannot influence the government.
• There is little difference in informal participation among social groups.
• In regional terms, Javanese are more likely to have worked together informally than non-Javanese (41% vs. 27%). This difference relates to the period before May ‘98 -- since then informal participation rates have become equal between Java and the rest of the country.

Non-Electoral ParticipationIn the past five years, have you ... ?
Got together with people in community or worked informally with others to deal with community issue/problem
24%
Been a member of political party or organization that took stands on political or community issues
7%
Served on local government body or council that deals with community problems/issues
7%
Contacted government official about problem/issue 3%

Differences in Participation by Area, Gender, and Age
• We found big inequalities in participation by area, gender, and age.
• In our study we measured nine types of political participation:
– Five types of electoral participation (registering, voting, attending meetings, volunteering, giving money) and
– Four types of non-electoral participation (informal community work, serving on boards, political group membership, contacting officials).
• When we tabulated the number who did more than register and vote:
– Men under 35 were the most likely to have done more -- 63% of those in cities and 61% of those in rural areas participated more actively.
– City people over 35 were the next most active, 50% of the men and 47% of the women have done more than just vote.
– Young women were less active -- 36%of women under 35 in urban areas and 38% of those in rural areas did more than vote.
– Older rural men were similar. 40% did more than vote, but just 25% did so among rural women over 35 -- the least active group.

Differences in Participation by Area, Gender, and Age
Percent in each group who did more than register and vote
63%
36% 50%47%
61%
38% 40%
25%
0%
20%
40%
60%
80%
Men Women
Under 35
URBAN RURAL
Over 35 Under 35
Over 35

Summary - Civic Education Issues
• Most Indonesians are still unfamiliar with the nature of democracy and what it can offer, though more are aware of these issues now than in January.
• Levels of political interest and discussion remain disturbingly low.
• Tolerance of unpopular parties has increased considerably since January, and political tolerance among friends is very high.
• Women’s equality in political leadership and their right to make their own choice are now accepted by large majorities.
• Indonesians tend to view the state as paternalistic authority, not as a servant of the public, and they feel unable to influence its decisions.
• Informal activity around local issues is fairly frequent, but contacting or belonging to official bodies, or joining political groups, is rare.
• Socially disadvantaged groups -- women, older and rural people, and those with low income or education -- engage in little political participation beyond the vote.

Part 4:Impact of Voter Education

Saw or Heard Voter Education• Most Indonesian voters were reached by the voter education campaigns, which
were run in a variety of media under the sponsorship of domestic and foreign organizations between February and June, 1999.
• A majority -- 51% -- saw or heard voter education material many times from at least one source, while another 34% did so a few times or once.
• Thus 85% of Indonesia’s voters (equal to 112 million people) were exposed to voter education -- only 15% of the voters were missed.
• Given the large size and population of the Indonesian archipelago, these figures indicate that the voter education campaigns were extremely successful in reaching the electorate.

Saw or Heard Voter EducationDid you see or hear anything about registration, the election, or democracy from voter education
groups through … (all sources combined)
51%
34%
15%
0%
10%
20%
30%
40%
50%
60%
Many Times Few Times/Once Never

Exposure to Voter Education Sources• TV was the principal medium through which voter education reached
Indonesians.
• Some 44% saw special voter education spots and programs on television many times -- a much larger proportion to do so than for any other medium.
• The second most popular medium, radio-based voter education, was heard many times by just 14% of the voters.
• Voter education stickers were seen many times by 12% and banners by 10% of the public.
• Pamphlets were seen many times by 6%, voter education material in newspapers by 5%, and in books by 2%.
• TV was the dominant voter education medium in every region and for every social group except non-TV viewers.
• For non-TV viewers, the main voter education media were radio and stickers.

Exposure to Voter Education SourcesDid you see or hear anything about registration, the election, or democracy from voter
education groups through…? (Percentage who saw/heard source “many times”)
44%
14%12%
10%
6% 5%2%
0%
10%
20%
30%
40%
50%
Television Radio Stickers Banners Pamphlets etc. Newspapers Books

Most Important Source of Voter Education
• Indonesians also credited TV with the greatest impact among voter education sources.
• The dominance of TV among voter education media was confirmed when we asked voters what their most important source of voter education was.
• Among those who saw at least one source of voter education, television towered over all other media: 85% said television was the most important voter education source for them.
• The second most frequently cited source, radio, was mentioned as the most important by only 7%.
• Banners were mentioned by 3%, stickers by 2%, and newspapers andpamphlets by 1% each.
• Thus TV was seen as the most important source of voter education even by many of those exposed to other media as well.

Most Important Source ofVoter Education
Which one of these things we just talked about was the most important source of information for you about how the election and democracy worked?
(Asked of those who saw at least one source of voter education)
85%
7%3% 2% 1% 1%
0%
20%
40%
60%
80%
100%
TV Radio Banners Stickers Newspapers Pamphlets
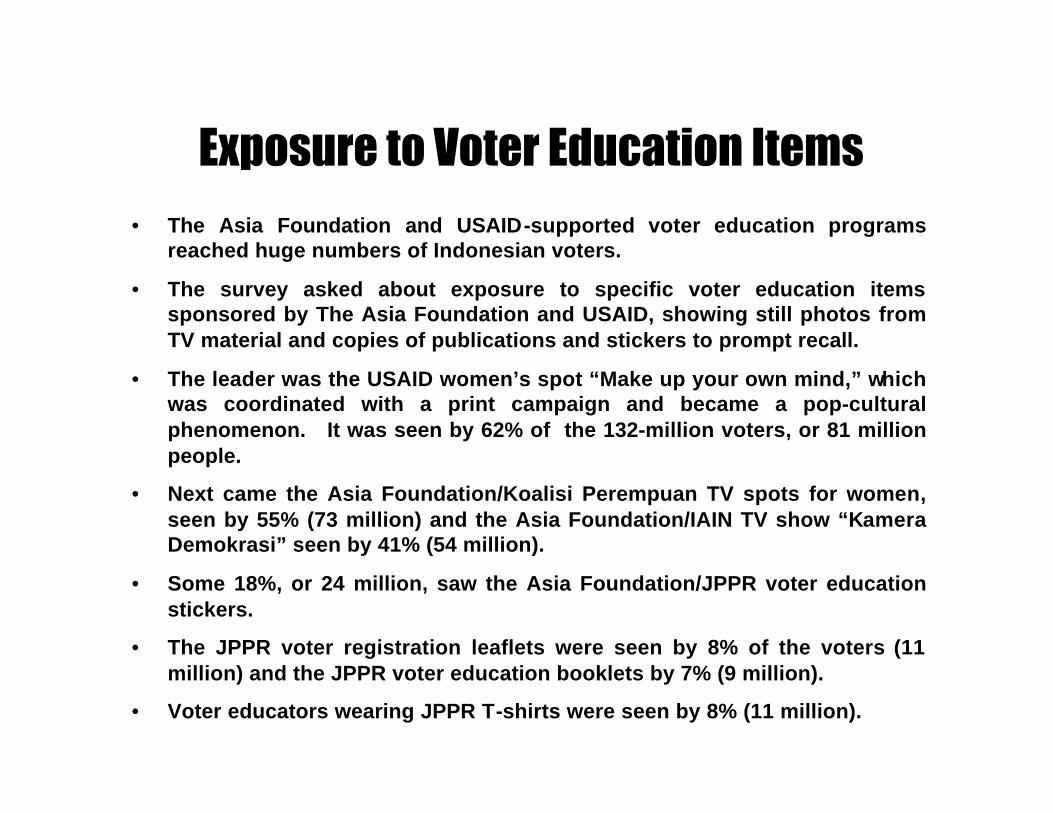
Exposure to Voter Education Items• The Asia Foundation and USAID-supported voter education programs
reached huge numbers of Indonesian voters.
• The survey asked about exposure to specific voter education items sponsored by The Asia Foundation and USAID, showing still photos from TV material and copies of publications and stickers to prompt recall.
• The leader was the USAID women’s spot “Make up your own mind,” which was coordinated with a print campaign and became a pop-cultural phenomenon. It was seen by 62% of the 132-million voters, or 81 million people.
• Next came the Asia Foundation/Koalisi Perempuan TV spots for women, seen by 55% (73 million) and the Asia Foundation/IAIN TV show “Kamera Demokrasi” seen by 41% (54 million).
• Some 18%, or 24 million, saw the Asia Foundation/JPPR voter education stickers.
• The JPPR voter registration leaflets were seen by 8% of the voters (11 million) and the JPPR voter education booklets by 7% (9 million).
• Voter educators wearing JPPR T-shirts were seen by 8% (11 million).

Exposure to Voter Education ItemsDid you see any of the following before the elections?
USAID Women's TV spot 62%
Asia Foundation/ Koalisi Perempuan PSA 55%
Asia Foundation/ IAIN 60-minute TV show 41%
JPPR stickers 18%
JPPR voter registration leaflets 8%
JPPR T-shirt worn by voter educators. 8%
JPPR booklet 7%
Impact of Voter Education:Election Process Issues
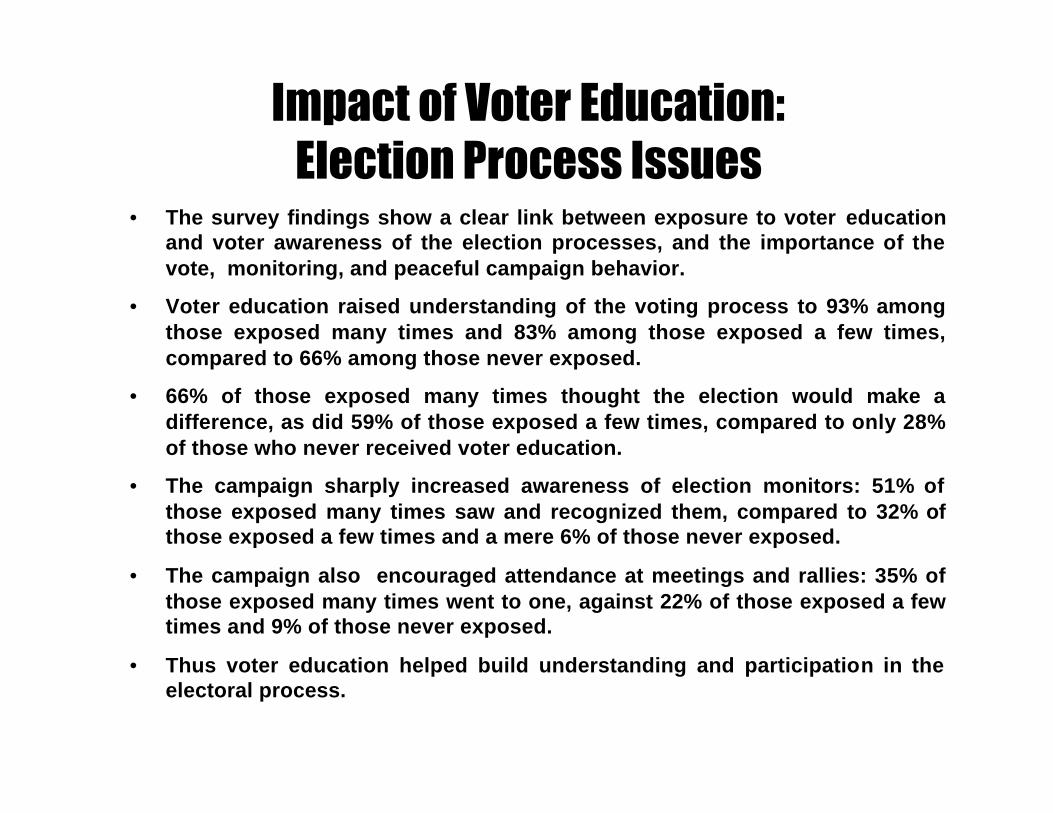
• The survey findings show a clear link between exposure to voter education and voter awareness of the election processes, and the importance of the vote, monitoring, and peaceful campaign behavior.
• Voter education raised understanding of the voting process to 93% among those exposed many times and 83% among those exposed a few times, compared to 66% among those never exposed.
• 66% of those exposed many times thought the election would make a difference, as did 59% of those exposed a few times, compared to only 28% of those who never received voter education.
• The campaign sharply increased awareness of election monitors: 51% of those exposed many times saw and recognized them, compared to 32% of those exposed a few times and a mere 6% of those never exposed.
• The campaign also encouraged attendance at meetings and rallies: 35% of those exposed many times went to one, against 22% of those exposed a few times and 9% of those never exposed.
• Thus voter education helped build understanding and participation in the electoral process.

Impact of Voter Education:Election Process Issues
Voter Education Exposure
NeverFew times/
onceMany times
Understood voting process 66% 83% 93%
Election will make a difference 28% 59% 66%
Saw and recognized election observers/monitors
6% 32% 51%
Attended meetings/rallies 9% 22% 35%

Impact of Voter Education:Civic Education Issues
• There is also an evident link between exposure to voter education campaigns and public attitudes on civic education issues, which included the right to speak freely, women’s equality, political tolerance, and attributes of democracy.
• Voter education helped spread the word that political expression is free: 92% of those exposed many times believed this, as did 81% of those exposed a few times, and just 55% of those never exposed.
• Some 77% of those exposed many times said women should be as active as men in political leadership, against 67% of those exposed a few times and 54% of those never exposed.
• Political tolerance was another emphasis, and 77% of those exposed many times would accept unpopular parties’ meetings, against 69% of those exposed a few times and just 46% of those never exposed.
• The campaigns also gave substance to the meaning of the term “democracy”: 91% of those exposed many times could offer one, against 53% of those exposed a few times and 36% of those never exposed.

Impact of Voter Education:Civic Education Issues
Voter Education Exposure
NeverFew times/
onceMany times
Political expression is free 55% 81% 92%
Political leadership: women as active 54% 67% 77%
Would tolerate all parties 46% 69% 77%
Meaning of democracy: could respond 36% 53% 91%

Impact of Voter Education: Gender Issues
• The survey findings also let us examine the impact of the two most widely seen voter education items, which dealt with gender issues: the Asia Foundation/Koalisi Perempuan TV spot and the USAID women’s spot.
• When attitudes towards women’s participation in political leadership are tallied by exposure to the Koalisi Perempuan spot, there is clear evidence of its effectiveness.
• Of those who saw the spot, 75% say women should be as active as men, Among those who did not see the spot, just 63% did -- virtually the same proportion as in the January poll.
• A similar but even larger impact is evident for the USAID women’s spot, which told women to “make up your own mind.”
• Some 82% of those who saw the spot agreed with this idea, while only 66% of those who had not seen it did.
• Thus the survey findings show that individual, widely-seen educational spots had a measurable effect on important issues such as genderequality in politics.

Impact of Voter Education:Gender Issues
Responses on women’s issues by exposure to gender TV spots
75%63%
82% 66%
0%
20%
40%
60%
80%
100%
Saw the spot Didn't see spot
Women should be just as active as men in political leadership
Married women should make their own choice
The Asia Foundation/ KOALISI PEREMPUAN: TV
Spot for women
USAID women TV spot: “Make up your own mind”

Civic Education Issues:Change from January to July
• Since our July poll repeated several questions in the previous survey, we can also show how attitudes have changed since January on some issues that civic education efforts dealt with. To sum up what we saw:
– The proportion of Indonesians who can offer a response on the meaning of democracy increased from 39% in January to 50% in July.
– The percentage who felt women should be as active as men in political leadership rose from 61% to 70% over the same time.
– Those who would tolerate unpopular parties grew from 49% to 70% of the voters.
– The share of the voters who said political expression was free rose from 55% to 83%.
• The third column in the table shows the attitudes in July of those voters exposed to no voter education, which resemble those of the entire electorate in January. In other words, the views of this “control group” seem unchanged.
• The growth in attitudes favored by voter education -- and its apparent absence among those not exposed to it -- strongly suggests that the change in attitudes is due to voters who were exposed to voter education.

Civic Education Issues: Change from January to July
All VotersNo Voter
Ed.January July July
Meaning of Democracy: could respond 39% 50% 36%
Political leadership: women as active 61% 70% 63%
Would tolerate all parties meetings 49% 70% 46%
Political expression is free 55% 83% 55%

Who Was Not Exposed To Voter Education?
• The minority of Indonesians not exposed to voter education tended to be the most isolated, in geographic, social, or media terms.
• Most of them are rural dwellers, have no or less than primary education, and are not regular TV viewers -- 76% in each case.
• Some 68% are over 35, and 61% are women.
• 50% belong to no organizations.
• In short, the group missed by voter education represents the most disadvantaged.

Who Was Not Exposed To Voter Education?Of the 15% who never saw or heard voter education...
• 76% live in rural areas
• 76% have no or incomplete primary school education
• 76% are not regular TV viewers
• 68% are over 35
• 61% are women
• 50% belong to no organizations

Summary - Impact of Voter Education• Voter education reached a large majority of Indonesian voters.
• TV was the voter education medium which reached the greatest number of voters and had the greatest effectiveness.
• TV voter education items funded by The Asia Foundation and USAID were seen by more than half the voters, while print materials and in-person voter education they sponsored reached tens of millions.
• There was clear evidence that voter education had an impact: the more often voters were exposed to it, the likelier they were to feel they understood the voting process, think the election would make a difference, recognize election monitors, or attend election meetings.
• There was a similar tie between exposure to voter education and views on political tolerance, gender issues, and the characteristics of democracy.
• Between January and July, public opinion on civic education issues the campaigns dealt with moved in the direction the campaigns favored, but only among those whom the campaigns reached.
• The few Indonesians who got no voter education tended to be rural, poorly educated, older, female, and cut off from TV and from organizations.
• Voter education thus contributed to the legitimacy of the election itself, to the establishment of an atmosphere conducive to free and fair elections, and to the promotion of democratic political culture.

Part 5:Civil Society Issues

Differences in Participationby Civil Society Organization
• The survey findings indicate that political participation other than voting, both electoral and non-electoral, is linked to participation in civil society structures – civil organizations, religious institutions, and workplaces.
• This is a phenomenon which has been observed in research elsewhere, so we decided to examine whether it applied to Indonesia as well.
• We looked at the proportion of Indonesians who participated politically in ways beyond the vote -- either in the election or in non-electoral terms --among those active in three major types of civil society structures.
• Of members of organizations, 54% did more than register and vote, while among non-members only 23% did.
• Among those who attended religious services at least once a month, 48% did more than vote, while of those who did not only 28% did.
• Some 46% of people who are employed did more than vote, against only 35% of those who are not working.
• Being active in organizations of civil society thus has a strong connection to political participation in Indonesia.

Differences in Participation by Civil Society Organization
Percent in each group that did more than register and vote
54%
23%
48%
28%
46%
35%
0%
20%
40%
60%
Civil organization Attend religiousservices
Working
Involved in group Not involved
Q.30-33, 38

Involvement in Civil Society Organizations
• The reach of the institutions of civil society in Indonesia is very broad.
– 78% of Indonesians attend religious services once a month or more.
– 66% of them belong to civil organizations (for example, religious groups, neighborhood associations, women’s groups, and youth andschool parents groups).
– 62% are employed.
• The people who are less frequently organizational members, worshippers, or workers tend to be women, older, and rural -- precisely the groups least likely to participate politically other than by voting.
• Still, only 6% of Indonesian adults are not involved in any of these.

Involvement in Civil Society Organizations
Attend religious services once monthly or more 78%Organizations 66%Working 62%None of these 6%

Civic Skills in Civil Society• Research in other countries has shown that the link between political
participation and civil society is the opportunity civil society groups offer to acquire “civic skills” needed for political participation beyond voting.
• This is especially important for members of disadvantaged groups, since it can compensate for limits to participation due to their social background.
• To understand why involvement in civil society promotes participation, we looked at the opportunities they offer to exercise five types of civic skills:
– writing a letter for the group
– attending a meeting and participating in decision-making
– planning or chairing a meeting
– making a speech or presentation
– holding an official post or position
• Civil organizations most often offered chances to practice civic skills (6% -- 16% of members), followed by religious institutions (5-13% of worshippers). Workplaces rarely did so (2-5% of employees).
• But the most impressive finding was that 70% of the Indonesian public had exercised NONE of these skills in any organizational context.
• Participation in civil society in Indonesia thus appears very hierarchical, much as in political society.

Civic Skills in Civil SocietyHere is a list of things that people sometimes do at work, in their religious institution, or in
other organizations. After I read each one, please tell me whether or not you have done that in the last year.
Skills Exercised In OrganizationIn Mosque /
Church / TempleAt Work
Never / DK / Refused
Wrote a letter on behalf of the organization
7% 6% 4% 88%
Helped make a decision at a meeting 16% 13% 5% 76%
Planned or chaired a meeting 10% 6% 4% 86%
Made a speech or presentation 6% 5% 2% 91%
Held an official post or belonged to a committee
10% 7% 3% 86%

Civic Skills and Participation• The extent to which Indonesians practice civic skills in civil society
groups is closely tied to their political participation beyond the vote.
• Of those who have never exercised any of the five civic skills we studied in civil society -- the vast majority of the public -- only 35% have done anything more than register and vote in the past five years.
• Of those who have exercised at least one such skill, 56% have done more than voting, and of those who have exercised two such skills, 61% have.
• Of the small group who have used three or more civic skills in civil society, 78% have done more than vote in the past five years.
• Thus, those who are active in civil society also tend to be those who are active in electoral and non-electoral political life.
• This reflects the fact that they possess the skills required to participate and lead civic advocacy and election campaign activities.
• In other words, in Indonesia at present, inequalities in participation in civil society reinforce inequalities in political participation. They do not counter-balance them.

Civic Skills and ParticipationPercent who did more than register and vote by number of civic skills exercised.
35%
56% 61%
78%
0%
20%
40%
60%
80%
100%
None One Two Three+
Civic Skills Exercised

Education
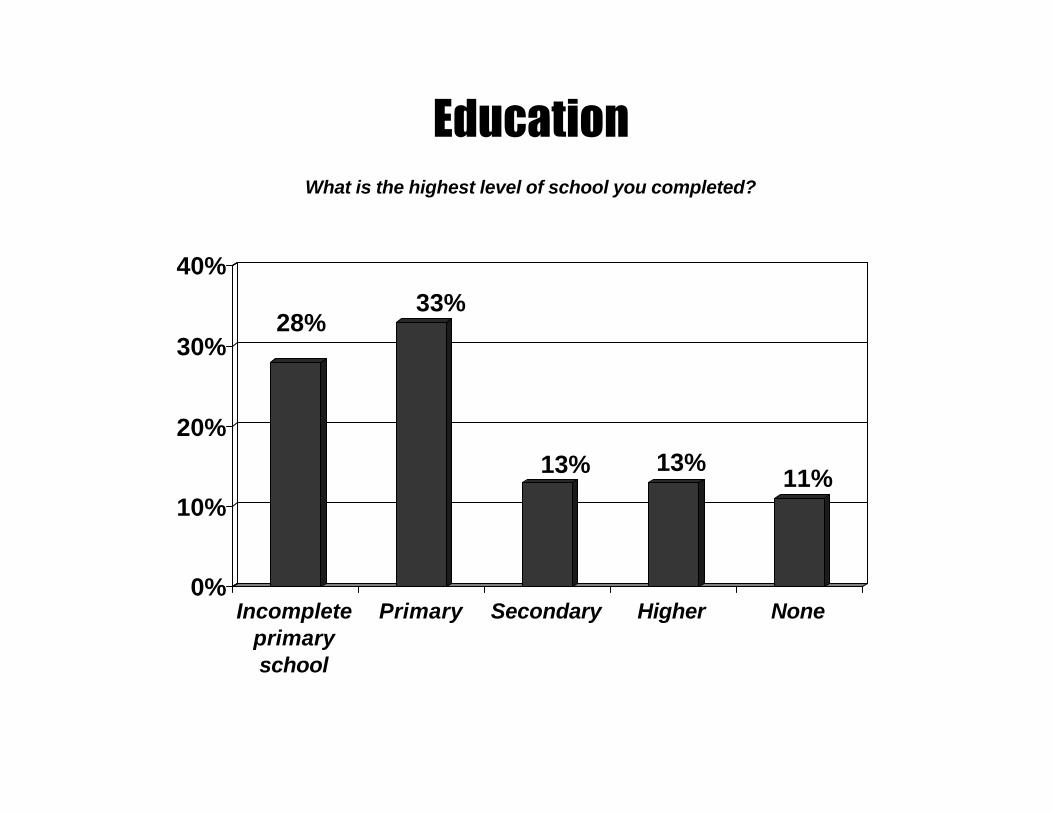
• We looked at Indonesians’ school experience as well, because other research has linked this, too, to political participation.
• A total of 89% of Indonesians have had some schooling:
– 28% have incomplete primary education.
– 33% completed primary school.
– 13% have gone to secondary school.
– 13% have higher education.
• Only 11% have received no schooling at all.
• Therefore we explored differences in the nature of Indonesians’ school experience to see if it helps explain the differences in their political participation.
EducationWhat is the highest level of school you completed?
28%33%
13% 13%11%
0%
10%
20%
30%
40%
Incompleteprimaryschool
Primary Secondary Higher None

Student Interest in Politics
• Most Indonesians say they were not very interested in politics when they were in school.
• Only 19% were interested (6% very, 13% somewhat), and 65% not interested.
• These figures are like those for the general public -- not too surprising since most people have been to school.
• The main correlates of political interest in one’s school days are youth and education.
– Among under-35s, 24% say they were interested in politics at school, twice the proportion among those older (12%).
– Some 34% of those who went to high school and 43% of those over 18 now students (mostly at university) say they were interested in politics in school.

Student Interest in PoliticsNow think back to your school days. How interested were the students in your school about
events and politics then – very interested, somewhat interested, not very interested, or not interested at all?
6%
13% 27%
38%
0%
20%
40%
60%
80%
Very/Somewhat: 19% Not Very/Not at all: 65%
Very/Not at all Somewhat/Not very

Current Events Courses
• The Indonesian classroom seems to have been a rather apolitical place.
• Only 24% of Indonesians who went to school had classes that wereconcerned with current events.
• Some 65% say they did not and the remainder are unsure.
• Once more those under 35 or who have secondary or further education are the most likely to have been exposed to current events classes.
• Civics education in Indonesian schools thus seems very limited.

Current Events CoursesThinking still about your school days, did you ever have any courses that required you to pay
attention to current events?
24%
65%
11%
0%
20%
40%
60%
80%
Yes No DK/Refused

Organizational Involvement in School
• Indonesians are joiners, in school and outside it.
• Some 68% of Indonesian adults who went to school say they belonged to some sort of organization while there.
• The student organizations of which the most people had experience in school were the Scouts, to which 45% belonged, and sports clubs, which 40% joined.
• Some 15% were members of other school clubs.
• Some 7% joined religious student groups, 5% were in the leadership of student government, and 4% worked for student newspapers.
• Only 32% did not belong to any student group.

Organizational Involvement in SchoolIn school, did you participate in…?
Scouts 45%School sport clubs 40%School clubs 15%Religious student organizations 7%Student government leadership 5%Student newspaper 4%None of these 32%
School Experience and Participation
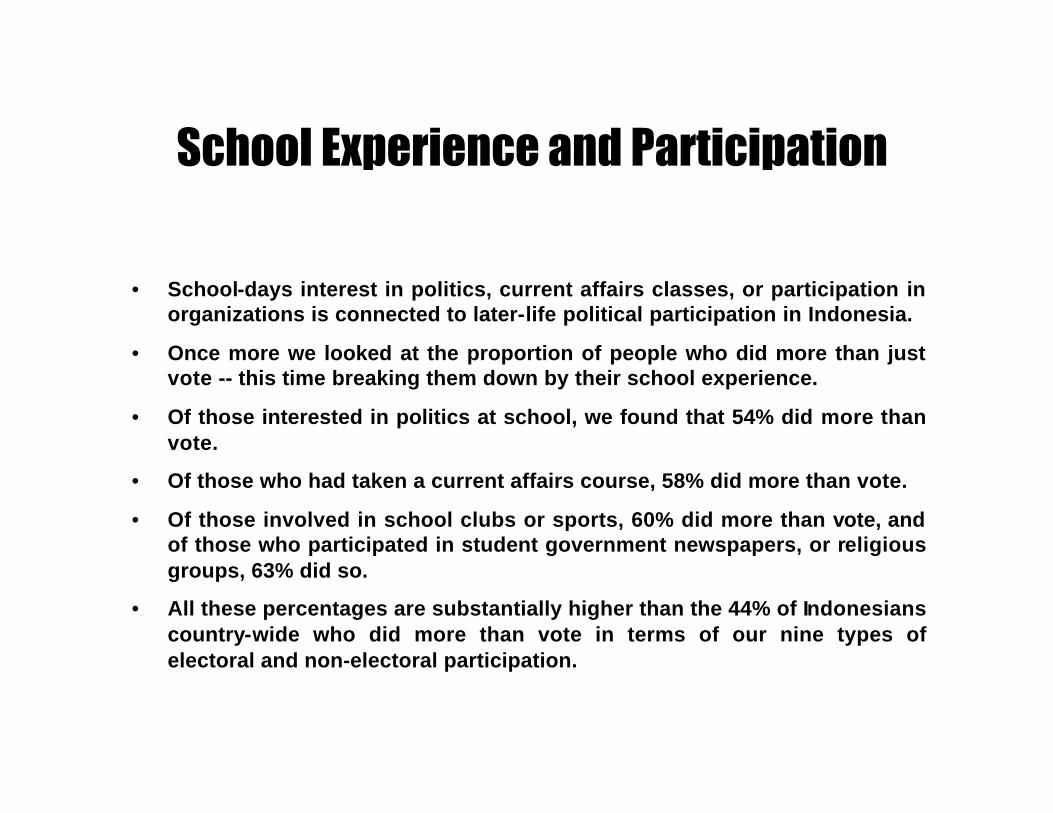
• School-days interest in politics, current affairs classes, or participation in organizations is connected to later-life political participation in Indonesia.
• Once more we looked at the proportion of people who did more than just vote -- this time breaking them down by their school experience.
• Of those interested in politics at school, we found that 54% did more than vote.
• Of those who had taken a current affairs course, 58% did more than vote.
• Of those involved in school clubs or sports, 60% did more than vote, and of those who participated in student government newspapers, or religious groups, 63% did so.
• All these percentages are substantially higher than the 44% of Indonesians country-wide who did more than vote in terms of our nine types of electoral and non-electoral participation.

School Experience and ParticipationPercent who did more than register and vote, by school experience.
54% 58% 60% 63%
0%
20%
40%
60%
80%
Interested inpolitics
Current affairscourses
School clubs orsports
Studentgovernment,
newspapers orreligious group

Summary - Civil Society Issues• Political participation beyond the vote is linked to participation in civil
society structures -- organizations, religious institutions, and workplaces.
• Most Indonesians are involved in some type of civil society institution, through civil organizations, religious worship, or work.
• But these groups offer few opportunities to exercise civic skills -- though organizations and religious institutions provide more than workplaces do.
• The practice of civic skills in civil society has a strong effect on political participation beyond the vote, including types linked to civic advocacy.
• In Indonesia, inequalities in social and political participation are thus cumulative rather than countervailing.
• Few Indonesians were interested in politics when they were at school, and most had no classes in current affairs.
• The majority of those who went to school did join clubs or groups, however.
• School experience -- interest in politics, current affairs classes, or participation in student groups -- is closely linked to political participation.
• The democratization of civil society in Indonesia thus appears to be one of the pathways to the strengthening of political democracy as well. Much more should be done to examine this issue.

Part 6: Regional and Decentralization Issues

Group Identity• Though Indonesians’ most intense identity is religious, national identity is
stronger than ethnic or regional identity in most of the country.
• Some 28% of Indonesians say they feel a lot in common with someone of the same religion, and 40% feel something in common, for a total of 68%.
• 23% say they feel a lot in common with other Indonesians, and 37% feel something in common with them, for a total of 60%.
• 22% feel a lot in common with other members of their ethnic or language group, and 38% feel something in common, also totaling 60%.
• 20% feel a lot in common with other people from their region or province, and 39% feel something in common, for a total of 59%.
• Despite the reality of regionalism, national identity is stronger than regional identity in Java, Sumatra (excluding Aceh), Kalimantan, and Sulawesi. In those regions, more people feel a lot in common with other Indonesians than with others of the same ethnic or regional background.
• Only in Irian Jaya (by 20% to 14%) and the Other Islands (by 23% to 17%) are those who feel a lot in common with others from their region a bit more numerous than those who feel a lot in common with other Indonesians.

Group IdentityIf you heard that someone belonged to your…, how much would you feel you had in common
with them? A lot, something, a little or not much?
A lot SomethingA little/not
muchSame religion 28% 40% 30%Fellow Indonesian 23% 37% 36%Ethnic / language group 22% 38% 37%Same region / Province 20% 39% 39%

Levels of Government
• Indonesians see local government as more important than nationalgovernment in their lives.
• Some 47% of the public said local government in their town or village affected their lives more, compared to just 34% who said the national government in Jakarta did.
• A majority or plurality take the same view in every region and in most social groups.
• The only exceptions are:
– residents of big cities (over 1-million) and students -- two of the most politicized groups; and
– men over 35 -- who may have stronger memories of eras of struggle for independence and national unity.
• For the the largest part of the public, then, a locally-oriented or parochial view of politics prevails.

Levels of GovernmentWhose decisions affect your life more: the national government in Jakarta, or the local
government in this town or village?
47%
34%
3%
17%
0%
10%
20%
30%
40%
50%
Local government Nationalgovernment
Both equally Don't know

Attitudes towards Decentralization
• Given the existence of strong regional identities and a locally-centered view of politics, it is not surprising that the majority of Indonesians favor giving more authority to the provinces.
• Some 54% of the public feel that provincial governments should receive more power, while only 26% prefer the current situation, where the central government in Jakarta has almost all the power and money.
• This view is very widely held: it commands a substantial plurality or majority in every region and social group in the survey. This includes Java and the big cities.
• The broad support for further decentralization is correlated with regional identity and a locally-centered view of politics. This suggests that the the devolution of power may offer a more effective way to satisfy regional aspirations while maintaining national unity than the imposition of uniformity from the center.

Attitudes towards DecentralizationHere are two ideas on how to organize the government.
Tell me which one you agree with more:
54%
26%21%
0%
20%
40%
60%
Provincial governments should receive more powerSituation should continue – Jakarta has almost all power and moneyDon’t know / refused

Decentralization: Reaction to Arguments
• When given strong arguments for and against, public support for decentralization holds up.
• To make sure we were tapping real opinions, we presented summaries of the main arguments against decentralization (regional inequality and national unity) and for it (central domination and regional aspirations).
– If the provinces are given more power to make their own laws and spend their own money, it could hurt the regions with less money. And differences between provinces could cause the break-up of Indonesia.
– Central government in Jakarta has taken too much money and too much power away from the provinces. More money and power for the provinces is fairer and will reduce tension with central government.
• Given this informed choice, Indonesians still preferred the second option, further decentralization, by 49% to 25%, or almost two to one.

Decentralization: Reactions to Arguments
Here are two more views. Which one do you agree with more?
49%
25% 25%
0%
20%
40%
60%
Central government has taken too much money and powerMore power and money for provinces endangers national unityDon't know/Refused
Summary - Regional and Decentralization Issues
• Religious identity is the strongest form of identity among Indonesians, though not by a large degree compared to national identity.
• National identity is stronger than ethnic or regional identity in the four main islands -- Java, Sumatra (excluding Aceh), Kalimantan, and Sulawesi.
• On the periphery -- in Irian Jaya and the Other Islands -- regional identity is marginally stronger than national identity.
• However, Indonesians do have a locally-oriented view of politics: they see local government as affecting their lives more than national government.
• The majority of the public in every region -- including Java -- favors further decentralization of power and resources to the provinces.
• This pro-decentralization sentiment is strong: it holds up even when forceful argumentation against decentralization is presented.

Part 7: Administration of Justice and Human Rights Issues

Use of Dispute Resolution Mechanisms
• RT or village officials and religious leaders are Indonesians’ main resorts to solve disputes, but most have never used any form of dispute resolution mechanism.
• RT or village officials have been consulted by 16% of the public to resolve a conflict or dispute, and 9% have used religious leaders for this purpose.
• No other mechanism has been used by more than 5%: the police have been used by 4% to solve disputes, government officials by 2%, and NGOs by 1%.
• Lawyers or courts have been used by only 1% as well.
• But 73% of the public has used none of these mechanisms. These results are consistent with the above-reported rarity with which Indonesians contact officials and their feelings of impotence regarding influencing official decisions.
• Informal, local dispute resolution techniques thus are more important in the lives of Indonesians than are formal legal procedures.

Use of Dispute Resolution MechanismsHave you ever gone to any of the following people to resolve a conflict or dispute?
An RT or village official 16%
A religious leader 9%
The police 4%
A government official 2%
A non-govermental organization 1%
A lawyer or court 1%
None of these 73%

Confidence in Law Enforcement
• Attitudes to the police and lawyers are mixed, but views of the courts and TNI as means of enforcing the law are positive.
• Some 49% of the public is very or fairly confident that the police will enforce the law fairly, but a sizable 38% is not confident, and the remaining 13% is not sure.
• Lack of confidence in the police predominates among residents of cities over 1-million and high school educated people.
• The courts receive a thumbs-up, with 56% confident, 29% not confident.
• Lawyers are viewed positively but without enthusiasm: 49% are confident in them, 28% not confident, but 23% are not sure.
• TNI receives the most positive reaction: 60% are very or fairly confident it will enforce the law fairly, only 24% disagree. A majority or plurality of every social group takes the same position.
• Of the different law enforcement agencies, the police are the most urgently in need of measures to strengthen their credibility with the public.

Confidence in Law EnforcementNow I’d like to ask you about people whose job is enforcing the law. Tell me if you are very confident, fairly confident, not very confident,
or not confident at all that they will enforce the law fairly.
Very/Fairly Not very/Not at all Don't know
The Police 49% 38% 13%
The Courts 56% 29% 16%
Lawyers 49% 28% 23%
ABRI 60% 24% 16%

A Corruption Trial for Suharto?• A substantial majority of the Indonesian public believes former President
Suharto should be tried on charges of corruption.
• Because of the sensitivity of the subject, we wanted to make sure that people understood the issues and the question was unbiased. So we asked the question in a balanced way that summarized the arguments for and against a trial:
– Former President Suharto should be put on trial for corruption. Corrupt leaders must be punished, no matter who they are.
– Former President Suharto should not be put on trial. It could cause conflict, and Indonesia should face the future, not the past.
• When asked this way, 70% of Indonesians favor putting former President Suharto on trial for corruption, while 16% oppose it, and 14% are not sure.
• Majorities favor trying Suharto in every social group and in every region except Irian Jaya, where only a plurality favors a trial.
• There is clearly a strong public desire for some sort of accountability on the part of Suharto.

A Corruption Trial for Suharto?Here are two opinions people have. Which view -the first or the second - is closer to your own?
70%
16% 14%
0%
20%
40%
60%
80%
Former President Suharto should be put on trial for corruption. Corrupt leaders must bepunished, no matter who they are.
Former President Suharto should not be put on trial. It could cause conflict, and Indonesiashould face the future, not the past.
DK/Refused

Punishing Military Officers for Human Rights Violations
• A large majority of the Indonesian public favors punishment for military officers guilty of serious human rights abuses.
• Once more, because the subject is delicate, we tried to make our question as fair as possible. So we put forward the two major arguments on this issue, and offered examples of serious human rights abuses:
– Officers responsible for serious human rights abuses, like killings, kidnappings, and torture in the past should be punished. No one is above the law.
– It would not be wise to try to punish officers responsible for human rights violations. That would be too dangerous.
• Some 81% of Indonesians favor punishing officers responsible for serious human rights abuses. Only 7% feel it would not be wise to punish them, while 13% are not sure.
• Majorities in every social group and region favor punishing those behind such abuses.
• On human rights, too, there is a clear public demand for accountability.

Punishing Officers for Human Rights Violations
Here are two more opinions. Which view – the first or the second –is closer to your own?
81%
7%13%
0%
20%
40%
60%
80%
100%
Officers responsible for serious human rights abuses, like killings, kidnappings, andtorture in the past should be punished. No one is above the law. It would not be wise to try to punish officers responsible for human rights violations. Thatwould be too dangerous.DK / Refused

Attitudes towards Truth Commission• A large majority of Indonesians would favor creating a “Truth
Commission” to investigate corruption and human rights abuses and name the people responsible for them if those people cannot be tried.
• Such Truth Commissions have been used in other countries where it was not feasible to put violators of human rights on trial, such as Chile, South Africa, and Brazil, and some suggest Indonesia should do the same.
• Since the concept is unfamiliar to many people, we put the issue this way:
– If those suspected of corruption and human rights abuses cannot be put on trial, Indonesia could set up a “truth commission” to investigate them and tell the country who was responsible, as other countries have done. If they cannot be put on trial, would you favor such a truth commission, or oppose it?
• Some 79% of Indonesians favored a Truth Commission if trials cannot be held for those suspected of corruption and human rights violations, 7% opposed it, and 14% were not sure.
• A Truth Commission thus may offer another way to achieve the accountability the public demands of officials for corruption or rights violations if trials are not possible.

Attitudes towards Truth CommissionIf those suspected of corruption and human rights abuses cannot be put on trial, Indonesia
could set up a “truth commission” to investigate them and tell the country who was responsible, as other countries have done. If they cannot be put on trial, would you favor
such a truth commission, or oppose it?
79%
7%14%
0%
20%
40%
60%
80%
100%
Favor Oppose DK/Refused

Summary - Administration of Justice and Human Rights Issues
• Informal mechanisms -- particularly RT or village officials and religious leaders -- resolve disputes among Indonesians far more often than do the police, lawyers, and courts.
• Views of the police are mixed in the general public and negative among big-city and better-educated Indonesians.
• Views of the fairness of the courts and TNI as law enforcers are generally positive.
• A substantial majority of the Indonesian public favors putting former President Suharto on trial for corruption.
• An even larger majority favors punishing officers responsible for human rights abuses.
• If such trials are impossible, most Indonesians would favor forming a Truth Commission to investigate past abuses and name those responsible.
• These attitudes point to a strong public desire for accountability for those accused of committing abuses while leaders in the previous government.

Conclusions: Voter Education and the Election
• The basic conclusion of the survey is: the election and the voter education campaigns conducted by The Asia Foundation, USAID, and other organizations succeeded.
• The election was far more legitimate than voting was under President Suharto and there were few complaints of electoral abuses.
• Voters also felt they understood the electoral process and recognized monitors and observers. This was linked to voter education.
• Voter education also helped explain the importance of the vote, build faith in free expression, promote tolerance among supporters of rival parties, encourage women’s political participation as equals, and increase knowledge of the basic elements of democracy.
• In these ways it contributed to the creation of an atmosphere conducive to free and fair elections and the beginnings of a democratic culture.
• In turn, the election and the process of political reformasi of which it is part, along with the start of economic recovery, did much to restore stability and optimism in Indonesia.

Conclusions: Voter Education and the Election
• The election and voter education succeeded.
– More legitimate vote and few alleged abuses.
– Awareness of the process and of observers.
• Voter education also helped to:
– Convince voters of the importance of the vote.
– Build confidence in freedom of expression and political tolerance.
– Encourage equal participation by women.
– Increase knowledge of elements of democracy.
Conclusions: Consolidating Democracy in Indonesia
• The poll results also point to several challenges which must be faced in the consolidation of democracy in Indonesia.
• There is a need to deepen citizen participation and democratic values. Indonesian citizens now do little to participate in politics besides vote. They feel they cannot influence their rulers, and understand little how democracy works.
• Democratizing politics also means democratizing civil society. Civil society is the training ground for political participation, but now chances to participate there are few and limited to those already active in politics.
• More decentralization of power and resources is a popular demand and This makes sense a situation where regional identities are strong and the focus of political interest is local.
• The administration of justice and official accountability are major issues. Informal dispute resolution mechanisms can be strengthened, and the workings of the police need improvement.
• Acknowledgement of past abuses by top officials is also sought by the public, via trials or a truth commission, which could provide some accountability for past abuses and set new standards for official behavior.
• Indonesia is on the road to democracy, but it still has some ways to go.

Conclusions: Consolidating Democracy in Indonesia
• Deepening Citizen Participation and Democratic Values.
• Democratizing Civil Society.
• Decentralization.
• Strengthening the Administration of Justice and Official Accountability.

Vol. II Regional Findings

Introduction to Regional Findings• This Regional Findings section of the report, has six sub-sections:
– Inter-Regional Comparisons
– Java
– Sumatra
– Irian Jaya
– Kalimantan
– Sulawesi
• For each region, there are sections on the regional mood, attitudes to the election, exposure and impact of voter education, and issues concerning civil education, civil society, decentralization and administration of justice.
• Bali, West Nusa Tenggara (Lombok, Sumbawa), and East Nusa Tenggara (Sumba, Flores, Timor) are grouped together under Other Islands.
• Including oversample interviews, the bases for the regional samples were: Java 488, Sumatra 161, Irian Jaya 104, Kalimantan 104, Sulawesi 104, and Other Islands 48.
• This yields error margins of +/-5% for the Java sample, +/-8% for Sumatra, +/-10% for Sulawesi, Irian Jaya, and Kalimantan, and +/-14% for Other Islands.
• Aceh, East Timor and Maluku were not sampled for security reasons.

Section IInter-Regional Comparisons
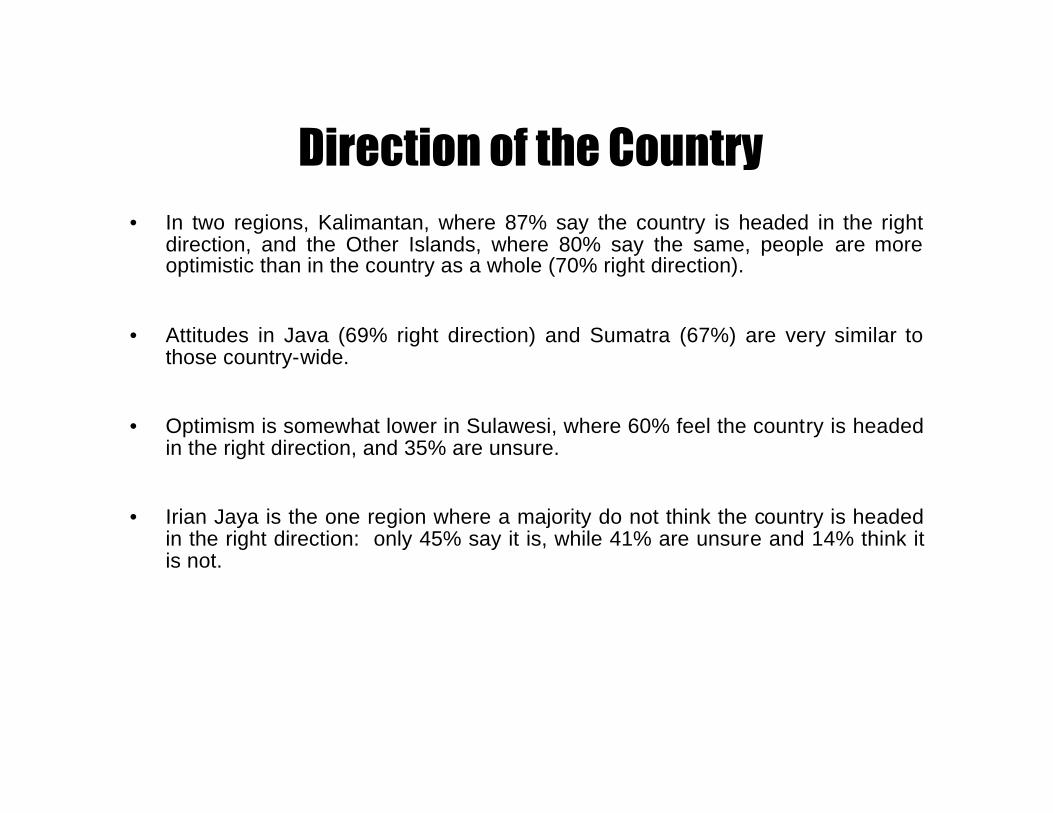
Direction of the Country• In two regions, Kalimantan, where 87% say the country is headed in the right
direction, and the Other Islands, where 80% say the same, people are more optimistic than in the country as a whole (70% right direction).
• Attitudes in Java (69% right direction) and Sumatra (67%) are very similar to those country-wide.
• Optimism is somewhat lower in Sulawesi, where 60% feel the country is headed in the right direction, and 35% are unsure.
• Irian Jaya is the one region where a majority do not think the country is headed in the right direction: only 45% say it is, while 41% are unsure and 14% think it is not.

Direction of the Country Generally speaking, do you think things in Indonesia today are going in the right direction,
or do you think they are going in the wrong direction? (Percent who replied “right direction”)
87%80%
69%67%
60%
45%
0%
20%
40%
60%
80%
100%
Kalimantan Other Islands Java Sumatra Sulawesi Irian Jaya

Freedom of Political Expression• The regions where people feel most free to speak are identical to those in the
last poll, though at much higher levels: Java (85%), Sulawesi (82%) and Sumatra (82%). In these regions, the proportion of those who feel free to express political opinions is close to the national average (83%).
• The atmosphere is also perceived as open and free by majorities in Kalimantan (77%) and the Other Islands (68%).
• In Irian Jaya, people are more fearful: Less than half, 41%, feel free to express themselves, while the same proportion (41%) do not feel free. It is the only region where the percent who feel they are not free to speak has risen, from 37% in the last poll.

Freedom of Political ExpressionDo people feel free to express their political opinions in the area where you live?
(Percent who replied “yes”)
85% 82% 82% 77%
68%
41%
0%
20%
40%
60%
80%
100%
Java Sulawesi Sumatra Kalimantan Other Islands Irian Jaya

Free and Fair Elections
• Majorities across Indonesia believe that the recent election was free and fair. Across the board, expectations from the last poll were exceeded by at least 10 points.
• In four regions, the proportion who consider this year’s election free and fair is close or equal to the national average of 80%: Kalimantan (85%), Sulawesi (83%), Java (80%) and Sumatra (80%). In Sulawesi and Java, January expectations were exceeded by more than 30 points.
• Belief that this year’s election was free and fair is slightly below the national average in the Other Islands (75%).
• While a respectable majority of Irian Jaya residents (62%) believe the election was free and fair, some 29% are unsure – the highest degree of uncertainty in any region.

Free and Fair ElectionsSome people think the 1999 election was free and fair, some think it was not, and some are
not sure. How about you? Which of these opinions do you agree with?(Percent who replied “yes, free and fair”)
85% 83%80% 80% 75%
62%
0%
20%
40%
60%
80%
100%
Kalimantan Sulawesi Java Sumatra Other Islands Irian Jaya
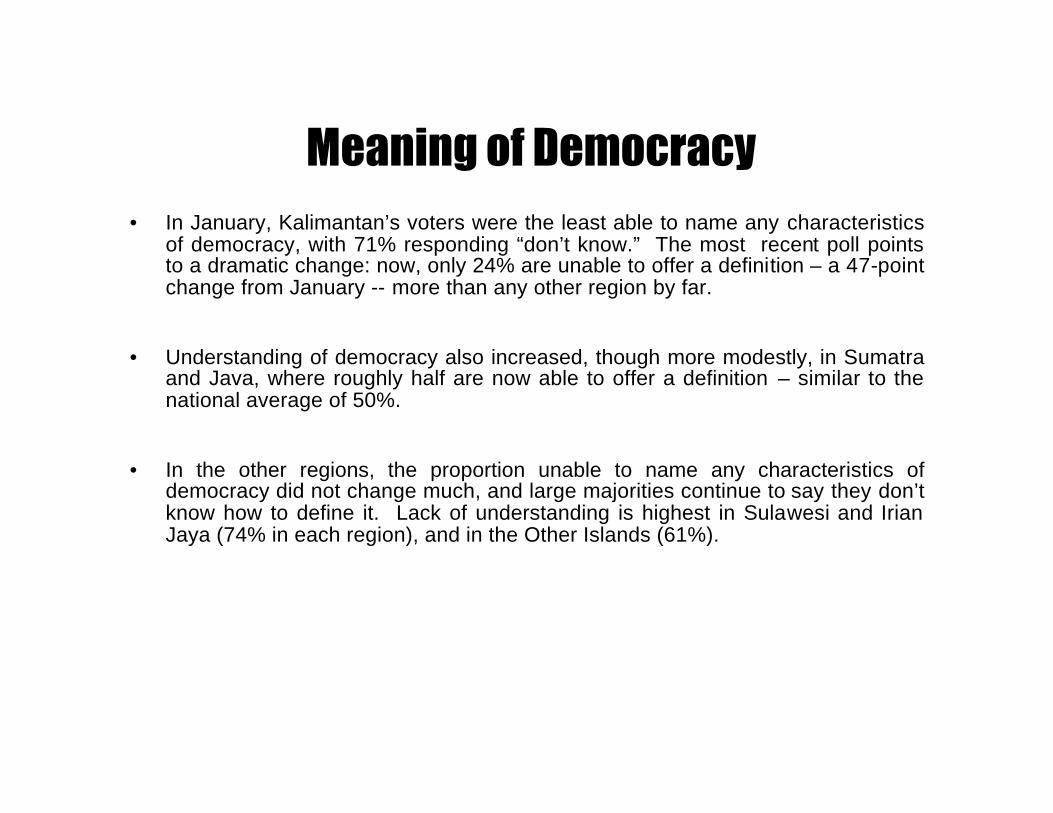
Meaning of Democracy• In January, Kalimantan’s voters were the least able to name any characteristics
of democracy, with 71% responding “don’t know.” The most recent poll points to a dramatic change: now, only 24% are unable to offer a definition – a 47-point change from January -- more than any other region by far.
• Understanding of democracy also increased, though more modestly, in Sumatra and Java, where roughly half are now able to offer a definition – similar to the national average of 50%.
• In the other regions, the proportion unable to name any characteristics of democracy did not change much, and large majorities continue to say they don’t know how to define it. Lack of understanding is highest in Sulawesi and Irian Jaya (74% in each region), and in the Other Islands (61%).

Meaning of DemocracyIf a country is called a democracy, what does that mean to you? Anything else?
(Percent who replied “don’t know”)
74% 74%
61%
50%48%
24%
0%
20%
40%
60%
80%
Sulawesi Irian Jaya Other Islands Sumatra Java Kalimantan

Exposure to Voter Education• Exposure to voter education was highest in Kalimantan, where nearly two-thirds
(65%) of residents said they saw or heard messages many times -- 15 points above the proportion who were exposed many times country-wide.
• More than half of voters in Sulawesi (55%) and Java (53%) were exposed to voter education many times, similar to the national average of 51%, while exposure in Sumatra was slightly lower at 48%
• Outside the four main regions, levels of exposure to voter education were much lower. Some 40% of voters in the Other Islands (40%) and only 25% of those in Irian Jaya, were exposed to voter education many times.

Exposure to Voter EducationDid you see or hear anything about registration, the election, or democracy from voter
education groups through … ? (Percent who replied “many times”)
65%
55% 53%48%
40%
25%
0%
20%
40%
60%
80%
Kalimantan Sulawesi Java Sumatra Other Islands Irian Jaya

Indonesian Identity• Identification with fellow Indonesians is strongest in Sulawesi, where 68% say
they feel a lot or some commonality with other Indonesians.
• Levels of identification are closer to the national average of 60% in Kalimantan (64%) and Java (63%).
• Outside of those regions, identification with the nation is weaker. While a majority of those in Sumatra (56%) and Irian Jaya (51%) feel commonality with other Indonesians, substantial minorities of 42% in each region feel the opposite way.
• Residents of the Other Islands were least likely to identify with their fellow countrymen; only 41% feel a lot or some in common, while the greatest proportion (49%) feel little or not much in common.

Indonesian IdentityIf you heard that someone was an Indonesian, how much would you feel you had in common
with them? A lot, something, a little, or not much?(Percent who replied “a lot” and “something”)
68%64% 63%
56%51%
41%
0%
20%
40%
60%
80%
Sulawesi Kalimantan Java Sumatra Irian Jaya Other Islands

Confidence in Police• Perception of the police as fair arbiters of the law varies widely. In the Other
Islands, 70% are confident that the police will enforce the law fairly.
• Elsewhere, narrow majorities of the residents of Sumatra (56%), Kalimantan (54%) and Sulawesi (52%) say they are confident in the police – a few points above the national average of 49%.
• In Java, residents are divided: 45% trust the police, while 41% do not.
• In Irian Jaya, by contrast, only one-third (33%) trust the police to enforce the law fairly.

Confidence in Police Tell me if you are very confident, fairly confident, not very confident, or not confident at all that the police will enforce the law fairly. (Percent who replied “very confident” and
“fairly confident”)
70%
56% 54% 52%
45%
33%
0%
20%
40%
60%
80%
Other Islands Sumatra Kalimantan Sulawesi Java Irian Jaya

Confidence in TNI*• Confidence in TNI is high across most of Indonesia. In Kalimantan, 69% of
residents trust TNI to enforce the law fairly – more than any other region.
• Perception of TNI is closer to the national average in Sulawesi (65% confident), Sumatra (62%) and Java (59%).
• TNI invokes less confidence among residents of the Other Islands (48% trust) and Irian Jaya (36%).
• Confidence in TNI is weaker in Irian Jaya, where 36% say they do not trust TNI to enforce laws fairly. In the Other Islands, people are uncertain: only 16% say they mistrust TNI, while a sizeable proportion, 36%, are unsure.
• The survey was taken before the referendum in East Timor and the subsequent allegations of TNI involvement in militia violence there.
* TNI = Tentara Nasional Indonesia (The Indonesian Armed Forces)

Confidence in TNITell me if you are very confident, fairly confident, not very confident, or not confident at all that TNI will enforce the law fairly. (Percent who replied “very confident” and “fairly
confident”)
69%65%
62% 59%
48%
36%
0%
20%
40%
60%
80%
Kalimantan Sulawesi Sumatra Java Other Islands Irian Jaya

Section IIJava

Part 1:The Regional Mood
( Java )

Summary - The Regional Mood( Java )
• The mood in Java in July was quite positive. Some 69% think the country is headed in the right direction, well up from January’s 44%. Only 16% say the country is headed in the wrong direction.
• The economy retains first place among concerns, cited by 58%. But it is less predominant than in January, when it was mentioned by 70%, while politics now is cited by 42%, up from 25% in the last poll. Some 16% are concerned by violence, down a bit from 22%.
• Another big gain registered is freedom of expression, with 85% feeling free to speak now, against 57%in January and 31% before Suharto’s fall.
• The proportion who think government cares what they think has risen to 70% from 58% in January.
• Confidence in the country’s future is also up, with 79% expecting a happy future for Indonesia.
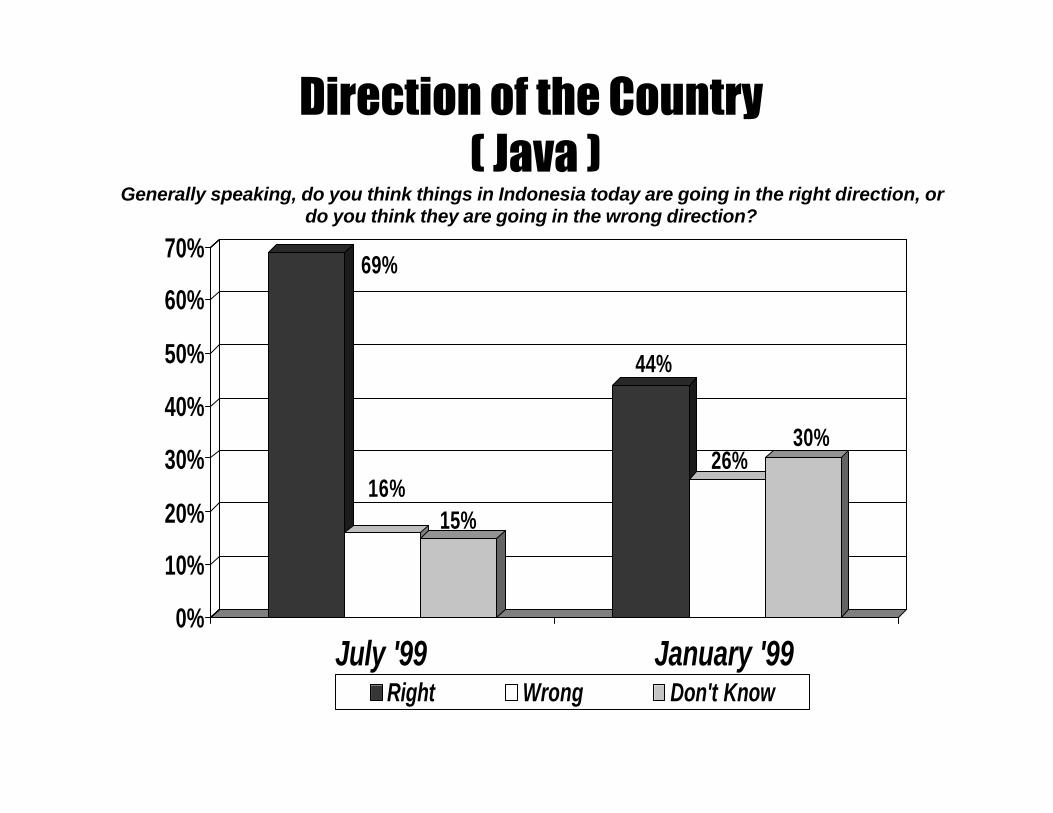
Direction of the Country( Java )
Generally speaking, do you think things in Indonesia today are going in the right direction, or do you think they are going in the wrong direction?
69%
16%15%
44%
26%30%
0%
10%
20%
30%
40%
50%
60%
70%
July '99 January '99Right Wrong Don't Know

Indonesia’s Biggest Problems( Java )
In your view, what is the biggest problem facing Indonesia? And after that, what is the second biggest problem?
58%
42%
16%
5%
0%
10%
20%
30%
40%
50%
60%
Economy Politics Violence Social

Pride in Indonesia(Java)
Generally speaking, what are the things about this country
you are most proud of as an Indonesian?
26%
19%
15% 14%
11%
6% 6%
10%
26%
0%
5%
10%
15%
20%
25%
30%
PeopleGeography
Economy
CultureReligion
HistoryPolitics
OtherNothing/DK

Freedom of Political Expression ( Java )
Do people feel free to express their political opinions in the area where you live? Did they feel free to express their opinions before the events of last May?
85%
7%
57%
15%
31%37%
0%
10%
20%
30%
40%
50%
60%
70%
80%
90%
Now January '99 Before May '98
Yes No

Political Alienation (Java)
Some people say, “I don’t think the government cares very much about what people like me think.” Do you agree or disagree? Strongly, or somewhat?
9%
13% 24%
46%
10%
16%23%
35%
0%
10%
20%
30%
40%
50%
60%
70%
Agree: 22% Disagree: 70% Agree: 26% Disagree: 58%
January '99July '99
Strongly Somewhat

Confidence in the Future(Java)
How confident are you of a happy future for Indonesia as a whole?
48%
11%26%
43%
2%10%0%
20%
40%
60%
80%
100%
Very/Fairly: 79% Not very/ Not at all:13%
Very/ Fairly: 70% Not very/ Not at all:12%
January '99July '99
Very/ Not at all Fairly/ Not very
31%
2%

Part 2:Attitudes to the Election
( Java )

Summary - Attitudes to the Election( Java )
• There is a consensus on the election: 80% of Javanese say it was free and fair, just 6%say it was unfair and 15% are unsure. This picture is more favorable than in January, when 57% expected a free and fair vote.
• The only concern about the vote which was noted on a large scale was omissions from the voting roll, cited by 22%. None of the other nine potential problems in the January poll was mentioned by more than 7% as having actually occurred in their areas.
• The working of the voting process was not a source of concern: 88% said they understood it.
• While registration and voting were nearly universal, almost one-third of Javanese also participated in election meetings or street rallies, more than in any other region in the poll.

Free and Fair Elections?(Java)
Some people think the 1999 election was [January: will be] free and fair, some think it was not [January: will not be], and some are not sure.
How about you? Which of these opinions do you agree with?
80%
6%
15%
57%
4%
39%
0%
10%
20%
30%
40%
50%
60%
70%
80%
90%
July '99 January '99Free and Fair Not Free and Fair Not Sure

Elections Free and Fair? 1999 vs. 1997
( Java)Some people think the 1999 election was Did you think the 1997 electionsFree and fair, some think it was not, and were free and fair?some are not sure. How about you?
80%
6%
15%
39% 39%
22%
0%
10%
20%
30%
40%
50%
60%
70%
80%
1999 1997Yes, free and fair No, not free and fair Don't Know

Election Concerns(Java)
I’m going to mention some problems that can happen in elections.For each one, tell me if you believe it happened [January: think it is possible] here in the
election this year.
July JanuaryPeople left off voting roll 22% 27%
News media bias favoring party 7% 21%
Finding out how people voted 6% 14%
Riots or disorders 4% 22%
Selling of votes 4% 12%
Violence against party activists 3% 16%
Cheating in counting 1% 19%
Forcing workers to vote together 1% 10%
People voting more than once 1% 9%
Threats from officials 0% 9%

Understand Voting and Election(Java)
In the recent national elections, did you understand how the voting and election process worked, or not?
88%
10%
2%
0%
10%
20%
30%
40%
50%
60%
70%
80%
90%
Yes No Don't Know

Types of Electoral Participation (Java)
Percent who reported each type of participation
Registered 98%
Voted 97%
Participated in election meeting or street rally 32%
Worked as volunteer 6%
Contributed money to party or candidate 4%

Part 3Exposure and Impact of
Voter Education( Java )

Summary - Impact of Voter Education( Java )
• Most Javanese saw or heard voter education: 86% were exposed to it and the majority (53%) reported they were exposed to one or more sources many times.
• TV was the most widely-used source of voter education, with 48% exposed to it many times. Some 15% more were exposed many times via radio.
• TV’s advantage was even greater in terms of impact: of those who saw at least one source of voter education, 88% said TV was the most important one.

Saw or Heard Voter Education[Java]
Did you see or hear anything about registration, the election, or democracy from voter education groups through … (all sources combined)
53%
33%
15%
0%
10%
20%
30%
40%
50%
60%
Many Times Few Times/Once Never

Exposure to Voter Education Sources(Java)
Did you see or hear anything about registration, the election, or democracy from voter education groups through…? (Percentage who saw/heard source “many times”)
48%
15%
8% 8%6% 5%
1%0%
10%
20%
30%
40%
50%
Television
RadioBanners (spanduk)
Stickers
Pamphlets etc.
Newspapers
Books

Most Important Source ofVoter Education (Java)
Which one of these things we just talked about was the most important source of information for you about how the election and democracy worked?
(Asked of those who saw at least one source of voter education)
88%
6% 2% 2% 1% 1% 0%0%
10%
20%
30%
40%
50%
60%
70%
80%
90%
TV RadioNewspapers
BannersPamphlets etc.
StickersBooks

Part 4Civic Education Issues
( Java )

Summary - Civic Education Issues( Java )
• The proportion of Javanese voters unable to offer a meaning for democracy was 48%, well below January’s 63%.
• Those with a concept of democracy were much more focused on political factors, mentioned by 39% (+12 points since January), and stability, cited by 17% (+10 points). Economic factors were mentioned by 10%, down 4 points since January.
• Support for women’s equality in political leadership is now expressed by 74% of both men and women, a nearly 20-point jump since January.
• Political tolerance for unpopular parties has also increased to 68% from 51%.
• Very few Javanese have contacted government officials (3%), served on local councils (7%) or belonged to political groups (7%). However, 41% have worked with informal community groups to solve problems, one of the highest proportions country-wide.

• Don’t Know / No Response: 48%
• Political Rights: 39%
– “Free speech,” “free expression”: 9%
– “People’s sovereignty,” “government of, by, for people”: 9%
– “Freedom”: 5%
– “Human rights,” “rule of law”: 6%
– “Free elections,” “free political participation”: 2%
– Other: “Leaders who listen to people,” “no corruption,” “Pancasila,” “reform”: 8%
• Peace, Stability, Consensus: 17%
• Economic Gains: 10%
– “Social justice,” “help for the poor”: 5%
– “Prosperity,”, “SEMBAKO availability”: 2%
– “Economic stability,” “jobs”: 2%
– “Educational opportunity”: 1%
Characteristics of a Democratic Country( Java )
If a country is called a democracy, what does that mean to you? Anything else?

Gender and Political Leadership(Java)
Do you think that political leadership positions should be mostly for men or do you think that women should be just as
active as men in political leadership?
21%
74%
21%
74%
27%
58%
35%
56%
0%
10%
20%
30%
40%
50%
60%
70%
80%
90%January
Women Men Women Men
July
Mostly for men Women Equal
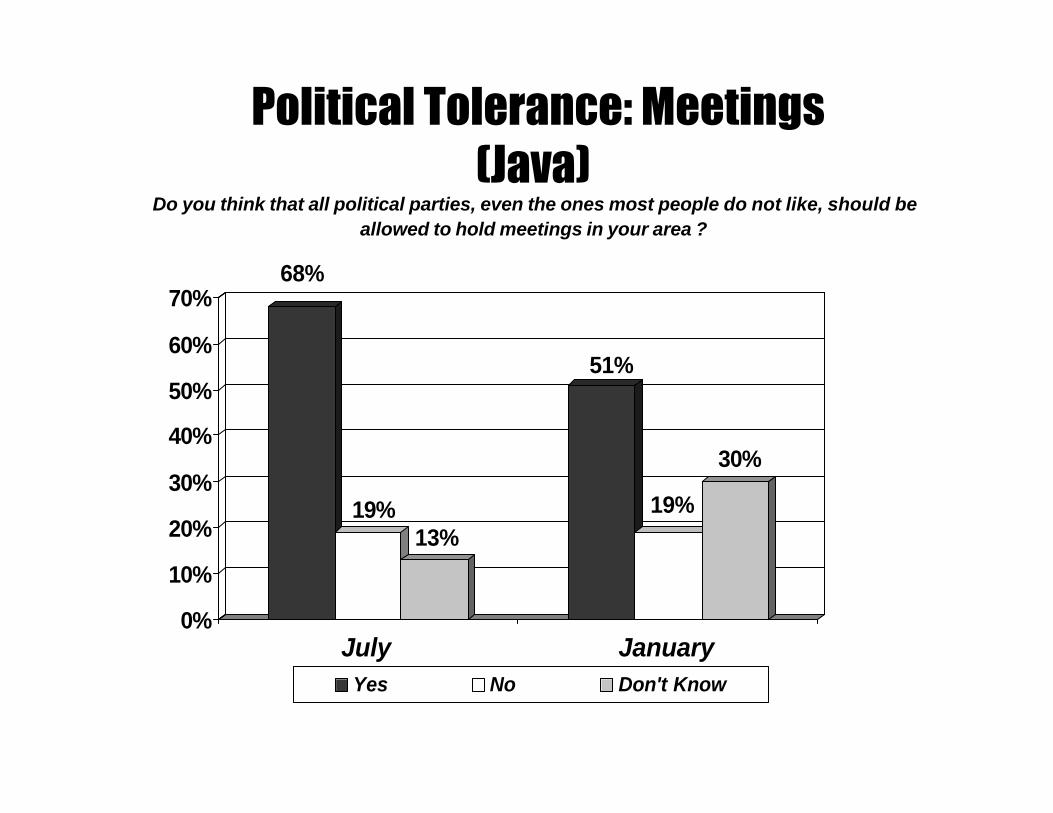
Political Tolerance: Meetings(Java)
Do you think that all political parties, even the ones most people do not like, should be allowed to hold meetings in your area ?
68%
19%13%
51%
19%
30%
0%
10%
20%
30%
40%
50%
60%
70%
July JanuaryYes No Don't Know

Non-Electoral Participation[Java]
In the past five years, have you…?
41%
7% 7%3%
0%
10%
20%
30%
40%
50%
Workedinformally with
others
Been a memberof politicalparty/org
Served on localcouncil
Contacted gov'tofficial

Part 5:Civil Society Issues
( Java )

Summary - Civil Society Issues( Java )
• Few Javanese have had opportunities to exercise civic skills in civil society. The greatest opportunities are offered by organizations (as opposed to religious institutions or at work), but even these remain few.
• Around 16% of Javanese who went to school say they were interested in politics as students, while 25% took courses requiring them to pay attention to current events.
• Scouts were the most popular youth group among former school pupils (57% belonged), followed by school sports clubs (39%).
• Javanese students are “joiners”: only 28% belonged to no type of student or youth groups.

Civic Skills in Civil Society(Java)
Here is a list of things that people sometimes do at work, in their religious institution, or in other organizations. After I read each one, please tell me whether or not you have done that
in the last year.
Skills Exercised In OrganizationIn Mosque /
Church / TempleAt Work
Never / DK / Refused
Wrote a letter on behalf of the organization
8% 7% 4% 88%
Helped make a decision at a meeting 16% 13% 5% 79%
Planned or chaired a meeting 11% 6% 4% 85%
Made a speech or presentation 7% 4% 2% 90%
Held an official post or belonged to a committee
11% 8% 3% 85%

Student Interest in Politics(Java)
Now think back to your school days. How interested were the students in your school about events and politics then – very interested, somewhat interested, not very interested, or not
interested at all?
6%10%
41%
24%
0%
10%
20%
30%
40%
50%
60%
70%
Very/Somewhat: 16% Not very/ Not at all: 13%Very/ Not at all Somewhat/Not very
10%

Current Events Courses(Java)
Thinking still about your school days, did you ever have any courses that required you to pay attention to current events?
25%
63%
12%
0%
10%
20%
30%
40%
50%
60%
70%
Yes No DK/Refused
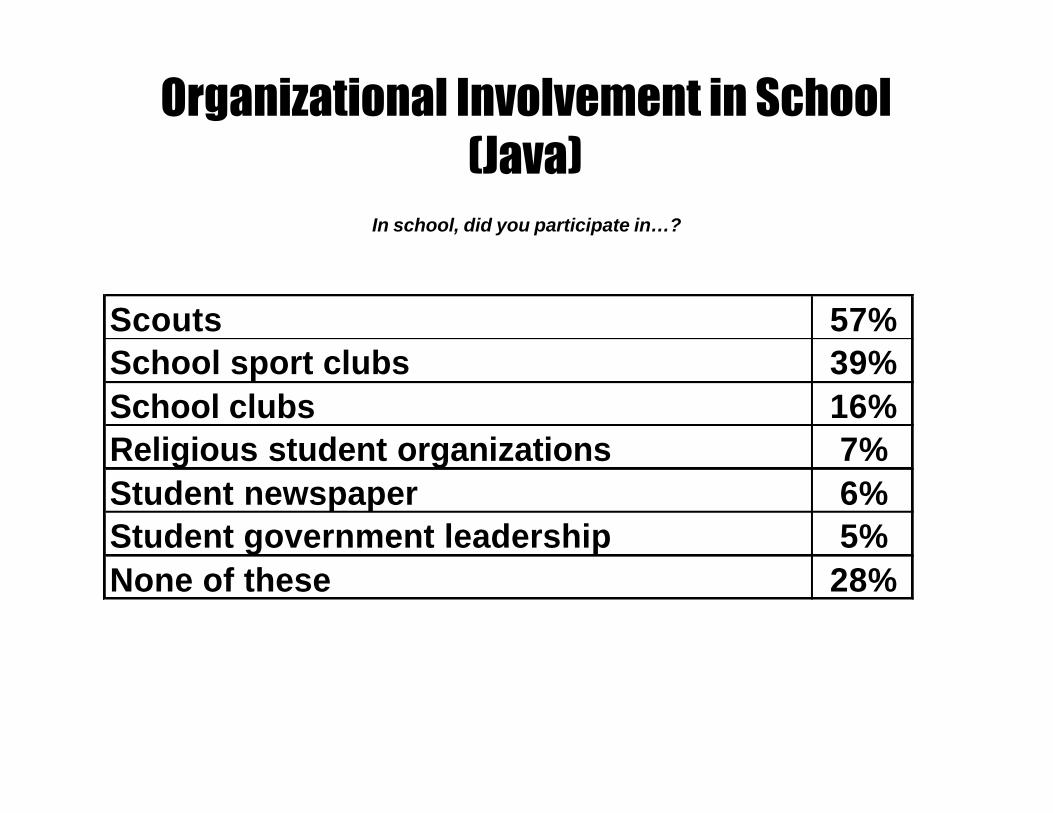
Organizational Involvement in School(Java)
In school, did you participate in…?
Scouts 57%School sport clubs 39%School clubs 16%Religious student organizations 7%Student newspaper 6%Student government leadership 5%None of these 28%

Part 6: Decentralization and Administration
of Justice Issues( Java )

Summary - Decentralization and Administration of Justice Issues
( Java )• The strongest ties among Javanese are religious -- 29% feel a lot in
common with people of the same religion.
• But 26% feel a lot in common with other Indonesians, the highestproportion of any region.
• Java residents support further decentralization to provincial governments by a margin of almost 2 to 1.
• The principal dispute resolution mechanisms they have used are RT or village officials (18%) or religious leaders (10%). Only 1% have used NGOs or lawyers.
• Attitudes to the police are mixed (45% confident, 41% not), but fairly positive to lawyers and positive to the courts and TNI.

Group Identity(Java)
If you heard someone belonged to your… , how much would you feel you had in common with them? A lot, something, a little or not much?
29%26% 26%
22%
0%
10%
20%
30%
Same religion
Same language/ethnic group
Fellow Indonesian
Same region/province

Attitudes Towards Decentralization(Java)
Here are two ideas on how to organize the government. Tell me which one you agree with more:
28%
50%
22%
0%
10%
20%
30%
40%
50%
Situation should continue – Jakarta has almost all power and moneyProvincial governments should receive more powerDon’t know / refused

Use of Dispute Resolution Mechanisms(Java)
Have you ever gone to any of the following people to resolve a conflict or dispute?
An RT or village official 18%
A religious leader 10%
The police 4%
A non-govermental organization 1%
A lawyer or court 1%
Government official 1%
None of these 72%

Confidence in Law Enforcement(Java)
Now I’d like to ask you about people whose job is enforcing the law. Tell me if you are very confident, fairly confident, not very confident,
or not confident at all that they will enforce the law fairly.
Very/Fairly Not very/Not at all Don't Know
ABRI 59% 25% 16%
The Courts 55% 30% 16%
Lawyers 48% 30% 23%
The Police 45% 41% 14%

Section IIISumatra

Part 1:The Regional Mood
( Sumatra )

Summary - The Regional Mood( Sumatra )
• Two-thirds (67%) of Sumatrans now believe that the country is headed in the right direction, unchanged from January’s 66%. Only 12% think that the country is headed in the wrong direction.
• Aceh, with roughly 9% of the region’s population, was excluded from our sample due to violence. This should be kept in mind in reviewing all our Sumatra results.
• The economy continues to be first among Sumatrans’ concerns, cited by 69% –more than any other region in the poll. At the same time, the level of concern about political rights has increased since January, from 26% to 37%, while concern about violence has decreased, from 31% to 20%.
• A solid majority of 82% say that people in their area feel free to express their political opinions – up significantly from 56% in January and only 28% before May 1998.
• The proportion who think government cares what they think showed a slight downturn, from 74% in January to 67% in the most recent poll, while the proportion who feel government ignores them grew from 18% to 27%. Sumatra is the only region in which this was the case.
• Confidence in the country’s future is stronger with 84% expecting a happy future for Indonesia – up from 78% in January.

Direction of the Country( Sumatra )
Generally speaking, do you think things in Indonesia today are going in the right direction, or do you think they are going in the wrong direction ?
67%
12%
21%
66%
16%17%
0%
10%
20%
30%
40%
50%
60%
70%
July JanuaryRight Wrong Don't Know

Indonesia’s Biggest Problems( Sumatra )
In your view, what is the biggest problem facing Indonesia ? And after that, what is the second biggest problem ?
69%
37%
20%
4%
0%
10%
20%
30%
40%
50%
60%
70%
Economy Politics Violence Social

Pride in Indonesia(Sumatra)
Generally speaking, what are the things about this country
you are most proud of as an Indonesian?
29%25%
19%
17%
12%
5%
2%
5%
25%
0%
5%
10%
15%
20%
25%
30%
People
Geography
Economy
Culture
Religion
History
Politics
OtherNothing/DK

Freedom of Political Expression ( Sumatra )
Do people feel free to express their political opinions in the area where you live ?Did they feel free to express their opinions before the events of last May ?
82%
11%
56%
27% 28%
52%
0%
10%
20%
30%
40%
50%
60%
70%
80%
90%
Now January '99 Before May '98
Yes No

Political Alienation (Sumatra)
Some people say, “I don’t think the government cares very much about what people like me think.” Do you agree or disagree? Strongly, or somewhat?
7%
20%18%
49%
5%
13%27%
47%
0%
10%
20%
30%
40%
50%
60%
70%
80%
Agree: 27% Disagree: 67% Agree: 18% Disagree: 74%
JanuaryJuly
Strongly Somewhat

Confidence in the Future(Sumatra)
How confident are you of a happy future for Indonesia as a whole?
60%
1%
57%
12%0%
20%
40%
60%
80%
100%
Very/Fairly: 84%
Not very/ Not at all: 13%
Very/Fairly: 78%
Not very/ Not at all: 13%
JanuaryJuly
Very/ Not at all Fairly/ Not very
24%12%
21%
1%

Part 2:Attitudes to the Election
( Sumatra )
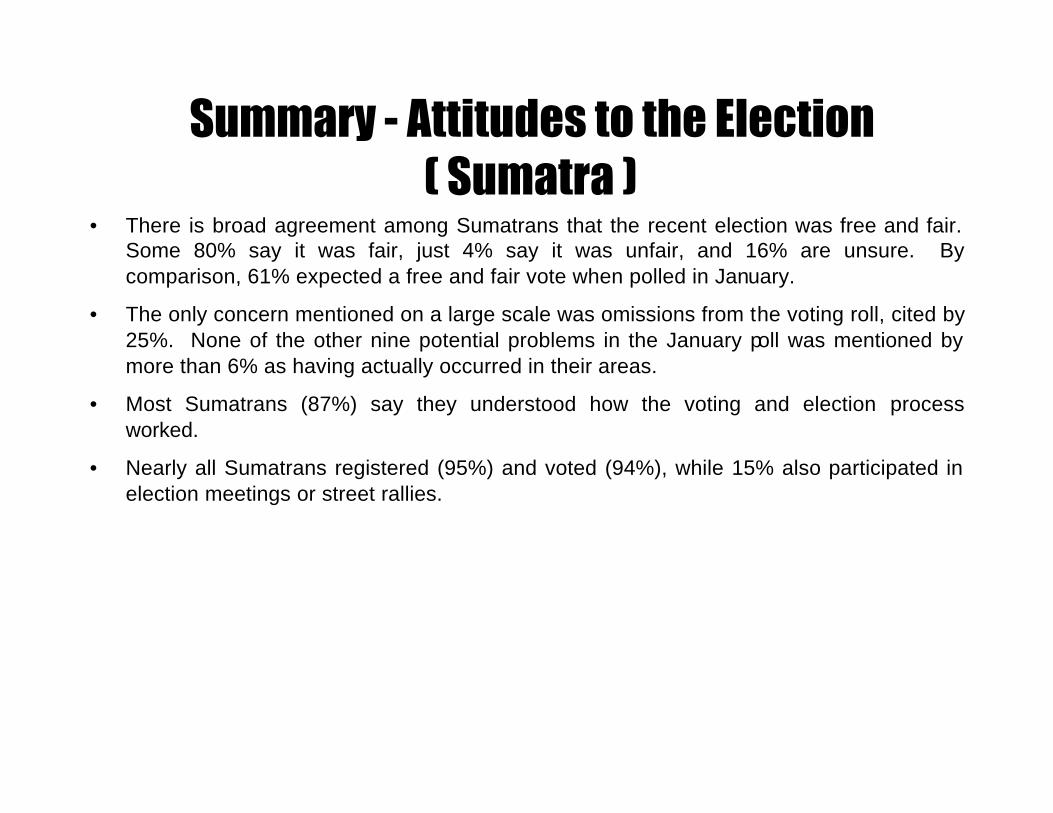
Summary - Attitudes to the Election( Sumatra )
• There is broad agreement among Sumatrans that the recent election was free and fair. Some 80% say it was fair, just 4% say it was unfair, and 16% are unsure. By comparison, 61% expected a free and fair vote when polled in January.
• The only concern mentioned on a large scale was omissions from the voting roll, cited by 25%. None of the other nine potential problems in the January poll was mentioned by more than 6% as having actually occurred in their areas.
• Most Sumatrans (87%) say they understood how the voting and election process worked.
• Nearly all Sumatrans registered (95%) and voted (94%), while 15% also participated in election meetings or street rallies.

Free and Fair Elections?(Sumatra)
Some people think the 1999 election was [January: will be] free and fair, some think it was not [January: will not be], and some are not sure.
How about you? Which of these opinions do you agree with?
80%
4%
16%
61%
5%
34%
0%
10%
20%
30%
40%
50%
60%
70%
80%
July JanuaryFree and Fair Not Free and Fair Not Sure

Elections: Free and Fair? 1999 vs. 1997
( Sumatra)
80%
4%
16%
46%
37%
17%
0%
10%
20%
30%
40%
50%
60%
70%
80%
1999 1997Yes, free and fair No, not free and fair Don't Know
Some people think the 1999 elections were Did you think that the 1997Free and fair, some think they were not, and elections were free and fair?some are not sure. How about you?
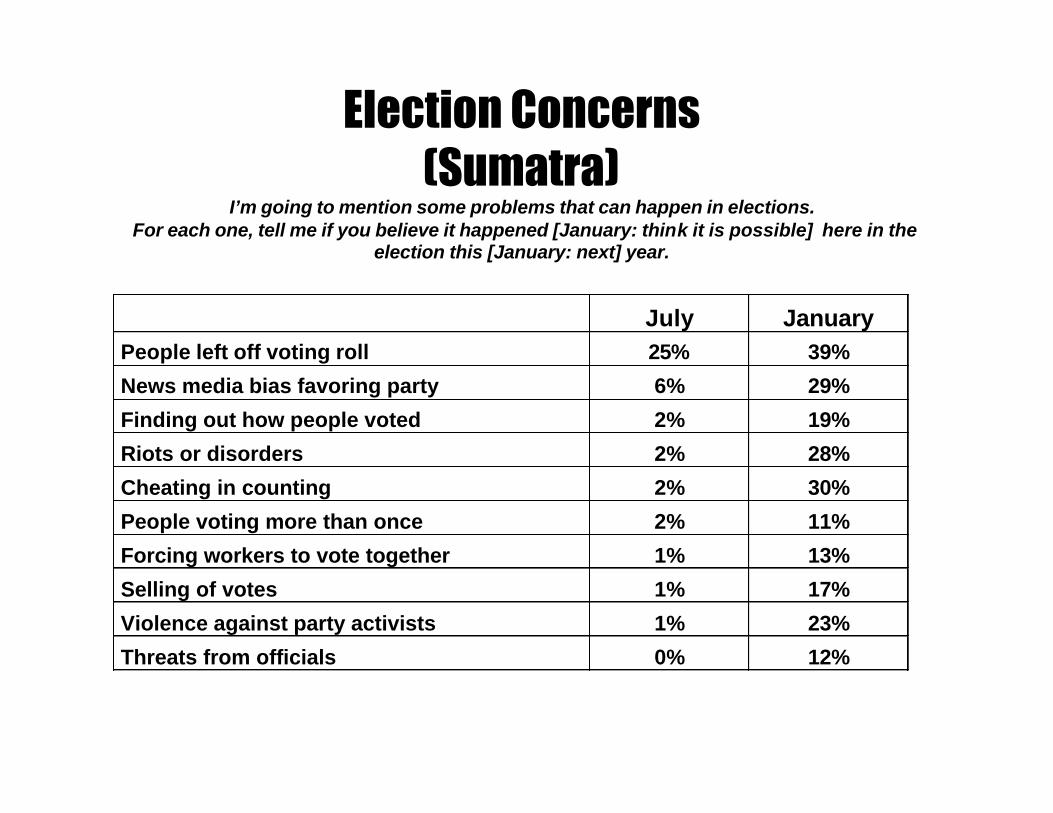
Election Concerns(Sumatra)
I’m going to mention some problems that can happen in elections.For each one, tell me if you believe it happened [January: think it is possible] here in the
election this [January: next] year.
July JanuaryPeople left off voting roll 25% 39%
News media bias favoring party 6% 29%
Finding out how people voted 2% 19%
Riots or disorders 2% 28%
Cheating in counting 2% 30%
People voting more than once 2% 11%
Forcing workers to vote together 1% 13%
Selling of votes 1% 17%
Violence against party activists 1% 23%
Threats from officials 0% 12%

Understand Voting and Election(Sumatra)
In the recent national elections, did you understand how the voting and election process worked, or not?
87%
11%
1%0%
10%
20%
30%
40%
50%
60%
70%
80%
90%
Yes No Don't Know

Types of Electoral Participation (Sumatra)
Percent who reported each type of participation
Registered 95%
Voted 94%
Participated in election meeting or street rally 15%
Worked as volunteer 6%
Contributed money to party or candidate 6%
Part 3Exposure and Impact of
Voter Education( Sumatra )

Summary - Exposure and Impact of Voter Education
( Sumatra )• Most Sumatrans saw or heard voter education: 84% were exposed to it and nearly half
(48%) reported that they were exposed to one or more sources many times.
• TV was the most widely used source of voter education, with 40% exposed to it many times. Some 14% were exposed many times to radio.
• TV was the medium with the greatest impact: 79% of Sumatrans identified TV as their most important source of voter education.

Saw or Heard Voter Education[Sumatra]
Did you see or hear anything about registration, the election, or democracy from voter education groups through … (all sources combined)
48%
36%
16%
0%
10%
20%
30%
40%
50%
Many Times Few Times/Once Never

Exposure to Voter Education Sources(Sumatra)
Did you see or hear anything about registration, the election, or democracy from voter education groups through…? (Percentage who saw/heard source “many times”)
40%
14%
9% 9%
5% 5%1% 1%
0%
10%
20%
30%
40%
Television
RadioStickers
Banners (spanduk)
Pamphlets etc.
Newspapers
BooksComics

Most Important Source ofVoter Education ( Sumatra )
Which one of these things we just talked about was the most important source of information for you about how the election and democracy worked?
(Asked of those who saw at least one source of voter education)
79%
8%
7% 2% 2% 1% 1%0%
10%
20%
30%
40%
50%
60%
70%
80%
TV RadioStickers
BannersPamphlets etc.
Newspapers
Books

Part 4Civic Education Issues
( Sumatra )

Summary - Civic Education Issues( Sumatra )
• When asked to define democracy, only 50% of Sumatran voters were unable to offer a meaning for democracy, down from 70% in January.
• Those who offered a definition were more focused on political rights, mentioned by 36%, up 6 points since January; and stability, cited by 17% (+10 points), while economic factors were mentioned by 10%, down 4 points since January.
• Support for women’s equality in political leadership is now expressed by 72% of women and 67% of men, up from 68% and 64%, respectively, in January.
• Political tolerance for unpopular parties has increased substantially since the last poll, to 79% from 50%.
• Nearly one in four Sumatrans (24%) have worked informally with others to deal with a community issue or problem in the past five years. During the same time frame, only a small proportion joined a party (7%), served on a local council (4%) or contacted a government official about a problem or issue (1%).
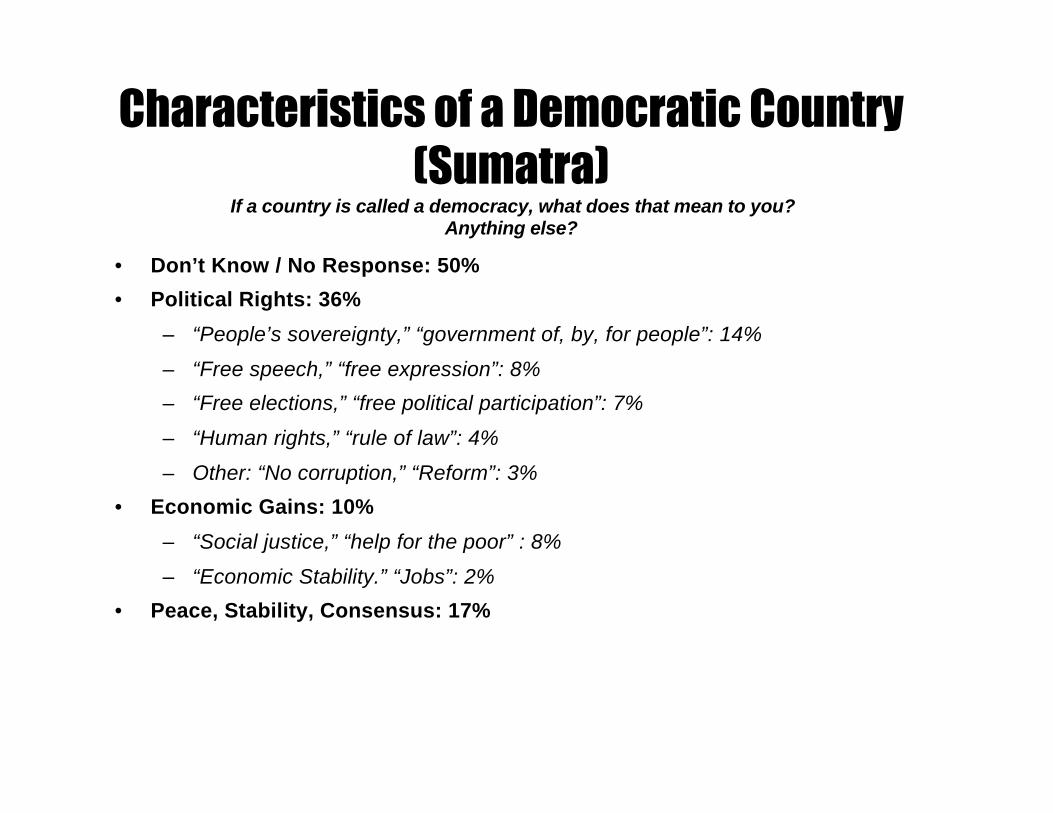
• Don’t Know / No Response: 50%
• Political Rights: 36%
– “People’s sovereignty,” “government of, by, for people”: 14%
– “Free speech,” “free expression”: 8%
– “Free elections,” “free political participation”: 7%
– “Human rights,” “rule of law”: 4%
– Other: “No corruption,” “Reform”: 3%
• Economic Gains: 10%
– “Social justice,” “help for the poor” : 8%
– “Economic Stability.” “Jobs”: 2%
• Peace, Stability, Consensus: 17%
Characteristics of a Democratic Country(Sumatra)
If a country is called a democracy, what does that mean to you? Anything else?
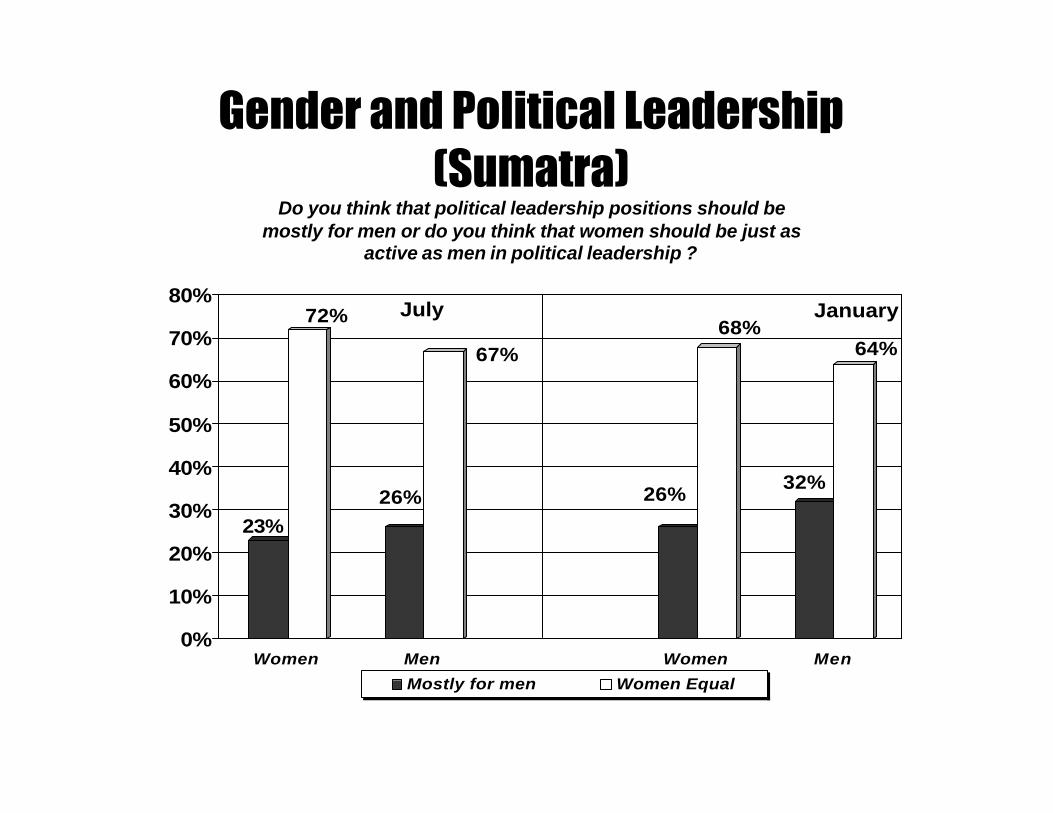
Gender and Political Leadership(Sumatra)
Do you think that political leadership positions should be mostly for men or do you think that women should be just as
active as men in political leadership ?
23%
72%
26%
67%
26%
68%
32%
64%
0%
10%
20%
30%
40%
50%
60%
70%
80%January
Women Men Women Men
July
Mostly for men Women Equal

Political Tolerance: Meetings(Sumatra)
Do you think that all political parties, even the ones most people do not like, should be allowed to hold meetings in your area ?
79%
10% 11%
50%
31%
19%
0%
10%
20%
30%
40%
50%
60%
70%
80%
July '99 January '99Yes No Don't Know

Non-Electoral Participation( Sumatra )
In the past five years, have you…?
24%
7%4%
1%0%
10%
20%
30%
Workedinformally with
others
Been a memberof politicalparty/org
Served on localcouncil
Contacted gov'tofficial

Part 5:Civil Society Issues
( Sumatra )

Summary - Civil Society Issues( Sumatra )
• Relatively few Sumatrans have exercised civic skills in civil society, with the greatest opportunities coming from organizations and religious institutions. Some 19% have helped make a decision in an organization, and 12% have done so in the mosque, church or temple to which they belong.
• Only one in five (19%) Sumatrans who attended school say they were interested in politics as students, while 21% took courses requiring them to follow current events.
• While in school, Sumatrans were most likely to belong to school sports clubs (42%) or the Scouts (29%).
• A sizeable proportion – 43% – reported that they belonged to no organizations at all while in school.
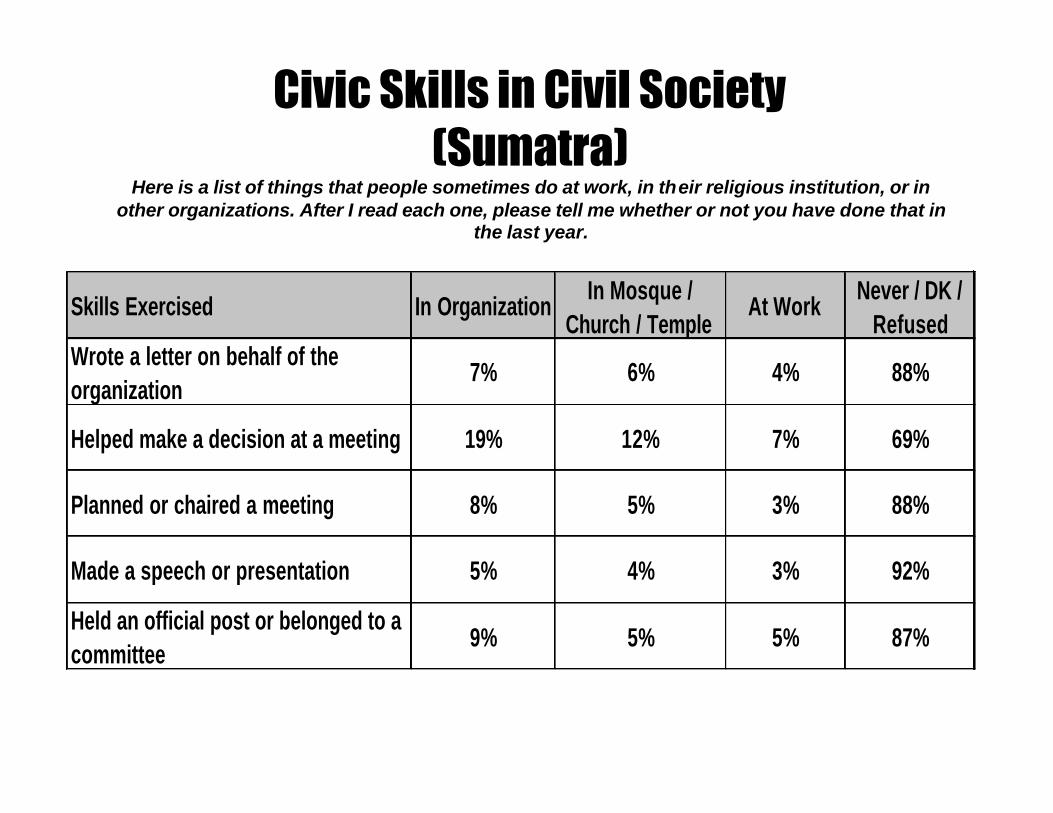
Civic Skills in Civil Society(Sumatra)
Here is a list of things that people sometimes do at work, in their religious institution, or in other organizations. After I read each one, please tell me whether or not you have done that in
the last year.
Skills Exercised In OrganizationIn Mosque /
Church / TempleAt Work
Never / DK / Refused
Wrote a letter on behalf of the organization
7% 6% 4% 88%
Helped make a decision at a meeting 19% 12% 7% 69%
Planned or chaired a meeting 8% 5% 3% 88%
Made a speech or presentation 5% 4% 3% 92%
Held an official post or belonged to a committee
9% 5% 5% 87%

Student Interest in Politics( Sumatra )
Now think back to your school days. How interested were the students in your school about events and politics then – very interested, somewhat interested, not very interested, or not
interested at all?
14%
30%
0%
10%
20%
30%
40%
50%
60%
70%
Very/Somewhat: 19% Not very/ Not at all: 71%Very/ Not at all Somewhat/Not very
14%
5%
32%

Current Events Courses( Sumatra )
Thinking still about your school days, did you ever have any courses that required you to pay attention to current events?
21%
71%
8%
0%
10%
20%
30%
40%
50%
60%
70%
Yes No DK/Refused

Organizational Involvement in School(Sumatra)
In school, did you participate in…?
School sport clubs 42%Scouts 29%School clubs 10%Religious student organizations 7%Student government leadership 2%Student newspaper 0%None of these 43%

Part 6: Decentralization and Administration
of Justice Issues( Sumatra )
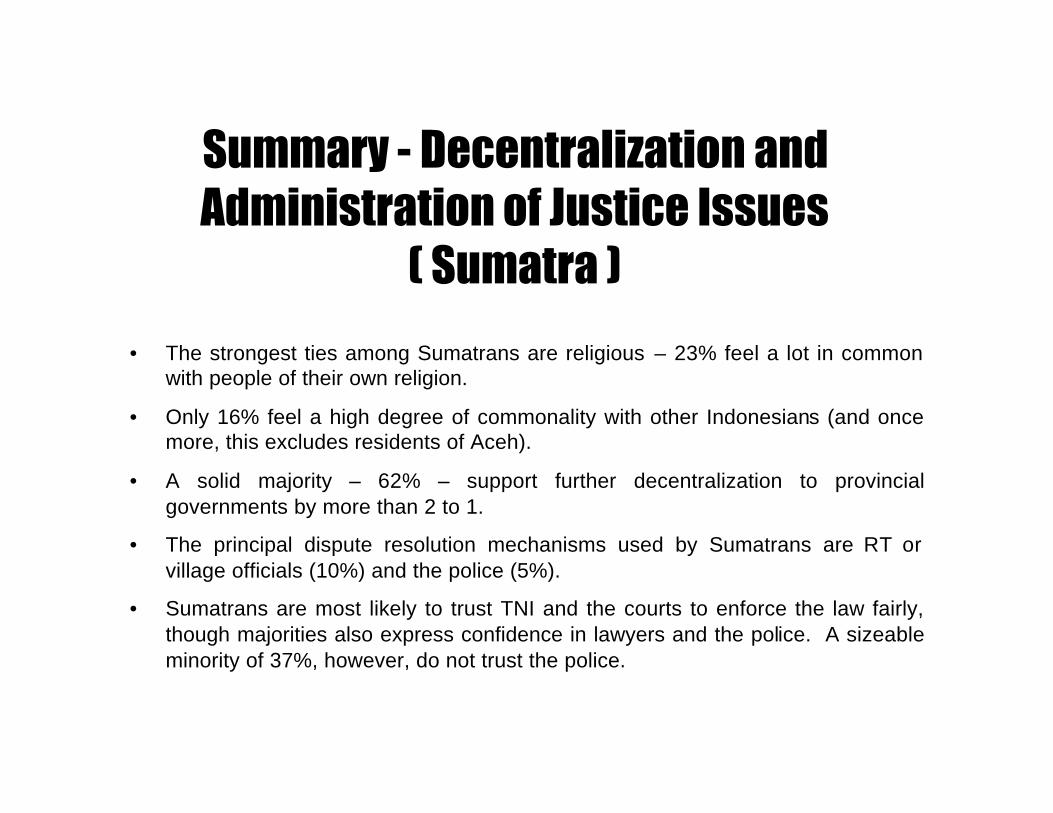
Summary - Decentralization and Administration of Justice Issues
( Sumatra )
• The strongest ties among Sumatrans are religious – 23% feel a lot in common with people of their own religion.
• Only 16% feel a high degree of commonality with other Indonesians (and once more, this excludes residents of Aceh).
• A solid majority – 62% – support further decentralization to provincial governments by more than 2 to 1.
• The principal dispute resolution mechanisms used by Sumatrans are RT or village officials (10%) and the police (5%).
• Sumatrans are most likely to trust TNI and the courts to enforce the law fairly, though majorities also express confidence in lawyers and the police. A sizeable minority of 37%, however, do not trust the police.

Group Identity(Sumatra)
If you heard someone belonged to your… , how much would you feel you had in common with them? A lot, something, a little or not much?
23%
16%14% 13%
0%
10%
20%
30%
Same religion
Fellow Indonesian
Same language/ethnic group
Same region/province

Attitudes Towards Decentralization(Sumatra)
Here are two ideas on how to organize the government. Tell me which one you agree with more:
23%
62%
15%0%
10%
20%
30%
40%
50%
60%
70%
Situation should continue – Jakarta has almost all power and moneyProvincial governments should receive more powerDon’t know / refused

Use of Dispute Resolution Mechanisms(Sumatra)
Have you ever gone to any of the following people to resolve a conflict or dispute?
An RT or village official 10%
The police 5%
A religious leader 3%
Government official 3%
A non-govermental organization 2%
A lawyer or court 0%
None of these 76%

Confidence in Law Enforcement( Sumatra)
Now I’d like to ask you about people whose job is enforcing the law. Tell me if you are very confident, fairly confident, not very confident, or not confident at all
that they will enforce the law fairly.
Very/Fairly Not very/Not at all Don't Know
ABRI 62% 25% 13%
The Courts 59% 27% 14%
Lawyers 57% 24% 18%
The Police 56% 37% 7%

Section IVIrian Jaya
Part 1:The Regional Mood
( Irian Jaya )

Summary - The Regional Mood( Irian Jaya )
• There mood of the majority in Irian Jaya is not positive, with 41% of residents saying that they are unsure if the country is moving in the right direction and 14% more believing it is headed in the wrong direction. However, 45% believe that it is on the right road – up from 36% in January.
• Irian Jaya’s voters were less concerned about the economy than in January: less than half, 48%, mentioned it in the most recent poll, compared to 68% in January. Concern about political rights remained unchanged, from 29% to 27%; while concern about violence dipped from 26% to only 11% of all mentions.
• Irian Jaya residents are split about freedom of political expression: 41% feel free; 41% do not. The proportion who feel they can speak out is up 14 points since January, but it remains the only region in the survey where the majority still do not feel free to express themselves.
• The proportion of those who believe government cares what they think has increased 7 points, to 54% from 47% in January.
• Despite its problems, there also has been a large gain in the Irian Jaya electorate’s confidence in the country’s future. Two-thirds expect a happy future for Indonesia, compared to only 39% who felt this way in the last poll.

Direction of the Country( Irian Jaya )
Generally speaking, do you think things in Indonesia today are going in the right direction, or do you think they are going in the wrong direction ?
45%
14%
41%36%
21%
43%
0%
10%
20%
30%
40%
50%
July JanuaryRight Wrong Don't Know

Indonesia’s Biggest Problems( Irian Jaya )
In your view, what is the biggest problem facing Indonesia ? And after that, what is the second biggest problem ? (Responses combined, all those cited by 5% or more)
48%
27%
11%
1%
0%
5%10%
15%20%25%
30%35%
40%45%
50%
Economy Politics Violence Social

Pride in Indonesia(Irian Jaya)
Generally speaking, what are the things about this country
you are most proud of as an Indonesian?
14%9% 6%
5% 4% 3% 2% 5%
59%
0%5%
10%15%20%25%30%35%40%45%50%55%60%
Economy
Religion
Culture
People
History
Geographics
Politics
OtherNothing/DK

Freedom of Political Expression ( Irian Jaya )
Do people feel free to express their political opinions in the area where you live ? Did they feel free to express their opinions before the events of last May ?
41% 41%
27%
37%
13%
50%
0%5%
10%15%20%25%30%35%40%45%50%
Now January '99 Before May '98
Yes No

Political Alienation (Irian Jaya)
Some people say, “I don’t think the government cares very much about what people like me think.” Do you agree or disagree? Strongly, or somewhat?
21%
3%36%
18%
18%
7%
22%
25%
0%
10%
20%
30%
40%
50%
60%
Agree: 24% Disagree: 54% Agree: 25% Disagree: 47%
JanuaryJuly
Strongly Somewhat

Confidence in the Future(Irian Jaya)
How confident are you of a happy future for Indonesia as a whole?
46%
19%
25%
20%
0%
20%
40%
60%
Very/Fairly: 66% Not very/ Not at all:22%
Very/Fairly: 39% Not very/ Not at all:27%
JanuaryJuly
Very/ Not at all Fairly/ Not very
20%
3%
14%
10%

Part 2:Attitudes to the Election
(Irian Jaya)

Summary - Attitudes to the Election( Irian Jaya )
• While less than half of Irian Jaya residents expected the election to be free and fair, 62% are convinced that it was; but this is the lowest proportion in any region. Some 9% say it was not; and a sizeable proportion, 29%, is unsure.
• There seem to have been serious problems with the voting roll in Irian Jaya. Half of the voters say that people were left off the voting roll in their area – at least twice the proportion of people who reported this problem in other regions. This may reflect the lowest rate of registration reported in any region (75%).
• Small proportions cited an array of other problems, including news media bias (8%), finding out how people voted (8%), and violence (5%).
• Understanding of the election was much below other regions: less than half (48%) reported that they understood the voting process, while one in three (34%) said they did not understand it and 18% were not sure.
• In an anomaly, a few respondents said they voted without registering: 75% reported registering, while 79% claimed voting -- but both were the lowest proportions of any region in the study. Some 27% indicated that they attended an election meeting or rally.

Free and Fair Elections?(Irian Jaya)
Some people think the 1999 election was [January: will be] free and fair, some think it was not [January: will not be], and some are not sure.
How about you? Which of these opinions do you agree with?
62%
9%
29%
48%
2%
50%
0%
10%
20%
30%
40%
50%
60%
70%
July January
Free and Fair Not Free and Fair Not Sure

Elections Free and Fair? 1999 vs. 1997( Irian Jaya)
62%
9%
29%
59%
20% 21%
0%
10%
20%
30%
40%
50%
60%
70%
July '99 Jan '99Yes, free and fair No, not free and fair Don't Know
Some people think the 1999 elections were Did you think that the 1997Free and fair, some think they were not, and elections were free and fair?some are not sure. How about you?

Election Concerns(Irian Jaya)
I’m going to mention some problems that can happen in elections.For each one, tell me if you believe it happened [January: think it is possible] here in the election
this [January: next] year.
July JanuaryPeople left off voting roll 50% 34%
News media bias favoring party 8% 25%
Finding out how people voted 8% 19%
Violence against party activists 5% 24%
Forcing workers to vote together 4% 17%
Threats from officials 3% 17%
Riots or Disorders 2% 27%
Cheating in counting 1% 23%
People voting more than once 1% 14%
Selling of votes 1% 20%

Understand Voting and Election(Irian Jaya)
In the recent national elections, did you understand how the voting and election process worked, or not?
48%
34%
18%
0%
10%
20%
30%
40%
50%
Yes No Don't Know

Types of Electoral Participation (Irian Jaya)
Percent who reported each type of participation
Registered 75%
Voted 79%
Participated in election meeting or street rally 27%
Worked as volunteer 7%
Contributed money to party or candidate 4%

Part 3Exposure and Impact of
Voter Education( Irian Jaya )

Summary - Exposure and Impact of Voter Education
( Irian Jaya )• Exposure to voter education was lower in Irian Jaya than in any other region, though a
slight majority (52%) reported seeing or hearing it. Only 25% said they were exposed many times, while 47% reported no exposure at all.
• As in other regions, TV was the most widely used source of voter education, but only 16% (compared to the national average of 44%) saw it many times, only slightly more than the 14% who heard voter education on radio many times. Other sources seen or heard many times include and stickers (10%).
• TV was identified by 57% of those who saw at least one source of voter education as the most important source of voter education (lower than any other region), while radio was cited by another 35% (higher than any other region).

Saw or Heard Voter Education(Irian Jaya)
Did you see or hear anything about registration, the election, or democracy from voter education groups through … (all sources combined)
25% 27%
47%
0%
10%
20%
30%
40%
50%
Many Times Few Times/Once Never

Exposure to Voter Education Sources(Irian Jaya)
Did you see or hear anything about registration, the election, or democracy from voter education groups through…? (Percentage who saw/heard source “many times”)
16%14%
10%
6% 6% 6%
1%
0%
10%
20%
TelevisionRadio Stickers
Banners (spanduk)
Pamphlets etc.
NewspapersBooks

Most Important Source ofVoter Education (Irian Jaya)
Which one of these things we just talked about was the most important source of information for you about how the election and democracy worked?
(Asked of those who saw at least one source of voter education)
57%
35%
3% 1% 0% 0% 0%0%
10%
20%
30%
40%
50%
60%
TV RadioNewspapers
StickersBanners
Pamphlets etc.
Books

Part 4Civic Education Issues
( Irian Jaya )

Summary - Civic Education Issues( Irian Jaya )
• No growth was found in the proportion of Irian Jaya’s voters who could offer a meaning for democracy. In fact, the number who could not increased to 74% from 61% in the last poll.
• Of those who could offer a definition, 10% cited political rights (compared to 29% in January), 12% named economic gains (+4 points) and 6% mentioned stability (7% in January). Free speech was referenced by 7%, down from 13% in January.
• Irian Jaya was also the only region which showed no growth in support for women’s equality in political leadership. It is now expressed by 65% of women and 70% of men, down slightly from 75% and 74%, respectively, in January.
• Likewise, political tolerance did not increase in the region, another difference from the other regions. The proportion who would tolerate unpopular parties dropped a little to 18% from 25%, while the percent who would not has grown to 56% from 45%.
• A sizeable number of Irian Jaya voters (41%) have worked informally with others to deal with a community issue or problem in the past five years. During the same time frame, 11% contacted a government official -- the highest of any region – 9% served on a local council -- also comparatively high – and 8% joined a political party or organization.

• Don’t Know / No Response: 74%
• Political Rights: 10%
– “Free speech,” “free expression” : 7%
– “People’s sovereignty,” “government of, by, for people”: 1%
– “Human rights,” “rule of law”: 1%
– “Free elections,” “free political participation”: 1%
• Peace, Stability, Consensus: 6%
• Economic Gains: 12%
– “Social justice,” “help for the poor”: 1%
– “Prosperity,”, “SEMBAKO availability”: 11%
Characteristics of a Democratic Country
( Irian Jaya )If a country is called a democracy, what does that mean to you? Anything else?

Gender and Political Leadership(Irian Jaya)
Do you think that political leadership positions should be mostly for men or do you think that women should be just as
active as men in political leadership ?
16%
65%
19%
70%
17%
75%
14%
74%
0%
10%
20%
30%
40%
50%
60%
70%
80%
Women Men Women Men
July
Mostly for men Women Equal
January

Political Tolerance: Meetings(Irian Jaya)
Do you think that all political parties, even the ones most people do not like, should be allowed to hold meetings in your area ?
18%
56%
27%25%
45%
30%
0%
10%
20%
30%
40%
50%
60%
July JanuaryYes No Don't Know

Non-Electoral Participation ( Irian Jaya )
In the past five years, have you…?
41%
11% 9% 8%
0%
10%
20%
30%
40%
50%
Workedinformally with
others
Contacted gov'tofficial
Served on localcouncil
Been a memberof politicalparty/org

Part 5:Civil Society Issues
( Irian Jaya )

Summary - Civil Society Issues( Irian Jaya )
• Compared to Indonesians in most other regions, Irian Jaya residents are heavily involved in public activities in organizations and religious institutions. Some 23% have helped make a decision at an organization’s meeting (14% in a mosque/church/temple); 15% have held office in a non-religious organization (12% in a mosque/church/temple); and 13% have planned or chaired a meeting (13% in a mosque/church/temple).
• At the same time, Irian Jaya residents are less likely than other Indonesians to say they were interested in politics as students (17%). More than one in four (27%) took courses requiring them to pay attention to current events.
• While in school, 58% belonged to a school sports club, 31% were Scouts, and 19% belonged to other school clubs.
• Irian Jaya residents are moderate joiners: one in three (33%) belonged to no type of student or youth group while in school.

Civic Skills in Civil Society(Irian Jaya)
Here is a list of things that people sometimes do at work, in their religious institution, or in other organizations. After I read each one, please tell me whether or not you have done that in
the last year.
Skills Exercised In OrganizationIn Mosque /
Church / TempleAt Work
Never / DK / Refused
Wrote a letter on behalf of the organization
8% 7% 3% 85%
Helped make a decision at a meeting 23% 14% 3% 69%
Planned or chaired a meeting 13% 13% 4% 77%
Made a speech or presentation 7% 8% 2% 88%
Held an official post or belonged to a committee
15% 12% 4% 76%

Student Interest in Politics(Irian Jaya)
Now think back to your school days. How interested were the students in your school about events and politics then –
very interested, somewhat interested, not very interested, or not interested at all?
12%
18%
0%
10%
20%
30%
40%
50%
Very/Somewhat: 17% Not very/ Not at all: 50%Very/ Not at all Somewhat/Not very
12%
5%
32%
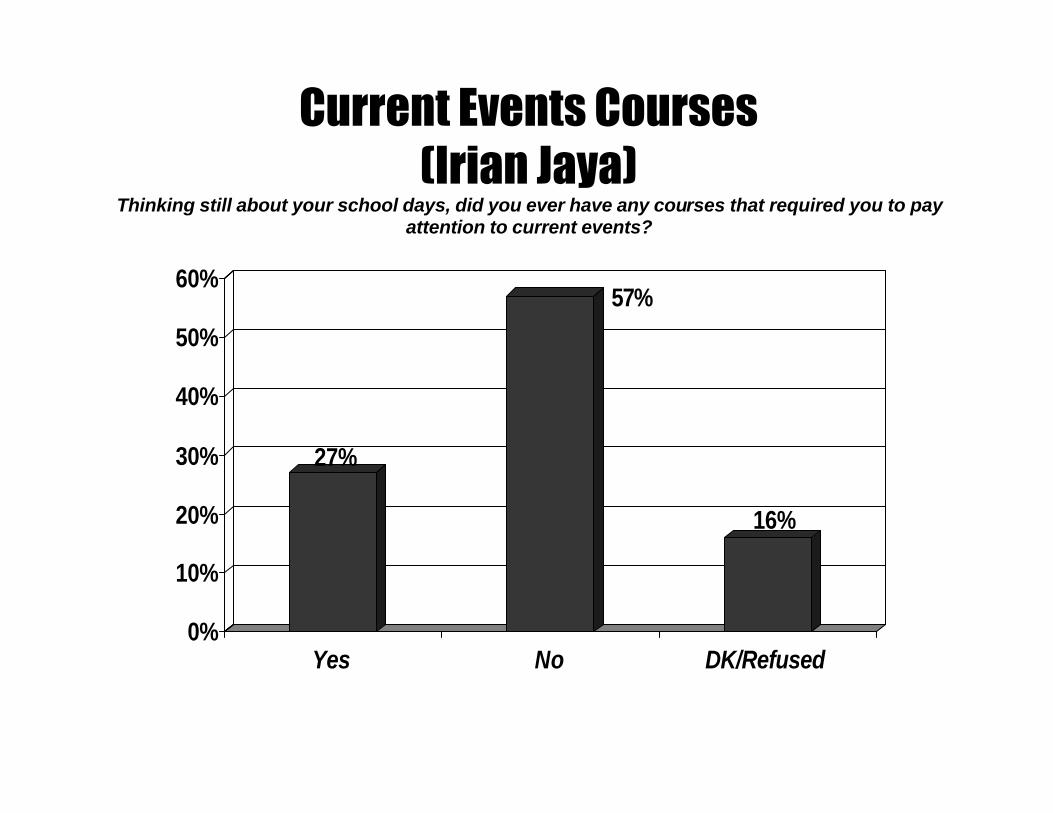
Current Events Courses(Irian Jaya)
Thinking still about your school days, did you ever have any courses that required you to pay attention to current events?
27%
57%
16%
0%
10%
20%
30%
40%
50%
60%
Yes No DK/Refused

Organizational Involvement in School(Irian Jaya)
In school, did you participate in…?
School sport clubs 58%Scouts 31%School clubs 19%Student government leadership 7%Religious student organizations 6%Student newspaper 4%None of these 33%

Part 6: Decentralization and Administration
of Justice Issues( Irian Jaya )

Summary - Decentralization and Administration of Justice Issues
( Irian Jaya )• The strongest ties among Irian Jaya residents are religious or regional: 22% feel a lot in
common with people of the same religion, while 20% feel this way about other Irian Jaya residents.
• Only 14% feel a lot in common with fellow Indonesians.
• While 47% support further decentralization to provincial governments, some 40% are unsure, though only 12% are opposed outright.
• The principal dispute resolution mechanisms they have used include RT or village officials (26%), the police (17%), government officials (14%) and religious leaders (12%). Only 4% have turned to an NGO.
• Irian Jaya residents are most likely to trust the courts and lawyers.
• Confidence in the police or TNI is the lowest of all the regions, and pluralities do not trust them to enforce the laws fairly.

Group Identity(Irian Jaya)
If you heard someone belonged to your… , how much would you feel you had in common with them? A lot, something, a little or not much?
22%20%
16%14%
0%
10%
20%
30%
Same religion
Same region/province
Same language/ethnic group
Fellow Indonesian

Attitudes Towards Decentralization(Irian Jaya)
Here are two ideas on how to organize the government. Tell me which one you agree with more:
12%
47%40%
0%
10%
20%
30%
40%
50%
Situation should continue – Jakarta has almost all power and moneyProvincial governments should receive more powerDon’t know / refused

Use of Dispute Resolution Mechanisms(Irian Jaya)
Have you ever gone to any of the following people to resolve a conflict or dispute?
An RT or village official 26%
The police 17%
Government official 14%
A religious leader 12%
A non-govermental organization 4%
A lawyer or court 1%
None of these 67%

Confidence in Law Enforcement(Irian Jaya)
Now I’d like to ask you about people whose job is enforcing the law. Tell me if you are very confident, fairly confident, not very confident,
or not confident at all that they will enforce the law fairly.
Very/Fairly Not very/Not at all Don't Know
The Courts 49% 24% 28%
Lawyers 49% 18% 33%
ABRI 36% 37% 27%
The Police 33% 43% 24%

Section VKalimantan

Part 1:The Regional Mood
( Kalimantan )

Summary - The Regional Mood( Kalimantan )
• The mood in Kalimantan in July is quite upbeat. Some 87% think that the country is headed in the right direction – the highest proportion of any region and substantially higher than the 49% who felt this way in January.
• While the economy is still the top concern in Kalimantan, cited by 61%, political rights have replaced violence as the second most-cited concern, cited by 44%. Violence continues to be a concern, however, cited by 34% – an 11-point increase since January.
• More than three-fourths (77%) of Kalimantan residents feel free to express theiropinions, against 44% in January and only 23% before Suharto’s fall.
• A similar proportion (78%) think government cares what they think, up from 60% in January.
• Confidence in Kalimantan is higher than in any other region, with 93% expecting a happy future for Indonesia.

Direction of the Country( Kalimantan )
Generally speaking, do you think things in Indonesia today are going in the right direction, or do you think they are going in the wrong direction ?
87%
6% 6%
49%
17%
34%
0%10%20%
30%40%
50%60%70%
80%90%
July JanuaryRight Wrong Don't Know

Indonesia’s Biggest Problems( Kalimantan )
In your view, what is the biggest problem facing Indonesia ? And after that, what is the second biggest problem ?
61%
44%
34%
15%
0%
10%
20%
30%
40%
50%
60%
70%
Economy Politics Violence Social
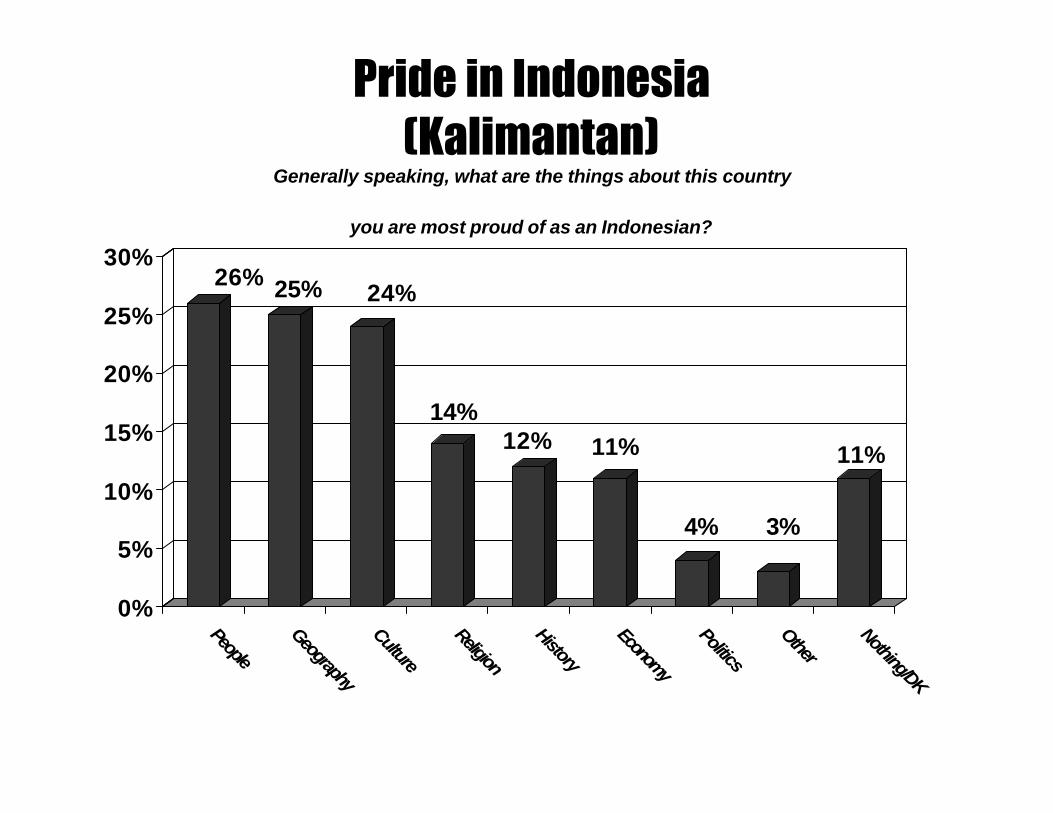
Pride in Indonesia(Kalimantan)
Generally speaking, what are the things about this country
you are most proud of as an Indonesian?
26% 25% 24%
14%12% 11%
4% 3%
11%
0%
5%
10%
15%
20%
25%
30%
People
Geography
Culture
Religion
History
Economy
Politics
OtherNothing/DK

Freedom of Political Expression ( Kalimantan )
Do people feel free to express their political opinions in the area where you live ?Did they feel free to express their opinions before the events of last May ?
77%
14%
44%
23% 23%
39%
0%
10%
20%
30%
40%
50%
60%
70%
80%
Now January '99 Before May '98
Yes No

Political Alienation (Kalimantan)
Some people say, “I don’t think the government cares very much about what people like me think.”
Do you agree or disagree? Strongly, or somewhat?
2%17%
32%
46%
15%
16%25%
35%
0%
10%
20%
30%
40%
50%
60%
70%
80%
Agree: 19% Disagree: 78% Agree: 31% Disagree: 60%
JanuaryJuly
Strongly Somewhat

Confidence in the Future(Kalimantan)
How confident are you of a happy future for Indonesia as a whole?
16%
77%
1%
5%21%
39%
6%
26%
0%
20%
40%
60%
80%
100%
Very/Fairly: 93%
Not very/ Not at all: 6%
Very/ Fairly: 60%
Not very/ Not at all: 32%
JanuaryJuly
Very/ Not at all Fairly/ Not very

Part 2:Attitudes to the Election
( Kalimantan )

Summary - Attitudes to the Election( Kalimantan )
• The consensus in Kalimantan – shared by 85% of residents, more than any other region – is that the recent election was free and fair. Only 4% thought otherwise, and 11% were unsure.
• Compared with other regions, fewer Kalimantan residents cited any election concerns at all. Mentioned most often were omissions from the voting roll, by 12%, and news media bias, by 7%.
• The proportion of those who said they understood the voting process was higher than any other region, at 93%.
• Registration and turnout were nearly universal, with 100% registering and 98% voting. Participation in other forms of pre-election activity was more limited than in other regions; just 17% attended a meeting or rally; 4% volunteered for a party or candidate; and only 2% gave money.

Free and Fair Elections?(Kalimantan)
Some people think the 1999 election was [January: will be] free and fair, some think it was not [January: will not be], and some are not sure.
How about you? Which of these opinions do you agree with?
85%
4% 11%
73%
3%
23%
0%
10%
20%
30%
40%
50%
60%
70%
80%
90%
July '99 January '99
Free and Fair Not Free and Fair Not Sure

Elections Free and Fair? 1999 vs. 1997( Kalimantan)
85%
4% 11%
65%
24%
11%
0%
10%
20%
30%
40%
50%
60%
70%
80%
90%
1999 1997
Yes, free and fair No, not free and fair Don't Know
Some people think the 1999 elections were Did you think that the 1997Free and fair, some think they were not, and elections were free and fair?some are not sure. How about you?

Election Concerns(Kalimantan)
I’m going to mention some problems that can happen in elections.For each one, tell me if you believe it happened [January: think it is possible] here in the
election this [January: next] year.
July JanuaryPeople left off voting roll 12% 24%
News media bias favoring party 7% 22%
Riots or disorders 2% 22%
Finding out how people voted 0% 9%
Selling of votes 0% 14%
Violence against party activists 0% 15%
Cheating in counting 0% 17%
Forcing workers to vote together 0% 8%
People voting more than once 0% 6%
Threats from officials 0% 6%

Understand Voting and Election(Kalimantan)
In the recent national elections, did you understand how the voting and election process worked, or not?
93%
7%
0%0%
10%
20%
30%
40%
50%
60%
70%
80%
90%
100%
Yes No Don't Know

Types of Electoral Participation (Kalimantan)
Percent who reported each type of participation
Registered 100%
Voted 98%
Participated in election meeting or street rally 17%
Worked as volunteer 4%
Contributed money to party or candidate 2%

Part 3Exposure and Impact of
Voter Education( Kalimantan )

Summary - Exposure and Impact of Voter Education
( Kalimantan )• Kalimantan residents reported the highest levels of exposure to voter education:
94% saw or heard it, and nearly two-thirds (65%) reported that they were exposed to one or more sources many times.
• TV was the most widely used source of voter education, with 47% exposed to it many times. The region had lots of stickers (25% saw them many times, well above the average), and was covered with banners (20% saw them many times), while 13% were exposed to radio many times.
• TV was identified as the most important medium for voter education by 84% of Kalimantan residents.

Saw or Heard Voter Education[Kalimantan]
Did you see or hear anything about registration, the election, or democracy from voter education groups through … (all sources combined)
65%
29%
6%
0%
10%
20%
30%
40%
50%
60%
70%
Many Times Few Times/Once Never

Exposure to Voter Education Sources(Kalimantan)
Did you see or hear anything about registration, the election, or democracy from voter education groups through…? (Percentage who saw/heard source “many times”)
47%
13%
20%
25%
6% 4%2%
0%
10%
20%
30%
40%
50%
Television
RadioBanners (spanduk)
Stickers
Pamphlets etc.
Newspapers
Books

Most Important Source ofVoter Education
(Kalimantan)Which one of these things we just talked about was the most important source of information
for you about how the election and democracy worked? (Asked of those who saw at least one source of voter education)
84%
10%3% 2%
0% 0% 0%0%
20%
40%
60%
80%
100%
TV RadioBanners
Pamphlets etc.
StickersBooks
Newspapers
Part 4Civic Education Issues
( Kalimantan )

Summary - Civic Education Issues( Kalimantan )
• When asked to define democracy, only 24% of Kalimantan voters were unable to offer a meaning for democracy, down massively from71% in January.
• Kalimantan residents most often defined democracy in terms of political rights, mentioned by 66%, with 19% referring to “government of/by/for the people” and 18% naming free speech. Economic gains were cited by 18%, and 4% named peace and stability.
• Support for women’s equality in political leadership is now expressed by 69% of women and 78% of men. (We had too few regional interviews in January for comparisons.)
• Despite political violence in parts of the region during the election campaign, Kalimantan residents are more tolerant of unpopular political parties than in January. The proportion who are tolerant has increased from 40% to 57%.
• More than one in four Kalimantan residents (27%) have worked informally with others to deal with a community issue or problem in the past five years. During the same time frame, only a small proportion served on a local council (9%) or contacted a government official about a problem or issue (2%).

• Don’t Know / No Response: 24%
• Political Rights: 66%
– “People’s sovereignty,” “government of, by, for people”: 19%
– “Leaders who listen to people,” “Pancasila”: 19%
– “Free speech,” “free expression” : 18%
– “Human rights,” “rule of law”: 7%
– “Freedom:“ 2%
– Free elections,” “free political participation”: 1%
• Economic Gains: 18%
– “Social justice,” “help for the poor” : 8%
– “Economic Stability,” “Jobs,”: 8%
– “Prosperity,”, “SEMBAKO availability: 2%
• Peace, Stability, Consensus: 4%
Characteristics of a DemocraticCountry (Kalimantan)
If a country is called a democracy, what does that mean to you? Anything else?

Gender and Political Leadership(Kalimantan)
Do you think that political leadership positions should be mostly for men or do you think that women should be just as
active as men in political leadership ?
31%
69%
20%
78%
0%
10%
20%
30%
40%
50%
60%
70%
80%
Women Men
Mostly for men Women Equal

Political Tolerance: Meetings(Kalimantan)
Do you think that all political parties, even the ones most people do not like, should be allowed to hold meetings in your area ?
57%
37%
6%
40%44%
16%
0%
10%
20%
30%
40%
50%
60%
70%
July JanuaryYes No Don't Know

Non-Electoral Participation( Kalimantan )
In the past five years, have you…?
27%
9%
2%0%
0%
10%
20%
30%
Workedinformally with
others
Served on localcouncil
Contacted gov'tofficial
Been a memberof politicalparty/org

Part 5:Civil Society Issues
( Kalimantan )

Summary - Civil Society Issues( Kalimantan )
• Kalimantan residents have had few opportunities to exercise civil skills in civil society, with no more than 19% reporting any activity at all.
• Just one in five (19%) Kalimantan residents who attended school say they were interested in politics as students, and only 12% took courses requiring them to follow current events.
• While in school, Kalimantan residents were most likely to belong to Scouts (26%), school sports clubs (23%) or school clubs (16%).
• Nearly half (47%) – more than any other region – reported that they belonged to no organization while in school.
• These figures are very low compared to other regions.

Civic Skills in Civil Society(Kalimantan)
Here is a list of things that people sometimes do at work, in their religious institution, or in other organizations. After I read each one, please tell me whether or not you have done that in
the last year.
Skills Exercised In OrganizationIn Mosque /
Church / TempleAt Work
Never / DK / Refused
Wrote a letter on behalf of the organization 9% 1% 8% 86%
Helped make a decision at a meeting 5% 10% 7% 81%
Planned or chaired a meeting 4% 5% 1% 92%
Made a speech or presentation 4% 6% 5% 88%
Held an official post or belonged to a committee
9% 6% 2% 87%

Student Interest in Politics(Kalimantan)
Now think back to your school days. How interested were the students in your school about events and politics then – very interested, somewhat interested, not very interested, or not
interested at all?
16%
41%
0%
10%
20%
30%
40%
50%
60%
70%
80%
Very/Somewhat: 19% Not very/ Not at all: 74%
Very/ Not at all Somewhat/Not very
16%3%
33%

Current Events Courses(Kalimantan)
Thinking still about your school days, did you ever have any courses that required you to pay attention to current events?
12%
78%
10%
0%
10%
20%
30%
40%
50%
60%
70%
80%
Yes No DK/Refused
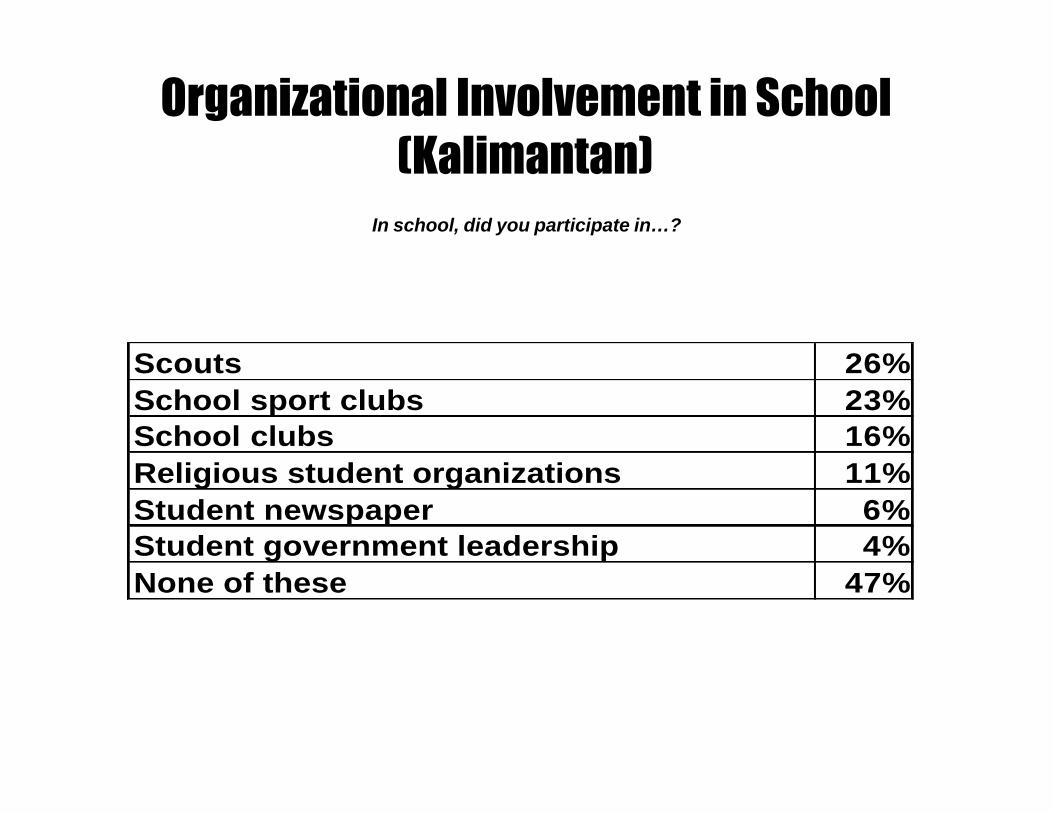
Organizational Involvement in School(Kalimantan)
In school, did you participate in…?
Scouts 26%School sport clubs 23%School clubs 16%Religious student organizations 11%Student newspaper 6%Student government leadership 4%None of these 47%

Part 6: Decentralization and Administration
of Justice Issues( Kalimantan )

Summary - Decentralization and Administration of Justice Issues
( Kalimantan )• Kalimantan voters identify with people of the same religion slightly more than with other
Indonesians – 29% feel a lot in common with people of their own religion, while 24% feel similarly about other Indonesians.
• A solid majority of 72% – more than any other region – support further decentralization.
• Compared with other regions, Kalimantan residents were least likely to seek outsiders for dispute resolution: 80% have not consulted anyone in this capacity. At the same time, Kalimantan residents are more likely than other Indonesians to use RT or village officials (19%) when help is needed.
• Opinion in Kalimantan is divided on the police, with 54% trusting them to enforce the law fairly and 40% feeling they are unfair. Lawyers are trusted by similar numbers and mistrusted by fewer, while TNI and the courts are trusted by 69% and 62%, respectively.

Group Identity(Kalimantan)
If you heard someone belonged to your… , how much would you feel you had in common with them? A lot, something, a little or not much?
29%
24%
14% 14%
0%
10%
20%
30%
Same religion
Fellow Indonesian
Same region/province
Same language/ethnic group

Attitudes Towards Decentralization(Kalimantan)
Here are two ideas on how to organize the government. Tell me which one you agree with more:
24%
72%
5%0%
20%
40%
60%
80%
Situation should continue – Jakarta has almost all power and money
Provincial governments should receive more power
Don’t know / refused

Use of Dispute Resolution Mechanisms(Kalimantan)
Have you ever gone to any of the following people to resolve a conflict or dispute?
An RT or village official 19%
A religious leader 3%
The police 3%
A non-govermental organization 0%
A lawyer or court 0%
Government official 0%
None of these 80%

Confidence in Law Enforcement(Kalimantan)
Now I’d like to ask you about people whose job is enforcing the law. Tell me if you are very confident, fairly confident, not very confident, or not confident at all
that they will enforce the law fairly.
Very/Fairly Not very/Not at all Don't Know
ABRI 69% 23% 8%
The Courts 62% 28% 10%
The Police 54% 40% 6%
Lawyers 53% 28% 19%

Section VISulawesi

Part 1:The Regional Mood
( Sulawesi )

Summary - The Regional Mood( Sulawesi )
• Sulawesi is moderately optimistic about the country’s future, an outlook which has changed little in the past six months. Some 60% feel the country is headed in the right direction – about the same as in January.
• Concerns have remained fairly consistent as well. The economy is mentioned by 62% (down from 69%); political rights are named by 26% (unchanged); and violence is identified as a problem by 17% (down somewhat from 25% in January).
• But people feel much freer now to express themselves politically in Sulawesi. Some 82% say they can speak freely at present, up from 51% in January and only 21% before May 1998.
• Most (69%) think the government cares what they think, about the same as in January (71%).
• Confidence is holding steady, with 72% expecting a happy future for Indonesia – down an insignificant three points from 75% in the last poll.

Direction of the Country( Sulawesi )
Generally speaking, do you think things in Indonesia today are going in the right direction, or do you think they are going in the wrong direction ?
60%
4%
35%
61%
12%
27%
0%
10%
20%
30%
40%
50%
60%
70%
July JanuaryRight Wrong Don't Know

Indonesia’s Biggest Problems( Sulawesi )
In your view, what is the biggest problem facing Indonesia ? And after that, what is the second biggest problem ?
62%
26%17%
2%0%
10%
20%
30%
40%
50%
60%
70%
Economy Politics Violence Social

Pride in Indonesia(Sulawesi)
Generally speaking, what are the things about this country
you are most proud of as an Indonesian?
25%
18%
14%12% 12%
7%
1%4%
37%
0%
5%
10%
15%
20%
25%
30%
35%
40%
Culture
Geography
Economy
People
Religion
Politics
History
OtherNothing/DK

Freedom of Political Expression ( Sulawesi )
Do people feel free to express their political opinions in the area where you live ?Did they feel free to express their opinions before the events of last May ?
82%
8%
51%
28%21%
47%
0%
10%
20%
30%
40%
50%
60%
70%
80%
90%
Now January '99 Before May '98
Yes No

Political Alienation (Sulawesi)
Some people say, “I don’t think the government cares very much about what people like me think.” Do you agree or disagree? Strongly, or somewhat?
7%
12%24%
45%
7%
14% 26%
45%
0%
10%
20%
30%
40%
50%
60%
70%
80%
Agree: 19% Disagree: 69% Agree: 21% Disagree: 71%
JanuaryJuly
Strongly Somewhat

Confidence in the Future(Sulawesi)
How confident are you of a happy future for Indonesia as a whole?
46%
9%
50%
9%0%
20%
40%
60%
80%
100%
Very/Fairly: 72%
Not very/ Not at all: 9%
Very/ Fairly: 75%
Not very/ Not at all: 10%
JanuaryJuly
Very/ Not at all Fairly/ Not very
16%
0%
27%
1%

Part 2:Attitudes to the Election
( Sulawesi )

Summary - Attitudes to the Election( Sulawesi )
• While less than half (48%) of Sulawesi residents expected the election to be free and fair, 83% are convinced that it was; only 1% think it was not; and 15% are unsure.
• Cited most often as a problem with the election was omissions from the voting roll, by 18%. None of the other nine potential problems in the January poll was mentioned by more than 5% as having actually occurred in their areas.
• The working of the voting process was not a source of concern; 89% said they understood it.
• Some 93% say they registered to vote, and 91% claim to have voted. Nearly one in four, 23%, participated in pre-election meetings or street rallies, while 7% volunteered to work for a party or candidate and 2% donated money.

Free and Fair Elections?( Sulawesi )
Some people think the 1999 election was [January: will be] free and fair, some think it was not [January: will not be], and some are not sure.
How about you? Which of these opinions do you agree with?
83%
1%
15%
48%
5%
47%
0%
10%
20%
30%
40%
50%
60%
70%
80%
90%
July JanuaryFree and Fair Not Free and Fair Not Sure

Elections Free and Fair? 1999 vs. 1997
( Sulawesi)
83%
1%
15%
50%
25% 25%
0%
10%
20%
30%
40%
50%
60%
70%
80%
90%
1999 1997Yes, free and fair No, not free and fair Don't Know
Some people think the 1999 elections were Did you think that the 1997Free and fair, some think they were not, and elections were free and fair?some are not sure. How about you?

Election Concerns(Sulawesi)
I’m going to mention some problems that can happen in elections.For each one, tell me if you believe it happened [January: think it is possible] here in the
election this [January: next] year.
July JanuaryPeople left off voting roll 18% 29%
News media bias favoring party 5% 17%
Finding out how people voted 4% 17%
People voting more than once 3% 7%
Threats from officials 3% 12%
Forcing workers to vote together 2% 11%
Cheating in counting 0% 16%
Violence against party activists 0% 17%
Riots or disorders 0% 16%
Selling of votes 0% 11%

Understand Voting and Election(Sulawesi)
In the recent national elections, did you understand how the voting and election process worked, or not?
89%
7%4%
0%
10%
20%
30%
40%
50%
60%
70%
80%
90%
100%
Yes No Don't Know

Types of Electoral Participation (Sulawesi)
Percent who reported each type of participation
Registered 93%
Voted 91%
Participated in election meeting or street rally 23%
Worked as volunteer 7%
Contributed money to party or candidate 2%

Part 3Exposure and Impact of
Voter Education(Sulawesi)

Summary - Exposure and Impact of Voter Education
( Sulawesi )• A wide majority of Sulawesi residents was exposed to voter education: 87% saw or
heard it, and more than half (55%) reported that they were exposed to one or more sources many times.
• TV was the most widely used source of voter education, with 39% exposed to it many times. Sulawesi residents also reported seeing a wide variety of other sources many times.
• The region was plastered with stickers (32% saw them many times, the most of any region), and more saw banners many times than elsewhere as well (27%). Radio broadcasts were heard many times by 12%.
• TV was identified by 81% of Sulawesi residents as the most important source of voter education, while banners were cited by another 11% (more than any other region).
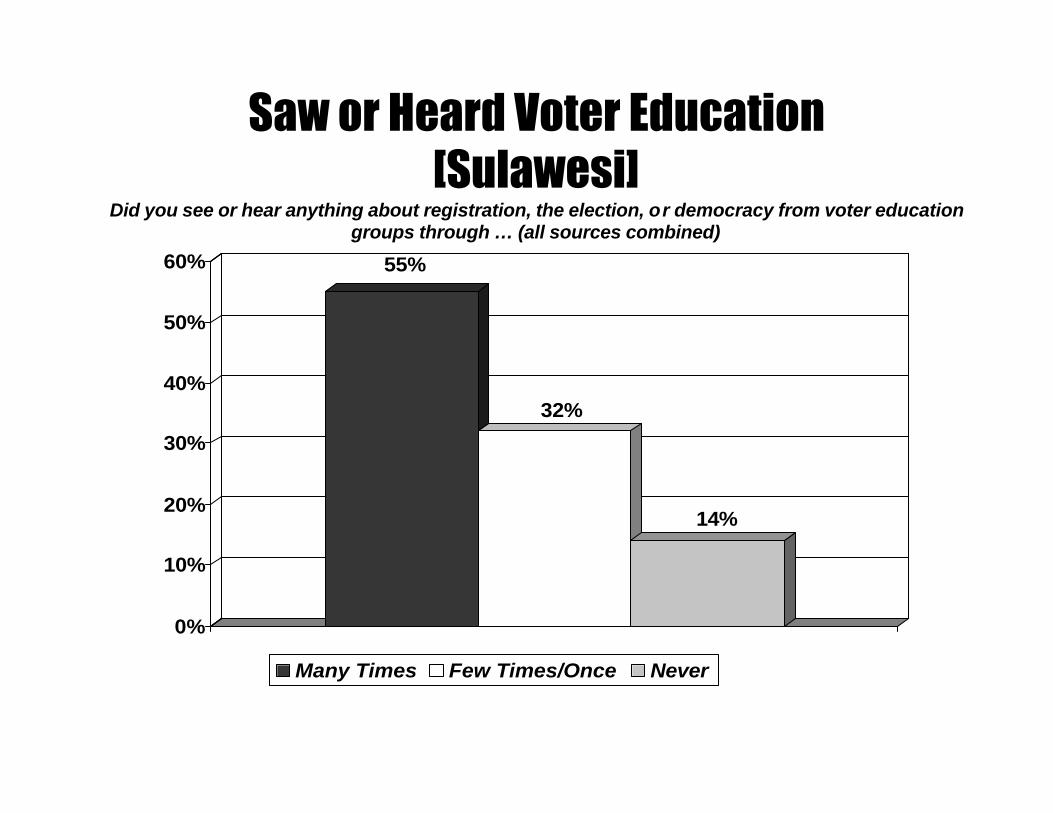
Saw or Heard Voter Education[Sulawesi]
Did you see or hear anything about registration, the election, or democracy from voter education groups through … (all sources combined)
55%
32%
14%
0%
10%
20%
30%
40%
50%
60%
Many Times Few Times/Once Never

Exposure to Voter Education Sources(Sulawesi)
Did you see or hear anything about registration, the election, or democracy from voter education groups through…? (Percentage who saw/heard source “many times”)
39%
12%
32%
27%
10%
4%6%
0%
10%
20%
30%
40%
Television
RadioStickers
Banners (spanduk)
Pamphlets etc.
Newspapers
Books

Most Important Source ofVoter Education (Sulawesi)
Which one of these things we just talked about was the most important source of information for you about how the election and democracy worked?
(Asked of those who saw at least one source of voter education)
81%
11% 7%
0% 0% 0% 0%0%
20%
40%
60%
80%
100%
TV BannersRadio
Newspapers
Pamphlets etc.
StickersBooks

Part 4Civic Education Issues
(Sulawesi)
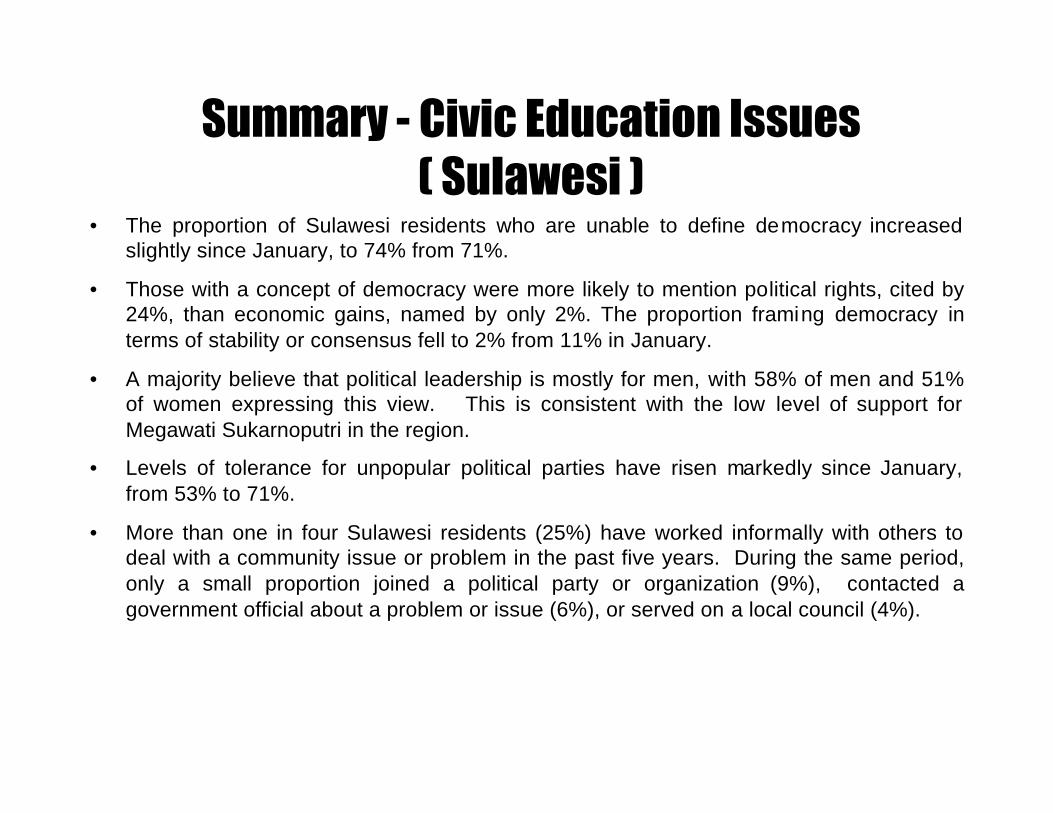
Summary - Civic Education Issues( Sulawesi )
• The proportion of Sulawesi residents who are unable to define democracy increased slightly since January, to 74% from 71%.
• Those with a concept of democracy were more likely to mention political rights, cited by 24%, than economic gains, named by only 2%. The proportion framing democracy in terms of stability or consensus fell to 2% from 11% in January.
• A majority believe that political leadership is mostly for men, with 58% of men and 51% of women expressing this view. This is consistent with the low level of support for Megawati Sukarnoputri in the region.
• Levels of tolerance for unpopular political parties have risen markedly since January, from 53% to 71%.
• More than one in four Sulawesi residents (25%) have worked informally with others to deal with a community issue or problem in the past five years. During the same period, only a small proportion joined a political party or organization (9%), contacted a government official about a problem or issue (6%), or served on a local council (4%).

• Don’t Know / No Response: 74%
• Political Rights: 24%
– “Free speech,” “free expression” : 9%
– “People’s sovereignty,” “government of, by, for people”: 8%
– “Pancasila,” 4%
– “Freedom” : 2%
– “Human rights,” “rule of law”: 1%
• Peace, Stability, Consensus: 2%
• Economic Gains: 2%
– “Social justice,” “help for the poor” : 2%
Characteristics of a Democratic Country ( Sulawesi )
If a country is called a democracy, what does that mean to you? Anything else?

Gender and Political Leadership(Sulawesi)
Do you think that political leadership positions should be mostly for men or do you think that women should be just as
active as men in political leadership ?
51%
42%
58%
41%
0%
10%
20%
30%
40%
50%
60%
Women Men
July
Mostly for men Women Equal

Political Tolerance: Meetings(Sulawesi)
Do you think that all political parties, even the ones most people do not like, should be allowed to hold meetings in your area ?
71%
22%
7%
53%
21%26%
0%
10%
20%
30%
40%
50%
60%
70%
July '99 January '99Yes No Don't Know

Non-Electoral Participation( Sulawesi )
In the past five years, have you…?
25%
9%
6%4%
0%
10%
20%
30%
Workedinformally with
others
Been a memberof politicalparty/org
Contacted gov'tofficial
Served on localcouncil
Part 5:Civil Society Issues
(Sulawesi)

Summary - Civil Society Issues( Sulawesi )
• Religious organizations offer the main opportunity for participation in civil society; 20% of Sulawesi residents have helped make a decision at a religious meeting, and 11% have planned or chaired a religious meeting.
• Sulawesi voters were more likely than other Indonesians to report being interested in politics when they were students (29%) and to have taken courses requiring them to follow current events (35%).
• While in school, Sulawesi residents reported high levels of involvement in several organizations, including sports clubs (57%), Scouts (30%) and school clubs (21%).
• Sulawesians are “joiners”: Only 18% reported that they did not belong to a school club or youth group while a student.

Civic Skills in Civil Society(Sulawesi)
Here is a list of things that people sometimes do at work, in their religious institution, or in other organizations. After I read each one, please tell me whether or not you have done that in
the last year.
Skills Exercised In OrganizationIn Mosque /
Church / TempleAt Work
Never / DK / Refused
Wrote a letter on behalf of the organization
6% 4% 0% 92%
Helped make a decision at a meeting 13% 20% 5% 74%
Planned or chaired a meeting 9% 11% 1% 87%
Made a speech or presentation 6% 8% 1% 88%
Held an official post or belonged to a committee
7% 7% 1% 89%

Student Interest in Politics(Sulawesi)
Now think back to your school days. How interested were the students in your school about events and politics then – very interested, somewhat interested, not very interested, or not
interested at all?
8%
21%
27%
22%
0%
10%
20%
30%
40%
50%
Very/Somewhat: 29% Not very/ Not at all: 49%Very/ Not at all Somewhat/Not very

Current Events Courses(Sulawesi)
Thinking still about your school days, did you ever have any courses that required you to pay attention to current events?
35%
49%
16%
0%
10%
20%
30%
40%
50%
Yes No DK/Refused

Organizational Involvement in School(Sulawesi)
In school, did you participate in…?
School sport clubs 57%Scouts 30%School clubs 21%Religious student organizations 9%Student government leadership 6%Student newspaper 1%None of these 18%
Part 6: Decentralization and Administration
of Justice Issues(Sulawesi)
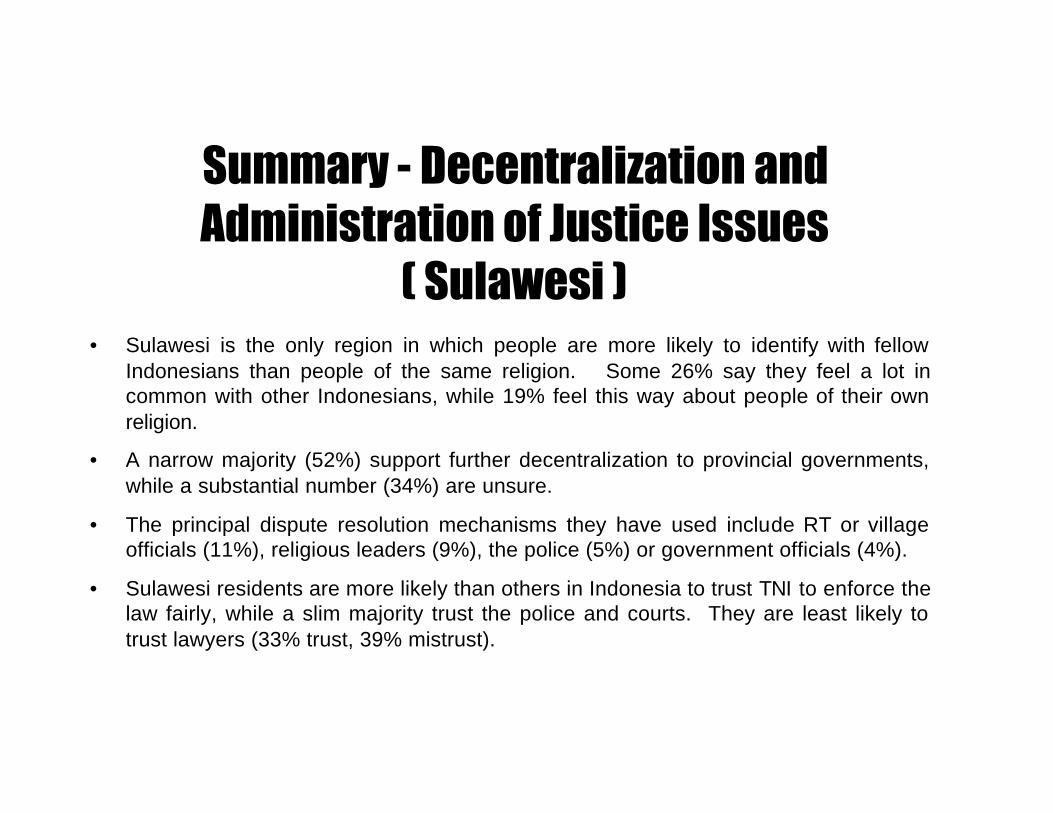
Summary - Decentralization and Administration of Justice Issues
( Sulawesi )• Sulawesi is the only region in which people are more likely to identify with fellow
Indonesians than people of the same religion. Some 26% say they feel a lot in common with other Indonesians, while 19% feel this way about people of their own religion.
• A narrow majority (52%) support further decentralization to provincial governments, while a substantial number (34%) are unsure.
• The principal dispute resolution mechanisms they have used include RT or village officials (11%), religious leaders (9%), the police (5%) or government officials (4%).
• Sulawesi residents are more likely than others in Indonesia to trust TNI to enforce the law fairly, while a slim majority trust the police and courts. They are least likely to trust lawyers (33% trust, 39% mistrust).

Group Identity(Sulawesi)
If you heard someone belonged to your… , how much would you feel you had in common with them? A lot, something, a little or not much?
26%
19%17% 16%
0%
10%
20%
30%
Fellow Indonesian
Same religion
Same language/ethnic group
Same region/province

Attitudes Towards Decentralization(Sulawesi)
Here are two ideas on how to organize the government. Tell me which one you agree with more:
14%
52%
34%
0%
10%
20%
30%
40%
50%
60%
Situation should continue – Jakarta has almost all power and moneyProvincial governments should receive more powerDon’t know / refused

Use of Dispute Resolution Mechanisms(Sulawesi)
Have you ever gone to any of the following people to resolve a conflict or dispute?
An RT or village official 11%
A religious leader 9%
The police 5%
Government official 4%
A non-govermental organization 0%
A lawyer or court 0%
None of these 78%

Confidence in Law Enforcement(Sulawesi)
Now I’d like to ask you about people whose job is enforcing the law. Tell me if you are very confident, fairly confident, not very confident,
or not confident at all that they will enforce the law fairly.
Very/Fairly Not very/Not at all Don't Know
ABRI 65% 21% 14%
The Courts 54% 36% 10%
The Police 52% 34% 15%
Lawyers 33% 39% 28%

Sampling Methodology

Sampling Methodology• The basic sampling method used for the national representative sample (of 800
potential voters) was multi-stage random sampling with the following stages:
– Stage 1 : Selection of Kelurahans/Desa’s (villages) with probability proportionate to population.
– Stage2 : Random selection of RTs (neighborhood administrative units) by interval method.
– Stage 3 : Random selection of households, by interval method.
– Stage 4 : Selection of respondent by Kish Grid.
• Kelurahans/Desa’s (village-sized urban and rural administrative units) were selected by ACNielsen statisticians in Jakarta using a Master Frame of all Kelurahans/Desa’s provided by Biro Pusat Statistik (National Statistics Office).
• 8 respondents were selected in each Kelurahan/Desa; 4 in each of two randomly selected RTs.
• ACNielsen interviewers in the field prepared lists of RT’s on information from the local Kelurahan office. RT’s for inclusion in the study were selected using random-number tables.

Sampling Methodology• Households in each RT were then mapped and listed, and respondent households were
then selected by using an interval of 1 in 5 households. A random start-point household was pre-selected by ACNielsen statisticians.
• All potential respondents in each household were then listed (in age order) and a random Kish Grid procedure was used to select a respondent for interview.
• Potential respondents were defined as:
– adults aged 17 and older.
– married people under age 17.
• One respondent was interviewed in each household.