graduate follow-up survey report - ferris
TRANSCRIPT

GRADUATE FOLLOW-UPSURVEY REPORT
2013-2014
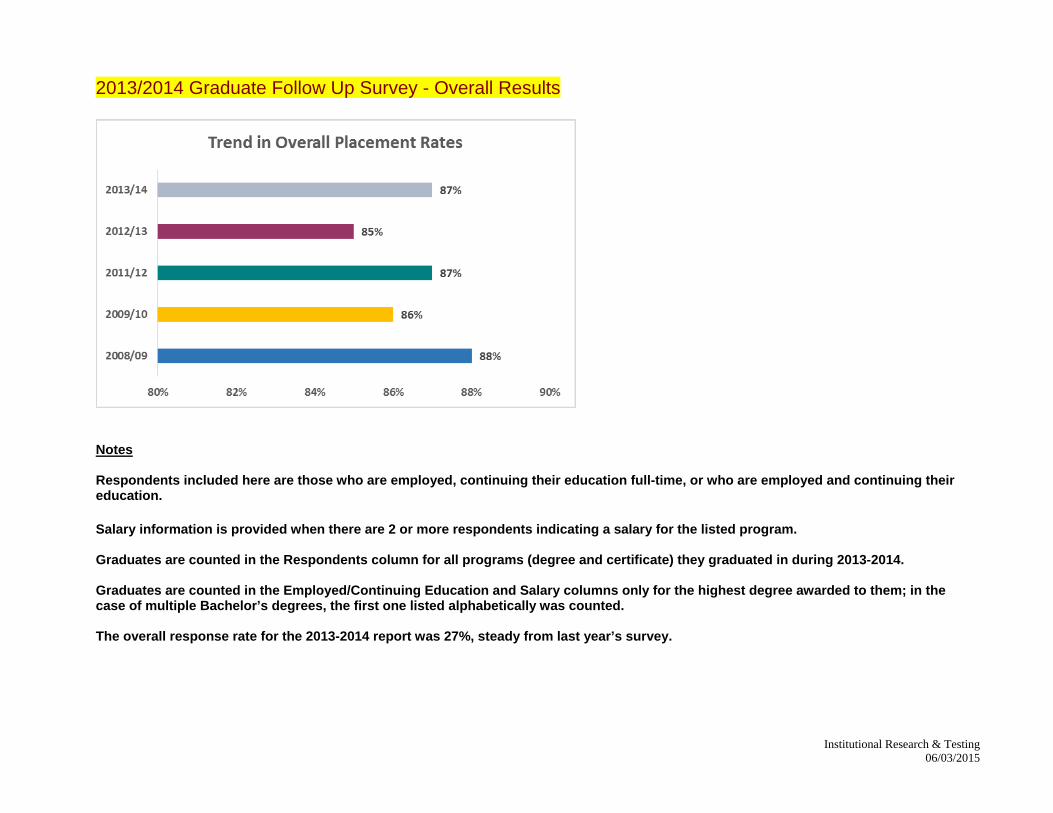
2013/2014 Graduate Follow Up Survey - Overall Results
Notes Respondents included here are those who are employed, continuing their education full-time, or who are employed and continuing their education. Salary information is provided when there are 2 or more respondents indicating a salary for the listed program. Graduates are counted in the Respondents column for all programs (degree and certificate) they graduated in during 2013-2014. Graduates are counted in the Employed/Continuing Education and Salary columns only for the highest degree awarded to them; in the case of multiple Bachelor’s degrees, the first one listed alphabetically was counted. The overall response rate for the 2013-2014 report was 27%, steady from last year’s survey.
Institutional Research & Testing 06/03/2015
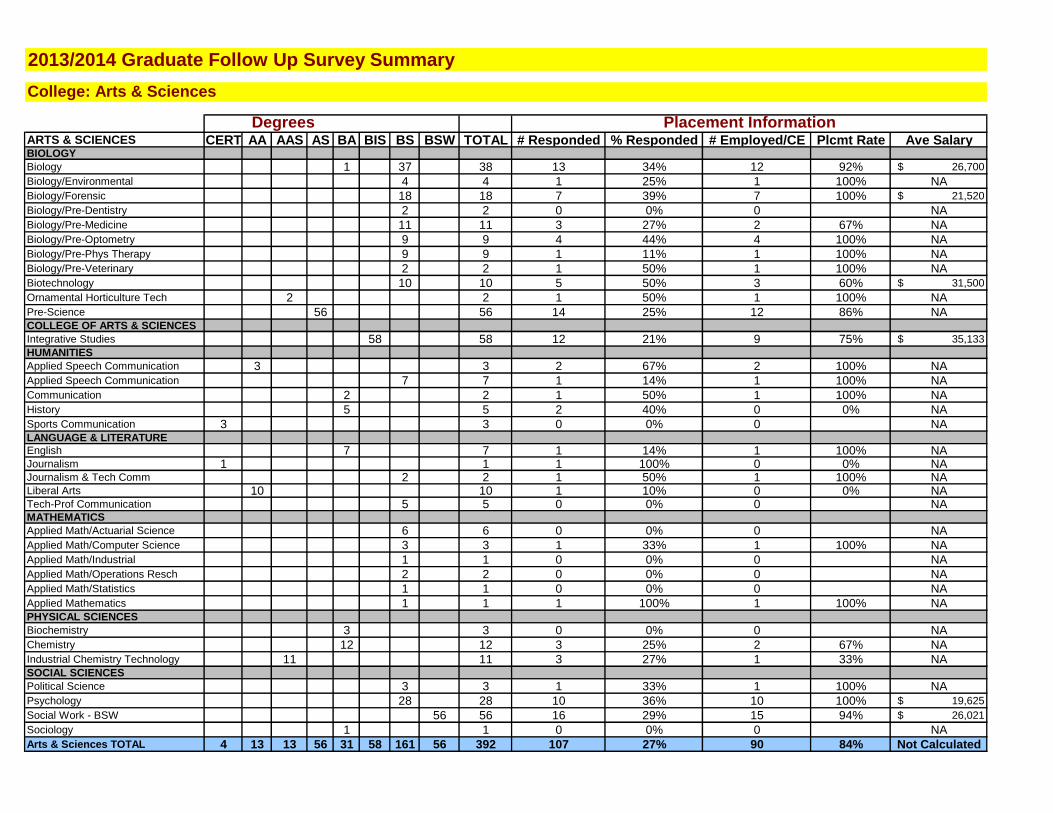
2013/2014 Graduate Follow Up Survey Summary
College: Arts & Sciences
DegreesARTS & SCIENCES CERT AA AAS AS BA BIS BS BSW TOTAL # Responded % Responded # Employed/CE Plcmt Rate Ave SalaryBIOLOGY
Biology 1 37 38 13 34% 12 92% $ 26,700
Biology/Environmental 4 4 1 25% 1 100% NA
Biology/Forensic 18 18 7 39% 7 100% $ 21,520
Biology/Pre-Dentistry 2 2 0 0% 0 NA
Biology/Pre-Medicine 11 11 3 27% 2 67% NA
Biology/Pre-Optometry 9 9 4 44% 4 100% NA
Biology/Pre-Phys Therapy 9 9 1 11% 1 100% NA
Biology/Pre-Veterinary 2 2 1 50% 1 100% NA
Biotechnology 10 10 5 50% 3 60% $ 31,500
Ornamental Horticulture Tech 2 2 1 50% 1 100% NA
Pre-Science 56 56 14 25% 12 86% NACOLLEGE OF ARTS & SCIENCES
Integrative Studies 58 58 12 21% 9 75% $ 35,133
HUMANITIES
Applied Speech Communication 3 3 2 67% 2 100% NA
Applied Speech Communication 7 7 1 14% 1 100% NA
Communication 2 2 1 50% 1 100% NA
History 5 5 2 40% 0 0% NA
Sports Communication 3 3 0 0% 0 NALANGUAGE & LITERATURE
English 7 7 1 14% 1 100% NAJournalism 1 1 1 100% 0 0% NAJournalism & Tech Comm 2 2 1 50% 1 100% NALiberal Arts 10 10 1 10% 0 0% NATech-Prof Communication 5 5 0 0% 0 NAMATHEMATICS
Applied Math/Actuarial Science 6 6 0 0% 0 NA
Applied Math/Computer Science 3 3 1 33% 1 100% NA
Applied Math/Industrial 1 1 0 0% 0 NA
Applied Math/Operations Resch 2 2 0 0% 0 NA
Applied Math/Statistics 1 1 0 0% 0 NA
Applied Mathematics 1 1 1 100% 1 100% NAPHYSICAL SCIENCES
Biochemistry 3 3 0 0% 0 NA
Chemistry 12 12 3 25% 2 67% NA
Industrial Chemistry Technology 11 11 3 27% 1 33% NASOCIAL SCIENCES
Political Science 3 3 1 33% 1 100% NA
Psychology 28 28 10 36% 10 100% $ 19,625
Social Work - BSW 56 56 16 29% 15 94% $ 26,021
Sociology 1 1 0 0% 0 NA
Arts & Sciences TOTAL 4 13 13 56 31 58 161 56 392 107 27% 90 84% Not Calculated
Placement Information
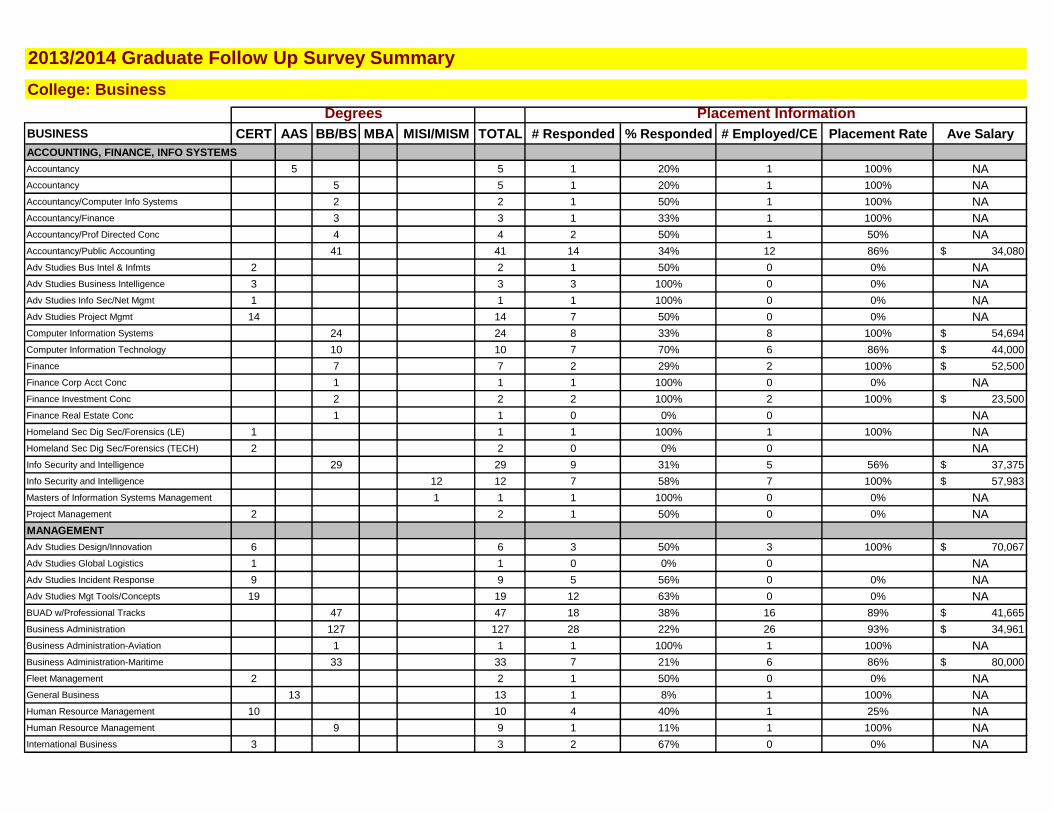
2013/2014 Graduate Follow Up Survey Summary
College: Business
BUSINESS CERT AAS BB/BS MBA MISI/MISM TOTAL # Responded % Responded # Employed/CE Placement Rate Ave Salary
ACCOUNTING, FINANCE, INFO SYSTEMS
Accountancy 5 5 1 20% 1 100% NA
Accountancy 5 5 1 20% 1 100% NA
Accountancy/Computer Info Systems 2 2 1 50% 1 100% NA
Accountancy/Finance 3 3 1 33% 1 100% NA
Accountancy/Prof Directed Conc 4 4 2 50% 1 50% NA
Accountancy/Public Accounting 41 41 14 34% 12 86% $ 34,080
Adv Studies Bus Intel & Infmts 2 2 1 50% 0 0% NA
Adv Studies Business Intelligence 3 3 3 100% 0 0% NA
Adv Studies Info Sec/Net Mgmt 1 1 1 100% 0 0% NA
Adv Studies Project Mgmt 14 14 7 50% 0 0% NA
Computer Information Systems 24 24 8 33% 8 100% $ 54,694
Computer Information Technology 10 10 7 70% 6 86% $ 44,000
Finance 7 7 2 29% 2 100% $ 52,500
Finance Corp Acct Conc 1 1 1 100% 0 0% NA
Finance Investment Conc 2 2 2 100% 2 100% $ 23,500
Finance Real Estate Conc 1 1 0 0% 0 NA
Homeland Sec Dig Sec/Forensics (LE) 1 1 1 100% 1 100% NA
Homeland Sec Dig Sec/Forensics (TECH) 2 2 0 0% 0 NA
Info Security and Intelligence 29 29 9 31% 5 56% $ 37,375
Info Security and Intelligence 12 12 7 58% 7 100% $ 57,983
Masters of Information Systems Management 1 1 1 100% 0 0% NA
Project Management 2 2 1 50% 0 0% NA
MANAGEMENT
Adv Studies Design/Innovation 6 6 3 50% 3 100% $ 70,067
Adv Studies Global Logistics 1 1 0 0% 0 NA
Adv Studies Incident Response 9 9 5 56% 0 0% NA
Adv Studies Mgt Tools/Concepts 19 19 12 63% 0 0% NA
BUAD w/Professional Tracks 47 47 18 38% 16 89% $ 41,665
Business Administration 127 127 28 22% 26 93% $ 34,961
Business Administration-Aviation 1 1 1 100% 1 100% NA
Business Administration-Maritime 33 33 7 21% 6 86% $ 80,000
Fleet Management 2 2 1 50% 0 0% NA
General Business 13 13 1 8% 1 100% NA
Human Resource Management 10 10 4 40% 1 25% NA
Human Resource Management 9 9 1 11% 1 100% NA
International Business 3 3 2 67% 0 0% NA
Degrees Placement Information
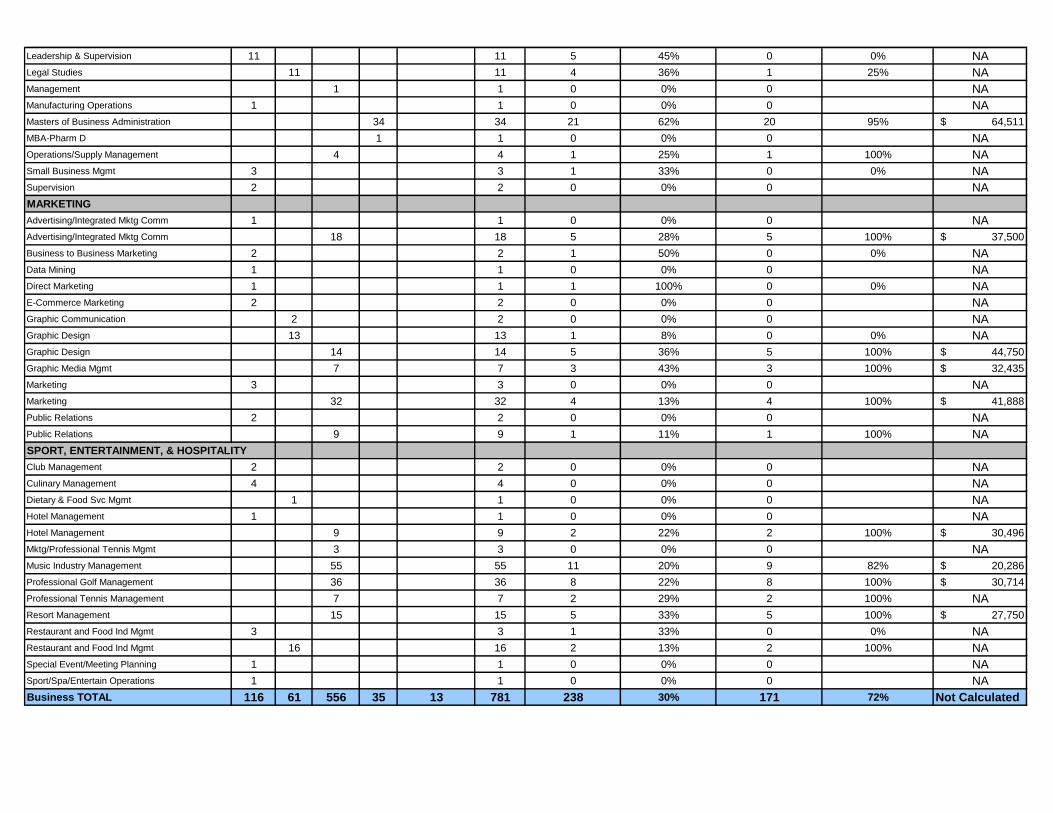
Leadership & Supervision 11 11 5 45% 0 0% NA
Legal Studies 11 11 4 36% 1 25% NA
Management 1 1 0 0% 0 NA
Manufacturing Operations 1 1 0 0% 0 NA
Masters of Business Administration 34 34 21 62% 20 95% $ 64,511
MBA-Pharm D 1 1 0 0% 0 NA
Operations/Supply Management 4 4 1 25% 1 100% NA
Small Business Mgmt 3 3 1 33% 0 0% NA
Supervision 2 2 0 0% 0 NA
MARKETING
Advertising/Integrated Mktg Comm 1 1 0 0% 0 NA
Advertising/Integrated Mktg Comm 18 18 5 28% 5 100% $ 37,500
Business to Business Marketing 2 2 1 50% 0 0% NA
Data Mining 1 1 0 0% 0 NA
Direct Marketing 1 1 1 100% 0 0% NA
E-Commerce Marketing 2 2 0 0% 0 NA
Graphic Communication 2 2 0 0% 0 NA
Graphic Design 13 13 1 8% 0 0% NA
Graphic Design 14 14 5 36% 5 100% $ 44,750
Graphic Media Mgmt 7 7 3 43% 3 100% $ 32,435
Marketing 3 3 0 0% 0 NA
Marketing 32 32 4 13% 4 100% $ 41,888
Public Relations 2 2 0 0% 0 NA
Public Relations 9 9 1 11% 1 100% NA
SPORT, ENTERTAINMENT, & HOSPITALITY
Club Management 2 2 0 0% 0 NA
Culinary Management 4 4 0 0% 0 NA
Dietary & Food Svc Mgmt 1 1 0 0% 0 NA
Hotel Management 1 1 0 0% 0 NA
Hotel Management 9 9 2 22% 2 100% $ 30,496
Mktg/Professional Tennis Mgmt 3 3 0 0% 0 NA
Music Industry Management 55 55 11 20% 9 82% $ 20,286
Professional Golf Management 36 36 8 22% 8 100% $ 30,714
Professional Tennis Management 7 7 2 29% 2 100% NA
Resort Management 15 15 5 33% 5 100% $ 27,750
Restaurant and Food Ind Mgmt 3 3 1 33% 0 0% NA
Restaurant and Food Ind Mgmt 16 16 2 13% 2 100% NA
Special Event/Meeting Planning 1 1 0 0% 0 NA
Sport/Spa/Entertain Operations 1 1 0 0% 0 NA
Business TOTAL 116 61 556 35 13 781 238 30% 171 72% Not Calculated
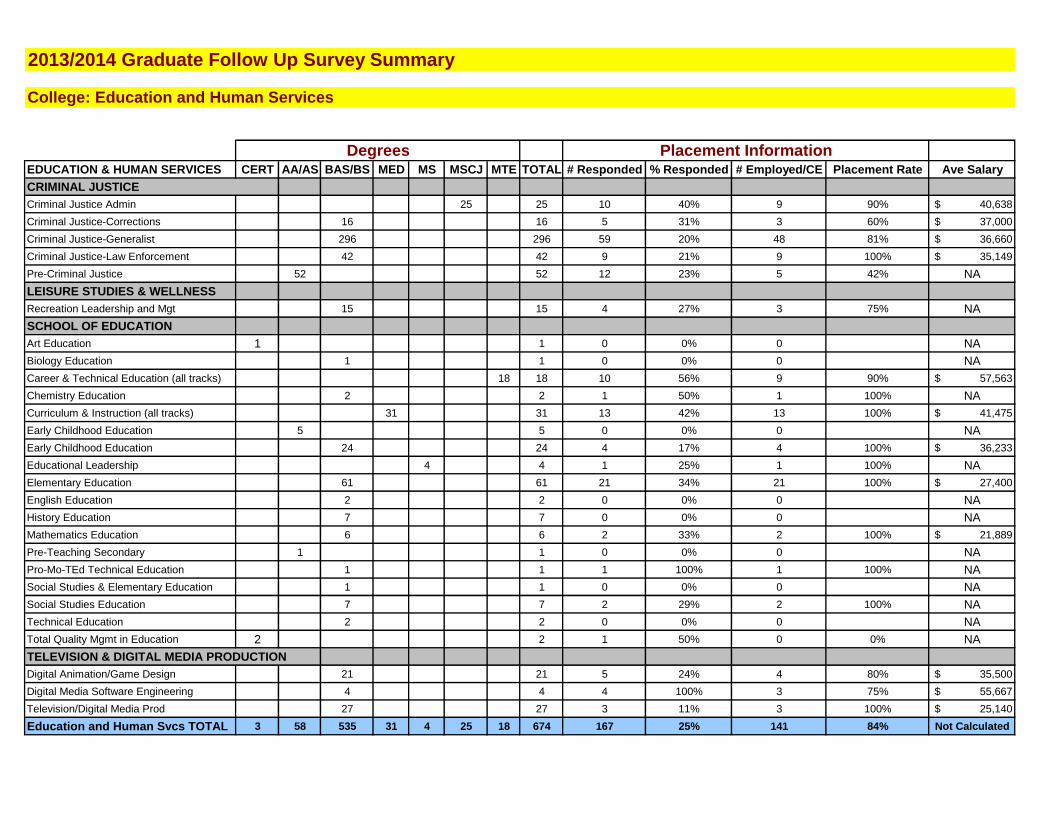
2013/2014 Graduate Follow Up Survey Summary
College: Education and Human Services
EDUCATION & HUMAN SERVICES CERT AA/AS BAS/BS MED MS MSCJ MTE TOTAL # Responded % Responded # Employed/CE Placement Rate Ave Salary
CRIMINAL JUSTICE
Criminal Justice Admin 25 25 10 40% 9 90% $ 40,638
Criminal Justice-Corrections 16 16 5 31% 3 60% $ 37,000
Criminal Justice-Generalist 296 296 59 20% 48 81% $ 36,660
Criminal Justice-Law Enforcement 42 42 9 21% 9 100% $ 35,149
Pre-Criminal Justice 52 52 12 23% 5 42% NA
LEISURE STUDIES & WELLNESS
Recreation Leadership and Mgt 15 15 4 27% 3 75% NA
SCHOOL OF EDUCATION
Art Education 1 1 0 0% 0 NA
Biology Education 1 1 0 0% 0 NA
Career & Technical Education (all tracks) 18 18 10 56% 9 90% $ 57,563
Chemistry Education 2 2 1 50% 1 100% NA
Curriculum & Instruction (all tracks) 31 31 13 42% 13 100% $ 41,475
Early Childhood Education 5 5 0 0% 0 NA
Early Childhood Education 24 24 4 17% 4 100% $ 36,233
Educational Leadership 4 4 1 25% 1 100% NA
Elementary Education 61 61 21 34% 21 100% $ 27,400
English Education 2 2 0 0% 0 NA
History Education 7 7 0 0% 0 NA
Mathematics Education 6 6 2 33% 2 100% $ 21,889
Pre-Teaching Secondary 1 1 0 0% 0 NA
Pro-Mo-TEd Technical Education 1 1 1 100% 1 100% NA
Social Studies & Elementary Education 1 1 0 0% 0 NA
Social Studies Education 7 7 2 29% 2 100% NA
Technical Education 2 2 0 0% 0 NA
Total Quality Mgmt in Education 2 2 1 50% 0 0% NA
TELEVISION & DIGITAL MEDIA PRODUCTION
Digital Animation/Game Design 21 21 5 24% 4 80% $ 35,500
Digital Media Software Engineering 4 4 4 100% 3 75% $ 55,667
Television/Digital Media Prod 27 27 3 11% 3 100% $ 25,140
Education and Human Svcs TOTAL 3 58 535 31 4 25 18 674 167 25% 141 84% Not Calculated
Placement InformationDegrees
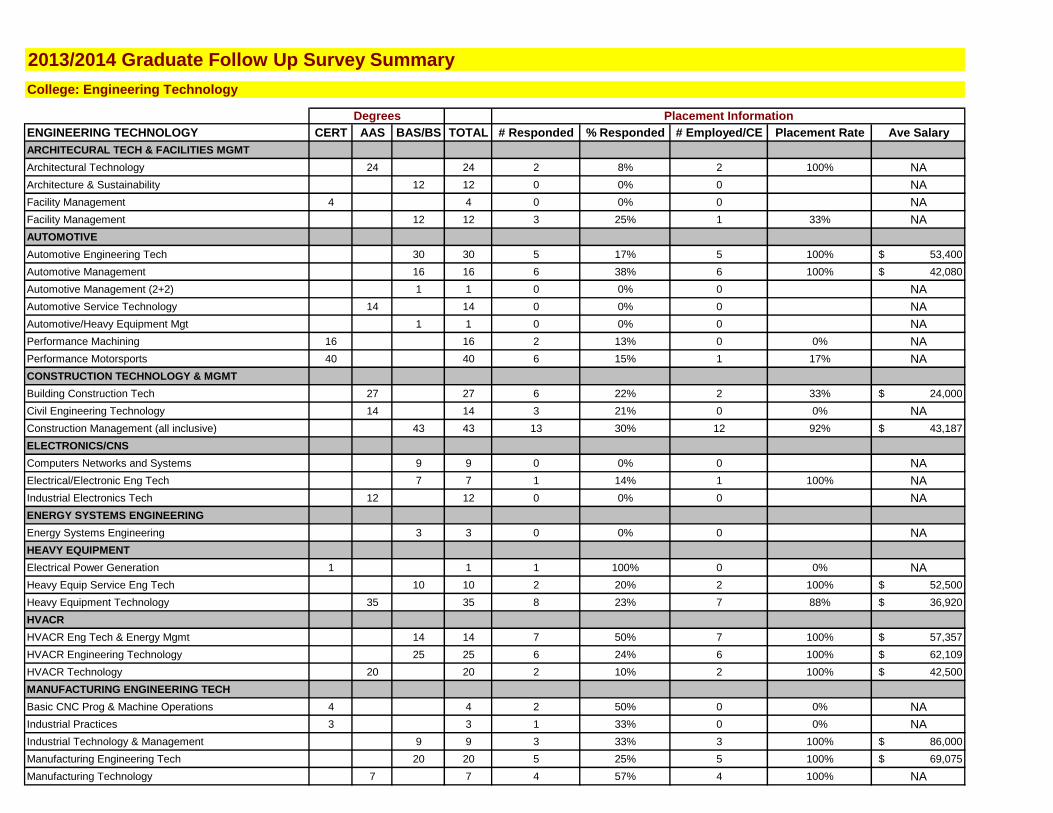
2013/2014 Graduate Follow Up Survey Summary
College: Engineering Technology
ENGINEERING TECHNOLOGY CERT AAS BAS/BS TOTAL # Responded % Responded # Employed/CE Placement Rate Ave Salary
ARCHITECURAL TECH & FACILITIES MGMT
Architectural Technology 24 24 2 8% 2 100% NA
Architecture & Sustainability 12 12 0 0% 0 NA
Facility Management 4 4 0 0% 0 NA
Facility Management 12 12 3 25% 1 33% NA
AUTOMOTIVE
Automotive Engineering Tech 30 30 5 17% 5 100% $ 53,400
Automotive Management 16 16 6 38% 6 100% $ 42,080
Automotive Management (2+2) 1 1 0 0% 0 NA
Automotive Service Technology 14 14 0 0% 0 NA
Automotive/Heavy Equipment Mgt 1 1 0 0% 0 NA
Performance Machining 16 16 2 13% 0 0% NA
Performance Motorsports 40 40 6 15% 1 17% NA
CONSTRUCTION TECHNOLOGY & MGMT
Building Construction Tech 27 27 6 22% 2 33% $ 24,000
Civil Engineering Technology 14 14 3 21% 0 0% NA
Construction Management (all inclusive) 43 43 13 30% 12 92% $ 43,187
ELECTRONICS/CNS
Computers Networks and Systems 9 9 0 0% 0 NA
Electrical/Electronic Eng Tech 7 7 1 14% 1 100% NA
Industrial Electronics Tech 12 12 0 0% 0 NA
ENERGY SYSTEMS ENGINEERING
Energy Systems Engineering 3 3 0 0% 0 NA
HEAVY EQUIPMENT
Electrical Power Generation 1 1 1 100% 0 0% NA
Heavy Equip Service Eng Tech 10 10 2 20% 2 100% $ 52,500
Heavy Equipment Technology 35 35 8 23% 7 88% $ 36,920
HVACR
HVACR Eng Tech & Energy Mgmt 14 14 7 50% 7 100% $ 57,357
HVACR Engineering Technology 25 25 6 24% 6 100% $ 62,109
HVACR Technology 20 20 2 10% 2 100% $ 42,500
MANUFACTURING ENGINEERING TECH
Basic CNC Prog & Machine Operations 4 4 2 50% 0 0% NA
Industrial Practices 3 3 1 33% 0 0% NA
Industrial Technology & Management 9 9 3 33% 3 100% $ 86,000
Manufacturing Engineering Tech 20 20 5 25% 5 100% $ 69,075
Manufacturing Technology 7 7 4 57% 4 100% NA
Degrees Placement Information
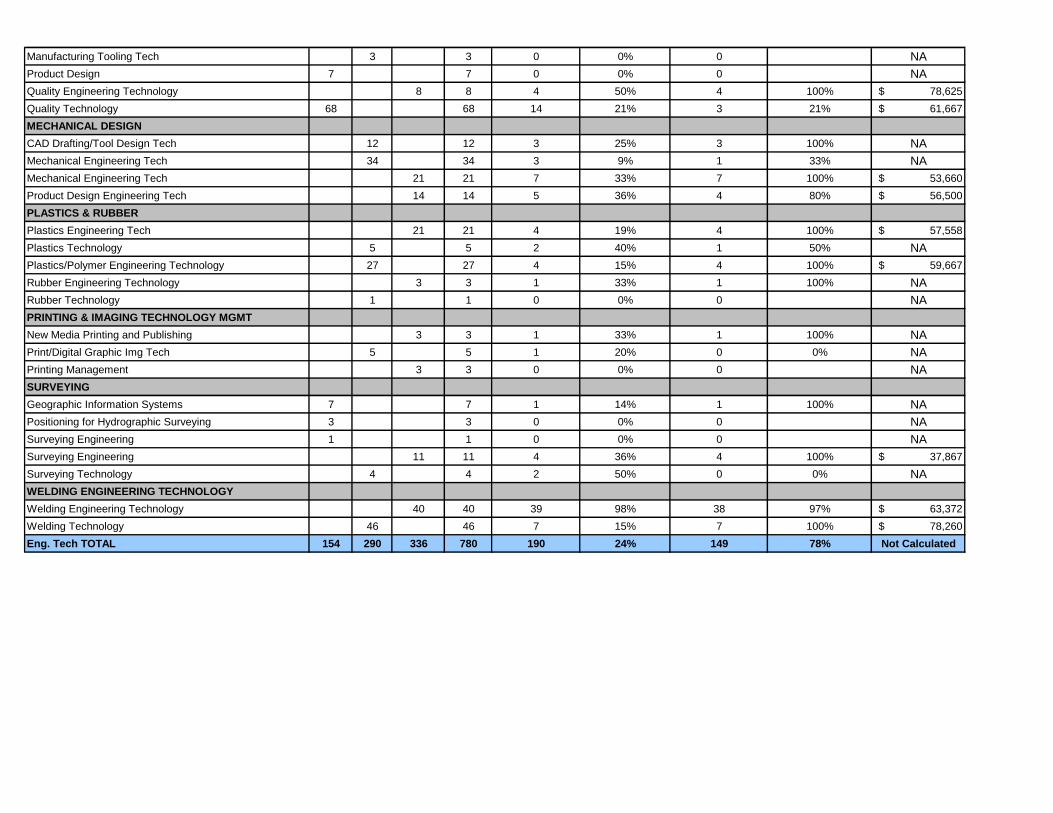
Manufacturing Tooling Tech 3 3 0 0% 0 NA
Product Design 7 7 0 0% 0 NA
Quality Engineering Technology 8 8 4 50% 4 100% $ 78,625
Quality Technology 68 68 14 21% 3 21% $ 61,667
MECHANICAL DESIGN
CAD Drafting/Tool Design Tech 12 12 3 25% 3 100% NA
Mechanical Engineering Tech 34 34 3 9% 1 33% NA
Mechanical Engineering Tech 21 21 7 33% 7 100% $ 53,660
Product Design Engineering Tech 14 14 5 36% 4 80% $ 56,500
PLASTICS & RUBBER
Plastics Engineering Tech 21 21 4 19% 4 100% $ 57,558
Plastics Technology 5 5 2 40% 1 50% NA
Plastics/Polymer Engineering Technology 27 27 4 15% 4 100% $ 59,667
Rubber Engineering Technology 3 3 1 33% 1 100% NA
Rubber Technology 1 1 0 0% 0 NA
PRINTING & IMAGING TECHNOLOGY MGMT
New Media Printing and Publishing 3 3 1 33% 1 100% NA
Print/Digital Graphic Img Tech 5 5 1 20% 0 0% NA
Printing Management 3 3 0 0% 0 NA
SURVEYING
Geographic Information Systems 7 7 1 14% 1 100% NA
Positioning for Hydrographic Surveying 3 3 0 0% 0 NA
Surveying Engineering 1 1 0 0% 0 NA
Surveying Engineering 11 11 4 36% 4 100% $ 37,867
Surveying Technology 4 4 2 50% 0 0% NA
WELDING ENGINEERING TECHNOLOGY
Welding Engineering Technology 40 40 39 98% 38 97% $ 63,372
Welding Technology 46 46 7 15% 7 100% $ 78,260
Eng. Tech TOTAL 154 290 336 780 190 24% 149 78% Not Calculated
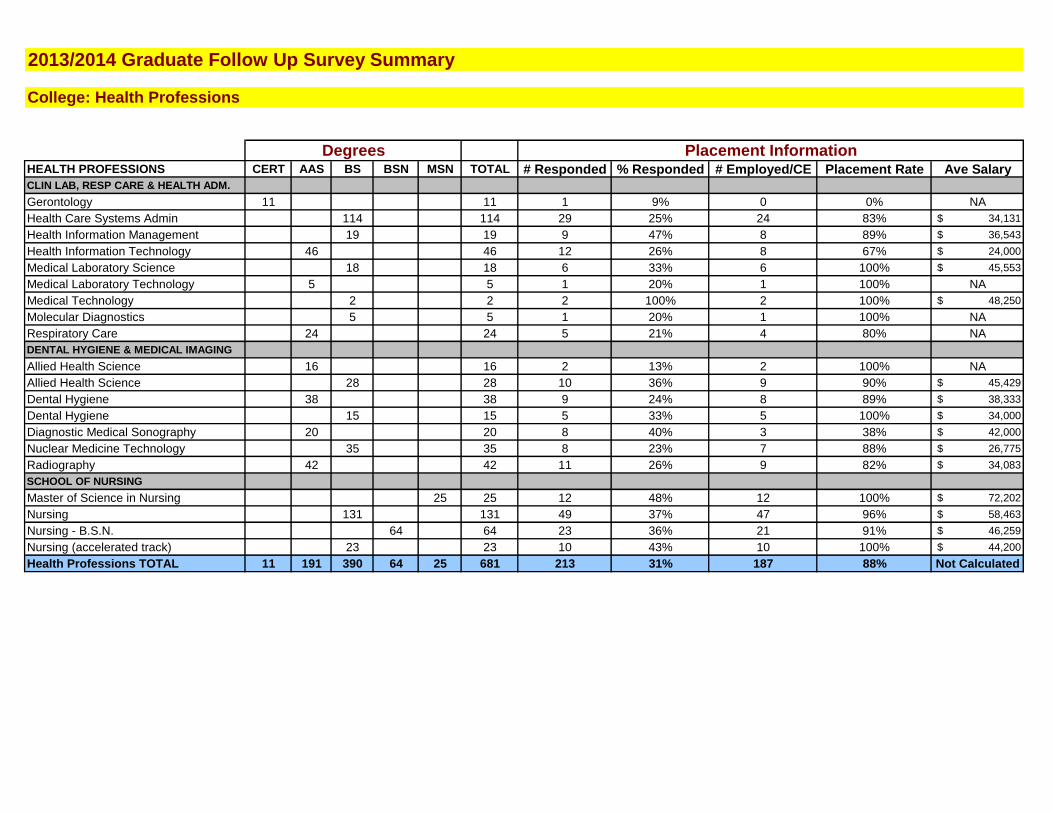
2013/2014 Graduate Follow Up Survey Summary
College: Health Professions
HEALTH PROFESSIONS CERT AAS BS BSN MSN TOTAL # Responded % Responded # Employed/CE Placement Rate Ave SalaryCLIN LAB, RESP CARE & HEALTH ADM.
Gerontology 11 11 1 9% 0 0% NA
Health Care Systems Admin 114 114 29 25% 24 83% $ 34,131
Health Information Management 19 19 9 47% 8 89% $ 36,543
Health Information Technology 46 46 12 26% 8 67% $ 24,000
Medical Laboratory Science 18 18 6 33% 6 100% $ 45,553
Medical Laboratory Technology 5 5 1 20% 1 100% NA
Medical Technology 2 2 2 100% 2 100% $ 48,250
Molecular Diagnostics 5 5 1 20% 1 100% NA
Respiratory Care 24 24 5 21% 4 80% NA
DENTAL HYGIENE & MEDICAL IMAGING
Allied Health Science 16 16 2 13% 2 100% NA
Allied Health Science 28 28 10 36% 9 90% $ 45,429
Dental Hygiene 38 38 9 24% 8 89% $ 38,333
Dental Hygiene 15 15 5 33% 5 100% $ 34,000
Diagnostic Medical Sonography 20 20 8 40% 3 38% $ 42,000
Nuclear Medicine Technology 35 35 8 23% 7 88% $ 26,775
Radiography 42 42 11 26% 9 82% $ 34,083
SCHOOL OF NURSING
Master of Science in Nursing 25 25 12 48% 12 100% $ 72,202
Nursing 131 131 49 37% 47 96% $ 58,463
Nursing - B.S.N. 64 64 23 36% 21 91% $ 46,259
Nursing (accelerated track) 23 23 10 43% 10 100% $ 44,200
Health Professions TOTAL 11 191 390 64 25 681 213 31% 187 88% Not Calculated
Degrees Placement Information
2013/2014 Graduate Follow Up Survey Summary
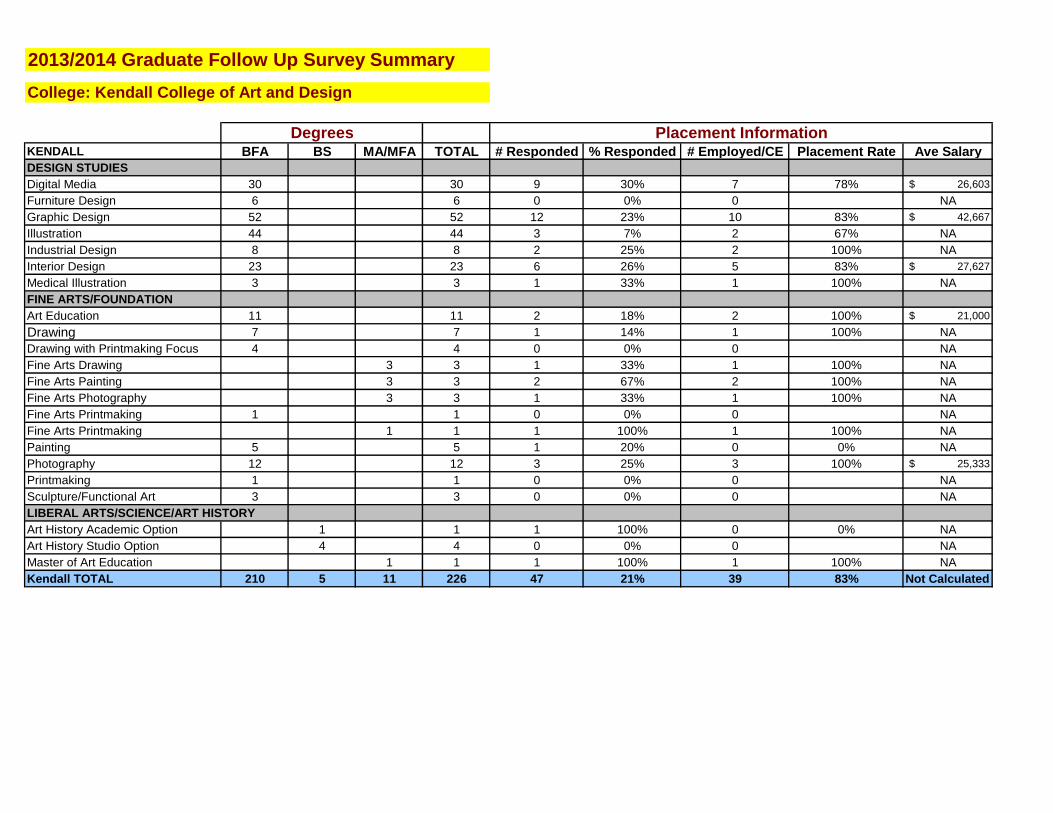
College: Kendall College of Art and Design
KENDALL BFA BS MA/MFA TOTAL # Responded % Responded # Employed/CE Placement Rate Ave Salary
DESIGN STUDIES
Digital Media 30 30 9 30% 7 78% $ 26,603
Furniture Design 6 6 0 0% 0 NA
Graphic Design 52 52 12 23% 10 83% $ 42,667
Illustration 44 44 3 7% 2 67% NA
Industrial Design 8 8 2 25% 2 100% NA
Interior Design 23 23 6 26% 5 83% $ 27,627
Medical Illustration 3 3 1 33% 1 100% NA
FINE ARTS/FOUNDATION
Art Education 11 11 2 18% 2 100% $ 21,000
Drawing 7 7 1 14% 1 100% NA
Drawing with Printmaking Focus 4 4 0 0% 0 NA
Fine Arts Drawing 3 3 1 33% 1 100% NA
Fine Arts Painting 3 3 2 67% 2 100% NA
Fine Arts Photography 3 3 1 33% 1 100% NA
Fine Arts Printmaking 1 1 0 0% 0 NA
Fine Arts Printmaking 1 1 1 100% 1 100% NA
Painting 5 5 1 20% 0 0% NA
Photography 12 12 3 25% 3 100% $ 25,333
Printmaking 1 1 0 0% 0 NA
Sculpture/Functional Art 3 3 0 0% 0 NA
LIBERAL ARTS/SCIENCE/ART HISTORY
Art History Academic Option 1 1 1 100% 0 0% NA
Art History Studio Option 4 4 0 0% 0 NA
Master of Art Education 1 1 1 100% 1 100% NA
Kendall TOTAL 210 5 11 226 47 21% 39 83% Not Calculated
Degrees Placement Information
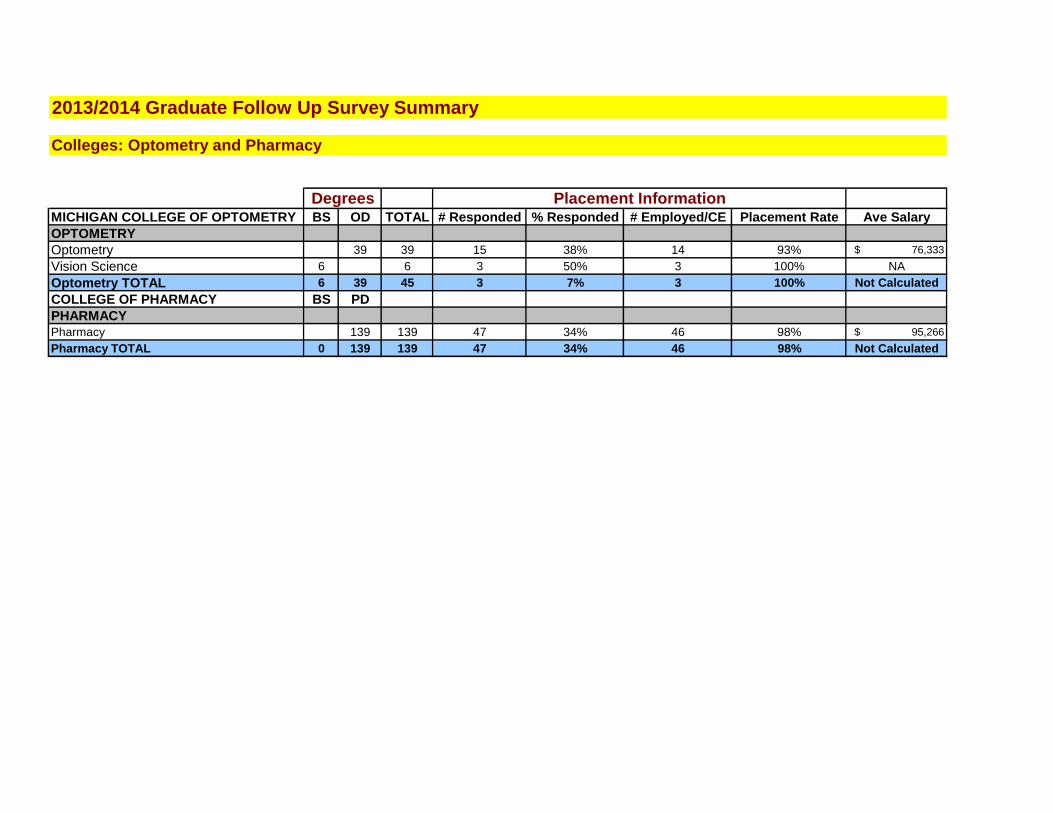
2013/2014 Graduate Follow Up Survey Summary
Colleges: Optometry and Pharmacy
MICHIGAN COLLEGE OF OPTOMETRY BS OD TOTAL # Responded % Responded # Employed/CE Placement Rate Ave Salary
OPTOMETRY
Optometry 39 39 15 38% 14 93% $ 76,333
Vision Science 6 6 3 50% 3 100% NA
Optometry TOTAL 6 39 45 3 7% 3 100% Not Calculated
COLLEGE OF PHARMACY BS PD
PHARMACY
Pharmacy 139 139 47 34% 46 98% $ 95,266
Pharmacy TOTAL 0 139 139 47 34% 46 98% Not Calculated
Degrees Placement Information
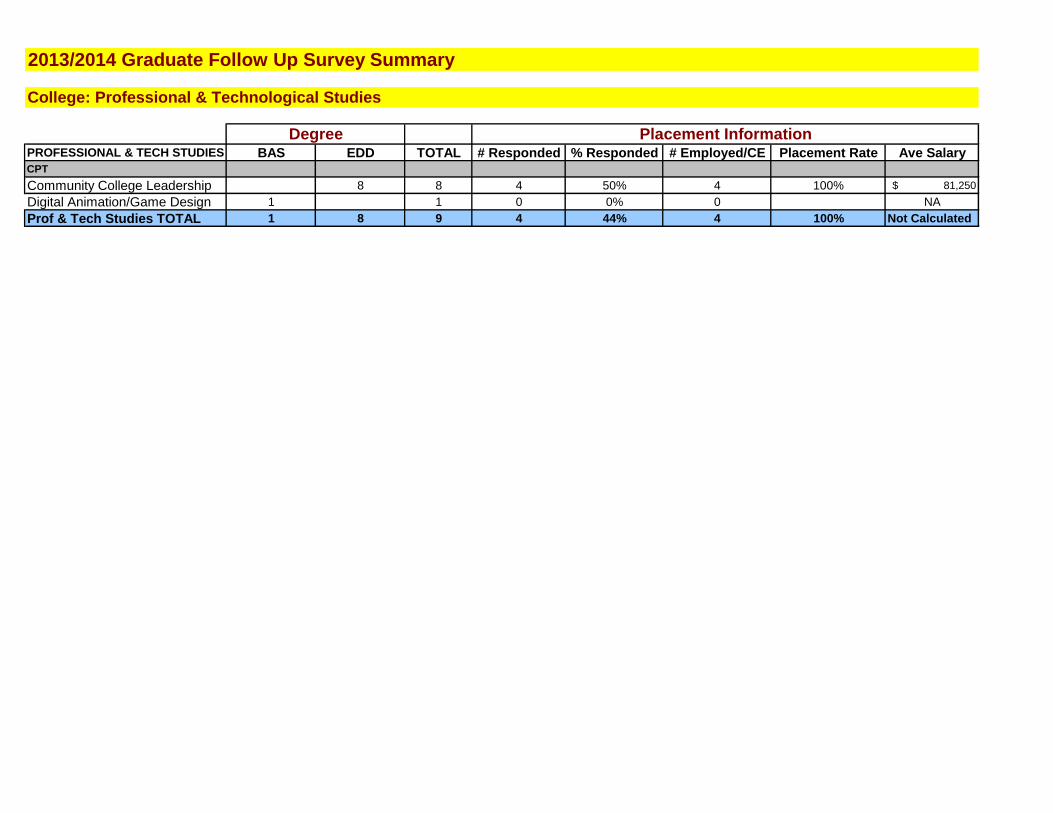
2013/2014 Graduate Follow Up Survey Summary
College: Professional & Technological Studies
PROFESSIONAL & TECH STUDIES BAS EDD TOTAL # Responded % Responded # Employed/CE Placement Rate Ave SalaryCPT
Community College Leadership 8 8 4 50% 4 100% $ 81,250
Digital Animation/Game Design 1 1 0 0% 0 NA
Prof & Tech Studies TOTAL 1 8 9 4 44% 4 100% Not Calculated
Placement InformationDegree
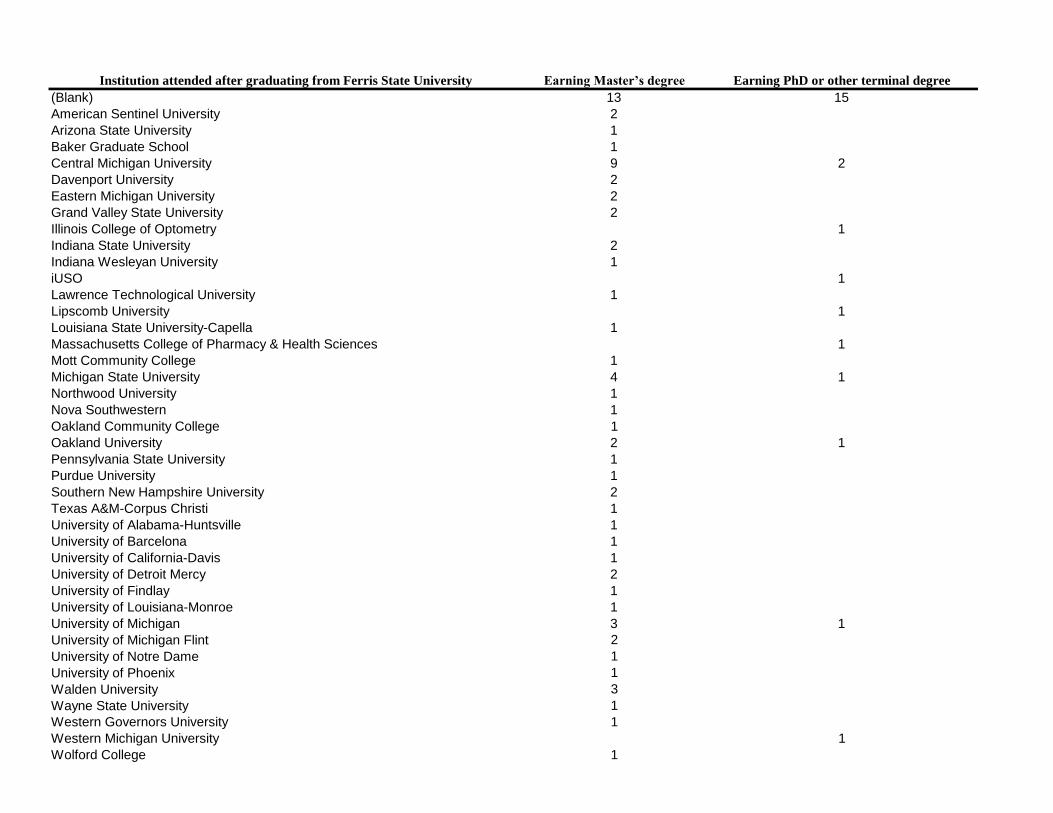
Institution attended after graduating from Ferris State University Earning Master’s degree Earning PhD or other terminal degree
(Blank) 13 15
American Sentinel University 2
Arizona State University 1
Baker Graduate School 1
Central Michigan University 9 2
Davenport University 2
Eastern Michigan University 2
Grand Valley State University 2
Illinois College of Optometry 1
Indiana State University 2
Indiana Wesleyan University 1
iUSO 1
Lawrence Technological University 1
Lipscomb University 1
Louisiana State University-Capella 1
Massachusetts College of Pharmacy & Health Sciences 1
Mott Community College 1
Michigan State University 4 1
Northwood University 1
Nova Southwestern 1
Oakland Community College 1
Oakland University 2 1
Pennsylvania State University 1
Purdue University 1
Southern New Hampshire University 2
Texas A&M-Corpus Christi 1
University of Alabama-Huntsville 1
University of Barcelona 1
University of California-Davis 1
University of Detroit Mercy 2
University of Findlay 1
University of Louisiana-Monroe 1
University of Michigan 3 1
University of Michigan Flint 2
University of Notre Dame 1
University of Phoenix 1
Walden University 3
Wayne State University 1
Western Governors University 1
Western Michigan University 1
Wolford College 1