inditex group consolidated annual accounts at … · inditex’s financial year and that of most of...
TRANSCRIPT

1
INDITEX GROUP
CONSOLIDATED ANNUAL ACCOUNTS
AT 31 JANUARY 2017
Translation of a report originally issued in Spanish
based on our work performed in accordance with the
audit regulations in force in Spain and of
consolidated annual accounts originally issued in
Spanish and prepared in accordance with the
regulatory financial reporting framework applicable
to the Group in Spain (see initial Note and Note 34).
In the event of a discrepancy, the Spanish-language
version prevails.


2
INDITEX GROUP CONSOLIDATED ANNUAL ACCOUNTS
AT 31 JANUARY 2017
I. CONSOLIDATED INCOME STATEMENT
II. CONSOLIDATED STATEMENT OF COMPREHENSIVE INCOME
III. CONSOLIDATED BALANCE SHEET
IV. CONSOLIDATED STATEMENT OF CASH FLOWS
V. CONSOLIDATED STATEMENT OF CHANGES IN EQUITY
VI. NOTES TO THE CONSOLIDATED ANNUAL ACCOUNTS
1. Activity and description of the Group
2. Selected accounting policies
2.1. Basis of consolidation
2.2. Accounting policies
a) Foreign currency translation
b) Property, plant and equipment
c) Rights over leased assets
d) Other intangible assets
e) Financial investments
f) Investment property
g) Impairment of non-current assets
h) Trade and other receivables
i) Inventories
j) Cash and cash equivalents
k) Current financial investments
l) Employee benefits
m) Provisions and contingent liabilities
n) Financial liabilities
o) Derivatives and hedging transactions
p) Revenue recognition
q) Leases
r) Finance income and costs
s) Income taxes
t) Current and non-current assets and liabilities
u) Treasury shares
3. Net sales
4. Cost of sales

3
5. Operating expenses
6. Other losses and income, net
7. Amortization and depreciation
8. Financial results
9. Earnings per share
10. Segment reporting
11. Trade and other receivables
12. Inventories
13. Property, plant and equipment
14. Investment property
15. Rights over leased assets and other intangible assets
16. Goodwill
17. Financial investments
18. Other non-current assets
19. Trade and other payables
20. Net financial position
21. Provisions
22. Other non-current liabilities
23. Capital and reserves
24. Income taxes
25. Operating leases
26. Financial risk management policy and financial instruments
27. Employee benefits
28. Jointly controlled entities
29. Proposed distribution of the profit of the Parent
30. Remuneration of the Board of Directors and related party transactions
31. External auditors
32. Environment
33. Events after the reporting period
34. Explanation added for translation to English
Appendix I - Composition of the Inditex Group

4
Translation of consolidated annual accounts originally issued in Spanish and prepared in accordance with the regulatory financial reporting framework applicable to the Group in Spain (see initial Note and Note 34). In the event of a discrepancy, the Spanish-language version prevails.
INDUSTRIA DE DISEÑO TEXTIL, S.A. AND SUBSIDIARY COMPANIES
CONSOLIDATED INCOME STATEMENT
(Amounts in thousands of euros)
(notes) 2016 2015
Net sales (3) 23,310,532 20,900,439
Cost of sales (4) (10,031,982) (8,811,139)
GROSS PROFIT 13,278,550 12,089,300
57.0% 57.8%
Operating expenses (5) (8,175,581) (7,391,832)
Other losses and income, net (6) (19,548) 1,691
GROSS OPERATING PROFIT (EBITDA) 5,083,420 4,699,159
Amortization and depreciation (7) (1,062,686) (1,021,717)
NET OPERATING PROFIT (EBIT) 4,020,734 3,677,442
Financial results (8) 9,997 10,069
Results of companies accounted for using the equity method (17) 47,588 55,607
PROFIT BEFORE TAXES 4,078,319 3,743,118
Income tax (24) (917,214) (860,917)
NET PROFIT 3,161,105 2,882,201
NET PROFIT ATTRIBUTABLE TO NON-CONTROLLING
INTERESTS 4,148 7,617
NET PROFIT ATTRIBUTABLE TO THE PARENT 3,156,957 2,874,584
BASIC AND DILUATED EARNINGS PER SHARE, euros (9) 1.014 0.923
5
Translation of consolidated annual accounts originally issued in Spanish and prepared in accordance with the regulatory financial reporting framework applicable to the Group in Spain (see initial Note and Note 34). In the event of a discrepancy, the Spanish-language version prevails.
INDUSTRIA DE DISEÑO TEXTIL, S.A. AND SUBSIDIARY COMPANIES
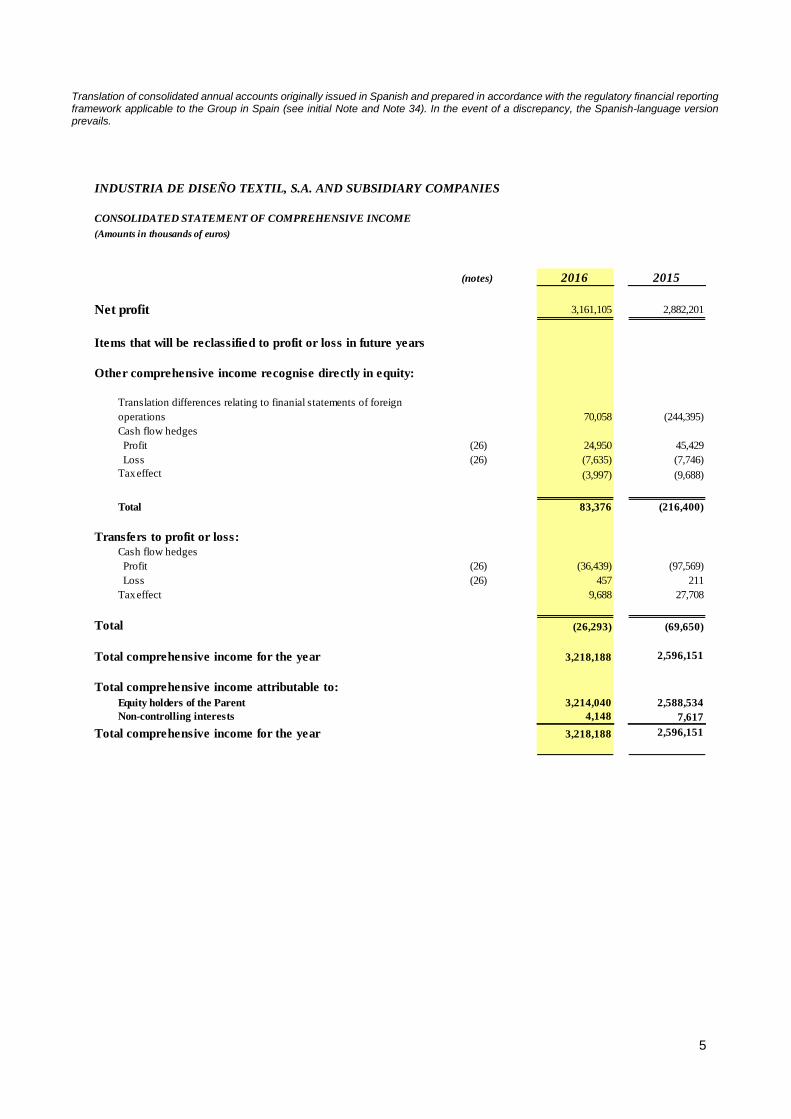
CONSOLIDATED STATEMENT OF COMPREHENSIVE INCOME
(Amounts in thousands of euros)
(notes) 2016 2015
Net profit 3,161,105 2,882,201
Items that will be reclassified to profit or loss in future years
Other comprehensive income recognise directly in equity:
Translation differences relating to finanial statements of foreign
operations 70,058 (244,395)
Cash flow hedges
Profit (26) 24,950 45,429
Loss (26) (7,635) (7,746)
Tax effect (3,997) (9,688)
Total 83,376 (216,400)
Transfers to profit or loss:
Cash flow hedges
Profit (26) (36,439) (97,569)
Loss (26) 457 211
Tax effect 9,688 27,708
Total (26,293) (69,650)
Total comprehensive income for the year 3,218,188 2,596,151
Total comprehensive income attributable to:
Equity holders of the Parent 3,214,040 2,588,534
Non-controlling interests 4,148 7,617
Total comprehensive income for the year 3,218,188 2,596,151
6
Translation of consolidated annual accounts originally issued in Spanish and prepared in accordance with the regulatory financial reporting framework applicable to the Group in Spain (see initial Note and Note 34). In the event of a discrepancy, the Spanish-language version prevails.
INDUSTRIA DE DISEÑO TEXTIL, S.A. AND SUBSIDIARY COMPANIES
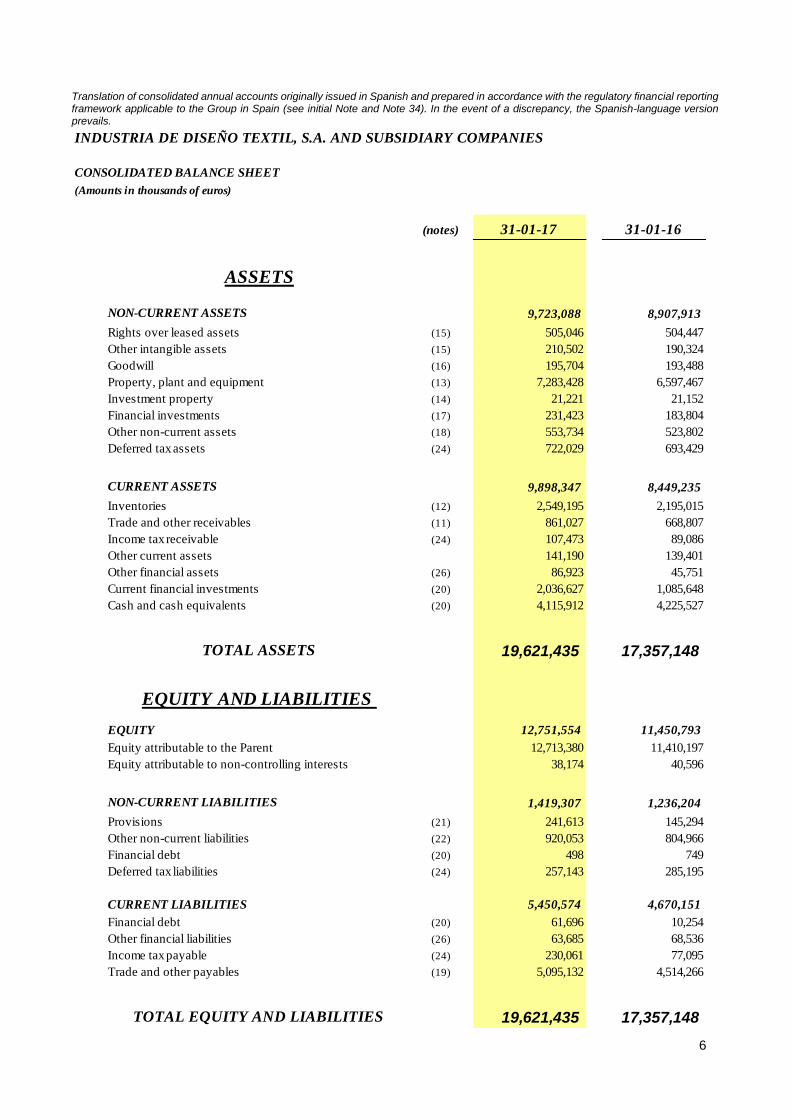
CONSOLIDATED BALANCE SHEET
(Amounts in thousands of euros)
(notes) 31-01-17 31-01-16
ASSETS
NON-CURRENT ASSETS 9,723,088 8,907,913
Rights over leased assets (15) 505,046 504,447
Other intangible assets (15) 210,502 190,324
Goodwill (16) 195,704 193,488
Property, plant and equipment (13) 7,283,428 6,597,467
Investment property (14) 21,221 21,152
Financial investments (17) 231,423 183,804
Other non-current assets (18) 553,734 523,802
Deferred tax assets (24) 722,029 693,429
CURRENT ASSETS 9,898,347 8,449,235
Inventories (12) 2,549,195 2,195,015
Trade and other receivables (11) 861,027 668,807
Income tax receivable (24) 107,473 89,086
Other current assets 141,190 139,401
Other financial assets (26) 86,923 45,751
Current financial investments (20) 2,036,627 1,085,648
Cash and cash equivalents (20) 4,115,912 4,225,527
TOTAL ASSETS 19,621,435 17,357,148
EQUITY AND LIABILITIES
EQUITY 12,751,554 11,450,793
Equity attributable to the Parent 12,713,380 11,410,197
Equity attributable to non-controlling interests 38,174 40,596
NON-CURRENT LIABILITIES 1,419,307 1,236,204
Provisions (21) 241,613 145,294
Other non-current liabilities (22) 920,053 804,966
Financial debt (20) 498 749
Deferred tax liabilities (24) 257,143 285,195
CURRENT LIABILITIES 5,450,574 4,670,151
Financial debt (20) 61,696 10,254
Other financial liabilities (26) 63,685 68,536
Income tax payable (24) 230,061 77,095
Trade and other payables (19) 5,095,132 4,514,266
TOTAL EQUITY AND LIABILITIES 19,621,435 17,357,148

7
Translation of consolidated annual accounts originally issued in Spanish and prepared in accordance with the regulatory financial reporting framework applicable to the Group in Spain (see initial Note and Note 34). In the event of a discrepancy, the Spanish-language version prevails.
2016 2015
Profit before taxes and non-controlling interest 4,078,319 3,743,118
Adjustments to profit-
Amortization and depreciation (7) 1,062,686 1,021,717
Foreign exchange translation differences (11,184) (15,717)
Provisions for impairment 52,136 15,269
Results of companies consolidated by equity method (17) (47,588) (55,607)
Other 69,297 165,935
Income tax (797,608) (977,349)
Funds from operations 4,406,058 3,897,366
Variation in assets and liabilities
Inventories (388,775) (425,134)
Receivables and other current assets (176,838) 187,222
Current payables 290,960 840,074
Changes in working capital (274,653) 602,162
Cash flows from operating activities 4,131,404 4,499,528
Payments relating to investments in intangible assets (173,034) (164,301)
Payments relating to investments in property, plant and equipment (1,258,523) (1,353,610)
Collections relating to investments in other financial investments 27,493 22,308
Payments relating to investments in other financial investments (12,538) -
Payments relating to investments in other assets (18) (52,749) (72,891)
Collections relating to investments in other assets (18) 24,424 16,422
Changes in current financial investments (951,375) (863,606)
Cash flows from investing activities (2,396,301) (2,415,678)
Payments relating to non-current financial debt (353) (2,929)
Payments relating to acquisitions of treasury shares (34,613) -
Changes in current financial debt 53,365 4,907
Dividends (1,871,456) (1,625,949)
Cash flows used in financing activities (1,853,058) (1,623,971)
Net increase in cash and cash equivalents (117,954) 459,879
Cash and cash equivalents at the beginning of the year (20) 4,225,527 3,797,930
Effect of exchange rate fluctuations on cash and cash equivalents 8,340 (32,282)
Cash and cash equivalents at the end of the year (20) 4,115,912 4,225,527

8
Translation of consolidated annual accounts originally issued in Spanish and prepared in accordance with the regulatory financial reporting framework applicable to the Group in Spain (see initial Note and Note 34). In the event of a discrepancy, the Spanish-language version prevails.
INDUSTRIA DE DISEÑO TEXTIL, S.A. AND SUBSIDIARY COMPANIES
CONSOLIDATED STATEMENT OF CHANGES IN EQUITY
(Amounts in thousands of euros)
CapitalShare
premium
Retained
earnings
Other
reserves
Reserves of
companies
accounted for
using the equity
method
Treasury
shares
Translation
differencesCash flows Subtotal
Non-controlling
interestsTotal equity
Balance at 1 February 2015 93,500 20,379 10,296,350 63,304 109,521 (73,354) (148,695) 69,650 10,430,655 38,046 10,468,701
Profit for the year - - 2,874,584 - - - - - 2,874,584 7,617 2,882,201
Distribution of results - - (32,125) - 32,125 - - - - - -
Distribution of dividends - - 10,415 - (10,415) - - - - - -
Other movements - - (4,411) - - - - - (4,411) 2,043 (2,368)
Other comprehensive income for the year - - - - - - (244,395) (41,655) (286,050) - (286,050)
Translation differences relating to finanial statements of foreign operations - - - - - - (244,395) - (244,395) - (244,395)
Cash flow hedges - - - - - - - (41,655) (41,655) - (41,655)
Operations with equity holders or owners - - (1,618,839) 14,259 - - - - (1,604,580) (7,110) (1,611,690)
Share-based payments - - - 14,259 - - - - 14,259 - 14,259
Dividends - - (1,618,839) - - - - - (1,618,839) (7,110) (1,625,949)
Balance at 31 January 2016 93,500 20,379 11,525,973 77,563 131,231 (73,354) (393,090) 27,995 11,410,197 40,596 11,450,793
Balance at 1 February 2016 93,500 20,379 11,525,973 77,563 131,231 (73,354) (393,090) 27,995 11,410,197 40,596 11,450,793
Profit for the year - - 3,156,957 - - - - - 3,156,957 4,148 3,161,105
Distribution of results - - (55,607) - 55,607 - - - - - -
Distribution of dividends - - 27,744 - (27,744) - - - - - -
Transfers - - (82,739) - - - 82,739 - - - -
Other movements - - (29,049) - 1,784 - - - (27,265) (3,304) (30,569)
Other comprehensive income for the year - - - - - - 70,058 (12,975) 57,083 - 57,083
Translation differences relating to finanial statements of foreign operations - - - - - - 70,058 - 70,058 - 70,058
Cash flow hedges - - - - - - - (12,975) (12,975) - (12,975)
Operations with equity holders or owners - - (1,868,190) (1,645) - (13,757) - - (1,883,592) (3,266) (1,886,858)
Treasury shares - - - - - (13,757) - - (13,757) - (13,757)
Additions relating to share-based payments - - - 16,929 - - - - 16,929 - 16,929
Exercise of share-based payments - - - (18,574) - - - - (18,574) - (18,574)
Dividends - - (1,868,190) - - - - - (1,868,190) (3,266) (1,871,456)
Balance at 31 January 2017 93,500 20,379 12,675,090 75,918 160,878 (87,111) (240,294) 15,020 12,713,380 38,174 12,751,554
Equity attributable to the Parent
9
Translation of consolidated annual accounts originally issued in Spanish and prepared in accordance with the regulatory
financial reporting framework applicable to the Group in Spain (see initial Note below and Note 34). In the event of a
discrepancy, the Spanish-language version prevails.
NOTES TO THE CONSOLIDATED ANNUAL ACCOUNTS OF THE INDITEX
GROUP AT 31 JANUARY 2017
The consolidated annual accounts of the Inditex Group for 2016 were prepared by the Board of Directors on
14 March 2017 and will be submitted for approval at the corresponding annual general shareholders’ meeting,
and it is considered that they will be approved without any changes. The consolidated annual accounts for
2015 were approved by the annual general shareholders' meeting held on 19 July 2016.
These annual accounts were prepared in accordance with the International Financial Reporting Standards
(IFRSs) and related interpretations (IFRICs and SICs) adopted by the European Union (EU-IFRSs) and the
other provisions of the applicable regulatory financial reporting framework.
Inditex’s financial year and that of most of its subsidiaries starts on 1 February of each year and ends on 31
January of the following year. The twelve-month period ended 31 January 2016 will hereinafter be referred to
as “2015”, the twelve-month period ended 31 January 2017 as “2016”, and so on.
Unless otherwise stated, the amounts shown in these consolidated annual accounts are expressed in
thousands of euros.
The consolidated annual accounts are presented in euros, since the euro is the Group’s functional currency.
The separate annual accounts of the Parent (Inditex) for 2016 were prepared by the Board of Directors in a
separate document to these consolidated annual accounts.
These consolidated annual accounts present fairly the equity and financial position of the Inditex Group at 31
January 2017, as well as the results of its operations, the changes in equity and the cash flows for the year then
ended.
The consolidated annual accounts of the Inditex Group for 2016 were prepared on the basis of the accounting
records of Inditex and the other Group companies.
The Group uses certain performance measures additional to those defined in IFRSs, since these measures
include information that is essential to assess the evolution of the Group.

10
In the consolidated income statement, gross profit, EBITDA and EBIT are defined as follows:
• Gross profit: the difference between net sales and the cost of sales. Notes 3 and 4 contain detailed
information on the items included in these consolidated income statement line items. The percentage
gross profit is calculated as the gross profit in absolute terms as a percentage of net sales.
• Gross operating profit (EBITDA): earnings before interest, the result of companies accounted for using
the equity method, taxes, depreciation and amortization, calculated as the gross profit less operating
expenses and other losses and income, net.
• Operating Income (EBIT): earnings before interest, the result of companies accounted for using the
equity method and taxes, calculated as EBITDA less amortization and depreciation.
Other alternative measures of performance are as follows:
• Return on capital employed (ROCE): defined as EBIT divided by average capital employed in the year
(average of equity attributable to the Parent plus net financial debt for the year).
• Return on equity attributable to the Parent (ROE), defined as net profit attributable to the Parent divided
by average shareholders' equity for the year.
In preparing the consolidated annual accounts at 31 January 2017 estimates were made in order to measure
certain of the assets, liabilities, income, expenses and obligations reported herein. These estimates relate
basically to the following:
• The assessment of possible impairment losses on certain assets.
• The useful life of the property, plant and equipment, intangible assets and investment property.
• The fair value of certain assets, mainly financial instruments.
• The assumptions used in the actuarial calculation of pension and other obligations to employees.
• The calculation of the provisions required for contingencies relating to litigation in progress and doubtful
debts.
• The term of leases.
• The amount of the future minimum non-cancellable operating lease payments.
• The recovery of deferred tax assets.
These estimates were made using the best information available at 31 January 2017 and 2016. However,
events that take place in the future might make it necessary to change these estimates. Changes in accounting
estimates would be applied prospectively in accordance with IAS 8.
The basis of consolidation and accounting policies applied are disclosed in Note 2.

11
1) Activity and description of the Group
Industria de Diseño Textil, S.A. (“Inditex”), domiciled in Spain (Avenida de la Diputación s/n Edificio Inditex,
Arteixo, A Coruña), is the Parent of a group of companies whose principal activity is the retail distribution of
fashion items, mainly clothing, footwear, accessories and household textile products. Inditex carries out its
activity through various commercial formats such as Zara, Pull & Bear, Massimo Dutti, Bershka, Stradivarius,
Oysho, Zara Home and Uterqüe. Inditex is listed on all four Spanish stock exchanges and, together with its
subsidiary companies, composes the Inditex Group (“the Group”).
Each format’s commercial activity is carried out through an integrated store and on-line model managed directly
by companies over which Inditex exercises control through the ownership of all or the majority of the share
capital and of the voting rights, with the exception of certain countries where, for various reasons, the retail
selling activity is performed through franchises. Certain franchise agreements entered into by the Group include
purchase options which, if exercised, would essentially enable the Group to have access to the lease rights
over the premises in which the franchised stores operate and the assets associated with these stores. These
options may be exercised after a certain period of time has elapsed since the signing of the franchise
agreement.
The Group does not have any significant non-controlling interests.
The Group holds joint ownership interests in the entities making up the Tempe Group. Based on an analysis
of the contractual arrangements giving it joint control, the Group classified its ownership interest in the Tempe
Group as a joint venture. The interest in the Tempe Group was accounted for using the equity method.
Inditex’s business model is characterized by the search for flexibility in adapting production to market demand
through control of the supply chain in the various stages of design, manufacture and distribution. This enables
it to focus both its own and suppliers’ production on changes in trends within each sales campaign.
The Group’s logistics system is based on continuous deliveries to stores, throughout each season, from the
distribution centers of the various commercial formats. This system essentially operates through centralized
logistics facilities for each of the concepts, at which inventory is stored and from which it is distributed to all the
stores worldwide.
At 31 January 2017, the various Group formats had stores in 93 different markets with the following
geographical distribution:

12
At 31 January 2016, the geographical distribution of stores was as follows:
The majority of company-managed store premises are held under operating leases. Information on the main
terms of the leases is provided in Note 25.
2) Selected accounting policies
2.1) Basis of consolidation
i) Subsidiaries
Subsidiaries are entities over which the Parent has control and, therefore, the power to govern their
financial and operating policies (see Note 1). Subsidiaries are consolidated by aggregating the total
amount of their assets, liabilities, income, expenses and cash flows, after making the adjustments and
eliminations relating to intra-Group transactions. The results of subsidiaries acquired during the year
are included in the consolidated annual accounts from the effective acquisition date. A detail of the
subsidiaries is provided in Appendix I. The identifiable assets acquired and liabilities and contingent
liabilities assumed in a business combination are stated at their acquisition-date fair values, provided
the acquisition took place after 1 January 2004, the date of transition to EU-IFRSs.
For business combinations subsequent to that date, any excess of the consideration transferred plus
the value assigned to non-controlling interests over the net amounts of the assets acquired and the
liabilities assumed is recognized as goodwill.
Number of stores
Company managed Franchises Total
Spain 1,748 39 1,787
Rest of Europe 3,073 155 3,228
Americas 578 165 743
Rest of the world 915 619 1,534
Total 6,314 978 7,292
Number of stores
Company managed Franchises Total
Spain 1,790 36 1,826
Rest of Europe 2,941 146 3,087
Americas 539 143 682
Rest of the world 835 583 1,418
Total 6,105 908 7,013

13
Any deficiency of the amount of the consideration transferred plus the value assigned to non-controlling
interests below the identifiable net assets acquired is recognized in profit or loss.
Acquisitions of equity interests in businesses subsequent to obtaining control and partial disposals that
do not result in a loss of control are recognized as transactions with shareholders in equity.
The non-controlling interests shown in the consolidated statement of changes in equity relate to non-
controlling interests in subsidiaries, and they are presented in consolidated equity separately from the
equity attributable to shareholders of the Parent.
The profit or loss and each component of other comprehensive income are allocated to the equity
attributable to shareholders of the Parent and to non-controlling interests in proportion to their relative
interests, even if this results in the non-controlling interests having a deficit balance. Agreements
entered into between the Group and non-controlling interests are recognized as a separate transaction.
The share of non-controlling interests of the equity and profit or loss of the subsidiaries is presented
under “Equity attributable to non-controlling interests” and “Net profit attributable to non-controlling
interests”, respectively. A detail of the subsidiaries is provided in Appendix I.
ii) Jointly controlled entities
Jointly controlled entities are those entities over whose activities the Group has joint control, established
by contractual arrangement. As indicated in Note 1, on the basis of the analysis performed of the
contractual arrangements, the Group classified these interests as a joint venture. Pursuant to IFRS 11,
Joint Arrangements, these entities are accounted for using the equity method in the consolidated annual
accounts.
iii) Harmonization of criteria
Each of the companies included in the consolidated Group prepares its annual accounts and other
accounting records in accordance with the corresponding accounting standards, based on the
legislation in force in the country of origin. Where these accounting and measurement criteria differ from
those adopted by the Inditex Group in preparing its consolidated annual accounts, they are adjusted in
order to present the consolidated annual accounts using uniform accounting policies.
iv) Intra-Group eliminations
All intra-Group receivables, payables and transactions, and any intra-Group gains or losses not yet
realized vis-à-vis third parties, are eliminated in the consolidation process.
v) Translation of annual accounts denominated in foreign currencies
The Group applied the exemption relating to cumulative translation differences envisaged in IFRS 1
First-time Adoption of International Financial Reporting Standards and, therefore, any translation
differences recognized in the consolidated annual accounts that were generated prior to 1 January
14
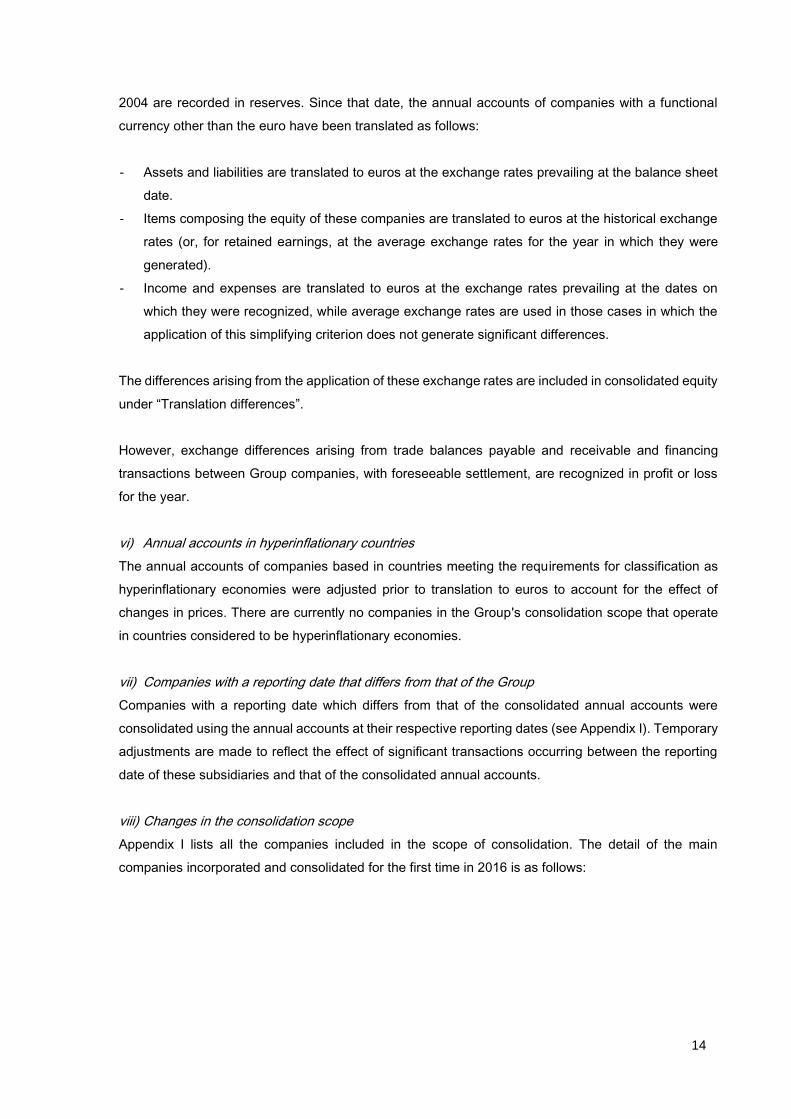
2004 are recorded in reserves. Since that date, the annual accounts of companies with a functional
currency other than the euro have been translated as follows:
- Assets and liabilities are translated to euros at the exchange rates prevailing at the balance sheet
date.
- Items composing the equity of these companies are translated to euros at the historical exchange
rates (or, for retained earnings, at the average exchange rates for the year in which they were
generated).
- Income and expenses are translated to euros at the exchange rates prevailing at the dates on
which they were recognized, while average exchange rates are used in those cases in which the
application of this simplifying criterion does not generate significant differences.
The differences arising from the application of these exchange rates are included in consolidated equity
under “Translation differences”.
However, exchange differences arising from trade balances payable and receivable and financing
transactions between Group companies, with foreseeable settlement, are recognized in profit or loss
for the year.
vi) Annual accounts in hyperinflationary countries
The annual accounts of companies based in countries meeting the requirements for classification as
hyperinflationary economies were adjusted prior to translation to euros to account for the effect of
changes in prices. There are currently no companies in the Group's consolidation scope that operate
in countries considered to be hyperinflationary economies.
vii) Companies with a reporting date that differs from that of the Group
Companies with a reporting date which differs from that of the consolidated annual accounts were
consolidated using the annual accounts at their respective reporting dates (see Appendix I). Temporary
adjustments are made to reflect the effect of significant transactions occurring between the reporting
date of these subsidiaries and that of the consolidated annual accounts.
viii) Changes in the consolidation scope
Appendix I lists all the companies included in the scope of consolidation. The detail of the main
companies incorporated and consolidated for the first time in 2016 is as follows:

15
Companies incorporated:
During the financial year, Massimo Dutti Puerto Rico INC has merged with Zara Puerto Rico INC, and
the company ITX Japan Corporation as merged with Zara Japan Corporation.
The inclusions in the consolidated Group referred to above did not have a material impact on equity in
the consolidated annual accounts for 2016.
2.2) Accounting policies
New standards and amendments applied in 2016
The following standards, amendments and interpretations recently came into force for all reporting
periods beginning on or after 1 January 2016:
- Clarification of Acceptable Methods of Depreciation and Amortization (Amendments to IAS 16,
Property, Plant and Equipment and IAS 38, Intangible Assets): These amendments clarify the
acceptable methods of depreciation and amortization of property, plant and equipment and
intangible assets.
- Accounting for Acquisitions of Interests in Joint Operations (Amendments to IFRS 11, Joint
Arrangements): The amendments provide guidance on the accounting for acquisitions of
interests in joint operations in which the activity constitutes a business.
- Improvements to IFRSs, 2012-2014 cycle - a series of minor amendments to the following
standards was introduced:
o IFRS 5, Non-Current Assets Held for Sale and Discontinued Operations.
o IFRS 7, Financial Instruments: Disclosures.
o IAS 19, Employee Benefits.
o IAS 34, Interim Financial Reporting.
- Equity Method in Separate Financial Statements (Amendments to IAS 27, Separate Financial
Statements): the amendments permit the use of the equity method in the separate financial
statements of an investor.
ZARA RETAIL NZ LIMITED
ZARA HOME SRB DOO BEOGRAD
UTERQÜE POLSKA SP. Z O.O.
MASSIMO DUTTI FINLAND OY
UTERQÜE KAZAKHSTAN LLP

16
- Disclosure Initiative (Amendments to IAS 1, Presentation of Financial Statements): the
amendments included clarifications in relation to disclosures (materiality, aggregation, order of
specific items within the Notes to the financial statements, etc.)
- Investment Entities: Applying the Consolidation Exception (Amendments to IFRS 10,
Consolidated Financial Statements, IFRS 11, Disclosure of Interests in Other Entities and IAS
28, Investments in Associates and Joint Ventures). The amendments introduce certain
clarifications on the consolidation exception for investment entities.
- Agriculture: Bearer Plants (Amendments to IAS 16, Property, Plant and Equipment and IAS
41, Agriculture). Bearer plants shall be measured at cost rather than at fair value.
The application of the aforementioned amendments and improvements did not give rise to a material
impact on the Group's annual accounts. Also, certain standards and amendments do not have an
impact due to their subject-matter (e.g. IAS 41, Agriculture).
Standards approved for use in the European Union
At the date of formal preparation of these consolidated annual accounts, the following standards and
interpretations with a potential impact on the Group had been issued by the IASB and adopted by the
European Union for their application in annual reporting periods beginning on or after 1 January 2018
(they were not applied early):
- IFRS 15, Revenue from Contracts with Customers, and the related clarifications. This standard,
which supersedes the current standards on revenue IAS 18, Revenue and IAS 11, Construction
Contracts and the interpretations issued (IFRIC 13, IFRIC 15, IFRIC 18 and SIC-31), establishes
a new model for revenue recognition based on the concept of control, whereby revenue is
recognized when (or as) the entity satisfies a performance obligation by transferring a promised
good or service to a customer. To this end, IFRS 15 introduces a five-step approach to the
recognition of revenue and more extensive disclosure requirements. Also, certain clarifications to
the standard issued by the IASB are yet to be adopted.
As detailed in Notes 1 and 3, the main activities for which the Group recognizes revenue are retail
sales through company-managed stores and online, franchises and other online channels. In a
preliminary assessment, Group management considered that the aforementioned activities
represent mainly the performance obligation to transfer certain goods to customers, revenue from
which is recognized at the point in time at which control over the aforementioned products is
transferred, which does not differ significantly from the current identification of independent price
components performed pursuant to IAS 18. Also, management does not expect the allocation of
the transaction price to the various performance obligations in each contract, where applicable,
17
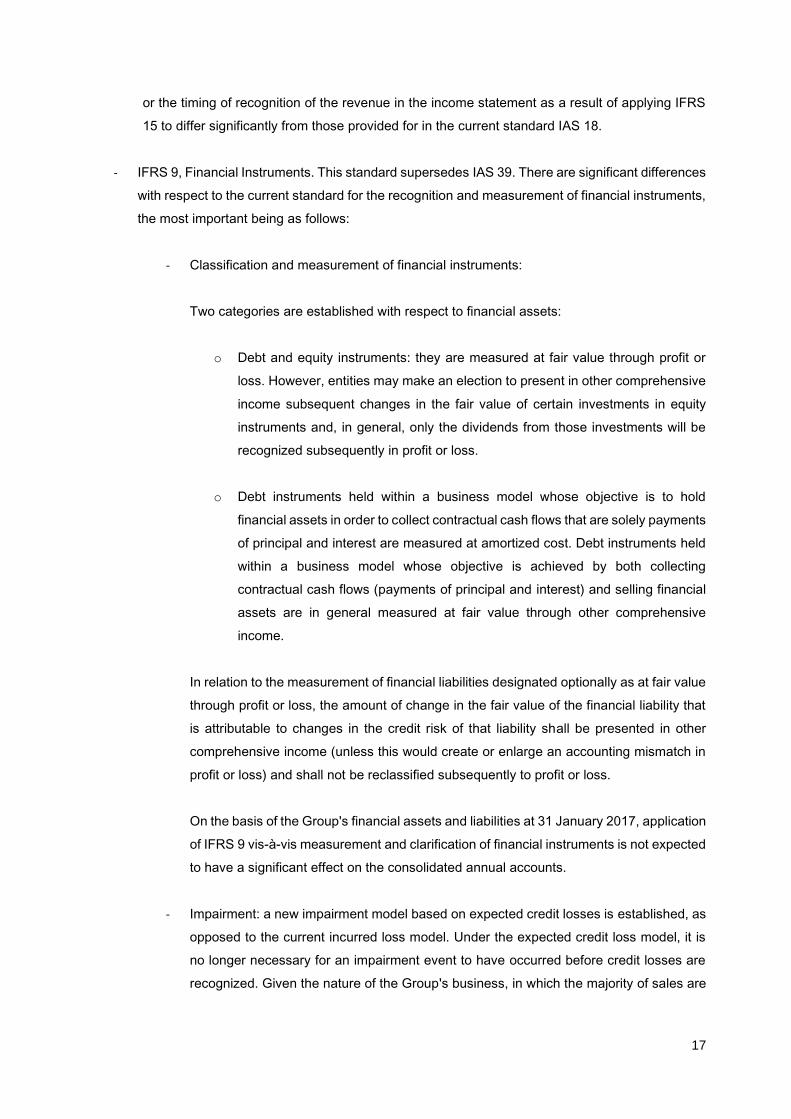
or the timing of recognition of the revenue in the income statement as a result of applying IFRS
15 to differ significantly from those provided for in the current standard IAS 18.
- IFRS 9, Financial Instruments. This standard supersedes IAS 39. There are significant differences
with respect to the current standard for the recognition and measurement of financial instruments,
the most important being as follows:
- Classification and measurement of financial instruments:
Two categories are established with respect to financial assets:
o Debt and equity instruments: they are measured at fair value through profit or
loss. However, entities may make an election to present in other comprehensive
income subsequent changes in the fair value of certain investments in equity
instruments and, in general, only the dividends from those investments will be
recognized subsequently in profit or loss.
o Debt instruments held within a business model whose objective is to hold
financial assets in order to collect contractual cash flows that are solely payments
of principal and interest are measured at amortized cost. Debt instruments held
within a business model whose objective is achieved by both collecting
contractual cash flows (payments of principal and interest) and selling financial
assets are in general measured at fair value through other comprehensive
income.
In relation to the measurement of financial liabilities designated optionally as at fair value
through profit or loss, the amount of change in the fair value of the financial liability that
is attributable to changes in the credit risk of that liability shall be presented in other
comprehensive income (unless this would create or enlarge an accounting mismatch in
profit or loss) and shall not be reclassified subsequently to profit or loss.
On the basis of the Group's financial assets and liabilities at 31 January 2017, application
of IFRS 9 vis-à-vis measurement and clarification of financial instruments is not expected
to have a significant effect on the consolidated annual accounts.
- Impairment: a new impairment model based on expected credit losses is established, as
opposed to the current incurred loss model. Under the expected credit loss model, it is
no longer necessary for an impairment event to have occurred before credit losses are
recognized. Given the nature of the Group's business, in which the majority of sales are

18
collected in cash and there are no material accounts receivable of another kind, the
impact of applying this new impairment model is not expected to be significant.
- Hedge accounting: IFRS 9 eases the rules for determining transactions that qualify for
hedge accounting and revises the rules of the hedge effectiveness test. Given that the
new hedge accounting requirements will be more closely aligned with the Group's risk
management policies, a preliminary assessment of the Group's current hedging
relationships indicates that they will meet the conditions to continue as hedging
relationships on application of IFRS 9. Application of IFRS 9 vis-à-vis hedge accounting
is not expected to have a significant impact on the consolidated annual accounts.
The aforementioned assessment was made by reference to an analysis of the Group's
financial assets and liabilities at 31 January 2017 and of the facts and circumstances that
existed at that date. Since the facts may change in the period until the date of initial application
of IFRS 9 (expected to be 1 February 2018, since the Group does not intend to apply the
standard early), the assessment of its potential effect is subject to change.
Standards issued but not yet approved for use in the European Union
At the date of preparation of these consolidated annual accounts, the following standards and
interpretations with a potential impact on the Group had been issued by the IASB but had not yet been
adopted by the European Union:
- Disclosure Initiative (Amendments to IAS 7, Statement of Cash Flows). Effective for annual
periods beginning on or after 1 January 2017, the amendments introduce new additional
disclosure requirements relating to the reconciliation of changes in financial liabilities to
cash flows from financing activities.
- Recognition of Deferred Tax Assets for Unrealised Losses (Amendments to IAS 12, Income
Taxes). Effective for annual periods beginning on or after 1 January 2017, the amendments
introduce clarifications to the principles established for the recognition of deferred tax
assets for unrealized losses on debt instruments measured at fair value.
- Classification and Measurement of Share-based Payment Transactions (Amendments to
IFRS 2, Share-based Payment). Effective for annual periods beginning on or after 1
January 2018, the amendments relate to specific issues concerning the classification and
measurement of share-based payment transactions.
- Applying IFRS 9, Financial Instruments with IFRS 4, Insurance Contracts (Amendments to
IFRS 4). Effective for annual periods beginning on or after 1 January 2018. The
19
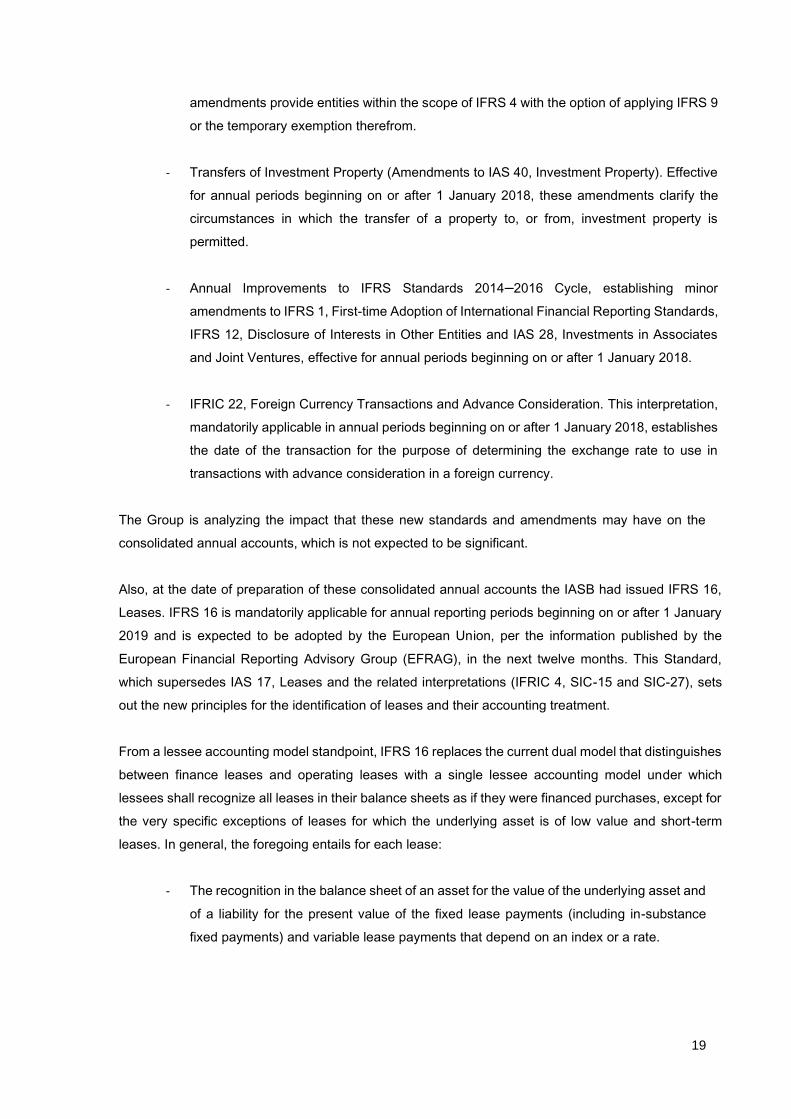
amendments provide entities within the scope of IFRS 4 with the option of applying IFRS 9
or the temporary exemption therefrom.
- Transfers of Investment Property (Amendments to IAS 40, Investment Property). Effective
for annual periods beginning on or after 1 January 2018, these amendments clarify the
circumstances in which the transfer of a property to, or from, investment property is
permitted.
- Annual Improvements to IFRS Standards 2014–2016 Cycle, establishing minor
amendments to IFRS 1, First-time Adoption of International Financial Reporting Standards,
IFRS 12, Disclosure of Interests in Other Entities and IAS 28, Investments in Associates
and Joint Ventures, effective for annual periods beginning on or after 1 January 2018.
- IFRIC 22, Foreign Currency Transactions and Advance Consideration. This interpretation,
mandatorily applicable in annual periods beginning on or after 1 January 2018, establishes
the date of the transaction for the purpose of determining the exchange rate to use in
transactions with advance consideration in a foreign currency.
The Group is analyzing the impact that these new standards and amendments may have on the
consolidated annual accounts, which is not expected to be significant.
Also, at the date of preparation of these consolidated annual accounts the IASB had issued IFRS 16,
Leases. IFRS 16 is mandatorily applicable for annual reporting periods beginning on or after 1 January
2019 and is expected to be adopted by the European Union, per the information published by the
European Financial Reporting Advisory Group (EFRAG), in the next twelve months. This Standard,
which supersedes IAS 17, Leases and the related interpretations (IFRIC 4, SIC-15 and SIC-27), sets
out the new principles for the identification of leases and their accounting treatment.
From a lessee accounting model standpoint, IFRS 16 replaces the current dual model that distinguishes
between finance leases and operating leases with a single lessee accounting model under which
lessees shall recognize all leases in their balance sheets as if they were financed purchases, except for
the very specific exceptions of leases for which the underlying asset is of low value and short-term
leases. In general, the foregoing entails for each lease:
- The recognition in the balance sheet of an asset for the value of the underlying asset and
of a liability for the present value of the fixed lease payments (including in-substance
fixed payments) and variable lease payments that depend on an index or a rate.

20
- The recognition in the income statement, over the lease term, of a depreciation charge
for the right-of-use asset and an interest expense relating to the amortized cost of the
lease liability.
As indicated in Note 1 to the consolidated annual accounts, the majority of the Group's company-
managed stores are located in commercial premises leased under operating leases, in relation to
which the Group recognized a lease expense and committed to certain future non-cancellable
minimum payments which are detailed in Note 25 to the consolidated annual accounts. At the date of
preparation of these consolidated annual accounts, the Group was adapting its reporting systems to
gather the necessary information on leases in order to recognise them in accordance with IFRS 16.
Also, at the date of preparation of these consolidated annual accounts, management was estimating
the impact that application of this new standard will have on the Group's consolidated annual accounts,
which, on the basis of the foregoing, is expected to be significant.
a) Translation of foreign currency balances and transactions
Foreign currency transactions are translated to euros by applying the exchange rates prevailing at the
date of the transaction. Monetary assets and liabilities denominated in foreign currencies are translated
to euros at the end of the reporting period using the closing rate. Exchange differences arising on
translating these items at those exchange rates are recognized in the income statement for the year as
financial results.
In presenting the consolidated statement of cash flows, cash flows arising from transactions in a foreign
currency are translated to euros by applying the exchange rates at the date of the cash flow. The effect
of exchange rate changes on cash and cash equivalents denominated in foreign currency is presented
separately in the consolidated statement of cash flows under “Effect of exchange rate fluctuations on
cash and cash equivalents”.
b) Property, plant and equipment
Items of property, plant and equipment are stated at cost, including any additional costs incurred until
the assets are ready for their intended use, less accumulated depreciation and any impairment losses
or write-downs that have to be recognized (see Note 2.2.g).
Depreciation is taken on a straight-line basis over the estimated useful lives of the assets.

21
The estimated average useful lives are as follows:
(*) In the case of assets located in leased premises, the depreciation rate is adapted to the estimated term of the lease if this is
shorter than the useful lives of the assets.
The Group reviews the residual values and useful lives of its property, plant and equipment at each
financial year-end. Any change in the initially established estimates is accounted for as a change in an
accounting estimate.
After initial recognition of an asset, only those costs that it is probable will give rise to future economic
benefits and that can be measured reliably are capitalized.
Periodic maintenance, upkeep and repair expenses are recognised in profit or loss as they are incurred.
c) Rights over leased assets
These rights, known as leasehold assignment rights, lease access or surrender premiums, relate to the
amounts paid for lease rights over premises for access to commercial premises, in which the acquirer
and new lessee is subrogated to the rights and obligations of the transferor and former lessee under
the previous lease.
Since these rights arose as a result of an acquisition for consideration, they were recognized as assets
in the accompanying consolidated balance sheet.
These assets are recognized at cost of acquisition. After initial recognition, they are stated at cost less
accumulated amortization and any impairment losses and are amortized on a straight-line basis over
the term of the lease contract, except when, for legal reasons, the rights do not lose value, in which
case they are determined to be intangible assets with indefinite useful lives and are therefore
systematically tested for impairment.
In order to assess the possible existence of impairment of these assets, the Group uses the procedures
described in Note 2.g., Impairment of non-current assets.
d) Other intangible assets
- Intellectual property: intellectual property is charged for the amounts paid for the acquisition of
title to or the right to use the related items, or for the expenses incurred in registration of the
rights developed by the Group. It is amortized on a straight-line basis over a maximum period
of ten years.
Asset description Useful life (years)
Buildings 25 to 50
Fixtures, furniture and machinery (*) 8 to 15
Other property, plant and equipment 4 to 13

22
- Computer software: software is stated at cost and is amortized on a straight-line basis over a
five-year period.
- Industrial designs: these items are reflected at their cost of production, which includes the cost
of samples, personnel costs and other directly or indirectly attributable costs, and are amortized
on a straight-line basis over an estimated useful life of two years.
The Group reviews the residual values and useful lives of its intangible assets at each financial
year-end. Any change in the initially established estimates would be accounted for as a change in
an accounting estimate.
e) Financial investments
Investments in companies over which the Group does not exercise significant influence are stated at
cost net of any impairment losses that have to be recognized.
f) Investment property
Investment property consists of assets held to generate rental income or for capital appreciation or
both, and is stated at cost of acquisition less accumulated depreciation and any impairment losses that
have to be recognized. Depreciation is calculated on a straight-line basis over the useful lives of the
corresponding assets (see Note 2.2.g).
A detail of the market value of investment property is shown in Note 14.
g) Impairment of non-current assets
The Group periodically assesses whether there are any indications that its non-current assets (including
goodwill and intangible assets with indefinite useful lives) might have become impaired, in order to
determine whether their recoverable amount is lower than their carrying amount (impairment loss). In
the case of goodwill and intangible assets with indefinite useful lives the impairment tests are performed
at least once a year, or more frequently if there are indications of impairment.
Impairment of non-current assets (property, plant and equipment and intangible assets) other than
goodwill and intangible assets with an indefinite useful life
The Group has developed a general, systematic procedure for carrying out these impairment tests
based on the monitoring of certain events or circumstances such as the performance of a store,
operating decisions regarding the continuity of a particular location, or other circumstances which
indicate that the value of an asset may not be recovered in full.

23
The recoverable amount of assets is the higher of fair value less costs to sell and value in use. Value
in use is determined on the basis of the expected future cash flows for the period in which these assets
are expected to generate revenue, expectations about possible variations in the amount or timing of
those future cash flows, the time value of money, the price for bearing the uncertainty inherent in the
asset, and other factors that market participants would consider in pricing the future cash flows to be
derived from the asset.
Recoverable amount is determined for each individual asset, unless the asset does not generate cash
inflows that are largely independent of those from other assets or groups of assets. If this is the case,
recoverable amount is determined for the cash-generating unit (CGU) to which the asset belongs.
Based on the actual management of operations, the Group has defined each of the commercial
premises in which it carries out its activities (stores) as basic cash-generating units, although these
basic units can be aggregated at concept-country level, or even at the level of all the companies located
in a given country. Group assets which are not clearly assignable under this structure (for example
industrial or logistics assets) are treated separately in a manner consistent with this general policy but
considering their specific nature.
The Group uses the budgets and business plans, which generally cover a period of between three and
five years, of the various cash-generating units to which the assets are assigned. The key assumptions
on which the budgets and business plans are based are estimated sales growth in comparable stores
and the evolution of the operating expenses and gross profit of each of the cash-generating units, based
on experience and knowledge of the trends in each of the markets in which the Group operates and on
the macroeconomic indicators that reflect the current and foreseeable economic situation for each
market.
The estimated cash flows are extrapolated to the period not covered by the business plan using a
growth rate and expense structure that are similar to those of the last year of the business plan in the
remaining term of the leases for the commercial premises or without any time limit in the case of
company-managed premises (perpetual return).
The discount rate applied is usually a pre-tax measure based on the risk-free rate for 10-year bonds
issued by the governments in the relevant markets (or similar instruments, if no 10-year bonds have
been issued), adjusted by a risk premium to reflect the increase in the risk of the investment per country
and the systematic risk of the Group.

24
The average discount rate, resulting from those applied by the Group in the various markets, used for
the purpose of calculating the present value of the estimated cash flows was as follows:
The results obtained from the 2016 impairment test performed on non-current assets (property, plant
and equipment and intangible assets) are shown in the tables of changes included in Notes 13 and 15
to the consolidated annual accounts relating to property, plant and equipment and rights over leased
assets and other intangible assets.
Also, the Group analysed the sensitivity of the result of the impairment test to the following changes in
assumptions:
- Increase of 100 basis points in the discount rate.
- 5% reduction in future cash flows.
These sensitivity analyses, performed separately for each of the aforementioned assumptions,
disclosed the potential existence of additional asset impairment amounting to Euros 1,761 thousand
and Euros 1,416 thousand, respectively (Euros 1,587 thousand and Euros 1,217 thousand,
respectively, in 2015).
Impairment of goodwill
Goodwill acquired through a business combination is allocated to the group of basic cash-generating
units aggregated at concept-country level, for the purpose of performing the related impairment tests.
This aggregation is made on the basis of:
- The degree of independence of the cash flows in each case.
- How the Group monitors the economic performance of its operations, and the model with which
its operations are conducted.
- The degree to which the CGUs are subject to the same macroeconomic circumstances.
- The level with which the goodwill would be naturally associated on the basis of the business
model.
In any case, this aggregation is never larger than an operating segment, as defined in IFRS 8.
Each year, or more often if there are indications of impairment, an impairment test is performed, using
the methodology described in the preceding point, with the exception that, since the CGU is the
acquiree, the cash flow analysis is performed considering a period of five years, after which perpetual
income is projected using a perpetuity growth rate of 2% with respect to the growth of the preceding
2016 Average 2015 Average
Americas 9.20% 9.55%
Asia and rest of the world 6.66% 6.85%
Spain 5.39% 5.79%
Rest of Europe 6.58% 6.84%
Total 7.05% 7.32%

25
period. The impairment tests for 2016 and 2015 did not give rise to the recognition of any impairment
loss on goodwill.
Also, the Group analysed the sensitivity of the result of the impairment test to the following changes in
assumptions:
- Increase of 100 basis points in the discount rate.
- Use of a perpetuity growth rate of 0%.
- 5% reduction in future cash flows.
These sensitivity analyses, performed separately for each of the aforementioned assumptions, did not
disclose the potential existence of any impairment in any of the cases.
Impairment of intangible assets with an indefinite useful life
Intangible assets with an indefinite useful life are assigned to each of the commercial premises where
the Group carries on its business activity (stores) and are included in the calculation of the impairment
of non-current assets, as explained above.
Reversals of impairment losses
Reversals of impairment losses on non-current assets are recognized with a credit to “Amortization and
depreciation” in the consolidated income statement, up to the limit of the carrying amount that the asset
would have had, net of depreciation or amortization, had the impairment loss never been recognized,
solely in those cases in which, once the internal and external factors have been assessed, it can be
concluded that the indications of impairment that led to the recognition of the impairment losses have
ceased to exist or have been partially reduced.
The reversal of an impairment loss for a cash-generating unit is allocated to the assets of the unit,
except for goodwill, pro rata with the carrying amounts of those assets and taking into account the limit
for the reversal referred to in the preceding paragraph.
An impairment loss recognized for goodwill must not be reversed in a subsequent period.
h) Trade and other receivables
Trade receivables are initially recognized at fair value. After initial recognition, they are stated at
amortized cost in accordance with the effective interest method, less any impairment losses recognized.
Impairment losses are recognized on trade receivables when there is objective evidence that the Group
will not be able to collect the entire amount owed by the debtor under the original terms governing the
accounts receivable. The amount of the impairment loss is the difference between the carrying amount
of the asset and the present value of the estimated future cash flows, discounted at the original interest
rate. The amount of the impairment loss is recognized in the income statement.
26
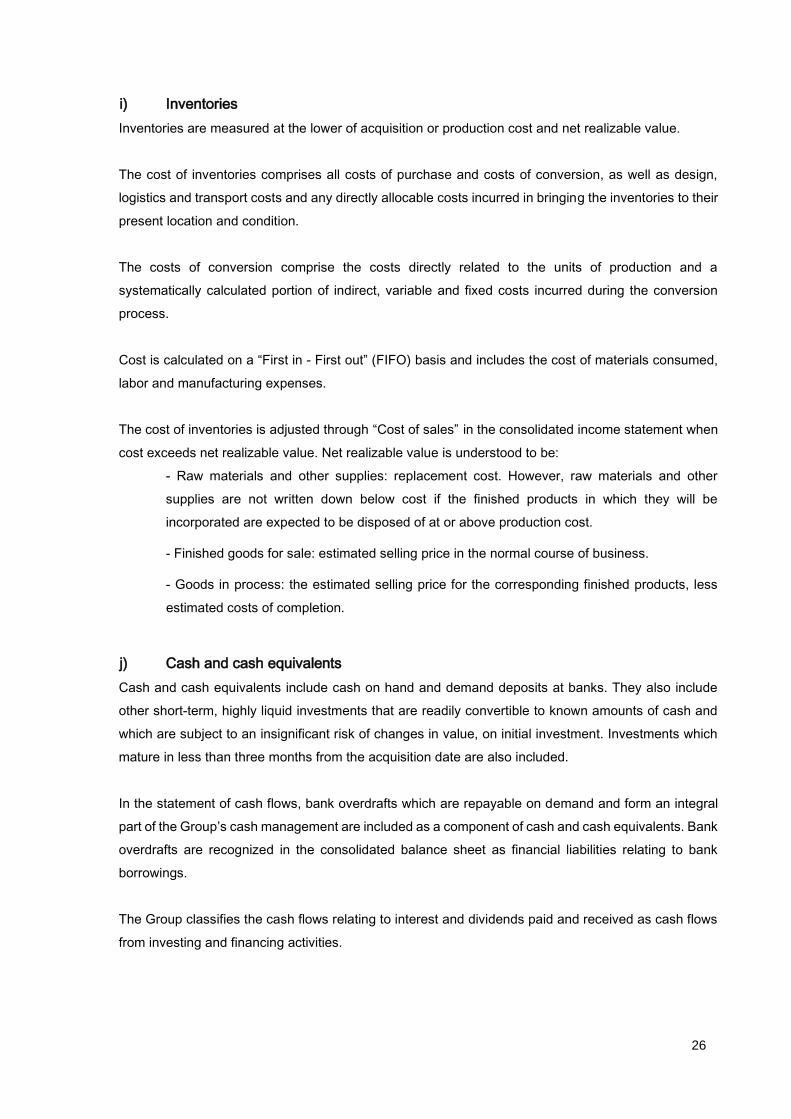
i) Inventories
Inventories are measured at the lower of acquisition or production cost and net realizable value.
The cost of inventories comprises all costs of purchase and costs of conversion, as well as design,
logistics and transport costs and any directly allocable costs incurred in bringing the inventories to their
present location and condition.
The costs of conversion comprise the costs directly related to the units of production and a
systematically calculated portion of indirect, variable and fixed costs incurred during the conversion
process.
Cost is calculated on a “First in - First out” (FIFO) basis and includes the cost of materials consumed,
labor and manufacturing expenses.
The cost of inventories is adjusted through “Cost of sales” in the consolidated income statement when
cost exceeds net realizable value. Net realizable value is understood to be:
- Raw materials and other supplies: replacement cost. However, raw materials and other
supplies are not written down below cost if the finished products in which they will be
incorporated are expected to be disposed of at or above production cost.
- Finished goods for sale: estimated selling price in the normal course of business.
- Goods in process: the estimated selling price for the corresponding finished products, less
estimated costs of completion.
j) Cash and cash equivalents
Cash and cash equivalents include cash on hand and demand deposits at banks. They also include
other short-term, highly liquid investments that are readily convertible to known amounts of cash and
which are subject to an insignificant risk of changes in value, on initial investment. Investments which
mature in less than three months from the acquisition date are also included.
In the statement of cash flows, bank overdrafts which are repayable on demand and form an integral
part of the Group’s cash management are included as a component of cash and cash equivalents. Bank
overdrafts are recognized in the consolidated balance sheet as financial liabilities relating to bank
borrowings.
The Group classifies the cash flows relating to interest and dividends paid and received as cash flows
from investing and financing activities.

27
k) Current financial investments
Current financial investments include bank deposits and investments in investment funds that are not
available at short term or that mature at between three and twelve months from acquisition and which
do not meet the requirements to be considered as cash equivalents.
The Group classifies cash flows relating to the amounts invested and received as cash flows from
investing activities.
l) Employee benefits
Obligations to Group personnel to be settled in the long term are estimated based on the dates on
which they vest through the application, where appropriate, of actuarial assumptions. The Group has
created a provision to cover the actuarial liability of the estimated portion vested at 31 January 2017.
The personnel expense accrued during the year is determined based on the best estimate of the degree
to which the conditions giving entitlement to payment have been met and the period that has elapsed
since the commencement of the vesting period for each of the obligations.
The personnel expenses incurred by the Company in relation to the beneficiaries of the plans referred
to in Note 27 to the consolidated annual accounts are recognized with a credit to liability and equity
accounts in the period in which the expenses are incurred.
m) Provisions and contingent liabilities
Provisions are recognized in the balance sheet when:
- the Group has a present obligation (legal or constructive) as result of a past event;
- it is probable that an outflow of resources embodying economic benefits will be required to
settle the obligation; and
- a reliable estimate can be made of the amount of the obligation.
Provisions are quantified on the basis of the best information available at the date of preparation of the
annual accounts and are reviewed at the end of each reporting period.
If it is no longer probable that an outflow of resources embodying economic benefits will be required to
settle the obligation, the provision is reversed. The provision is reversed against the consolidated
income statement item where the corresponding expense was recognized.
There are no risks that might give rise to significant future contingencies affecting the Group that have
not already been taken into account in these consolidated annual accounts.
The Group guarantees the debts of certain companies in the Netherlands, pursuant to the provisions
of Article 403.1, Book 2, Part 9 of the Civil Code of the Netherlands.

28
n) Financial liabilities
Financial liabilities, including trade and other payables, are initially recognized at fair value less any
transaction costs that are directly attributable to the issue of the financial liability. After initial recognition,
the Group’s financial liabilities are measured at amortized cost using the effective interest method.
o) Derivatives and hedging operations
Financial instruments acquired by the Group to hedge forecast transactions in foreign currencies are
initially recognized at fair value.
Foreign currency hedges relating to forecast transactions are treated as cash flow hedges, and
therefore any gains or losses derived from measuring the hedging instrument at fair value which
correspond to the effective portion of the hedge are recognized in equity. The ineffective portion is
charged to finance costs or credited to finance income, as appropriate.
Amounts recognized in equity are taken to income when the forecast transaction takes place with a
charge or credit to the income statement account in which it was recognized. Also, gains or losses
recognized in equity are reclassified to finance income or costs when the forecast transaction is no
longer expected to occur. The fair value of the hedges is recognized, depending on whether it is positive
or negative, under “Other financial assets” or “Other financial liabilities” in the accompanying
consolidated balance sheet.
In order for these financial instruments to qualify for hedge accounting, they are initially designated as
hedging instruments and the hedging relationship is documented. Also, the Group verifies, both at
inception and periodically over the term of the hedge, using “effectiveness tests”, that the hedging
relationship is effective, i.e. that it is prospectively foreseeable that the changes in the fair value or cash
flows of the hedged item (attributable to the hedged risk) will be almost fully offset
by those of the hedging instrument and that, retrospectively, the gain or loss on the hedge was within
a range of 80-125% of the gain or loss on the hedged item. Also, the ineffective portion of the hedging
instrument is recognized immediately in the consolidated income statement.
The fair value of the hedging instruments was calculated using valuation techniques based on the spot
exchange rate and yield curves, which are Level 1 and 2 inputs according to the fair value hierarchy
shown below:
Level 1
Fair value is calculated on the basis of quoted prices (unadjusted) in active markets for identical
assets or liabilities that the entity can access at the measurement date.
29
Level 2
Fair value is calculated on the basis of inputs other than quoted prices included within Level 1 that
are observable for the asset or liability, either directly or indirectly.
Level 3
Unobservable inputs for the asset or liability.
The Group does not have any assets or liabilities assigned to this hierarchical level.
The measurement methodology, based on the aforementioned hierarchy, is as follows:
Level 1 instruments
The Group assigns certain fixed-income securities to this level and measures them at the prices in
the active market in which they are traded.
Level 2 instruments
The Group assigns the assets and liabilities associated with its OTC derivative positions to this level
and measures them using observable market inputs.
Accordingly, the fair value of the hedging instruments arranged by the Group is calculated as follows:
Foreign currency forwards
Fair value measurement:
Foreign currency forwards are basically measured by comparing the contract strike price (agreed
delivery price) with the market forward rate for the maturity of the contract. Once the estimated future
settlement of the contract has been obtained based on the aforementioned comparison (in euros),
the settlement is discounted using the risk free zero coupon yield curve (or the interbank yield curve).
This risk free valuation is subsequently adjusted to include each party's credit risk, both the risk
corresponding to the counterparty (Credit Value Adjustment ("CVA") or counterparty default risk) and
own risk (Debit Value Adjustment ("DVA") or own default risk).
The CVA and the DVA are calculated by multiplying the estimated exposure by the probability of
default and the loss severity (which measures the loss given default). Where possible, the probability
of default and the assumed recoverable amount in the event of default are obtained from quoted
CDSs or from other observable market inputs. The CVA and the DVA calculations are netted for each
counterparty with which the entity has an ISDA master agreement providing for the netting of the
derivative positions in the event of default.

30
Cross-currency swaps
Fair value measurement:
Cross currency swaps are basically measured by discounting the future cash flows of each leg
of the derivative (swap) with the corresponding risk free yield curve (in the applicable currency).
Subsequently, the present value of the leg that is not denominated in euros is translated to euros
(using the current spot exchange rate) and the risk free value is calculated as the difference
between the present value of the receiving leg and the present value of the paying leg. The
discount curves are adjusted for the cross currency (basis) swap corresponding to the currency
pair.
The risk free portion is then adjusted to include the credit risk adjustment: both the CVA (Credit
Value Adjustment - counterparty default risk) and the DVA (Debit Value Adjustment - own default
risk).
The CVA and the DVA are calculated by multiplying the estimated exposure by the probability of
default and the loss severity (which measures the loss given default). Where possible, the
probability of default and the assumed recoverable amount in the event of default are obtained
from quoted CDSs or from other observable market inputs.
The CVA and the DVA calculations are netted for each counterparty with which the entity has an
ISDA master agreement providing for the netting of the derivative positions in the event of default.
Zero-premium option combinations
Fair value measurement:
Valuation of zero-premium options is based on a stochastic local volatility ("SLV") model using a
Monte Carlo simulation. The valuation depends on the implied volatility of the standard option
contracts as well as the dynamics of the implied volatilities. Fair value is a function of the stochastic
process that describes the behavior of the underlying's volatility parameter and of the weighted local
volatility component determined by the implied volatility surface.
Options purchased
Fair value measurement:
The determination of the fair value of the (plain vanilla) options is based on a modified version of the
Black-Scholes formula (Garman-Kohlhagen). Fair value is a function of the underlying's price, the

31
exercise price, the time to expiration and the volatility of the underlying. The credit risk adjustment is
performed using the spread method.
p) Revenue recognition
Sales of goods are recognized when substantially all the risks and rewards of ownership of the goods
are transferred, and they are presented net of actual and projected sales returns.
Sales of goods to franchises are recognized when the aforementioned conditions are met and when
revenue can be reliably determined and collection is considered probable.
Rental income is recognized on a straight-line basis over the term of the lease.
Revenue from royalties is recognized using the accrual principle based on the substance of the
contracts, provided that collection of the revenue is considered probable and its amount can be reliably
estimated.
q) Leases
Leases are classified as finance leases when they transfer substantially all the risks and rewards
inherent to ownership of the leased asset. All other leases are classified as operating leases.
Assets acquired through a finance lease are recognized as non-current assets at the lower of the
present value of the future lease payments and the fair value of the leased asset, while the
corresponding debt with the lessor is recognized as a liability. Lease payments are apportioned
between the reduction of the outstanding liability and the finance charge, which is recorded as a finance
cost for the year.
In the case of operating leases, non-contingent or fixed rent payments are recognized as an expense
on a straight-line basis over the term of the lease. Contingent rent is recognized as an expense in the
period in which payment is probable, as are fixed rent increases linked to the consumer price index.
Incentives received from shopping centre developers or owners of commercial premises (mainly
contributions to construction work and grace periods) are recognized as non-current liabilities under
“Other non-current liabilities - Lease incentives” and, in respect of the portion expected to be taken to
income in the following year, as current liabilities under “Trade and other payables”. They are credited
to profit or loss, as a reduction of the rental expense under “Other operating expenses”, on a straight-
line basis over the term of the respective lease contracts.
r) Finance income and costs
Interest income and interest expenses are recognized on an accrual basis using the effective interest
method. Dividend income is recognized when the right to receive payment is established.

32
s) Income tax
The income tax expense for the year comprises current tax and deferred tax. Current and deferred tax
is recognized as income or as an expense and included in net profit or loss for the period, except to the
extent that the tax arises from a transaction which is charged or credited, in the same or a different
period, directly to equity, or from a business combination.
Current tax is the tax expected to be paid or recovered in the year, using tax rates enacted or
substantially enacted at the balance sheet date, in respect of the current period, and any adjustment to
tax payable or recoverable in respect of prior periods.
Deferred tax is calculated using the balance sheet liability method, which provides for temporary
differences between the carrying amounts of assets and liabilities for financial reporting purposes and
the amounts used for tax purposes. Deferred tax liabilities are the amounts of income taxes payable in
the future in respect of taxable temporary differences, while deferred tax assets are the amounts of
income taxes recoverable in the future due to the existence of deductible temporary differences, tax
loss carryforwards or tax credit carryforwards.
The Group recognizes deferred tax assets and liabilities for temporary differences, except where they
relate to the initial recognition of an asset or liability in a transaction which is not a business combination
and which at the time of the transaction affected neither gross accounting profit nor taxable profit (tax
loss), or in the case of deferred tax liabilities, where the temporary differences relate to the initial
recognition of goodwill. Deferred tax liabilities are also recognized for temporary differences associated
with investments in subsidiaries, except to the extent that the Parent is able to control the timing of their
reversal and it is probable that the temporary differences will not reverse in the foreseeable future.
Deferred tax assets and liabilities are measured at the tax rates that are expected to apply to the period
when the asset is realized or the liability is settled, based on tax rates and tax laws that have been
enacted or substantially enacted by the balance sheet date, and reflecting the tax consequences that
would follow from the manner in which the Group expects to recover or settle the carrying amount of its
assets and liabilities.
Deferred tax assets are recognized to the extent that it is probable that future taxable profits will be
available against which the corresponding unused tax losses or tax credits can be utilized. Deferred tax
assets, whether recognized or not, are reviewed at each balance sheet date.
The Group only offsets current tax assets and liabilities if it has a legally enforceable right to set off the
recognized amounts and intends either to settle on a net basis, or to realize the asset and settle the
liability simultaneously.
Deferred tax assets and liabilities are recognized in the consolidated balance sheet under non-current
assets and liabilities, irrespective of the expected date of realization or settlement.
33
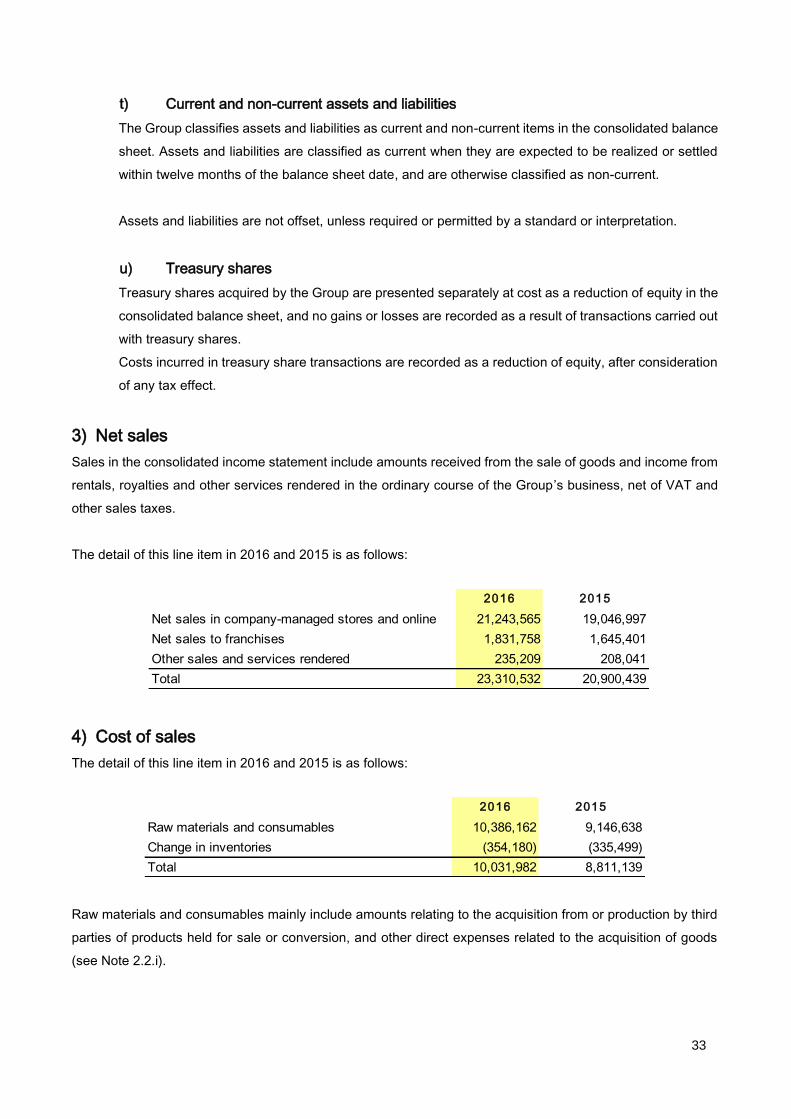
t) Current and non-current assets and liabilities
The Group classifies assets and liabilities as current and non-current items in the consolidated balance
sheet. Assets and liabilities are classified as current when they are expected to be realized or settled
within twelve months of the balance sheet date, and are otherwise classified as non-current.
Assets and liabilities are not offset, unless required or permitted by a standard or interpretation.
u) Treasury shares
Treasury shares acquired by the Group are presented separately at cost as a reduction of equity in the
consolidated balance sheet, and no gains or losses are recorded as a result of transactions carried out
with treasury shares.
Costs incurred in treasury share transactions are recorded as a reduction of equity, after consideration
of any tax effect.
3) Net sales
Sales in the consolidated income statement include amounts received from the sale of goods and income from
rentals, royalties and other services rendered in the ordinary course of the Group’s business, net of VAT and
other sales taxes.
The detail of this line item in 2016 and 2015 is as follows:
4) Cost of sales
The detail of this line item in 2016 and 2015 is as follows:
Raw materials and consumables mainly include amounts relating to the acquisition from or production by third
parties of products held for sale or conversion, and other direct expenses related to the acquisition of goods
(see Note 2.2.i).
2016 2015
Net sales in company-managed stores and online 21,243,565 19,046,997
Net sales to franchises 1,831,758 1,645,401
Other sales and services rendered 235,209 208,041
Total 23,310,532 20,900,439
2016 2015
Raw materials and consumables 10,386,162 9,146,638
Change in inventories (354,180) (335,499)
Total 10,031,982 8,811,139
34
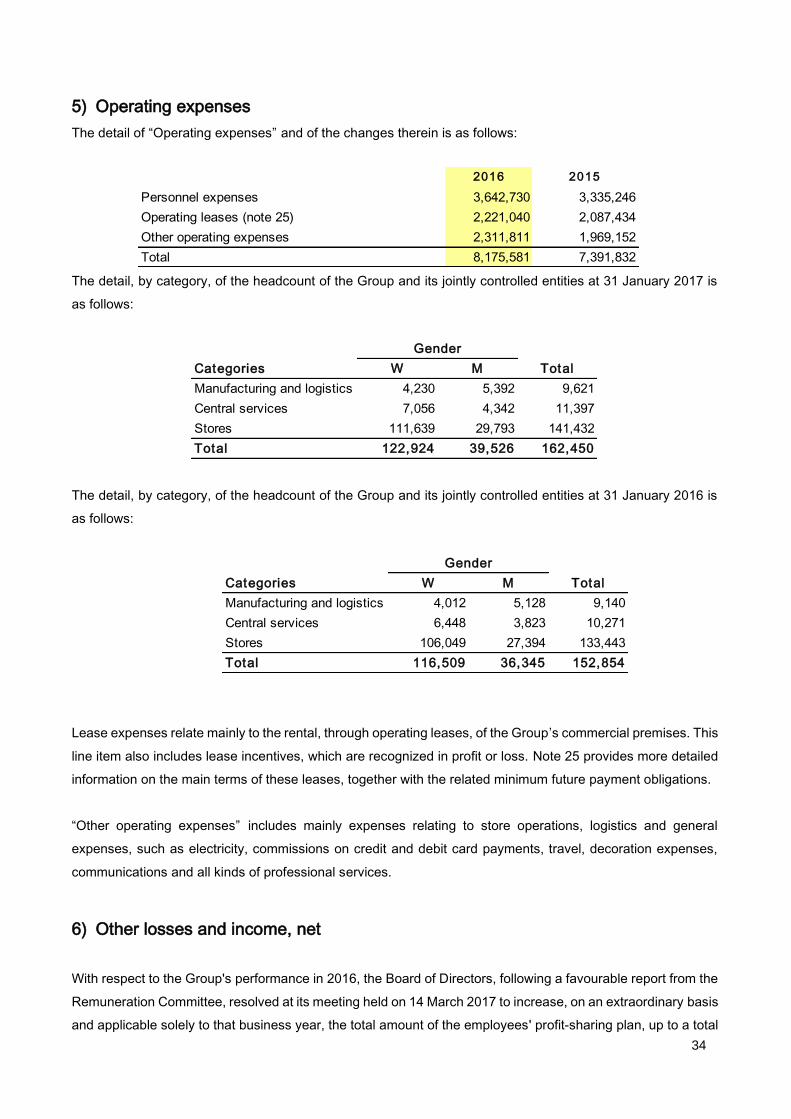
5) Operating expenses
The detail of “Operating expenses” and of the changes therein is as follows:
The detail, by category, of the headcount of the Group and its jointly controlled entities at 31 January 2017 is
as follows:
The detail, by category, of the headcount of the Group and its jointly controlled entities at 31 January 2016 is
as follows:
Lease expenses relate mainly to the rental, through operating leases, of the Group’s commercial premises. This
line item also includes lease incentives, which are recognized in profit or loss. Note 25 provides more detailed
information on the main terms of these leases, together with the related minimum future payment obligations.
“Other operating expenses” includes mainly expenses relating to store operations, logistics and general
expenses, such as electricity, commissions on credit and debit card payments, travel, decoration expenses,
communications and all kinds of professional services.
6) Other losses and income, net
With respect to the Group's performance in 2016, the Board of Directors, following a favourable report from the
Remuneration Committee, resolved at its meeting held on 14 March 2017 to increase, on an extraordinary basis
and applicable solely to that business year, the total amount of the employees' profit-sharing plan, up to a total
2016 2015
Personnel expenses 3,642,730 3,335,246
Operating leases (note 25) 2,221,040 2,087,434
Other operating expenses 2,311,811 1,969,152
Total 8,175,581 7,391,832
Gender
Categories W M Total
Manufacturing and logistics 4,230 5,392 9,621
Central services 7,056 4,342 11,397
Stores 111,639 29,793 141,432
Total 122,924 39,526 162,450
Gender
Categories W M Total
Manufacturing and logistics 4,012 5,128 9,140
Central services 6,448 3,823 10,271
Stores 106,049 27,394 133,443
Total 116,509 36,345 152,854
35
of Euros 42,000 thousand, and recognized Euros 14,000 thousand under this heading in relation to the excess
over the amount corresponding to 10% of the growth in profit. The characteristics of this plan are described in
Note 27, Employee benefits.
Also, this heading includes changes in the prices of the debts recognized as a result of the existence of cross
call and put options between the Group and the owners of some of the shares of certain of the subsidiaries,
since these cross options are considered to be a deferred acquisition of the shares constituting the underlying.
The estimated option strike price is recognized as a liability and changes are recognized in profit or loss.
Following is a description of the main cross put and call options on those investments:
a) Subsidiaries domiciled in Mexico
The Group holds a call option on 5% of the share capital of Zara México, S.A. de C.V. owned by a non-
controlling shareholder. The strike price is set on the basis of the non-controlling shareholder’s share of the
equity of the investee when the call option is exercised.
b) Subsidiaries domiciled in Korea
The Group holds a call option on 20% of the share capital of Zara Retail Korea, Ltd. This ownership interest is
held by Lotte Shopping Co., Ltd., which in turn holds an option to sell the full amount of this holding to Industria
de Diseño Textil, S.A. The strike price is set on the basis of the shareholder’s share of the equity of the investee
when the call option is exercised.
c) Subsidiaries domiciled in South Africa
The Group holds a call option on 10% of the share capital of ITX Fashion Retail South Africa (Proprietary), LTD.
This ownership interest is held by Peter Vundla Retail (Propietary), LTD, which in turn holds an option to sell
the full amount of this holding to Industria de Diseño Textil, S.A. The strike price is set on the basis of the
shareholder’s share of the equity of the investee when the call option is exercised.
d) Subsidiaries domiciled in Australia
The Group holds a call option on 10% of the share capital of Group Zara Australia, PTY. LTD. This ownership
interest is held by International Brand Management, PTY. LTD., which in turn holds an option to sell the full
amount of this holding to Industria de Diseño Textil, S.A. The strike price is set on the basis of the shareholder’s
share of the equity of the investee when the call option is exercised.
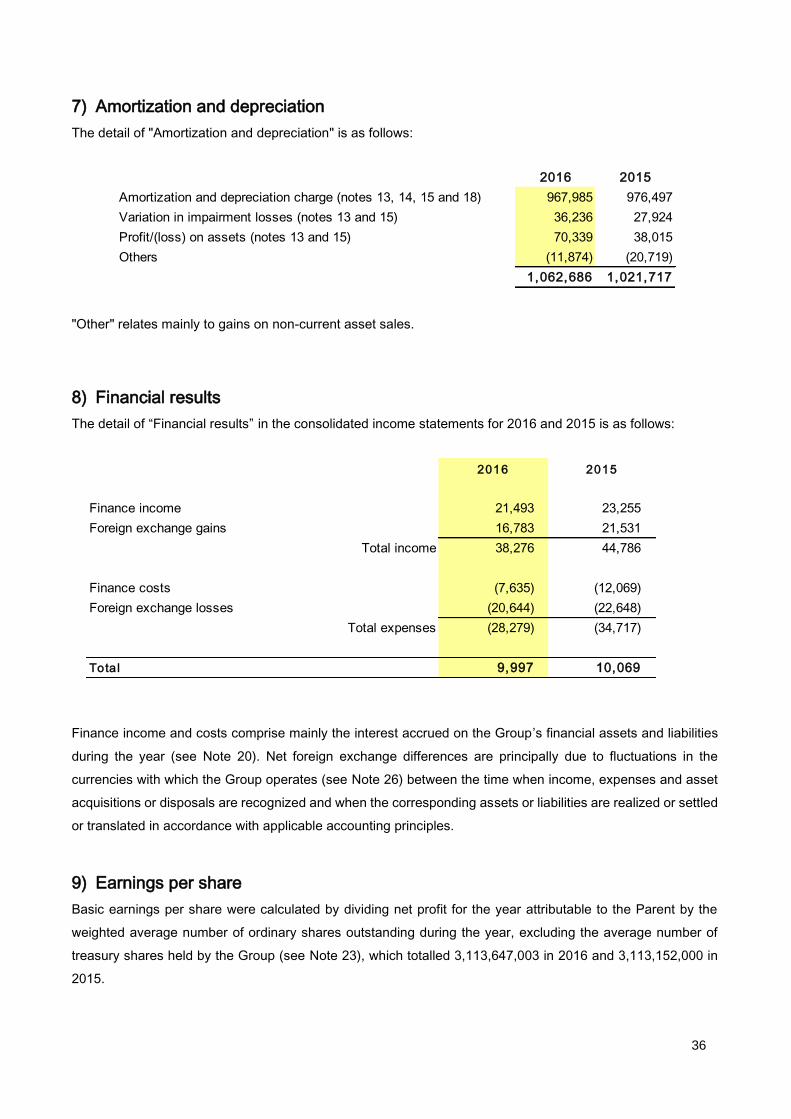
36
7) Amortization and depreciation
The detail of "Amortization and depreciation" is as follows:
"Other" relates mainly to gains on non-current asset sales.
8) Financial results
The detail of “Financial results” in the consolidated income statements for 2016 and 2015 is as follows:
Finance income and costs comprise mainly the interest accrued on the Group’s financial assets and liabilities
during the year (see Note 20). Net foreign exchange differences are principally due to fluctuations in the
currencies with which the Group operates (see Note 26) between the time when income, expenses and asset
acquisitions or disposals are recognized and when the corresponding assets or liabilities are realized or settled
or translated in accordance with applicable accounting principles.
9) Earnings per share
Basic earnings per share were calculated by dividing net profit for the year attributable to the Parent by the
weighted average number of ordinary shares outstanding during the year, excluding the average number of
treasury shares held by the Group (see Note 23), which totalled 3,113,647,003 in 2016 and 3,113,152,000 in
2015.
2016 2015
Amortization and depreciation charge (notes 13, 14, 15 and 18) 967,985 976,497
Variation in impairment losses (notes 13 and 15) 36,236 27,924
Profit/(loss) on assets (notes 13 and 15) 70,339 38,015
Others (11,874) (20,719)
1,062,686 1,021,717
2016 2015
Finance income 21,493 23,255
Foreign exchange gains 16,783 21,531
Total income 38,276 44,786
Finance costs (7,635) (12,069)
Foreign exchange losses (20,644) (22,648)
Total expenses (28,279) (34,717)
Total 9,997 10,069
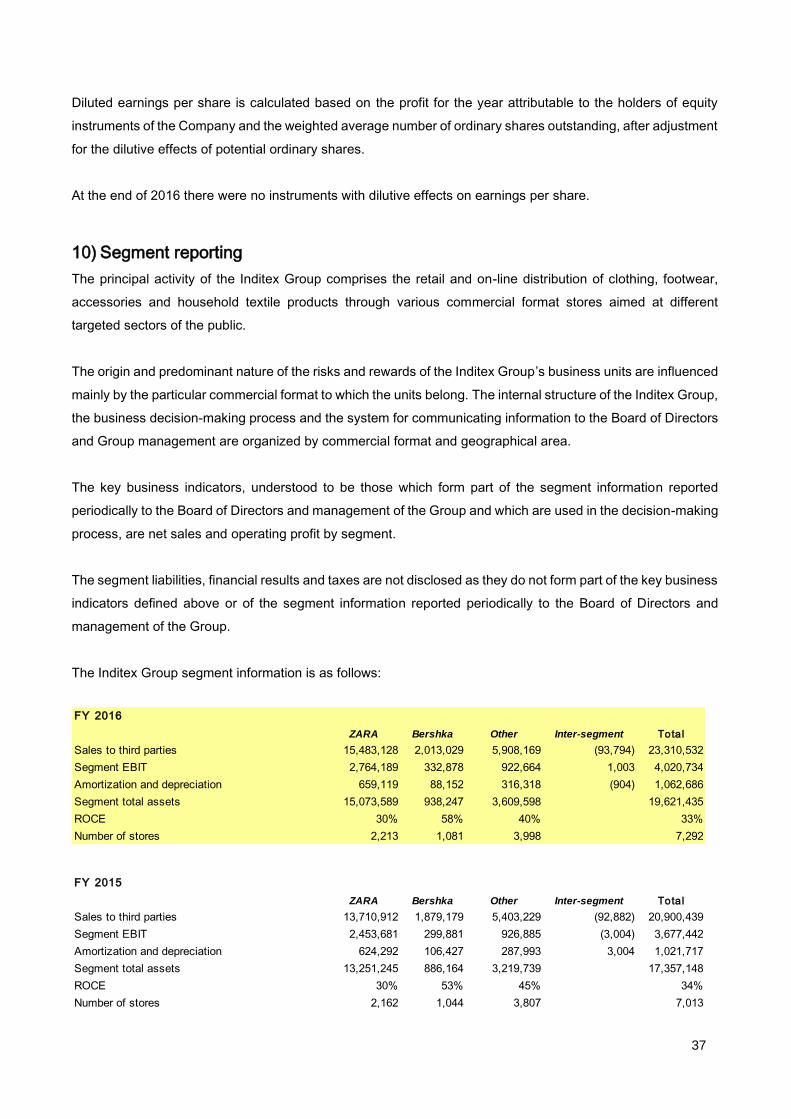
37
Diluted earnings per share is calculated based on the profit for the year attributable to the holders of equity
instruments of the Company and the weighted average number of ordinary shares outstanding, after adjustment
for the dilutive effects of potential ordinary shares.
At the end of 2016 there were no instruments with dilutive effects on earnings per share.
10) Segment reporting
The principal activity of the Inditex Group comprises the retail and on-line distribution of clothing, footwear,
accessories and household textile products through various commercial format stores aimed at different
targeted sectors of the public.
The origin and predominant nature of the risks and rewards of the Inditex Group’s business units are influenced
mainly by the particular commercial format to which the units belong. The internal structure of the Inditex Group,
the business decision-making process and the system for communicating information to the Board of Directors
and Group management are organized by commercial format and geographical area.
The key business indicators, understood to be those which form part of the segment information reported
periodically to the Board of Directors and management of the Group and which are used in the decision-making
process, are net sales and operating profit by segment.
The segment liabilities, financial results and taxes are not disclosed as they do not form part of the key business
indicators defined above or of the segment information reported periodically to the Board of Directors and
management of the Group.
The Inditex Group segment information is as follows:
FY 2016
ZARA Bershka Other Inter-segment Tota l
Sales to third parties 15,483,128 2,013,029 5,908,169 (93,794) 23,310,532
Segment EBIT 2,764,189 332,878 922,664 1,003 4,020,734
Amortization and depreciation 659,119 88,152 316,318 (904) 1,062,686
Segment total assets 15,073,589 938,247 3,609,598 19,621,435
ROCE 30% 58% 40% 33%
Number of stores 2,213 1,081 3,998 7,292
FY 2015
ZARA Bershka Other Inter-segment Tota l
Sales to third parties 13,710,912 1,879,179 5,403,229 (92,882) 20,900,439
Segment EBIT 2,453,681 299,881 926,885 (3,004) 3,677,442
Amortization and depreciation 624,292 106,427 287,993 3,004 1,021,717
Segment total assets 13,251,245 886,164 3,219,739 17,357,148
ROCE 30% 53% 45% 34%
Number of stores 2,162 1,044 3,807 7,013

38
For presentation purposes, the commercial concepts other than Zara and Bershka were grouped into a single
reporting segment due to the similarities in the nature of the products sold and their management and monitoring
model.
For the purpose of reconciliation with the consolidated annual accounts, sales to third parties relate to "Net
sales" in the consolidated income statement and the amortization and depreciation corresponds to
"Amortization and depreciation" in the consolidated income statement.
The segment's profit from operations refers to its Operating Result (EBIT), as defined in the initial Note to these
consolidated annual accounts. Income and expenses which might be considered to be corporate in nature or
as belonging to all segments were assigned to each of the segments based on distribution criteria considered
reasonable by Group management. Transactions between the various segments are carried out on an arm's
length basis.
Total segment assets relate to "Total assets" in the consolidated balance sheet.
ROCE is calculated as defined in the initial Note to these consolidated annual accounts.
Zara was the first concept created by the Inditex Group and its positioning is based on a fashion offering
featuring a wide range of products.
Bershka targets the younger consumers and its aim is to offer the latest fashion at affordable prices.
Geographical reporting
In the presentation of information by geographical segment, revenue is based on the geographical location of
customers and segment non-current assets are based on the geographical location of assets. Segment non-
current assets do not include deferred tax assets.
2016 2015 31/01/2017 31/01/2016
Spain 4,251,149 4,002,801 3,073,960 2,920,572
Rest of Europe 10,749,859 9,695,065 3,253,120 2,916,414
Americas 3,484,459 3,002,480 1,529,005 1,361,809
Asia and rest of the world 4,825,064 4,200,093 1,144,974 1,015,689
Total 23,310,532 20,900,439 9,001,059 8,214,484
Net Sales Non-current assets
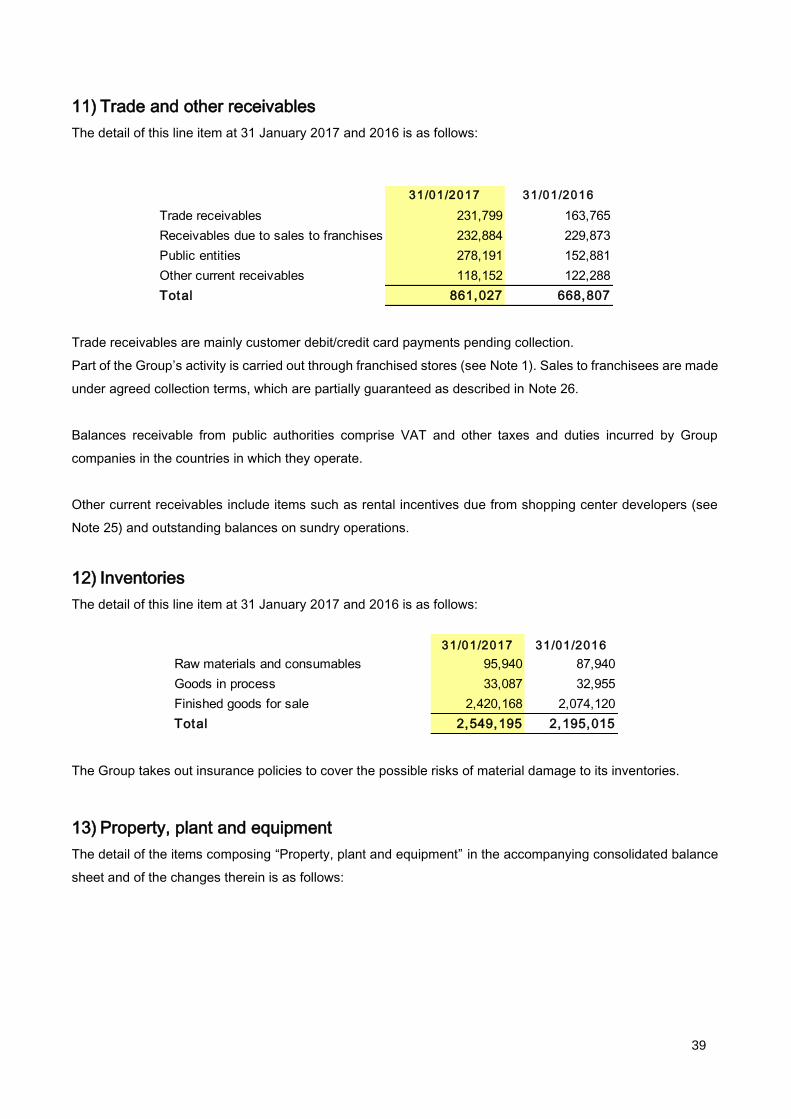
39
11) Trade and other receivables
The detail of this line item at 31 January 2017 and 2016 is as follows:
Trade receivables are mainly customer debit/credit card payments pending collection.
Part of the Group’s activity is carried out through franchised stores (see Note 1). Sales to franchisees are made
under agreed collection terms, which are partially guaranteed as described in Note 26.
Balances receivable from public authorities comprise VAT and other taxes and duties incurred by Group
companies in the countries in which they operate.
Other current receivables include items such as rental incentives due from shopping center developers (see
Note 25) and outstanding balances on sundry operations.
12) Inventories
The detail of this line item at 31 January 2017 and 2016 is as follows:
The Group takes out insurance policies to cover the possible risks of material damage to its inventories.
13) Property, plant and equipment
The detail of the items composing “Property, plant and equipment” in the accompanying consolidated balance
sheet and of the changes therein is as follows:
31/01/2017 31/01/2016
Trade receivables 231,799 163,765
Receivables due to sales to franchises 232,884 229,873
Public entities 278,191 152,881
Other current receivables 118,152 122,288
Total 861,027 668,807
31/01/2017 31/01/2016
Raw materials and consumables 95,940 87,940
Goods in process 33,087 32,955
Finished goods for sale 2,420,168 2,074,120
Total 2,549,195 2,195,015

40
Land and
buildings
Fix tures ,
furniture and
machinery
Other
proper ty ,
plant and
equipment
Work in
progress Total
Cost
Balance at 01/02/2015 1,643,011 8,251,907 434,387 471,113 10,800,418
Acquisitions 136,563 1,160,402 82,399 153,500 1,532,865
Disposals (Note 7) (1,837) (399,394) (35,193) (760) (437,184)
Transfers 86,507 82,746 9,212 (123,244) 55,222
Foreign exchange translation differences 9,004 (231,452) (11,649) 9,225 (224,872)
Balance at 31/01/2016 1,873,248 8,864,209 479,157 509,835 11,726,449
Balance at 01/02/2016 1,873,248 8,864,209 479,157 509,835 11,726,449
Acquisitions 6,827 1,214,531 106,114 211,046 1,538,517
Disposals (Note 7) (3,766) (442,802) (53,441) (312) (500,321)
Transfers 274,204 64,576 58,491 (398,533) (1,261)
Foreign exchange translation differences 10,473 91,585 8,247 (1,319) 108,986
Balance at 31/01/2017 2,160,986 9,792,099 598,568 320,716 12,872,370
Deprec iat ion
Balance at 01/02/2015 258,269 4,236,605 203,126 - 4,698,000
Depreciation charge for the year (Note 7) 36,370 751,565 64,084 - 852,018
Disposals (Note 7) (585) (363,526) (33,245) - (397,356)
Transfers 10,319 (9,694) 766 - 1,390
Foreign exchange translation differences 338 (93,232) (5,998) - (98,892)
Balance at 31/01/2016 304,711 4,521,717 228,733 - 5,055,160
Balance at 01/02/2016 304,711 4,521,717 228,733 - 5,055,160
Depreciation charge for the year (Note 7) 38,860 719,963 73,011 - 831,834
Disposals (Note 7) (1,021) (380,834) (26,987) - (408,843)
Transfers 32 (1,034) (21) - (1,022)
Foreign exchange translation differences 551 19,890 3,497 - 23,938
Balance at 31/01/2017 343,133 4,879,701 278,233 - 5,501,067
Impairment losses (note 2.2-g)
Balance at 01/02/2015 1,413 59,118 1,313 - 61,844
Charge for the year (Note 7) 258 34,089 549 - 34,896
Amounts charged to profit or loss (Note 7) - (10,212) (347) - (10,559)
Disposals (Note 7) - (11,380) (426) - (11,807)
Transfers - 291 1 - 291
Foreign exchange translation differences - (861) 16 - (845)
Balance at 31/01/2016 1,671 71,044 1,106 - 73,821
Balance at 01/02/2016 1,671 71,044 1,106 - 73,821
Charge for the year (Note 7) - 47,296 1,621 - 48,917
Amounts charged to profit or loss (Note 7) (139) (15,317) (274) - (15,730)
Disposals (Note 7) - (14,503) (258) - (14,761)
Transfers - (5,211) (90) - (5,300)
Foreign exchange translation differences - 930 (2) - 927
Balance at 31/01/2017 1,532 84,240 2,102 - 87,875
Carry ing amount
Balance at 31/01/2016 1,566,865 4,271,448 249,319 509,835 6,597,467
Balance at 31/01/2017 1,816,321 4,828,158 318,233 320,716 7,283,428

41
“Fixtures, furniture and machinery” includes mainly assets related to stores.
“Other property, plant and equipment” includes, inter alia, information technology equipment and motor
vehicles.
Disposals comprise mainly assets related to the commercial premises at which the Group carries out its
commercial activities.
Fully depreciated items of property, plant and equipment include certain items, mainly machinery, fixtures and
furniture, with a gross cost value of Euros 1,949,016 thousand and Euros 1,887,334 thousand at 31 January
2017 and 31 January 2016, respectively.
The Group performed an impairment test and a sensitivity analysis based on reasonably possible changes in
the main variables used in asset measurement, and the results did not vary significantly (see Note 2.2.g).
Through its corporate risk management policy, the Group identifies, assesses and controls damage and liability-
related risks to which the Group companies are exposed. It does this by compiling and measuring the main
risks of damage, loss of profits and liability affecting the Group and implements prevention and protection
policies aimed at reducing, to the extent possible, the frequency and intensity of these risks.
Likewise, standard measurement criteria are established at corporate level which enable the different risks to
which the Group is exposed to be quantified, measured and insured.
Lastly, the Group takes out insurance policies through corporate insurance programs to protect its assets from
the various risks, and establishes suitable limits, excesses and conditions in view of the nature of the assets
and the financial dimension of the Group.
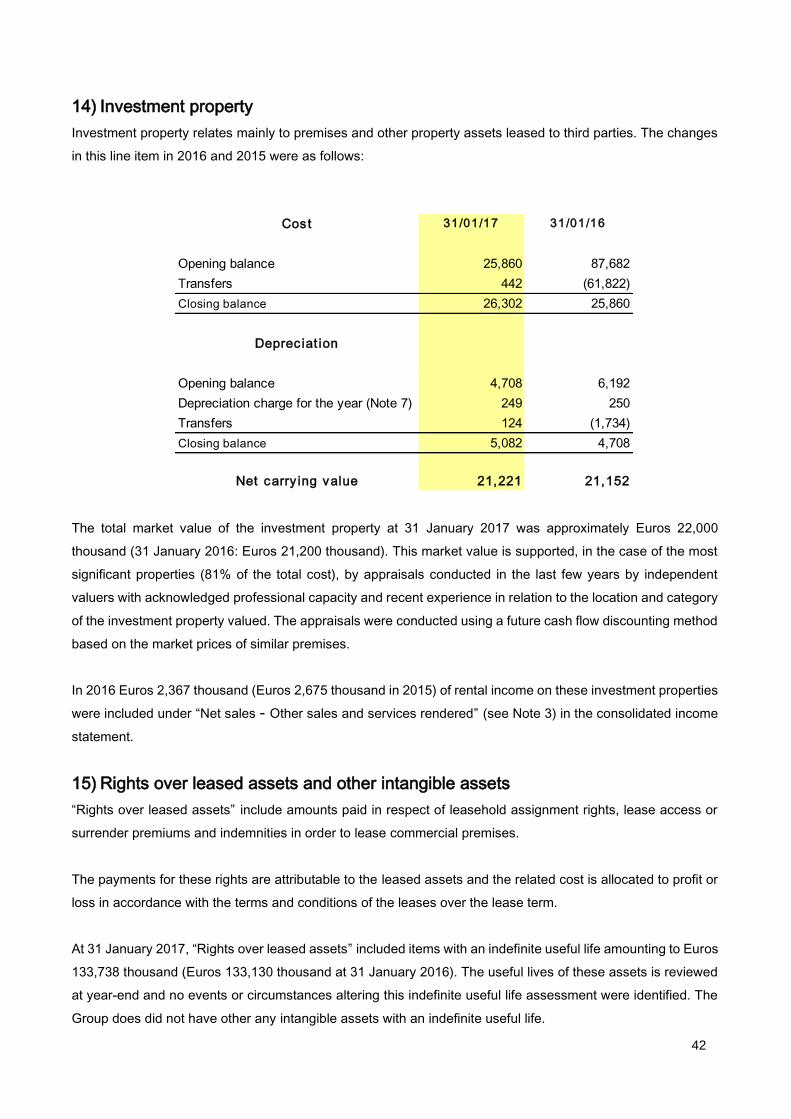
42
14) Investment property
Investment property relates mainly to premises and other property assets leased to third parties. The changes
in this line item in 2016 and 2015 were as follows:
The total market value of the investment property at 31 January 2017 was approximately Euros 22,000
thousand (31 January 2016: Euros 21,200 thousand). This market value is supported, in the case of the most
significant properties (81% of the total cost), by appraisals conducted in the last few years by independent
valuers with acknowledged professional capacity and recent experience in relation to the location and category
of the investment property valued. The appraisals were conducted using a future cash flow discounting method
based on the market prices of similar premises.
In 2016 Euros 2,367 thousand (Euros 2,675 thousand in 2015) of rental income on these investment properties
were included under “Net sales - Other sales and services rendered” (see Note 3) in the consolidated income
statement.
15) Rights over leased assets and other intangible assets
“Rights over leased assets” include amounts paid in respect of leasehold assignment rights, lease access or
surrender premiums and indemnities in order to lease commercial premises.
The payments for these rights are attributable to the leased assets and the related cost is allocated to profit or
loss in accordance with the terms and conditions of the leases over the lease term.
At 31 January 2017, “Rights over leased assets” included items with an indefinite useful life amounting to Euros
133,738 thousand (Euros 133,130 thousand at 31 January 2016). The useful lives of these assets is reviewed
at year-end and no events or circumstances altering this indefinite useful life assessment were identified. The
Group does did not have other any intangible assets with an indefinite useful life.
Cost 31/01/17 31/01/16
Opening balance 25,860 87,682
Transfers 442 (61,822)
Closing balance 26,302 25,860
Deprec iat ion
Opening balance 4,708 6,192
Depreciation charge for the year (Note 7) 249 250
Transfers 124 (1,734)
Closing balance 5,082 4,708
Net carry ing value 21,221 21,152

43
“Other intangible assets” includes basically amounts paid for the registration and use of Group brand names,
industrial designs of items of clothing, footwear, accessories and household goods created during the year, and
the cost of software applications.
The Group performed an impairment test and a sensitivity analysis based on reasonably possible changes in
the main variables used in asset measurement, and the results did not vary significantly (see Note 2.2.g).
The detail of “Other intangible assets” in the consolidated balance sheet and of the changes therein in 2016
and 2015 is as follows:
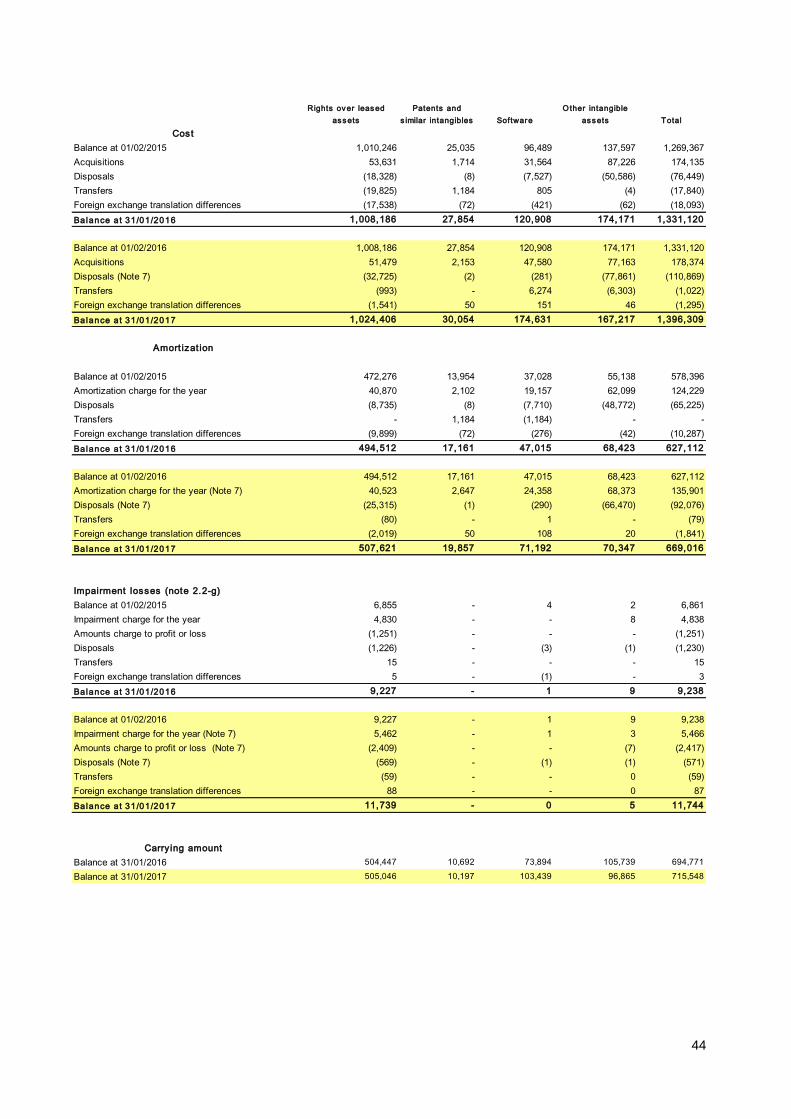
44
Rights over leased
assets
Patents and
s imilar intangibles Software
Other intangible
assets Total
Cost
Balance at 01/02/2015 1,010,246 25,035 96,489 137,597 1,269,367
Acquisitions 53,631 1,714 31,564 87,226 174,135
Disposals (18,328) (8) (7,527) (50,586) (76,449)
Transfers (19,825) 1,184 805 (4) (17,840)
Foreign exchange translation differences (17,538) (72) (421) (62) (18,093)
Balance at 31/01/2016 1,008,186 27,854 120,908 174,171 1,331,120
Balance at 01/02/2016 1,008,186 27,854 120,908 174,171 1,331,120
Acquisitions 51,479 2,153 47,580 77,163 178,374
Disposals (Note 7) (32,725) (2) (281) (77,861) (110,869)
Transfers (993) - 6,274 (6,303) (1,022)
Foreign exchange translation differences (1,541) 50 151 46 (1,295)
Balance at 31/01/2017 1,024,406 30,054 174,631 167,217 1,396,309
Amort izat ion
Balance at 01/02/2015 472,276 13,954 37,028 55,138 578,396
Amortization charge for the year 40,870 2,102 19,157 62,099 124,229
Disposals (8,735) (8) (7,710) (48,772) (65,225)
Transfers - 1,184 (1,184) - -
Foreign exchange translation differences (9,899) (72) (276) (42) (10,287)
Balance at 31/01/2016 494,512 17,161 47,015 68,423 627,112
Balance at 01/02/2016 494,512 17,161 47,015 68,423 627,112
Amortization charge for the year (Note 7) 40,523 2,647 24,358 68,373 135,901
Disposals (Note 7) (25,315) (1) (290) (66,470) (92,076)
Transfers (80) - 1 - (79)
Foreign exchange translation differences (2,019) 50 108 20 (1,841)
Balance at 31/01/2017 507,621 19,857 71,192 70,347 669,016
Impairment losses (note 2.2-g)
Balance at 01/02/2015 6,855 - 4 2 6,861
Impairment charge for the year 4,830 - - 8 4,838
Amounts charge to profit or loss (1,251) - - - (1,251)
Disposals (1,226) - (3) (1) (1,230)
Transfers 15 - - - 15
Foreign exchange translation differences 5 - (1) - 3
Balance at 31/01/2016 9,227 - 1 9 9,238
Balance at 01/02/2016 9,227 - 1 9 9,238
Impairment charge for the year (Note 7) 5,462 - 1 3 5,466
Amounts charge to profit or loss (Note 7) (2,409) - - (7) (2,417)
Disposals (Note 7) (569) - (1) (1) (571)
Transfers (59) - - 0 (59)
Foreign exchange translation differences 88 - - 0 87
Balance at 31/01/2017 11,739 - 0 5 11,744
Carry ing amount
Balance at 31/01/2016 504,447 10,692 73,894 105,739 694,771
Balance at 31/01/2017 505,046 10,197 103,439 96,865 715,548

45
The Group capitalized Euros 47,580 thousand in 2016 (Euros 24,824 thousand in 2015) corresponding to
software development activities that meet the requirements for capitalization under IAS 38. The Group also
capitalized Euros 77,163 thousand (Euros 86,538 thousand in 2015) in respect of the development of industrial
designs and other intangibles associated with the Group's activity that meet the requirements for capitalization
under IAS 38.
16) Goodwill
The detail of this line item in the consolidated balance sheet and of the changes therein in 2016 and 2015 is as
follows:
The goodwill arising from the acquisition or termination of franchise contracts corresponds to the amount of the
intangible assets that did not meet the requirements established in IFRS 3 for separate recognition. These
requirements were essentially related to the capacity of the assets to generate future cash flows.
2016 2015
Opening balance 193,488 197,901
Foreign exchange translation differences 2,216 (4,413)
Closing balance 195,704 193,488
Investee 2016 2015
Stradivarius España, S.A. 53,253 53,253
BCN Diseños, S.A. de C.V. 10,276 11,447
Zara Polska, S.p. Zo.o. 33,651 32,819
Zao Zara CIS 10,492 8,254
Pull&Bear CIS 232 182
Stradivarius CIS 5,486 5,173
Zara Serbia, D.O.O. Belgrade 4,150 4,174
Pull & Bear Serbia, D.O.O. Belgrade 690 695
Massimo Dutti Serbia, D.O.O. Belgrade 831 835
Bershka Serbia, D.O.O. Belgrade 803 807
Stradivarius Serbia, D.O.O. Belgrade 724 728
Oysho Serbia, D.O.O. Belgrade 482 485
Inditex Montenegro, D.O.O. Podgorica 2,577 2,577
Massimo Dutti Benelux, N.V. 19,921 19,921
Italco Moda Italiana, LDA. 51,357 51,357
Z-Fashion Finland OY 781 781
Closing balance 195,704 193,488

46
The recovery of the goodwill is adequately guaranteed through the profitability of the acquired companies,
whose future cash flows support the carrying amount of goodwill at year-end (see Note 2.2.g).
Also, sensitivity analyses were performed based on reasonably possible changes in the main variables used in
asset measurement, and the recoverable amount is higher than the related carrying amount (see Note 2.2.g).
17) Financial investments
The detail of this line item in the consolidated balance sheet and of the changes therein in 2016 and 2015 is
as follows:
The carrying amount of the ownership interest in the Tempe Group in the accompanying consolidated balance
sheet does not differ significantly from the value of the Group’s share of the net assets of the Tempe Group
(see Note 28).
There are no significant restrictions of any kind on the Tempe Group’s ability to transfer funds to the Group in
the form of cash dividends or the repayment of loans or advances granted by the Group.
Loans and
other credi t
faci l i ties
Investm ents
accounted for using
the equi ty m ethod
Others Tota l
Balance at 01/02/2015 7,109 141,676 2,468 151,253
Acquisitions 300 55,607 73 55,980
Disposals (267) (22,414) (748) (23,429)
Balance at 31/01/2016 7,142 174,869 1,793 183,804
Balance at 01/02/2016 7,142 174,869 1,793 183,804
Acquisitions 13,954 47,588 - 61,542
Disposals (1,416) (27,493) - (28,909)
Transfers 12,478 - 463 12,941
Foreign exchange translation (1,363) 3,409 - 2,046
Balance at 31/01/2017 30,794 198,373 2,256 231,423

47
18) Other non-current assets
The detail of this line item in the consolidated balance sheet and of the changes therein in 2016 and 2015 is as
follows:
The guarantees and deposits relate mainly to amounts deposited with owners of leased commercial premises
to ensure compliance with the conditions stipulated in the lease contracts (see Note 25), and to amounts paid
to secure compliance with contracts in force.
These amounts are recognized at their repayment value as this value does not differ significantly from amortized
cost.
19) Trade and other payables
The detail of this line item in the consolidated balance sheets at 31 January 2017 and 2016 is as follows:
Guarantees Other Total
Balance at 01/02/2015 429,324 42,822 472,146
Acquisitions 62,177 10,714 72,891
Disposals (16,255) (167) (16,422)
Profit/(Loss) for the year (4,097) (6,852) (10,949)
Transfers (5,004) 18,048 13,044
Foreign exchange translation differences (4,654) (2,253) (6,907)
Balance at 31/01/2016 461,490 62,312 523,802
Balance at 01/02/2016 461,490 62,312 523,802
Acquisitions 37,209 15,539 52,749
Disposals (24,040) (384) (24,424)
Profit/(Loss) for the year (904) (3,802) (4,706)
Transfers (778) (1,020) (1,798)
Foreign exchange translation differences 9,627 (1,516) 8,111
Balance at 31/01/2017 482,604 71,131 553,734
31/01/2017 31/01/2016
Trade payables 3,471,084 2,994,901
Personnel 376,759 406,187
Public entities 756,857 705,974
Other current payables 490,432 407,204
Total 5,095,132 4,514,266
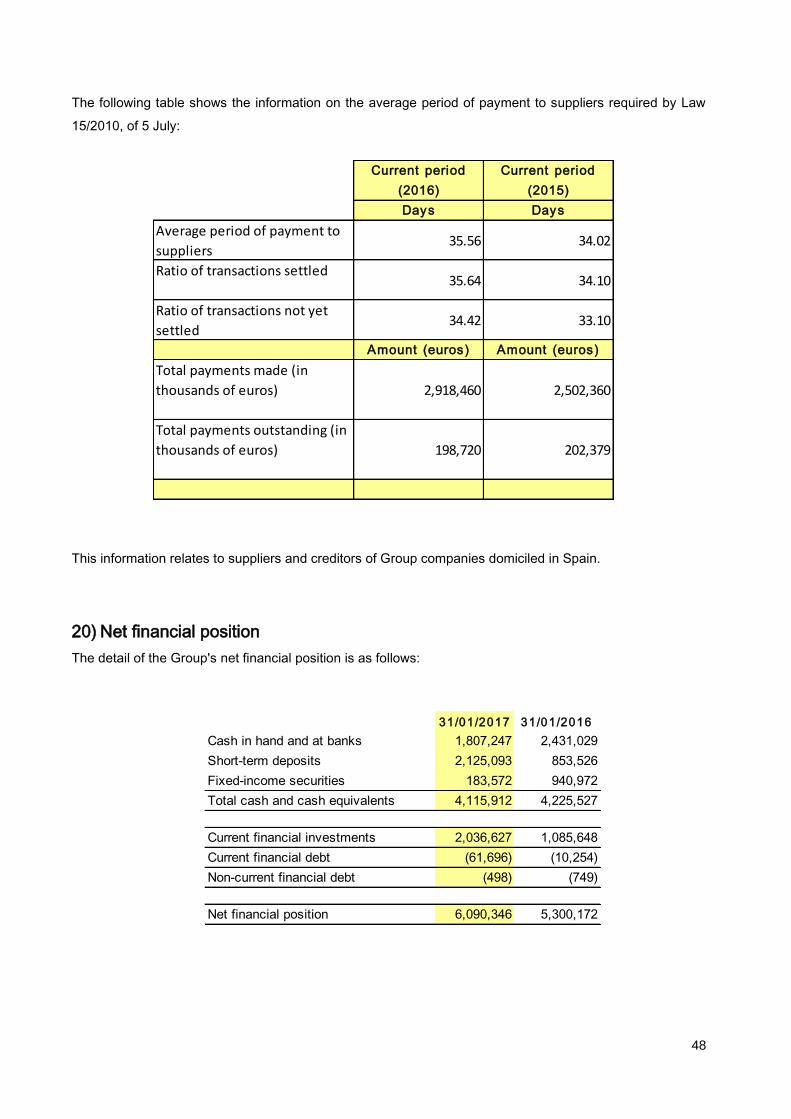
48
The following table shows the information on the average period of payment to suppliers required by Law
15/2010, of 5 July:
This information relates to suppliers and creditors of Group companies domiciled in Spain.
20) Net financial position
The detail of the Group's net financial position is as follows:
Current period
(2016)
Current period
(2015)
Days Days
Average period of payment to
suppliers35.56 34.02
Ratio of transactions settled35.64 34.10
Ratio of transactions not yet
settled34.42 33.10
Amount (euros) Amount (euros)
Total payments made (in
thousands of euros) 2,918,460 2,502,360
Total payments outstanding (in
thousands of euros) 198,720 202,379
31/01/2017 31/01/2016
Cash in hand and at banks 1,807,247 2,431,029
Short-term deposits 2,125,093 853,526
Fixed-income securities 183,572 940,972
Total cash and cash equivalents 4,115,912 4,225,527
Current financial investments 2,036,627 1,085,648
Current financial debt (61,696) (10,254)
Non-current financial debt (498) (749)
Net financial position 6,090,346 5,300,172
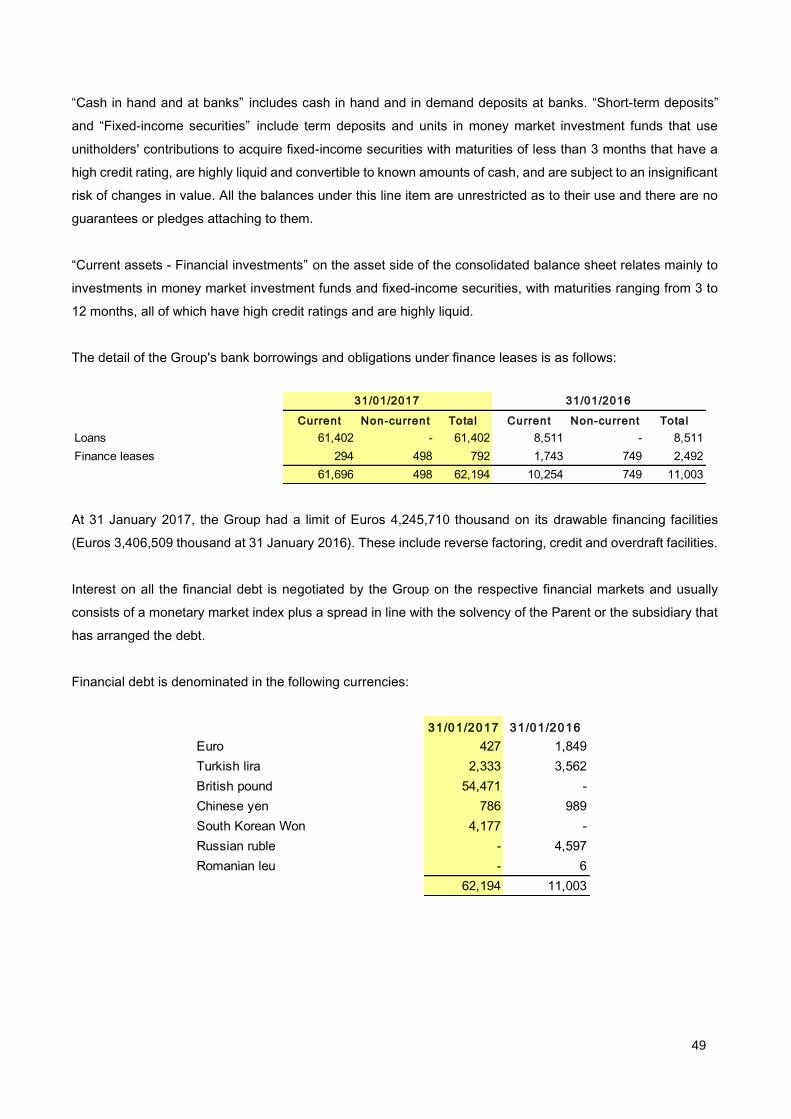
49
“Cash in hand and at banks” includes cash in hand and in demand deposits at banks. “Short-term deposits”
and “Fixed-income securities” include term deposits and units in money market investment funds that use
unitholders' contributions to acquire fixed-income securities with maturities of less than 3 months that have a
high credit rating, are highly liquid and convertible to known amounts of cash, and are subject to an insignificant
risk of changes in value. All the balances under this line item are unrestricted as to their use and there are no
guarantees or pledges attaching to them.
“Current assets - Financial investments” on the asset side of the consolidated balance sheet relates mainly to
investments in money market investment funds and fixed-income securities, with maturities ranging from 3 to
12 months, all of which have high credit ratings and are highly liquid.
The detail of the Group's bank borrowings and obligations under finance leases is as follows:
At 31 January 2017, the Group had a limit of Euros 4,245,710 thousand on its drawable financing facilities
(Euros 3,406,509 thousand at 31 January 2016). These include reverse factoring, credit and overdraft facilities.
Interest on all the financial debt is negotiated by the Group on the respective financial markets and usually
consists of a monetary market index plus a spread in line with the solvency of the Parent or the subsidiary that
has arranged the debt.
Financial debt is denominated in the following currencies:
Current Non-current Total Current Non-current Total
Loans 61,402 - 61,402 8,511 - 8,511
Finance leases 294 498 792 1,743 749 2,492
61,696 498 62,194 10,254 749 11,003
31/01/2017 31/01/2016
31/01/2017 31/01/2016
Euro 427 1,849
Turkish lira 2,333 3,562
British pound 54,471 -
Chinese yen 786 989
South Korean Won 4,177 -
Russian ruble - 4,597
Romanian leu - 6
62,194 11,003
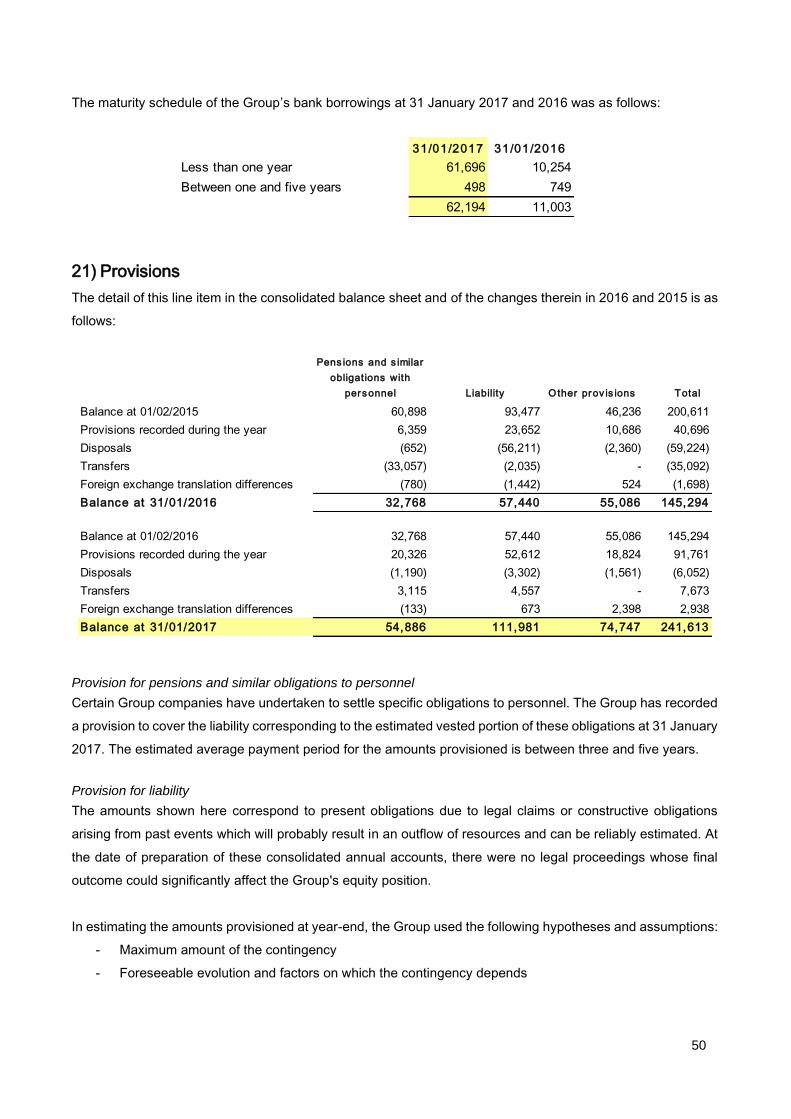
50
The maturity schedule of the Group’s bank borrowings at 31 January 2017 and 2016 was as follows:
21) Provisions
The detail of this line item in the consolidated balance sheet and of the changes therein in 2016 and 2015 is as
follows:
Provision for pensions and similar obligations to personnel
Certain Group companies have undertaken to settle specific obligations to personnel. The Group has recorded
a provision to cover the liability corresponding to the estimated vested portion of these obligations at 31 January
2017. The estimated average payment period for the amounts provisioned is between three and five years.
Provision for liability
The amounts shown here correspond to present obligations due to legal claims or constructive obligations
arising from past events which will probably result in an outflow of resources and can be reliably estimated. At
the date of preparation of these consolidated annual accounts, there were no legal proceedings whose final
outcome could significantly affect the Group's equity position.
In estimating the amounts provisioned at year-end, the Group used the following hypotheses and assumptions:
- Maximum amount of the contingency
- Foreseeable evolution and factors on which the contingency depends
31/01/2017 31/01/2016
Less than one year 61,696 10,254
Between one and five years 498 749
62,194 11,003
Pens ions and s imilar
obligations with
personnel Liability Other prov is ions Total
Balance at 01/02/2015 60,898 93,477 46,236 200,611
Provisions recorded during the year 6,359 23,652 10,686 40,696
Disposals (652) (56,211) (2,360) (59,224)
Transfers (33,057) (2,035) - (35,092)
Foreign exchange translation differences (780) (1,442) 524 (1,698)
Balance at 31/01/2016 32,768 57,440 55,086 145,294
Balance at 01/02/2016 32,768 57,440 55,086 145,294
Provisions recorded during the year 20,326 52,612 18,824 91,761
Disposals (1,190) (3,302) (1,561) (6,052)
Transfers 3,115 4,557 - 7,673
Foreign exchange translation differences (133) 673 2,398 2,938
Balance at 31/01/2017 54,886 111,981 74,747 241,613

51
The estimated average payment period for the amounts provisioned depends largely on the local legislation of
each of the markets in which the Group operates. An analysis is performed each year of the portion that will
foreseeably have to be paid the following year and the related amount is transferred to current payables.
The directors of Inditex consider that the provisions recorded in the consolidated balance sheet adequately
cover the risks relating to litigation, arbitration and other contingencies and do not expect any liabilities additional
to those recognized to arise therefrom.
22) Other non-current liabilities
The detail of this caption in the consolidated balance sheet and of the changes therein in 2016 and 2015 is as
follows:
23) Capital and reserves
Share capital
At 31 January 2017 and 2016, the Parent’s share capital amounted to Euros 93,499,560, and was divided into
3,116,652,000 fully subscribed and paid shares of Euros 0.03 par value each. All shares are of a single class
and series, carry the same voting and dividend rights and are represented by book entries.
The Parent’s share premium at 31 January 2017 and 2016 amounted to Euros 20,379 thousand, while retained
earnings amounted to Euros 3,666,407 thousand and Euros 3,334,142 thousand, respectively. The Parent’s
legal reserve, amounting to Euros 18,700 thousand, was recognized in compliance with Article 274 of the
Lease incentives Other Total
Balance at 01/02/2015 667,013 48,758 715,771
Acquisitions 140,510 12,986 153,496
Changes through profit or loss 9,445 21,104 30,549
Transfers (54,492) (9,117) (63,609)
Foreign exchange translation differences (31,243) 1 (31,242)
Balance at 31/01/2016 731,234 73,732 804,966
Balance at 01/02/2016 731,234 73,732 804,966
Acquisitions 164,567 - 164,567
Changes through profit or loss 13,758 20,592 34,350
Disposals (3,430) - (3,430)
Transfers (80,699) (10,337) (91,036)
Foreign exchange translation differences 10,613 23 10,636
Balance at 31/01/2017 836,044 84,010 920,053

52
Spanish Companies Act, which establishes that 10% of profit for each year must be transferred to the legal
reserve until the balance of this reserve reaches at least 20% of share capital. The legal reserve is not
distributable to shareholders and if it is used to offset losses, in the event that sufficient other reserves are not
available for this purpose, the reserve must be replenished with future profits. At 31 January 2017 and 2016,
the Parent had appropriated to this reserve the minimum amount required by the Spanish Companies Act.
The total consolidated reserves at 31 January 2017 include restricted reserves amounting to Euros 433,344
thousand (Euros 383,151 thousand at 31 January 2016) whose distribution is limited due to domestic legal
requirements (basically bylaw reserves).
INDITEX shares are listed on the four Spanish stock exchanges. As the shares are represented by book entries
and the Company does not keep a record of its shareholders, it is not possible to accurately ascertain the
ownership structure of the Company. According to public information registered with the Spanish National
Securities Market Commission (CNMV), at 31 January 2017 and 2016 the members of the Board of Directors
owned, directly or indirectly, 59.36% of the Parent’s share capital (see Note 30). At 31 January 2017 and 2016,
Pontegadea Inversiones, S.L. held 50.010% of the shares of INDITEX.
Dividends
The dividends paid by the Parent in 2016 and 2015 amounted to Euros 1,868,190 thousand and Euros
1,618,839 thousand, respectively. These amounts correspond to payments of euro 0.60 per share in 2016 and
euro 0.52 per share in 2015.
The distribution of profit proposed by the Board of Directors is shown in Note 29.
Treasury shares
The annual general shareholders' meeting held on 16 July 2013 approved the 2013-2017 Long-Term Share-
Based Incentive Plan (see Note 27) and authorized the Board of Directors to derivatively acquire treasury
shares to cater for this plan. Similarly, the annual general shareholders' meeting held on 19 July 2016 approved
the 2016-2020 Long-Term Incentive Plan (see Note 27) and authorized the Board of Directors to derivatively
acquire treasury shares to cater for this plan.
At 1 February 2016, the Company owned a total of 3,500,000 treasury shares, representing 0.112% of the
share capital. In 2016, settlement of the first cycle (2013-2016) of the 2013-2017 Long-Term Share-Based
Incentive Plan took place, with the corresponding shares being delivered to the beneficiaries of the
aforementioned first cycle of the Plan.
Also, in order for the Company to have the shares required for delivery to the beneficiaries of the second cycle
(2014-2017) of the 2013-2017 Long-Term Share-Based Incentive Plan, the Company acquired shares until it
reached a total of 3,610,755, representing 0.116 % of the share capital at 31 January 2017.
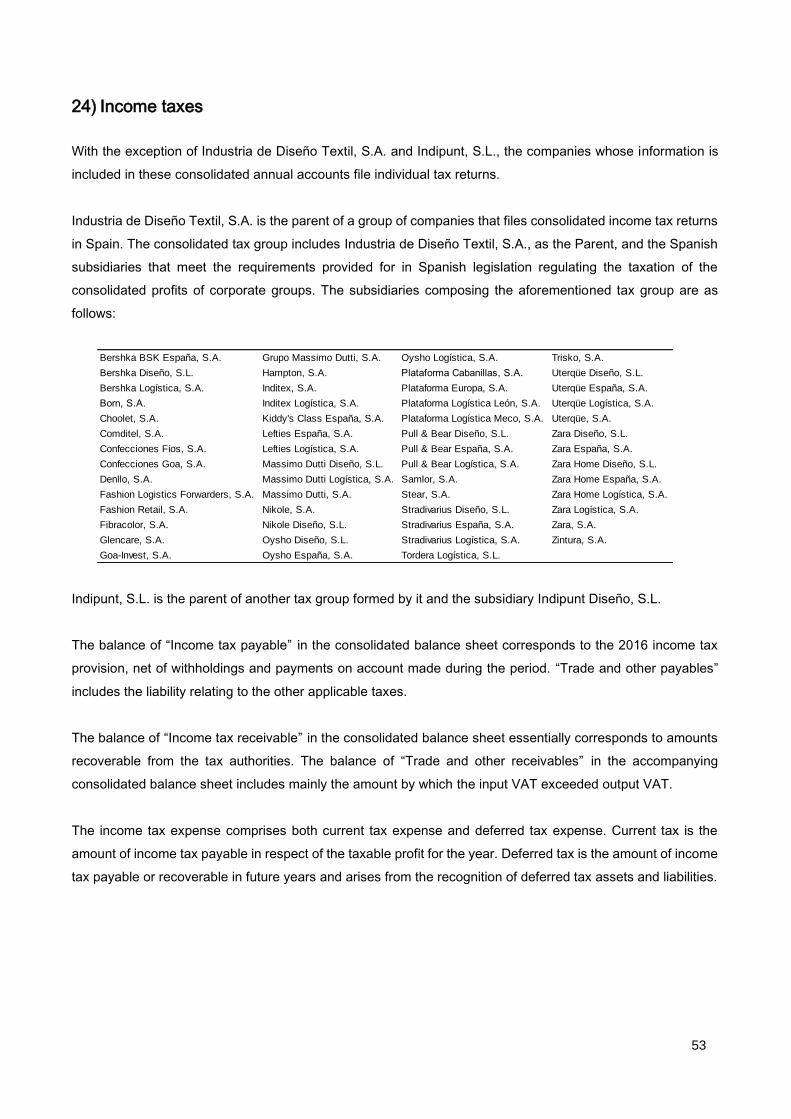
53
24) Income taxes
With the exception of Industria de Diseño Textil, S.A. and Indipunt, S.L., the companies whose information is
included in these consolidated annual accounts file individual tax returns.
Industria de Diseño Textil, S.A. is the parent of a group of companies that files consolidated income tax returns
in Spain. The consolidated tax group includes Industria de Diseño Textil, S.A., as the Parent, and the Spanish
subsidiaries that meet the requirements provided for in Spanish legislation regulating the taxation of the
consolidated profits of corporate groups. The subsidiaries composing the aforementioned tax group are as
follows:
Indipunt, S.L. is the parent of another tax group formed by it and the subsidiary Indipunt Diseño, S.L.
The balance of “Income tax payable” in the consolidated balance sheet corresponds to the 2016 income tax
provision, net of withholdings and payments on account made during the period. “Trade and other payables”
includes the liability relating to the other applicable taxes.
The balance of “Income tax receivable” in the consolidated balance sheet essentially corresponds to amounts
recoverable from the tax authorities. The balance of “Trade and other receivables” in the accompanying
consolidated balance sheet includes mainly the amount by which the input VAT exceeded output VAT.
The income tax expense comprises both current tax expense and deferred tax expense. Current tax is the
amount of income tax payable in respect of the taxable profit for the year. Deferred tax is the amount of income
tax payable or recoverable in future years and arises from the recognition of deferred tax assets and liabilities.
Bershka BSK España, S.A. Grupo Massimo Dutti, S.A. Oysho Logística, S.A. Trisko, S.A.
Bershka Diseño, S.L. Hampton, S.A. Plataforma Cabanillas, S.A. Uterqüe Diseño, S.L.
Bershka Logística, S.A. Inditex, S.A. Plataforma Europa, S.A. Uterqüe España, S.A.
Born, S.A. Inditex Logística, S.A. Plataforma Logística León, S.A. Uterqüe Logística, S.A.
Choolet, S.A. Kiddy's Class España, S.A. Plataforma Logística Meco, S.A. Uterqüe, S.A.
Comditel, S.A. Lefties España, S.A. Pull & Bear Diseño, S.L. Zara Diseño, S.L.
Confecciones Fíos, S.A. Lefties Logística, S.A. Pull & Bear España, S.A. Zara España, S.A.
Confecciones Goa, S.A. Massimo Dutti Diseño, S.L. Pull & Bear Logística, S.A. Zara Home Diseño, S.L.
Denllo, S.A. Massimo Dutti Logística, S.A. Samlor, S.A. Zara Home España, S.A.
Fashion Logistics Forwarders, S.A. Massimo Dutti, S.A. Stear, S.A. Zara Home Logística, S.A.
Fashion Retail, S.A. Nikole, S.A. Stradivarius Diseño, S.L. Zara Logística, S.A.
Fibracolor, S.A. Nikole Diseño, S.L. Stradivarius España, S.A. Zara, S.A.
Glencare, S.A. Oysho Diseño, S.L. Stradivarius Logística, S.A. Zintura, S.A.
Goa-Invest, S.A. Oysho España, S.A. Tordera Logística, S.L.

54
The income tax expense comprises the following:
The reconciliation of the income tax expense that would result from applying the standard tax rate in force in
Spain to the profit before tax and the income tax expense recognized in the consolidated income statements
for 2016 and 2015 is as follows:
The permanent differences correspond mainly to non-deductible expenses, taxable income relating to the
contribution of rights to use certain assets to a subsidiary and the exemption of income from permanent
establishments abroad.
As permitted by the prevailing tax legislation in each country, consolidated Group companies availed
themselves of tax benefits amounting to Euros 13,528 thousand in 2016 (Euros 15,568 thousand at 31 January
2016). These tax benefits relate mainly to tax credits for investments and, to a lesser extent, to tax relief.
The temporary differences are the differences between the carrying amounts of assets or liabilities and their
tax base. The consolidated balance sheet at 31 January 2017 reflects the deferred tax assets and liabilities at
that date.
2016 2015
Current taxes 995,032 838,854
Deferred taxes (77,818) 22,063
2016 2015
Consolidated accounting profit for the year before taxes 4,078,319 3,743,118
Tax expense at tax rate in force in the country of the Parent (30%) 1,019,580 1,048,073
Net permanent differences (175,179) (166,149)
Effect of application of different tax rates (73,964) (129,728)
Adjustments to prior years' taxes 38,355 26,308
Tax withholdings and other adjustments 116,515 96,407
Adjustments to deferred tax assets and liabilities 5,435 1,574
Tax withholdings and tax benefits (13,528) (15,568)
Income tax expense 917,214 860,917

55
The detail of “Deferred tax assets” and “Deferred tax liabilities” in the accompanying consolidated balance sheet
is as follows:
These balances were determined using the tax rates that, based on enacted tax laws, will be in force in the
period when they are expected to reverse, and in some cases these tax rates may differ from the tax rates in
force in the present year.
The expense for deferred income tax was adjusted for the difference between the balances calculated at the
tax rate in force at the end of the present year and those calculated at the new tax rates at which they will
reverse.
The movement in deferred tax assets and liabilities in 2016 and 2015 was as follows:
Deferred tax assets arising from: 2016 2015
Provisions 105,035 87,456
Non-current assets 143,479 153,496
Lease incentives 48,026 35,786
Valuation adjustments 47,940 43,207
Tax losses 101,046 101,537
Intra-Group transactions 180,948 158,938
Other 95,555 113,009
Total 722,029 693,429
Deferred tax liabilities arising from: 2016 2015
Leases 651 1,497
Intra-Group transactions 133,602 100,331
Non-current assets 51,933 99,201
Valuation adjustments 31,704 42,026
Other 39,253 42,140
Total 257,143 285,195
2016 2015
Deferred tax assets Deferred tax assets
Opening balance 693,429 643,574
Charge/Credit to profit or loss 30,401 64,881
Charge/Credit to equity 1,333 (14,919)
Transfers (3,134) (107)
Closing balance 722,029 693,429
2016 2015
Deferred tax l iabil i t ies Deferred tax l iabil i t ies
Opening balance 285,195 240,825
Charge/Credit to profit or loss (43,009) 62,132
Charge/Credit to equity 18,091 (17,655)
Transfers (3,134) (107)
Closing balance 257,143 285,195
56
At 31 January 2017, the Group had tax losses of Euros 415,719 thousand (Euros 399,889 thousand at 31
January 2016) which may be offset against future profits. The foregoing detail of deferred tax assets includes
those relating to tax loss carryforwards, with a balance of Euros 101,046 thousand at 31 January 2017. The
Group, based on the methodology established for verifying the existence of indications of impairment on its
non-current assets (see Note 2.2.g), constructs the assumptions for analyzing the existence of sufficient taxable
profits in the future to make it possible to offset the tax losses before they become statute-barred. Also, the
Group takes into account the reversal at the same taxable entity of deferred tax liabilities relating to the same
taxation authority that might give rise to sufficient taxable amounts against which it can offset the unused tax
losses. Therefore, the balance of deferred tax assets recognized in the consolidated balance sheet is the result
of the aforementioned analysis of the total amount of tax losses reported by the Group at year-end which, for
the most part, are not subject to any effective statute-of-limitations period.
Also, certain companies forming part of the consolidated Group have reserves which could be taxable if
distributed. These consolidated annual accounts include the tax effect associated with such a distribution to the
extent that it is probable that it will occur in the foreseeable future. The deferred tax liabilities associated with
investments in subsidiaries, associates and permanent establishments, which were not recognized because
the Group opted to avail itself of the exception provided for in IAS 12, amounted to Euros 21.14 million.
In addition, under the tax legislation applicable to the Parent of the Group, the dividends to the Parent's
shareholders that were proposed or declared before the annual accounts were authorized for issue but which
were not recognized as liabilities do not have any income tax consequences for the Parent.
The years open for review by the tax authorities for the main applicable taxes vary depending on the tax
legislation in each country in which the Group operates. Certain Group companies are currently being audited
for tax purposes, including most notably those domiciled in France, Italy and Greece. In any case, the Group
does not expect any liabilities that might significantly affect its equity position or results to arise as a result of
the tax audits in progress or those that might be carried out in the future in relation to periods are not yet statute-
barred.
Lastly, these consolidated annual accounts include the effect of the entry into force in Spain of Royal Decree-
Law 3/2016, of 2 December, adopting tax measures aimed at shoring up public finances. These measures
consisted of the amendment of the limits for offsetting tax losses and the introduction of the compulsory reversal
of impairment losses on investments and the non-deductibility of losses arising on the transfer of investments
in certain entities. The effect of these measures on the Group's equity position and results was not significant.
57
25) Operating leases
Most of the commercial premises at which the Group carries on its retail distribution activities are leased from
third parties. These leases are classified as operating leases because they do not transfer the risks and rewards
incidental to ownership of the underlying assets, since:
- ownership of the asset is not transferred to the lessee by the end of the lease term;
- the lessee does not have an option to purchase the leased asset;
- the leases have an initial term of between 15 and 25 years, which is shorter than the estimated
useful life of assets of this nature (see Note 2.2.c);
- at the inception of the lease, the present value of the minimum lease payments does not amount
to at least substantially all of the fair value of the leased asset.
Due, inter alia, to the presence of the Group in various different countries, the resulting variety of legislation
governing lease contracts and the diverse nature and economic status of the owners, its leases are regulated
by a broad range of clauses.
In many cases the lease contracts simply establish a fixed lease payment, normally made on a monthly basis
and adjusted for inflation based on a price index. In other cases the amounts payable to the lessor are
determined as a percentage of the sales obtained by the Group in the leased premises. These variable lease
payments or contingent rent may have guaranteed minimum amounts or certain specific calculation rules
attached. In some countries lease contracts are subject to periodic market rent reviews, and this is sometimes
conducted on an upward-only basis (i.e. rent is reset upward to higher, but not downward to lower, market
rates). Occasionally, escalating rental payments are agreed, which means cash outflows can be reduced during
the initial years of the use of commercial premises, even though the expense is recognized on a straight-line
basis (see Note 2.2.q). Rent-free periods are also frequently established in order to avoid having to pay rent
when stores are being refurbished and prepared for opening.
Lease contracts also sometimes require the lessee to pay certain amounts to the lessor which, from an
economic perspective, could be considered to be advance rental payments, or to pay amounts to the previous
tenants so that they waive certain rights or transfer them to the Group (leasehold assignment rights or various
types of indemnities). These amounts are recognized as non-current assets (see Note 15) and are generally
amortized over the term of the lease.
On certain occasions, shopping center developers or the proprietors of leased premises make contributions
towards the establishment of the Group’s business in their premises. These contributions are treated as lease
incentives (see Note 22) and are taken to income on a straight-line basis over the lease term.
There is also a wide variety of different lease terms, and leases generally have an initial term of between 15
and 25 years. However, as a result of legislation in certain countries or the purposes for which lease contracts
are habitually entered into, in some cases the term of the lease is shorter.

58
In some countries, legislation or the lease contracts themselves safeguard the ability of the lessee to terminate
the lease at any time during its term, provided that it gives the owner prior notice, as previously agreed (e.g.
three months' notice), of its decision to do so. In other cases, however, the Group is obliged to see out the full
term of the lease contract, or at least a significant portion thereof. Some contracts combine these obligations
with get-out clauses that may only be exercised at certain times during the term of the contract (e.g. every five
years or at the end of the tenth year).
The detail of the operating lease expense is as follows:
The breakdown of the future minimum lease payments under non-cancellable operating leases is as follows:
26) Financial risk management policy and financial instruments
Financial risk management policy
The Group’s activities are exposed to various financial risks: market risk (foreign currency risk and interest rate
risk) and other risks (credit risk, liquidity risk and country risk). The Group’s financial risk management focuses
on the uncertainty of financial markets and aims to minimize the potential adverse effects on the profitability of
its business.
This Note provides information on the Group’s exposure to each of the aforementioned risks, the Group’s
objectives, policies and processes for managing risk, the methods used to measure these risks, any changes
from the previous year and the financial instruments used to mitigate the risks.
Foreign currency risk
The Group operates in an international environment and, accordingly, is exposed to foreign currency risk on
transactions in currencies, in particular the US dollar (the euro is the Group's reference currency and the
functional currency of the Parent) and, to a lesser extent, the Mexican peso, the Russian rouble, the Chinese
yuan, the Japanese yen and the pound sterling. Foreign currency risk arises on future commercial transactions,
recognized assets and liabilities and net investments in foreign operations.
2016 2015
Minimum payments 1,819,582 1,728,979
Contingent rents 401,458 358,455
2,221,040 2,087,434
Sublease income 4,528 4,340
2016 2015
Less than one
year
One to five
years
Over five
years
Less than
one year
One to five
years
Over five
years
Lease payments 1,384,842 2,357,796 1,239,287 1,326,313 2,314,019 1,349,112

59
Foreign currency risk is managed in line with the corporate risk management model guidelines, which establish
the ongoing monitoring of exchange rate fluctuations and other measures designed to mitigate this risk, mainly
through the optimization of the Group's operations in order to minimize the impact, using natural hedges, the
benefits of diversification and the arrangement of financial hedges.
Merchandise and goods for resale are acquired partly through orders placed with foreign suppliers, mostly in
US dollars. In accordance with prevailing foreign currency risk management policies, Group management
arranges derivatives, mainly foreign currency forwards, to hedge fluctuations in cash flows relating to the EUR-
USD exchange rate. The Group also uses non-derivative financial instruments as hedges (e.g. deposits held in
currencies other than the euro), and these instruments are recognized under “Current financial investments”.
The Group's head companies supply their subsidiaries with finished goods for sale to the end customers. With
a view to reducing the fluctuations in value of the expected foreign currency cash flows arising from these
intercompany transactions (denominated in currencies other than the euro), the Group uses financial derivatives
such as zero-premium option combinations and, occasionally, foreign currency forwards and plain vanilla
options.
Certain Group subsidiaries are granted internal financing denominated in currencies other than the euro. In
accordance with prevailing foreign currency risk management policies, derivatives are arranged, mainly
forwards and cross currency swaps, to hedge the changes in fair value related to exchange rates.
As described in Note 2.2.o, the Group applies hedge accounting to mitigate the volatility that would arise in the
consolidated income statement as a result of the existence of significant foreign currency transactions. Hedge
accounting has been used because the Group meets the requirements described in Note 2.2.o on accounting
policies in order to be able to classify financial instruments as hedges for accounting purposes.
The Group applies the hedge accounting rules established in the applicable accounting standards. As a result,
certain financial instruments were formally designated as hedging instruments and the Group verified that the
hedges are highly effective. The maturity dates of the hedging instruments were negotiated so that they coincide
with those of the hedged items. In 2016, using hedge accounting, no significant amounts were recognized in
profit or loss either as a result of transactions that ultimately did not occur or as a result of the ineffectiveness of
the hedges.
Approximately 60% of the cash flows associated with hedges in US dollars are expected to occur in the six
months subsequent to year-end, while the remaining 40% are expected to fall due between six months and one
year. Also, the impact on the consolidated income statement will foreseeably occur in those periods. The
derivatives hedging the cash flows from intercompany transactions to supply finished goods for sale to end
customers have short-term time horizons aligned with the expected cash flows.
The fair value of the hedging instruments was calculated as described in Note 2.2.o.

60
The Group uses the cash-flow-at-risk (CFaR) methodology to estimate the potential loss in the Group's
consolidated profit before tax and financial results arising from the effect of changes in exchange rates on the
equivalent value of expected foreign currency cash flows in the following year. CFaR is calculated using
probabilistic simulation and considering volatilities and correlations based on market series for the last three
years. It is necessary to bear in mind the limitation that actual market changes and the magnitude and time
horizon of the exposures may differ from the assumptions considered for the CFaR calculation. The potential
negative impact is calculated with a confidence level of 95%. The impacts for each of the currencies are
aggregated, considering their correlations, in a portfolio of exposures, which reduces the value of the total risk.
It is estimated that the resulting negative impact on the 12-month expected cash flows, attributable to an
adverse change in the exchange rate, could be Euros 267 million at 31 January 2017 (Euros 137 million at 31
January 2016).
Credit risk
The Group is not exposed to significant concentrations of credit risk as policies are in place to cover sales to
franchises and retail sales represent the vast majority of revenue. Collections are made primarily in cash or
through credit card payments.
The Group adopts prudent criteria in its investment policy the main objectives of which are to mitigate the credit
risk associated with investment products and the counterparty risk associated with banks by establishing highly
detailed analysis criteria.
Investment vehicles are rated using a selection of criteria, including, inter alia, the ratings of the three main
rating agencies, the size of the investment vehicle, location and returns. All the investment vehicles have the
highest possible credit rating.
In addition to taking into account the credit ratings issued by the three main rating agencies, the Group considers
the solvency, liquidity, asset quality and managerial prudence of the banks, as well as the performance potential
of the bank in stressed conditions and standard probability of default models.
Based on the aforementioned counterparty risk considerations, the Group assigns a rating that determines the
maximum permissible exposure to a given bank. A rigorous analysis of the counterparty does not completely
eliminate credit risk and, therefore, these limits seek to guarantee a broad diversification of the banks used by
the Group. This principle of diversification is also applied to the jurisdiction in which assets are held and the
range of financial products used for investing purposes. In the specific case of short-term money market funds,
the credit analysis and diversification principles are satisfied by the requisite fulfilment by the investment vehicle
of domestic and regulatory requirements.
The credit risk resulting from the arrangement of financial derivatives is mitigated by the requirement that such
instruments be subject to an ISDA master agreement. Occasionally, where deemed necessary, the Group
requests that additional security be provided in the form of pledged collateral.
61
In relation to credit risk arising from commercial transactions, impairment losses are recognized for trade
receivables when objective evidence exists that the Group will be unable to recover all the outstanding amounts
in accordance with the original contractual conditions of the receivables. The amount of the impairment loss is
the difference between the carrying amount of the asset and the present value of the estimated cash flows,
discounted at the effective interest rate. The amount of the impairment loss is recognized in the consolidated
income statement. In 2016 there were no significant additions to or reversals of impairment losses in this
connection.
At 31 January 2017 and 2016, there were no material outstanding balances. Furthermore, based on available
historical data, the Group does not consider it necessary to make valuation adjustments to receivables which
are not past due. The fair value of the receivables does not differ from their carrying amount.
The main financial assets of the Group are shown in the “Financial instruments: other information” section
below.
Liquidity risk
The Group is not exposed to significant liquidity risk, as it maintains sufficient cash and cash equivalents to
meet the outflows required in its normal operations. If the Group has a specific financing requirement, either in
euros or in other currencies, it resorts to loans, credit facilities or other types of financial instruments (see Note
20).
Note 20 contains a detail of the financial liabilities, along with their scheduled maturities.
Interest rate risk
The Group's exposure to interest rate risk, which is no case is significant, arises principally in relation to the
following items:
- Cash and cash equivalents: given the Group’s investment policy (see Note 20), any changes in
interest rates at year-end would not significantly affect consolidated profits.
- Financial debt: given the amount of the Group’s external financing (see Note 20), any change in
interest rates at year-end would not significantly affect consolidated profits.
- Discount rates: used in the calculation of the impairment losses on non-current assets (property,
plant and equipment and intangible assets), goodwill and intangible assets with an indefinite useful
life (see Note 2.2.g).
- Derivatives: given the type of hedging instruments arranged, the interest rate risk is not material.

62
The Group does not have any material financial assets or liabilities designated as at fair value through profit or
loss.
Country risk
The international presence of the Group's business activities exposes it to the country risk of multiple
geographical regions, in both its supply and its sales and distribution activities. The Group adapts its
administrative and business processes in order to minimize country risk and take advantage of the benefits
of geographical diversification.
The outcome of the referendum held on 23 June 2016 on the United Kingdom's continued membership of the
European Union was an unexpected shock that brought added uncertainty to the markets. Nevertheless, its
impact on the Group in 2016 was not significant. The depreciation of the pound sterling as a result of the
Brexit vote did not trigger a material increase in foreign currency risk, in view of the behavior of the Group's
currency exposure portfolio due to its high level of diversification and the foreign currency risk management
policy in place.
One of the most significant manifestations of country risk is foreign currency risk and the possibility of
exposure to limits or controls on the free circulation of cash flows due to a lack of currency convertibility, in
current or capital account terms, or to unexpected restrictions on the movement of capital. The Group
manages cash at corporate level based on a highly active repatriation policy aimed at reducing the
aforementioned risks to a minimum.
At 31 January 2017, there was no significant risk in relation to the repatriation of funds or any material cash
surpluses not available for use by the Group or its subsidiaries. Similarly, there are no significant restrictions
on the Group's ability to access the assets and settle the liabilities of its subsidiaries.
At 31 January 2017, the Group did not operate in markets in which there was more than one exchange rate.
Capital management
The Group’s capital management objectives are to safeguard its ability to continue operating as a going
concern, so that it can continue to generate returns for shareholders and benefit other stakeholders, and to
maintain an optimum capital structure to reduce the cost of capital.
The Group manages its capital structure and makes adjustments thereto in response to changes in economic
conditions. The current capital management policy is based on self-financing through funds generated by
operations. The shareholder remuneration policy is detailed in Note 29.
There were no significant changes to capital management in the year.
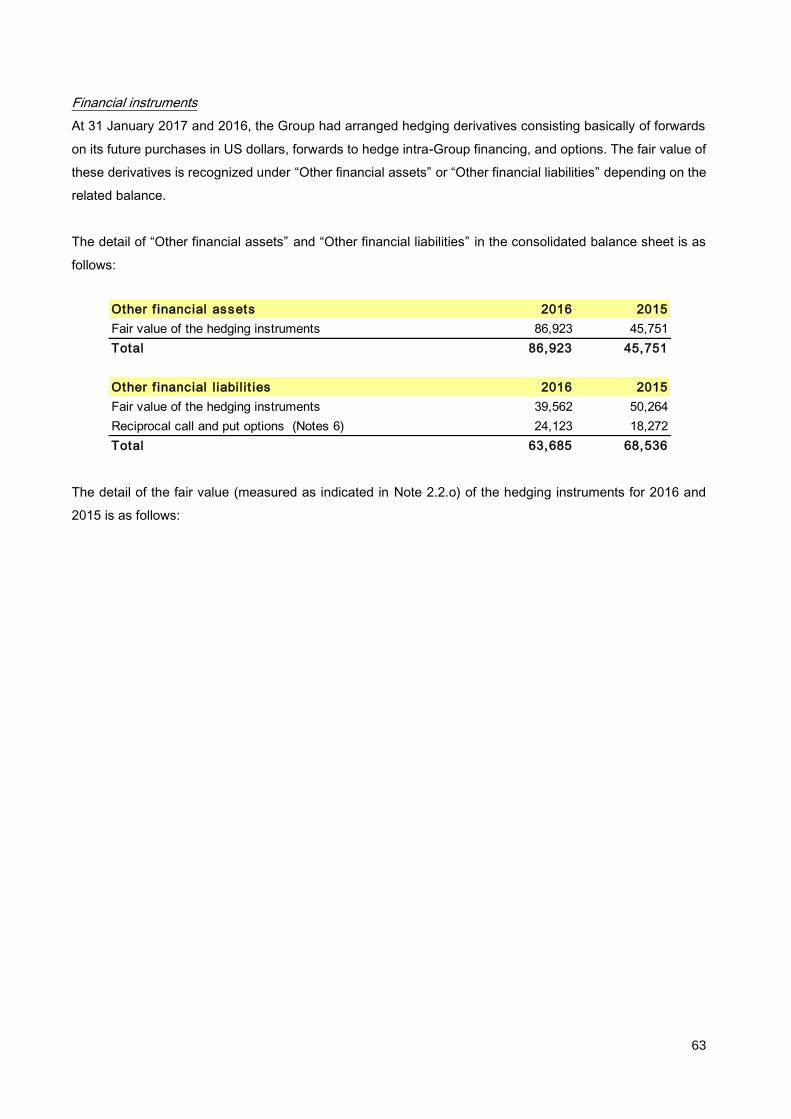
63
Financial instruments
At 31 January 2017 and 2016, the Group had arranged hedging derivatives consisting basically of forwards
on its future purchases in US dollars, forwards to hedge intra-Group financing, and options. The fair value of
these derivatives is recognized under “Other financial assets” or “Other financial liabilities” depending on the
related balance.
The detail of “Other financial assets” and “Other financial liabilities” in the consolidated balance sheet is as
follows:
The detail of the fair value (measured as indicated in Note 2.2.o) of the hedging instruments for 2016 and
2015 is as follows:
Other f inanc ial assets 2016 2015
Fair value of the hedging instruments 86,923 45,751
Total 86,923 45,751
Other f inanc ial l iabil i t ies 2016 2015
Fair value of the hedging instruments 39,562 50,264
Reciprocal call and put options (Notes 6) 24,123 18,272
Total 63,685 68,536

64
There were no transfers among the various levels of the fair value hierarchy (see Note 2.2.o).
2016
DESCRIPTION LEVEL
FAIR VALUE
2016
TRANSFER TO
INCOME
TRANSFER TO INCOME
FROM EQUITY
INCOME RECOGNISE
DIRECTLY IN EQUITY
FAIR VALUE
2015
OTC Derivatives
Foreign currency forwards 2 80,983 52,644 (36,439) 19,048 45,729
Options 2 5,901 - - 5,901 -
Zero-premium option combinations 2 39 17 - - 22
Total Der ivates 86,923 52,661 (36,439) 24,950 45,751
DESCRIPTION LEVEL
FAIR VALUE
2016
TRANSFER TO
INCOME
TRANSFER TO INCOME
FROM EQUITY
INCOME RECOGNISE
DIRECTLY IN EQUITY
FAIR VALUE
2015
OTC Derivatives
Foreign currency forwards 2 25,195 (17,339) (457) 9,357 33,634
Zero-premium option combinations 2 1 (25) - - 26
Cross Currency Swap 2 14,366 (474) - (1,722) 16,562
Interest rate Swap 2 - (41) - - 41
Total Der ivates 39,562 (17,879) (457) 7,635 50,264
2015
DESCRIPTION LEVEL
FAIR VALUE
2015
TRANSFER TO
INCOME
TRANSFER TO INCOME
FROM EQUITY
INCOME RECOGNISE
DIRECTLY IN EQUITY
FAIR VALUE
2014
OTC Derivatives
Foreign currency forwards 2 45,729 (71,079) (97,569) 45,429 168,947
Cross Currency Swap 2 22 22 - - -
Total Der ivates 45,751 (71,057) (97,569) 45,429 168,947
DESCRIPTION LEVEL
FAIR VALUE
2015
TRANSFER TO
INCOME
TRANSFER TO INCOME
FROM EQUITY
INCOME RECOGNISE
DIRECTLY IN EQUITY
FAIR VALUE
2014
OTC Derivatives
Foreign currency forwards 2 33,634 (13,122) (972) 9,448 38,281
Zero-premium option combinations 2 26 26 - - -
Cross Currency Swap 2 16,562 277 762 (1,702) 17,226
Interest rate Swap 2 41 (164) - - 204
Total Der ivates 50,264 (12,983) (211) 7,746 55,711
OTHER FINANCIAL LIABILITIES AT FAIR VALUE AND CLASSIFICATION ON A FAIR VALUE HIERARCHY
OTHER FINANCIAL ASSETS AT FAIR VALUE AND CLASSIFICATION ON A FAIR VALUE HIERARCHY
OTHER FINANCIAL ASSETS AT FAIR VALUE AND CLASSIFICATION ON A FAIR VALUE HIERARCHY
OTHER FINANCIAL LIABILITIES AT FAIR VALUE AND CLASSIFICATION ON A FAIR VALUE HIERARCHY
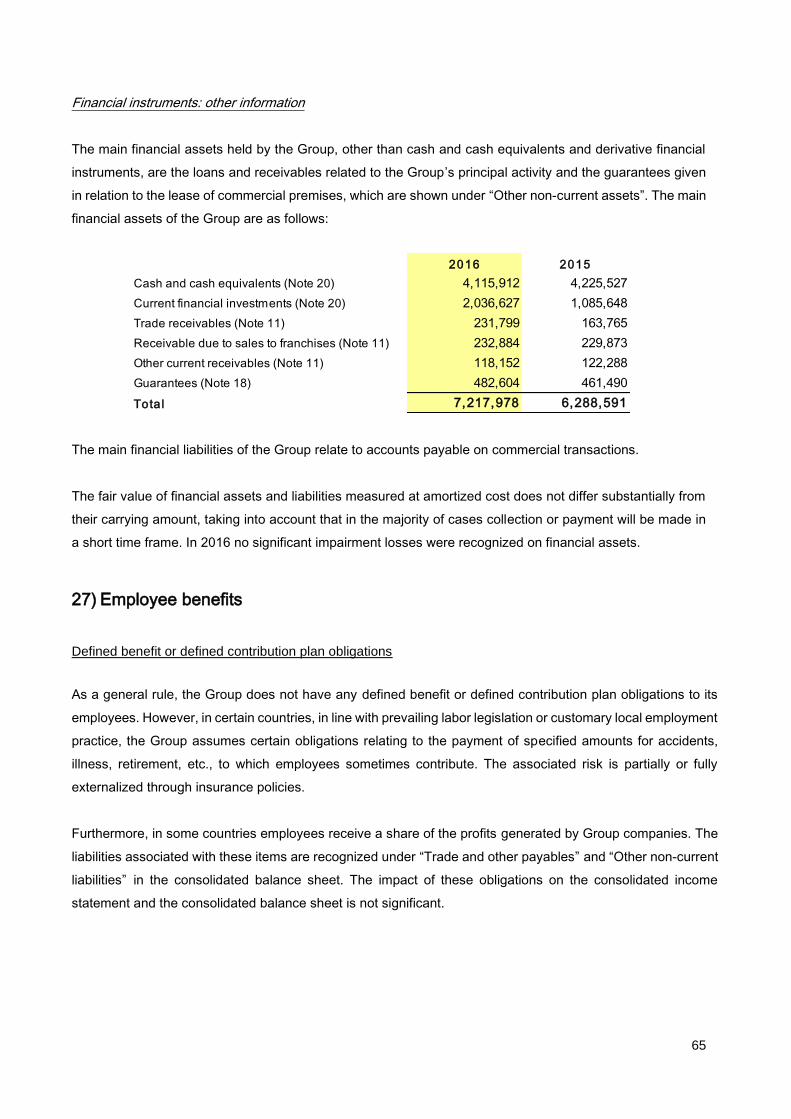
65
Financial instruments: other information
The main financial assets held by the Group, other than cash and cash equivalents and derivative financial
instruments, are the loans and receivables related to the Group’s principal activity and the guarantees given
in relation to the lease of commercial premises, which are shown under “Other non-current assets”. The main
financial assets of the Group are as follows:
The main financial liabilities of the Group relate to accounts payable on commercial transactions.
The fair value of financial assets and liabilities measured at amortized cost does not differ substantially from
their carrying amount, taking into account that in the majority of cases collection or payment will be made in
a short time frame. In 2016 no significant impairment losses were recognized on financial assets.
27) Employee benefits
Defined benefit or defined contribution plan obligations
As a general rule, the Group does not have any defined benefit or defined contribution plan obligations to its
employees. However, in certain countries, in line with prevailing labor legislation or customary local employment
practice, the Group assumes certain obligations relating to the payment of specified amounts for accidents,
illness, retirement, etc., to which employees sometimes contribute. The associated risk is partially or fully
externalized through insurance policies.
Furthermore, in some countries employees receive a share of the profits generated by Group companies. The
liabilities associated with these items are recognized under “Trade and other payables” and “Other non-current
liabilities” in the consolidated balance sheet. The impact of these obligations on the consolidated income
statement and the consolidated balance sheet is not significant.
2016 2015
Cash and cash equivalents (Note 20) 4,115,912 4,225,527
Current financial investments (Note 20) 2,036,627 1,085,648
Trade receivables (Note 11) 231,799 163,765
Receivable due to sales to franchises (Note 11) 232,884 229,873
Other current receivables (Note 11) 118,152 122,288
Guarantees (Note 18) 482,604 461,490
Total 7,217,978 6,288,591

66
Long-term incentive plans
2013-2017 Long-Term Share-Based Incentive Plan
The annual general shareholders’ meeting held on 16 July 2013 resolved to launch the 2013-2017 Long-Term
Share-Based Incentive Plan (the “2013-2017 Plan”) for members of the management team and other personnel
of Inditex and of its corporate Group. Under the 2013-2017 Plan, each of the beneficiaries will be entitled,
provided the terms and conditions established therein are fulfilled, to receive a number of shares up to the
maximum number allocated to each of them.
The 2013-2017 Plan consists of two mutually independent time cycles. The first cycle of the 2013-2017 Plan
ran from 1 July 2013 to 30 June 2016 (now ended). The second cycle of the Plan is from 1 July 2014 to 30 June
2017.
The amount relating to this plan is recognized under “Equity” in the consolidated balance sheet and the period
charge is recognized under “Operating expenses” in the consolidated income statement. The impact of these
obligations on the consolidated income statement and the consolidated balance sheet is not material.
The 2013-2017 Plan does not expose the Group to any material risks.
To cater for this 2013-2017 Long-Term Share-Based Incentive Plan, the Group acquired, as a plan asset, a
sufficient number of treasury shares to be able to settle the future obligations (see Note 23).
The number of shares to be delivered to beneficiaries is calculated on the basis of the metrics indicated in the
fifth resolution of the annual general shareholders’ meeting held on 16 July 2013.
2016-2020 Long-Term Incentive Plan
The annual general shareholders’ meeting held on 19 July 2016 approved the 2016-2020 Long-Term Incentive
Plan (the “2016-2020 Plan”) for members of the management team and other personnel of Inditex and of its
corporate Group. Under this Plan, each of the beneficiaries will be entitled, provided the terms and conditions
established therein are fulfilled, to receive up to a maximum amount of the incentive allocated.
The 2016-2020 Plan combines a multi-year cash bonus and a restricted stock unit award which, after a specified
period of time has elapsed and the achievement of specific targets has been verified, will be paid to the plan
beneficiaries, either in full or at the percentage applicable in each case.
The 2016-2020 Plan has a total duration of four years and is structured into two mutually independent time
cycles. The first cycle of the 2016-2020 Plan is from 1 February 2016 to 31 January 2019. The second cycle
spans the period from 1 February 2017 to 31 January 2020.
67
The 2016-2020 Plan is linked to critical business targets and the creation of shareholder value.
The 2016-2020 Plan does not expose the Group to any material risks.
The liability relating to the cash-settled component of the 2016-2020 Plan is recognized under “Provisions” in
the consolidated balance sheet and the related period provision is reflected under “Operating expenses” in the
consolidated income statement. The impact of these obligations on the consolidated income statement and the
consolidated balance sheet is not material.
The amount relating to the equity-settled component of the 2016-2020 Plan is recognized under “Equity” in the
consolidated balance sheet and the related period charge is reflected under “Operating expenses” in the
consolidated income statement. The impact of these obligations on the consolidated income statement and the
consolidated balance sheet is not material.
To cater for this 2016-2020 Plan, the Group acquired, as a plan asset, a sufficient number of treasury shares
to be able to settle the future obligations (see Note 23).
The incentive to be received will be calculated as provided for in the seventh resolution of the annual general
shareholders’ meeting held on 19 July 2016.
Extraordinary profit-sharing plan
In view of the Group's performance in recent years, the Board of Directors of Inditex approved an
extraordinary plan for 2015-2016 to allow employees to share in the growth of profits. The plan is intended
for all the employees of the stores, manufacturing and logistics centers, and concepts and subsidiaries around
the world with a length of service of more than two years at the Group. Among all those participating in the
plan, the Group will distribute 10% of the year-on-year increase in net profit attributable to the Parent of the
Group, up to a maximum of 2% of total net profit. In 2016 more than 84,000 employees worldwide were plan
beneficiaries (2015: more than 78,000 employees).
The plan has a two-year duration, covering the 2015 and 2016 reporting periods. The first phase of the plan
was executed in April 2016 taking into account the increase in the net profit attributable to the Parent of the
Group in 2015 as compared with 2014. The second phase will be executed in 2017, in accordance with the
criteria described in Note 6.
The liability relating to this plan is recognized under “Trade and other payables” in the consolidated balance
sheet and the related period charge is reflected under “Operating expenses” and “Other losses and income,
net” in the consolidated income statement. The impact of these obligations on the consolidated income
statement and the consolidated balance sheet is not material.

68
28) Jointly controlled entities
Inditex has a 50% stake in the group formed by the parent Tempe, S.A. and its subsidiaries, the detail of
which is shown in the following table. The core activity of these companies is basically the design, supply and
distribution of footwear for the various retail formats of the Inditex Group, which is their main customer.
Set forth below is the financial information of the Tempe Group (expressed in thousands of euros), obtained
from its consolidated annual accounts prepared in accordance with IFRSs, together with other relevant
financial information:
In 2016 the Group received dividends totalling Euros 27,493 thousand (Euros 22,414 thousand in 2015) from
Tempe (see Note 17).
CompanyEffec tive % of
ownershipLocation Consolidation method Repor ting date Chain Line of bus iness
Tempe, S.A. 50.00% Alicante - Spain Equity method 31-Jan Multi-concept Sale of footwear
Tempe México, S.A. de C.V. 50.00% Mexico City - Mexico Equity method 31-Dec Multi-concept Sale of footwear
Tempe Logística, S.A. 50.00% Alicante - Spain Equity method 31-Jan Multi-concept Logistics
Tempe Brasil, Ltda. 50.00% Sao Paulo -Brazil Equity method 31-Dec Multi-concept Sale of footwear
Tempe Diseño, S.L. 50.00% Alicante - Spain Equity method 31-Jan Multi-concept Design
Tempe Trading 50.00% Fribourg - Switzerland Equity method 31-Oct Multi-concept Dormant
Tempe Trading Asia Limited 50.00% Hong Kong - China Equity method 31-Jan Multi-concept Sale of footwear
TMP Trading (Shanghai) Co. Ltd 50.00% Shanghai- China Equity method 31-Dec Multi-concept Sale of footwear
2016 2015
Property, plant and equipment 159,896 153,536
Others 24,990 23,578
Non-current assets 184,886 177,114
Inventories 240,929 207,737
Trade and other receivables 351,323 293,632
Cash and cash equivalents 41,767 32,920
Current assets 634,018 534,290
Non-current l iabil i t ies (48,065) (32,109)
Trade and other payables (338,409) (278,470)
Others (6,406) (20,739)
Current liabilities (344,815) (299,210)
Net assets 426,025 380,084
Revenues 1,237,575 1,117,422
Gross prof it 307,846 324,890
Operating expenses (169,323) (152,505)
Amortization and depreciation (21,887) (20,872)
EBIT 116,516 152,470
Net profit 94,846 110,976

69
29) Proposed distribution of the profit of the Parent
The directors will propose that Euros 2,116,868 thousand of 2016 net profit of the Parent, which is the maximum
amount distributable, be distributed as an ordinary dividend of Euros 0.50 gross per share and an extraordinary
dividend of Euros 0.18 gross per share on the total outstanding shares, and that Euros 98,857 thousand be taken
to voluntary reserves.
30) Remuneration of the Board of Directors and related party transactions
Remuneration of the Board of Directors
The remuneration earned by the Board of Directors and senior management of the Company in 2016 is shown in the
section on related party transactions.
Other information concerning the Board of Directors
According to the public registers of the Spanish National Securities Market Commission (CNMV), at 31 January
2017 the members of the Board of Directors held the following direct and indirect investments in the share capital
of Inditex:
As established in Article 229 of the Spanish Companies Act, amended by Law 31/2014, of 3 December, reforming
that Act in order to improve corporate governance, it is hereby disclosed that the directors did not report any
situation of direct or indirect conflict of interest that they or persons related to them might have with the Parent. Two
of the directors each notified the Board of Directors of a potential conflict of interest, of which the Board took due
Note. These conflicts of interest did not materialise in 2016. At the date of formal preparation of the consolidated
annual accounts, the two concerned directors had reported that the potential conflicts of interest no longer existed.
When the Board of Directors deliberated on the appointment or re-election of a director, on the acknowledgment
and acceptance of his/her resignation, on the placement of his/her office at the disposal of the Board, on
Mr Pablo Isla Álvarez de Tejera 1,866,227 - 0.0598%
Mr Amancio Ortega Gaona - 1,848,000,315 1 59.294%
Mr José Arnau Sierra 30,000 - 0.001%
PONTEGADEA INVERSIONES, S.L. 1,558,637,990 - 50.010%
Ms Denise Patricia Kingsmill - - -
Mr José Luis Durán Schulz 1,700 - -
Mr Rodrigo Echenique Gordillo - - -
Mr Carlos Espinosa de los Monteros Bernaldo de Quirós 150,000 - 0.005%
Mr Emilio Saracho Rodríguez de Torres - - -
Total 59.36%
1 Throuhg Pontegadea Inversiones, SL and Partler 2006, S.L.
Name or company name of direc tor
Number of direc t
shares
Number of indirec t
shares
Percentage of
capital
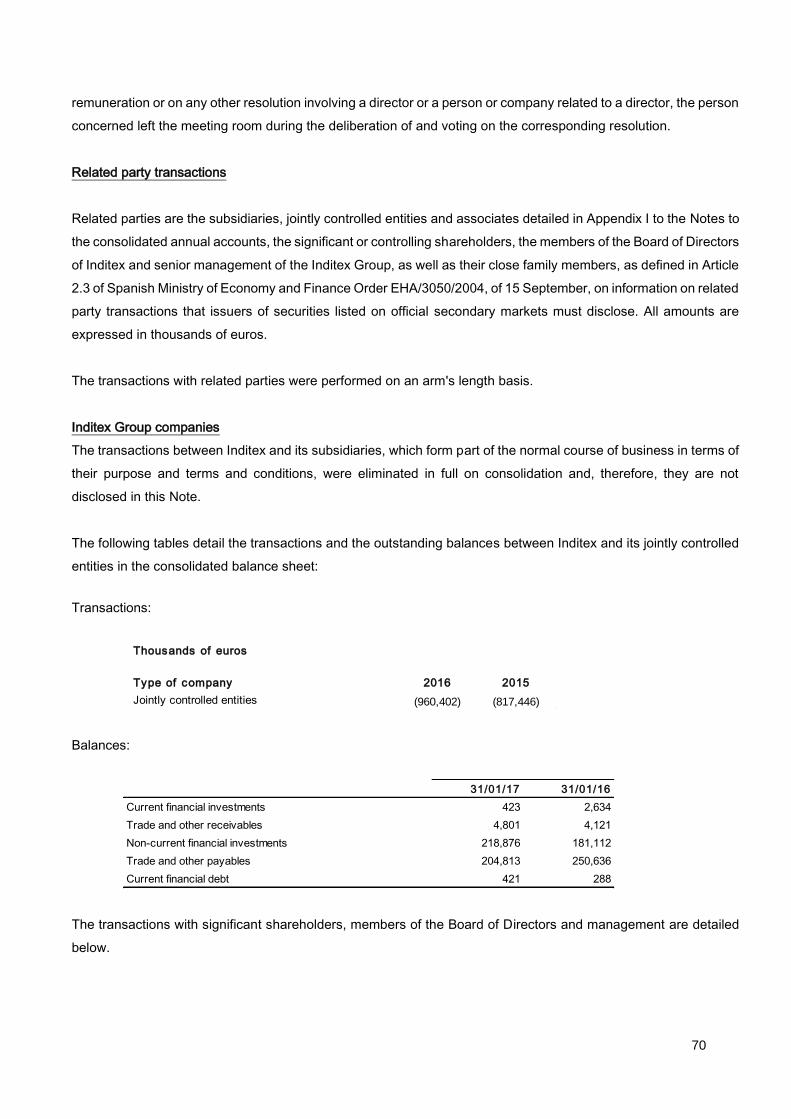
70
remuneration or on any other resolution involving a director or a person or company related to a director, the person
concerned left the meeting room during the deliberation of and voting on the corresponding resolution.
Related party transactions
Related parties are the subsidiaries, jointly controlled entities and associates detailed in Appendix I to the Notes to
the consolidated annual accounts, the significant or controlling shareholders, the members of the Board of Directors
of Inditex and senior management of the Inditex Group, as well as their close family members, as defined in Article
2.3 of Spanish Ministry of Economy and Finance Order EHA/3050/2004, of 15 September, on information on related
party transactions that issuers of securities listed on official secondary markets must disclose. All amounts are
expressed in thousands of euros.
The transactions with related parties were performed on an arm's length basis.
Inditex Group companies
The transactions between Inditex and its subsidiaries, which form part of the normal course of business in terms of
their purpose and terms and conditions, were eliminated in full on consolidation and, therefore, they are not
disclosed in this Note.
The following tables detail the transactions and the outstanding balances between Inditex and its jointly controlled
entities in the consolidated balance sheet:
Transactions:
Balances:
The transactions with significant shareholders, members of the Board of Directors and management are detailed
below.
Thousands of euros
2016 2015
Jointly controlled entities (960,402) (817,446)
Type of company
31/01/17 31/01/16
Current financial investments 423 2,634
Trade and other receivables 4,801 4,121
Non-current financial investments 218,876 181,112
Trade and other payables 204,813 250,636
Current financial debt 421 288
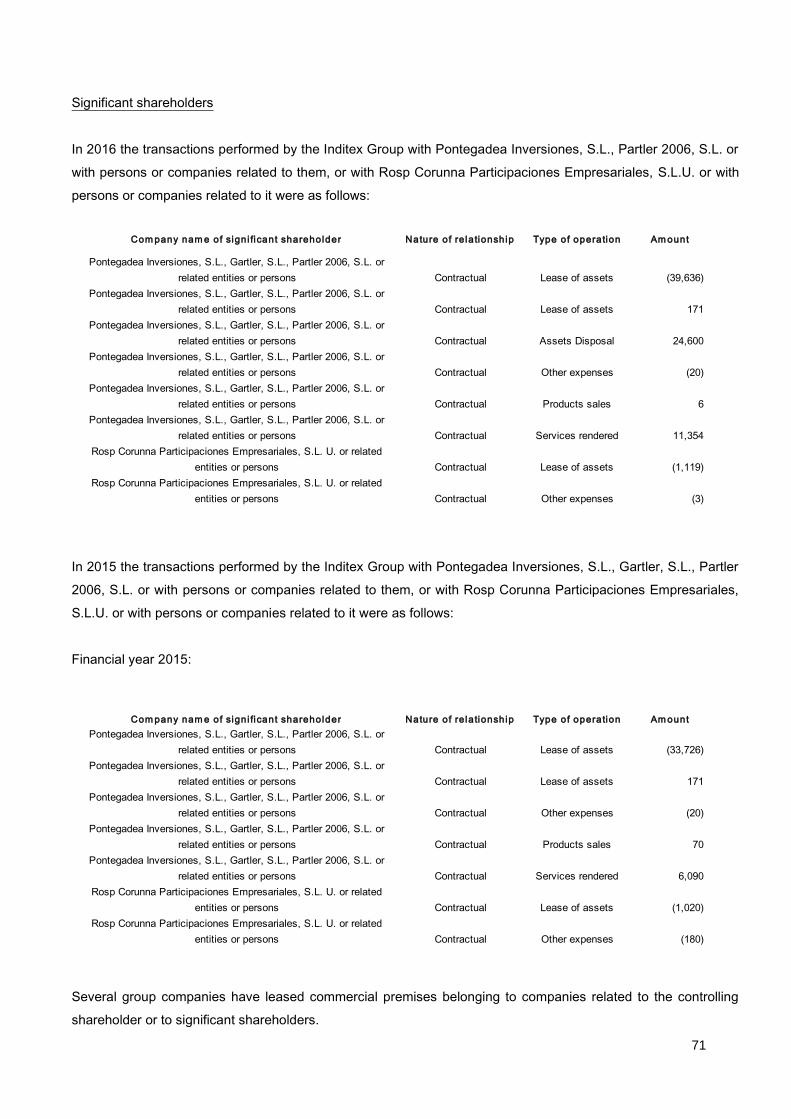
71
Significant shareholders
In 2016 the transactions performed by the Inditex Group with Pontegadea Inversiones, S.L., Partler 2006, S.L. or
with persons or companies related to them, or with Rosp Corunna Participaciones Empresariales, S.L.U. or with
persons or companies related to it were as follows:
In 2015 the transactions performed by the Inditex Group with Pontegadea Inversiones, S.L., Gartler, S.L., Partler
2006, S.L. or with persons or companies related to them, or with Rosp Corunna Participaciones Empresariales,
S.L.U. or with persons or companies related to it were as follows:
Financial year 2015:
Several group companies have leased commercial premises belonging to companies related to the controlling
shareholder or to significant shareholders.
Com pany nam e of sign i ficant shareholder Nature of re lationship Type of operation Am ount
Pontegadea Inversiones, S.L., Gartler, S.L., Partler 2006, S.L. or
related entities or persons Contractual Lease of assets (39,636)
Pontegadea Inversiones, S.L., Gartler, S.L., Partler 2006, S.L. or
related entities or persons Contractual Lease of assets 171
Pontegadea Inversiones, S.L., Gartler, S.L., Partler 2006, S.L. or
related entities or persons Contractual Assets Disposal 24,600
Pontegadea Inversiones, S.L., Gartler, S.L., Partler 2006, S.L. or
related entities or persons Contractual Other expenses (20)
Pontegadea Inversiones, S.L., Gartler, S.L., Partler 2006, S.L. or
related entities or persons Contractual Products sales 6
Pontegadea Inversiones, S.L., Gartler, S.L., Partler 2006, S.L. or
related entities or persons Contractual Services rendered 11,354
Rosp Corunna Participaciones Empresariales, S.L. U. or related
entities or persons Contractual Lease of assets (1,119)
Rosp Corunna Participaciones Empresariales, S.L. U. or related
entities or persons Contractual Other expenses (3)
Com pany nam e of sign i ficant shareholder Nature of re lationship Type of operation Am ount
Pontegadea Inversiones, S.L., Gartler, S.L., Partler 2006, S.L. or
related entities or persons Contractual Lease of assets (33,726)
Pontegadea Inversiones, S.L., Gartler, S.L., Partler 2006, S.L. or
related entities or persons Contractual Lease of assets 171
Pontegadea Inversiones, S.L., Gartler, S.L., Partler 2006, S.L. or
related entities or persons Contractual Other expenses (20)
Pontegadea Inversiones, S.L., Gartler, S.L., Partler 2006, S.L. or
related entities or persons Contractual Products sales 70
Pontegadea Inversiones, S.L., Gartler, S.L., Partler 2006, S.L. or
related entities or persons Contractual Services rendered 6,090
Rosp Corunna Participaciones Empresariales, S.L. U. or related
entities or persons Contractual Lease of assets (1,020)
Rosp Corunna Participaciones Empresariales, S.L. U. or related
entities or persons Contractual Other expenses (180)

72
Members of the Board of Directors and management
The following tables show the remuneration and termination benefits earned by the directors and management of
Inditex in 2016:
An itemized breakdown of the remuneration of the members of the Board of Directors in 2016 is as follows:
An itemized breakdown of the remuneration of the members of the Board of Directors in 2015 is as follows:
The total remuneration and termination benefits earned by senior management of the Inditex Group in 2016 were
as follows:
Remuneration Remuneration Fixed Var iable Multiannual Total
of Board for chair ing remunerationremuneration var iable 2016
Members Committees remuneration
Mr Pablo Isla Álvarez de Tejera Executive 100 0 0 0 3,250 3,627 3,395 10,372
Mr José Arnau Sierra Propietary 100 80 150 0 0 0 0 330
Mr Amancio Ortega Gaona Propietary 100 0 0 0 0 0 0 100
PONTEGADEA INVERSIONES S.L. (1) Propietary 100 0 0 0 0 0 0 100
Ms Irene R.Miller (2) Independent 46 0 70 23 0 0 0 139
Ms Denise Patricia Kingsmill (3) Independent 54 0 80 0 0 0 0 134
Mr.José Luis Durán Schulz (4) Independent 100 0 150 27 0 0 0 277
Mr Carlos Espinosa Bernaldo de Quirós Other external 100 0 150 0 0 0 0 250
Mr Rodrigo Echenique Gordillo Independent 100 0 150 50 0 0 0 300
Mr Emilio Saracho Rodríguez de Torres Independent 100 0 150 50 0 0 0 300
TOTAL 900 80 900 150 3,250 3,627 3,395 12,302
Notes:
(1) Represented by Ms Flora Pérez Marcote
(2) Cessation of employment af 18 July 2016
(3) Appointment at 19 July 2016
(4) Appointment as Audit and Control Comitee at 19 July 2016
Type
Remuneration of
Deputy Chairman
of Board of
Direc tors
Remuneration for
serv ing on Comittees
and other Board of
Direc tors
Remuneration Remuneration Fixed Var iable Multiannual Total
of Board for chair ing remunerationremuneration var iable 2015
Members Committees remuneration
Mr Pablo Isla Álvarez de Tejera Executive 100 0 0 0 3,250 3,300 5,520 12,170
Mr José Arnau Sierra Propietary 100 80 127 0 0 0 0 307
Mr Amancio Ortega Propietary 100 0 0 0 0 0 0 100
GARTLER, S.L .(1) Propietary 85 0 0 0 0 0 0 85
PONTEGADEA INVERSIONES S.L. (2) Propietary 15 0 0 0 0 0 0 15
Ms Irene R.Miller Independent 100 0 127 50 0 0 0 277
Mr Nils Smedegaard Andersen (3) Independent 45 0 45 0 0 0 0 90
Mr.José Luis Durán Schulz (4) Independent 55 0 82 0 0 0 0 137
Mr Carlos Espinosa Bernaldo de Quirós Other external 100 0 127 0 0 0 0 227
Mr Rodrigo Echenique Gordillo Independent 100 0 127 50 0 0 0 277
Mr Emilio Saracho Rodríguez de Torres Independent 100 0 127 27 0 0 0 254
TOTAL 900 80 762 127 3,250 3,300 5,520 13,939
Notes:
(1) Represented by Ms Flora Pérez Marcote. Cessation of employment at 8 December 2015
(1) Represented by Ms Flora Pérez Marcote. Appointment at 9 December 2015
(3) Cessation of employment at 13 July 2015
(4) Appointment at 14 July 2015
Type
Remuneration of
Deputy Chairman
of Board of
Direc tors
Remuneration for
serv ing on Comittees
and other Board of
Direc tors
MANAGEMENT
Remuneration 31,379
Termination benefits -
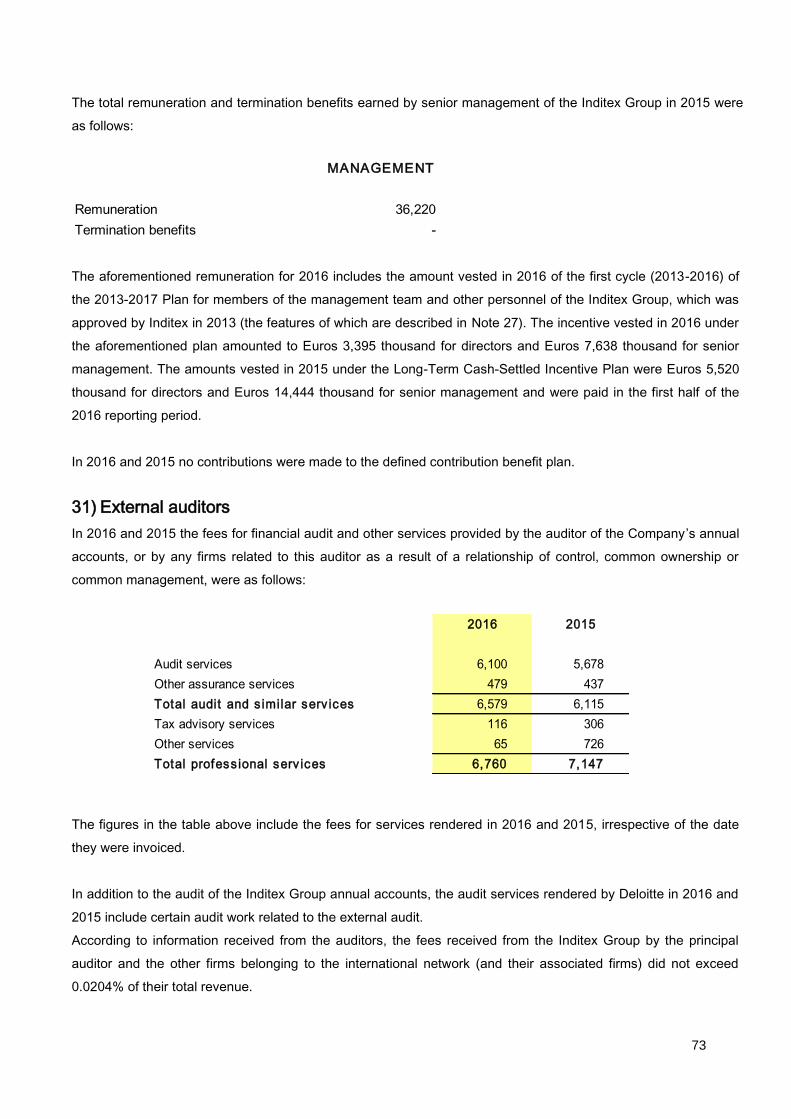
73
The total remuneration and termination benefits earned by senior management of the Inditex Group in 2015 were
as follows:
The aforementioned remuneration for 2016 includes the amount vested in 2016 of the first cycle (2013-2016) of
the 2013-2017 Plan for members of the management team and other personnel of the Inditex Group, which was
approved by Inditex in 2013 (the features of which are described in Note 27). The incentive vested in 2016 under
the aforementioned plan amounted to Euros 3,395 thousand for directors and Euros 7,638 thousand for senior
management. The amounts vested in 2015 under the Long-Term Cash-Settled Incentive Plan were Euros 5,520
thousand for directors and Euros 14,444 thousand for senior management and were paid in the first half of the
2016 reporting period.
In 2016 and 2015 no contributions were made to the defined contribution benefit plan.
31) External auditors
In 2016 and 2015 the fees for financial audit and other services provided by the auditor of the Company ’s annual
accounts, or by any firms related to this auditor as a result of a relationship of control, common ownership or
common management, were as follows:
The figures in the table above include the fees for services rendered in 2016 and 2015, irrespective of the date
they were invoiced.
In addition to the audit of the Inditex Group annual accounts, the audit services rendered by Deloitte in 2016 and
2015 include certain audit work related to the external audit.
According to information received from the auditors, the fees received from the Inditex Group by the principal
auditor and the other firms belonging to the international network (and their associated firms) did not exceed
0.0204% of their total revenue.
MANAGEMENT
Remuneration 36,220
Termination benefits -
2016 2015
Audit services 6,100 5,678
Other assurance services 479 437
Total audit and s imilar serv ices 6,579 6,115
Tax advisory services 116 306
Other services 65 726
Total profess ional serv ices 6,760 7,147

74
The fees for financial audit services provided by auditors other than the principal auditor amounted to Euros 58
thousand in 2016.
32) Environment
In view of the business activities carried on by the Group, it does not have any environmental liability, expenses,
assets, provisions or contingencies that might be material with respect to its equity, financial position or results.
Therefore, no specific disclosures relating to environmental issues are included in these Notes to the consolidated
annual accounts.
33) Events after the reporting period
At the date of formal preparation of these consolidated annual accounts no matters had been disclosed that
might modify the consolidated annual accounts or give rise to disclosures additional to those already included
in these consolidated annual accounts.
34) Explanation added for translation to English
These consolidated annual accounts are presented on the basis of the regulatory financial reporting framework
applicable to the Group in Spain (see first page of the Notes). Certain accounting practices applied by the Group
that conform with that regulatory framework may not conform with other generally accepted accounting
principles and rules.
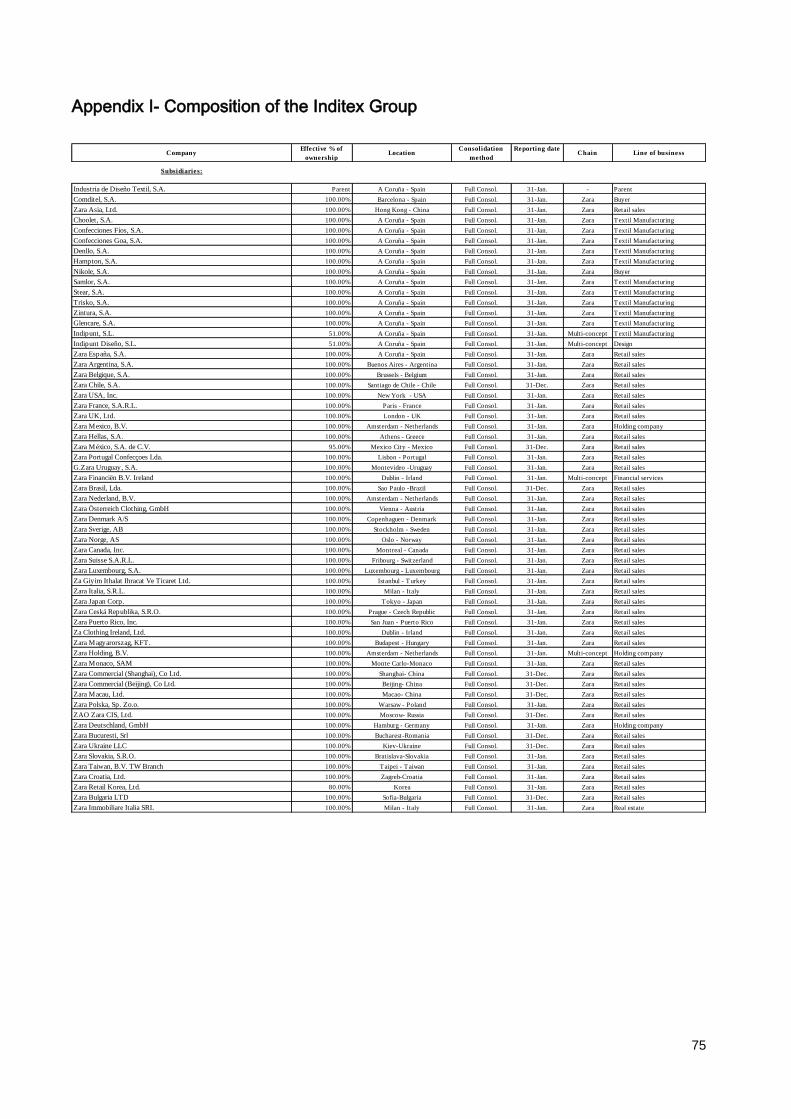
75
Appendix I- Composition of the Inditex Group
CompanyEffective % of
ownershipLocation
Consolidation
method
Reporting dateChain Line of business
Subsidiaries:
Industria de Diseño Textil, S.A. Parent A Coruña - Spain Full Consol. 31-Jan. - Parent
Comditel, S.A. 100.00% Barcelona - Spain Full Consol. 31-Jan. Zara Buyer
Zara Asia, Ltd. 100.00% Hong Kong - China Full Consol. 31-Jan. Zara Retail sales
Choolet, S.A. 100.00% A Coruña - Spain Full Consol. 31-Jan. Zara Textil Manufacturing
Confecciones Fíos, S.A. 100.00% A Coruña - Spain Full Consol. 31-Jan. Zara Textil Manufacturing
Confecciones Goa, S.A. 100.00% A Coruña - Spain Full Consol. 31-Jan. Zara Textil Manufacturing
Denllo, S.A. 100.00% A Coruña - Spain Full Consol. 31-Jan. Zara Textil Manufacturing
Hampton, S.A. 100.00% A Coruña - Spain Full Consol. 31-Jan. Zara Textil Manufacturing
Nikole, S.A. 100.00% A Coruña - Spain Full Consol. 31-Jan. Zara Buyer
Samlor, S.A. 100.00% A Coruña - Spain Full Consol. 31-Jan. Zara Textil Manufacturing
Stear, S.A. 100.00% A Coruña - Spain Full Consol. 31-Jan. Zara Textil Manufacturing
Trisko, S.A. 100.00% A Coruña - Spain Full Consol. 31-Jan. Zara Textil Manufacturing
Zintura, S.A. 100.00% A Coruña - Spain Full Consol. 31-Jan. Zara Textil Manufacturing
Glencare, S.A. 100.00% A Coruña - Spain Full Consol. 31-Jan. Zara Textil Manufacturing
Indipunt, S.L. 51.00% A Coruña - Spain Full Consol. 31-Jan. Multi-concept Textil Manufacturing
Indipunt Diseño, S.L. 51.00% A Coruña - Spain Full Consol. 31-Jan. Multi-concept Design
Zara España, S.A. 100.00% A Coruña - Spain Full Consol. 31-Jan. Zara Retail sales
Zara Argentina, S.A. 100.00% Buenos Aires - Argentina Full Consol. 31-Jan. Zara Retail sales
Zara Belgique, S.A. 100.00% Brussels - Belgium Full Consol. 31-Jan. Zara Retail sales
Zara Chile, S.A. 100.00% Santiago de Chile - Chile Full Consol. 31-Dec. Zara Retail sales
Zara USA, Inc. 100.00% New York - USA Full Consol. 31-Jan. Zara Retail sales
Zara France, S.A.R.L. 100.00% Paris - France Full Consol. 31-Jan. Zara Retail sales
Zara UK, Ltd. 100.00% London - UK Full Consol. 31-Jan. Zara Retail sales
Zara Mexico, B.V. 100.00% Amsterdam - Netherlands Full Consol. 31-Jan. Zara Holding company
Zara Hellas, S.A. 100.00% Athens - Greece Full Consol. 31-Jan. Zara Retail sales
Zara México, S.A. de C.V. 95.00% Mexico City - Mexico Full Consol. 31-Dec. Zara Retail sales
Zara Portugal Confecçoes Lda. 100.00% Lisbon - Portugal Full Consol. 31-Jan. Zara Retail sales
G.Zara Uruguay, S.A. 100.00% Montevideo -Uruguay Full Consol. 31-Jan. Zara Retail sales
Zara Financiën B.V. Ireland 100.00% Dublin - Irland Full Consol. 31-Jan. Multi-concept Financial services
Zara Brasil, Lda. 100.00% Sao Paulo -Brazil Full Consol. 31-Dec. Zara Retail sales
Zara Nederland, B.V. 100.00% Amsterdam - Netherlands Full Consol. 31-Jan. Zara Retail sales
Zara Österreich Clothing, GmbH 100.00% Vienna - Austria Full Consol. 31-Jan. Zara Retail sales
Zara Denmark A/S 100.00% Copenhaguen - Denmark Full Consol. 31-Jan. Zara Retail sales
Zara Sverige, AB 100.00% Stockholm - Sweden Full Consol. 31-Jan. Zara Retail sales
Zara Norge, AS 100.00% Oslo - Norway Full Consol. 31-Jan. Zara Retail sales
Zara Canada, Inc. 100.00% Montreal - Canada Full Consol. 31-Jan. Zara Retail sales
Zara Suisse S.A.R.L. 100.00% Fribourg - Switzerland Full Consol. 31-Jan. Zara Retail sales
Zara Luxembourg, S.A. 100.00% Luxembourg - Luxembourg Full Consol. 31-Jan. Zara Retail sales
Za Giyim Ithalat Ihracat Ve Ticaret Ltd. 100.00% Istanbul - Turkey Full Consol. 31-Jan. Zara Retail sales
Zara Italia, S.R.L. 100.00% Milan - Italy Full Consol. 31-Jan. Zara Retail sales
Zara Japan Corp. 100.00% Tokyo - Japan Full Consol. 31-Jan. Zara Retail sales
Zara Ceská Republika, S.R.O. 100.00% Prague - Czech Republic Full Consol. 31-Jan. Zara Retail sales
Zara Puerto Rico, Inc. 100.00% San Juan - Puerto Rico Full Consol. 31-Jan. Zara Retail sales
Za Clothing Ireland, Ltd. 100.00% Dublin - Irland Full Consol. 31-Jan. Zara Retail sales
Zara Magyarorszag, KFT. 100.00% Budapest - Hungary Full Consol. 31-Jan. Zara Retail sales
Zara Holding, B.V. 100.00% Amsterdam - Netherlands Full Consol. 31-Jan. Multi-concept Holding company
Zara Monaco, SAM 100.00% Monte Carlo-Monaco Full Consol. 31-Jan. Zara Retail sales
Zara Commercial (Shanghai), Co Ltd. 100.00% Shanghai- China Full Consol. 31-Dec. Zara Retail sales
Zara Commercial (Beijing), Co Ltd. 100.00% Beijing- China Full Consol. 31-Dec. Zara Retail sales
Zara Macau, Ltd. 100.00% Macao- China Full Consol. 31-Dec. Zara Retail sales
Zara Polska, Sp. Zo.o. 100.00% Warsaw - Poland Full Consol. 31-Jan. Zara Retail sales
ZAO Zara CIS, Ltd. 100.00% Moscow- Russia Full Consol. 31-Dec. Zara Retail sales
Zara Deutschland, GmbH 100.00% Hamburg - Germany Full Consol. 31-Jan. Zara Holding company
Zara Bucuresti, Srl 100.00% Bucharest-Romania Full Consol. 31-Dec. Zara Retail sales
Zara Ukraine LLC 100.00% Kiev-Ukraine Full Consol. 31-Dec. Zara Retail sales
Zara Slovakia, S.R.O. 100.00% Bratislava-Slovakia Full Consol. 31-Jan. Zara Retail sales
Zara Taiwan, B.V. TW Branch 100.00% Taipei - Taiwan Full Consol. 31-Jan. Zara Retail sales
Zara Croatia, Ltd. 100.00% Zagreb-Croatia Full Consol. 31-Jan. Zara Retail sales
Zara Retail Korea, Ltd. 80.00% Korea Full Consol. 31-Jan. Zara Retail sales
Zara Bulgaria LTD 100.00% Sofia-Bulgaria Full Consol. 31-Dec. Zara Retail sales
Zara Immobiliare Italia SRL 100.00% Milan - Italy Full Consol. 31-Jan. Zara Real estate

76
CompanyEffective % of
ownershipLocation
Consolidation
method
Reporting dateChain Line of business
Zara Diseño, S.L. 100.00% A Coruña - Spain Full Consol. 31-Jan. Zara Design
Zara Management, B.V. 100.00% Amsterdam - Netherlands Full Consol. 31-Jan. Zara Holding company
Zara Retail NZ Limited 100.00% Auckland - New Zealand Full Consol. 31-Jan. Zara Retail sales
Kommanditgesellschaft ZARA Deutschland B.V. & Co. 100.00% Hamburg - Germany Full Consol. 31-Jan. Zara Retail sales
Zara Retail South Africa (Propietary), LTD. 90.00% South Africa Full Consol. 31-Jan. Zara Retail sales
Group Zara Australia Pty. Ltd. 80.00% Sidney - Australia Full Consol. 31-Jan. Zara Retail sales
ITX Financien, B.V. 100.00% Amsterdam - Netherlands Full Consol. 31-Jan. Multi-concept Financial services
Zara Taiwan, B.V. 100.00% Amsterdam - Netherlands Full Consol. 31-Jan. Zara Holding company
Zara Vittorio 11 Italia S.R.L. 100.00% Milan - Italy Full Consol. 31-Jan. Zara Real estate
Zara BH, D.O.O. 100.00% Sarajevo - Bosnia Herzegovina Full Consol. 31-Dec. Zara Retail sales
Zara Serbia, D.O.O. Belgrade 100.00% Belgrade - Serbia Full Consol. 31-Jan. Zara Retail sales
Nikole Diseño, S.L. 100.00% A Coruña - Spain Full Consol. 31-Jan. Zara Design
Inditex Montenegro, D.O.O. Podgorica 100.00% Montenegro Full Consol. 31-Dec. Multi-concept Retail sales
Inditex Vastgoed Korea, Ltd. 100.00% Korea Full Consol. 31-Jan. Zara Real estate
Inditex Trent Retail India Private LTD 51.00% Gurgaon-India Full Consol. 31-Mar. Zara Retail sales
Kiddy´s Class España, S.A. 100.00% A Coruña - Spain Full Consol. 31-Jan. Zara Retail sales
Fibracolor, S.A. 100.00% Barcelona - Spain Full Consol. 31-Jan. Zara Dormant
ITX Holding, S.A. 100.00% Fribourg - Switzerland Full Consol. 31-Jan. Multi-concept Holding company
Zara Finland, OY 100.00% Helsinki - Finland Full Consol. 31-Jan. Zara Retail sales
Retail Group Kazakhstan, LLP 100.00% Almaty - Kazakhstan Full Consol. 31-Dec. Zara Retail sales
ITX Financien III, B.V. 100.00% Amsterdam - Netherlands Full Consol. 31-Jan. Multi-concept Financial services
ITX Albania SHPK 100.00% Tirana - Albania Full Consol. 31-Dec. Multi-concept Retail sales
Zara Fashion (Shanghai) CO., Ltd. 100.00% Shanghai- China Full Consol. 31-Dec. Zara Retail sales
Oysho España, S.A. 100.00% Barcelona - Spain Full Consol. 31-Jan. Oysho Retail sales
Oysho Portugal, Conf. Lda. 100.00% Lisbon - Portugal Full Consol. 31-Jan. Oysho Retail sales
Oysho Mexico, S.A. de C.V. 100.00% Mexico City - Mexico Full Consol. 31-Dec. Oysho Retail sales
Oysho Italia, S.R.L. 100.00% Milan - Italy Full Consol. 31-Jan. Oysho Retail sales
Oysho Hellas, S.A. 100.00% Athens - Grece Full Consol. 31-Jan. Oysho Retail sales
Oysho Giyim Ithalat Ihracat Ve Ticaret Ltd. 100.00% Istanbul - Turkey Full Consol. 31-Jan. Oysho Retail sales
Oysho Polska, Sp zo.o 100.00% Warsaw- Poland Full Consol. 31-Jan. Oysho Retail sales
Oysho CIS, Ltd. 100.00% Moscow- Russia Full Consol. 31-Dec. Oysho Retail sales
Oysho France, S.A.R.L. 100.00% Paris - France Full Consol. 31-Jan. Oysho Retail sales
Oysho MAGYARORSZAG, KFT 100.00% Budapest - Hungary Full Consol. 31-Jan. Oysho Retail sales
Oysho Ro, Srl 100.00% Bucharest-Romania Full Consol. 31-Dec. Oysho Retail sales
Oysho Ukraine, Llc 100.00% Kiev-Ukraine Full Consol. 31-Dec. Oysho Retail sales
Oysho Diseño, S.L. 100.00% Barcelona - Spain Full Consol. 31-Jan. Oysho Design
Oysho Bulgaria, LTD 100.00% Sofia-Bulgaria Full Consol. 31-Dec. Oysho Retail sales
Oysho Commercial & Trading (Shangai) Co., LTD. 100.00% Shanghai- China Full Consol. 31-Dec. Oysho Retail sales
Oysho Korea, LTD 100.00% Korea Full Consol. 31-Jan. Oysho Retail sales
Oysho Croacia, LTD 100.00% Zagreb-Croatia Full Consol. 31-Jan. Oysho Retail sales
Oysho Serbia, D.O.O. Belgrade 100.00% Belgrade - Serbia Full Consol. 31-Jan. Oysho Retail sales
Oysho Macau, Ltd 100.00% Macao- China Full Consol. 31-Dec. Oysho Retail sales
Oysho Kazakhstan, LLP 100.00% Almaty - Kazakhstan Full Consol. 31-Dec. Oysho Retail sales
Oysho Hong Kong Ltd 100.00% Hong Kong - China Full Consol. 31-Jan. Oysho Retail sales
Oysho Belgique, S.A 100.00% Brussels - Belgium Full Consol. 31-Jan. Oysho Retail sales
Grupo Massimo Dutti, S.A. 100.00% Barcelona - Spain Full Consol. 31-Jan. Massimo Dutti Retail sales
Massimo Dutti Hellas, S.A. 100.00% Athens - Greece Full Consol. 31-Jan. Massimo Dutti Retail sales
Massimo Dutti Giyim Ithalat Ih.Ve Tic. Ltd. 100.00% Istanbul - Turkey Full Consol. 31-Jan. Massimo Dutti Retail sales
Massimo Dutti France, S.A.R.L. 100.00% Paris - France Full Consol. 31-Jan. Massimo Dutti Retail sales
Massimo Dutti UK, Ltd. 100.00% London - UK Full Consol. 31-Jan. Massimo Dutti Retail sales
Massimo Dutti Suisse, S.A.R.L. 100.00% Fribourg - Switzerland Full Consol. 31-Jan. Massimo Dutti Retail sales
Massimo Dutti Sverige, AB 100.00% Stockholm - Sweden Full Consol. 31-Jan. Massimo Dutti Retail sales
Massimo Dutti Norge, AS. 100.00% Oslo - Noruega Full Consol. 31-Jan. Massimo Dutti Retail sales
Massimo Dutti Italia, S.R.L. 100.00% Milan - Italy Full Consol. 31-Jan. Massimo Dutti Retail sales
Massimo Dutti Ireland., Ltd. 100.00% Dublin - Irland Full Consol. 31-Jan. Massimo Dutti Retail sales
Massimo Dutti USA, INC 100.00% New York - USA Full Consol. 31-Jan. Massimo Dutti Retail sales
Massimo Dutti Danmark A/S 100.00% Copenhagen - Denmark Full Consol. 31-Jan. Massimo Dutti Dormant
Massimo Dutti CIS, Ltd. 100.00% Moscow- Russia Full Consol. 31-Dec. Massimo Dutti Retail sales
Massimo Dutti Deutschland, GmbH 100.00% Hamburg - Germany Full Consol. 31-Jan. Massimo Dutti Holding company

77
CompanyEffective % of
ownershipLocation
Consolidation
method
Reporting dateChain Line of business
Massimo Dutti Mexico, S.A. de C.V. 100.00% Mexico City - Mexico Full Consol. 31-Dec. Massimo Dutti Retail sales
BCN Diseños, S.A. de C.V. 100.00% Mexico City - Mexico Full Consol. 31-Dec. Massimo Dutti Real estate
Liprasa Cartera, S.L. 100.00% Madrid - Spain Full Consol. 31-Jan. Massimo Dutti Holding company
Massimo Dutti, S.A. 100.00% A Coruña - Spain Full Consol. 31-Jan. Massimo Dutti Dormant
Massimo Dutti Hong Kong, Ltd. 100.00% Hong Kong - China Full Consol. 31-Jan. Massimo Dutti Retail sales
Massimo Dutti Polska, Sp z.o.o. 100.00% Warsaw - Poland Full Consol. 31-Jan. Massimo Dutti Retail sales
Massimo Dutti Ro, Srl 100.00% Bucharest-Romania Full Consol. 31-Dec. Massimo Dutti Retail sales
Massimo Dutti Macau Ltd. 100.00% Macao- China Full Consol. 31-Dec. Massimo Dutti Retail sales
Massimo Dutti Ukraine, Llc 100.00% Kiev-Ukraine Full Consol. 31-Dec. Massimo Dutti Retail sales
Massimo Dutti Ceská Republika, s.r.o 100.00% Prague - Czech Republic Full Consol. 31-Jan. Massimo Dutti Retail sales
Massimo Dutti Commercial Beijing Co, Ltd. 100.00% Beijing- China Full Consol. 31-Dec. Massimo Dutti Retail sales
Massimo Dutti Bulgaria, LTD 100.00% Sofia-Bulgaria Full Consol. 31-Dec. Massimo Dutti Retail sales
Massimo Dutti Croatia, LTD 100.00% Zagreb-Croatia Full Consol. 31-Jan. Massimo Dutti Retail sales
Massimo Dutti Korea, LTD 100.00% Korea Full Consol. 31-Jan. Massimo Dutti Retail sales
Massimo Dutti Diseño, S.L. 100.00% Barcelona - Spain Full Consol. 31-Jan. Massimo Dutti Design
Massimo Dutti Commercial Shangai CO, LTD 100.00% Shanghai- China Full Consol. 31-Dec. Massimo Dutti Retail sales
Massimo Dutti Österreich, GMBH 100.00% Vienna - Austria Full Consol. 31-Jan. Massimo Dutti Retail sales
Massimo Dutti Nederland, B.V. 100.00% Amsterdam - Netherlands Full Consol. 31-Jan. Massimo Dutti Retail sales
Massimo Dutti Canada, INC. 100.00% Montreal - Canada Full Consol. 31-Jan. Massimo Dutti Retail sales
Massimo Dutti Taiwan, B.V. Taiwan Branch 100.00% Taipei - Taiwan Full Consol. 31-Jan. Massimo Dutti Retail sales
Massimo Dutti Finland OY 100.00% Helsinki - Finland Full Consol. 31-Jan. Massimo Dutti Retail sales
MD Benelux, N.V. 100.00% Bruges - Belgium Full Consol. 31-Jan. Massimo Dutti Retail sales
Italco Moda Italiana, LDA. 100.00% Lisbon - Portugal Full Consol. 31-Jan. Massimo Dutti Retail sales
Massimo Dutti Japan, Co. 100.00% Tokyo - Japan Full Consol. 31-Jan. Massimo Dutti Retail sales
KG Massimo Dutti Deutschland, B.V. & CO. 100.00% Hamburg - Germany Full Consol. 31-Jan. Massimo Dutti Retail sales
Massimo Dutti Serbia, D.O.O. Belgrade 100.00% Belgrade - Serbia Full Consol. 31-Jan. Massimo Dutti Retail sales
Massimo Dutti Magyarorxzág KFT 100.00% Budapest - Hungary Full Consol. 31-Jan. Massimo Dutti Retail sales
Massimo Dutti Taiwan, B.V 100.00% Amsterdam - Netherlands Full Consol. 31-Jan. Massimo Dutti Holding company
Master Retail Kazakhstan, LLP 100.00% Almaty - Kazakhstan Full Consol. 31-Dec. Massimo Dutti Retail sales
Massimo Dutti BH, D.O.O 100.00% Sarajevo - Bosnia Herzegovina Full Consol. 31-Dec. Massimo Dutti Retail sales
Massimo DuttiI India Private Ltd 51.00% Gurgaon-India Full Consol. 31-Mar. Massimo Dutti Retail sales
ITX Merken, B.V. 100.00% Amsterdam - Netherlands Full Consol. 31-Jan. Multi-concept Services
Pull & Bear España, S.A. 100.00% A Coruña - Spain Full Consol. 31-Jan. Pull & Bear Retail sales
Pull & Bear Hellas, S.A. 100.00% Athens - Greece Full Consol. 31-Jan. Pull & Bear Retail sales
Pull & Bear Portugal Conf. Lda. 100.00% Lisbon - Portugal Full Consol. 31-Jan. Pull & Bear Retail sales
Pull & Bear Giyim Ith. Ihrac.Ve Tic. Ltd. 100.00% Istanbul - Turkey Full Consol. 31-Jan. Pull & Bear Retail sales
Pull & Bear Mexico, S.A. de C.V. 100.00% Mexico City - Mexico Full Consol. 31-Dec. Pull & Bear Retail sales
Pull & Bear Belgique, S.A. 100.00% Brussels - Belgium Full Consol. 31-Jan. Pull & Bear Retail sales
Pull & Bear France, S.A.R.L. 100.00% Paris - France Full Consol. 31-Jan. Pull & Bear Retail sales
Pull & Bear Italia, S.R.L. 100.00% Milan - Italy Full Consol. 31-Jan. Pull & Bear Retail sales
Pull & Bear Ceska Republika, S.R.O. 100.00% Prague - Czech Republic Full Consol. 31-Jan. Pull & Bear Retail sales
Pull & Bear Ireland, Ltd. 100.00% Dublin - Irland Full Consol. 31-Jan. Pull & Bear Retail sales
Pull & Bear Magyarország Kft. 100.00% Budapest - Hungary Full Consol. 31-Jan. Pull & Bear Retail sales
Pull & Bear Polska, Sp zo.o 100.00% Warsaw- Poland Full Consol. 31-Jan. Pull & Bear Retail sales
Pull & Bear CIS, Ltd. 100.00% Moscow- Russia Full Consol. 31-Dec. Pull & Bear Retail sales
Pull & Bear Uk Limited 100.00% London - UK Full Consol. 31-Jan. Pull & Bear Retail sales
Pull & Bear Ro, Srl 100.00% Bucharest-Romania Full Consol. 31-Dec. Pull & Bear Retail sales
Pull & Bear Ukraine, Llc 100.00% Kiev-Ukraine Full Consol. 31-Dec. Pull & Bear Retail sales
Pull & Bear Slovakia, S.R.O. 100.00% Bratislava-Slovakia Full Consol. 31-Jan. Pull & Bear Retail sales
Pull & Bear Croatia, LTD 100.00% Zagreb-Croatia Full Consol. 31-Jan. Pull & Bear Retail sales
Pull & Bear Commercial Beijing Co, Ltd. 100.00% Beijing- China Full Consol. 31-Dec. Pull & Bear Retail sales
Pull & Bear Bulgaria, LTD 100.00% Sofia-Bulgaria Full Consol. 31-Dec. Pull & Bear Retail sales
Pull & Bear Hong Kong LTD 100.00% Hong Kong - China Full Consol. 31-Jan. Pull & Bear Retail sales
Pull & Bear Diseño, S.L. 100.00% A Coruña - Spain Full Consol. 31-Jan. Pull & Bear Design
Pull & Bear Macau, LTD 100.00% Macao- China Full Consol. 31-Dec. Pull & Bear Retail sales
Pull & Bear Nederland, B.V. 100.00% Amsterdam - Netherlands Full Consol. 31-Jan. Pull & Bear Retail sales
Pull & Bear Österreich Clothing, Gmbh 100.00% Vienna - Austria Full Consol. 31-Jan. Pull & Bear Retail sales
Pul & Bear Taiwan, B.V. Taiwan Branch 100.00% Taipei - Taiwan Full Consol. 31-Jan. Pull & Bear Retail sales
Pull & Bear Korea, LTD 100.00% Korea Full Consol. 31-Jan. Pull & Bear Retail sales
Pull & Bear Serbia, D.O.O. Belgrade 100.00% Belgrade - Serbia Full Consol. 31-Jan. Pull & Bear Retail sales
Pull & Bear BH, D.O.O. 100.00% Sarajevo - Bosnia Herzegovina Full Consol. 31-Dec. Pull & Bear Retail sales
Plataforma Cabanillas, S.A. 100.00% A Coruña - Spain Full Consol. 31-Jan. Pull & Bear Logistics

78
CompanyEffective % of
ownershipLocation
Consolidation
method
Reporting dateChain Line of business
Pull & Bear Taiwan, B.V. 100.00% Amsterdam - Netherlands Full Consol. 31-Jan. Pull & Bear Holding company
P&B Gmbh 100.00% Hamburg - Germany Full Consol. 31-Jan. Pull & Bear Holding company
Pull & Bear Deutschland BV& CO 100.00% Hamburg - Germany Full Consol. 31-Jan. Pull & Bear Retail sales
Pro Retail Kazakhstan, LLP 100.00% Stockholm - Sweden Full Consol. 31-Dec. Pull & Bear Retail sales
Pull & Bear Sverige, AB 100.00% Stockholm - Sweden Full Consol. 31-Jan. Pull & Bear Retail sales
Pull & Bear Suisse, SÁRL 100.00% Fribourg - Switzerland Full Consol. 31-Jan. Pull & Bear Retail sales
Uterqüe, S.A. 100.00% A Coruña - Spain Full Consol. 31-Jan. Uterqüe Buyer
Uterqüe España, S.A. 100.00% A Coruña - Spain Full Consol. 31-Jan. Uterqüe Retail sales
Uterqüe Hellas 100.00% Athens - Greece Full Consol. 31-Jan. Uterqüe Retail sales
Gruputerqüe Portugal Conf. Lda 100.00% Lisbon - Portugal Full Consol. 31-Jan. Uterqüe Retail sales
Uterqüe Cis, LTD 100.00% Moscow- Russia Full Consol. 31-Dec. Uterqüe Retail sales
Uterqüe Giyim Limited 100.00% Istanbul - Turkey Full Consol. 31-Jan. Uterqüe Retail sales
Uterqüe México S.A. de C.V. 100.00% Mexico City - Mexico Full Consol. 31-Dec. Uterqüe Retail sales
Uterqüe Diseño, S.L. 100.00% A Coruña - Spain Full Consol. 31-Jan. Uterqüe Design
Uterqüe Italia, Srl. 100.00% Milan - Italy Full Consol. 31-Jan. Uterqüe Retail sales
ITX Finance Asia, LTD 100.00% Hong Kong - China Full Consol. 31-Jan. Zara Financial services
Uterqüe Commercial & Trading (Shangai) Co., LTD. 100.00% Shanghai- China Full Consol. 31-Dec. Uterqüe Retail sales
Uterqüe Polska SP. ZOO 100.00% Varsovia - Poland Full Consol. 31-Jan. Uterqüe Retail sales
Uterqüe Kazakhstan LLP 100.00% Almaty - Kazakhstan Full Consol. 31-Dec. Uterqüe Retail sales
Uterqüe Ukraine, LLC 100.00% Kiev-Ukraine Full Consol. 31-Jan. Uterqüe Retail sales
Bershka BSK España, S.A. 100.00% Barcelona - Spain Full Consol. 31-Jan. Bershka Retail sales
Bershka Portugal Conf. Soc. Unip. Lda. 100.00% Lisbon - Portugal Full Consol. 31-Jan. Bershka Retail sales
Bershka Hellas, S.A. 100.00% Athens - Greece Full Consol. 31-Jan. Bershka Retail sales
Bershka Mexico, S.A. de CV 100.00% Mexico City - Mexico Full Consol. 31-Dec. Bershka Retail sales
Bershka Giyim Ithalat Ihracat Ve Tic.Ltd. 100.00% Istanbul - Turkey Full Consol. 31-Jan. Bershka Retail sales
Bershka Belgique, S.A. 100.00% Brussels - Belgium Full Consol. 31-Jan. Bershka Retail sales
Bershka France, S.A.R.L. 100.00% Paris - France Full Consol. 31-Jan. Bershka Retail sales
Bershka Suisse, S.A.R.L. 100.00% Fribourg - Switzerland Full Consol. 31-Jan. Bershka Retail sales
Bershka Nederland, B.V. 100.00% Amsterdam - Netherlands Full Consol. 31-Jan. Bershka Retail sales
Bershka Italia, S.R.L. 100.00% Milan - Italy Full Consol. 31-Jan. Bershka Retail sales
Bershka U.K., Ltd. 100.00% London - UK Full Consol. 31-Jan. Bershka Retail sales
Bershka Ireland., Ltd. 100.00% Dublin - Irland Full Consol. 31-Jan. Bershka Retail sales
Bershka Ceska Republica, S.R.O. 100.00% Prague - Czech Republic Full Consol. 31-Jan. Bershka Retail sales
Bershka Croatia, Ltd. 100.00% Zagreb-Croatia Full Consol. 31-Jan. Bershka Retail sales
Bershka Polska Sp Z O.O. 100.00% Warsaw - Poland Full Consol. 31-Jan. Bershka Retail sales
Bershka Slovakia, S.R.O. 100.00% Bratislava-Slovakia Full Consol. 31-Jan. Bershka Retail sales
Bershka Carpati, Srl 100.00% Bucharest-Romania Full Consol. 31-Dec. Bershka Retail sales
Bershka Ukraine, Llc 100.00% Kiev-Ukraine Full Consol. 31-Dec. Bershka Retail sales
Bershka Magyaroszag Kft. 100.00% Budapest - Hungary Full Consol. 31-Jan. Bershka Retail sales
Bershka Cis, Ltd 100.00% Moscow- Russia Full Consol. 31-Dec. Bershka Retail sales
Bershka Osterreich Clothing GmbH 100.00% Vienna - Austria Full Consol. 31-Jan. Bershka Retail sales
Bershka Hong Kong Limited 100.00% Hong Kong - China Full Consol. 31-Jan. Bershka Retail sales
Bershka Commercial Beijing Co, Ltd 100.00% Beijing- China Full Consol. 31-Dec. Bershka Retail sales
Bershka Bulgaria, LTD 100.00% Sofia-Bulgaria Full Consol. 31-Dec. Bershka Retail sales
Bershka Korea, LTD 100.00% Korea Full Consol. 31-Jan. Bershka Retail sales
Bershka Taiwan, B.V. Taiwan Branch 100.00% Taipei - Taiwan Full Consol. 31-Jan. Bershka Retail sales
Bershka Diseño, S.L. 100.00% Barcelona - Spain Full Consol. 31-Jan. Bershka Design
Bershka Macau, LTD 100.00% Macao- China Full Consol. 31-Dec. Bershka Retail sales
Bershka Japan, LTD 100.00% Tokyo - Japan Full Consol. 31-Jan. Bershka Retail sales
BSKE, GMBH 100.00% Hamburg - Germany Full Consol. 31-Jan. Bershka Holding company
Bershka BH, D.O.O. 100.00% Sarajevo - Bosnia Herzegovina Full Consol. 31-Dec. Bershka Retail sales
Bershka Deutschland B.V. & CO. KG 100.00% Hamburg - Germany Full Consol. 31-Jan. Bershka Retail sales
Bershka Serbia, D.O.O. Belgrade 100.00% Belgrade - Serbia Full Consol. 31-Jan. Bershka Retail sales
Bershka Taiwan, B.V. 100.00% Amsterdam - Netherlands Full Consol. 31-Jan. Bershka Holding company
Best Retail Kazakhstan, LLP 100.00% Almaty - Kazakhstan Full Consol. 31-Dec. Bershka Retail sales
Bershka Commercial (Shanghai) Co, Ltd 100.00% Shanghai- China Full Consol. 31-Dec. Bershka Retail sales
Bershka USA INC 100.00% New York - USA Full Consol. 31-Jan. Bershka Retail sales
Stradivarius España, S.A. 100.00% Barcelona - Spain Full Consol. 31-Jan. Stradivarius Retail sales
Stradivarius Hellas, S.A. 100.00% Athens - Greece Full Consol. 31-Jan. Stradivarius Retail sales
ITX RE 100.00% Dublin - Irland Full Consol. 31-Jan. Multi-concept Insurance
Stradivarius Portugal, Conf. Unip. Lda. 100.00% Lisbon - Portugal Full Consol. 31-Jan. Stradivarius Retail sales
Stradivarius Giyim Ithalat Ih. Ve Tic. Ltd. 100.00% Istanbul - Turkey Full Consol. 31-Jan. Stradivarius Retail sales
Stradivarius Polska, Sp zo.o 100.00% Warsaw- Poland Full Consol. 31-Jan. Stradivarius Retail sales
Stradivarius Ireland Limited 100.00% Dublin - Irland Full Consol. 31-Jan. Stradivarius Retail sales
Stradivarius Italia SRL 100.00% Milan - Italy Full Consol. 31-Jan. Stradivarius Retail sales

79
CompanyEffective % of
ownershipLocation
Consolidation
method
Reporting dateChain Line of business
Stradivarius CIS, Ltd. 100.00% Moscow- Russia Full Consol. 31-Dec. Stradivarius Retail sales
Stradivarius France, S.A.R.L. 100.00% Paris - France Full Consol. 31-Jan. Stradivarius Retail sales
Stradivarius Magyaroszag Kft. 100.00% Budapest - Hungary Full Consol. 31-Jan. Stradivarius Retail sales
Stradivarius Croatia, LTD. 100.00% Zagreb-Croatia Full Consol. 31-Jan. Stradivarius Retail sales
Stradivarius Slovakia, S.R.O. 100.00% Bratislava-Slovakia Full Consol. 31-Jan. Stradivarius Retail sales
Stradivarius Ro, Srl 100.00% Bucharest-Romania Full Consol. 31-Dec. Stradivarius Retail sales
Stradivarius Ukraine, Llc 100.00% Kiev-Ukraine Full Consol. 31-Dec. Stradivarius Retail sales
Stradivarius Ceská Republika, s.r.o 100.00% Prague - Czech Republic Full Consol. 31-Jan. Stradivarius Retail sales
Stradivarius Commercial Shangai CO, LTD 100.00% Shanghai- China Full Consol. 31-Dec. Stradivarius Retail sales
Stradivarius Bulgaria, LTD 100.00% Sofia-Bulgaria Full Consol. 31-Dec. Stradivarius Retail sales
Stradivarius Diseño, S.L. 100.00% Barcelona - Spain Full Consol. 31-Jan. Stradivarius Design
Stradivarius Macau, LTD 100.00% Macao- China Full Consol. 31-Dec. Stradivarius Retail sales
Stradivarius Korea, LTD 100.00% Korea Full Consol. 31-Jan. Stradivarius Retail sales
Stradivarius Hong Kong, LTD 100.00% Hong Kong - China Full Consol. 31-Jan. Stradivarius Retail sales
Stradivarius UK LIMITED 100.00% London - UK Full Consol. 31-Jan. Stradivarius Retail sales
Stradivarius Nederland, B.V. 100.00% Amsterdam - Netherlands Full Consol. 31-Jan. Stradivarius Retail sales
Stradivarius México, S.A. de C.V. 100.00% Mexico City - Mexico Full Consol. 31-Dec. Stradivarius Retail sales
Stradivarius BH, D.O.O. 100.00% Sarajevo - Bosnia Herzegovina Full Consol. 31-Dec. Stradivarius Retail sales
Stradivarius Serbia, D.O.O. Belgrade 100.00% Belgrade - Serbia Full Consol. 31-Jan. Stradivarius Retail sales
Spanish Retail Kazakhstan, LLP 100.00% Almaty - Kazakhstan Full Consol. 31-Dec. Stradivarius Retail sales
Stradivarius Japan Corporation 100.00% Tokyo - Japan Full Consol. 31-Jan. Stradivarius Retail sales
ITX Trading, S.A. 100.00% Fribourg - Switzerland Full Consol. 31-Jan. Multi-concept Buyer
Zara Home España, S.A. 100.00% A Coruña - Spain Full Consol. 31-Jan. Zara Home Retail sales
Zara Home Portugal, Conf. Soc. Unip. Lda. 100.00% Lisbon - Portugal Full Consol. 31-Jan. Zara Home Retail sales
Zara Home U.K., Ltd. 100.00% London - UK Full Consol. 31-Jan. Zara Home Retail sales
Zara Home Hellas, S.A. 100.00% Athens - Greece Full Consol. 31-Jan. Zara Home Retail sales
Zara Home Nederland, B.V. 100.00% Amsterdam - Netherlands Full Consol. 31-Jan. Zara Home Retail sales
Zara Home Mexico, S.A. de C.V. 100.00% Mexico City - Mexico Full Consol. 31-Dec. Zara Home Retail sales
Zara Home Italia, S.R.L. 100.00% Milan - Italy Full Consol. 31-Jan. Zara Home Retail sales
Zara Home Giyim Ithalat Ihracat Ve Ticaret Ltd. 100.00% Istanbul - Turkey Full Consol. 31-Jan. Zara Home Retail sales
Zara Home Francia, S.A.R.L. 100.00% Paris - France Full Consol. 31-Jan. Zara Home Retail sales
Zara Home Ro, Srl 100.00% Bucharest-Romania Full Consol. 31-Dec. Zara Home Retail sales
Zara Home CIS, Ltd. 100.00% Moscow- Russia Full Consol. 31-Dec. Zara Home Retail sales
Zara Home Ukraine, Llc 100.00% Kiev-Ukraine Full Consol. 31-Dec. Zara Home Retail sales
Zara Home Polska, Sp zo.o 100.00% Warsaw- Poland Full Consol. 31-Jan. Zara Home Retail sales
Zara Home Diseño, S.L. 100.00% A Coruña - Spain Full Consol. 31-Jan. Zara Home Design
Zara Home Deutschland B.V. & Co. KG 100.00% Hamburg - Germany Full Consol. 31-Jan. Zara Home Retail sales
Zara Home Taiwan, B.V. TW Branch 100.00% Taipei - Taiwan Full Consol. 31-Jan. Zara Home Retail sales
ZHE, Gmbh 100.00% Hamburg - Germany Full Consol. 31-Jan. Zara Home Holding company
Zara Home Brasil Produtos para o Lar, Ltda. 100.00% Sao Paulo -Brazil Full Consol. 31-Dec. Zara Home Retail sales
Zara Home Croatia, LTD 100.00% Zagreb-Croatia Full Consol. 31-Jan. Zara Home Retail sales
Zara Home Belgique, S.A. 100.00% Brussels - Belgium Full Consol. 31-Jan. Zara Home Retail sales
Zara Home Commercial & Trading (Shangai) Co., LTD. 100.00% Shanghai- China Full Consol. 31-Dec. Zara Home Retail sales
Zara Home Japan Corp. 100.00% Tokyo - Japan Full Consol. 31-Jan. Zara Home Retail sales
Zara Home Canada, Inc 100.00% Montreal - Canada Full Consol. 31-Jan. Zara Home Retail sales
Zara Home Taiwan, B.V. 100.00% Amsterdam - Netherlands Full Consol. 31-Jan. Zara Home Holding company
Zara Home Macao Ltd 100.00% Macao- China Full Consol. 31-Dec. Zara Home Retail sales
Zara Home Sverige AB 100.00% Stockholm - Sweden Full Consol. 31-Jan. Zara Home Retail sales
Zara Home Kazakhstan, LLP 100.00% Almaty - Kazakhstan Full Consol. 31-Dec. Zara Home Retail sales
Zara Home Hong Kong Ltd 100.00% Hong Kong - China Full Consol. 31-Jan. Zara Home Retail sales
Zara Home Suisse SÀRL 100.00% Fribourg - Switzerland Full Consol. 31-Jan. Zara Home Retail sales
Zara Home Chile SPA 100.00% Santiago de Chile - Chile Full Consol. 31-Dec. Zara Home Retail sales
Zara Home Australia Pty Ltd 100.00% Sidney - Australia Full Consol. 31-Jan. Zara Home Retail sales
Zara Home Magyarorszag KFT. 100.00% Budapest - Hungary Full Consol. 31-Jan. Zara Home Retail sales
Zara Home Korea LIMITED 100.00% Korea Full Consol. 31-Jan. Zara Home Retail sales
Zara Home Danmark A/S 100.00% Copenhagen - Denmark Full Consol. 31-Jan. Zara Home Retail sales
G. Zara Home Uruguay, S.A. 100.00% Montevideo -Uruguay Full Consol. 31-Jan. Zara Home Retail sales
Zara Home SRB DOO Beograd 100.00% Belgrade - Serbia Full Consol. 31-Dec. Zara Home Retail sales
Zara Logística, S.A. 100.00% A Coruña - Spain Full Consol. 31-Jan. Zara Logistics
Plataforma Europa, S.A. 100.00% Zaragoza - Spain Full Consol. 31-Jan. Zara Logistics
Plataforma Logística León, S.A. 100.00% León- Spain Full Consol. 31-Jan. Zara Logistics
Plataforma Logística Meco, S.A. 100.00% Madrid- Spain Full Consol. 31-Jan. Multi-concept Logistics
Pull & Bear Logística, S.A. 100.00% A Coruña - Spain Full Consol. 31-Jan. Pull & Bear Logistics
Massimo Dutti Logística, S.A. 100.00% Barcelona - Spain Full Consol. 31-Jan. Massimo Dutti Logistics
Bershka Logística, S.A. 100.00% Barcelona - Spain Full Consol. 31-Jan. Bershka Logistics
Oysho Logística, S.A. 100.00% Barcelona - Spain Full Consol. 31-Jan. Oysho Logistics
Stradivarius Logística, S.A. 100.00% Barcelona - Spain Full Consol. 31-Jan. Stradivarius Logistics
Zara Home Logística, S.A. 100.00% A Coruña - Spain Full Consol. 31-Jan. Zara Home Logistics
Uterqüe Logística, S.A. 100.00% A Coruña - Spain Full Consol. 31-Jan. Uterqüe Logistics

80
CompanyEffective % of
ownershipLocation
Consolidation
method
Reporting dateChain Line of business
Lefties Logística, S.A. 100.00% A Coruña - Spain Full Consol. 31-Jan. Zara Logistics
Inditex Logística, S.A. 100.00% A Coruña - Spain Full Consol. 31-Jan. Zara Logistics
Tordera Logística, S.L. 100.00% A Coruña - Spain Full Consol. 31-Jan. Multi-concept Logistics
Nueva comercializadora global XXI, S.A. DE C.V. 100.00% Mexico City - Mexico Full Consol. 31-Dec. Multi-concept Logistics
Corporación de Servicios XX1, S.A. de C.V. 100.00% Mexico City - Mexico Full Consol. 31-Dec. Multi-concept Services
ITX Fashion Ltd 100.00% Dublin - Irland Full Consol. 31-Jan. Multi-concept Retail sales
Goa-Invest, S.A. 100.00% A Coruña - Spain Full Consol. 31-Jan. Multi-concept Construction
Goa-Invest Deutschland GMBH 100.00% Hamburg - Germany Full Consol. 31-Jan. Multi-concept Construction
Zara Vastgoed, B.V. 100.00% Amsterdam - Netherlands Full Consol. 31-Jan. Zara Real estate
ITX Global Solutions LIMITED 100.00% Hong Kong - China Full Consol. 31-Jan. Multi-concept Services
SNC Zara France Immobiliere 100.00% Paris - France Full Consol. 31-Dec. Zara Real estate
SCI Vastgoed Ferreol P03302 100.00% Paris - France Full Consol. 31-Dec. Zara Real estate
SCI Vastgoed France P03301 100.00% Paris - France Full Consol. 31-Dec. Zara Real estate
SCI Vastgoed General Leclerc P03303 100.00% Paris - France Full Consol. 31-Dec. Zara Real estate
SCI Vastgoed Nancy P03304 100.00% Paris - France Full Consol. 31-Dec. Zara Real estate
Invercarpro, S.A. 100.00% Madrid - Spain Full Consol. 31-Jan. Zara Real estate
Born, S.A. 100.00% Palma de Mallorca- Spain Full Consol. 31-Jan. Zara Real estate
LFT RUS Ltd 100.00% Moscow- Russia Full Consol. 31-Dec. Zara Retail sales
Robustae Mexico, S.A DE C.V. 100.00% Mexico City - Mexico Full Consol. 31-Dec. Zara Retail sales
Robustae S.G.P.S. Unip. Lda. 100.00% Lisbon - Portugal Full Consol. 31-Jan. Zara Retail sales
Lefties España, S,A, 100.00% A Coruña - Spain Full Consol. 31-Jan. Zara Real estate
Inditex Cogeneración, A.I.E. 100.00% A Coruña - Spain Full Consol. 31-Jan. Multi-concept Combined heat and power plant
Inditex, S.A. 100.00% A Coruña - Spain Full Consol. 31-Jan. Zara Dormant
Zara Holding II, B.V 100.00% Amsterdam - Netherlands Full Consol. 31-Jan. Multi-concept Holding company
Zara, S.A. 100.00% A Coruña - Spain Full Consol. 31-Jan. Zara Dormant
Zara, S.A. 100.00% Buenos Aires - Argentina Full Consol. 31-Jan. Zara Dormant
Fashion Logistic Forwarders, S.A. 100.00% A Coruña - Spain Full Consol. 31-Jan. Multi-concept Logistics
ITX Asia Pacific Enterprise Management, Co., Ltd 100.00% Shanghai- China Full Consol. 31-Dec. Multi-concept Buyer
FSF New York, LLC 100.00% New York - USA Full Consol. 31-Jan. Zara Real estate
FSF Soho, LLC 100.00% New York - USA Full Consol. 31-Jan. Zara Real estate
ITX USA, LLC 100.00% New York - USA Full Consol. 31-Jan. Multi-concept Retail sales
Fashion Retail España, S.A. 100.00% A Coruña - Spain Full Consol. 31-Jan. Multi-concept Retail sales
ITXR Macedonaia Dooel Skopje 100.00% Skopje-Macedonia Full Consol. 31-Dec. Multi-concept Retail sales
ITX E-commerce (Shanghai) Co. Ltd 100.00% Shanghai- China Full Consol. 31-Dec. Multi-concept Retail sales
ITX Financien II, B.V. 100.00% Amsterdam - Netherlands Full Consol. 31-Jan. Multi-concept Financial services
ITX Canada, Inc. 100.00% Montreal - Canada Full Consol. 31-Jan. Multi-concept Retail sales
ITX Mexico XXI, S.A. DE C.V. 100.00% Mexico City - Mexico Full Consol. 31-Dec. Multi-concept Retail sales
ITX Korea LIMITED 100.00% Korea Full Consol. 31-Jan. Multi-concept Retail sales
ITX Services India Private Ltd 100.00% Gurgaon-India Full Consol. 31-Mar. Multi-concept Buyer
ITX Turkey Perakende Magazacilik Ve Ticaret LIMITED SIRKETI 100.00% Stockholm - Sweden Full Consol. 31-Jan. Multi-concept Retail sales
Inditex France, S.A.R.L. 100.00% Paris - France Full Consol. 31-Jan. Multi-concept Dormant
ITX Merken, B.V. 100.00% Amsterdam - Netherlands Full Consol. 31-Jan. Multi-concept Services
Zara Home Österreich Clothing GMBH 100.00% Vienna - Austria Full Consol. 31-Jan. Zara Home Retail sales
Massimo Dutti Slovakia, S.R.O. 100.00% Bratislava-Slovakia Full Consol. 31-Jan. Massimo Dutti Retail sales
Pull & Bear, Luxembourg S.A. 100.00% Luxembourg - Luxembourg Full Consol. 31-Jan. Pull & Bear Retail sales
Zara Vittorio 13 Italia, S.R.L. 100.00% Milan - Italy Full Consol. 31-Jan. Zara Real estate
CDC Trading (Shangai) Co. LTD. 100.00% Shanghai- China Full Consol. 31-Dec. Multi-concept Buyer
Oysho Sverige, AB 100.00% Stockholm - Sweden Full Consol. 31-Jan. Oysho Retail sales
Oysho Slovakia S.R.O 100.00% Bratislava-Slovakia Full Consol. 31-Jan. Oysho Retail sales
Zara Home Retail South Africa (PTY) LTD. 100.00% South Africa Full Consol. 31-Jan. Zara Retail sales
FGI Gestión Mex, S.A. de C.V. 100.00% Mexico City - Mexico Full Consol. 31-Dec. Multi-concept Construction
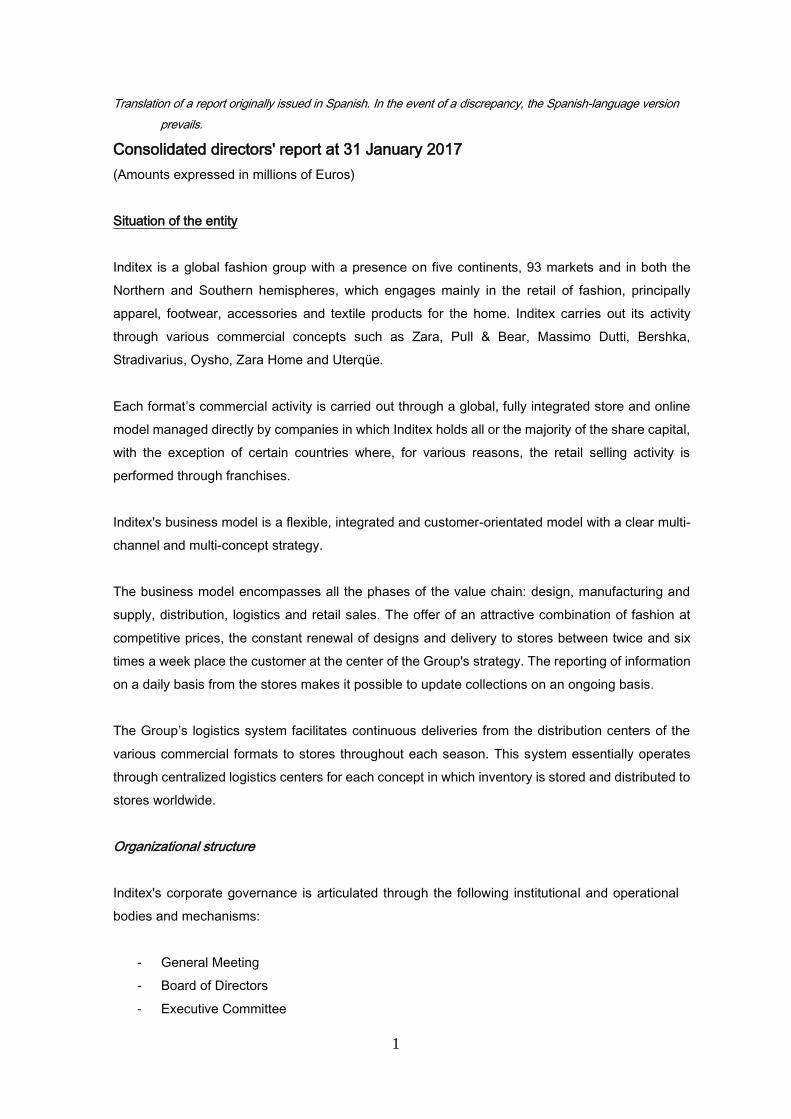
1
Translation of a report originally issued in Spanish. In the event of a discrepancy, the Spanish-language version
prevails.
Consolidated directors' report at 31 January 2017
(Amounts expressed in millions of Euros)
Situation of the entity
Inditex is a global fashion group with a presence on five continents, 93 markets and in both the
Northern and Southern hemispheres, which engages mainly in the retail of fashion, principally
apparel, footwear, accessories and textile products for the home. Inditex carries out its activity
through various commercial concepts such as Zara, Pull & Bear, Massimo Dutti, Bershka,
Stradivarius, Oysho, Zara Home and Uterqüe.
Each format’s commercial activity is carried out through a global, fully integrated store and online
model managed directly by companies in which Inditex holds all or the majority of the share capital,
with the exception of certain countries where, for various reasons, the retail selling activity is
performed through franchises.
Inditex's business model is a flexible, integrated and customer-orientated model with a clear multi-
channel and multi-concept strategy.
The business model encompasses all the phases of the value chain: design, manufacturing and
supply, distribution, logistics and retail sales. The offer of an attractive combination of fashion at
competitive prices, the constant renewal of designs and delivery to stores between twice and six
times a week place the customer at the center of the Group's strategy. The reporting of information
on a daily basis from the stores makes it possible to update collections on an ongoing basis.
The Group’s logistics system facilitates continuous deliveries from the distribution centers of the
various commercial formats to stores throughout each season. This system essentially operates
through centralized logistics centers for each concept in which inventory is stored and distributed to
stores worldwide.
Organizational structure
Inditex's corporate governance is articulated through the following institutional and operational
bodies and mechanisms:
- General Meeting
- Board of Directors
- Executive Committee

2
- Audit and Control Committee
- Nomination Committee
- Remuneration Committee
- Compliance Committee
- Ethics Committee
Business performance and results
Key financial and non-financial indicators
Inditex continues to roll out its global, fully integrated store and online model.
In FY2016, Inditex achieved a strong operating performance. Net sales reached €23.3 billion, with
sales growth of 12%. Currency translation was -3%.
Like-for-like sales increased 10% in FY2016 (11% in first half and 9% in second half) on 8.5% in
FY2015. The like-for-like calculation includes store sales (i.e. sales in stores opened for the whole
of fiscal years 2016 and 2015) and online. This represents 80% of total sales.
In FY2016 Inditex new space in prime locations increased 8%. Total selling area at FYE reached
4,410,896 square metres:
Net store openings in FY2016 amounted to 279 reaching a total of 7,292 stores in 93 markets. In
FY2016 Inditex opened stores in 56 markets.
A list of quarterly openings and stores opened as at FYE is included in the table below.
2016 2015 16/15
Zara 2,705,417 2,523,388 7%
Pull&Bear 387,023 351,799 10%
Massimo Dutti 251,157 233,084 8%
Bershka 485,966 456,914 6%
Stradivarius 299,391 271,386 10%
Oysho 101,960 92,891 10%
Zara Home 168,218 146,866 15%
Uterqüe 11,764 10,576 11%
Total 4,410,896 4,086,904 8%
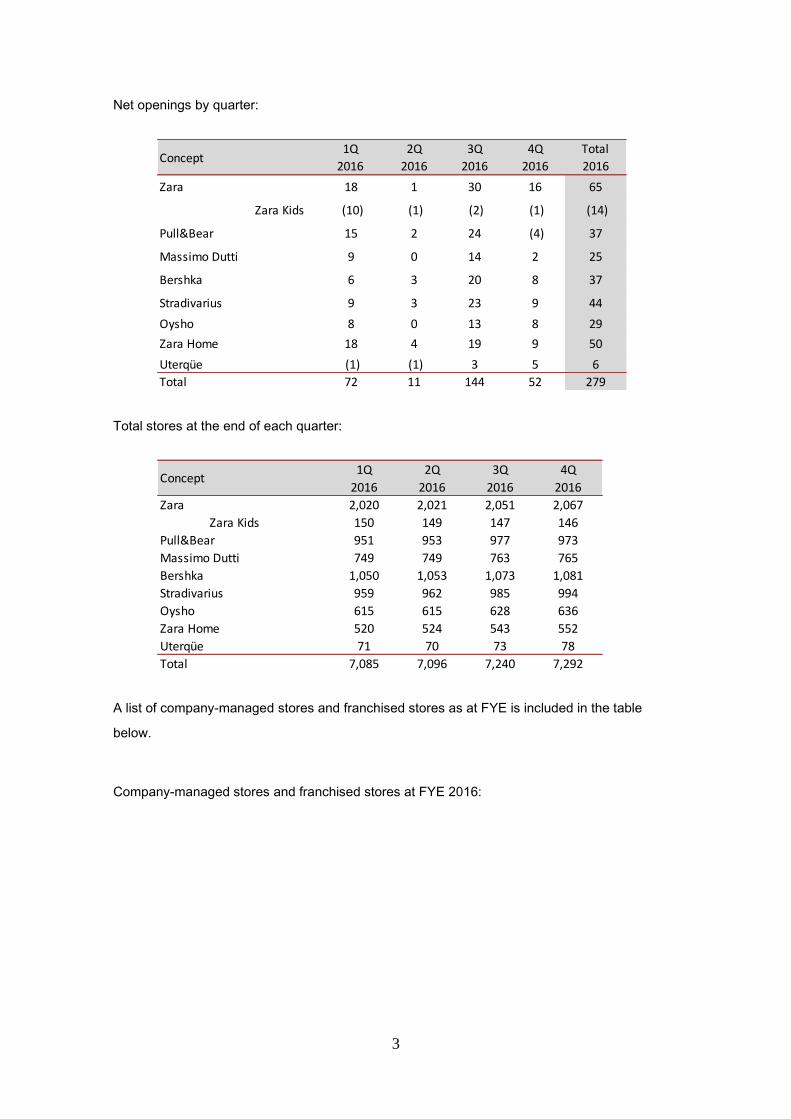
3
Net openings by quarter:
Total stores at the end of each quarter:
A list of company-managed stores and franchised stores as at FYE is included in the table
below.
Company-managed stores and franchised stores at FYE 2016:
Concept1Q
2016
2Q
2016
3Q
2016
4Q
2016
Total
2016
Zara 18 1 30 16 65
Zara Kids (10) (1) (2) (1) (14)
Pull&Bear 15 2 24 (4) 37
Massimo Dutti 9 0 14 2 25
Bershka 6 3 20 8 37
Stradivarius 9 3 23 9 44
Oysho 8 0 13 8 29
Zara Home 18 4 19 9 50
Uterqüe (1) (1) 3 5 6
Total 72 11 144 52 279
Concept1Q
2016
2Q
2016
3Q
2016
4Q
2016
Zara 2,020 2,021 2,051 2,067
Zara Kids 150 149 147 146
Pull&Bear 951 953 977 973
Massimo Dutti 749 749 763 765
Bershka 1,050 1,053 1,073 1,081
Stradivarius 959 962 985 994
Oysho 615 615 628 636
Zara Home 520 524 543 552
Uterqüe 71 70 73 78
Total 7,085 7,096 7,240 7,292
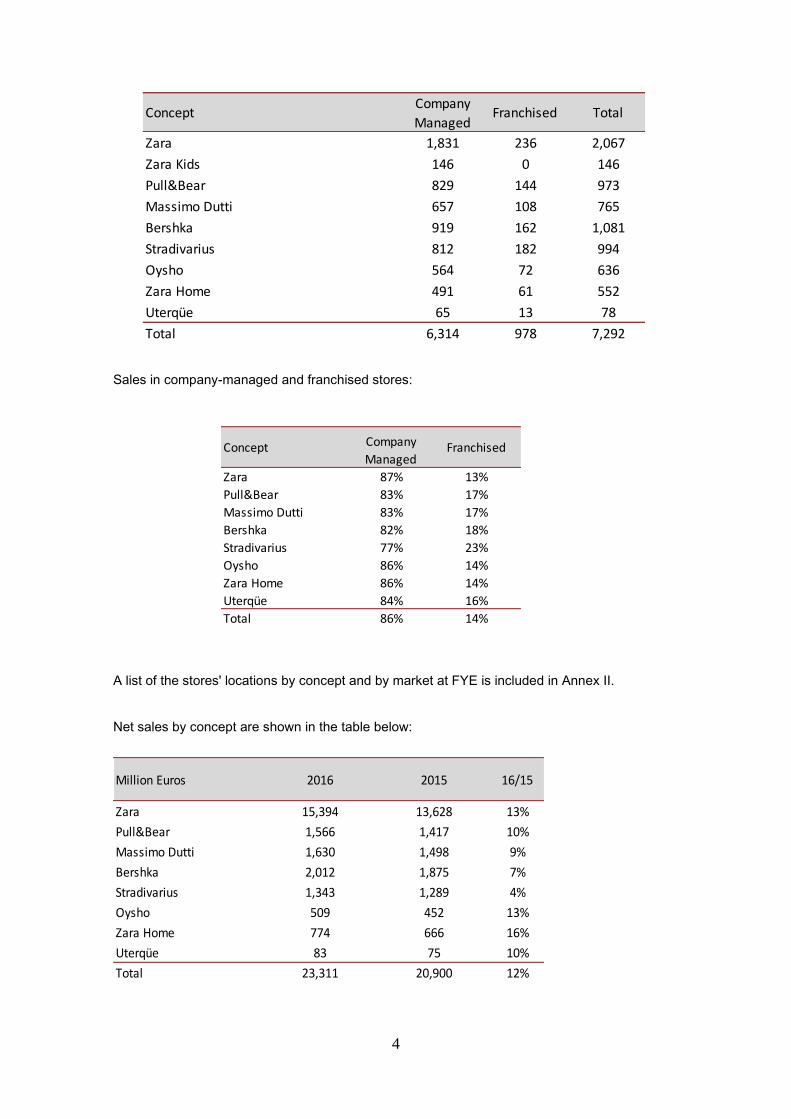
4
Sales in company-managed and franchised stores:
A list of the stores' locations by concept and by market at FYE is included in Annex II.
Net sales by concept are shown in the table below:
ConceptCompany
ManagedFranchised Total
Zara 1,831 236 2,067
Zara Kids 146 0 146
Pull&Bear 829 144 973
Massimo Dutti 657 108 765
Bershka 919 162 1,081
Stradivarius 812 182 994
Oysho 564 72 636
Zara Home 491 61 552
Uterqüe 65 13 78
Total 6,314 978 7,292
Concept Company
ManagedFranchised
Zara 87% 13%
Pull&Bear 83% 17%
Massimo Dutti 83% 17%
Bershka 82% 18%
Stradivarius 77% 23%
Oysho 86% 14%
Zara Home 86% 14%
Uterqüe 84% 16%
Total 86% 14%
Million Euros 2016 2015 16/15
Zara 15,394 13,628 13%
Pull&Bear 1,566 1,417 10%
Massimo Dutti 1,630 1,498 9%
Bershka 2,012 1,875 7%
Stradivarius 1,343 1,289 4%
Oysho 509 452 13%
Zara Home 774 666 16%
Uterqüe 83 75 10%
Total 23,311 20,900 12%
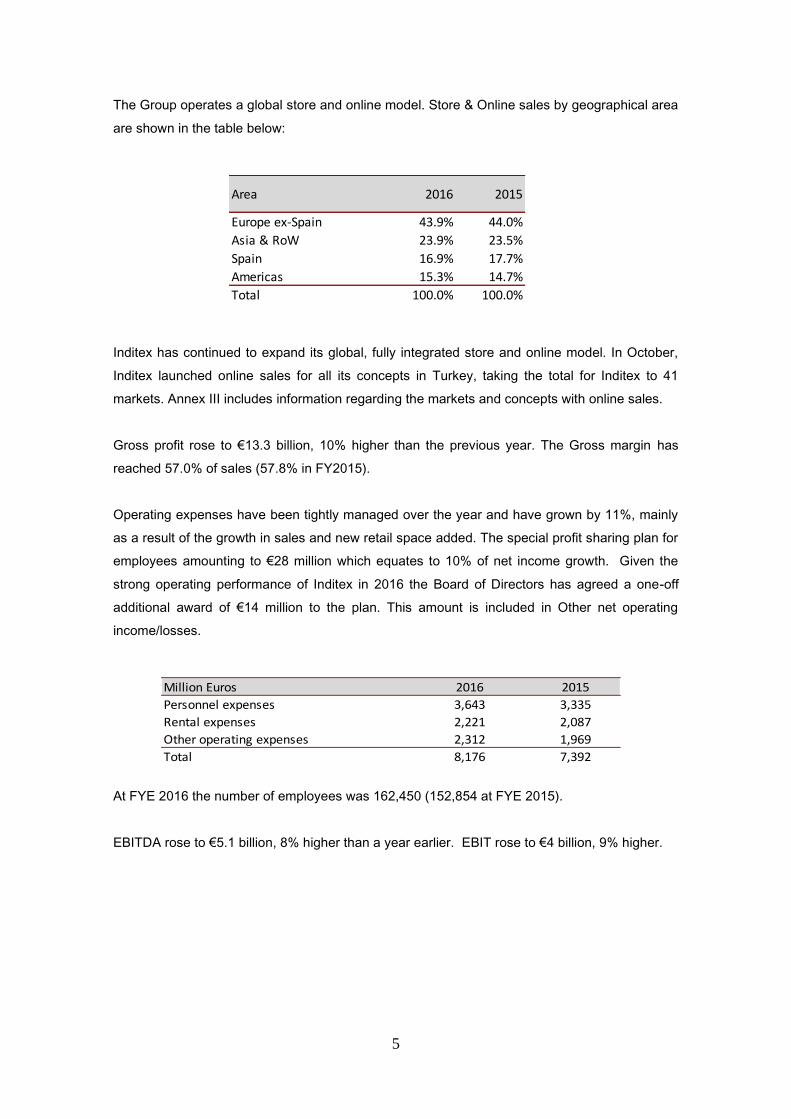
5
The Group operates a global store and online model. Store & Online sales by geographical area
are shown in the table below:
Inditex has continued to expand its global, fully integrated store and online model. In October,
Inditex launched online sales for all its concepts in Turkey, taking the total for Inditex to 41
markets. Annex III includes information regarding the markets and concepts with online sales.
Gross profit rose to €13.3 billion, 10% higher than the previous year. The Gross margin has
reached 57.0% of sales (57.8% in FY2015).
Operating expenses have been tightly managed over the year and have grown by 11%, mainly
as a result of the growth in sales and new retail space added. The special profit sharing plan for
employees amounting to €28 million which equates to 10% of net income growth. Given the
strong operating performance of Inditex in 2016 the Board of Directors has agreed a one-off
additional award of €14 million to the plan. This amount is included in Other net operating
income/losses.
At FYE 2016 the number of employees was 162,450 (152,854 at FYE 2015).
EBITDA rose to €5.1 billion, 8% higher than a year earlier. EBIT rose to €4 billion, 9% higher.
Area 2016 2015
Europe ex-Spain 43.9% 44.0%
Asia & RoW 23.9% 23.5%
Spain 16.9% 17.7%
Americas 15.3% 14.7%
Total 100.0% 100.0%
Million Euros 2016 2015
Personnel expenses 3,643 3,335
Rental expenses 2,221 2,087
Other operating expenses 2,312 1,969
Total 8,176 7,392
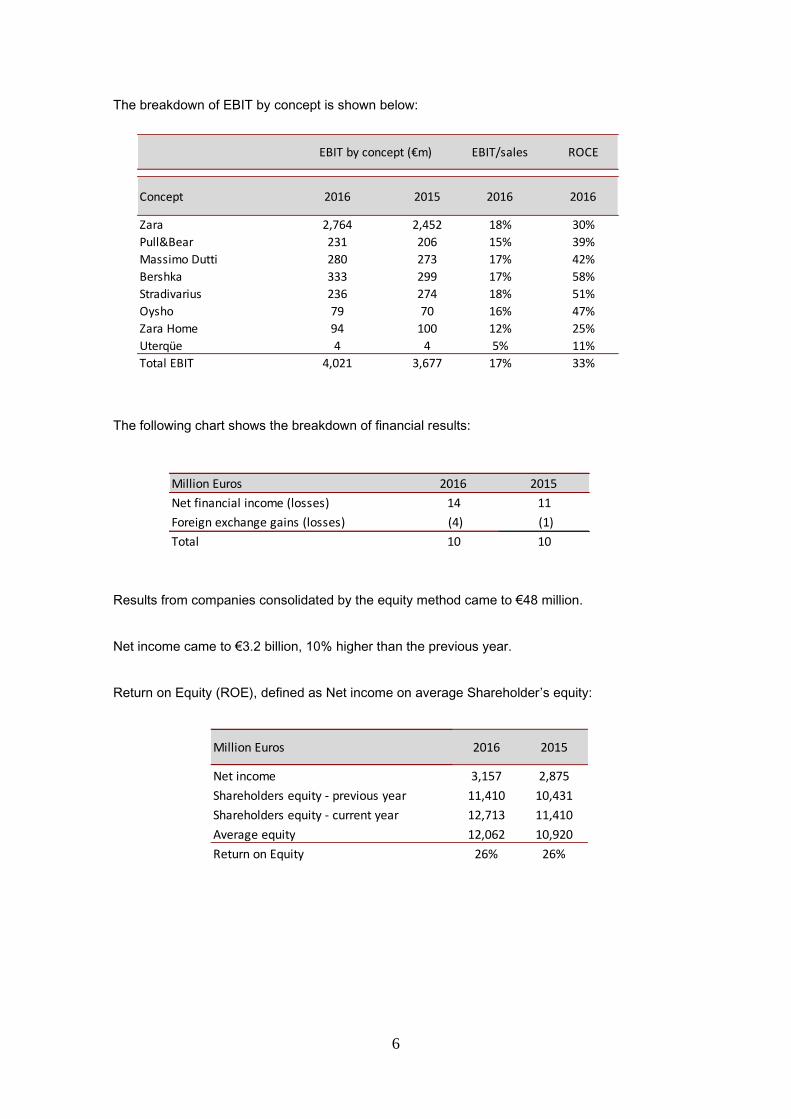
6
The breakdown of EBIT by concept is shown below:
The following chart shows the breakdown of financial results:
Results from companies consolidated by the equity method came to €48 million.
Net income came to €3.2 billion, 10% higher than the previous year.
Return on Equity (ROE), defined as Net income on average Shareholder’s equity:
EBIT/sales ROCE
Concept 2016 2015 2016 2016
Zara 2,764 2,452 18% 30%
Pull&Bear 231 206 15% 39%
Massimo Dutti 280 273 17% 42%
Bershka 333 299 17% 58%
Stradivarius 236 274 18% 51%
Oysho 79 70 16% 47%
Zara Home 94 100 12% 25%
Uterqüe 4 4 5% 11%
Total EBIT 4,021 3,677 17% 33%
EBIT by concept (€m)
Million Euros 2016 2015
Net financial income (losses) 14 11
Foreign exchange gains (losses) (4) (1)
Total 10 10
Million Euros 2016 2015
Net income 3,157 2,875
Shareholders equity - previous year 11,410 10,431
Shareholders equity - current year 12,713 11,410
Average equity 12,062 10,920
Return on Equity 26% 26%
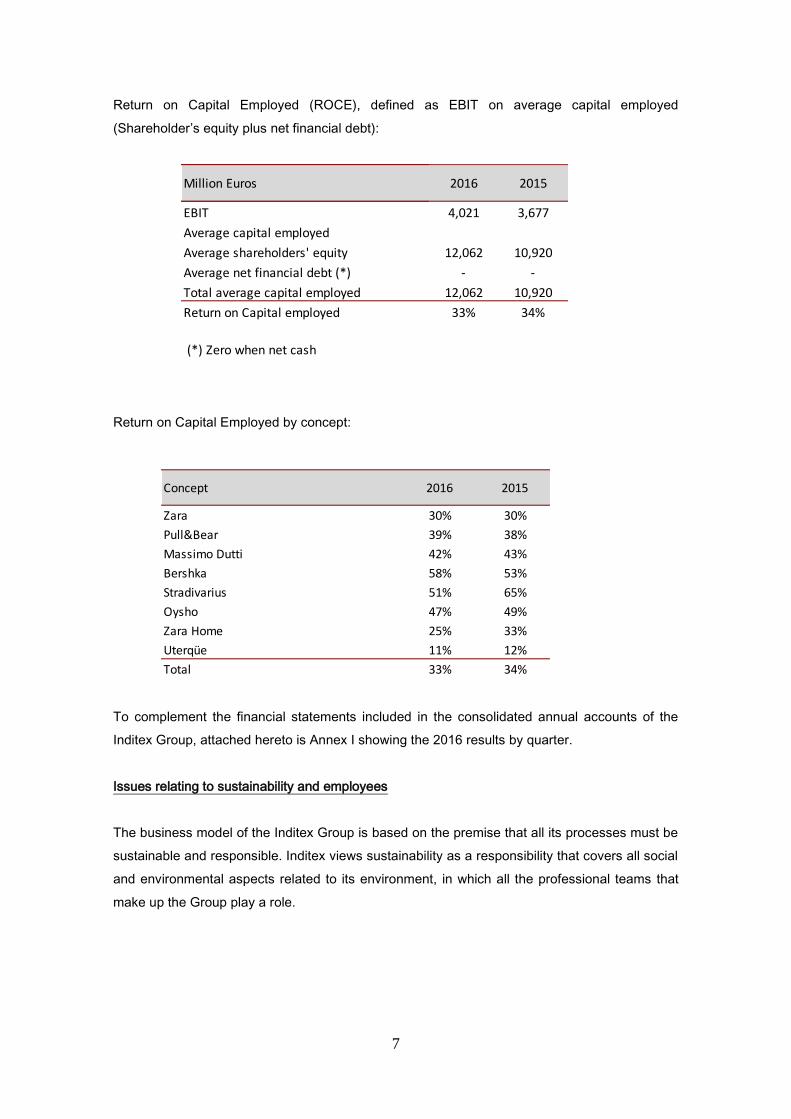
7
Return on Capital Employed (ROCE), defined as EBIT on average capital employed
(Shareholder’s equity plus net financial debt):
Return on Capital Employed by concept:
To complement the financial statements included in the consolidated annual accounts of the
Inditex Group, attached hereto is Annex I showing the 2016 results by quarter.
Issues relating to sustainability and employees
The business model of the Inditex Group is based on the premise that all its processes must be
sustainable and responsible. Inditex views sustainability as a responsibility that covers all social
and environmental aspects related to its environment, in which all the professional teams that
make up the Group play a role.
Million Euros 2016 2015
EBIT 4,021 3,677
Average capital employed
Average shareholders' equity 12,062 10,920
Average net financial debt (*) - -
Total average capital employed 12,062 10,920
Return on Capital employed 33% 34%
(*) Zero when net cash
Concept 2016 2015
Zara 30% 30%
Pull&Bear 39% 38%
Massimo Dutti 42% 43%
Bershka 58% 53%
Stradivarius 51% 65%
Oysho 47% 49%
Zara Home 25% 33%
Uterqüe 11% 12%
Total 33% 34%

8
This responsibility is reflected in a series of commitments including most notably the responsible
manufacture of goods, the traceability and integrity of the supply chain, efficient use of resources,
innovation and customer service and a commitment to its employees and the community. All of
these processes are carried out within Inditex under the Right to Wear principle, which defines
the ethical and sustainable commitment from the Company's social and environmental point of
view and which encompasses, inter alia, product health and safety processes (Clear To Wear
and Safe To Wear), traceability and integrity of the supply chain (Tested To Wear), environmental
processes (Green To Wear), corporate policies (Teams To Wear), and investment in the
community (Social To Wear).
All suppliers and factories involved in the production process of goods for sale are obliged on an
explicit and binding basis to adhere to the social responsibility and environmental values and
practices. These define the Group, and are transmitted through the Sustainability Department and
its purchasing teams. Inditex responds to this challenge through the creation and implementation
of policies that are in tune with fundamental employment standards and environmental protection,
as well as the establishment of tools for monitoring and direct cooperation with suppliers and
multilateral dialogue with bodies and institutions working in these areas.
In this connection, Inditex's commitment and duty to responsible management of its supply chain
involve identifying the areas of work that contribute to improving the sector's conditions in each
of the countries in which the Group operates, thereby creating sustainable productive
environments. The Manufacturer and Supplier Code of Conduct, and the Compliance Program
that ensures its implementation, are the cornerstone on which Inditex bases its supply chain
management and strengthening work.
Noteworthy among the projects in which Inditex has collaborated in order to meet the challenge
posed by a sustainable manufacturing chain are the following:
- The 2014 - 2018 Strategic Plan for a Stable and Sustainable Supply Chain.
- Supply chain traceability system.
- Manufacturer and Supplier Code of Conduct Compliance Program.
- Establishment of supplier clusters as platforms for communication.
- 2016-2020 Inditex Environmental Plan: Program for improved energy, water and waste
management in the Green to Wear manufacturing chain.
- Forest product policy to protect primary forests in danger of extinction.
- Product health and safety standards compliance programs Clear to Wear and Safe to
Wear.
- Ready to Manufacture program to evaluate the wet textile manufacturing processes, with
the aim of implementing practices to guarantee product health and safety.
9
- The List, by Inditex, research and quality control program for the chemical products
employed in textile manufacturing.
These projects are associated with several codes and commitments assumed by Inditex,
including most notably the following:
The Framework Agreement with IndustriALL Global Union (formerly ITGLWF) (www.industriall-
union.org). To promote fundamental human and social rights in Inditex's manufacturing chain,
including the definition of intervention and joint-action mechanisms in the manufacturing chain for
the implementation of the Manufacturer and Supplier Code of Conduct. Date of adherence: 4
October 2007. On 4 May 2012 Inditex and IndustriALL signed the "Protocol to specify trade union
involvement in order to strengthen the Global Framework Agreement for the manufacturing chain
of Inditex". On 8 July 2014 the Framework Agreement between both parties was renewed at the
headquarters of the International Labour Organization (ILO) in Geneva (Switzerland). In 2016 a
new agreement was reached which allows the involvement of trade union experts in the clusters
(local platforms to communicate with our stakeholders), in order to monitor, supervise and work
alongside the suppliers throughout the entire supply chain.
The Accord on Fire and Building Safety in Bangladesh's Textile Industry dated 13 May 2013
(www.bangladeshaccord.org). This is an agreement between global brands and retailers and
local and international trade unions and NGOs, with the aim of ensuring lasting improvements in
the working conditions of Bangladesh's textile industry.
United Nations Global Compact (www.globalcompact.org). A United Nations initiative to promote
social dialogue between companies and the civil society. Date of adherence: 31 October 2001.
Ethical Trading Initiative (ETI) (www.ethicaltrade.org). A platform for dialogue to improve the
working conditions of workers in developing countries in the retail sector, comprising companies,
international trade union organizations and non-governmental organizations. Date of adherence:
17 October 2005.
ACT (Action, Collaboration, Transformation) is a collaborative initiative between retail brands,
suppliers and trade unions to promote living wages in the textile sector's supply chain. To
implement this initiative, the brands included in ACT and IndustriALL Global Union executed a
Memorandum of Understanding to establish the principles of freedom of association, collective
bargaining and living wages in the manufacturing chains. Date signed: 13 March 2015.

10
The ILO's Better Work Program (www.betterwork.org). A platform to improve compliance with
labor standards and the competiveness of global supply chains. Date of adherence: October
2007. In the course of this partnership, Inditex and Better Work executed on 9 October 2013 a
specific collaboration agreement whereby Inditex became a direct buyer partner of the Better
Work Program.
Zero Discharge of Hazardous Chemicals in 2020. Commitment to the restriction and elimination
of certain chemicals in the product manufacturing process. Date of execution: 27 November 2012.
The CEO Water Mandate (www.ceowatermandate.org). A United Nations initiative to support
companies in the development, application and communication of its water strategies and
policies. Date of adherence: 30 June 2011.
Sustainable Apparel Coalition (www.apparelcoalition.org). A textile sector initiative to develop a
common sustainability index in order to evaluate the environmental performance of suppliers
during the production process. Date of adherence: 20 October 2011.
Textile Exchange (www.textileexchange.org). A platform to promote the growing of organic cotton
and global sustainability in the textile sector. Date of adherence: 8 September 2010.
Better Cotton Initiative (www.bettercotton.org). An initiative that develops and promotes good
practices in the traditional growing of cotton for the benefit of those who produce it, the
environment and to ensure the future of the sector. Date of adherence: 1 July 2011.
Code of good tax practices. The code promotes a mutual cooperation between the tax authorities
and companies. Date of adherence: 21 September 2010.
The Cotton Campaign is a global coalition of human rights, labor, investor and business
organizations dedicated to improving the working conditions of the cotton sectors in Uzbekistan
and Turkmenistan. Date of adherence: 26 October 2012.
Fur Free Alliance (www.infurmation.com). Inditex forms part of the Fur Free Alliance's Fur Free
Retailer Program. The Fur Free Alliance is an international coalition of organizations to protect
animals, whose main objective is to end the exploitation and killing of animals for fur. Date of
adherence: 1 January 2014.
Bangladesh Water PaCT (Partnership for Cleaner Textile). A four-year initiative to promote
change in the Bangladesh textile sector by improving the environment of the so-called wet
processes (dying, washing, printing and other finishes), thereby contributing to the sector's long-
term competiveness. Date of adherence: 20 June 2013.
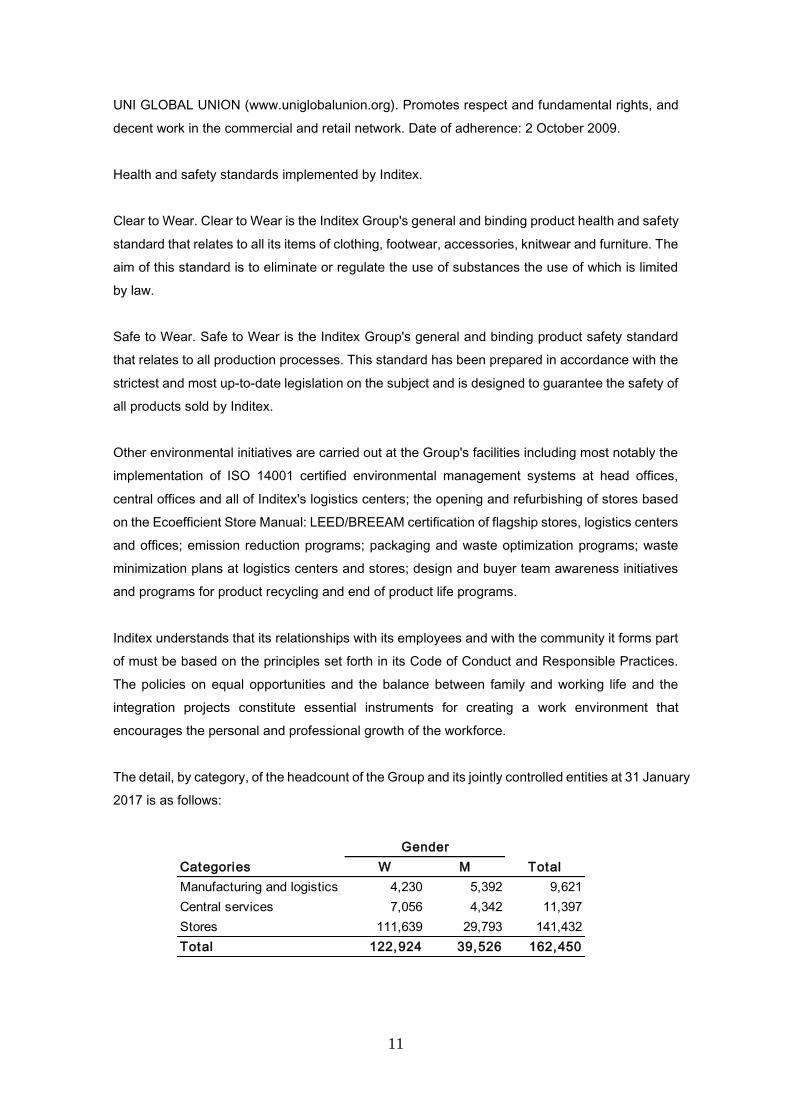
11
UNI GLOBAL UNION (www.uniglobalunion.org). Promotes respect and fundamental rights, and
decent work in the commercial and retail network. Date of adherence: 2 October 2009.
Health and safety standards implemented by Inditex.
Clear to Wear. Clear to Wear is the Inditex Group's general and binding product health and safety
standard that relates to all its items of clothing, footwear, accessories, knitwear and furniture. The
aim of this standard is to eliminate or regulate the use of substances the use of which is limited
by law.
Safe to Wear. Safe to Wear is the Inditex Group's general and binding product safety standard
that relates to all production processes. This standard has been prepared in accordance with the
strictest and most up-to-date legislation on the subject and is designed to guarantee the safety of
all products sold by Inditex.
Other environmental initiatives are carried out at the Group's facilities including most notably the
implementation of ISO 14001 certified environmental management systems at head offices,
central offices and all of Inditex's logistics centers; the opening and refurbishing of stores based
on the Ecoefficient Store Manual: LEED/BREEAM certification of flagship stores, logistics centers
and offices; emission reduction programs; packaging and waste optimization programs; waste
minimization plans at logistics centers and stores; design and buyer team awareness initiatives
and programs for product recycling and end of product life programs.
Inditex understands that its relationships with its employees and with the community it forms part
of must be based on the principles set forth in its Code of Conduct and Responsible Practices.
The policies on equal opportunities and the balance between family and working life and the
integration projects constitute essential instruments for creating a work environment that
encourages the personal and professional growth of the workforce.
The detail, by category, of the headcount of the Group and its jointly controlled entities at 31 January
2017 is as follows:
Gender
Categories W M Total
Manufacturing and logistics 4,230 5,392 9,621
Central services 7,056 4,342 11,397
Stores 111,639 29,793 141,432
Total 122,924 39,526 162,450
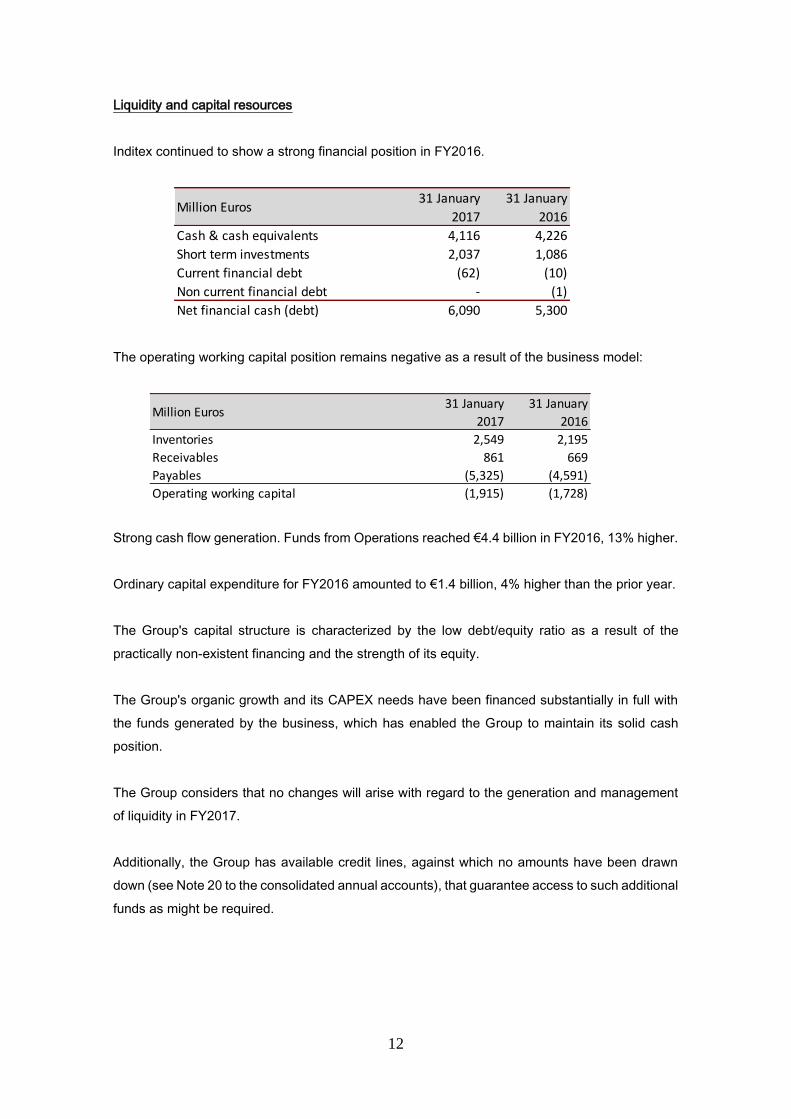
12
Liquidity and capital resources
Inditex continued to show a strong financial position in FY2016.
The operating working capital position remains negative as a result of the business model:
Strong cash flow generation. Funds from Operations reached €4.4 billion in FY2016, 13% higher.
Ordinary capital expenditure for FY2016 amounted to €1.4 billion, 4% higher than the prior year.
The Group's capital structure is characterized by the low debt/equity ratio as a result of the
practically non-existent financing and the strength of its equity.
The Group's organic growth and its CAPEX needs have been financed substantially in full with
the funds generated by the business, which has enabled the Group to maintain its solid cash
position.
The Group considers that no changes will arise with regard to the generation and management
of liquidity in FY2017.
Additionally, the Group has available credit lines, against which no amounts have been drawn
down (see Note 20 to the consolidated annual accounts), that guarantee access to such additional
funds as might be required.
Million Euros 31 January
2017
31 January
2016
Cash & cash equivalents 4,116 4,226
Short term investments 2,037 1,086
Current financial debt (62) (10)
Non current financial debt - (1)
Net financial cash (debt) 6,090 5,300
Million Euros 31 January
2017
31 January
2016
Inventories 2,549 2,195
Receivables 861 669
Payables (5,325) (4,591)
Operating working capital (1,915) (1,728)
13
Analysis of contractual obligations and off balance sheet transactions
As detailed in Note 25 to the consolidated annual accounts, the most significant contractual
obligations related to future minimum payments under non-cancellable operating leases.
Also, commitments exist in relation to investments envisaged in the opening of new stores in
FY2017, the amount of which is included in the figure for capital expenditure detailed under Issues
relating to sustainability and employees.
Main risks and uncertainties
In order to facilitate unified and comprehensive risk management, the Group has established a
common definition of risk for the Organization as a whole. Accordingly, the Group defines a risk
as "any potential event that may have a negative impact on the fulfilment of the business
objectives".
The risks reviewed are classified and grouped in the following categories:
1. Business environment
Risks arising from external factors relating to the Group's business activities.
This category includes risks relating to difficulties in adapting to the environment or market in
which the Group operates, as regards both the procurement processes and the product retailing
and sale activities. These risks are inherent to the fashion retailing business and consist of the
Group's potential inability to continue operating and react to changes in its target market or to
adapt to new situations in the countries from which it obtains its supplies or in which it performs
retail activities.
In this regard, country-risk triggering geo-political, demographic and socio-economic changes in
countries in which procurements or retail sales are made, the emergence of new means of
communication and changes in consumer behavior or a downturn in demand in certain markets
constitute, inter alia, factors that might have an adverse effect on the optimum achievement of
the Group's business objectives.
2. Legislative and regulatory
These are the risks to which the Group is exposed as a result of the legislation in force in the
countries in which it carries on its business activities.

14
The risks included in this category include risks relating to tax, customs, labor law, commercial
and consumption-related regulations, intellectual property regulations and risks relating to other
types of legislation, in particular, regulations in relation to criminal risk, which determine the
criminal liability of legal entities, and other risks of non-compliance with legislation.
The General Secretary's department supervises and manages the Inditex Group's regulatory
compliance system in order to prevent legal (including criminal) and reputational risks arising from
possible regulatory breaches, and to achieve the best ethical standards and monitor the corporate
best practices.
3. Reputation
These are risks which have a direct influence on the perception of the Group held by its
stakeholders (customers, employees, shareholders and suppliers) and society in general.
They arise from the possibility of the incorrect management of issues relating to corporate social
responsibility and environmental sustainability, responsibility for product health and safety, the
corporate image of the Group, as well as its image in social networks, and any other potential
regulatory breach that might have an impact on the Organization's reputation.
4. Human resources
The main risks relating to human resources are those arising from potential dependence on key
employees and the difficulties involved in identifying and adequately retaining talent, and
maintaining an adequate working environment in all the work centers.
5. Operational
The principal operational risks to which the Group is exposed arise from the possible difficulties
involved in recognizing and taking on board the constant changes in fashion trends, and in
manufacturing, buying and selling new items that meet customer expectations.
The risk arising from the interruption of operations is associated with the possible occurrence of
extraordinary events not within the Group's control (natural disasters, fires, transport or key
supplier strikes, interruptions in energy and fuel supplies, withholding of goods in freight, etc.),
which could have a significant effect on the normal functioning of the Group's operations.
In view of the Group's operating structure, the main operational risks are concentrated at logistics
centers and at third party operators transporting goods. The clothing, footwear, accessories and
household products of all the concepts are distributed from 14 logistics centers located throughout
Spain. Logistics distribution is complemented by other smaller logistics centers located in other
15
countries and with third party logistics operators which carry out small scale distribution
operations.
Other risks included under this category would be those associated with property management,
particularly in relation to the search for and selection of commercial premises and the return
thereon.
6. Financial
The normal functioning of the Group's operations exposes it to risks of a financial nature. This
category includes foreign currency risk and counterparty credit risk. In addition, the increasingly
international nature of the Group's businesses exposes it to country risk in its various different
markets.
The euro is the Group's functional currency. Its international transactions require the use of
numerous non-euro currencies giving rise to foreign currency risk. The Group has investments
overseas whose assets are exposed to the foreign currency risk. Given that the Group
consolidates the annual accounts of all its companies in its functional currency, i.e. in the euro, it
is exposed to foreign currency risk in the translation of the results of all its entities located outside
the Economic and Monetary Union. The Group is also exposed to the risk arising from the
payment and collection flows in currencies other than the euro in relation to the acquisition and
provision of goods and services in both Group and non-Group transactions.
The Group is not exposed to significant concentrations of counterparty credit risk. The majority of
its revenue relates to retail sales which are collected in cash or through credit or debit card
payments. In any event, the Group is exposed to the risk that the (mainly financial) counterparties
do not fulfil the obligations resulting from investing the Company's liquidity, under the credit
facilities or other funding and guarantee vehicles or the derivatives arranged to hedge financial
risks.
7. Information for decision-making
The risks in this category relate to the availability of adequate information at all levels:
transactional and operating information, financial and accounting information, management
information and budgeting and control information.
The Group's various departments and particularly the Management Planning and Control and the
Administration departments, which report to the Corporate Finance Department, are directly
responsible for producing and supervising the quality of this information.

16
8. Technology and information systems
These include the risks associated with the technological infrastructure, the effective
management of information, IT and robotic networks and communications. They also include
those relating to the physical and technological security of systems, in particular, the risk of
cyberattacks on information systems, which could potentially affect the confidentiality, integrity
and availability of critical data.
9. Corporate governance
This category includes the risk relating to the possibility of an inadequacy in the Group's
management leading to the failure to comply with corporate governance and transparency rules.
Risk management at the Group is a process promoted by the Board of Directors and senior
management and is the responsibility of all members of the Organization, the purpose of which is
to provide reasonable assurance that the objectives established by the Group will be achieved,
furnishing shareholders, other stakeholders and the market in general with sufficient guarantees
to ensure that the value generated will be protected.
In this context, the Group's Risk Management and Control Policy establishes the basic principles,
key risk factors and the general action guidelines for managing and controlling the risks that affect
the Group. This Policy is applicable to the entire Group and forms the basis for an Integral Risk
Management System.
The Risk Management and Control Policy is implemented and complemented by specific policies
and internal regulations relating to certain units or areas of the Group. The policies and internal
regulations developed and implemented by these areas for the management of the different types
of risk include most notably:
Investment Policy.
External Financing Policy.
Payment Management Policy.
Financial Risk Management Policy.
Code of Conduct and of Responsible Practices.
Criminal Risk Prevention Policy.
Criminal Risk Prevention Proceedings.
Internal Code of Conduct for matters related to Securities Markets.
Corporate Social Responsibility Policy.

17
Manufacturer and Supplier Code of Conduct.
Occupational Risk Prevention Policy.
Environmental Sustainability Policy.
IT Security Policy.
Purchasing and Contracting Policy.
Shareholder, Institutional Investor and Proxy adviser communication and Relations policy.
Representation by Proxy and Authorised Representative Policy and Procedure.
Human Rights Policy.
Compliance Policy.
Tax Strategy and Policy.
Procedure to Engage Auditors for the Provision of Non-Audit Services.
For more details, see Section E-Risk control systems of the Annual Corporate Governance Report
for 2016.
Significant events after the reporting period
No significant events have occurred since the reporting date.
Information on the outlook for the Group
Store & Online sales in local currencies, adjusted for the calendar effect of an extra trading day
in February 2016 due to the leap year, have increased by 13% from 1 February to 12 March 2017.
The Spring/Summer season is influenced by the performance over the Easter period due to its
significant sales volumes.
In FY2017 Inditex expects 450-500 gross openings and the selective absorption of 150-200 small
units into neighbouring stores. Approximately 70% of the new contracts have been signed but in
some cases openings may not take place in FY2017.
Online sales for Zara were launched in Singapore and Malaysia in March 2017, with Thailand and
Vietnam to follow in the coming weeks. In 2017, Zara expects to launch online sales in India.
Ordinary capital expenditure in FY2017 will be approximately €1.5 billion driven mainly by the
addition of new space in prime locations during the year. Ordinary capital expenditure is expected
to grow below space growth in the coming years.
18
In view of the performance of Inditex over recent years, the Board of Directors has agreed to
extend the existing special profit sharing plan for employees to FY2017 and FY2018.
Inditex sees strong growth opportunities and continues to expand its global, fully integrated store
and online sales platform.
R&D+I activities
The Inditex Group generally does not carry out research and development projects, which are
defined as projects, other than those involving the design of garments, accessories, household
products or certain logistical activities, in which amounts are invested over several years to
develop assets on which a return is expected over multi-year periods.
Since its inception, the Group has been run with the help of the technology available in all areas
of activity in order to improve manufacturing and distribution processes, and by developing in-
house or third-party tools to facilitate the management of the business. Some examples of this
are point-of-sale terminals, inventory management systems, distribution center delivery systems,
systems for communications with stores and in-store garment labeling systems.
Acquisition and sale of treasury shares
The annual general shareholders' meeting held on 16 July 2013 approved the 2013-2017 Long-
Term Share-Based Incentive Plan ("the 2013-2017 Plan") aimed at management and other
employees of the Inditex Group (see Note 27) and authorized the Board of Directors to derivatively
acquire treasury shares to cater for this plan. Additionally, the annual general shareholders'
meeting held on 19 July 2016 approved the 2016-2020 Long-Term Incentive Plan ("the 2016-
2020 Plan") (see Note 27) and authorized the Board of Directors to acquire treasury shares to
cater for this plan.
At 1 February 2016 the Company held 3,500,000 treasury shares. In 2016, settlement of the first
cycle (2013-2016) of the 2013-2017 Plan took place, with the corresponding shares being
delivered to the beneficiaries of the aforementioned first cycle of the Plan.
Also, in order for the Company to have the shares required for their delivery to the beneficiaries
of the second cycle (2014-2017) of the 2013-2017 Plan, the Company acquired shares until it
reached a total of 3,610,755, representing 0.116 % of the share capital at 31 January 2017.

19
Other salient information
Stock market information
Shares in Inditex saw growth of 1.5% during the financial year 2016, closing at 30.535 Euros per
share on 31st January 2017, on top of a 15.5% growth during financial year 2015. The average
transacted volume of shares in financial year 2016 was approximately 5.7 million per day. In the
same period, the Dow Jones Stoxx 600 Retail fell by 5.3% and the Ibex 35 rose by 5.7%, following
declines of 4.4% and 15.3%, respectively, in 2015.
Inditex's market capitalization stood at 95,167 million Euros at FYE 2016, up 939% on its
capitalization when its shares were admitted to trading on 23 May 2001, as compared with a 3%
decrease in the Ibex 35 index in the same period.
The dividend for FY2015 totaling Euros 0.60 per issued share was paid in May and November
2016.
Dividend policy
The Group's policy consists of the payment of dividends equivalent to 50% of the net profit
generated in the year as an ordinary dividend and the possibility of a bonus dividend.
Inditex’s Board of Directors will propose at the General Shareholders Meeting a dividend increase
of 13%, composed of an ordinary dividend of €0.50 per share and a bonus dividend of €0.18 per
share, equating to a total dividend of €0.68 per share. €0.34 would be payable on 2 May 2017 as
an interim ordinary dividend and €0.34 would be payable on 2 November 2017 as the final
ordinary and bonus dividend.
Dividends paid to shareholders in 2016 reached €1.9 billion.
Other disclosures
Related party transactions
Transactions with related parties are described in Note 30 to the consolidated annual accounts.
The Company did not carry out any transactions with related parties in FY2016 that substantially
affected its financial position or results.
The following table shows the information on average payment periods required by Law 15/2012,
of 5 July, amending Law 3/2004, of 29 December

20
The Group's supplier payment policy complies with the periods for payment to suppliers set in the
late payment legislation in force. The Group is developing measures to try to reduce the payment
period in those rare cases in which the established maximum payment period is exceeded. The
aforementioned measures will focus on reducing the length of the processes involved in the
receipt, verification, acceptance and accounting of invoices (enhancing use of electronic and
technological methods) and improving the procedure for incident resolution in this connection.
Annual Corporate Governance Report
The Annual Corporate Governance Report for 2016 is available at www.inditex.com and was
published in the section on Relevant Event Communications of the CNMV (Spanish National
Securities Market Commission) website (www.cnmv.es) on 15 March 2017.
Alternative performance measures
The gross profit, EBITDA, EBIT, ROCE and ROE are defined in the initial Note to the
consolidated annual accounts for 2016.
The information disclosed in this document may contain statements in relation to future intentions,
expectations and projections. All such statements, except for those based on historical data, are
forward-looking statements, including, inter alia, those that address our financial position,
business strategy, management plans and objective for future transactions. The aforementioned
intentions, expectations or projections are subject per se to risks and uncertainties which could
cause actual results to differ from those anticipated.
These risks include, but are not limited to, competition within the sector, consumer preferences
and spending trends, economic and legal conditions, restrictions on free trade and/or political
instability in those markets where the Inditex Group has a presence or in those countries in which
Group products are manufactured or distributed.
The risks and uncertainties that could potentially have an impact on the information disclosed are
difficult to predict. The Group undertakes no obligation to publicly update or revise any of the
forward-looking statements in the event that any unforeseen changes or events arise which might
affect them.
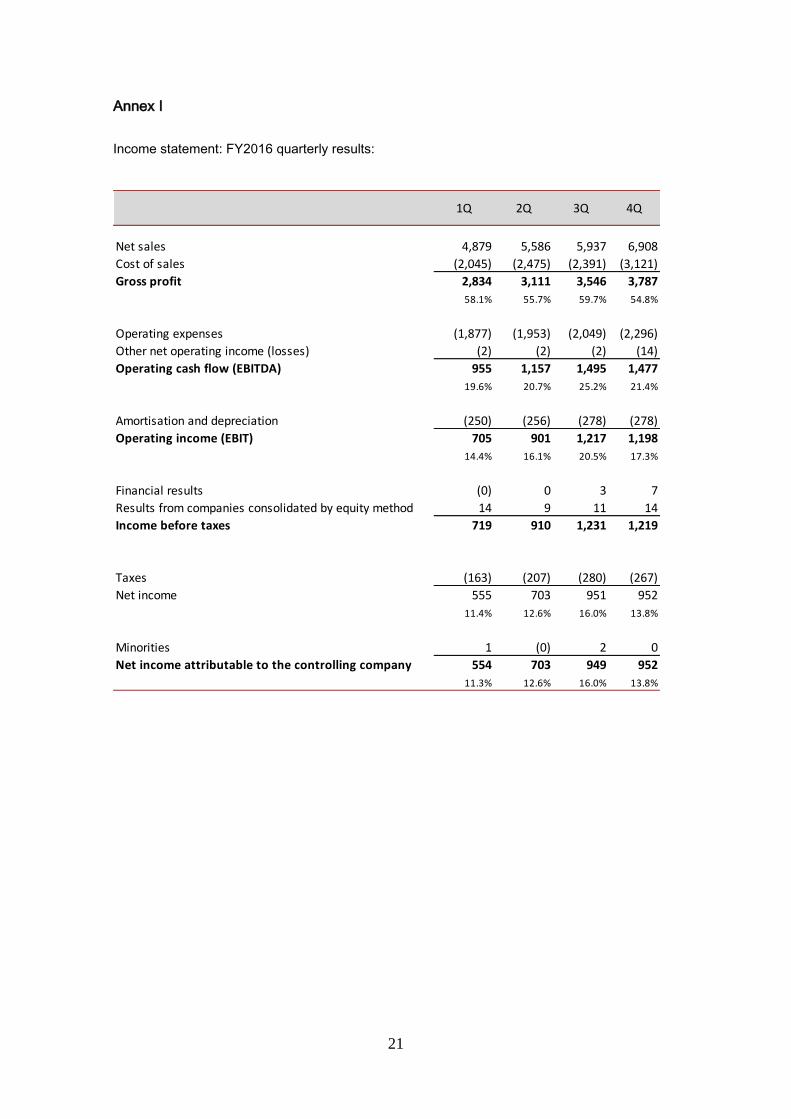
21
Annex I
Income statement: FY2016 quarterly results:
1Q 2Q 3Q 4Q
Net sales 4,879 5,586 5,937 6,908
Cost of sales (2,045) (2,475) (2,391) (3,121)
Gross profit 2,834 3,111 3,546 3,787
58.1% 55.7% 59.7% 54.8%
Operating expenses (1,877) (1,953) (2,049) (2,296)
Other net operating income (losses) (2) (2) (2) (14)
Operating cash flow (EBITDA) 955 1,157 1,495 1,477
19.6% 20.7% 25.2% 21.4%
Amortisation and depreciation (250) (256) (278) (278)
Operating income (EBIT) 705 901 1,217 1,198
14.4% 16.1% 20.5% 17.3%
Financial results (0) 0 3 7
Results from companies consolidated by equity method 14 9 11 14
Income before taxes 719 910 1,231 1,219
Taxes (163) (207) (280) (267)
Net income 555 703 951 952
11.4% 12.6% 16.0% 13.8%
Minorities 1 (0) 2 0
Net income attributable to the controlling company 554 703 949 952
11.3% 12.6% 16.0% 13.8%

22
Annex II
Stores by concept and market as at 31 January 2017:
Market Zara Zara Kids Pull&BearMassimo
DuttiBershka
Stradivariu
sOysho Zara Home Uterqüe INDITEX
ALBANIA 1 1 1 1 1 5
GERMANY 77 11 20 11 18 137
ANDORRA 1 1 1 1 1 1 1 1 8
SAUDI ARABIA 34 15 14 31 44 18 6 3 165
ALGERIA 1 1 2 1 1 6
ARGENTINA 10 10
ARMENIA 2 2 2 2 2 1 11
ARUBA 1 1
AUSTRALIA 18 3 21
AUSTRIA 14 3 3 8 4 32
AZERBAIJAN 3 2 2 3 2 1 13
BAHREIN 2 2 2 1 1 1 1 10
BELGIUM 29 8 23 11 2 9 82
BOSNIA 3 3 1 3 3 13
BRAZIL 56 15 71
BULGARIA 6 5 5 7 5 5 33
CANADA 28 8 2 38
CHILE 9 2 11
CHINA 193 81 79 84 74 73 36 620
CYPRUS 6 5 4 6 6 4 4 35
COLOMBIA 13 5 5 11 11 3 3 51
SOUTH KOREA 43 5 8 6 3 2 3 70
COSTA RICA 2 2 1 2 2 1 10
CROATIA 10 6 4 9 6 3 2 40
DENMARK 4 1 5
ECUADOR 2 2 1 2 2 1 10
EGYPT 5 5 4 5 4 3 3 29
EL SALVADOR 2 2 2 1 7
UAE 11 8 11 9 6 8 8 2 63
SLOVAKIA 3 2 3 3 11
SLOVENIA 5 2 1 4 4 16
SPAIN 313 123 243 212 231 292 191 147 35 1,787
UNITED STATES 78 3 81
ESTONIA 3 1 2 1 1 1 9
PHILIPPINES 8 2 2 4 3 19
FINLAND 4 1 5
FRANCE 128 1 37 24 50 22 12 22 296
GEORGIA 3 1 3 2 2 1 12
GREECE 39 6 24 12 29 20 18 10 158
GUATEMALA 3 3 1 3 3 2 1 16
NETHERLANDS 26 8 7 15 1 4 61
HONDURAS 2 2 1 2 2 1 10
HUNGARY 8 7 3 10 8 2 2 40
INDIA 19 2 21
INDONESIA 15 11 4 7 12 1 3 53
IRELAND 9 3 2 6 3 23
ICELAND 2 2
ISRAEL 23 25 2 10 3 63
ITALY 100 53 9 60 74 46 35 377
JAPAN 100 24 11 17 152
JORDAN 3 3 3 2 5 2 2 1 21
KAZAKHSTAN 4 4 3 4 5 2 3 25
KUWAIT 6 3 2 2 2 4 3 2 24
LATVIA 4 3 2 3 1 13
LEBANON 7 5 6 8 5 5 4 1 41
LITHUANIA 5 4 5 4 4 2 24
LUXEMBOURG 3 1 1 5
MACEDONIA 1 1 1 1 1 5
MALAYSIA 9 2 5 4 20
MALTA 1 3 1 2 2 1 2 12
MOROCCO 4 2 2 2 6 3 3 1 23
MEXICO 79 61 37 64 36 46 25 12 360
MONACO 1 1
MONTENEGRO 1 1 1 1 1 5
NICARAGUA 1 1 1 1 4
NORWAY 4 1 5
NEW ZEALAND 1 1
OMAN 1 1 1 1 1 5
PANAMA 3 2 1 2 2 2 1 13
PARAGUAY 1 1 2
PERU 3 2 5
POLAND 47 36 26 52 72 18 11 1 263
PORTUGAL 67 16 53 41 50 44 34 26 6 337
PUERTO RICO 3 3
QATAR 4 3 3 3 1 3 3 2 22
UNITED KINGDOM 66 8 14 5 4 13 110
CZECH REPUBLIC 7 5 1 4 4 21
DOMINICAN REPUBLIC 2 1 2 2 2 2 1 12
ROMANIA 24 24 11 24 24 9 6 122
RUSSIA 95 89 52 98 86 67 44 10 541
SERBIA 4 2 2 2 2 2 1 15
SINGAPORE 9 3 4 3 1 20
SOUTH AFRICA 9 1 10
SWEDEN 12 1 4 1 4 22
SWITZERLAND 19 2 8 5 2 36
THAILAND 11 3 4 1 2 2 23
TAIWAN 9 3 5 1 2 20
TUNISIA 3 2 1 2 1 2 11
TURKEY 36 28 22 30 28 25 19 188
UKRAINE 9 0 11 5 11 11 6 0 1 54
URUGUAY 2 0 0 0 0 0 0 2 0 4
VENEZUELA 9 0 5 0 10 0 0 0 0 24
VIETNAM 1 0 0 0 0 0 0 0 0 1
INDITEX 2,067 146 973 765 1,081 994 636 552 78 7,292
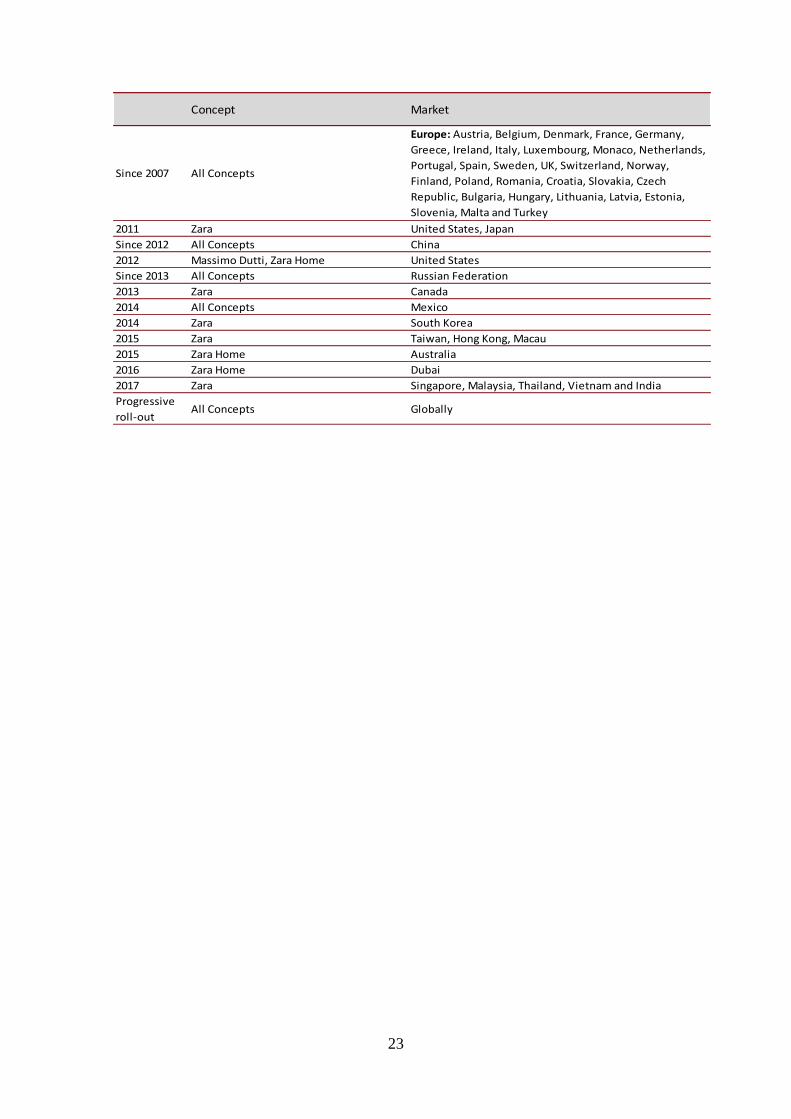
23
Concept Market
Since 2007 All Concepts
Europe: Austria, Belgium, Denmark, France, Germany,
Greece, Ireland, Italy, Luxembourg, Monaco, Netherlands,
Portugal, Spain, Sweden, UK, Switzerland, Norway,
Finland, Poland, Romania, Croatia, Slovakia, Czech
Republic, Bulgaria, Hungary, Lithuania, Latvia, Estonia,
Slovenia, Malta and Turkey
2011 Zara United States, Japan
Since 2012 All Concepts China
2012 Massimo Dutti, Zara Home United States
Since 2013 All Concepts Russian Federation
2013 Zara Canada
2014 All Concepts Mexico
2014 Zara South Korea
2015 Zara Taiwan, Hong Kong, Macau
2015 Zara Home Australia
2016 Zara Home Dubai
2017 Zara Singapore, Malaysia, Thailand, Vietnam and India
Progressive
roll-outAll Concepts Globally