annual report 2000 - inditex
TRANSCRIPT

Annual report 2000

Chairman’s statement
Financial highlights
International presence
Five chains and one philosophy
Business performance
Corporate government
3
6
11
14
28
40
Index

Chairman’s Statement


Chairman
Once again, Inditex’s Annual Report makes public the group’s results for the last fiscal year and the main aspects of its activity in 2000. As before, the data compiled in this document is proof of the efforts made by the team of people who make up this company, a team which is capable of keeping up the intense rate of growth of recent years.
During fiscal year 2000 we have continued our international expansion, and there are now thirty-three countries containing at least one of the five chains forming part of Inditex. Four of them have been incorporated as new markets over the course of the last year. This growth is reflected to the greatest extent in the number of new stores, over 150, and the overall number of outlets, which reached 1,080 on January 31 .
Last year marked the 25th anniversary of the opening of the group’s first store. A lot has changed since then, from the world we live in, to the company itself. But one thing hasn’t changed - the innovative spirit and urge for improvement that was the driving force back then. Today we number over 24,000 professionals world-wide, who each day tackle the same goal that we set when we opened that first store: to satisfy the needs of our customers with the latest in fashion.
In the near future, we are going to take on new projects, which will surely oblige us to renew our commitment. We have a strong foundation, as is evidenced by our course of steady growth, profitability and commercial success. During the last fiscal year our net income rose by 27% and our net revenues by 28%. Sales in our stores located outside Spain have now exceeded 52% of the total, which confirms our international calling.
We plan to continue consolidating our presence in many of the international markets that we have recently entered, paying special attention to Europe, but without overlooking our expansion in other parts of the world. We will undoubtedly enter new countries and all of the chains in our group will continue to strive to bring their concept of fashion to new customers all over the world. As we have done up to now, we will have to continue to win the confidence of the millions of people who frequent our stores on three continents with the quality of our work. Just as we did in that first store which opened its doors in A Coruña 25 years ago, we will expose ourselves daily to public scrutiny and attempt to seduce the customer with the latest fashion, the finest design, and the most attentive service.
It gives me true satisfaction to be able to present the impressive figures included in this Annual Report 2000, not only because of the achievements they represent, but also because they are the reflection of a solid foundation for the development of our future projects.

Financial highlights

Revenues Net revenues Net sales in owned stores and franchises (VAT excl . ) Percentage of net sales abroad
Prof its and Cash f low EBITDA EBIT Net income before minorit ies Net income after minorit ies Cash-f low
Financial Structure Shareholders ' funds Net f inancial debt
Other Information Number of stores
In Spain
Abroad
Financial and Management Rat ios Net debt on shareholders funds ROE (Net income after minorit ies on average shareholders ’
funds) ROCE (EBIT on average capital employed) Cash f low on net f inancial debt Net gear ing (assets on shareholders ’ funds) Net income after minorities on sales in stores
2000/1998
C.A.G.R.
2000/1999199919981999
G.R.
20002000 1998M i l l i o n E u r o s
MONETARY AMOUNTS
2,6152,607
M i l l i o n P e s e t a s
521380262259401
1,171
51
2,0352,000
410296206205319
893
150
1,6151,525
326242153153237
673
93
435,049433,693
52%
194,822
8,420
1,080
692
388
4%25%34%
7.91.89.9
338,607332,843
48%
68,29249,27834,31434,07053,084
268,665253,818
46%
54,18440,18325,44025,48039,481
148,613
24,949
922
603
319
112,040
15,477
748
489
259
17%26%33%
2.12.0
10.1
14%25%37%
2.62.09.5
28%30%
27%28%27%27%26%
31%
-66%
27%31%
27%25%31%30%30%
32%
-46%
86,76863,20843,57943,13366,693

2000
00/99
435,049
28%
net revenues income2000
00/99
43,133
27%
net
2000
00/99
66,693
26%
2000
00/99
52%
48%
sales in storeabroad
number of
2000
1999
1,080
922
stores
cash flow
2000 10%
incomeneton sales

The net revenues of the group have doubled in the last three years.
In the last fiscal year, closed on January 31, 2001, Inditex achieved consolidated net revenues
of 435,049 million pesetas, up 28% on the previous year. In keeping with this data, the
accumulated growth during the last three fiscal years amounted to 115%. The increase in
sales has gone hand in hand with parallel growth in net income, reaching 43,133 million
pesetas, 27% more than the previous year.
Sales in stores abroad now account for 52% of the total, as compared to 48% during the last
fiscal year, which reflects the international calling of its chains. During this period the five
chains that comprise the group have opened a total of 158 new stores. The net income on store
�������������

International presence

America
71
Argentina
Brazil
Canada
Chile
Mexico
United States
Uruguay
Venezuela
1991 4
1992 5
1993 6
1994 8
1995 9
1996 10
1997 14
1998 21
1999 30
2000 33
number of countries

Asia andMiddle East
Europe
943
66
Five fashion chains with 1,080 stores in 33 countries
Zara
Pull & Bear
Massimo Dutti
Bershka
Stradivarius
449
229
198
104
100
Andorra
Austria
Belgium
Cyprus
Denmark
France
Germany
Greece
Malta
Netherlands
Norway
Poland
Portugal
Spain
Sweden
Turkey
United Kingdom Bahrain
Israel
Japan
Kuwait
Lebanon
Qatar
Saudi Arabia
United Arab Emirates
Total number of stores on January 31, 2001

Zara Pull & Bear Massimo Dutti Bershka Stradivarius
Five chains and one philosophy

Inditex currently comprises the fashion retail chains Zara, Pull & Bear, Massimo Dutti, Bershka and Stradivarius.
They all share the same objective: to bring the latest fashion trends to their respective customers.
The goal of Inditex was to divide the market into segments, so the company set up some of the chains and
purchased others which found in the group an ideal platform for their growth. They all share the same philosophy
of marketing and management: to be leaders in their market segment by means of a flexible business model, in
which a vocation for international expansion is a reality.
Each one of these chains enjoys a great deal of autonomy in the management of the business. Their management
teams are free to make marketing decisions and act independently in the administration of their resources. This
freedom in management that has been granted by the group has led to the development of a high degree of
initiative, resulting in the enormous growth of each and every one of the commercial formats.
However, belonging to a group which has expanded to over thirty countries has given them a high level of synergy
in terms of organisation and knowledge management. In this way, each management team is able to focus on
the development of its own business, fully aware that certain support elements are covered by the joint experience
the group has accumulated.
Inditex, the parent company of the group, is in charge of the central corporate services, that is to say, the services
shared by the five chains, and which deal with international growth, administration, the use of logistics technology,
the general human resources policy, legal aspects, financial capacity, etc.

ZaraPull & Bear Cataluña
Massimo DuttiBershka
Stradivarius
Galicia
Functions of each chainGeneral Management
Design
Purchasing
Product
Store Image
Store Management
Logistics
Personnel
Mixed functionsReal Estate – Expansion
Management Control
General Services
Internet
Corporate functionsStrategic Management
General Counsel’s OfficeLegalFiscal
FinancialCapital Markets
Administration Systems Corporate Communications
Insurance Human Resources
Central Services
In addition to performing corporate functions, Inditex also acts as the head of Zara, the first chain set up by the
group, which accounts for three-quarters of the consolidated revenues.
This is the organisational model of the group: five chains sheltered by Inditex with a common philosophy expressing
the belief that all business begins and ends with the customer.

ZARAIn May, 1975 the first Zara store was opened in A Coruña. It was almost by chance
that these four letters were arranged to form a name which, twenty-five years
later, would expand to be in 29 countries on three continents, offering fashion for
men, women and children in its 449 stores.
Living fashion. Every customer, every trend has a place at Zara. From Tokyo to
Buenos Aires, in Paris or in New York, from London to Mexico. More than 10,000
different models are created each year in order to renew the collections every week
with fresh articles. A sizeable team of designers gathers and transforms the tastes
and preferences of our customers, offering new ideas.


Passion for fashion. This is how we might define the attitude of the people who work at Zara
stores all over the world. No matter what language they speak, they all share a universal
language which conveys a quality garment, a satisfied customer and a store that offers a
unique shopping experience.
What differentiates Zara’s business model is the integration of all the stages of the creation
of value in fashion, design and processing the fabrics, in manufacturing garments and in
sale to our customers. About half of the total amount of garments bought by our clients are
manufactured in the plants owned by the group. The rest are provided by suppliers, who
manufacture the models designed by the creative teams of the chain. The ability to respond
quickly to changing consumer tastes is the hallmark of a chain of supply which handles more
than 90 million articles of clothing a year. 80% of the apparel is manufactured in Europe,
with Spain and Portugal being the countries that turn out the highest volumes, both in number
of garments and in value.

Between our factories and our stores: logistics. Zara’s main distribution centre is located in
Arteixo - A Coruña, along with the headquarters of the chain. Merchandise is shipped from
this centre to all the stores several times a week. In Europe, fleets of trucks deliver the
merchandise, covering a distance of more than 7 million kilometres a year. Shipments to more
distant stores are made by air freight, thereby cutting the time between the placement of the
order and the reception of the merchandise. In 2000 more than 9 million kilos of garments
were shipped by air.
Once in the stores, our customers discover the fruits of the efforts of thousands of professionals
who strive to present them with the latest trends, the finest fabrics, and the quality inherent
in an international fashion chain. Their reactions will be again the impulse to start the process
of creating new garments.

Pull & Bear was founded in 1991 by Inditex for the purpose of providing
basic apparel for the young man. In 1998 the line of women’s fashion was
first introduced, putting the final touches to its commercial goal.
Young, active, informal. This is the customer that Pull & Bear targets. With
229 stores in 10 countries, its outlets attract the public through both its
modern image and through its competitive prices.
Pull & Bear’s headquarters, currently located in Arteixo, are scheduled to
move to the municipality of Narón-Ferrol in the province of A Coruña in mid-
2001, together with the new distribution centre on which the future expansion
of the chain will be based. In this new location, all the teams working in the
chain will continue to offer the latest trends.
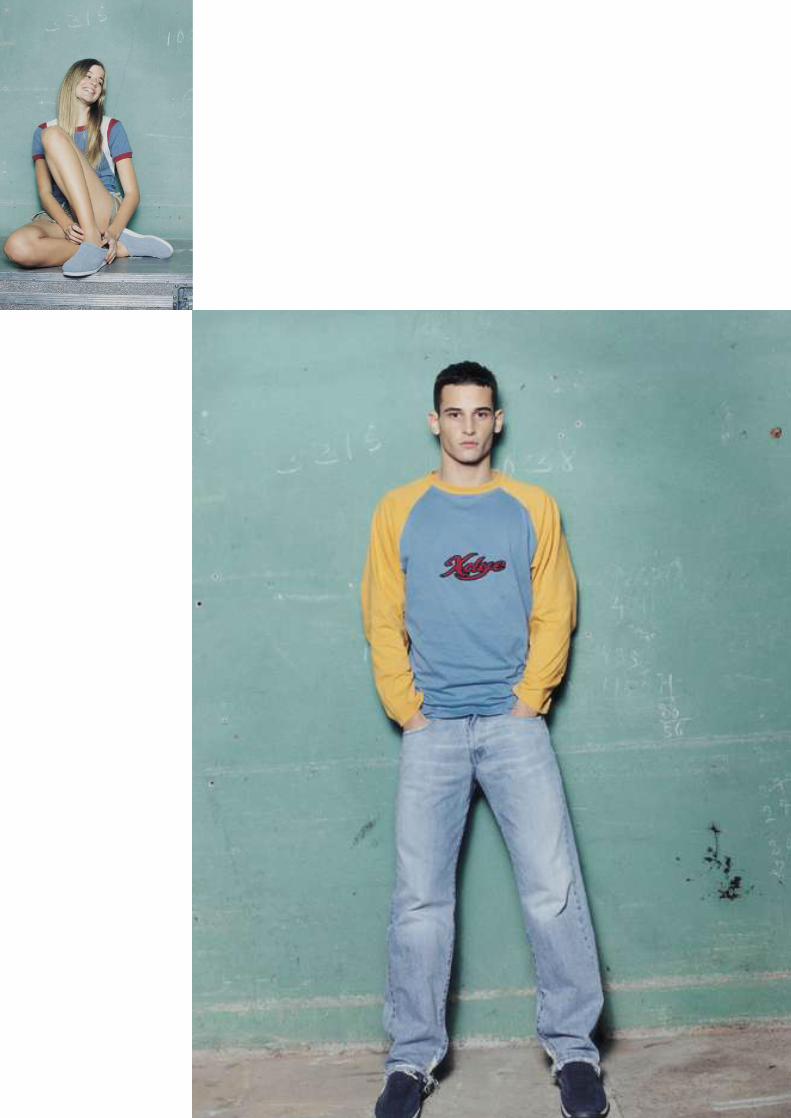
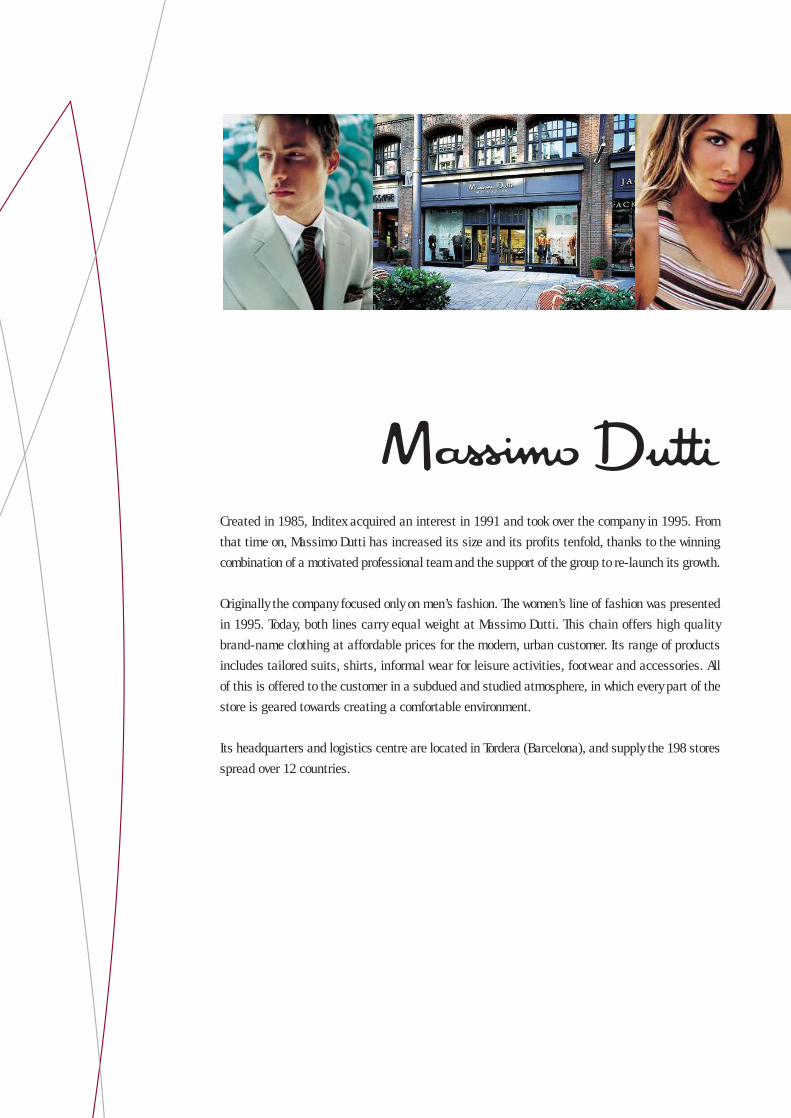
Created in 1985, Inditex acquired an interest in 1991 and took over the company in 1995. From
that time on, Massimo Dutti has increased its size and its profits tenfold, thanks to the winning
combination of a motivated professional team and the support of the group to re-launch its growth.
Originally the company focused only on men’s fashion. The women’s line of fashion was presented
in 1995. Today, both lines carry equal weight at Massimo Dutti. This chain offers high quality
brand-name clothing at affordable prices for the modern, urban customer. Its range of products
includes tailored suits, shirts, informal wear for leisure activities, footwear and accessories. All
of this is offered to the customer in a subdued and studied atmosphere, in which every part of the
store is geared towards creating a comfortable environment.
Its headquarters and logistics centre are located in Tordera (Barcelona), and supply the 198 stores
spread over 12 countries.

Founded in 1998 to meet the needs of the younger female customers, Bershka is the
most recent chain to be created by Inditex. In only three years it has become a symbol
in the sector, closing the last fiscal year with 104 stores in four countries.
The distinct trend of its clothing and a store image conceived with its customers
in mind has converted Bershka into an emblematic reference for young people
between the ages of 13 and 23.
The headquarters have been located in Tordera (Barcelona) since 1999. Here each
garment is painstakingly designed. This is also where the manufacturing process
of the suppliers is controlled in order to guarantee top quality and assure the articles
of clothing are in good condition for when they reach the store.
Like all the projects of the Group, Bershka has had a special focus on the international
market since its conception. Despite its considerable prospects for growth in Spain,
the company has already taken its first steps abroad, to the point that 20% of its
sales in stores are made outside Spain.

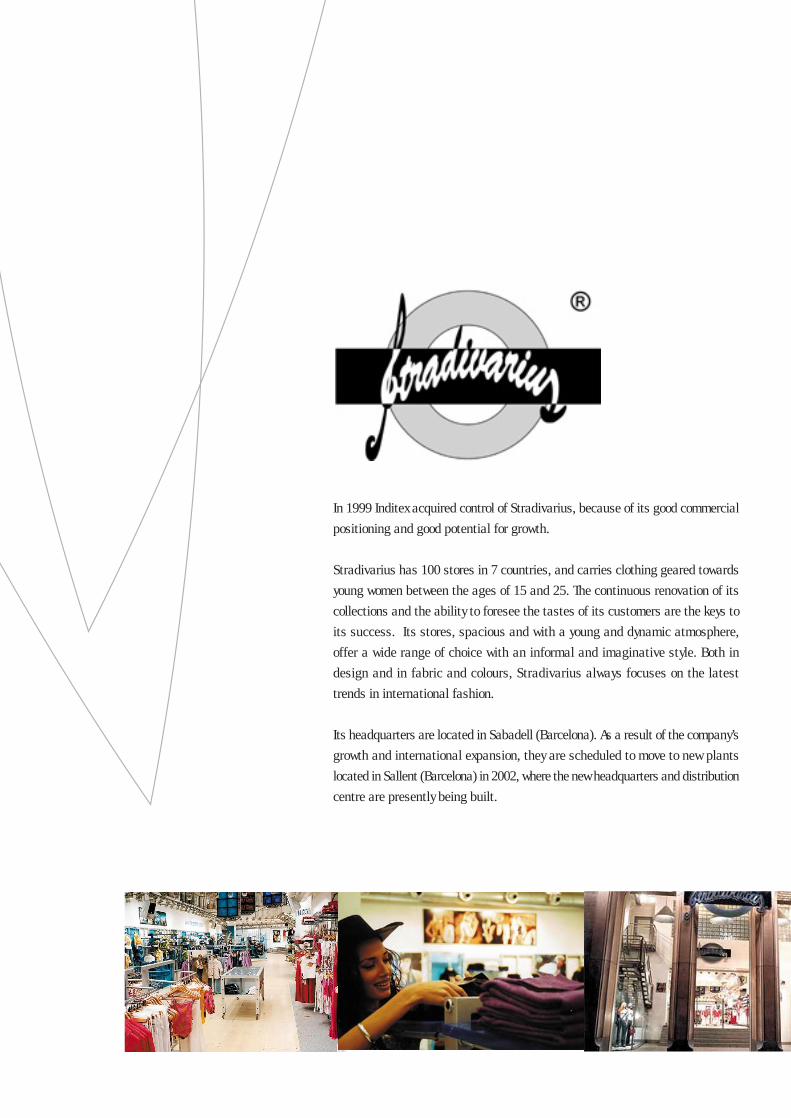
In 1999 Inditex acquired control of Stradivarius, because of its good commercial
positioning and good potential for growth.
Stradivarius has 100 stores in 7 countries, and carries clothing geared towards
young women between the ages of 15 and 25. The continuous renovation of its
collections and the ability to foresee the tastes of its customers are the keys to
its success. Its stores, spacious and with a young and dynamic atmosphere,
offer a wide range of choice with an informal and imaginative style. Both in
design and in fabric and colours, Stradivarius always focuses on the latest
trends in international fashion.
Its headquarters are located in Sabadell (Barcelona). As a result of the company’s
growth and international expansion, they are scheduled to move to new plants
located in Sallent (Barcelona) in 2002, where the new headquarters and distribution
centre are presently being built.

31

Business performance

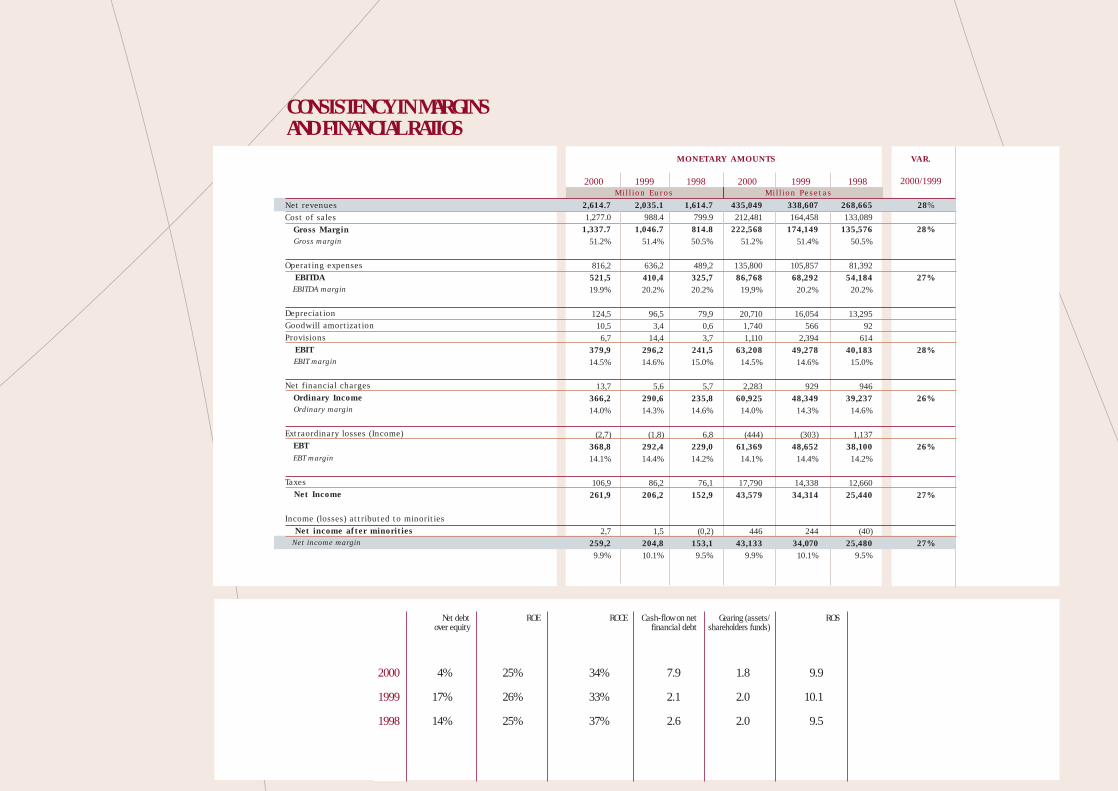
Consistent growth
Since 1998, Inditex has maintained average annual growth in net revenues
of 27%, which reached 28% in the last fiscal year. This growth was
spurred on by major international expansion: In 2000, foreign sales
accounted for 52% of the total. Five years earlier, they represented 30%.
The growth of the group is evidenced both by the result of its international
expansion – the opening of 20 new markets in the last three years - as
well as by the efficient management of the business, which registered
increased sales without taking into account the new stores opened.
With its favourable ranking in the market and the growth of its chains,
this group achieved a figure of over 90 million garments sold in 2000,
80% of which were manufactured in Europe, mostly at the group’s own
factories.

1998
1999
435,049
338,607
268,665
Sales (VAT excl.) in owned stores and franchises
Percentage of sales abroad
2000
1999
1998
Net revenues
433,693
332,834
253,818
52%
48%
46%
2000
Spain
Abroad
52%
48%Evolution of sales in stores in:
48%
52%
54%
46%
86,768
68,298
54,184
27%
27%
EBITDANet income after
minorities for the year
43,133
34,070
25,480
27%
30%
Net income before taxes
61,369
48,652
38,100
26%
27%
EBIT
63,208
49,278
40,183
28%
25%
2000
1999
1998
G.R:�����
C.A.G.R.�����
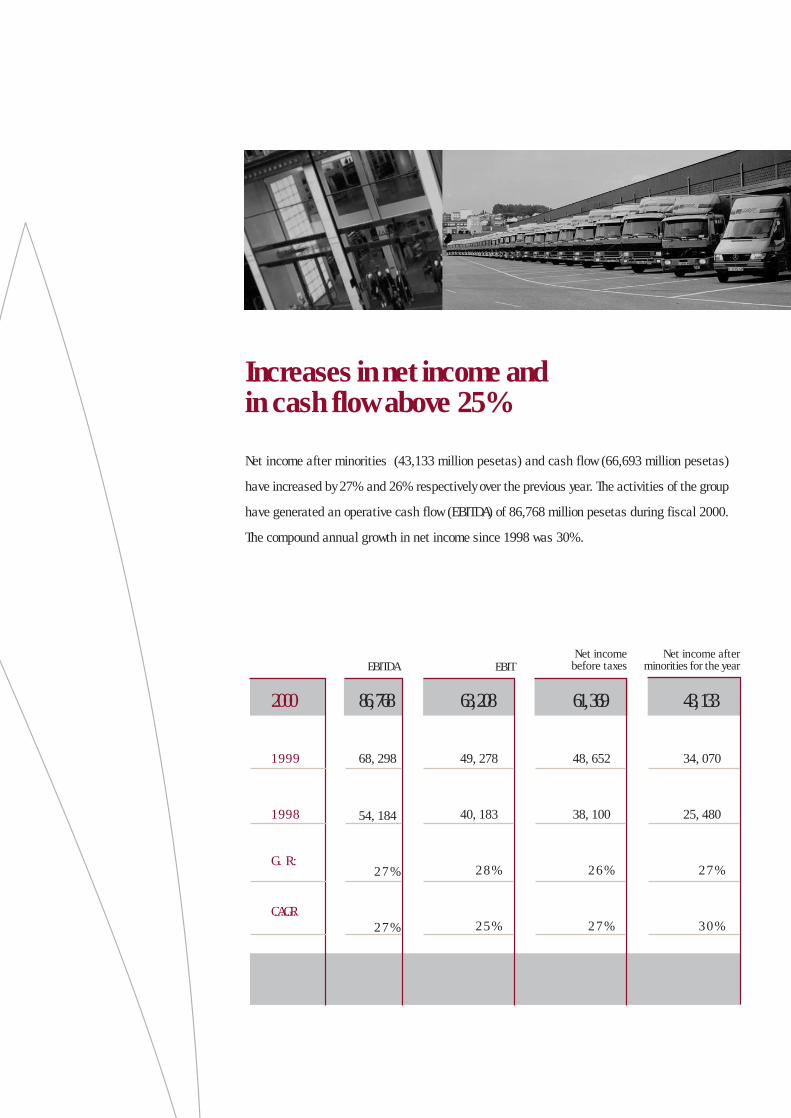
Increases in net income and in cash flow above 25%
Net income after minorities (43,133 million pesetas) and cash flow (66,693 million pesetas)
have increased by 27% and 26% respectively over the previous year. The activities of the group
have generated an operative cash flow (EBITDA) of 86,768 million pesetas during fiscal 2000.
The compound annual growth in net income since 1998 was 30%.

Net income after minorities
Cash flow
2000
1999
1998
43,133
34,070
25,480
2000
1999
1998
66,693
53,084
39,481
43,133
34,070
25,480
53,084
39,481
66,693

More than 200,000 million pesetas invested in the last five years
The continued growth of the results of the group has made it possible for the company to
achieve a volume of shareholder’s funds amounting to 194,822 million pesetas in 2000. This
figure represents an increase of 31% over the previous fiscal year, a percentage which is
equivalent to the average annual increase in the last few years.
The strong investment trend stands out as being the basis for the steady growth experienced
by the group. The overall investment figure during the last five fiscal years exceeded 200,000
million pesetas. In fiscal year 2000 investments exceeded 50,000 million pesetas, which has
made it possible for the group to open over 150 new stores as well as setting up new
distribution centres for the different chains and state-of-the-art production centres.

Shareholder’s funds
2000
1999
1998
194,822
148,613
112,040
194,822
148,613
112,040
Investments completed in 2000
New headquarters of the Inditex Group in Arteixo (A Coruña)
Headquarters in Tordera (Barcelona), where the central services and logistics facilities for
Massimo Dutti and Bershka are located
Indipunt production centre in Narón-Ferrol (A Coruña)
Investments in progress
Pull and Bear headquarters and distribution centre in Narón-Ferrol (A Coruña)
Stradivar ius headquarters and dist r ibut ion centre in Sal lent (Barcelona)
2000/19991999 1998
MONETARY AMOUNTS VAR.
2000
Net revenuesCost of sales Gross Margin Gross margin
Operat ing expenses EBITDA EBITDA margin
Depreciat ionGoodwil l amort izat ionProvis ions EBIT EBIT margin
Net f inancial charges Ordinary Income Ordinary margin
Extraordinary losses ( Income) EBT EBT margin
Taxes Net Income
Income ( losses) attr ibuted to minorit ies Net income after minorities Net income margin
435,049212,481
222,56851.2%
135,80086,768
19,9%
20,7101,7401,110
63,20814.5%
2,28360,925
14.0%
(444)61,369
14.1%
17,79043,579
44643,133
9.9%
338,607164,458
174,14951.4%
105,85768,292
20.2%
16,054566
2,39449,278
14.6%
92948,349
14.3%
(303)48,652
14.4%
14,33834,314
24434,07010.1%
268,665133,089
135,57650.5%
81,39254,184
20.2%
13,29592
61440,183
15.0%
94639,237
14.6%
1,13738,100
14.2%
12,66025,440
(40)25,480
9.5%
2,614.71,277.0
1,337.751.2%
816,2521,519.9%
124,510,56,7
379,914.5%
13,7366,214.0%
(2,7)368,814.1%
106,9261,9
2,7259,29.9%
2,035.1988.4
1,046.751.4%
636,2410,420.2%
96,53,4
14,4296,214.6%
5,6290,614.3%
(1,8)292,414.4%
86,2206,2
1,5204,810.1%
1,614.7799.9814.850.5%
489,2325,720.2%
79,90,63,7
241,515.0%
5,7235,814.6%
6,8229,014.2%
76,1152,9
(0,2)153,19.5%
1999 19982000M i l l i o n E u r o s M i l l i o n P e s e t a s
28%
28%
27%
28%
26%
26%
27%
27%
CONSISTENCY IN MARGINSAND FINANCIAL RATIOS
4%
17%
14%
2000
1999
1998
Net debtover equity
25%
26%
25%
ROE
34%
33%
37%
ROCE
7.9
2.1
2.6
Cash-flow on net financial debt
9.9
10.1
9.5
ROS
1.8
2.0
2.0
Gearing (assets/shareholders funds)

1,080 stores in 33 countriesAs of January 31, 2001, Inditex had 1,080 stores – 158 more
than the year before - in 33 countries. Over the course of
2000, the group has opened up 4 new markets: Austria,
Denmark, Andorra and Qatar.
In addition to entering these new markets, Inditex has
continued to strengthen its presence in other countries,
particularly those in which it has recently set up business.

2000
1999
1998
1,080
922
748
Number of stores
Stores in Spain
692
603
489
Stores abroad
388
319
259
1,080
922
748

24,000 professionals in three continents
The professionals who are part of the Inditex group play a key role in the growth and international
expansion of the group. It is this strong commitment from a team who is willing to meet the challenge
and is able to adapt quickly to an ever-changing environment which has made it possible for the group
to take on on new projects with the warranty of carrying them out successfully.
Inditex is a multinational company, made up of professionals from a wide variety of cultures. One of the
major efforts of the group consists of training the large number of people who join the group each year.
The integration of new technologies in all the areas of the group’s activity – design, manufacture, logistics,
customer service... - also requires a considerable investment in training. In fiscal year 2000, interactive
training systems were implemented based on the new technologies, internet, CD’s etc. As a whole, this
training effort is aimed at raising the quality and professionalism in all areas as well as to promote
independent and responsible management.

Corporate government

Board Of Directors
Chairman
Mr. Amancio Ortega Gaona
Deputy Chairman and C.E.O.
Mr. Jose María Castellano Ríos
Board Members
Mr. Carlos Espinosa de los Monteros
Mr. Francisco Luzón López
Mrs. Rosalía Mera Goyenechea
Mrs. Josefa Ortega Gaona
Mr. Juan Carlos Rodríguez Cebrián
Mr. Juan Manuel Urgoiti López de Ocaña
Secretary, non-member
Mr. Antonio Abril Abadín
Members of the committees Cha i rman of the Committee
Execut iveAudit ing and Compl iance
Remuneration and Nominat ion

Board of Directors
The Board of Directors of Inditex is the body responsible for the management, administration and supervision of the activity of this company, notwithstanding the powers pertaining to the General Meeting of Shareholders established in the articles of association or the Spanish law.
The General Meeting of Shareholders of Inditex held on July 20, 2000, resolved to restructure the composition of the Board of Directors by adjusting it to the Olivencia Code’s recommendations on good corporate governance. The objective of the adaptation of this company governing body was to balance the number of Domanial, Independent and Executive Directors, the latter represented on the Board, in addition to the chairman thereof, by the Chief Executive Officer and the Managing Director.
The current composition of Inditex’s Board of Directors is the following: Mr. Amancio Ortega Gaona, Chairman; Mr. José María Castellano, Deputy Chairman and Chief Executive Officer; and as Directors: ROSP CORUNNA, S.L., represented by Mrs. Rosalía Mera Goyenechea; Mrs. Josefa Ortega Gaona; Mr. Juan Carlos Rodríguez Cebrián (Inditex’s Managing Director); Mr. Carlos Espinosa de los Monteros; Mr. Francisco Luzón López and Mr. Juan Manuel Urgoiti López de Ocaña, the last three as Independent Directors, and Mr. Antonio Abril Abadín as Secretary (Non-Director).
The Board usually meets every three months and, on the President’s initiative, as many times as he may consider appropriate for the good functioning of the company.
Board Regulations
In its meeting held on July 20, 2000, Inditex’s Board of Directors approved its Organisation and Functioning Regulations (the Board Regulations).
The most relevant aspects of the Board Regulations, which came into effect on the date they were approved, ������������������
(a) Except for the issues exclusively reserved for the general meeting of shareholders, the Board of Directors is the highest decision-making body of the Company, as it is in charge of its administration and representation.
The policy of the Board of Directors is to delegate the management of the Company’s ordinary business operations to the executive bodies and the management team, except for those matters that according to the Spanish law or to the articles of the association are exclusively reserved for the knowledge of the Board of Directors and those that may be necessary for the responsible performance of its general supervisory function.

The Board of Directors will perform its functions under the principle of maximisation of the Company’s value, and will define and review the business and financial strategies of the Company in the light �������������������
(b) The Board of Directors will be composed of the Domanial Directors (those who are holders or representatives of holders of stable significant stakes in the Company’s share capital), Executive Directors (those who have management responsibilities within the Company) and Independent Directors (those professionals of recognised prestige who are not linked to the executive team or to the significant ��������������
Furthermore, it has been resolved that the Board of Directors, in the performance of its powers to make proposals to the General Meeting and to co-opt for the filling of vacancies, will endeavour to have the percentage of Independent Directors on the Board of Directors to be at least equivalent to the Company �����������������
(c) The Board Regulations regulate its structure and working procedure, the status of the board member, the relations of the Board of Directors with its shareholders, its institutional investors, the markets, �����������������
Board Committees
Inditex’s Board of Directors, in its meeting held on February 28, 1997, created the Executive Committee. The current composition of the Executive Committee was approved by the Board of Directors in its meeting held on July 20, 2000. On July 20, 2000, once the Board of Directors Regulations had been approved, the Audit and Compliance Committee and the Remuneration and Nomination Committee were formed.
Later, the Executive Committee, in its meeting held on October 27, 2000, approved the composition of the Audit and Compliance Committee and the Remuneration and Nomination Committee.
Composition of the Committees
Under the Board Regulations, the Executive Committee will be composed of a number of Directors consisting of between three and seven members, the Chairman of the Board of Directors acting as Chairman and the Secretary of the Board of Directors as Secretary, who may be assisted by the Assistant Secretary.

In addition, the Board Regulations establish that the Audit and Compliance Committee and the Remuneration and Nomination Committee will be composed of a number of Directors consisting of between three and five, the majority of its members being Independent Directors and its Chairman being an Independent Director.
In all the Committees, Mr. Antonio Abril Abadín, the Secretary of the Board of Directors, will act as Secretary.
Functions of the Committees
Executive Committee
On February 28, 1997, the Board of Directors delegated to the Executive Committee all the powers attributed to it, except for those non-delegable powers established in the Spanish law or in the articles of the association, and those that may be necessary for the responsible performance of the general supervisory function that is incumbent on the Board of Directors.
The Executive Committee will hold its sessions every month and, in any case, when called by its Chairman. The Executive Committee will inform the Board of Directors about the matters discussed and the decisions �����
Audit and Compliance Committee
Without prejudice to any other duty the Board of Directors may assign to it, the Audit and Compliance Committee has as its main functions:
(i) To propose the appointment of the Company’s auditors and serve as a communication channel between these and the Board of Directors.
(ii) To review the Company’s accounts and verify the suitability and integrity of internal control systems.
(iii) To review the periodical financial information the Board of Directors must provide to the markets and to its supervisory bodies.
To examine compliance of the different internal Regulations and codes approved by the Company and make the necessary proposals for their improvement.

The Audit and Compliance Committee will meet whenever it is called by its Chairman, who must do so whenever the Board of Directors or its Chairman requests the issuing of a report or the adoption of proposals, and whenever it is appropriate for the proper performance of its functions. In any case, it will meet once a year to review the information the Board of Directors must include in the annual public documentation.
Remuneration and Nomination Committee
Without prejudice to any other duty the Board of Directors may assign to it, the Remuneration and Nomination Committee has as its main functions:
(i) To inform about proposals for the appointment of Directors and Committee members, as well as those of senior management.
(ii) To inform about the systems and amount of remuneration of Directors and senior management.
(iii) To inform about transactions that may imply conflicts of interest and, in general, about matters related to Director’s duties.
The Remuneration and Nomination Committee will meet whenever it is called by its Chairman, who must do so whenever the Board of Directors or its Chairman requests the issuing of a report or the adoption of proposals, and whenever it is appropriate for the proper performance of its functions. In any case, it will meet once a year to prepare the information on Directors’ remuneration that the Board of Directors must include in the annual public documentation.

Management Team
Managing DirectorJuan Carlos R. Cebrián
Deputy Chairman and CEOJose María Castellano
ChairmanAmancio Ortega
Legal Department�����������������
General Counsel and Secretary�������������
Tax advisory����������
Finance and management control������������������
Capital markets������������
Corporate communications������������
Internet����������
Administration and SystemsFernando Aguiar
Human ResourcesJesús Vega
ZARA José Toledo
PULL&BEAR Pablo del Bado
MASSIMO DUTTI Jorge Pérez
BERSHKA Carlos Mato
STRADIVARIUS Jordi Triquell
OYSHOSergio Bucher
Business Units Business support areasCorporative Departments
Logistics�����������
Row MaterialJosé Mª Vandellós
Manufacturing plants����������
International����������������
Expansion�����������
Real Estate�����������������

Annual accounts 2000


7
9
11
39
Balance sheet
Profit and loss account
Consolidated report
Consolidated management report
Index


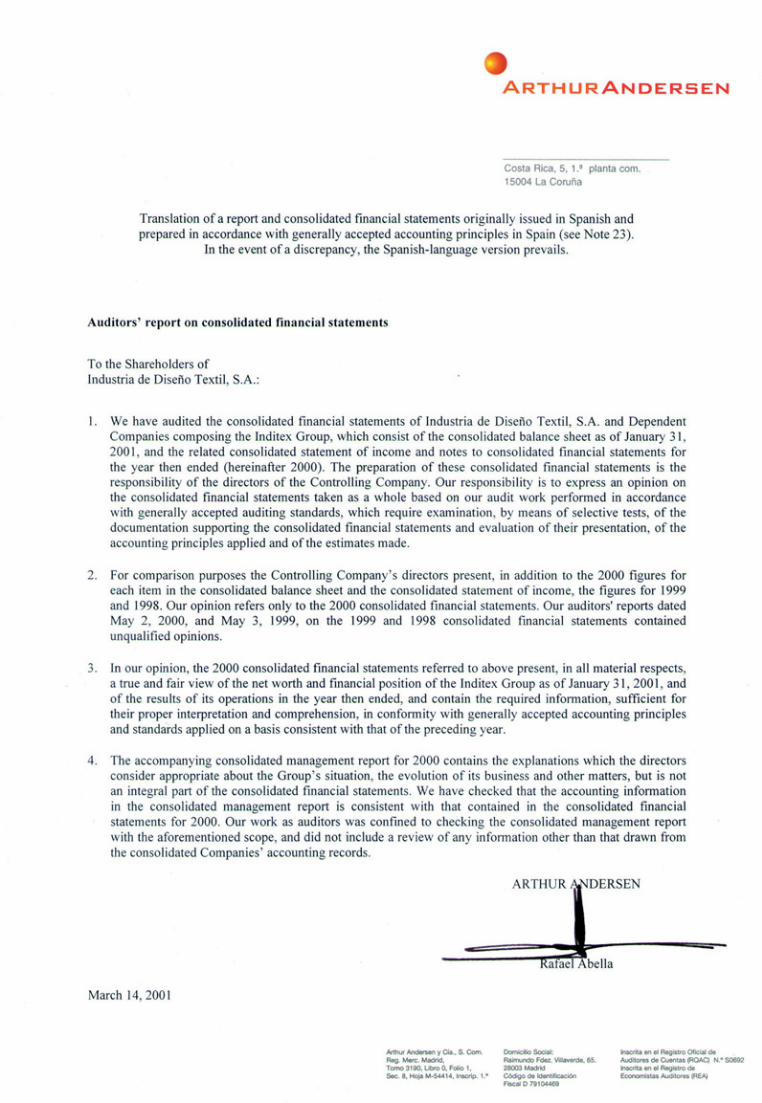
Auditors’ report and annual accounts


INDUSTRIA DE DISEÑO TEXTIL,S.A. AND DEPENDENT COMPANIES
CONSOLIDATED BALANCE SHEETS AS OF JANUARY 31, 2001, 2000 AND 1999
(CURRENCY - MILLIONS OF SPANISH PESETAS)
ASSETS Jan 31, 2001 Jan 31, 2000 (*) Jan 31, 1999 (*)
33550,46566,363
(15,890)(8)
174,02871,392
133,13316,64113,865
(61,003)0
6,8731,5082,0573,476(168)
524
232,225
14,827
3,740
40,77224,15511,81912,484
(148)14,12810,443
3,68519,793
1,034
99,882
350,674
7943,61657,045
(13,421)(8)
144,89357,961
106,86917,03414,867
(51,804)(34)
5,7001,347
8563,518
(21)180
194,468
16,325
4,006
31,35720,235
9,79010,591
(146)8,3215,5592,762
19,0441,225
80,182
294,981
8835,75146,949
(11,190)(8)
111,58750,33377,26412,52712,446
(40,589)(394)4,6581,509
5632,586
0180
152,264
194
3,089
26,23012,484
7,0015,795(312)
14,31012,494
1,81610,923
1,186
65,133
220,680
I. Start-up expenses (Note 5)II. Intangible assets (Note 6) Intangible assets and rights Accumulated amortization ProvisionsIII. Tangible fixed assets (Note 7) Land and structures Technical installations and machinery Other tangible fixed assets Advances and construction in progress Accumulated depreciation ProvisionsIV. Long-term financial investments (Note 8) Holdings in companies carried by the equity method Long-term investment securities Other loans ProvisionsV. Treasury Stock
Total Fixed and Non Current Assets
C) GOODWILL IN CONSOLIDATION (Note 9)
D) DEFERRED CHARGES (Note 10)
E) CURRENT ASSETS
II. Inventories (Note 11)III. Accounts receivable Customer receivables for sales and services Other accounts receivable ProvisionsIV. Short-term financial investments (Note 12) Short-term investment securities Other loansVI. CashVII. Accrual accounts
Total Current Assets
TOTAL ASSETS
B) FIXED AND OTHER NONCURRENT ASSETS
Translation of a report and financial statements originally issued in Spanish and prepared in accordance with generally accepted accounting priciples in Spain (see Note 23). In the event of a discrepancy, the Spanish - language version prevails.
The accompanying notes 1 to 23 and Exhibits I, II and III are an integral part of the consolidated balance sheet as of January 31, 2001.(*) Presented solely for comparison purposes

SHAREHOLDERS’EQUITY - SHAREHOLDER’S EQUITY AND LIABILITIES
15,5573,391
28279,87076,240
3,63046,860
1215,8085,808
43,13343,579
(446)(200)
194,822
1,876
341
3,537
27,54311,025
38,568
16,118304
53,73341,359
16
111,530
350,674
15,4000
28248,24044,980
3,26045,279
265,3165,316
34,07034,314
(244)0
148,613
2,344
311
3,503
34,57513,834
48,409
19,357241
45,94126,252
10
91,801
294,981
15,4000
28235,63332,373
3,26033,815
1081,3221,322
25,48025,440
400
112,040
1,247
332
2,088
28,0502,939
30,989
14,698226
35,87023,177
13
73,984
220,680
INDUSTRIA DE DISEÑO TEXTIL,S.A. AND DEPENDENT COMPANIES
CONSOLIDATED BALANCE SHEETS AS OF JANUARY 31, 2001, 2000 AND 1999
(CURRENCY - MILLIONS OF SPANISH PESETAS)
Jan 31, 2001 Jan 31, 2000 (*) Jan 31, 1999 (*)
I. CapitalII. Additional paid-in capitalIII. Revaluation reserveIV. Other reserves of the Controlling Company Unrestricted reserves Restricted reservesV. Reserves at com. cons. by the global or prop. integ. methodVI. Reserves at companies carried by the equity methodVII. Translation differences Companies consolidated by the global integration methodVIII. Income attributable to the Controlling Company Consolidated income for the year (Income) loss attributed to minority interestsIX. Interim dividend paid in the year
Total shareholders´ equity
B) MINORITY INTERESTS (Note 15)
D) DEFERRED REVENUES (Note 16)
E) PROVISIONS FOR CONTINGENCIES AND EXPENSES (Note 17)
F) LONG-TERM DEBT
II. Payable to credit entities (Note 18)III. Other accounts payable (Note 19)
Total long-term debt
G) CURRENT LIABILITIES
II. Payable to credit entities (Note 18)III. Payable to companies carried by the equity method (Note 13)IV. Trade accounts payableV. Other nontrade payables (Note 19)VII. Accrual accounts
Total current liabilities
TOTAL SHAREHOLDERS´ EQUITY AND LIABILITIES
A) SHAREHOLDERS’EQUITY (note 14)
The accompanying notes 1 to 23 and Exhibits I, II and III are an integral part of the consolidated balance sheet as of January 31, 2001.(*) Presented solely for comparison purposes

INDUSTRIA DE DISEÑO TEXTIL,S.A. AND DEPENDENT COMPANIES
CONSOLIDATED STATEMENTS OF INCOME FOR THE YEARS ENDEDJANUARY 31, 2001, 2000 AND 1999
(CURRENCY - MILLIONS OF SPANISH PESETAS)
DEBIT
A) EXPENSES
215,23168,45054,32614,12420,710
98567,810
64,948
3,6604,099
0
01,740
60,925
1371,4135,064
596
444
61,369
16,888902
43,579
446
43,133
164,91053,01141,38811,62316,054
2,48952,990
49,844
2,7151,025
0
0566
48,349
(11)644677
92
303
48,652
13,586752
34,314
244
34,070
141,43242,02132,997
9,02413,295
73839,376
40,275
2,152895
0
792
39,237
1161,194
229171
0
38,100
12,179481
25,440
0
25,480
Jan 31, 2001 Jan 31, 2000 (*) Jan 31, 1999 (*)
The accompanying notes 1 to 23 and Exhibits I, II and III are an integral part of the consolidated statements of income as of January 31, 2001.(*) Presented solely for comparison purposes
Purchases Personnel expenses a) Wages, salaries, etc. b) Employee welfare expenses (Note 21)Period depreciation and amortizationVariation in operating provisions (Note 2.e)Other operating expenses
I. OPERATING INCOME
Financial and similar expensesExchange losses
II. FINANCIAL INCOME
Share in losses of companies carried by the equity����������Amortization of goodwill in consolidation (Note 9)
III. INCOME FROM ORDINARY ACTIVITIES
Variation in intangible asset and tangible fixed asset provisionsLosses on fixed assetsExtraordinary expenses (Notes 2.e and 21)Prior years' expenses and losses
IV. EXTRAORDINARY INCOME (Note 21)
V. CONSOLIDATED INCOME BEFORE TAXES
Corporate income tax (Note 20)Other taxes (Note 20)
VI. CONSOLIDATED INCOME FOR THE YEAR
Income attributed to minority interests
VII. INCOME FOR THE YEAR ATTRIBUTED TO THE CONTROLLING COMPANY

INDUSTRIA DE DISEÑO TEXTIL,S.A. AND DEPENDENT COMPANIES
CONSOLIDATED STATEMENTS OF INCOME FOR THE YEARS ENDEDJANUARY 31, 2001, 2000 AND 1999
(CURRENCY - MILLIONS OF SPANISH PESETAS)
CREDIT
B) REVENUES
435,049
2,750335
0
271,6003,806
2,326
43
0
6,6787
757212
0
0
338,607
452239
0
421,1131,560
1,025
96
0
6326
98087
0
0
268,665
8,343129
0
131,038
998
998
59
0
17921
253120
1,137
40
Jan 31, 2001 Jan 31, 2000 (*) Jan 31, 1999 (*)
The accompanying notes 1 to 23 and Exhibits I, II and III are an integral part of the consolidated statements of income as of January 31, 2001.(*) Presented solely for comparison purposes
Net revenues (Note 21)Increase in finished product and work-in-process inventoriesOther operating revenues
I. OPERATING LOSS
Income from shareholdingsOther financial revenuesExchange gains
II. FINANCIAL LOSS
Share in income of companies carried by the equity method (Note 8)
III. LOSS ON ORDINARY ACTIVITIES
Gains on fixed asset disposals Capital subsidies transferred to income for the yearExtraordinary revenues and incomePrior years' revenues and income
IV. EXTRAORDINARY LOSS
Loss atributed to minority interests
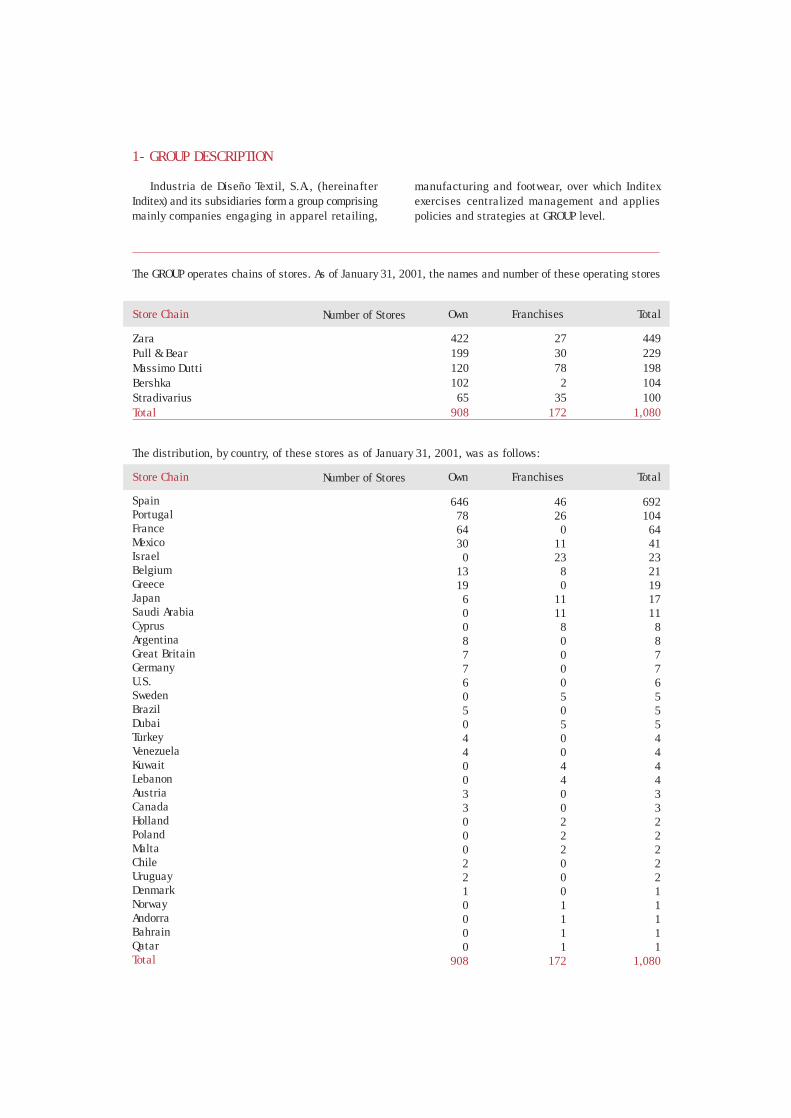
1- GROUP DESCRIPTION
Store Chain Own Franchises Total
manufacturing and footwear, over which Inditex exercises central ized management and appl ies policies and strategies at GROUP level.
ZaraPull & BearMassimo DuttiBershkaStradivariusTotal
Number of Stores
422199120102
65908
273078
235
172
449229198104100
1,080
The distribution, by country, of these stores as of January 31, 2001, was as follows:
646786430
01319
60087760504400330002210000
908
4626
01123
80
1111
800005050044002220001111
172
692104
64412321191711
887765554444332222211111
1,080
Industria de Diseño Texti l , S.A. , (hereinafter Inditex) and its subsidiaries form a group comprising mainly companies engaging in apparel retailing,
The GROUP operates chains of stores. As of January 31, 2001, the names and number of these operating stores ����������������
Store Chain Own Franchises TotalNumber of Stores
SpainPortugalFranceMexicoIsraelBelgiumGreeceJapanSaudi ArabiaCyprusArgentinaGreat BritainGermanyU.S.SwedenBrazilDubaiTurkeyVenezuelaKuwaitLebanonAustriaCanadaHollandPolandMaltaChileUruguayDenmarkNorwayAndorraBahrainQatarTotal

2 - BASIS OF PRESENTATION OF THE CONSOLIDATED FINANCIAL STATEMENTS AND CONSOLIDATION PRINCIPLES
The individual financial statements of Inditex as o f January 31 , 2001, were p repared by i ts D i rec to rs in a document separate f rom these consolidated financial statements, which will also be deposited with the Mercant i le Register of A Coruña (Spain) once they have been approved by the Company's Shareholders' Meeting.
b) Accounting policies.
The consol idated f inancial statements as of January 31, 2001, were prepared by applying the accounting principles and methods summarized in Note 4. All obligatory accounting principles with an ef fect on the GROUP’s net wor th , f inancia l position and results of operations were applied in �� � � � � � � � � � � � � �
c) Consolidation principles.
The accompany ing conso l idated f inanc ia l statements were prepared f rom the account ing r e c o r d s o f I N D I T E X a n d i t s s u b s i d i a r i e s i n accordance with the Spanish National Chart of Accounts and consolidation regulations.
The consolidation was carried out as fol lows:
- The companies over which effect ive control is e x e r c i s e d w e r e c o n s o l i d a t e d b y t h e g l o b a l �� � � � � � � � � � � � � � � � � �
- The multigroup companies which are managed jointly with third parties were consolidated by the proportional integration method.
The companies in which there is s ignif icant influence but not ownership of a majority of the vo t ing r ights o r j o in t management w i th th i rd parties are carried by the equity method.
The equity of minority interests in the net worth and resu l ts o f operat ions o f the conso l idated dependent companies i s p resented under the "Minority Interests" and "(Income) Loss Attributed to Minority Interests" captions in the consolidated ba lance sheet and conso l idated s ta tement o f income, respectively.
The GROUP offers its customers, at the stores of a l l i ts chains of s tores located in Spain , the “Affinity” charge card, managed by a third-party finance entity, which assumes the risk of payment default.
The consolidated dependent, associated and multigroup companies in which Inditex has direct and indirect holdings are disclosed in Exhibit III .
a) True and fair view.
The accompany ing conso l idated f inanc ia l
statements as of January 31, 2001, which were
prepared from the accounting records of Industria
de D i seño Te x t i l , S . A . and o f t he dependen t
companies composing the INDITEX GROUP, are
presented in accordance with the Spanish National
Chart of Accounts and, accordingly, they give a
t rue and fa i r v i ew o f the G roup ’s ne t wo r th ,
financial position and results of operations.
The ind iv idual and conso l idated f inanc ia l
statements as of January 31, 2000, of Industria
de Diseño Texti l , S.A. and of the INDITEX GROUP,
r e s p e c t i v e l y , a n d t h e i n d i v i d u a l f i n a n c i a l
statements as of January 31, 2000, of each of the
consolidated dependent and associated companies
were approved by their respective Shareholders'
Meetings within the legally stipulated periods; the
f inancial statements as of January 31, 2001, of
each of the consolidated companies, which were
p r e p a r e d b y t h e D i r e c t o r s o f t h e r e s p e c t i v e
Companies, will be submitted for approval by their
r espec t i ve Shareho lde rs ' Mee t ings , and i t i s
considered that they will be approved without any
�� � � � � � �
The consolidated f inancial statements of the
INDITEX GROUP will be submitted for approval by
the Shareholders' Meeting of Inditex, and are also
expected to be approved without any changes.

All material accounts receivable and payable, transactions and profits between the companies consolidated by the global integration method were eliminated in consolidation.
The accounts receivable and payable, revenues, expenses and income from operations with other GROUP companies of those consol idated by the proportional integration method were el iminated in consol idat ion in proport ion to the ownership interest of Inditex in them.
In the case of subsidiaries whose accounting and valuation methods differed from those of the Controlling Company, where the effect thereof was material adjustments were made so as to present the consolidated financial statements on a uniform ��� � � �
In accordance with standard practice in Spain, these consol idated f inancial statements do not include the tax effect of including the reserves of dependent companies abroad in the accounting records of the Parent Company, where applicable, since it is considered that reserves not taxed at source wi l l not be t ransferred and because the c o n s o l i d a t i o n p r o c e s s d o e s n o t i n v o l v e t h e distr ibution of reserves, since they are going to continue to be used as a source of self-financing by each of the consolidated companies.
d) Currency.
All the amounts in these consolidated financial statements are expressed in mil l ions of Spanish �� � � �
The year ended January 31, 2000, wil l hence-forward be referred to as “1999”, the year ended January 31, 2001, wil l be referred to as “2000”, �� � � � � � � � �
e) Comparative information.
The 1998 and 1999 consolidated statements, which were prepared by the Directors, included the caption “Capital ized Expenses of Work on Fixed Assets”, amount ing to Ptas. 9 ,456 mi l l ion and Ptas. 16,869 mill ion, respectively, which are not inc luded in the accompany ing 1998 and 1999 consolidated statements of income because these a m o u n t s h a v e b e e n e l i m i n a t e d a g a i n s t t h e expenses which generated them.
The “Extraordinary Expenses” caption in the 1998 and 1999 consolidated statements of income, which were prepared by the Directors, included P t a s . 6 1 4 m i l l i o n a n d P t a s . 2 , 3 9 4 m i l l i o n , r e spec t i v e l y, wh i ch we r e r e c l ass i f i ed t o t he “ Va r i a t i o n i n P r o v i s i o n s ” c a p t i o n i n t h e a c c o m p a n y i n g 1 9 9 8 a n d 1 9 9 9 c o n s o l i d a t e d statements of income.
Both these rec lassi f icat ions of pr ior years ’ accounts were made in order to give a truer and fairer view of results and to present these accounts using the same methods as in 2000.
Scope of consolidation.
The following companies, all of which were formed by the GROUP, were included in the consolidated Group in 2000:
Bershka Mexico, S.A. de CV Bershka Venezuela, S.A. Stradivarius Hellas, S.A. Stradivarius Portugal, Conf. Lda. Massimo Dutti Deutschland, GmbH SCI Vastgoed Nancy
In 2000 the following companies were excluded from the scope of consolidation: Arrojo, S.A. and Motorgal, S.A., due to their scant significance for the GROUP and DBJ Portugal Conf. Lda., which was in the process of l iquidation.
In 2000 Pígaro 2100, S.A., changed its corporate n a m e t o S t r a d i v a r i u s E s p a ñ a , S . A . a n d Confecciones Noite, S.A. changed its name to Oysho �� � � � � � � � � � �
The dependent company Zara Deutschland, GmhB, wh ich was conso l idated by the g loba l in tegrat ion method in the p rev ious year, was consolidated by the proportional integration method in 2000, s ince the Parent Company’s ef fect ive holding in this company fell from 51% in 1999 to 50% in 2000 (see Note 15).
These changes did not give rise to any significant n e t w o r t h c h a n g e s i n t h e a c c o m p a n y i n g consolidated financial statements.

two amoun ts , wh i ch r ep r esen t s t he i n t e r es t expenses on the t ransact ion , is recorded as a deferred expense and is allocated to income each year by the interest method.
Exceptionally, certain consolidated companies revalued their leased assets pursuant to Royal Decree-Law 7/1996 (see Notes 6 and 14).
The r ights recorded as intangible assets are amortized over the useful life of the related asset, as explained in section c) below. The value of the recorded r ights and thei r re lated accumulated amortization are retired from these accounts and included in tangible fixed assets when the purchase option is exercised.
- Leasehold assignment rights: these are recorded at the amounts paid for their acquisition and are amortized on a straight-line basis over ten years, unless the contract term is shorter. Also included under this caption are the leasehold assignment r ights paid by the GROUP companies located in France, which are legally protected under French leg is la t ion and are , there fo re , o f a perpetua l na tu re ; thus the accompany ing conso l ida ted statement of income as of January 31, 2001, does not include any depreciation of these rights.
Also included under this caption are the access fees: These amounts are general ly al located to income on a straight-l ine basis over the term of the related contracts.
c) Tangible fixed assets.
The tangible fixed assets of certain consolidated companies are carried at cost revalued pursuant to the applicable enabling legislation, including Royal Decree-Law 7/1997 (see Notes 7 and 14). The tangible fixed assets of the other companies are stated at cost, which includes the additional expenses incur red unt i l the assets come in to operating condition, excluding financial expenses. I n e x c e p t i o n a l c i r c u m s t a n c e s , p r o v i d e d t h e requirements stipulated by accounting legislation current ly in force are compl ied with , f inancial expenses incurred prior to the entry into service of the asset are capitalized.
3 - DISTRIBUTION OF THE INCOME OF THE CONTROLLING COMPANY
The Company’s Directors propose that Ptas. 1,200 mi l l i on o f the 2000 net income o f the Parent Company be allocated to dividends, of which 200 were paid as an interim dividend in 2000, Ptas. 28 ,189 mi l l i on to vo lunta r y r ese rves and the remaining Ptas. 31 mil l ion to the legal reserve.
4 - VALUATION STANDARDS
The main valuation methods applied in preparing the financial statements of the consolidated GROUP as of January 31, 2001, in accordance with the Span ish Nat iona l Char t o f Accounts , were as �� � � � � � �
a) Start-up expenses.
Start-up expenses are valued at cost and are presented net of amortization, which is generally taken on a straight-line basis over five years.
b) Intangible assets.
Th is ba lance o f th is asset capt ion in the accompanying consolidated balance sheet includes �� � � � � � � � � � � � � � � � � � �
- Intellectual property: this account is charged for the amounts paid to acquire tit le to, or the right to use, such items, or for the expenses incurred in registering the proprietary rights developed by the Company, which are amortized on a straight-line basis over five years.
- Computer software: this is valued at cost and amortized on a straight-line basis over five years.
- Rights on leased assets : the f inancia l lease contracts of al l the consolidated companies are recorded as intangible assets at the cash value of the asset, and the total debt for lease payments p lus the amount o f the pu rchase op t i on a re recorded as a liability. The difference between the

The cos ts o f e xpans ion , modern i za t i on o r i m p r o v e m e n t s l e a d i n g t o a n i n c r e a s e i n p r o d u c t i v i t y , c a p a c i t y o r e f f i c i e n c y o r t o a lengthening of the useful l i fe of the assets are �� � � � � � � � � � �
Period upkeep and maintenance expenses are expensed currently.
Tangible f ixed assets are depreciated by the straight-line method at annual rates based on the following years of estimated useful l ife:
Description Years of Estimated Useful Life
Structures Technical installations Machinery Tools Furniture Computer hardware Transport equipment Other tangible fixed assets
The surpluses or increases in value resulting f rom revaluat ions are depreciated over the tax pe r i ods in the r ema in ing use fu l l i ves o f the �� � � � � � � � � � � � � � �
d) Marketable securities and other similar financial � � � � � � � � � � � �
M a r k e t a b l e s e c u r i t y i n v e s t m e n t s n o t c o n s o l i d a t e d b y t h e g l o b a l o r p r o p o r t i o n a l integrat ion method (see Exhib i t I I I ) but which represent holdings of more than 20% are carried by the equity method, i .e. at the underlying book va lue o f the ho ld ing pe r the la tes t ava i lab le balance sheet of the investee.
Marketable securities representing holdings of less than 20% or not included in consolidation are valued at the lower of cost or underlying book value per the la test ava i lab le ba lance sheet o f the investee th rough the record ing o f the re la ted �� � � � � � � � � �
The unrealized gains disclosed at the time of the acquisit ion and st i l l exist ing at the date of subsequent valuation are taken into account in calculating the underlying book value.
Short and long-term nontrade loans are recorded at the amount delivered. The difference between this amount and the loan principal is recorded in the "Deferred Revenues" account, with a balancing entry under the related fixed or current asset cap-tion on the asset side of the consolidated balance sheet . Interest revenues are calculated by the interest method in the year in which they accrue.
e) Shares of the Controlling Company.
These relate in full to shares acquired by the Parent Company (INDITEX) and are stated at the lower of cost , represented by the total amount paid for acquis i t ion p lus the expenses inherent to the transaction, or the related underlying book value adjusted by the amount of the unreal ized gains disclosed at the time of the acquisition and stil l existing at the date of subsequent valuation.
f) Goodwill in consolidation.
This caption in the accompanying consolidated balance sheet reflects the unamortized differences in consol idation arising from the acquisit ion of dependent companies consolidated or carried by the equ i t y method , as appropr ia te , which are expected to be recove red th rough the income reported by these investees in the future.
The general cr i ter ion is to depreciate these differences systematically over a ten year period, term foreseen by the Management of the GROUP during which said goodwill shall contribute to the earning of profits (see Note 9).
g) Translation of the financial statements of foreign consolidated companies.
The assets and l iab i l i t ies in the f inancia l statements of the foreign consolidated companies were t ranslated to Ptas. at the exchange rates ru l ing a t year-end . The equ i t y accounts were
25 to 508 to 138 to 10
4 to 87 to 10
4 to 83 to 8
4 to 10

translated at historical exchange rates, and income statement i tems at the average 2000 exchange ��� � � �
The balance sheet and income statement items of companies located in high-inflation countries (ma in l y Mex i c o , Tu r ke y and Vene zue la ) we r e adjusted, before being translated to Ptas., by the effect of changes in pr ices, in accordance with the regulations established for this purpose in the �� � � � � � � � � � � � � � � � � � �
The exchange gains or losses ar is ing f rom appl icat ion of the aforement ioned method are r e f l e c t e d u n d e r t h e " S h a r e h o l d e r s ’ E q u i t y - T r a n s l a t i o n D i f f e r e n c e s " c a p t i o n i n t h e accompanying consol idated balance sheet (see �� � � � � � � �
h) Deferred charges.
The balance of this caption in the accompanying consolidated balance sheet comprises the following ��� � � �
- Differences between the face value of debts and the amount received, which are charged to income by the interest method.
- F i xed asset acquis i t ion expenses , which are recorded by the amounts incurred and allocated to income on a straight-line basis over ten years.
i) Inventories.
Inventories are valued at acquisit ion price or p r o d u c t i o n c o s t ( m a t e r i a l s , l a b o r a n d manufacturing expenses). If the market value is lower than the acquisition price or production cost and the diminution in value is considered to be r eve rs ib le , the ca r r y ing va lue i s ad jus ted by recording the related allowance. The market value is determined as follows:
- Commerc ia l invento r i es , raw mate r ia ls and s u p p l i e s : l o w e r o f r e p l a c e m e n t c o s t o r n e t �� � � � � � � � � � � � � � � �- Finished products: realizable value, net of the related marketing expenses.
- Work- in-process and semif in ished products :
realizable value of the related finished products,
net of total unincurred manufacturing costs and
��� � � � � � � � � � � � � � � � �
The method for calculating the acquisition price
varies depending on the type of goods. Basically,
the “first in-first out” (FIFO) method is used for
fabrics and other textile supplies.
Obsolete, defective and slow-moving inventories
have been reduced to realizable value.
j) Provisions for contingencies and expenses.
The INDITEX GROUP records provisions for the
estimated amount required for probable or certain
th i rd-par ty l iab i l i t y a r is ing f rom l i t igat ion in
progress or from outstanding indemnity payments
o r o b l i g a t i o n s o f u n d e t e r m i n e d a m o u n t , f o r
collateral and other similar guarantees provided
by the Group, and for other contingencies of any
other k ind that might ar ise as a resul t o f the
Group’s activities. These provisions are recorded
when the contingency or obligation giving rise to
the indemnity or payment arises (see Note 17).
Under the appl icable col lect ive labor agree-
ments, certain GROUP companies are required to
make retirement bonus payments. This obligation
is generally recorded as an expense when the rela-
ted payments are made, since it is considered that
the possible liability in this connection would not
be material with respect to the f inancial state-
ments taken as a whole.
k) Debts.
Debts are recorded at face va lue and the
difference between the face value and the amount
rece ived is recorded on the asset s ide o f the
balance sheet as deferred charges and charged to
period income on an accrual basis by the interest
�� � � � � �

In the accompanying consolidated balance sheet and in accordance with the Spanish National Chart of Accounts, debts maturing in less than 12 months are c lass i f ied as cur rent l iab i l i t ies and those maturing at over 12 months as long-term debt.
l) Capital subsidies.
Nonrefundable capital subsidies are recorded under the “Defer red Revenues” capt ion on the l iabi l i ty s ide of the accompanying consol idated balance sheet at the amount granted and are allocated to income on a straight-line basis over the years of estimated useful life of the subsidized �� � � � � �
m) Foreign currency transactions.
Foreign currency on hand and receivables and payables denominated in foreign currencies are translated to Ptas. at the exchange rates rul ing at the transaction date, and are adjusted at year-end to the exchange rates then prevailing.
Exchange differences on the foreign currency held by the Companies are charged or credited, as appropriate, to income for the year.
Exchange differences arising on adjustment of foreign currency payables and receivables to year-end exchange rates are classified by due date and currency. For this purpose, the currencies which, although different, are officially convertible and pe r f o rm s imi la r l y i n the marke t a re g rouped together.
The positive net differences in each group are recorded under the "Deferred Revenues" caption on the l iabil ity side of the consolidated balance sheet, unless exchange losses in a given group have been charged to income in pr ior years, in which case the posit ive differences are credited to period income up to the limit of the net negative differences charged to income in prior years.
The negat ive di f ferences in each group are �� � � � � � � � � � � � � � � � �
The positive differences deferred in prior years are credited to income in the year in which the related accounts receivable and payable fall due, or as negative exchange differences for the same o r a h i g h e r a m o u n t a r e r e c o g n i z e d i n e a c h ��� � � � � � � � � � � � � � � �
n) Recognition of revenues and expenses.
Revenues and expenses are recognized on an accrual basis , i .e . when the actual f low of the related goods and services occurs, regardless of when the resul t ing monetary o r f inancia l f low ��� � � � �
However, in accordance with the accounting principle of prudence, the companies only record realized income at year-end, whereas foreseeable cont ingenc ies and l osses , inc lud ing poss ib le losses, are recorded as soon as they become known.
ñ) Corporate income tax.
The expense for corporate income tax of each year is calculated on the basis of the book income before taxes of each company in the INDITEX GROUP, increased or decreased, as appropr iate , by the permanent differences from taxable income.
Tax relief and tax credits taken in the year are treated as a reduction in the corporate income tax expense for that year.
o) Hedges.
The GROUP arranges f inancial t ransact ions (bas ica l l y e xchange ra te hedges and f o re ign currency options and forward contracts) to hedge a por t i on o f i t s fo re ign cur rency impor ts and exports. Since these hedging transactions are not of a speculative nature, the gains or losses thereon are recorded on sett lement of the transactions.
The theoretical close of these transactions as of January 31, 2001, did not disclose any losses that had to be recorded in the GROUP’s accounting records.

5 - START-UP EXPENSES
Balance at 02/01/00 Additions Transfers
Incorporation expensesPre-opening expensesCapital increase expensesTotal
Writedowns Balance at 01/31/01
1661
279
0312
55367
189
090
5146
50201
12316
7335
6 - INTANGIBLE ASSETS
Intangible Assets Reductions
Intellectual propertyComputer softwareLeasehold assignment rightsRights on leased assetsAdvances and other intangible assetsTotal
Transfers
1,434371
30,77524,314
15157,045
561116
9,902475352
11,406
171
82700
845
287
(577)(755)
0(1,243)
1,980573
39,27324,034
50366,363
Accumulated Amortization Reductions
Intellectual propertyComputer softwareLeasehold assignment rightsRights on leased assetsTotal
Transfers
797233
8,7673,624
13,421
245110
1,8171,1073,279
016
4430
459
255
(66)(342)(351)
1,044382
10,0754,389
15,890
The variations in 2000 in the accounts composing this caption in the accompanying consolidated balance sheet were as follows:
The detail of the balance of the “Intangible Assets” caption in the accompanying consolidated balance sheet and of the variations therein in 2000 is as follows:
Balance at 02/01/00 Additions Balance at 01/31/01
Balance at 02/01/00 Additions Balance at 01/31/01
The additions relate to the investments made in the year.
The “Transfers” column includes addit ions relating mainly to translation differences at foreign dependent companies, and reduct ions re lat ing mainly to lease contracts which expired during the year and were transferred to tangible fixed assets.
Certain GROUP companies revalued their leased assets pursuant to Royal Decree-Law 7/1996. The revaluation surplus amounted to Ptas. 843 million a n d i n c r e a s e d t h e 2 0 0 0 i n t a n g i b l e a s s e t amor t i zat ion charge by P tas . 11 mi l l i on . The reva luat ion is expected to increase the 2001 intangible asset amortization charge by Ptas. 14
million. The net accumulated surpluses as of January 31, 2001, ar is ing f rom the revaluat ions made pursuant to Royal Decree-Law 7/1996, taking into account the retirements and transfers made in 2000 and prior years, amounted to Ptas. 713 mil l ion.
The details of the lease contracts in force at 2000 year-end, re lat ing mainly to commerc ia l premises, are as follows:
Total cost of assets Prior years’ lease payments 2000 lease payments Outstanding lease payments Purchase option
24,03411,121
3,39512,648
1,670
Start-up Expenses

7 - TANGIBLE FIXED ASSETS
Tangible Fixed Assets Additions Transfers
Land and structuresTechnical installations and MachineryFurnitureComputer hardwareOther tangible fixed assetsAdvances and construction in progressTotal
Reductions
57,961106,869
10,0283,1233,883
14,867196,731
8,59827,041
3,458895
3,8719,565
53,428
6,0797,255
(1,422)(43)
57(9,240)
2,686
1,2468,032
43897
6,6741,327
17,814
71,392133,133
11,6263,8781,137
13,865235,031
Accumulated Depreciation
StructuresMachinery and InstallationsFurnitureComputer hardwareOther tangible fixed assetsTotal
7,35336,068
3,2491,9393,195
51,804
1,99312,575
1,479620268
16,935
316(183)(571)
(53)0
(491)
3143,794
19819
2,9207,245
9,34844,666
3,9592,487
54361,003
The net accumulated surpluses as of January 31, 2001, arising from the revaluation made pursuant to Royal Decree-Law 7/1996, taking into account the retirements made both in 2000 and in prior years, and the transfers from intangible assets, amounted to Ptas. 1,808 million.
As of January 31, 2001, the net book value of the tangible fixed assets outside Spain, which consisted mainly of the commercial premises, furniture and installations relating to the open stores, amounted to Ptas. 75,684 million.
The gross cost of the GROUP’s tangible fixed assets which had been fully depreciated as of Janua-ry 31, 2001, is as follows:
Elements Cost
StructuresMachinery and Technical installations���������Computer hardwareOther tangible fixed assetsTotal
The GROUP has firm purchase commitments for ��������������������
The GROUP takes out insurance policies to cover the possible risks to which its tangible fixed assets ������������
1264,465
1171,070
1365,914
The detail of the balance of the “Tangible Fixed Assets” caption in the accompanying consolidated balance sheet and of the variations therein in 2000 is as follows:
Balance at 02/01/00 Balance at 01/31/01
Additions ReductionsBalance at 02/01/00 Balance at 01/31/01
The additions relate to the investments made in the year.
The transfers relate to the cost of lease contracts which expired during each year and to transfers from construction in progress and advances. Also include the effect of translation differences at foreign dependent companies.
The reductions relate mainly to retirements of technical facilities arising from refurbishment of the premises where the GROUP performs its business and to the disposal of land, structures and an air-��������������������
On January 31, 1997, certain GROUP companies revalued their tangible fixed assets pursuant to Royal Decree-Law 7/1996. The revaluation surpluses ����������������
Surplus
Land and structures Technical installations Machinery Tools Furniture Transport equipment Computer hardware Other tangible fixed assets Total
The effects of the revaluation on the annual depre-ciation charge and on the income for 2000 amount to approximately Ptas. 409 million and Ptas. 401 million, respectively.
Transfers
2,6501,973
412
26230
192
4,943

Description Additions Reductions
Other loansLong-term guarantees and depositsTotal
1,0362,4823,518
0994994
1,0030
1,003
03,4763,476
8 - LONG-TERM FINANCIAL INVESTMENTS
Holdings in Companies Carried by the Equity Method Additions Income
Fibracolor, S.A. and Dependent CompaniesTotal
1,3471,347
118118
4343
1,5081,508
The detail of the balance of the GROUP’s long-term investment securities portfolio is as follows:
Long Term Investment Securities Portfolio
Banco Gallego, S.A.Arrojo, S.A.Motorgal, S.A.Bostbil, S.L.OthersTotal
824388
45336464
2,057
The detail of the balances of, and variations in, the remaining consolidated long-term financial investment accounts is as follows:
Transfers toShort Term
(33)0
(33)
The reductions are due to early amortization of the transactions recorded.
9 - GOODWILL IN CONSOLIDATION
The variations in 2000 in the balance of this caption on the asset side of the accompanying consolidated balance sheet were as follows:
Subsidiary Balance at 02/01/00 Additions Amortization
Nosopunto, S.L.Stradivarius España, S.A.Za Giyim Ithalat Ihracat Ve Ticaret, Ltd.Total
13815,090
1,09716,325
00
242242
561,557
1271,740
8213,533
1,21214,827
10 - DEFERRED CHARGES
Description Additions Transfers
Deferred interest on lease transactionsFixed asset acquisition and other expensesTotal
Reductions
1,6182,3884,006
5981,0441,642
774(1,194)
(420)
57418475
2,2151,5253,740
Writedowns
718295
1,013
The detail of the "Holdings in Companies Carried by the Equity Method" caption in the consolidated balance ��������������������
Balance at 02/01/00 Balance at 01/31/01
Balance at 01/31/01
Balance at 02/01/00 Balance at 01/31/01
Balance at 01/31/01
Za Giyim Ithalat Ihracat Ve Ticaret, Ltd. is the company that operates the Zara stores in Turkey. The addition is due to the increase of the GROUP’s holding to 100% in 2000.
The detail of the balance of this caption in the accompanying consolidated balance sheet and of the variations therein in 2000 is as follows:
Balance at 02/01/00 Balance at 01/31/01

11 - INVENTORIES
Description
Commercial inventoriesRaw materialsOther suppliesWork-in-process and semifinished productsFinished productsHousing developmentProvisionsAdvances to suppliersTotal
Balance at 01/31/01
1,1725,488
6002,559
30,503654
(442)238
40,772
The breakdown of inventories at consolidated level as of January 31, 2001, is as follows:
12 - SHORT-TERM FINANCIAL INVESTMENTS
The detail of “Other Loans” and “Short-Term Investment Securities” as of January 31, 2001, is as follows:
The INDITEX GROUP takes out insurance policies to cover the potential risks to which its inventories ������������
Other Short-Term Loans
Loans and credits to related companiesForeign currency time depositsOthersTotal
6372,681
3673,685
Short-Term Investment Securities
Mutual Funds, Treasury Bills and others 10,443
13 - BALANCES WITH MULTIGROUP, ASSOCIATED AND RELATED COMPANIES
The detail, at consolidated level, of the accounts receivable from and payable to companies carried by the equity method, multigroup and other related companies is as follows:
Company
Companies consolidated by the proportional integration methodCompanies carried by the equity methodOther related companiesTotal
Payable
903304
201,227
Receivable
5260
6371,163
As o f January 31 , 2000, the "F i xed Asset Acquisition and Other Expenses" caption included the impl ic i t interest on the deferred payments relating to the acquisition of Stradivarius España, S.A. amounting to Ptas. 1,403 million, which were t ransferred in 2000 to the “Deferred Interest” caption, Ptas. 895 million remaining as of January 31, 2001. In addition, the "Transfers" column also inc ludes defer red f inancia l expenses on lease transactions maturing at short term which were reclassified, in certain GROUP companies, to the "Accrual Accounts" caption on the asset side of the
a c c o m p a n y i n g c o n s o l i d a t e d b a l a n c e s h e e t .
The decrease in the "Deferred Interest" caption relates to interest rate revisions made by several ������������������
The writedowns of deferred interest on lease transactions were recorded as financial expenses in the accompanying consolidated statement of income. The writedowns of fixed asset acquisition expenses were recorded as “Period Depreciation and ��������������
Balance at 01/31/01
Balance at 01/31/01
T h e a c c o u n t s r e c e i v a b l e f r o m o t h e r r e l a t e d companies are recorded under the "Short-Term Financial Investments - Other Loans" caption and those from multigroup companies are recorded under the "Long-Term Financial Investments - Other Loans" caption, while the accounts payable to other related
companies and multigroup companies are recorded under the "Trade Accounts Payable" and "Other Nontrade Payables" captions, and those payable to assoc iated companies are recorded under the “Payable to companies carried by the equity method” caption in the accompanying consolidated balance sheet.

14 - SHAREHOLDERS’ EQUITY The var iat ions in 2000 in equi ty accounts in the consol idated balance sheet were as fo l lows:
Description Balance at 02/01/00 Additions Transfers Dividends Balance at 01/31/01
CapitalAdditional paid-in capitalUnrestricted reserves of the Controlling CompanyRestricted reserves of the Controlling CompanyRevaluation reservesReserves at companies consolidated by the globla or proportional integration methodReserves at companies carried by the equity methodTranslation differencesInterim dividend1999 income2000 incomeTotal
15,4000
44,9803,260
28245,279
265,316
034,070
0148,613
1833,391
000
2100
492(200)
043,13347,209
(26)0
31,260370
01,371
9500
(33,070)00
000000000
(1,000)0
(1,000)
15,5573,391
76,2403,630
28246,860
1215,808(200)
043,133
194,822
The de ta i l o f the “Rese rves a t Compan ies Consolidated by the Global or Proportional Integration Method” and the “Translation Differences” captions as of January 31, 2001, is as follows:
Company Reserves at Companies Consolidated by the Global or Proportional Integration Method
Comditel, S.A.Confecciones Fíos, S.A.Confecciones Goa, S.A.Denllo, S.A.Hampton, S.A.Kenner, S.A.Kettering, S.A.Samlor, S.A.Trisko, S.A.Zintura, S.A.Tempe, S.A.Zara España, S.A.Pull & Bear España, S.A.Kiddy´s Class España, S.A.Grupo Massimo Dutti, S.A.Goa-Invest, S.A.Zara France, S.A.R.L.Zara Hellas, S.A.Zara Mexico, S.A. de CVPull & Bear Portugal Confecçoes, Lda.Zara Portugal Confecçoes Lda.Brettos BRT España, S.A.Zara Belgique, S.A.Zara Holding, B.V.Zara Financien, B.V.Zara UK, LtdZara Mexico, B.V.Zara Merken, B.V.OtrasOther consolidation adjustmentsTotal
943551308887404229
1,353350609651981
904,0631,9191,297
4641,194
6871,1501,7294,3921,189
55417,647
1,344218
1,1503,8341,030
(4,357)46,860
----------------
102(154)2,546
-105
-75
6211,300
(34)--
1,247-
5,808
TranslationDifferences
Capital
Variations in capital
As of January 31, 2000, the capital of Industria de D iseño Tex t i l , S .A . ( IND ITEX) cons is ted o f 3,080,000 fully subscribed and paid shares of Ptas. 5 ,000 par va lue each . On Ju l y 20 , 2000, the Shareholders’ Meeting resolved to split the outstan-ding shares 200-for-1, to redenominate them in euros and change to the book entry system Servicio de Compensación y Liquidación de Valores, S.A. was appointed to keep the accounting record of the shares. As a result of the redenomination in euros, capital was reduced by ¤ 155,864.08 (approxima-tely Ptas. 26 million), which were credited to res-tricted reserve accounts pursuant to Law 46/1998 on the introduction of the euro, amended by Law 14/2000 on Tax, Administrative, Labor and Social Security Measures.
The Universal Shareholders’ Meetings held on July 20, 2000, and January 19, 2001, approved certain stock option plans which are detailed later i n t h i s r e p o r t . To c o v e r t h e s e p l a n s t h e aforementioned Shareholders’ Meetings resolved to increase the Company’s capital by issuing 7,330,400 new common shares of ¤ 0.15 par value each, with additional paid-in capital of ¤ 2.78 per share, representing a total disbursement of ¤ 21,478,072
(app ro x imate l y P tas . 3 ,574 mi l l i on ) . A l l t he

shareholders waived their preemptive subscription
rights. The increase was subscribed by two finance
entities on January 31, 2001, and was registered
with the Mercantile Register of A Coruña on March
1, 2001. The 7,330,400 new shares issued carry
entitlement to all corporate earnings from February
1, 2001, and shareholders can receive as the first
div idend the div idend, i f any, i t is resolved to
distribute with a charge to the Company’s for the
year beginning on February 1, 2001.
Consequent ly, as of January 31, 2001, the
Company’s capital amounted to ¤ 93,499,560
(approximately Ptas. 15,557 million) represented
by 623,330,400 fully subscribed and paid shares of
¤0.15 par value each. All these shares are of the
same class and series and carry identical voting
and dividend rights (with the exception indicated
in the preceding paragraph with regard to the
7,330,400 new shares issued, relating to entitlement
to a share in corporate earnings for the year ended
January 31, 2001), and are represented by book
��������
capital, for an acquisition cost of Ptas. 524 million, f o r wh ich the r e la ted r es t r i c t ed r ese rve was recorded. A significant portion of these shares will be used to cover INDITEX’s stock option plan, as explained later in this report.
Admission to l isting on official security markets
On July 20, 2000, the Universal Annual and Spec ia l Shareho lders ’ Meet ing of Indust r ia de Diseño Textil , S.A. unanimously resolved to apply for admission to off icial trading on the Madrid, Barcelona, Bilbao and Valencia stock exchanges, a n d f o r i n c l u s i o n i n t h e S p a n i s h U n i f i e d Computerized Trading System (Continuous Market) of all the shares of the capital of INDITEX, through a prior public offering of shares.
At the date of preparation of these f inancial s tatements , the Company had not appl ied fo r a d m i s s i o n t o l i s t i n g o f i t s s h a r e s i n t h e aforementioned organized markets.
Plan for awarding of free shares to Group employees
On January 19, 2001, the Shareholders’ Meeting o f Indust r ia de D iseño Tex t i l , S .A . reso lved to introduce a system for the awarding of free shares to GROUP employees worldwide. Pursuant to this reso lut ion, a l l serv ing GROUP employees as of D e c e m b e r 3 1 , 2 0 0 0 , w h o w e r e s t i l l s e r v i n g employees four months af ter the admiss ion to l is t ing of the Company’s shares on the Madr id Stock Exchange will receive 50 shares per year (or fraction of a year) of service in the Group, provided that the aforementioned listing takes place before December 31, 2003. The employees of companies with registered offices in countries in which the awarding of shares is not advisable due to legal or administrative difficulties wil l receive a cash amount equal to the value of the shares at the date on which the r ight to receive them vests .
On February 23, 2001, pursuant to the Securities Market Law, prior notice of this transaction was registered with the Spanish National Securit ies �� � � � � � � � � � � � � � � � �
Shareholder Number of shares %
Gartler, S.L.Rosp Corunna, S.L.INDITEX (Treasury Stock)Santander Central Hispano Investment, S.A.Banco Bilbao Vizcaya Argentaria, S.A.IndividualsTotal
369,600,00043,590,000
1,446,600
4,312,000
3,018,400201,363,400�����������
59.2944%6.9931%0.2321%
0.6918%
0.4842%32.3044%
100%
As of January 31, 2001, the shareholder structure of INDITEX was as follows:
Treasury stock
As of January 31, 2000, INDITEX held 740,000 own shares acquired in 1995 for Ptas. 180 million. In Ju ly 2000 INDITEX acquired, f rom one of i ts shareholders, 706,000 own shares for Ptas. 344 mi l l ion . As o f January 31 , 2001, INDITEX he ld 1 ,446,000 own shares , represent ing 0 .23% of
To cover the Employee Stock Participation Plan, Santande r Cent ra l H i spano Inves tment , S .A . , s u b s c r i b e d 4 , 3 1 2 , 0 0 0 s h a r e s i n t h e c a p i t a l increase mentioned above, and signed a purchase option under which INDITEX can acquire the shares to be awarded to its GROUP employees. In addition, INDITEX arranged a swap with the aforementioned f inance ent i t y to dete rmine the re turn on the investment in the Company’s shares and regulate the monetary f lows relat ing to this investment.
Should any shares remain once the plan for a w a r d i n g o f s h a r e s h a s b e e n i m p l e m e n t e d , INDITEX’s Shareholders’ Meet ing can resolve to a l locate these shares to new plans for prof i t -shar ing by the Di rectors of INDITEX and/or i ts GROUP personnel prior to the deadline indicated in the following paragraph.
I f (a) on December 31, 2003, the Company’s shares have not been admitted to l ist ing on the Madr id , Barce lona, Va lenc ia and B i lbao s tock exchanges and included in the Spanish Unif ied Computerized Trading System (Continuous Market), or (b) on January 30, 2004, there are any remaining s h a r e s h e l d b y S a n t a n d e r C e n t r a l H i s p a n o Investment, S.A., INDITEX undertakes to submit to the first (Annual or Special) Shareholders’ Meeting subsequent to that date a resolution for a capital reduction through the redemption of the subscribed s h a r e s h e l d b y S a n t a n d e r C e n t r a l H i s p a n o I n v e s t m e n t , S . A . w h i c h I N D I T E X h a s n o t repurchased, at a redemption value of ¤ 2.93 per �� � � � �
The estimated cost of awarding of free shares transaction for the Group as a whole amounts to Ptas. 3,743 mil l ion, which were charged to the “ E x t r a o r d i n a r y E x p e n s e s ” c a p t i o n i n t h e accompanying 2000 consol idated statement of income, with a credit to the “Current Liabilities – Other Nontrade Payables” caption on the liability s ide of the accompanying balance sheet as of � � � � � � � � � � � � � � � � �
1998 stock option plan
In 1998 the Company signed agreements with a group of executives under which it would grant them option rights if certain economic targets were
met. As a result of this Plan, options were granted giving the group of executives as a whole the right to purchase a maximum of 1,405,600 shares from the Company at a price of ¤ 2.93 per share. The per iod fo r the exerc ise o f the opt ions is f rom September 15, 2001, to September 15, 2003, and all the rights relating to the unexercised options expire on the latter date.
INDITEX received Ptas. 34 million (Ptas. 24.35 per share) as the option premium. The 1998 option p lan was ra t i f i ed by IND ITEX ’s Shareho lde rs ’ Meeting on July 20, 2000.
To cover this Plan, INDITEX has a suff ic ient number of shares of treasury stock to provide for exercise of all the options granted, and no losses are foreseen for the Company, since the acquisition cost is lower than the pr ice of exerc ise of the �� � � � � � �
Stock option plan
On July 20, 2000, and January 19, 2001, the Shareho lde rs ’ Meet ing o f IND ITEX reso lved to implement a new stock action plan under which opt ion r ights wi l l be granted on a maximum of 3,018,400 common shares of INDITEX of ¤ 0.15 par value each. This plan relates to the members of INDITEX’s board of Directors and to executives and other key employees of the GROUP. Each option, when exercised, will give entitlement to one INDITEX ��� � � �
The number of options to be awarded will depend on the appreciat ion of INDITEX’s shares in the Continuous Market in the year in which its shares are admitted to listing on the stock exchanges and in the two following years.
I t is planned to grant a maximum of 437,300 options to members of INDITEX’s board of Directors and a maximum of 2,581,100 options to executives and key employees of the GROUP. A maximum of 69,000 options can be granted to any one director and a max imum of 57 ,575 opt ions to any one executive or employee. Unless certain minimum appreciation levels are reached in any one of the above-mentioned years, no rights will vest for any o f t h e P l a n ’s b e n e f i c i a r i e s i n t h a t y e a r.
Legal reserve
Under the revised Corporations Law, 10% of the income for each year must be transferred to the legal reserve unt i l the balance of th is reserve reaches at least 20% of capital.
The legal reserve can be used to increase capital provided that the remaining reserve balance does not fall below 10% of the increased capital amount.
Except as ment ioned above, unt i l the legal reserve exceeds 20% of capital, it can only be used to offset losses, provided that suff ic ient other r ese r ves a r e no t ava i l ab l e f o r t h i s pu rpose .
General ly, the consolidated companies’ legal reserves have reached legally the stipulated level.
Revaluat ion reserves Royal Decree-Law 7/1996
From the date on which the tax authorities have r e v i e w e d a n d a p p r o v e d t h e b a l a n c e o f t h e “Revaluation Reserve Royal Decree-Law 7/1996” account (or the three-year period for review has expired), the aforementioned balance can be used, free of tax, to offset recorded losses (both prior years’ accumulated losses and current year losses or losses which might arise in the future), and to increase capital. From February 1, 2007 (ten years from the date of the balance sheet which reflected the revaluation transactions), the balance of this account can be taken to unrestr icted reserves, p rov ided that the monetary surp lus has been realized. The surplus will be deemed to have been r e a l i z e d i n r e s p e c t o f t h e p o r t i o n o n w h i c h dep r ec ia t i on has been taken f o r accoun t i ng purposes or when the revalued assets have been transferred or retired from the accounting records.
A l so , i f l eased asse ts a r e r eva lued , the aforementioned use of the “Revaluation Reserve” balance may not take place before the purchase option has been exercised.
I f this balance were used in a manner other than that provided for in Royal Decree-Law 7/1996, it would be subject to tax.
The Shareholders’ Meet ing delegated to the Board of Directors the determination of the methods whereby the Directors, executives and other key employees to be the beneficiaries of the Plan, and the number of options to be granted to each one, within the limits stated above, will be decided. At t h e d a t e o f p r e p a r a t i o n o f t h e s e f i n a n c i a l s tatements the Board of Di rectors had not yet approved these limits.
The price of exercise of the options wil l be ¤ 2.93, and the periods for exercise will commence two years after each of the periods for calculating the above-mentioned appreciation.
To cover the stock option plan, Banco Bilbao Vizcaya Argentar ia , S .A . subscr ibed 3 ,018,400 shares in the capital increase referred to above, and signed a purchase option contract under which INDITEX can acquire the shares to be sold to the benef ic iar ies who exercise their opt ions should these options vest. In addition, INDITEX arranged a swap with the aforementioned finance entity to determine the return on the investment in the Company’s shares and regulate the monetary flows relating to this investment.
Should any shares remain once the stock option p l a n h a s b e e n i m p l e m e n t e d , I N D I T E X ’s Shareholders’ Meeting can resolve to allocate these shares to new p lans fo r pro f i t -shar ing by the Directors of INDITEX and/or its GROUP personnel pr ior to the deadl ine indicated in the fol lowing ��� � � � � � � �
I f (a) on December 31, 2002, the Company’s shares have not been admitted to l ist ing on the Madr id , Barce lona, Va lenc ia and B i lbao s tock exchanges and included in the Spanish Unif ied Computerized Trading System (Continuous Market), or (b) on January 30, 2007, there are any remaining shares held by Banco Bilbao Vizcaya Argentaria, S .A. , INDITEX undertakes to submit to the f i rst ( A n n u a l o r S p e c i a l ) S h a r e h o l d e r s ’ M e e t i n g subsequent to that date a resolution for a capital reduction through the redemption of the subscribed shares held by Banco Bilbao Vizcaya Argentaria, S .A . which INDITEX has not repurchased, at a �� � � � � � � � � � � � � � � � � � �¤ 2.93 per share.

15 - MINORITY INTERESTS The variations in 2000 in this caption in the accompanying consolidated balance sheet were as ��������
Description Amount
Beginning balanceAllocation of 2000 incomeAdditionsRetirementsEnding Balance
2,344446
0(914)1,876
The retirements relate basically to the change in the method of consolidation of the dependent company Zara Deutschland, GmbH (see Note 2).
The detail, by company, as of January 31, 2001, is as follows:
Company Capital Reserves
Zara Mexico, S.A. de CVNosopunto, S.L.Zara Canada, Inc.Stradivarius España, S.A.Jema Creaciones Infantiles, S.L.Total
Income Total
8284
1141014
304
207790(9)
12810
1,126
121253
123426
446
4101,127
117172
501,876
INDITEX has a purchase option on 9.95% of the capital stock of Stradivarius España, S.A. owned by a minority shareholder. In turn, this shareholder has a put option for sale of this holding to INDITEX. The period for exercise of these options, which were g ranted when INDITEX acqu i red a cont ro l l ing interest, is from 2005 to 2010. The options were granted without any premium and can be exercised f o r P tas . 1 , 990 m i l l i on , p l us 9 .95% o f t he undistributed income of Stradivarius España, S.A. f rom the date of acquisi t ion of the holding by INDITEX through the date on which either of the opt ions are exerc ised. The GROUP’s holding in Stradivarius España, S.A. was acquired in 1999 for Ptas. 18,010 million, which will be paid between 1999 and 2005 (see Notes 10 and 19).
INDITEX has a purchase option on 50% of the capital of Zara Deutschland GmbH owned by Otto Versand GmbH & Co., which in turn has a put option for the sale to INDITEX of all its holding. The period f o r e xe r c i se o f these op t i ons commences i n September 2001 and extends over the term of the agreement between the shareholders. The options were granted without any premium and the exercise price will depend on the equity of the investee and on the number of stores operated by this company at the date on which either option is exercised.
INDITEX has a purchase option on 51% of the capital of Zara Japan Corporation owned by the Bigi
Group. The exercise period for this option extends ove r the te rm o f the agreement be tween the shareholders. The option was granted without any premium and the exercise price will depend on the equity of the investee and on the number of stores operated by this company at the date on which either ��������������������
INDITEX has a purchase option on 5% of the capital of Zara Canada, Inc. owned by Reitmans Canada Limited, which in turn has a put option for the sale to INDITEX of i ts holding. The exercise period for this option extends over the term of the agreement between the shareholders. The options were granted without any premium and the exercise price will depend on the equity of the investee.
INDITEX has a purchase option on 5% of the capital of Zara México, S.A. de CV owned by the minority shareholder. The exercise period for this opt ion extends over the term of the agreement between the shareholders. The options were granted without any premium and the exercise price wil l depend on the equity of the investee.
INDITEX’s Directors consider that in no event will s ign i f i cant var ia t ions a r ise in the resu l ts o f operations or financial situation of INDITEX or of its consolidated GROUP as a result of exercise of any of the options described above.

16 - DEFERRED REVENUES
The breakdown of the balance of this caption in the accompanying consolidated balance sheet as of January 31, 2001, is as follows:
17 - PROVISIONS FOR CONTINGENCIES AND EXPENSES
The variations in 2000 in the balance of this caption in the accompanying consolidated balance sheet is �����������
Description Balance at 02/01/00 Provisions Used Amounts
Provision for pensions and similar obligationsProvision for third-party liabilityProvision for major repairsTotal
Decrease Balance at 01/31/01
841,9181,5013,503
31173
1,1101,314
062
9971,059
15206
0221
1001,8231,6143,537
18 - PAYABLE TO CREDIT ENTITIES
The detail of the INDITEX GROUP’s debts to credit entit ies as of January 31, 2001, is as fol lows:
Type of Debt Limit Balance at 01/31/01
Peseta loansForeign currency loansCredit facilities in Ptas.Credit facilities in foreign currenciesLease transactionsOther financial debtsTotal
41,67914,359
56,038
2,60319,690
4,3552,244
14,318451
43,661
All these debts bear interest at the usual rates in the respective financial markets.
The detai l of the maturit ies of the INDITEX GROUP’s debt to credit entities as of January 31, 2001, is as follows:
Debt due by: Amount
January 31, 2002January 31, 2003January 31, 2004January 31, 2005Subsequent yearsTotal
16,1186,0506,2502,772
12,47143,661
Description Balance at 01/31/01
Capital subsidiesDeferred interestExchange gainsTotal
2953115
341
T h e c o n s o l i d a t e d c o m p a n i e s r e c o g n i z e d approximately Ptas. 7 million of subsidies in income under the "Capital Subsidies Transferred to Income f o r t h e Ye a r " c a p t i o n i n t h e a c c o m p a n y i n g consolidated statement of income.
The provision for third-party liability relates to amounts recorded at the companies and used to cover risks arising from their usual operations. The provision for major repairs covers possible future losses due to renovations at commercial premises at which the GROUP operates and the related amount is recorded in the “Operating Income - Variation in Provisions” caption in the accompanying consolidated statement of income.

19 - OTHER NONTRADE PAYABLES
The detail of the blances of the “Long-Term Debt - Other Accounts Payable” and “Current Liabilities - Other Nontrade Payables” captions as of January 31, 2001, is as follows:
Long-Term Debt - Other Accounts Payable Balance at 01/31/01
Guarantees receivedFixed asset suppliers and othersAccrued taxes payable (Note 20)Other long-term accounts payableTotal
257,8102,342
84811,025
Payable to public authorities (Note 20)Compensation payableFixed asset suppliersAccounts payable for awarding of shares (Note 14)Other accounts payableTotal
26,0735,4245,5163,743
60341,359
Debt due by: Amount
January 31, 2003January 31, 2004January 31, 2005Total
3,4003,4001,0107,810
20 - TAX MATTERS
Choolet, S.A.Comditel, S.A.Denllo, S.A.Confecc iones F íos , S .A .Confecc iones Goa , S .A .�������������Kenner, S.A.Nikole, S.A.Oysho España, S.A.Trisko, S.A.Zintura, S.A.Yeroli, S.A.Kettering, S.A.Zara España, S.A.Bershka BSK España, S.A.Bershka Logíst ica, S.A.� � � � � � � � � � � � � � � � � � � ��������������
Pu l l & Bea r España , S . A .K iddy ´s Class España, S .A .B r e t t o s B RT E s p a ñ a , S . A .Grupo Mass imo Dut t i , S .A .����������������Arrojo, S.A.Motorgal, S.A.Lefties España, S.A.Pul l & Bear Logíst ica, S .A .��������������Sircio, S.A.Zara, S.A.Tugend, S.A.Stear, S.A.Massimo Dutti Logística, S.A.Samlor, S.A.Textil Rase, S.A.S t rad i va r i us España , S .A .
Current Liabilities - Other Nontrade Payables Balance at 01/31/01
The long- and short-term accounts payable to fixed asset suppliers include Ptas. 7,810 million and Ptas. 3,400 million, respectively, relating to the deferred payment for acquisition of the Group’s holding in Stradivarius España, S.A. (see Notes 10 ���������
The accrued taxes payable include deferred taxes and amounts payable for withholdings made chiefly from personnel, VAT and social security taxes for the last month of the year.
The detail of the maturities of the long-term debt to fixed asset suppliers is as follows:
The consolidated companies file individual tax returns except for Inditex, which files consolidated tax returns as the Controlling Company of a subgroup comprising the following companies:

The Spanish GROUP companies generally have the last four years open for rev iew by the tax inspection authorities for all the taxes applicable ��������
The balance of the "Other Nontrade Payables" caption in the accompanying consolidated balance sheet includes the liability for the applicable taxes, including the provision for 2000 corporate income tax, net of period withholdings and prepayments.
The balance of the “Accounts Receivable-Other Accounts Receivable” caption in the accompanying consolidated balance sheet includes those sums to be recovered from the Authorities, among which are included VAT credit over VAT rebounded during the fiscal year, and prepaid taxes.
INDITEX has a 49% ownership interest in four economic interest groupings which engage in the lease of assets and have availed themselves of the tax incentives regulated in the fifteenth additional provision of the Corporate Income Tax Law, having requested and obtained this tax benefit from the Ministry of Economy and Finance. In the first years tax losses will foreseeably be incurred which will reduce Inditex’s corporate income tax expense. The Company has opted to allocate the entit ies’ tax bases to the tax per iod in which the f inancial statements are approved and, consequently, the first allocation will be made in the following year. This investment will be deemed to be a financial transaction and the estimated net result will be allocated over the foreseeable life thereof.
The 2000 corporate income tax was calculated on the basis of income per books determined by appl icat ion o f genera l l y accepted account ing principles, which does not necessarily coincide with ����������������
The GROUP’s corporate income tax expense was calculated by aggregating the tax expense of each o f t h e i n d i v i d u a l c o m p a n i e s d e t e r m i n e d i n accordance with the corporate and tax legislation in force in the countries in which the consolidated ������������������
The co rporate income tax expense o f the companies composing the Spanish consolidated tax subgroup of which Inditex is the controlling company was determined in accordance with Rule Six of the
Resolution of October 9, 1997, of ICAC (the Spanish Accounting and Audit Institute), taking into account, in addition to the parameters of individual taxation, the timing and permanent differences deriving from the process of consolidation and the tax credits and tax relief for the amount applicable under the tax regime for corporate groups.
The reconciliation of the GROUP's 2000 income per books to the taxable income for corporate income tax purposes is as follows:
Amount
Income for the year per books Corporate income tax due Net permanent differences: Individual companies Consolidation adjustments Net timing differences: Offset of prior years’ uncapitalized tax losses Taxable income
The GROUP recorded under the “Other Taxes” caption in the accompanying consolidated statement of income Ptas. 902 million relating to withholding ������
The companies, mainly the spanish ones, have recorded the prepaid and deferred income taxes ar is ing f rom t iming di f ferences in recogniz ing certain revenues and expenses for accounting and tax purposes. The cumulative amounts as of January 31, 2001, for these spanish companies were as ��������
Description Amount
Deferred corporate income tax Prepaid corporate income tax
The companies comprising the consol idated GROUP have generally availed themselves of the tax credit benefits provided by current corporate income tax legislation. Although the companies have not yet filed their corporate income tax returns for 2000, the prov is ion fo r corporate income tax in the accompanying consolidated financial statements includes deductions for Ptas. 3,499 million.
43,13316,888
612137
(2,614)
(199)57,957
6,4651,391
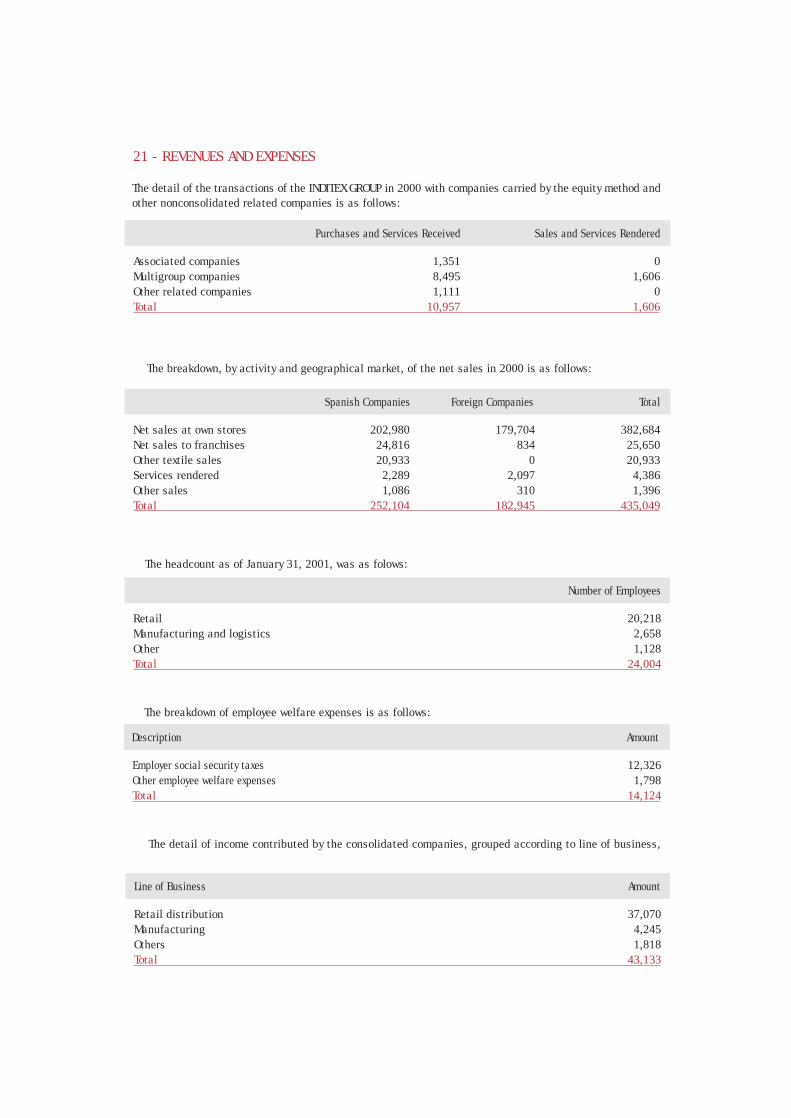
21 - REVENUES AND EXPENSES
The breakdown, by activity and geographical market, of the net sales in 2000 is as follows:
Total
Net sales at own storesNet sales to franchisesOther textile salesServices renderedOther salesTotal
382,68425,65020,933
4,3861,396
435,049
Foreign Companies
202,98024,81620,933
2,2891,086
252,104
Spanish Companies
179,704834
02,097
310182,945
The headcount as of January 31, 2001, was as folows:
RetailManufacturing and logisticsOtherTotal
Number of Employees
20,2182,6581,128
24,004
The breakdown of employee welfare expenses is as follows:
Employer social security taxesOther employee welfare expensesTotal
Amount
12,3261,798
14,124
Description
The detail of income contributed by the consolidated companies, grouped according to line of business, ��������������
Retail distributionManufacturingOthersTotal
Amount
37,0704,2451,818
43,133
Line of Business
Sales and Services Rendered
Associated companiesMultigroup companiesOther related companiesTotal
01,606
01,606
Purchases and Services Received
1,3518,4951,111
10,957
The detail of the transactions of the INDITEX GROUP in 2000 with companies carried by the equity method and other nonconsolidated related companies is as follows:

23 - EXPLANATION ADDED FOR TRANSLATION TO ENGLISH
These consolidated financial statements are presented on the basis of accounting principles generally accepted in Spain. Certain accounting practices applied by the Group that conform with generally accepted accounting principles in Spain may not conform with generally accepted accounting principles in other ����������
22 - DIRECTORS’ REMUNERATION
In 2000 the GROUP recorded approximately Ptas. 668 million of wages and salaries earned by the Directors.
The INDITEX GROUP has granted no advances and has no pension or life insurance commitments to the Directors of Inditex or of any of the consolidable companies.
Revenues Amount
Gains on fixed asset disposalsCapital subsidiesExtraordinary revenues and incomePrior years' revenues and incomeTotal revenues
6,6787
757212
7,654
Extraordinary revenues and expenses
The main extraordinary revenues and expenses in 2000 are summarized as follows:
Expenses Amount
Variation in fixed asset provisionsLosses on fixed assetsExtraordinary expenses Awarding of shares (Note 14) OtherPrior years’ expenses and lossesTotal expenses
1371,413
3,7431,321
5967,210
Extraordinary income 444
The losses on fixed assets relate mainly to the retirement of facilities due to refurbishing at commercial premises where the GROUP operates.
Revenues from tangible fixed assets relate to the sale of land and structures and of an aircraft.
The transactions performed by the Group in the year, by currency, are as follows (in millions of Ptas.):
EuroOther european currenciesUS dollarOther American currenciesOther currenciesTotal
Net Sales
356,9375,8446,041
57,9928,235
435,049
Currency
183,8370
31,39400
215,231
82.0%1.3%1.4%
13.3%1.9%
100.0%
85.4%0.0%
14.6%0.0%0.0%
100.0%
Procurements % Net Sales % Procurements

Net salesCost of Sales Gross Margin (Gross Profit) Gross margin
Operating expenses Operating cash flow (EBITDA) EBITDA margin
Fixed asset depreciation and amortizationAmortization of goodwillProvisions Operating income (EBIT) EBIT margin
Net financial expenses����Ordinary Income Ordinary margin
Extraordinary loss (income) Income before taxes (EBT) EBT margin
Taxes Consolidated Income (Net Income before minorities)
Income (loss) attributed to minority interests Income for the year attributed to the Controlling Company (Net Income) Net income margin
435,049212,481
222,56851.2%
135,80086,768
19.9%
20,7101,7401,110
63,20814.5%
2,28360,925
14.0%
(444)61,36914.1%
17,79043,579
446
43,1339.9%
338,607164,458
174,14951.4%
105,85768,292
20.2%
16,054566
2,39449,278
14.6%
92948,349
14.3%
(303)48,652
14.4%
14,33834,314
244
34,07010.1%
268,665133,089
135,57650.5%
81,39254,184
20.2%
13,29592
61440,183
15.0%
94639,237
14.6%
1,13738,10014.2%
12,66025,440
(40)
25,4809.5%
28%
28%
27%
28%
26%
26%
27%
27%
Millions of Euros Millions of Pesetas
2000 19981999 2000 19981999
VAR
2000/1999
EXHIBIT IPage 1
2000, 1999 AND 1998 STATEMENTS OF INCOME IN ACCORDANCE WITH THE INDUSTRY’S STANDARDS(Amounts in Millions of Euros, Millions of Pesetas and as a Percentage of Net Sales)
INDUSTRIA DE DISEÑO TEXTIL,S.A. AND DEPENDENT COMPANIES
Following are the statements of income for the last three years in accordance with the industry’s standards, which can be used to analyze the generation of margins in accordance with the industry’s standards.
2,614.71,277.0
1,337.751.2%
816.2521.519.9%
124.510.56.7
379.914.5%
13.7366.214.0%
(2.7)368.814.1%
106.9261.9
2.7
259.29.9%
2,035.1988.4
1,046.751.4%
636.2410.420.2%
96.53.4
14.4296.214.6%
5.6290.614.3%
(1.8)292.414.4%
86.2206.2
1.5
204.810.1%
1,614.7799.9814.850.5%
489.2325.720.2%
79.90.63.7
241.515.0%
5.7235.814.6%
6.8229.014.2%
76.1152.9
(0.2)
153.19.5%

2,013303,301398,850(95,501)
(48)1,045,929
429,075800,145100,014
83,330(366,635)
041,307
9,06312,36320,891(1,010)
3,149
1,395,699
89,112
22,478
245,045145,176
71,03475,031
(889)84,91162,76422,147
118,9586,214
600,304
2,107,593
475262,137342,847(80,662)
(48)870,824348,352642,296102,376
89,352(311,348)
(204)34,258
8,0955,145
21,144(126)1,082
1,168,776
98,115
24,077
188,459121,621
58,84063,658
(877)50,00933,40916,600
114,4577,362
481,908
1,772,876
529214,868282,169(67,253)
(48)670,651302,507464,366
75,28974,802
(243,945)(2,368)27,995
9,0693,384
15,5420
1,082
915,125
1,166
18,565
157,64575,03142,07734,829(1,875)86,00475,09010,91465,649
7,128
391,457
1,326,313
EXHIBIT IIPage 1
The accompanying Notes 1 to 23 and Exhibits I, II and III are an integral part of the consolidated balance sheet as of January 31, 2001. (1) Calculated by dividing the figures in pesetas by 166,386(*) Presented solely for comparison purposes
INDUSTRIA DE DISEÑO TEXTIL,S.A. AND DEPENDENT COMPANIES
CONSOLIDATED BALANCE SHEETS AS OF JANUARY 31, 2001, 2000 AND 1999
(CURRENCY - THOUSANDS OF EUROS) (1)
ASSETS Jan 31, 2001 Jan 31, 2000 (*) Jan 31, 1999 (*)
I. Start-up expenses (Note 5)II. Intangible assets (Note 6) Intangible assets and rights Accumulated amortization ProvisionsIII. Tangible fixed assets (Note 7) Land and structures Technical installations and machinery Other tangible fixed assets Advances and construction in progress Accumulated depreciation ProvisionsIV. Long-term financial investments (Note 8) Holdings in companies carried by the equity method Long-term investment securities Other loans ProvisionsV. Treasury Stock
Total Fixed and Non Current Assets
C) GOODWILL IN CONSOLIDATION (Note 9)
D) DEFERRED CHARGES (Note 10)
E) CURRENT ASSETS
II. Inventories (Note 11)III. Accounts receivable Customer receivables for sales and services Other accounts receivable ProvisionsIV. Short-term financial investments (Note 12) Short-term investment securities Other loansVI. CashVII. Accrual accounts
Total Current Assets
TOTAL ASSETS
B) FIXED AND OTHER NONCURRENT ASSETS
Translation of a report and financial statements originally issued in Spanish and prepared in accordance with generally accepted accounting pricipies in Spain (see Note 23). In the event of a discrepancy, the Spanish - language version prevails.

93,49920,380
1,695480,029458,212
21,817281,634
72734,90734,907
259,235261,916(2,681)(1,202)
1,170,904
11,275
2,049
21,258
165,53766,262
231,799
96,8711,827
322,941248,573
96
670,308
2,107,593
92,5560
1,695289,928270,335
19,593272,131
15531,94931,949
204,771206,246(1,475)
0
893,186
14,088
1,869
21,053
207,80083,144
290,944
116,3381,448
276,111157,778
60
551,735
1,772,876
92,5560
1,695214,159194,566
19,593203,232
6497,9457,945
153,137152,897
2400
673,373
7,495
1,995
12,549
168,58417,664
186,248
88,3371,358
215,583139,297
78
444,653
1,326,313
EXHIBIT IIPage 2
The accompanying Notes 1 to 23 and Exhibits I, II and III are an integral part of the consolidated balance sheet as of January 31, 2001. (1) Calculated by dividing the figures in pesetas by 166,386(*) Presented solely for comparison purposes
SHAREHOLDER’S EQUITY AND LIABILITIES
INDUSTRIA DE DISEÑO TEXTIL,S.A. AND DEPENDENT COMPANIES
CONSOLIDATED BALANCE SHEETS AS OF JANUARY 31, 2001, 2000 AND 1999
(CURRENCY - THOUSANDS OF EUROS) (1)
Jan 31, 2001 Jan 31, 2000 (*) Jan 31, 1999 (*)
I. CapitalII. Additional paid-in capitalIII. Revaluation reserveIV. Other reserves of the Controlling Company Unrestricted reserves Restricted reservesV. Reserves at com. cons. by the global or prop. integ. methodVI. Reserves at companies carried by the equity methodVII. Translation differences Companies consolidated by the global integration methodVIII. Income attributable to the Controlling Company Consolidated income for the year (Income) loss attributed to minority interestsIX. Interim dividend paid in the year
Total shareholders´ equity
B) MINORITY INTERESTS (Note 15)
D) DEFERRED REVENUES (Note 16)
E) PROVISIONS FOR CONTINGENCIES AND EXPENSES (Note 17)
F) LONG-TERM DEBT
II. Payable to credit entities (Note 18)III. Other accounts payable (Note 19)
Total long-term debt
G) CURRENT LIABILITIES
II. Payable to credit entities (Note 18)III. Payable to companies carried by the equity method (Note 13)IV. Trade accounts payableV. Other nontrade payables (Note 19)VII. Accrual accounts
Total current liabilities
TOTAL SHAREHOLDERS´ EQUITY AND LIABILITIES
A) SHAREHOLDERS’EQUITY (note 14)

1,293,564411,393326,506
84,887124,470
5,920407,546
390,345
21,99724,635
0
010,458
366,166
8238,492
30,4353,582
2,670
368,836
101,4995,421
261,916
2,681
259,235
991,123318,603248,747
69,85696,48914,959
318,476
299,572
16,3146,160
0
03,402
290,589
(67)3,8724,066
551
1,826
292,415
81,6514,518
206,246
1,475
204,771
850,017252,551198,316
54,23579,905
4,435236,655
242,064
12,9345,379
0
42553
235,825
6977,1761,3831,028
0
228,985
73,1972,891
152,897
0
153,137
EXHIBIT IIPage 3
INDUSTRIA DE DISEÑO TEXTIL,S.A. AND DEPENDENT COMPANIES
CONSOLIDATED STATEMENTS OF INCOME FOR THE YEARS ENDEDJANUARY 31, 2001, 2000 AND 1999
(CURRENCY - THOUSANDS OF EUROS) (1)
DEBIT
A) EXPENSES
Jan 31, 2001 Jan 31, 2000 (*) Jan 31, 1999 (*)
Purchases Personnel expensesa) Wages, salaries, etc.b) Employee welfare expenses (Note 21)Period depreciation and amortizationVariation in operating provisions (Note 2.e)Other operating expenses
I. OPERATING INCOME
Financial and similar expensesExchange losses
II. FINANCIAL INCOME
Share in losses of companies carried by the equity����������Amortization of goodwill in consolidation (Note 9)
III. INCOME FROM ORDINARY ACTIVITIES
Variation in intangible asset and tangible fixed asset provisionsLosses on fixed assetsExtraordinary expenses (Notes 2.e and 21)Prior years' expenses and losses
IV. EXTRAORDINARY INCOME (Note 21)
V. CONSOLIDATED INCOME BEFORE TAXES
Corporate income tax (Note 20)Other taxes (Note 20)
VI. CONSOLIDATED INCOME FOR THE YEAR
Income attributed to minority interests
VII. INCOME FOR THE YEAR ATTRIBUTED TO THE CONTROLLING COMPANY
The accompanying Notes 1 to 23 and Exhibits I, II and III are an integral part of the consolidated statements of income as of January 31, 2001. (1) Calculated by dividing the figures in pesetas by 166,386(*) Presented solely for comparison purposes

2,614,697
16,5282,013
0
1629,616
22,875
13,979
258
0
40,13642
4,5501,274
0
0
2,035,069
2,7171,436
0
2526,6899,376
6,158
577
0
3,79836
5,890523
0
0
1,614,709
50,142775
0
786,2395,998
5,998
355
0
1,076126
1,521721
6,840
240
EXHIBIT IIPage 4
The accompanying Notes 1 to 23 and Exhibits I, II and III are an integral part of the consolidated statements of income as of January 31, 2001. (1) Calculated by dividing the figures in pesetas by 166,386(*) Presented solely for comparison purposes
INDUSTRIA DE DISEÑO TEXTIL,S.A. AND DEPENDENT COMPANIES
CONSOLIDATED STATEMENTS OF INCOME FOR THE YEARS ENDEDJANUARY 31, 2001, 2000 AND 1999
(CURRENCY - THOUSANDS OF EUROS) (1)
CREDIT
B) REVENUES
Jan 31, 2001 Jan 31, 2000 (*) Jan 31, 1999 (*)
Net revenues (Note 21)Increase in finished product and work-in-process inventoriesOther operating revenues
I. OPERATING LOSS
Income from shareholdingsOther financial revenuesExchange gains
II. FINANCIAL LOSS
Share in income of companies carried by the equity method (Note 8)
III. LOSS ON ORDINARY ACTIVITIES
Gains on fixed asset disposals Capital subsidies transferred to income for the yearExtraordinary revenues and incomePrior years' revenues and income
IV. EXTRAORDINARY LOSS
Loss atributed to minority interests

COMPOSITION OF THE INDITEX GROUP
The companies included in consolidation as of January 31, 2001, are as follows:
Company Effective Owner-ship Interest Country Consolidation Method Year-End Business Line
EXHIBIT IIIPage 1
Industria de Diseño Textil, S.A.Comditel, S.A.Inditex Asia, Ltd.Zara Asia, Ltd.Choolet, S.A.Confecciones Fíos, S.A.Confecciones Goa, S.A.Denllo, S.A.Hampton, S.A.Jema Creaciones Infantiles, S.L.Kenner, S.A.Kettering, S.A.Nikole, S.A.Nosopunto, S.L.Samlor, S.A.Sircio, S.A.Stear, S.A.Textil Rase, S.A.Trisko, S.A.Tugend, S.A.Yeroli, S.A.Zintura, S.A.Glencare, S.A.Todotinte, S.L.Indipunt, S.A.Tempe, S.A.Zara España, S.A.Zara Argentina, S.A.Zara Belgique, S.A.Zara Chile, S.A.Zara USA Inc.Zara France, S.A.R.L.Zara UK, Ltd.Zara Hellas, S.A.Zara Japan Corp.Zara México, S.A. de CVZara Portugal Confecçoes Lda.Zara Venezuela, S.A.G.Zara Uruguay, S.A.Zara Brasil, Lda.Zara Deutschland, GmbHZara Nederland, B.V.Zara Österreich Clothing, GmbH����������������Zara Sverige, ABZara Norge, ASZara Canada, Inc.Zara Suisse S.A.R.L.Zara Luxembourg, S.A.Za Giyim Ithalat Ihracat Ve Ticaret Ltd.
Parent Co.100.00%100.00%100.00%100.00%100.00%100.00%100.00%100.00%
45.90%100.00%100.00%100.00%
51.00%100.00%100.00%100.00%100.00%100.00%100.00%100.00%100.00%100.00%
51.00%51.00%50.00%
100.00%100.00%100.00%100.00%100.00%100.00%100.00%100.00%
49.00%95.00%
100.00%100.00%100.00%100.00%
50.00%100.00%100.00%100.00%100.00%100.00%
95.00%100.00%100.00%100.00%
SpainSpain
Hong KongHong Kong
SpainSpainSpainSpainSpainSpainSpainSpainSpainSpainSpainSpainSpainSpainSpainSpainSpainSpainSpainSpainSpainSpainSpain
ArgentinaBelgium
ChileU.S.
FranceU.K.
GreeceJapan
MexicoPortugal
VenezuelaUruguay
BrazilGermanyHollandAustria
DenmarkSwedenNorwayCanada
SwitzerlandLuxembourg
Turkey
Global I.Global I.Global I.Global I.Global I.Global I.Global I.Global I.Global I.Global I.Global I.Global I.Global I.Global I.Global I.Global I.Global I.Global I.Global I.Global I.Global I.Global I.Global I.Global I.Global I.
Prop. I.Global I.Global I.Global I.Global I.Global I.Global I.Global I.Global I.
Prop. I.Global I.Global I.Global I.Global I.Global I.
Prop. I.Global I.Global I.Global I.Global I.Global I.Global I.Global I.Global I.Global I.
01/31/0101/31/0101/31/0101/31/0101/31/0101/31/0101/31/0101/31/0101/31/0101/31/0101/31/0101/31/0101/31/0101/31/0101/31/0101/31/0101/31/0101/31/0101/31/0101/31/0101/31/0101/31/0101/31/0101/31/0101/31/0101/31/0101/31/0101/31/0101/31/0112/31/0001/31/0101/31/0101/31/0101/31/0101/31/0112/31/0001/31/0101/31/0101/31/0112/31/0001/31/0101/31/0101/31/0101/31/0101/31/0101/31/0101/31/0101/31/0101/31/0112/31/00
Parent CompanyTextile purchase centerTextile purchase centerTextile purchase center
Textile manufactureTextile manufactureTextile manufactureTextile manufactureTextile manufactureTextile manufactureTextile manufactureTextile manufactureTextile manufactureTextile manufactureTextile manufactureTextile manufactureTextile manufactureTextile manufactureTextile manufactureTextile manufactureTextile manufactureTextile manufactureTextile manufactureTextile manufactureTextile manufacture
Marketing of footwearRetailRetailRetailRetailRetailRetailRetailRetailRetailRetailRetailRetailRetailRetailRetailRetailRetailRetailRetailRetailRetailRetailRetailRetail

EXHIBIT IIIPage 2
Oysho España, S.A.Grupo Massimo Dutti, S.A.Massimo Dutti Hellas, S.A.Massimo Dutti Deutschland, GmbHPull & Bear España, S.A.Pull & Bear Hellas, S.A.Pull & Bear Portugal Conf. Lda.Vajo, N.V.Kiddy´s Class España, S.A.Kiddy´s Class Portugal Conf. Lda.Bershka BSK España, S.A.Bershka Portugal Conf. Soc. Unip. Lda.��������������������Bershka Mexico, SA de CVBershka BSK Venezuela, S.A.Stradivarius España, S.A.Stradivarius Hellas, S.A.Stradivarius Portugal, Conf. Unip. Lda.��������������������Massimo Dutti Logística, S.A.Bershka Logística, S.A.Pull & Bear Logística, S.A.Zara Financiën B.V.Zara Mexico, B.V.Zara Holding, B.V.Massimo Dutti Holding, B.V.Zalapa, B.V.Zara Merken, B.V.Goa-Invest, S.A.SNC Zara France ImmobiliereZara Vastgoed, B.V.Vastgoed Asia, Ltd.SCI Vastgoed Ferreol P03302SCI Vastgoed France P03301SCI Vastgoed General Leclerc P03303SCI Vastgoed Nancy P03304Zara Vastgoed Hellas, S.A.Invercarpro, S.A.Robustae S.G.P.S. Unip. Lda.Inditex Cogeneración, AIEFibracolor Decoración, S.A.Fibracolor, S.A.Inditex, S.A.Zara Italia, B.V.Zara Nippon, B.V.Zara Italia, S.R.L.Zara, S.A.Zara, S.A.Brettos BRT España, S.A.Lefties España, S,A,
100.00%100.00%100.00%
50.00%100.00%100.00%100.00%100.00%100.00%100.00%100.00%100.00%100.00%
99.97%100.00%
90.05%91.05%90.05%
100.00%100.00%100.00%100.00%100.00%100.00%100.00%100.00%100.00%100.00%100.00%100.00%100.00%100.00%100.00%100.00%100.00%100.00%100.00%100.00%100.00%100.00%
39.97%39.97%
100.00%100.00%100.00%100.00%100.00%100.00%100.00%100.00%
SpainSpain
GreeceGermany
SpainGreece
PortugalBelgium
SpainPortugal
SpainPortugal
GreeceMexico
VenezuelaSpain
GreecePortugal
SpainSpainSpainSpain
HollandHollandHollandHollandHollandHolland
SpainFrance
HollandHong Kong
FranceFranceFranceFranceGreeceSpain
PortugalSpainSpainSpainSpain
HollandHolland
ItalySpain
ArgentinaSpainSpain
Global I.Global I.Global I.
Prop. I.Global I.Global I.Global I.Global I.Global I.Global I.Global I.Global I.Global I.Global I.Global I.Global I.Global I.Global I.Global I.Global I.Global I.Global I.Global I.Global I.Global I.Global I.Global I.Global I.Global I.Global I.Global I.Global I.Global I.Global I.Global I.Global I.Global I.Global I.Global I.Global I.
Carried by Equity�����������������
Global I.Global I.Global I.Global I.Global I.Global I.Global I.Global I.
01/31/0101/31/0101/31/0101/31/0101/31/0101/31/0101/31/0101/31/0101/31/0101/31/0101/31/0101/31/0101/31/0112/31/0001/31/0101/31/0101/31/0101/31/0101/31/0101/31/0101/31/0101/31/0101/31/0101/31/0101/31/0101/31/0101/31/0101/31/0101/31/0112/31/0001/31/0101/31/0112/31/0012/31/0012/31/0012/31/0001/31/0101/31/0101/31/0101/31/0112/31/0012/31/0001/31/0101/31/0101/31/0101/31/0101/31/0101/31/0101/31/0101/31/01
RetailRetailRetailRetailRetailRetailRetailRetailRetailRetailRetailRetailRetailRetailRetailRetailRetailRetail
LogisticsLogisticsLogisticsLogistics
Financial servicesFinancial servicesPortfolio companyPortfolio companyPortfolio company
Use of brand namesConstruction and real estate
Property developmentReal estateReal estateReal estateReal estateReal estateReal estateReal estateReal estateReal estate
Cogeneration plantDecoration
Textile purchase and treatmentInactive as of 01/31/01Inactive as of 01/31/01Inactive as of 01/31/01Inactive as of 01/31/01Inactive as of 01/31/01Inactive as of 01/31/01Inactive as of 01/31/01Inactive as of 01/31/01
Company Effective Owner-ship Interest Country Consolidation Method Year-End Business Line

INDITEX
2000 CONSOLIDATEDMANAGEMENT REPORT
B U S I N E S S P E R F O R M A N C E
Store Spain
ZaraPull & BearMassimo DuttiBershkaStradivarius
Total stores
Abroad Total
220165137
8387
692
22964612113
388
449229198104100
1,080
Number of stores as of January 31, 2001
In 2000 the GROUP continued to expand interna-tionally, opening new stores in countries in which it was already present and launching operations in new markets. At year-end there were over 1,000 stores operated by the Group or through a franchise, in 33 countries in three continents, as fol lows:
Translation of a report originally issued in Spanish.In the event of a discrepancy, the Spanish-language version prevails.
At year-end, compared with the previous year the
GROUP had 156 more stores with over 537,000
square meters of sales floor area, representing a
24% increase from 1999 year-end. The foregoing
table shows that for the first time Zara has more
stores abroad than in Spain.
Consolidated net sales grew by 28% to reach
���������������¤ 2,615 million). When comparing
the relative size of each market or each of the chains
composing the GROUP, the concept of store sales
should be introduced. The chains measure sales in
own or franchised stores at the retail price excluding
VAT and do not include other revenue items which
are included in net sales.
For the f irst t ime in the GROUP’s history its
foreign sales in own or franchised stores were higher
��������������������
The fo l lowing char t shows s to re sa les by ������������������
This chart shows that a large percentage of the
GROUP’s business is conducted abroad, particularly
in Europe: 77% of store sales are made in Europe
and only 23% in other continents. This emphasis
on Europe is not only patent in the revenues earned
but also in the supply chain: approximately 80%
of the goods sold by the GROUP’s stores in 2000
were made in Europe, with a large portion supplied
by Spain and Portugal.
The percentages of store sales for each of the
five store chains operated by INDITEX are as follows:
Zara is still the GROUP’s main driver. However, the
strong growth of the other store chains and the
inclusion of Stradivarius at 1999 year-end has
reduced Zara’s weight in the GROUP as a whole.
Stradivarius 3%
Bershka 5%
Pull & Bear 7%
Massimo Dutti 8%
Zara 77%
Spain 47%
Other 8%
America 15%
Rest of Europe 30%

Description 2000
Gross profit
Operating cash-flow (EBITDA)
Operating Income (EBIT)
Ordinary Income
Income before taxes (EBT)
Net consolidated income
Net income attributable (Net Income)
1999 % Variation
222,568
86,768
63,208
60,925
61,369
43,579
43,133
174,149
68,292
49,278
48,349
48,652
34,314
34,070
28%
27%
28%
26%
26%
27%
27%
Structure of income margins
In the first place, the consistent trends in all the margins
must be highlighted. Despite the large number of new
markets penetrated by the GROUP in recent years and the
associated launching expenses, its 14.5% operating margin
was very similar to that of prior years. Also noteworthy is
the fact that net income represented nearly 10% of sales.
Consolidated cash flows also grew at a similar rate.
Consolidated cash flow, which amounted to Ptas. 66,693
million (up 26% from 1999), is measured by adding net
income, fixed asset depreciation and amortization,
amortization of goodwill and provisions for contingencies
�������������
As in prior years, 2000 was characterized by the GROUP’s
clear role as an investor. Investments made from 1995
through 2000 totalized over Ptas. 200,000 million.
Nevertheless, the consolidated balance sheet reflects much
higher solvency levels than the average of European
companies of a similar size: the net debt at year-end was
approximately Ptas. 8,400 million, representing 4.3% of
consolidated equity per books, and financial leverage,
measured as the ratio of total assets to equity, came to 1.80
(1.98 in 1999). Working capital funds amounted to
approximately Ptas. 29,400 million as of January 31, 2000,
compared with the Ptas. 19,600 million recorded at 1999
year-end.
Regarding the Company’s return on equity, the following
chart shows the variations in recent years in net return on
average equity (ROE) and the return (EBIT) on average capital
employed (equity plus net financial debt).
Return on equity (ROE)
Return on capital employed (ROCE)
29%
35%37%
33% 34%
20%25% 25% 26% 25%
20001999199819971996
The margin generation structure did not undergo any noteworthy variations in 2000. Following is a summary of their growth in the format used in Exhibit I to the 2000 financial statements:
The GROUP’s records of return on equity and return on
capital employed have been extremely uniform. The slight
drop in ROCE in 1999 was due to the large investments
made in recent years, which is why a 34% recovery was
recorded in 2000. The decrease in ROE was a direct result
of the GROUP’s lower leverage in 2000.
In 2000 a new building was launched to house the GROUP’s
centralized corporate services and the centralized services
of the Zara chain. Work also commenced on the new Pull &
Bear logistics center in the municipality of Narón (A Coruña)
to which this chain’s centralized services will be transferred
in mid-2001. Lastly, land was acquired for the future
Stradivarius logistics center in Sallent (Barcelona). These
measures will soon provide all the GROUP units with platforms
which will ensure their future capacity for expansion.
In short, the GROUP established itself in 2000 as one of
the leading European fashion distributors, with a healthy
statement of income and balance sheet, providing it with
a solid base for future growth.

SALIENT EVENTS SUBSEQUENT TO YEAR-END
At the beginning of 2001 the GROUP carried on with its
normal activities. No significant event occurred between
January 31, 2001 and the date of preparation of the
consolidated financial statements and management report.
OUTLOOK FOR THE GROUP
In 2001 the Directors expect the GROUP to increase its
presence in the markets already penetrated, and to begin
operating in new arenas. The prospects for growth are
bright, both for the GROUP as a whole and for each of the
chains composing it.
The second half of 2001 will see the inauguration of the
first stores of a new distribution chain created by the GROUP
for retail sales of lingerie and other undergarments. These
items, as in the case of the GROUP’s other labels, will be
distributed internationally.
RESEARCH AND DEVELOPMENT ACTIVITIES
The INDITEX GROUP did not perform, is not performing,
and has not engaged third parties to perform, any research
and development projects, deemed to be those in which
investments were made over several years for the development
of products on which a return is expected, which should be
computed ovr more than one year.
However, since the GROUP was created, its management
has been based on the application of available technology
in all its business areas to improve manufacturing and
distribution processes, and on the development through its
own means or the assistance of third parties of tools to
facilitate business management. Some of these tools are
point-of-sale terminals, inventory administration and
management systems, allocation systems at distribution
centers, store communications systems or machines for
labeling clothes in stores. The GROUP has not capitalized
any amount relating to the costs incurred in these
�������������
On the other hand, the GROUP is aware of how important
the Internet could become as a distribution channel in its
field of operations. Although the Directors do not regard it
as an imminent threat, the Company has a team which
works full-time on the development of the GROUP’s web
sites, the analysis of opportunities that might arise and the
harmonization of corporate strategy in this field.
ACQUISITION OF TREASURY STOCK
In July 2000 the Controlling Company acquired 706,600
own shares, representing 0.12% of its capital stock, from
one of its shareholders. Accordingly, as of January 31, 2001,
the GROUP’s Parent Company had 1,446,600 own shares,
representing 0.23% of its capital stock, at a cost of Ptas.
������������


INDITEX S.A. Edificio Inditex, Avenida de la Diputación 15.142 Arteixo. A Coruña. España
telf. +34 981 18 54 00 fax. +34 981 18 54 54
www.inditex.com