annual report inditex 2005
DESCRIPTION
Annual Report Inditex 2005TRANSCRIPT

Economic and Financial Performance
ANNUAL REPORT 2005
1 pag LIBROS INGLÉS.qxp 27/6/06 09:14 Página 1

fondos2-3 26/6/06 14:00 Página 1

fondos2-3 26/6/06 14:00 Página 2

indices INGLES 1 Y 3.qxp 27/6/06 09:17 Página 2
1 Chronology of the Year 07
2 The Costumer, the Focus of Inditex´s Activities 152.1 The costumer, at the hearth of Inditex 2.2 The costumer care model2.3 Main Indicators
3 Key Data 233.1 Seasonal nature of business in 2005
4 International Expansion 294.1 International presence4.2 Geographic sales distribution4.3 Own store growth
5 Sales by Format 375.1 Analysis by format
6 Stock Market 45
7 Other Indicators of Financial Activity 517.1 Gross Margin7.2 Working capital trends7.3 Staff Costs7.4 Providers of capital7.5 Taxes7.6 Reserve variations
8 Auditors´ Report and Consolidated Annual Accounts 578.1 Consolidated income statement8.2 Consolidated balance sheet8.3 Consolidated statement of cash flows8.4 Consolidated statement of changes in equity8.5 Consolidated annual accounts
9 Consolidated Management Report 1119.1 Consolidated Financial Statements9.2 Comments on the consolidated results9.3 Comments on the balance sheet9.4 Comments on the cash flow statement9.5 Start of FY20069.6 Board of Directors agreement9.7 Other subjects
Economic and FinancialPerformance
indices INGLES 1 Y 3.qxp 30/6/06 14:07 Página 3

4-Cronologia eng.qxp 27/6/06 13:22 Página 6

1Chronology of the Year
4-Cronologia eng.qxp 29/6/06 11:18 Página 7

FINANCIAL PERFORMANCE INDITEX 20058
03.19.05
04.15.05
02.24.05
03.03.05
03.11.05
03.11.05
05.09.05
4-Cronologia eng.qxp 27/6/06 13:22 Página 8

FINANCIAL PERFORMANCE INDITEX 2005 9
4-Cronologia eng.qxp 27/6/06 13:22 Página 9

FINANCIAL PERFORMANCE INDITEX 200510
06.16.05
10.14.05
09.01.05
10.31.05
09.05.05
4-Cronologia eng.qxp 27/6/06 13:23 Página 10

FINANCIAL PERFORMANCE INDITEX 2005 11
06.13.05
4-Cronologia eng.qxp 27/6/06 13:23 Página 11

12.14.05
11.28.05
01.31.06
11.23.05
4-Cronologia eng.qxp 27/6/06 13:24 Página 12

FINANCIAL PERFORMANCE INDITEX 2005 13
4-Cronologia eng.qxp 27/6/06 13:24 Página 13

14-21 El Clienteok2_EN.qxp 27/6/06 09:29 Página 14

2The Customer,
the Focus of Inditex’sActivities
14-21 El Clienteok2_EN.qxp 27/6/06 09:29 Página 15

FINANCIAL PERFORMANCE INDITEX 200516
The Inditex model is built
around the customer. Each of
the elements comprising the
company’s value chain, from
designing collections to its
logistics capacity, make sense
only on this basis
14-21 El Clienteok2_EN.qxp 29/6/06 11:20 Página 16

FINANCIAL PERFORMANCE INDITEX 2005 17
THE CUSTOMER, AN ESSENTIAL REFERENCE FOR THE INDITEX MODEL
The customer is the focus of Inditex’s activities, and it is only through the customer that the
company’s business model - from design to sales, through manufacture and logistics - can be
explained and defined. This approach sets the Group apart and directs its growth.
In order to be able to respond adequately to consumer’s real demands, Inditex proposed a
profound transformation of the business organisation from the beginning. In contrast with the
horizontally organised model in which each stage was followed by the next and the customer
was no more than the end recipient of a commercial offering, Inditex proposed an integrated
model with the customer as the main source of information for decision-making in every area.
IInntteeggrraatteedd PPrroocceessss
In this integrated model, the designers work dynamically, partly based on analyses of
customers’ reactions to the fashion on offer in the stores. Of course, their suggestions,
opinions and specific demands regarding the products they would like to find in them are also
taken into account. Production is organised as a function of the pace set by the commercial
department, which manages the information from the stores. In view of the importance of the
time factor for the market response to be truly effective, the concept of production in proximity
becomes quite important. Finally, the logistics operation is at the store’s service. The stores self-
regulate the flow of products constantly supplied by the logistics centres.
The store thus becomes the centre of the whole operation, since this is where customer
contact takes place. This is why the Inditex Group makes such a great effort to ensure both
that it has the best locations and that its designs and image - — window dressing, interior
design and coordination -— provide an environment which will make the purchase
experience enjoyable.
14-21 El Clienteok2_EN.qxp 27/6/06 09:29 Página 17

FINANCIAL PERFORMANCE INDITEX 200518
THE CUSTOMER, AT THE HEART OF INDITEX
The customer’s reality influences fundamental elements of the operation, such as:
2.1
a) Commercial decision-making
The configuration of our collections is not based primarily on the analysis of production
costs, volume or sales for a specific design. Our offering is based on short series of lar-
ge numbers of references, allowing us to constantly adapt to demand on the one
hand, while avoiding saturating the market with a specific design on the other.
Decisions are ultimately based on the customers’ interests.
b) Product Design
Inditex’s stores contain a broad and constantly
changing variety of designs. This fashion offering reflects
what customers want. In order to achieve this, our
designers work closely with our sales teams, and our sales
teams are in close contact with our store teams. This way,
collections are constantly changing in accordance with
the information received from the market.
c) Choice of locations
The logic underlying the location of our stores is
also focused on our customers, both from an urban
mobility point of view and from the perspective of
our cities’ aesthetic appearance. The locations
chosen for Inditex Group stores are always central,
visible and easily accessible. These criteria turn our
stores into an outstanding element of cities’
commercial layout. At the same time, Inditex has
placed great emphasis on the recovery of remarkable
buildings, combining its commercial activities with
improving the beauty of city centres and conserving
heritage, two aspects which are highly valued by our
customers.
d) Supply and Production Organisation
The Inditex supply structure is designed for greater flexibility and speed
in the manufacture of the products demanded by customers. The production
in proximity concept - which represents 50% of the total - ensures this quick
response. Products with a greater fashion component are manufactured in the
Group’s own factories or by suppliers whose processes are significantly integrated with
the Group’s dynamics. This enables us to place a design in the market in record time.
14-21 El Clienteok2_EN.qxp 27/6/06 09:29 Página 18

FINANCIAL PERFORMANCE INDITEX 2005 19
Product
Marketin
Store
Desi
gn
Production
Logistics
Sale
sDe
part
m
ent
CUSTOMERS
e) Logistics Management
In contrast with traditional logistics models in which the flow of products to distribution
points is determined by a central sales department, Inditex logistics centres are at the stores’
service or, to put it another way, at the service of the customers’ demands. At Inditex, logistic
efficiency is measured on the basis of the effectiveness of our immediate response to
the needs of each store.
f) Image ManagementIn the customer relation model practised by Inditex,
communication with customers takes place almost
exclusively through the stores themselves. The
absence of advertising tools is due to the fact that
Inditex does not aim to encourage purchases of a
particular item but rather tries to interpret the
customers’ wishes. In this model, brand
image is linked to store image, since the
stores are the space in which customers
and fashion meet. Inditex’s only
advertising campaign is its shop
windows, whose function is to
transmit to the outside world the
constantly changing selection of
products available inside.
g) Store Design
The store’s internal structure,
layout and interior design are
designed to enable direct and
unrestricted contact between the
customer and the product. At the
same time, the store must provide
a comfortable environment which
will make the purchase experience
enjoyable.
14-21 El Clienteok2_EN.qxp 27/6/06 09:29 Página 19
FINANCIAL PERFORMANCE INDITEX 200520
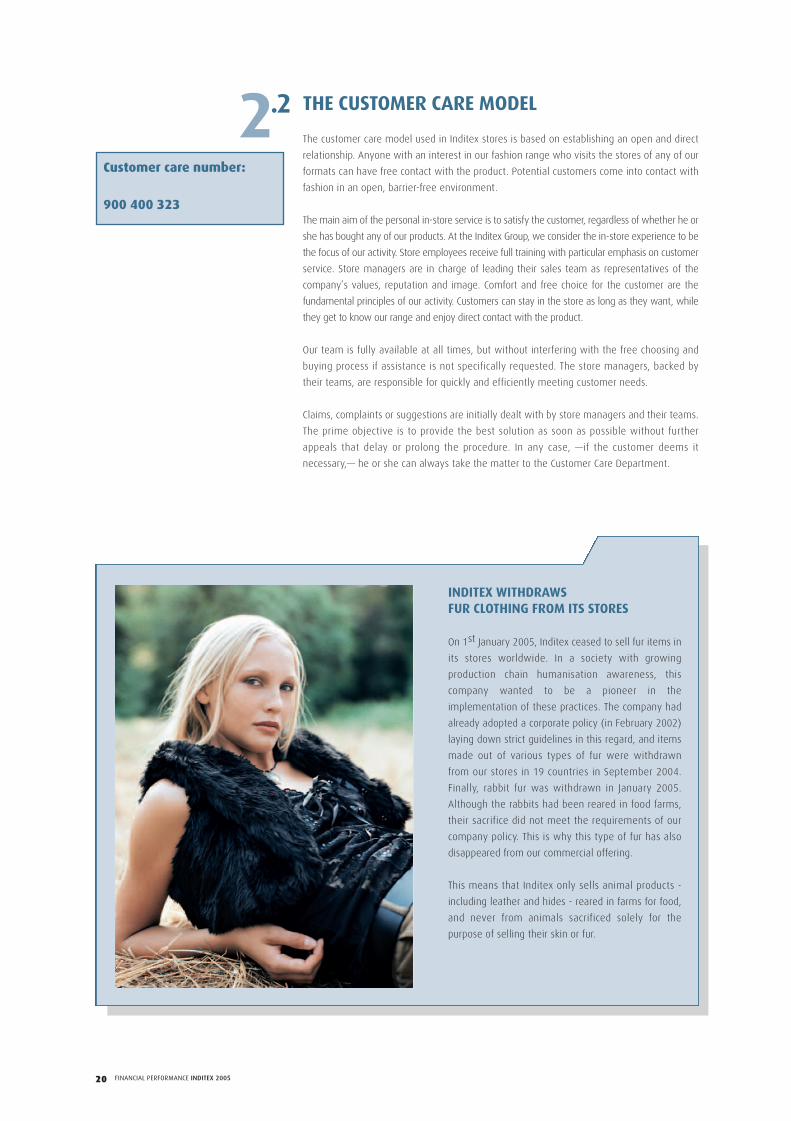
2.2 THE CUSTOMER CARE MODEL
The customer care model used in Inditex stores is based on establishing an open and direct
relationship. Anyone with an interest in our fashion range who visits the stores of any of our
formats can have free contact with the product. Potential customers come into contact with
fashion in an open, barrier-free environment.
The main aim of the personal in-store service is to satisfy the customer, regardless of whether he or
she has bought any of our products. At the Inditex Group, we consider the in-store experience to be
the focus of our activity. Store employees receive full training with particular emphasis on customer
service. Store managers are in charge of leading their sales team as representatives of the
company’s values, reputation and image. Comfort and free choice for the customer are the
fundamental principles of our activity. Customers can stay in the store as long as they want, while
they get to know our range and enjoy direct contact with the product.
Our team is fully available at all times, but without interfering with the free choosing and
buying process if assistance is not specifically requested. The store managers, backed by
their teams, are responsible for quickly and efficiently meeting customer needs.
Claims, complaints or suggestions are initially dealt with by store managers and their teams.
The prime objective is to provide the best solution as soon as possible without further
appeals that delay or prolong the procedure. In any case, —if the customer deems it
necessary,— he or she can always take the matter to the Customer Care Department.
INDITEX WITHDRAWS FUR CLOTHING FROM ITS STORES
On 1st January 2005, Inditex ceased to sell fur items in
its stores worldwide. In a society with growing
production chain humanisation awareness, this
company wanted to be a pioneer in the
implementation of these practices. The company had
already adopted a corporate policy (in February 2002)
laying down strict guidelines in this regard, and items
made out of various types of fur were withdrawn
from our stores in 19 countries in September 2004.
Finally, rabbit fur was withdrawn in January 2005.
Although the rabbits had been reared in food farms,
their sacrifice did not meet the requirements of our
company policy. This is why this type of fur has also
disappeared from our commercial offering.
This means that Inditex only sells animal products -
including leather and hides - reared in farms for food,
and never from animals sacrificed solely for the
purpose of selling their skin or fur.
Customer care number:
900 400 323
14-21 El Clienteok2_EN.qxp 29/6/06 11:22 Página 20

WEBSITE HITS
Stradivarius 3.8%Zara Home 2.3%
Oysho 1.5%
Massimo Dutti 5.7%Pull and Bear 5.5%
Bershka 7.1%Inditex 8.7%
Zara 65.5%
A. PERCENTAGE PER CHAIN
Pull and Bear 3.3%Stradivarius 2.6%
Oysho 1.1%
Zara 26.4%Massimo Dutti 16.8%Zara Home 5.4%
Bershka 20.6%Inditex 23.8%
B. PERCENTAGE PER COUNTRY OF ORIGIN
Venezuela 2%Germany 1%
India 1%
United Kingdom 4%
Portugal 2 %France 2%Italy 2%
Other 41%Spain 34%
United States 4%Mexico 7%
CUSTOMER QUERIES RECEIVED BY E-MAIL
FINANCIAL PERFORMANCE INDITEX 2005 21
MAIN INDICATORS
Number of customers
Inditex does not monitor the number of customers who visit its stores. However, other
indicators may help provide an idea of their number:
� In 2005, a total of 429 million items were sold in the group’s stores.
� Inditex has its own payment method in Spain: the Affinity card. As at 31st January
2006, 639,977 customers had an Affinity card.
Degree of customer satisfaction
The ease with which products can be exchanged and returned is one of the services our
customers value most highly. The volume of such transactions should therefore be interpreted
not as a customer satisfaction problem but as an indicator of the success of this policy.
As far as complaints about the service and the products are concerned, a total of 2,762
complaint forms were submitted to the Spanish Consumer Protection authorities in 2005
(Spain accounts for 43% of the Inditex Group’s turnover). This is 0.002 % of transactions
carried out in Spain.
2.3
Both Inditex and the Group’s formats have
customer care systems, which they make
available to customers through their
respective websites (see the table). In
2005, our websites received a total of
17,570,551 hits.
In 2005, we received a total of 51,228
customer communications using the forms
available on the websites. They all received
individual answers. Out of this total, 7,337
related to various service or product-related
problems. This is 0.003% of the number of
transactions worldwide. All other
communications received in this way were
requests for information regarding our
various chains’ commercial activities, such
as store location, new openings or requests
for catalogues, or relating to corporate
aspects concerning the Inditex Group.
The Inditex Customer Care department for
Spain, on its part, received a total of 12,803
phone calls in 2005, all of which were
attended individually. The Group has in
Spain a special freephone Customer Care
number (900 400 323), as well as a general
number for each chain’s head office.
Group Websites:
www.inditex.comwww.zara.comwww.pullandbear.comwww.massimodutti.comwww.bershka.comwww.e-stradivarius.comwww.oysho.comwww.zarahome.com
14-21 El Clienteok2_EN.qxp 27/6/06 09:29 Página 21

22-27- Datos clave_EN.qxp 27/6/06 09:51 Página 22

FINANCIAL PERFORMANCE INDITEX 2005 23
3Key Data
22-27- Datos clave_EN.qxp 27/6/06 09:51 Página 23
FINANCIAL PERFORMANCE INDITEX 200524
The turnover for 2005
was €6,741 million,
making Inditex one
of the world leaders
in the fashion retail
industry.
Its net profit rose
by 26% to €803 million
22-27- Datos clave_EN.qxp 29/6/06 11:23 Página 24

6,740.8
5,568.6
05 04
Sales:+21%millions of euros
803.2
638.5
05 04
Net profit:+26%millions of euros
2,920.9
2,393.3
05 04
Equity:+22%millions of euros
1,459.3
1,227.4
05 04
EBITDA:+19%millions of euros
1,093.6
922.0
05 04
EBIT:+19%millions of euros
41%
42%
05 04
ROCE:41%
30%
29%
05 04
ROE:30%
FINANCIAL PERFORMANCE INDITEX 2005 25
SALES GROWTH OVER 15% IN ALL FORMATS
Inditex is the fashion distribution group which owns Zara, Kiddy’s Class, Pull and Bear, Massimo
Dutti, Bershka, Stradivarius, Oysho and Zara Home. Its consolidated turnover for 2005 was
€6,741 million, 21% more than in 2004, and its net profit was €803 million, a 26% increase,
which established it as one of the world’s largest companies in its sector. As at 31st January
2006, the Group owned 2,692 stores in 62 countries in Europe, America, the Asia-Pacific
Region, the Middle East and North Africa.
In addition to this increased activity resulting from a 5% sale increase in comparable stores
(stores which have been open for more than two years) and a 22% selling area increase, its
gross returns rose by 56.2% as compared with the previous year’s 55.4%.
With an overall selling area increase of more than 250,000 m2 in 2005 and a total of 448 new
stores (the highest figure in the company’s history), each of Inditex’s eight formats have
increased their sales by over 15%, with a particularly high increase in the Group’s youngest
formats. Thus, Stradivarius and Oysho saw sales increases of over 40%, and Zara Home, —
which has been in the market for less than three years,— went up by over 90%. In spite of
having increased its selling area by 82% in 2005, Zara Home managed to raise its return on
capital employed to 3%. The global average return for other formats was 41%. At the end of a
year of serious expansion focused on the main European markets, its net margin rose by 40
basis points, at 11.9% of sales, continuing the previous year’s rising trend.
MAIN INDICATORS (millions of euros)
Var 2005 2004 05/04
Results:
Sales 6,740.8 5,568.6 21%
EBITDA 1,459.3 1,227.4 19%
EBIT 1,093.6 922 19%
Attributed net profit 803.2 638.5 26%
Other indicators:
Net assets 2,920.9 2,393.3 22%
Net financial position 703.1 488.9
Stores:
Number of stores at year-end 2,692 2,244
Net openings 448 322
Number of countries with stores opened 62 57
Other relevant information:
% of sales in international stores 56.9% 54.5%
Variation of like-for-like sales 5% 9%
Return on Equity (ROE) 30% 29%
Return on Capital Employed (ROCE) 41% 42%
No. of employees 58,190 47,046
We have only included a comparison with 2004 due to the
implementation of the IFRS (International Financial Repor-
ting Standards). A comparison with previous years in accor-
dance with the Spanish General Accounting System can be
found in the 2004 Report, available on our website:
www.inditex.com
22-27- Datos clave_EN.qxp 29/6/06 11:23 Página 25

SEASONAL NATURE OF BUSINESS IN 2005
The percentage of sales and the year’s profit in each quarter of the year are not uniform. The
seasonal nature of sales due to the effect of climate on consumption means that a higher
proportion of sales and the majority of profit are generated during the second half of the year.
This second half (from 1st August to 31st January) coincides with the autumn-winter season in
the Northern Hemisphere, where the vast majority of Inditex outlets are located.
3.1
% EBIT PER QUARTER 04 - 05
17%
17%
15%
14%
34%
35%
34%
34%
05 04
1 Q
05 04
2 Q
05 04
3 Q
05 04
4 Q
SALES PER QUARTER 04 - 05
21%
21%
21%
21%
27%
28%
31%
30%
05 04
1 Q
05 04
2 Q
05 04
3 Q
05 04
4 Q
millions of euros
22-27- Datos clave_EN.qxp 27/6/06 09:51 Página 26

FINANCIAL PERFORMANCE INDITEX 2005 27
22-27- Datos clave_EN.qxp 27/6/06 09:51 Página 27

28-35 - Exp interna_EN.qxp 27/6/06 09:57 Página 28

4International
Expansion
28-35 - Exp interna_EN.qxp 27/6/06 09:57 Página 29

FINANCIAL PERFORMANCE INDITEX 200530
The multiple format
expansion strategy is
focused on the European
continent, where Inditex
already had over 2,300
stores at year-end, with
particular emphasis on
opportunities arising in
the Asia-Pacific region
28-35 - Exp interna_EN.qxp 29/6/06 11:24 Página 30

FINANCIAL PERFORMANCE INDITEX 2005 31
INTERNATIONAL EXPANSION AND GROWTH
Of the 448 stores opened during the year, 308 are in international markets. These represent
69% of all openings for the year and are mostly in 44 countries. Of these, Inditex stores were
opened for the first time in Monaco, Costa Rica, Indonesia, the Philippines and Thailand.
As a result of this expansion, sales in international stores rose to 56.9% of the total, as
compared to the previous year’s 54.5%. All chains increased their sales percentage outside
Spain, led by Zara’s 68.9%.
EuropeMost of the new stores were in European markets, which accounted for up to 82% of net
openings (366 new stores). As a result, the Group passed the 2,000-store mark in Europe, with
2,309 European stores as at 31st January 2006.
The European countries (apart from Spain) with the largest number of openings were Portugal
(54), Italy (37, thus doubling the number of stores it had the previous year), Greece, (27),
France (21), the UK (15), Ireland (11), Germany (10) and Russia (10).
Asia-Pacific Region With regard to the Asia-Pacific Region, the new stores resulted in a 75% increase in Inditex
selling area in that region. This reflects the Group’s serious commitment to growth in these
markets. The 19 Inditex stores opened at the end of 2004 had thus become 33 in January
2006. The first stores opened in Indonesia, the Philippines and Thailand were of particular
significance. In 2006, this expansion has continued with our first opening in the Chinese
mainland and the announcement of two more stores in China and the first Korean store.
Other Areas Outside the European and Asian markets, Inditex has also increased its presence in all the
geographic areas in which it operates. Thus, the American continent had a total of 211
stores with 28 net openings. The company opened 40 stores in the Middle East and North
Africa, adding up to 139 stores in total.
Number of storesas at 31st January 2006
Openings in 2005
Zara 852 129
Kiddy’s Class 149 20
Pull and Bear 427 56
Massimo Dutti 369 43
Bershka 368 66
Stradivarius 263 36
Oysho 154 50
Zara Home 110 48
Total 2,692 448
28-35 - Exp interna_EN.qxp 27/6/06 09:57 Página 31

FINANCIAL PERFORMANCE INDITEX 200532* Data at 01.31.06
INTERNATIONAL PRESENCE 4.1
28-35 - Exp interna_EN.qxp 29/6/06 11:32 Página 32

FINANCIAL PERFORMANCE INDITEX 2005 33
28-35 - Exp interna_EN.qxp 29/6/06 11:32 Página 33

FINANCIAL PERFORMANCE INDITEX 200534
PERCENTAGE OF SALES IN INTERNATIONAL STORES
2005Format 2004
Zara 68.9% 65.8%
Kiddy’s Class 14.0% 12.8%
Pull and Bear 33.2% 30.2%
Massimo Dutti 45.6% 41.9%
Bershka 41.5% 35.7%
Stradivarius 17.4% 15.4%
Oysho 31.8% 31.5%
Zara Home 23.0% 12.7%
Group Total 56.9% 54.5%
GEOGRAPHIC SALES DISTRIBUTIONEuropean sales still form the Group’s main international sales, with a percentage of over 80%
of the total. Significantly, sales in this area (not counting Spain) have risen by 1.6 percentage
points, to 38.7% of the total. The relative weight of Spanish sales has thus dropped from 45.5%
in 2004 to 43.1% this Financial Year, due to the greater weight of European sales. This trend will
continue in the next few years.
The relative weight of sales in the Rest of the
World has also increased, rising from 6.7% in
2004 to the 7.5% reached in 2005. Although
its presence in the region is still relatively
modest in absolute terms, it is undoubtedly a
very attractive business opportunity. In
addition to being the world’s largest market in
terms of population, these countries are and
will continue to be among the fastest growing
economies. Our interest in increasing our
weight in the region is partly due to Zara’s
commercial experience in the region, where
there is great interest in fashion.
4.2
SALES PER GEOGRAFIC AREA
10.7
10.6
7.5
6.7
38.7
37.2
43.1
45.5
SpainTheAmericas
Asia Rest of Europe
05 04 05 04 05 04 05 04
05 04 03 02 01
NUMBER OF STORES 01 - 05
1,284
1,558
1,922
2,244
2,692
05 04 03 02 01
NUMBER OF COUNTRIES 01 - 05
39
44
48
57
62
28-35 - Exp interna_EN.qxp 29/6/06 11:34 Página 34

FINANCIAL PERFORMANCE INDITEX 2005 35
PERCENTAGE OF SALES IN OWN AND FRANCHISED STORES
Ownmanagement
Franchises Ownmanagement
FranchisesFormat2005 2004
Zara 90% 10% 91% 9%
Kiddy’s Class 100% 0% 100% 0%
Pull and Bear 91% 9% 91% 9%
Massimo Dutti 72% 28% 68% 32%
Bershka 97% 3% 98% 2%
Stradivarius 82% 18% 82% 18%
Oysho 98% 2% 98% 2%
Zara Home 96% 4% 100% 0%
Total 89% 11% 90% 10%
NUMBER OF OWN AND FRANCHISED STORES
Ownmanagement
Franchises Total TotalOwnmanagement
FranchisesFormat2005 2004
Zara 770 82 852 649 74 723
Kiddy’s Class 149 149 129 129
Pull and Bear 380 47 427 333 38 371
Massimo Dutti 275 94 369 228 98 326
Bershka 351 17 368 295 7 302
Stradivarius 208 55 263 183 44 227
Oysho 149 5 154 102 2 104
Zara Home 100 10 110 62 62
Total 2,382 310 2,692 1,981 263 2,244
OWN STORE GROWTH
The growth of Inditex’s sales formats is largely due to the opening of stores managed by
companies in which Inditex is the sole or main shareholder. As at 31st January 2006, 88% of
stores were managed by the company and represented 89% of total sales. At the end of
2005, there were 310 franchises.
In 2005, Inditex acquired 100% of the share capital in Zara Japan, the company through
which it conducts its operations in Japan. Japan, the Asia-Pacific country where the Group is
most firmly established, will continue to be one of the main focuses for future growth.
Inditex has also acquired 100% of Zara Russia (the company which operated the brand as a
franchise) and most of the capital in Zara Poland (also previously operated under a
franchise agreement). In the same lines, the Group reached an agreement in March 2006 to
increase its stake in its German subsidiary Zara Deutschland to 78%. As at 31st January
2006, Inditex had 18 stores in Japan, 14 in Russia, 12 in Poland and 46 in Germany.
4.3
28-35 - Exp interna_EN.qxp 27/6/06 09:57 Página 35
36-43 - Ventas_EN.qxp 27/6/06 10:02 Página 36

FINANCIAL PERFORMANCE INDITEX 2005 37FINANCIAL PERFORMANCE INDITEX 200537
5Sales by Format
36-43 - Ventas_EN.qxp 27/6/06 10:03 Página 37

FINANCIAL PERFORMANCE INDITEX 200538
All store formats have
experienced significant
sales increases.
With an investment plan
of over €800 million in
2005, Inditex opened
448 new stores in 2005,
70% of them outside
Spain
36-43 - Ventas_EN.qxp 29/6/06 11:40 Página 38

FINANCIAL PERFORMANCE INDITEX 2005 39
SALES BY FORMAT
Although each sales format has its own particular characteristics as far as target audience,
business line and store design are concerned, all the chains have one common feature: a
fashion offering with an emphasis on design, aimed at meeting customer demands at
competitive prices.
The different level of development of each Inditex format is reflected both in its sales volume
and weight within the Group, and in the level of internationalisation reached, as shown in the
tables and graphs in the following pages.
Zara is still the format with the highest sales percentage. The tables also show this growth for
the most recent formats, such as Zara Home and Oysho, which grew by 93% and 49%
respectively in 2005.
Below is an individual analysis of each format’s behaviour during the whole of 2005. The
Return on Capital Employed, which reached an average of 41% for the Group, is also shown.
Sales by format(millions of euros)
FORMAT 2005 2004 Var %05/04
Zara 4,440.8 3,759.7 18%
Kiddy’s Class 155.4 120.6 29%
Pull and Bear 445.1 367.2 21%
Massimo Dutti 533.8 458.4 16%
Bershka 639.4 508.8 26%
Stradivarius 341.1 241.9 41%
Oysho 107.0 71.7 49%
Zara Home 78.1 40.4 93%
Totals 6,740.7 5,568.7 21%
(%) on total sales
2005 2004
65.9% 67.5%
2.3% 2.2%
6.6% 6.6%
7.9% 8.2%
9.5% 9.1%
5.1% 4.3%
1.5% 1.3%
1.2% 0.8%
100.0% 100.0%
ANALYSIS BY FORMAT5.1
36-43 - Ventas_EN.qxp 27/6/06 10:03 Página 39

FINANCIAL PERFORMANCE INDITEX 200540
Kiddy’s Class used the year to continue to expand in the two markets in which it
operates, opening 16 new stores in Spain and four in Portugal. At year-end, the children’s
chain had 149 stores in the two Iberian countries’ most important cities. Their selling area
added up to 28,999 m2, 15% more than a
year earlier. The 2005 Return on Capital
Employed figure was 67%, and the EBIT
margin rose by 130 basis points.
Kiddy’s Class sales for 2005 were €155.4
million, a 29% rise with respect to 2004
and 2.3% of the Group’s total.
KIDDY’S CLASS 2005 2004 05/04
Net sales(*) 155.4 120.6 29%
EBIT (*) 28.8 20.8 39%
EBIT margin 18.5% 17.2% -
Stores 149 129 20
ROCE (%) 67% 59% -
Zara attained a store presence in 59 countries as at 31st January 2006, with 852 stores. It had
129 net openings in 2005, including its first stores in Monaco, Costa Rica, the Philippines and
Indonesia, which were also new markets for the Group. The growth effort was directed at the
international markets, with 111 new shops outside Spain. In total, Zara increased its number of
stores in 35 countries, reaching a total selling area of 961,791 m2, 19% more than a year earlier.
This growth was particularly significant in Italy and the UK, with 13 and 12 new storesrespectively,
as well as in Germany (8 openings in 2005),
France (7 new stores) and Japan (6 openings).
All these markets are key to the company’s
growth.
In 2005, Zara’s sales rose to €4,440.8 million,
representing 65.9% of the Group’s total.
ZARA 2005 2004 05/04
Net sales(*) 4,440.8 3,759.7 18%
EBIT (*) 712.1 654.2 9%
EBIT margin 16.0% 17.4% -
Stores 852 723 129
ROCE (%) 41% 42% -
(*) Millions of euros
(*) Millions of euros
36-43 - Ventas_EN.qxp 27/6/06 10:03 Página 40

FINANCIAL PERFORMANCE INDITEX 2005 41
Pull and Bear exported its concept of
affordable fashion with young designs to
four new markets in 2005 - Italy, France,
Turkey and the Czech Republic - thus
continuing its current growth and expansion
rate outside the Spanish market, mostly in
the European markets.
The Pull and Bear formula is receiving a particularly good response in the first of these
countries, Italy, where seven new stores opened, including the first ones in Milan, Rome and
Turin. A total of 56 stores were opened in 13 countries, increasing the format´s store area by
29% to 95,179 m2. As at 31st January 2006, Pull and Bear had over 427 stores in 23
countries.
Its turnover was €445.1 million, 6.6% of the total for the Inditex Group and 21% more than the
total sales for 2004. It has a Return on Capital Employed of 47% and an EBIT margin close to 17%.
PULL AND BEAR 2005 2004 05/04
Net sales(*) 445.1 367.2 21%
EBIT (*) 75.3 52.2 44%
EBIT margin 16.9% 14.2% -
Stores 427 371 56
ROCE (%) 47% 41% -
MASSIMO DUTTI 2005 2004 05/04
Net sales(*) 533.8 458.4 16%
EBIT (*) 68.8 67.6 2%
EBIT margin 12.9% 14.7% -
Stores 369 326 43
ROCE (%) 27% 43% -
Massimo Dutti started its South East Asia presence in 2005, with the opening of its
first stores in Singapore and Thailand. Until then, the Group only had Zara stores in that area.
The third new market entered by this format in 2005 was Ireland, in this case as part of its
gradual European growth strategy.
In 2005, Massimo Dutti carried out a total of 43 net openings in 18 countries, extending its
presence to a total of 369 stores in 27 countries.
Its selling area increased by 30% to 103,816 m2.
Massimo Dutti reached €533.8 million in sales, representing 7.9% of the Group’s total.
(*) Millions of euros
(*) Millions of euros
36-43 - Ventas_EN.qxp 27/6/06 10:03 Página 41

FINANCIAL PERFORMANCE INDITEX 200542
Stradivarius continued its international growth strategy and opened 36 new stores in
2005. As at 31st January 2006, it had 263 shops in 14 countries. This year, it extended its
presence to four new markets: Russia, Greece, Lebanon and Turkey. Its selling area at the end
of the financial year was 67,297 m2, 17% more than the previous year.
This chain, which is aimed at a young female target audience, achieved sales of €341.1
million, a 41% increase over 2004. This
figure was 5.1% of the sales for the whole
Group. Its Return on Capital Employed was
82%, and its gross operating profit rose by
128%, reaching a 24.5% margin as
compared with the previous year’s 15.2%
STRADIVARIUS 2005 2004 05/04
Net sales(*) 341.1 241.9 41%
EBIT (*) 83.7 36.7 128%
EBIT margin 24.5% 15.2% -
Stores 263 227 36
ROCE (%) 82% 41% -
BERSHKA 2005 2004 05/04
Net sales(*) 639.4 508.8 26%
EBIT (*) 98.9 74.8 32%
EBIT margin 15.5% 14.7% -
Stores 368 302 66
ROCE (%) 42% 47% -
Bershka had a total of 368
stores in 20 countries as at 31st
January 2006, having opened 66
new shops in 17 countries during
2005. In six of these markets it had
only started to operate the
previous year: Poland, Ireland,
Turkey, the Czech Republic, Saudi
Arabia and Malta. In Europe, its
growth was particularly significant
in countries such as France and
Italy, where it opened 10 and 5 new stores respectively.
Its selling area increased by 24% to 130,495 m2. The chain reached sales of €639.4 million, which
made it the Group’s second largest format (after Zara) by turnover, with 9.5% of the total.
(*) Millions of euros
(*) Millions of euros
36-43 - Ventas_EN.qxp 27/6/06 10:03 Página 42

FINANCIAL PERFORMANCE INDITEX 2005 43
Zara Home went from having a
presence in six countries to having stores in
14 markets at the end of 2005, with a
great response in every new market it
penetrates.
Following its 48 openings in 2005, this
chain specialising in home furnishings and
decoration now has 110 stores. The new
markets penetrated by Zara Home in 2005
were Italy, Belgium, the United Arab
Emirates, Saudi Arabia, Kuwait, Turkey,
Andorra and Cyprus. The chainís selling area
grew by 82%, to 25,978 m2.
Zara Home’s sales for 2005 were €78.1
million, 93% more than the previous year.
This figure represented 1.2% of the total
Inditex Group sales for 2005.
ZARA HOME 2005 2004 05/04
Net sales(*) 78.1 40.4 93%
EBIT (*) 1.4 0.2 652%
EBIT margin 1.8% 0.5% -
stores 110 62 48
ROCE (%) 3% 1% -
Oysho opened 50 new stores in 2005, and closed the year with 154 stores in 10
countries. During the year, it opened its first stores in the United Arab Emirates, Turkey and
Lebanon. From the countries in which Oysho increased its number of shops, Italy - where its
formula based on lingerie and comfortable clothes to wear around the house is attracting
Italian consumers’ interest - and Mexico,
are particularly noteworthy. Six stores were
opened in each of these two countries.
Greece in turn saw the opening of four new
shops.
The chain’s selling area increased by 52%
to 21,197 m2, and it reached sales of €107
million, accounting for 1.6% of all Inditex
sales, with a 50% Return on Capital
Employed.
OYSHO 2005 2004 05/04
Net sales(*) 107.0 71.7 49%
EBIT (*) 24.5 15.5 58%
EBIT margin 22.9% 21.7% -
Stores 154 104 50
ROCE (%) 50% 51% -
(*) Millions of euros
(*) Millions of euros
36-43 - Ventas_EN.qxp 27/6/06 10:04 Página 43

44-49 desarrlloEN.qxp 27/6/06 10:20 Página 44

6Stock Market
44-49 desarrlloEN.qxp 27/6/06 10:20 Página 45

FINANCIAL PERFORMANCE INDITEX 200546
Inditex’s shares
rose by 30.2%
during the fiscal year.
The proposed dividend for
2005 rose 40% to €0.67
44-49 desarrlloEN.qxp 27/6/06 10:20 Página 46

FINANCIAL PERFORMANCE INDITEX 2005 47
SHARE PRICE IN 2005
Inditex’s shares revaluated by 30.2% during 2005, closing at €28.27 per share on 31st January
2006. The average negotiated volume of shares went over the two million shares per day
mark. In the same period, the Spanish reference index, IBEX 35, rose by 20.4%.
Inditex’s market capitalisation stood at €17,621 million at year-end, 91.31% more than its
initial market value on 23rd May 2001, as compared with the 14.66% rise experimented by
IBEX 35 during the same period.
The 2004 dividend paid out in July 2005 was €0.48 per share, 37% more than the previous year.
This payment consisted of an ordinary dividend of €0.30 and an extraordinary dividend of €0.18
per share.
PROFIT PER SHARE (in euro cents)
2005: 129.4
Var 04/05: 26%
31.01.05
ITX
IBEX
ANNUAL TREND ITX vs. IBEX 35
31.01.06
100%
110%
120%
130%
90%
44-49 desarrlloEN.qxp 27/6/06 10:20 Página 47

31.01 28.02 31.03 30.04 31.05 30.06 31.07 31.08 30.09 31.10 31.11 31.120
30.01
50,00
100,00
150,00
200,00
250,00
300,00
350,00
NEGOTIATED VOLUME(millions of euros)
05 06
FINANCIAL PERFORMANCE INDITEX 200548
SHARE PRICE TRENDS IN 2005 (in Euros)
31st January 2005: 21.72
31st January 2006: 28.27
Var 05/04: 30.2%
Market Capitalisation at the end of 2005: €17,621 million
Market Capitalisation at the beginning of 2005: €13,538 million
IPO price (23rd May 2001): €14.70
31st January 2006: €28.27
Var. at the end of FY2005/ IPO: 92.3%
SHARE PRICE TRENDS SINCE THE IPO
31.01 28.02
0531.03 30.04 31.05 30.06 31.07 31.08 30.09 31.10 30.11 31.12
20 ¤
22 ¤
24 ¤
26 ¤
28 ¤
30 ¤
20.82¤07.07.05
31.01
06
28.27¤31.01.06
INDITEX SHARE VALUE TRENDS
44-49 desarrlloEN.qxp 27/6/06 10:20 Página 48

44-49 desarrlloEN.qxp 27/6/06 10:20 Página 49

50-55 Otros indes_EN.qxp 27/6/06 10:26 Página 50

7Other Indicators of Financial Activity
50-55 Otros indes_EN.qxp 29/6/06 11:43 Página 51

FINANCIAL PERFORMANCE INDITEX 200552
The gross margin was
56.2% of sales, 80 basis
points higher than the
previous fiscal year
50-55 Otros indes_EN.qxp 27/6/06 10:26 Página 52

05 04
55.4%
56.2%
FINANCIAL PERFORMANCE INDITEX 2005 53
WORKING CAPITAL TRENDS
Collection and Payment Periods
The following tables show the average period of collection from customers and payment to
suppliers. The payment periods are in line with industry standards.
.
GROSS MARGIN7.1
7.2
7.2.1
7.2.2
(in millions of euros) 2005 2004
Final balance of trade creditors 1,015.8 794.2
Goods cost for financial year 2,953.1 2,483.4
Operating costs for financial year 2,296.8 1,849.3
Total expenses created bytrade creditors 5,249.9 4,332.7
Expenses from supplier´s balance 5.17 5.46
Average collection period (days) 7 7
Average payment period (days) 71 67
Like-for-like salesINCREASE OF
LIKE-FOR-LIKE SALES
(in millions of euros) 2005 2004
Final balance of debtorsfor sales and services 122.6 102.3
Turnover 6,740.8 5,568.6
Turnover fordebtors for sales 55.0 54.5
2005 2004
First half 4.5% 8%
Second half 5% 10%
Full year 5% 9%
50-55 Otros indes_EN.qxp 27/6/06 10:26 Página 53

FINANCIAL PERFORMANCE INDITEX 200554
PROVIDERS OF CAPITALAt the last two year-ends, Inditex had a positive net cash position, i.e. its positive bank balance was
greater than its debts. Inditex had loans, although a significant part of the authorised limits had not
been drawn on. With regard to the credit granted as at 31st January 2006, the main providers of
Inditex capital are:
Institution Nationality % of credit granted
BBVA Spain 25
BSCH Spain 20
Hypovereinsbank Germany 7
Fortis Belgium 6
BNP France 4
Caixa Galicia Spain 4
7.4
(millions of euros) 2005 2004
Goods cost 2,953.1 2,483.4
Initial stock 517.9 490.6
Final stock 684.4 517.9
Average stock 601.1 504.2
Rotation (times) 4.9 4.9
Rotation (days) 74 74
(millions of euros) 2005 2004
Stock 684.4 517.9
Debtors 357.9 254.1
Short term creditors (1,641.6) (1,208.6)
Other assets 15.9 17.9
Operating working capital (583.4) (418.7)
7.2.3 Stock rotation
7.2.4 Operative working capital
7.3 STAFF COSTS
(millions of euros) 2005 2004 EBIT 05/04
Fixed and variable salaries 842.5 683.4 23
Inditex national insurance contributions 194.1 156.1 24
Total staff costs 1,036.6 839.5 23
STAFF COST BY GEOGRAFIC AREA
America 6.2%
Rest of Europe 35.7%Spain 56.8%
Rest of the World 1.3%
50-55 Otros indes_EN.qxp 27/6/06 10:26 Página 54

America 6.1%Rest of Europe 19.1%
Spain 72.5%
Rest of the World 2.3%
FINANCIAL PERFORMANCE INDITEX 2005 55
Industria de Diseño Textil S.A. and subsidiariesCONSOLIDATED STATEMENT OF CHANGES IN EQUITY
In thousands of euros
Equity attributed to the parent company
BALANCE AS AT 01/02/04 93,500 20,379 (8,909) 1,805,233 0 56,406 1,966,609 10,971 1,977,580
Transfers - - - (911) 911 - 0 - 0
Other - - - (489) 0 - (489) - (489)
Impact of exchange rates - - - - (17,531) - (17,531) - (17,531)
Inflation restatement - - - - - 4,947 4,947 - 4,947
Net income directly recognised
in equity
accounts - - - (1,400) (16,620) 4,947 (13,073) 0 (13,073)
Profit for the year - - - 638,451 - - 638,451 7,346 645,797
Total net income
recognised
during the year 637,051 (16,620) 4,947 625,378 7,346 632,724
Dividends - - - (217,351) - - (217,351) (1,446) (218,797)
Delivery of own shares - - 1,442 - - - 1,442 - 1,442
Acquisition of companies - - - - - - 0 351 351
Balance as at 31/01/05 93,500 20,379 (7,467) 2,224,933 (16,620) 61,353 2,376,078 17,222 2,393,300
BALANCE AS AT 01/02/05 93,500 20,379 (7,467) 2,224,933 (16,620) 61,353 2,376,078 17,222 2,393,300
Transfers - - 0 (7.579) 7.579 - 0 0 0
Other - - 0 (4,712) 0 (6,864) (11,576) 0 (11,576)
Impact of exchange rates - - 0 - 28,815 - 28,815 (119) 28,696
Inflation restatement - - 0 - 0 - 0 0 0
Net income directly recognised
in equity
accounts - - (12,291) 36,394 (6.864) 17,239 (119) 17,120
Profit for the year - - 0 803,162 0 - 803,162 7,701 810,863
Total net income
recognised during the year - - 790,871 36,394 (6,864) 820,401 7,582 827,983
Dividends - - 0 (298,098) 0 - (298,098) (3,711) (301,809)
Delivery of own shares - - 497 0 0 - 497 0 497
Acquisition of companies - - - - - - - 902 902
Balance as at 31/01/06 93,500 20,379 (6,970) 2,717,706 19,774 54,489 2,898,878 21,995 2,920,873
Net EquityMin. interest
Equity attributedto the parent
company
Other reserves
Conversiondifferences
Retainedearnings
Ownshares
Issue premium
Capital
7.5
7.6
TAXES
RESERVE VARIATIONSThe following table shows the evolution of Inditex’s (consolidated group) assets in the last two
financial years:
50-55 Otros indes_EN.qxp 30/6/06 14:09 Página 55
56-89 CUENTAS 1.qxp 27/6/06 11:12 Página 56

8Auditors´Report and Consolidated Annual Accounts
56-89 CUENTAS 1.qxp 29/6/06 11:49 Página 57

FINANCIAL PERFORMANCE INDITEX 200558
AUDITOR´S REPORT
56-89 CUENTAS 1.qxp 29/6/06 11:50 Página 58

FINANCIAL PERFORMANCE INDITEX 2005 59
56-89 CUENTAS 1.qxp 27/6/06 11:13 Página 59

INDITEXGROUP CONSOLIDATED ANNUAL ACCOUNTS1
AS AT 31 JANUARY 2006
8.1 CONSOLIDATED INCOME STATEMENT8.2 CONSOLIDATED BALANCE SHEET8.3 CONSOLIDATED STATEMENT OF CASH FLOWS8.4 CONSOLIDATED STATEMENT OF CHANGES IN EQUITY8.5 CONSOLIDATED ANNUAL ACCOUNTS
1. Activity and description of the Group2. Accounting policies
a) Statement of complianceb) Basis of presentationc) Basis of consolidation
3. Revenue4. Cost of merchandise5. Operating expenses 6. Other operating expenses and income 7. Net financing and income8. Earnings per share 9. Segment reporting
10. Trade and other receivables 11. Inventories12. Property, plant and equipment 13. Investment property 14. Rights over leased premises and other intangible assets15. Goodwill 16. Investments17. Investments in associates18. Other non-current assetss19. Trade and other payables 20. Net financial position21. Provisions22. Other non-current liabilities 23. Capital and reserves24. Income tax25. Operating leases26. Finance leases 27. Risk management and financial instruments 28. Employee benefits 29. Interest in joint ventures 30. Proposed distribution of parent company profit 31. Remuneration of the board of directors and transactions
with related parties32. External auditors33. Subsequent events34. Transition to International Financial Reporting Standards
(IFRS)35. Selected accounting policies
a) Foreign currency transactionsb) Property, plant and equipmentc) Rights over leased premisesd) Other intangible assetse) Investmentsf) Investment propertyg) Goodwillh) Impairmenti) Trade and other receivables j) Inventoriesk) Cash and cash equivalentsl) Employee benefitsm) Provisionsn) Trade and other payableso) Financial liabilitiesp) Derivatives and hedging operations q) Income recognitionr) Leasess) Financial income and expensest) Income taxesu) Earnings per sharev) Non-current assets and liabilities
1 Translation from the original in Spanish
56-89 CUENTAS 1.qxp 29/6/06 11:51 Página 60

FINANCIAL PERFORMANCE INDITEX 2005 61
INDUSTRIA DE DISEÑO TEXTIL,S.A. AND SUBSIDIARY COMPANIES
CONSOLIDATED INCOME STATEMENT
(In Thousands Of Euros)
31 January 2006
31 January 2005
Revenue (3) 6,740,826 5,568,644Cost of merchandise (4) (2,953,073) (2,483,441)
GROSS PROFIT 3,787,753 3,085,203
Operating expenses (5) (2,296,759) (1,849,264)Operating expenses and income (6) (31,672) (8,563)
Operating Profit (Ebitda) 1,459,322 1,227,376
Amortisation and depreciation (12,13,14) (365,730) (305,418)
Operating Profit (Ebit) 1,093,592 921,958
Net financing revenue/(costs) (7) 8,046 (24,846)Equity accounting losses (17) (192) (358)
Profit Before Tax 1,101,446 896,754
Income tax (24) (290,583) (250,957)
Net profit 810,863 645,797
Profit attributable to minority interest 7,701 7,346
Profit Attributable To The Parent 803,162 638,451
Basic Earnings Per Share (8) 129.4 102.8
8.1
(notes)
56-89 CUENTAS 1.qxp 27/6/06 11:13 Página 61

FINANCIAL PERFORMANCE INDITEX 200562
CURRENT ASSETS 2,046,612 1,561,713Cash and cash equivalents (20) 988,405 771,842
Trade and other receivables (10) 327,322 240,035
Inventories (11) 684,392 517,870
Income tax receivable (24) 30,609 14,064
Other current assets 15,884 17,902
NON-CURRENT ASSETS 3,156,251 2,651,153Property, plant and equipment (12) 2,410,032 2,002,151
Investment property (13) 14,227 10,535
Rights over leased assets (14) 410,690 366,632
Other intangible assets (14) 9,269 9,098
Goodwill (15) 79,094 68,777
Investments (16) 61,021 53,470
Investments in associates (17) 7,040 7,232
Deferred tax assets (24) 77,716 61,367
Other (18) 87,162 71,891
TOTAL ASSETS 5,202,863 4,212,866
LIABILITIES
CURRENT LIABILITIES 1,850,828 1,372,355Trade and other payables (19) 1,509,526 1,075,453
Financial debt (20) 209,192 163,733
Income tax payable (24) 132,110 133,169
NON-CURRENT LIABILITIES 431,162 447,211Financial debt (20) 76,099 119,185
Deferred tax liabilities (24) 106,735 89,177
Provisions (21) 41,965 31,728
Other non-current liabilities (22) 206,363 207,121
NET EQUITY 2,920,873 2,393,300Net equity attributable to the parent 2,898,878 2,376,078
Net equity attributable to minority interest 21,995 17,222
TOTAL LIABILITIES 5,202,863 4,212,866
31 Jan 2006
(notes)
ASSETS
31 Jan2005
8.2 Industria De Diseño Textil, S.A. and subsidiary companies
CONSOLIDATED BALANCE SHEETS
(in thousands of euros)
56-89 CUENTAS 1.qxp 27/6/06 11:13 Página 62
FINANCIAL PERFORMANCE INDITEX 2005 63
Year 2005 Year 2004 Var % 05/04
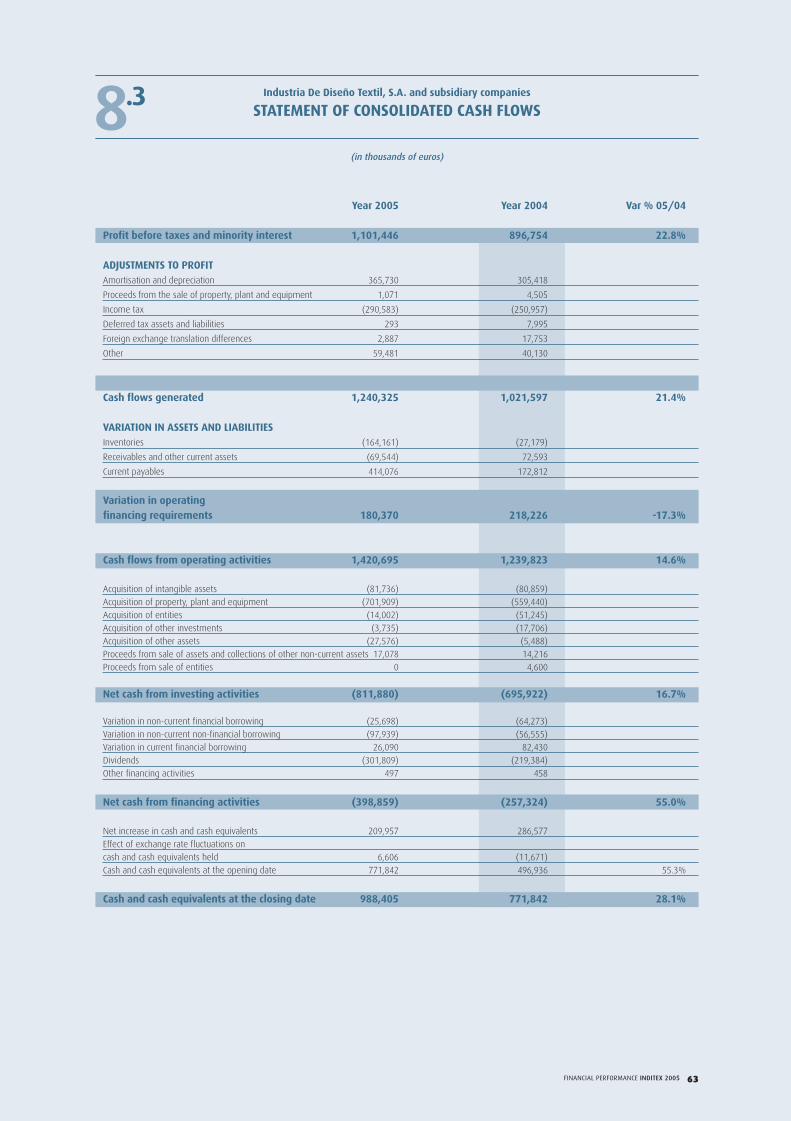
Profit before taxes and minority interest 1,101,446 896,754 22.8%
ADJUSTMENTS TO PROFITAmortisation and depreciation 365,730 305,418
Proceeds from the sale of property, plant and equipment 1,071 4,505
Income tax (290,583) (250,957)
Deferred tax assets and liabilities 293 7,995
Foreign exchange translation differences 2,887 17,753
Other 59,481 40,130
Cash flows generated 1,240,325 1,021,597 21.4%
VARIATION IN ASSETS AND LIABILITIESInventories (164,161) (27,179)
Receivables and other current assets (69,544) 72,593
Current payables 414,076 172,812
Variation in operatingfinancing requirements 180,370 218,226 -17.3%
Cash flows from operating activities 1,420,695 1,239,823 14.6%
Acquisition of intangible assets (81,736) (80,859)
Acquisition of property, plant and equipment (701,909) (559,440)
Acquisition of entities (14,002) (51,245)
Acquisition of other investments (3,735) (17,706)
Acquisition of other assets (27,576) (5,488)
Proceeds from sale of assets and collections of other non-current assets 17,078 14,216
Proceeds from sale of entities 0 4,600
Net cash from investing activities (811,880) (695,922) 16.7%
Variation in non-current financial borrowing (25,698) (64,273)
Variation in non-current non-financial borrowing (97,939) (56,555)
Variation in current financial borrowing 26,090 82,430
Dividends (301,809) (219,384)
Other financing activities 497 458
Net cash from financing activities (398,859) (257,324) 55.0%
Net increase in cash and cash equivalents 209,957 286,577
Effect of exchange rate fluctuations on
cash and cash equivalents held 6,606 (11,671)
Cash and cash equivalents at the opening date 771,842 496,936 55.3%
Cash and cash equivalents at the closing date 988,405 771,842 28.1%
8.3 Industria De Diseño Textil, S.A. and subsidiary companies
STATEMENT OF CONSOLIDATED CASH FLOWS
(in thousands of euros)
56-89 CUENTAS 1.qxp 27/6/06 11:13 Página 63

FINANCIAL PERFORMANCE INDITEX 200564
8.4 Industria De Diseño Textil, S.A. and subsidiary companies
CONSOLIDATED STATEMENT OF CHANGES IN EQUITY
(in thousands of euros)
Equity attributable to the parent
Balance at 01/02/2004 93,500 20,379 (8,909) 1,805,233 0 56,406 1,966,609 10,971 1,977,580
Transfers - - - (911) 911 - 0 - 0
Others - - - (489) 0 - (489) - (489)
Exchange rate effect - - - - (17,531) - (17,531) - (17,531)
Restatement due to inflation - - - - - 4,947 4,947 - 4,947
Net income
recognized
directly in equity - - - (1,400) (16,620) 4,947 (13,073) 0 (13,073)
Profit for the year - - - 638,451 - - 638,451 7,346 645,797
Total recognized
income and expense
for the period 637,051 (16,620) 4,947 625,378 7,346 632,724
Dividends - - - (217,351) - - (217,351) (1,446) (218,797)
Own shares - - 1,442 - - - 1,442 - 1,442
Acquisition of entities - - - - - - 0 351 351
Balance at 31/01/2005 93,500 20,379 (7,467) 2,224,933 (16,620) 61,353 2,376,078 17,222 2,393,300
BALANCE AT 01/02/2005 93,500 20,379 (7,467) 2,224,933 (16,620) 61,353 2,376,078 17,222 2,393,300
Transfers - - 0 (7,579) 7,579 - 0 0 0
Others - - 0 (4,712) 0 (6,864) (11,576) 0 (11,576)
Exchange rate effect - - 0 - 28,815 - 28,815 (119) 28,696
Restatement due to inflation - - 0 - 0 - 0 0 0
Net income
recognized directly
in equity - - - (12,291) 36,394 (6,864) 17,239 (119) 17,120
Profit for the year - - 0 803,162 0 - 803,162 7,701 810,863
Total recognized income
and expense for the period - - 790,871 36,394 (6,864) 820,401 7,582 827,983
Dividends - - 0 (298,098) 0 - (298,098) (3,711) (301,809)
Own shares - - 497 0 0 - 497 0 497
Acquisition of entities - - - - - - - 902 902
Balance at 31/01/2006 93,500 20,379 (6,970) 2,717,706 19,774 54,489 2,898,878 21,995 2,920,873
Net equity
Minorityinterests
Equity attributable
to theparent
Otherreserves
Translationdifferences
Accumula-ted
earnings
OwnShares
Share Premium
Capital
56-89 CUENTAS 1.qxp 27/6/06 11:13 Página 64

FINANCIAL PERFORMANCE INDITEX 2005 65
1. ACTIVITY AND DESCRIPTION OF THE GROUPIndustria de Diseño Textil, S.A., (hereinafter Inditex) is the parent of a group of companies, the
principal activity of which consists of the distribution of fashion articles, mainly clothing, foot-
wear, accessories and household textile products. Inditex carries out its activity through various
commercial formats such as Zara, Kiddy´s Class, Pull & Bear, Massimo Dutti, Bershka, Stradiva-
rius, Oysho and Zara Home, which are managed separately but which share certain corporate
functions. Inditex is domiciled in Spain, is listed on all four of the Spanish stock exchanges and,
together with its subsidiary companies, comprises the Inditex Group (the Group).
Each formats commercial activity is carried out through chains of stores managed directly by
companies in which Inditex holds all or the majority of the share capital, with the exception of
certain countries where, for various reasons, the retail selling activity is performed through fran-
chises.
Inditex business model is characterised by the search for flexibility in adapting production to
market demand by controlling the supply chain throughout the different stages of design, manu-
facture and distribution. This enables it to focus both its own and suppliers´ production on chan-
ges in market trends during each commercial campaign.
The logistics system is based on constant deliveries from the distribution centres of the various
commercial formats to stores throughout each season. This system essentially operates through
centralised logistics centres for each chain in which inventory is stored and distributed to stores
worldwide.
At 31 January 2006 the different group formats have stores in 61 countries as follows:
The majority of own stores are held under operating leases. Information on the main characte-
ristics of lease contracts is provided in note 25.
Own Franchises Total
Spain 1,430 31 1,461
Rest of Europe 724 124 848
America 207 4 211
Rest of the world 21 151 172
Total 2,382 310 2,692
Number of stores
8.5 CONSOLIDATED ANNUAL ACCOUNTS OF THEINDITEX GROUP AT 31 JANUARY 2006
56-89 CUENTAS 1.qxp 27/6/06 11:13 Página 65
FINANCIAL PERFORMANCE INDITEX 200566
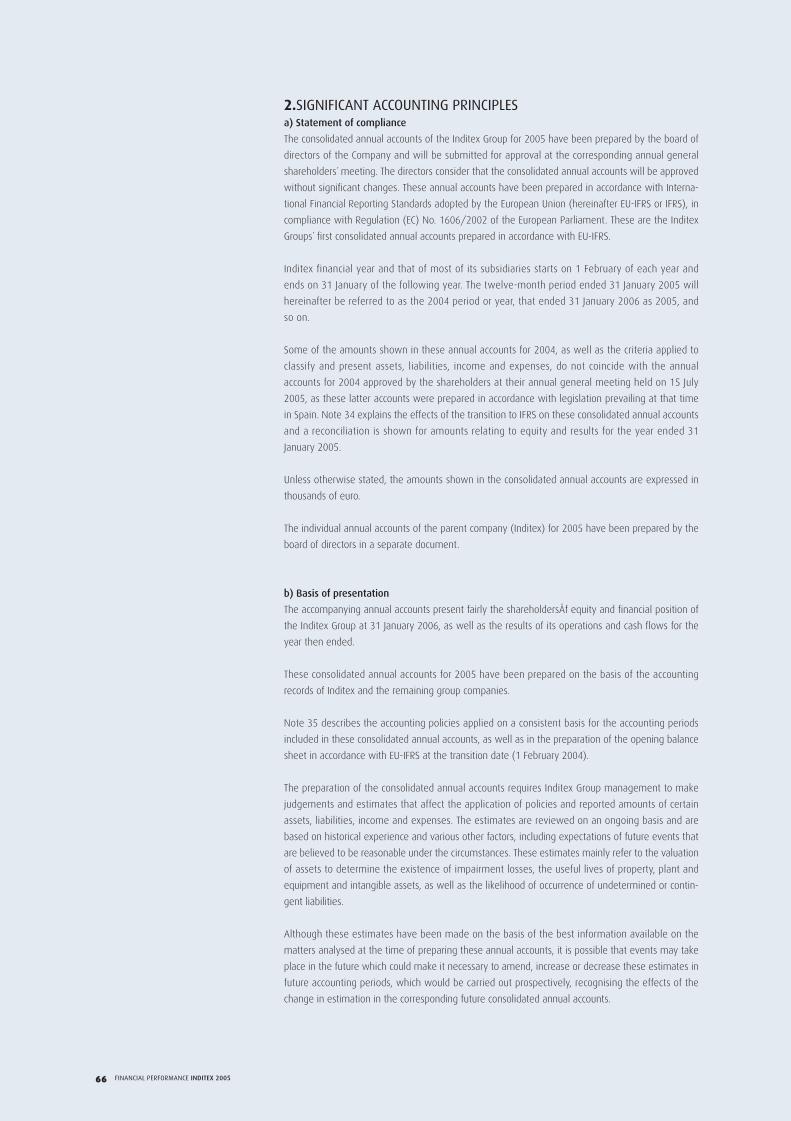
2.SIGNIFICANT ACCOUNTING PRINCIPLESa) Statement of compliance
The consolidated annual accounts of the Inditex Group for 2005 have been prepared by the board of
directors of the Company and will be submitted for approval at the corresponding annual general
shareholders´ meeting. The directors consider that the consolidated annual accounts will be approved
without significant changes. These annual accounts have been prepared in accordance with Interna-
tional Financial Reporting Standards adopted by the European Union (hereinafter EU-IFRS or IFRS), in
compliance with Regulation (EC) No. 1606/2002 of the European Parliament. These are the Inditex
Groups´ first consolidated annual accounts prepared in accordance with EU-IFRS.
Inditex financial year and that of most of its subsidiaries starts on 1 February of each year and
ends on 31 January of the following year. The twelve-month period ended 31 January 2005 will
hereinafter be referred to as the 2004 period or year, that ended 31 January 2006 as 2005, and
so on.
Some of the amounts shown in these annual accounts for 2004, as well as the criteria applied to
classify and present assets, liabilities, income and expenses, do not coincide with the annual
accounts for 2004 approved by the shareholders at their annual general meeting held on 15 July
2005, as these latter accounts were prepared in accordance with legislation prevailing at that time
in Spain. Note 34 explains the effects of the transition to IFRS on these consolidated annual accounts
and a reconciliation is shown for amounts relating to equity and results for the year ended 31
January 2005.
Unless otherwise stated, the amounts shown in the consolidated annual accounts are expressed in
thousands of euro.
The individual annual accounts of the parent company (Inditex) for 2005 have been prepared by the
board of directors in a separate document.
b) Basis of presentation
The accompanying annual accounts present fairly the shareholdersÅf equity and financial position of
the Inditex Group at 31 January 2006, as well as the results of its operations and cash flows for the
year then ended.
These consolidated annual accounts for 2005 have been prepared on the basis of the accounting
records of Inditex and the remaining group companies.
Note 35 describes the accounting policies applied on a consistent basis for the accounting periods
included in these consolidated annual accounts, as well as in the preparation of the opening balance
sheet in accordance with EU-IFRS at the transition date (1 February 2004).
The preparation of the consolidated annual accounts requires Inditex Group management to make
judgements and estimates that affect the application of policies and reported amounts of certain
assets, liabilities, income and expenses. The estimates are reviewed on an ongoing basis and are
based on historical experience and various other factors, including expectations of future events that
are believed to be reasonable under the circumstances. These estimates mainly refer to the valuation
of assets to determine the existence of impairment losses, the useful lives of property, plant and
equipment and intangible assets, as well as the likelihood of occurrence of undetermined or contin-
gent liabilities.
Although these estimates have been made on the basis of the best information available on the
matters analysed at the time of preparing these annual accounts, it is possible that events may take
place in the future which could make it necessary to amend, increase or decrease these estimates in
future accounting periods, which would be carried out prospectively, recognising the effects of the
change in estimation in the corresponding future consolidated annual accounts.
56-89 CUENTAS 1.qxp 27/6/06 11:13 Página 66

FINANCIAL PERFORMANCE INDITEX 2005 67
c) Basis of consolidation
I) Subsidiaries
Subsidiaries are those entities controlled by the parent company. Control exists when the parent
company has the power, directly or indirectly, to govern financial and operating policies. Subsi-
diaries are consolidated by aggregating the total amount of assets, liabilities, income, expenses
and cash flows, after carrying out the adjustments and eliminations relating to intragroup opera-
tions. The results of subsidiaries acquired during the year are included in the consolidated annual
accounts from the date that control commences.
Net identifiable assets acquired and certain or contingent liabilities assumed as part of a busi-
ness combination are stated at fair value at the date of acquisition, providing the acquisition
takes place after the date of transition to EU-IFRS. If the cost of acquisition is greater than the
fair value of the net identifiable assets acquired at that date, the excess is recognised as good-
will, and otherwise is recorded as income for the year. The interest held by minority sharehol-
ders is established proportionally to the fair value of the recognised assets and liabilities. Any
loss attributable to minority shareholders that exceeds their interest is assumed by the Group
in the preparation of its annual accounts. Minority interest in the equity and results of subsidia-
ries is presented under Net equity attributable to minority interest and Profit attributable to
minority interest, respectively. A list of subsidiaries is presented in Appendix I.
II) Joint ventures
Joint ventures are those entities over whose activities the Group has joint control, established by
contractual agreement. The consolidated annual accounts include, in each individual caption of
the balance sheet and income statement, the Group proportionate share in these entities assets,
liabilities, revenue and expenses from the date that joint control commences until the date that
joint control ceases.
III) Associates
Associates are those entities in which the Group has significant influence, but not control, over
the financial and operating policies. The consolidated annual accounts include the Group share
of the total recognised gains, losses, assets and liabilities of associates on an equity accounted
basis, from the date that significant influence commences until the date that significant
influence ceases. When the Group share of losses exceeds its interest in an associate, the
Group associate´s carrying amount is reduced to nil and recognition of further losses is discon-
tinued except to the extent that the Group has incurred legal obligations or made payments
on behalf of the associate.
IV) Harmonisation of criteria
Each of the entities included in the consolidated group prepares its annual accounts and
other accounting records in accordance with accounting policies and legislation applicable in
the country of origin. When these accounting criteria and policies are different to those adop-
ted by Inditex in the preparation of its consolidated annual accounts, they have been adjus-
ted in order to present the consolidated annual accounts using homogenous accounting
principles.
V) Transactions eliminated on consolidation
Intragroup balances and transactions, and any unrealised gains arising from transactions with
third parties, are eliminated in the consolidation process. In the case of jointly controlled enti-
ties, balances, revenues and expenses between intragroup companies, and any unrealised
gains arising from transactions with third parties, are eliminated in the consolidation process to
the extent of the Group´s interest in the entity. Unrealised gains arising from transactions with
associates are eliminated from the consolidated annual accounts to the extent of the Group´s
interest in the entity.
56-89 CUENTAS 1.qxp 27/6/06 11:13 Página 67
FINANCIAL PERFORMANCE INDITEX 200568
VI) Financial statements of foreign operations
The conversion of financial statements of entities with a functional currency other than the euro is
carried out as follows:
• Assets and liabilities are translated to euro at foreign exchange rates ruling at the balance
sheet date.
• Items that comprise the net equity of these entities are translated to euro at historical
exchange rates (or, for accumulated results, at the average exchange rate for the year in
which they were generated).
• Revenues and expenses are translated to euro at the average exchange rate for the year.
Differences arising from the application of these exchange rates are included in net consolidated
equity under the “Translation Differences” caption.
Foreign exchange differences of consolidated companies deriving from monetary operations with
other consolidated entities which, in substance, form part of the net investment made by the Group
in foreign entities, and whose collection or payment is not foreseeable or is not likely to occur, are
classified as net consolidated equity until disinvestment in the subsidiary takes place, at which time
the differences are recognised as income or expense for the year.
Exchange differences deriving from trade payable and receivable balances and financing operations
between group companies, with foreseeable settlement, are recognised in the income statement for
the year.
VII) Financial statements in hyperinflationary countries
The financial statements of foreign operations in countries considered to have hyperinflationary eco-
nomies have been adjusted prior to translation to euro to account for the effect of changes in prices.
VIII) Entities with a closing date different to that of the Group
Entities with a closing date different to that of the consolidated accounts have been consolidated
with the financial statements at their closing date. Significant operations carried out between the
closing date of these subsidiaries and that of the consolidated accounts are harmonised accor-
dingly.
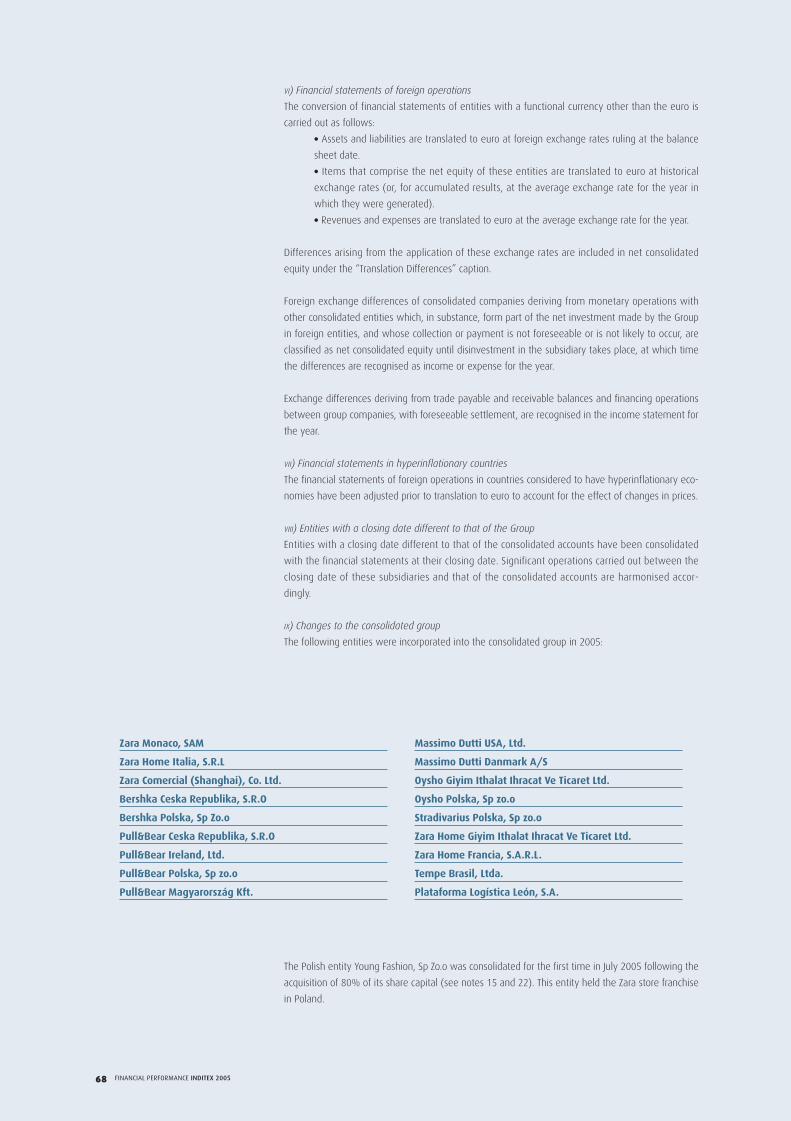
IX) Changes to the consolidated group
The following entities were incorporated into the consolidated group in 2005:
The Polish entity Young Fashion, Sp Zo.o was consolidated for the first time in July 2005 following the
acquisition of 80% of its share capital (see notes 15 and 22). This entity held the Zara store franchise
in Poland.
Zara Monaco, SAM
Zara Home Italia, S.R.L
Zara Comercial (Shanghai), Co. Ltd.
Bershka Ceska Republika, S.R.O
Bershka Polska, Sp Zo.o
Pull&Bear Ceska Republika, S.R.O
Pull&Bear Ireland, Ltd.
Pull&Bear Polska, Sp zo.o
Pull&Bear Magyarország Kft.
Massimo Dutti USA, Ltd.
Massimo Dutti Danmark A/S
Oysho Giyim Ithalat Ihracat Ve Ticaret Ltd.
Oysho Polska, Sp zo.o
Stradivarius Polska, Sp zo.o
Zara Home Giyim Ithalat Ihracat Ve Ticaret Ltd.
Zara Home Francia, S.A.R.L.
Tempe Brasil, Ltda.
Plataforma Logística León, S.A.
56-89 CUENTAS 1.qxp 27/6/06 11:13 Página 68

Net sales in own stores 6,251,746 5,147,017
Net sales to franchises 420,201 347,551
Other sales and services rendered 68,879 74,076
Total 6,740,826 5,568,644
FINANCIAL PERFORMANCE INDITEX 2005 69
The entities known as Vajo, S.A. and Zara Merken, B.V. at 31 January 2005 have changed their names
to Zara Home Belgium, S.A. and ITX Merken, B.V., respectively.
The incorporations referred to in the previous paragraphs have not had a significant impact on the
consolidated annual accounts for 2005.
3. REVENUEThe figure for revenue in the consolidated income statement includes amounts received from the
sale of goods and income from rentals, royalties and other services rendered in the ordinary course
of the Group´s business, net of VAT and other sales-related taxes.
Details of this caption for 2005 and 2004 are as follows:
4. COST OF MERCHANDISEDetails of this caption for 2005 and 2004 are as follows:
Raw materials and consumables mainly include amounts relating to the acquisition or production
by third parties of products held for sale or transformation, the transportation of purchases made
by group companies until goods are delivered to the corresponding logistic centres, customs
tariffs, duties and taxes payable on imported goods and other minor amounts related to the
acquisition of goods.
2005 2004
Personnel expenses 1,036,576 839,500
Operating leases (note 25) 577,041 468,101
Other operating expenses 683,142 541,663
Total 2,296,759 1,849,264
2005 2004
Raw materials and consumables 3,119,595 2,510,756
Change in inventories (166,522) (27,315)
Total 2,953,073 2,483,441
2005 2004
5. OPERATING EXPENSESDetails of operating expenses are as follows:
56-89 CUENTAS 1.qxp 27/6/06 11:13 Página 69

FINANCIAL PERFORMANCE INDITEX 200570
At 31 January 2006 and 2005 the Group had a total of approximately 58,000 and 47,000 emplo-
yees, respectively. Note 28 (employee benefits) provides additional information on personnel
expenses.
Lease expenses mainly relate to the rental, through operating leases, of the commercial premises
from which the Group carries out its activity. Note 25 provides more detailed information on the
main characteristics of these leases, together with the related minimum future payment commit-
ments.
ÅgOther operating expensesÅh mainly include expenses relating to store operations, logistics and
general overheads, such as electricity, commissions on credit and debit card payments, travel,
transportation of merchandise from logistic centres to stores, decoration expenses, communica-
tions and all kinds of professional services.
6. OTHER OPERATING EXPENSES AND INCOME This caption includes all operating expenses, other than those associated with the Group´s com-
mercial and logistics activity, included under ¨Operating expenses¨ in the consolidated income sta-
tement described in the prior note.
“Other operating expenses” mainly include variations in the debt related to reciprocal sales and
purchase options between the Group and shareholders with a partial stake in certain subsidiaries,
as these options are considered a deferred acquisition of the shares which constitute the underl-
ying asset (notes 22, 33 and 34). These variations are basically due to the relationship between
the price of the options and the number of stores operated, shareholders´ equity and the results
of these subsidiary companies.
Below are details of the main reciprocal sales-purchase options over these investments:
a) Stradivarius España, S.A.
Since 90.05% of this company was acquired in 1998, Inditex had a call option on the remaining
9.95% of share capital held by another shareholder, which in turn had a reciprocal put option
with the Group. These options had no premium attached and were exercisable from 2005 to
2010 for a strike price plus 9.95% of undistributed Stradivarius España, S.A. profit from the acqui-
sition date until such time as either of the options was exercised.
In July 2005 Inditex exercised its call option on the remaining 9.95% of share capital and settled
the corresponding liability. This option was duly eliminated when exercised and is therefore not
shown in the balance sheet at 31 January 2006.
b) Subsidiary companies domiciled in Germany
The Group has a call option on 50% of the share capital of Zara Deutschland, GmbH, Oysho Deuts-
chland, GmbH and Massimo Dutti Deutschland, GmbH, held by Otto GMBH and Co., which in turn
has a reciprocal put option with the Group. These options may be exercised over the term of the
agreement between the parties, have no premium and the strike price depends mainly on the
contributions made by Otto GmbH and Co. to the shareholders´f equity of each respective subsi-
diary and the number of stores operated by the subsidiary if and when either of the options is
exercised.
During the last quarter of the year ended 31 January 2006, Inditex communicated to Otto GMBH
and Co. its intention to proceed to the increase of its particiation in the subsidiaries companies
domiciliated in Germany, after an agreement reached between the parties to partially exercise
the option in favour of Inditex and amend the agreements signed in prior years (see note 33). As
a result, Inditex´s investment in Zara Deutschland, GmbH has risen from 50% to 78% and the
agreements reached prior to the closing date were formally documented at the end of March.
Furthermore, on the same date Inditex management made known its intention to acquire Otto
GMBH and Co.´s 50% stake in the rest of the subsidiaries domiciliated in Germany (see note 33).
56-89 CUENTAS 1.qxp 27/6/06 11:13 Página 70

FINANCIAL PERFORMANCE INDITEX 2005 71
c) Zara Japan
At 31 January 2004, Inditex held a 50% investment in Zara Japan Corporation and a call option on
the remaining 50% belonging to the Bigi group. In May 2004, Inditex reached an agreement with
this group whereby it partially exercised its call option and acquired an additional 35%, and sig-
ned a new contract of association with the Bigi group which granted Inditex a call option over the
remaining 15% of the share capital and the Bigi group a reciprocal put option. These options had
no premium attached and the strike price comprised a fixed and a variable amount.
In December 2005, Inditex exercised its call option, acquired the 15% stake held by the Bigi
group in Zara Japan Corporation and settled the corresponding liability. This option was duly elimi-
nated when exercised and is therefore not shown in the balance sheet at 31 January 2006.
d) Subsidiary companies domiciled in Italy
At 31 January 2004, Inditex held 51% of the share capital of Zara Italia, S.R.L., and in March 2004
reached an agreement with the other shareholder (the Percassi group), whereby it acquired a
further 29%. On the same date it signed a new contract of association, which is still in force, that
granted Inditex a call option on the remaining 20% of the share capital held by the Percassi
group, and the Percassi group a reciprocal put option. The options have no premium attached and
the strike price will comprise a fixed and variable portion which will be mainly conditional on the
shareholders´ equity, the subsidiary results and the number of stores operated by the subsidiary if
and when either of the options is exercised.
Additionally, the Group has a call option on 20% of the share capital of Massimo Dutti Italia,
S.R.L., Bershka Italia S.R.L., Pull & Bear Italia S.R.L. and Oysho Italia, S.R.L., held by the Percassi
group, which in turn holds a reciprocal put option. The options have no premium attached and
the strike price will depend on the shareholders equity of the subsidiary and the number of sto-
res operated by the subsidiary if and when the option is exercised.
Inditex has accounts receivable from the Percassi group of Euros 20 million which may be netted
against any creditor balances in the event either of the above-mentioned options is exercised
(see note 16).
e) Subsidiary companies domiciled in Mexico
The Group has call options on 5% of the share capital of Zara México, S.A. de C.V., 3% of the sha-
re capital in Bershka México, S.A. de C.V., and 1.5% each of Oysho México, S.A. de C.V. and Pull &
Bear México, S.A. de C.V., which are held by the minority interest. The exercise period of these
options extends over the term of the agreements between the parties. The options have no pre-
mium attached and the strike price will depend on the shareholders equity of the subsidiaries.
56-89 CUENTAS 1.qxp 27/6/06 11:13 Página 71

FINANCIAL PERFORMANCE INDITEX 200572
7. NET FINANCING REVENUE/COSTSDetails of net financing revenue/costs in the consolidated income statements for 2005 and 2004 are
as follows:
8. EARNINGS PER SHAREBasic earnings per share was calculated based on the net profit for the year divided by the weighted
average number of ordinary shares in circulation during the year, excluding the average number of
parent company shares held by the Group (see note 23), which in 2005 and 2004 totalled
620,910,527 and 620,810,520, respectively.
The Group has not carried out any operations which would give rise to a diluted earnings per share
that differs from basic earnings per share.
9. SEGMENT REPORTINGBusiness segments
The principal activity of the Inditex Group comprises the retail distribution of clothing, footwear,
accessories and household textile products through various commercial format stores aimed at diffe-
rent sectors of the public. These commercial formats are managed independently in such a way that
each constitutes a business segment which is subject to risks and rewards different to those expe-
rienced by the rest of the Group, although each carries out its activity in the same sector.
The eight business formats of Inditex are: Zara, KiddyÅfs Class, Pull & Bear, Massimo Dutti, Bershka,
Stradivarius, Oysho and Zara Home. Each format manages its own supply chain, corporate policy and
network of stores, while taking advantage of the synergies of belonging to the Inditex Group, mainly
in the areas of support, market knowledge, economic solvency before third parties and in all corpo-
rate activities.
Geographical segments
All Inditex Group commercial formats operate in different markets with varying economic, com-
mercial and legal environments, and are therefore subject to different risks and rewards. The
four geographical segments of the Group´s activities _ Spain, rest of Europe, America and Asia
and the rest of the world _ are determined based on the similarity of commercial, economic
and political conditions and the proximity of operations.
Primary and secondary segments
The origin and predominant nature of the risks and rewards of the Inditex GroupÅfs business units are
attributable to business segments, as these risks and rewards are mainly influenced by the fact that each
cash generating unit belongs to a particular commercial format, and geographical location. The internal
organisation of the Inditex Group, the decision-making process and the system for communicating infor-
Financial income and expenses basically comprise interest accrued on the Group´s financial assets
and liabilities during the year (see note 20). Net foreign exchange translation differences are princi-
pally due to fluctuations in the currencies with which the Group operates (see note 27) between
when income, expenses, acquisitions or disposals of assets are recognised and the corresponding
assets or liabilities are realised or valued under applicable accounting principles. Net financing reve-
nue/costs also include the effect of measuring exchange rate derivative instruments at fair value
(see note 35.p).
Financial income 24,729 14,579
Financial expenses (20,928) (21,817)
Net foreign exchange translation differences 4,245 (17,608)
Total 8,046 (24,846)
2005 2004
56-89 CUENTAS 1.qxp 27/6/06 11:13 Página 72

FINANCIAL PERFORMANCE INDITEX 2005 73
mation to the board of directors and group management is organised primarily by commercial format,
followed by geographical areas.
Details of the Inditex Group by segments are as follows:
YEAR 2004 Total revenue 3,980,010 1,817,920 - 5,797,930
Inter-segment revenue 220,342 8,944 (229,286) 0
Revenue from third parties 3,759,668 1,808,976 - 5,568,644
Segment result 654,165 267,793 - 921,958
Segment assets 2,546,575 1,102,601 - 3,649,176
Segment liabilities 963,919 439,339 - 1,403,258
Segment investments 465,084 239,526 - 704,610
Amortisation and depreciation 210,970 94,448 - 305,418
Expenses without cash outflow 25,939 4,016 - 29,955
ROCE 42% 43% - 42%
Number of stores 723 1,521 - 2,244
YEAR 2005Total revenue 4,691,088 2,302,739 - 6,993,827
Inter-segment revenue 250,330 2,671 (253,001) 0
Revenue from third parties 4,440,759 2,300,067 - 6,740,826
Segment result 712,128 381,464 - 1,093,592
Segment assets 2,781,173 1,619,905 - 4,401,078
Segment liabilities 1,279,959 584,630 - 1,864,589
Segment investments 535,397 297,214 - 832,609
Amortisation and depreciation 246,635 119,095 - 365,730
Expenses without cash outflow 23,588 5,454 - 29,042
ROCE 41% 42% - 41%
Number of stores 852 1,840 - 2,692
Rest of formats
Eliminations onconsolidationZARA TOTALPRIMARY SEGMENTS
YEAR 2004ZARA Kiddy´s Class Pull & Bear Massimo Dutti Bershka Stradivarius Oysho Zara Home Total
Total revenue 3,980,010 120,741 369,119 459,941 511,017 244,487 72,213 40,400 - 5,797,930
Inter-segment revenue 220,342 108 1,886 1,581 2,203 2,606 556 4 (229.286) 0
Revenue from third parties 3,759,668 120,633 367,233 458,360 508,814 241,881 71,657 40,396 - 5,568,644
Segment result 654,165 20,799 52,209 67,592 74,816 36,656 15,533 188 - 921,958
Segment assets 2,546,575 79,317 216,313 306,847 315,507 130,133 28,233 26,250 - 3,649,176
Segment liabilities 963,919 14,493 83,259 124,356 126,814 62,038 16,712 11,666 - 1,403,258
Segment investments 465,084 14,153 27,199 83,198 66,326 18,072 11,476 19,103 - 704,610
Amortisation and depreciation 210,970 4,602 18,798 27,206 24,360 12,016 4,842 2,625 - 305,418
Expenses without cash outflow 25,939 404 1,355 1,864 1,126 -328 -464 58 - 29,955
ROCE 42% 59% 41% 43% 47% 41% 51% 1% - 42%
Number of stores 723 129 371 326 302 227 104 62 - 2,244
YEAR 2005ZARA Kiddy´s class Pull & Bear Massimo Dutti Bershka Stradivarius Oysho Zara Home Total
Total revenue 4,691,088 155,509 445,585 534,121 640,997 341,369 107,030 78,128 - 6,993,827
Inter-segment revenue 250,330 106 460 319 1,548 238 1 0 (253.001) 0
Revenue from third parties 4,440,759 155,404 445,125 533,802 639,449 341,131 107,029 78,128 - 6,740,826
Segment result 712,128 28,818 75,313 68,796 98,940 83,631 24,528 1,417 - 1,093,592
Segment assets 2,781,173 103,639 282,098 454,629 454,502 188,345 79,586 57,106 - 4,401,078
Segment liabilities 1,279,959 19,572 109,356 142,074 168,802 89,929 28,434 26,464 - 1,864,589
Segment investments 535,397 12,411 54,381 89,039 72,956 24,599 20,909 22,918 - 832,609
Amortisation and depreciation 246,635 5,578 21,644 37,845 28,605 12,372 5,272 7,778 - 365,730
Expenses without cash outflow 23,588 -122 1,053 2,826 791 402 469 35 - 29,042
ROCE 41% 67% 47% 27% 42% 82% 50% 3% - 41%
Number of stores 852 149 427 369 368 263 154 110 - 2,692
PRIMARY SEGMENTS
Eliminations ofconsolidation
Eliminations ofconsolidation
56-89 CUENTAS 1.qxp 27/6/06 11:13 Página 73

The segment result is defined as Operating Profit (EBIT). Therefore, according to IAS 14, and in order to
keep consistency between the amounts shown in the balance sheet and profit and loss account, assets
and liabilities of the segment are only those employed in its operating activities and do not include inco-
me tax assets or liabilities neither receivables or payables, loans, investments or other financial income-
producing asset or liability, as these concepts are not included in the segment result. Income, expenses,
assets and liabilities which are considered corporate in nature or as belonging to the group of segments as
a whole have been assigned to each segment in accordance with criteria considered reasonable by group
management.
ROCE is defined as the ratio between the segment result for the year (EBIT) and the total net average
assets of the segment, that include those employed in its operating activities as well as financial and tax
assets.
10. TRADE AND OTHER RECEIVABLES Details of this caption at 31 January 2006 and 2005 are as follows:
Trade receivables mainly correspond to debit/credit card payments pending collection.
Part of the Group activity is carried out through franchised stores (see note 3). Sales to franchises are
made under agreed collection terms and generate the receivables shown in the table above, which
are secured as described in note 27.
Balances receivable from public entities comprise VAT other taxes and duties incurred by group com-
panies in the respective countries in which they operate.
Other current receivables include items such as rental incentives due from shopping centre develo-
pers (see note 25) and outstanding balances on sundry operations.
Sales to third parties
2005 2004
Spain 3,039,145 2,648,149
Rest of Europe 2,608,774 2,065,703
AmErica 757,651 600,102
Asia and Rest of the World 335,256 254,689
Total 6,740,826 5,568,644
FINANCIAL PERFORMANCE INDITEX 200574
Secondary segments
Trade receivables 49,555 41,790
Sales to franchises 73,015 60,475
Public entities 149,196 82,393
Other current receivables 55,556 55,377
Total 327,322 240,035
2005 2004
Net assets Investment
2005 2004 2005 2004
Spain 1,559,229 1,260,466 268,700 314,937
Rest of Europe 2,364,690 2,000,757 448,471 312,399
AmErica 382,695 305,234 75,236 40,393
Asia and Rest of the World 94,464 82,720 40,203 36,881
Total 4,401,078 3,649,177 832,609 704,610
56-89 CUENTAS 1.qxp 27/6/06 11:13 Página 74

FINANCIAL PERFORMANCE INDITEX 2005 75
11.INVENTORIESDetails at 31 January 2006 and 2005 are as follows:
The amount of the write-down of inventories measured at net realisable value (as it is lower than
cost of acquisition or production) amount to Euros 27,782 thousand at 31 January 2006 (Euros 24,648
thousand at 31 January 2005) and mainly relate to the final season´s stock.
The Group contracts insurance policies to cover potential inventory-related risks.
12. PROPERTY, PLANT AND EQUIPMENTDetails of and movement in the Property, plant and equipment caption of the consolidated balance
sheet are as follows:
Raw materials and consumables 35,735 37,933
Work in progress 17,074 16,892
Finish goods for sale 631,583 463,045
Total 684,392 517,870
2005 2004
Land andbuildings
Leaseholdimprovements& machineryand furniture
Other Advances andwork in progress
TOTAL
COSTBalance at 01/02/2004 551,168 1,821,056 89,523 54,696 2,516,443
Acquisitions 34,926 478,085 11,272 74,886 599,169
Acquisition of entities 0 3,606 0 0 3,606
Disposals (2,714) (88,566) (2,208) (3,463) (96,951)
Transfers 5,803 48,017 414 (40,352) 13,882
Effect of movements
in foreign exchange (203) (11,193) (316) (1,484) (13,196)
Restatement due to inflation 1,639 2,878 106 0 4,623
Balance at 31/01/2005 590,619 2,253,883 98,791 84,283 3,027,576
Balance at 01/02/2005 590,619 2,253,883 98,791 84,283 3,027,576
Acquisitions 1,977 607,823 15,291 108,221 733,312
Acquisition of entities 0 8,614 0 0 8,614
Disposals (13,392) (96,583) (1,987) (16,084) (128,046)
Transfers 26,143 43,824 (1,741) (71,271) (3,045)
Effect of movements
in foreign exchange 1,585 25,130 1,036 942 28,693
Balance at 31/01/2006 606,932 2,842,691 111,390 106,091 3,667,104
DEPRECIATIONBalance at 01/02/2004 96,722 664,872 42,986 - 804,580
Depreciation charge for
the year 17,730 218,843 11,777 - 248,350
Acquisition of entites 0 562 0 - 562
Disposals (1,595) (42,333) (2,946) - (46,874)
Transfers (756) 1,904 208 - 1,356
Effect of movements
in foreign exchange (860) (3,177) (257) - (4,294)
Restatement due to inflation 816 5,882 284 - 6,982
Balance at 31/01/2005 112,057 846,553 52,052 - 1,010,663
Balance at 01/02/2005 112,057 846,553 52,052 - 1,010,663
Depreciation charge for the year 11,925 275,252 11,645 - 298,822
Reversal of impairment losses (3,129) (75,030) (1,575) - (79,734)
Transfers 726 1,844 (738) - 1,832
Effect of movements
in foreign exchange 38 (1,212) 708 - (466)
Balance at 31/01/2006 121,617 1,047,407 62,092 - 1,231,117
IMPAIRMENT LOSSES (NOTE 35-H)Balance at 01/02/2004 0 13,310 0 - 13,310
Impairment charge 0 1.453 0 - 1,453
Balance at 31/01/2005 0 14,763 0 - 14,763
Balance at 01/02/2005 0 14,763 0 - 14,763
Impairment charge 0 13,271 0 - 13,271
Applications 0 (2,078) 0 - (2,078)
Balance at 31/01/2006 0 25,956 0 - 25,956
NET CARRYING AMOUNTBalance at 31/01/2005 478,562 1,392,567 46,739 84,283 2,002,151
Balance at 31/01/2006 485,315 1,769,328 49,298 106,091 2,410,032
56-89 CUENTAS 1.qxp 27/6/06 11:13 Página 75

The ¨Other¨ caption includes, for instance, computer hardware and vehicles.
The cost of fully depreciated items under property, plant and equipment at 31 January 2006 and 31
January 2005 is Euro 237,601 thousand and Euro129,862 thousand, respectively.These mainly corres-
pond to machinery and furniture.
The Group contracts insurance policies to cover potential risks affecting items under property, plant and
equipment.
Through its corporate management risk policy, the Group identifies, assesses and controls damage and
responsibility-related risks to which its subsidiaries are exposed. It does this by compiling and measu-
ring the main risks of damage, loss of profits and responsibilities affecting the Group and implements
prevention and protection policies aimed at reducing the frequency and intensity of these risks.
Standard measurement criteria are established at corporate level which enable the different exposure
risks to be quantified and measured.
The Group contracts insurance policies through corporate insurance programs to protect its equity from
risk and establishes limits, policy excesses and conditions according to the nature thereof and the finan-
cial relevance of the subsidiary. This structure mainly comprises three worldwide insurance programs
which comprise the main risks insured by the Group.
13. INVESTMENT PROPERTYInvestment property mainly corresponds to premises and other properties leased to third parties. Move-
ment in this caption during 2005 and 2004 is as follows:
FINANCIAL PERFORMANCE INDITEX 200576
Opening balance 13,543 13,543
Acquisitions 6,101 0
Disposals 0 0
Closing balance 19,644 13,543
2005Cost 2004
Opening balance 3,008 2,446
Acquisitions 2,409 562
Disposals 0 0
Closing balance 5,417 3,008
Net carrying amount 14,227 10,535
2005Amortisation and depreciation 2004
56-89 CUENTAS 1.qxp 27/6/06 11:13 Página 76
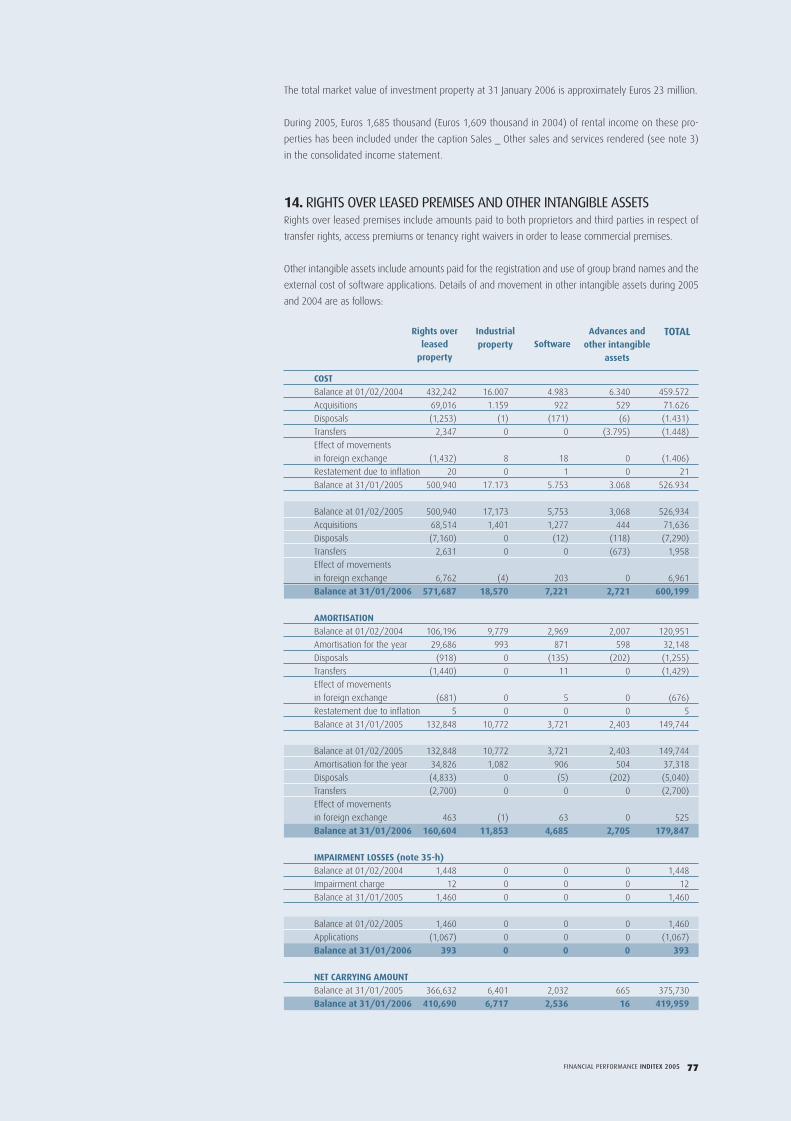
FINANCIAL PERFORMANCE INDITEX 2005 77
The total market value of investment property at 31 January 2006 is approximately Euros 23 million.
During 2005, Euros 1,685 thousand (Euros 1,609 thousand in 2004) of rental income on these pro-
perties has been included under the caption Sales _ Other sales and services rendered (see note 3)
in the consolidated income statement.
14. RIGHTS OVER LEASED PREMISES AND OTHER INTANGIBLE ASSETSRights over leased premises include amounts paid to both proprietors and third parties in respect of
transfer rights, access premiums or tenancy right waivers in order to lease commercial premises.
Other intangible assets include amounts paid for the registration and use of group brand names and the
external cost of software applications. Details of and movement in other intangible assets during 2005
and 2004 are as follows:
Industrial property Software
Advances andother intangible
assets
Rights overleased
property
TOTAL
COSTBalance at 01/02/2004 432,242 16.007 4.983 6.340 459.572
Acquisitions 69,016 1.159 922 529 71.626
Disposals (1,253) (1) (171) (6) (1.431)
Transfers 2,347 0 0 (3.795) (1.448)
Effect of movements
in foreign exchange (1,432) 8 18 0 (1.406)
Restatement due to inflation 20 0 1 0 21
Balance at 31/01/2005 500,940 17.173 5.753 3.068 526.934
Balance at 01/02/2005 500,940 17,173 5,753 3,068 526,934
Acquisitions 68,514 1,401 1,277 444 71,636
Disposals (7,160) 0 (12) (118) (7,290)
Transfers 2,631 0 0 (673) 1,958
Effect of movements
in foreign exchange 6,762 (4) 203 0 6,961
Balance at 31/01/2006 571,687 18,570 7,221 2,721 600,199
AMORTISATIONBalance at 01/02/2004 106,196 9,779 2,969 2,007 120,951
Amortisation for the year 29,686 993 871 598 32,148
Disposals (918) 0 (135) (202) (1,255)
Transfers (1,440) 0 11 0 (1,429)
Effect of movements
in foreign exchange (681) 0 5 0 (676)
Restatement due to inflation 5 0 0 0 5
Balance at 31/01/2005 132,848 10,772 3,721 2,403 149,744
Balance at 01/02/2005 132,848 10,772 3,721 2,403 149,744
Amortisation for the year 34,826 1,082 906 504 37,318
Disposals (4,833) 0 (5) (202) (5,040)
Transfers (2,700) 0 0 0 (2,700)
Effect of movements
in foreign exchange 463 (1) 63 0 525
Balance at 31/01/2006 160,604 11,853 4,685 2,705 179,847
IMPAIRMENT LOSSES (note 35-h)Balance at 01/02/2004 1,448 0 0 0 1,448
Impairment charge 12 0 0 0 12
Balance at 31/01/2005 1,460 0 0 0 1,460
Balance at 01/02/2005 1,460 0 0 0 1,460
Applications (1,067) 0 0 0 (1,067)
Balance at 31/01/2006 393 0 0 0 393
NET CARRYING AMOUNTBalance at 31/01/2005 366,632 6,401 2,032 665 375,730
Balance at 31/01/2006 410,690 6,717 2,536 16 419,959
56-89 CUENTAS 1.qxp 27/6/06 11:13 Página 77

FINANCIAL PERFORMANCE INDITEX 200578
15. GOODWILL Details of and movement in goodwill during 2005 and 2004 are as follows:
Goodwill corresponding to Stradivarius Espa_a, S.A. was generated upon acquisition of this company in
1998 and is stated at its net carrying amount at 1 February 2004, the date of transition to EU-IFRS (see
note 34).
Additions in 2004 comprise the acquisition of 98% of BCN Diseños, S.A. de C.V., which until then held the
franchise rights to Massimo Dutti stores in Mexico.
In 2005 Inditex acquired a 51% share in the Polish company Young Fashion Sp. Z.o.o., which until then
held the franchise rights to Zara in that country, and irrevocably undertook to acquire an additional 29% in
February 2008. The voting rights of 80% of share capital had already been acquired by Inditex, for which it
paid approximately Euros 14,582 thousand in August 2005, although legal ownership of the aforementio-
ned 29% of shares will remain with Young Fashion Sp. Z.o.o. until the agreed date. The contribution to net
profit since its incorporation into the Group and up to 31 January 2006 amounted to Euros 2,546 thousand.
Inditex granted the seller a put option on 20% of the remaining share capital, which is exercisable betwe-
en April and May 2008 for a price conditional on the company´s results, but with a set minimum of Euros
8 million. In the event this option is not exercised, the minority interest has a further put option on the
20% share which may be exercised as of June 2008 and which will depend exclusively on results for the
year prior to that in which the option is exercised, with no set minimum. Inditex has a call option on the
remaining 20% of the company, exercisable as of May 2011 for a strike price which depends exclusively
on the results of the company during the year prior to that in which the option is exercised.
These acquisitions had the following effect on the GroupÅfs assets and liabilities in 2005 and 2004:
Opening balance 68,777 53,253
Acquisitions 10,983 15,524
Other (666) 0
Closing balance 79,094 68,777
2005 2004
Stradivarius España S.A. 53,253 53,253
BCN Diseños, S.A. de C.V. 14,858 15,524
Young Fashion, S.p. Zo.o 10,983 0
Closing balance 79,094 68,777
2005Subsidiary 2004
2005 2004Young Fashion BCN Diseños
Property, plant and equipment 8,614 3,044
Other non-current assets 218 130
Cash and cash equivalents 580 1,397
Inventories 2,361 1,453
Other current assets 252 220
Current liabilities (3,349) (1,036)
non-current liabilities (4,187) (108)
Net identifiable assets and liabilities 4.489 5,100
Goodwill 10,983 15,524
Cost of acquisition 15,472 20,624
Amount disbursed 14,582 20,624
Cash acquired (580) (1,397)
Net cash outflow 14,002 19,227
56-89 CUENTAS 1.qxp 27/6/06 11:13 Página 78

FINANCIAL PERFORMANCE INDITEX 2005 79
Goodwill is tested for impairment, although it has not been considered necessary to recognise any
amount to date (see note 35-h).
16. INVESTMENTSDetails of and movement in investments during 2005 and 2004 are as follows:
Non-current investment securities mainly correspond to a Euros 4,955 thousand stake in Banco Galle-
go, S.A.
¨Loans and other credit facilities¨ include an amount of Euros 20 million extended to LÅfInnominato,
S.p.A., which holds 20% of the share capital of Zara Italia, S.R.L. and other subsidiaries domiciled in
Italy. This credit facility is secured by a pledge over the Zara Italia, S.R.L. shares, accrues interest at a
market rate and may be offset with the amounts payable in the event the reciprocal options betwe-
en Inditex and the borrower are exercised (see note 6).
The investment in Economic Interest Groupings (EIGs) comprises Inditex´s shareholding in nine
economic interest groupings, the activity of which is the leasing of assets managed by a separa-
te, non-group entity which retains most of the profits and is exposed to the risks associated with
this activity. These groupings have applied the fiscal incentives established in prevailing Spanish
legislation (see note 24), the effect of which is shown under ¨Income tax¨ in the consolidated
income statement.
17. INVESTMENTS IN ASSOCIATESInvestments in associates comprises Inditex’s 39.97% stake in Fibracolor, S.A.
Movement in this caption during 2005 and 2004 is as follows:
El movimiento de este epígrafe durante los ejercicios 2005 y 2004 ha sido el siguiente:
Fibracolor, S.A ia a Spanich company whose principal activity is the dyeing and printing of all types of
fabrics, as well as other related finishing processes. The main shareholder are Inditex, wich holds
39,9% of the share capital, and Empresa de Promoció i Localització Industrial de Catalunya, S.A.
(Eplicsa), a public company with a 25,2% stake . The Remaining shares are divided among sharehol-
ders, none of wich hold more than 7 % of share capital. Fibracolor, S.A renders services ti the Inditex
group, wich represent approximately 36% of revenues for 2005 (19% in 2004).
TotalLoans andother credit
facilities
Bankdeposits
Investmentir EIG’S
Investmentsecurieties
Balance at 01/02/2004 5,991 15,576 6,536 7,555 35.658
Acquisitions 225 36,405 2,010 684 39.324
Disposals (600) (16,420) 0 (4,492) (21.512)
Balance at 31/01/2005 5,616 35,561 8,546 3,747 53.470
Balance at 01/02/2005 5,616 35,561 8,546 3,747 53,470
Acquisitions 100 0 2,455 21,246 23,801
Disposals 0 (13,383) 0 (66) (13,449)
Transfer to current assets 0 0 0 (2,576) (2,576)
Other (225) 0 0 0 (225)
Balance at 31/01/2006 5,491 22,178 11,001 22,351 61,021
Opening balance 7,232 7,612
Loss for the year (192) (358)
Other 0 (22)
Closing balance 7,040 7,232
2005 2004
56-89 CUENTAS 1.qxp 27/6/06 11:13 Página 79

18. OTHER NON-CURRENT ASSETSDetails of and movement in this caption of the consolidated balance sheet during 2005 and 2004 are
as follows:
Guarantees mainly correspond to amounts extended to proprietors of leased commercial premises to
ensure compliance with the conditions stipulated in the lease contract (see note 25).
19. TRADE AND OTHER PAYABLES Details of this caption of the 2005 and 2004 consolidated balance sheets are as follows:
FINANCIAL PERFORMANCE INDITEX 200580
As a result of the agreement between the shareholders of Fibracolor, during 2006 and 2007 Inditex is
required to acquire a total of 463,509 shares held by the public company EPLICSA which represent
13.45% share capital of Fibracolor. As a result of this acquisition, Inditex will hold majority voting
rights in this company. The shares will be sold at the net carrying amount at the 2006 or 2007 closing
dates, as appropriate, or their net carrying amount on the dates in which EPLICSA could have freely
elected to exercise its call options (31 December 2003, 2004 and 2005).
The investment in Fibracolor, S.A. has been classified as an investment in an associate, as Inditex is
understood to exercise no control over this company.
A summary of the financial information of Fibracolor S.A. and its subsidiaries at the 2005 and 2004
closing dates (in thousands of Euros) is as follows:
2005 (*) 2004Assets 60,694 69,268
Liabilities 37,130 44,738
Net equity 23,564 24,530
Income 29,071 39,163
Net loss (481) (524)
(*) Unaudited figures
Guarantees Other Total
Balance at 01/02/2004 47,259 5,564 52,823
Acquisitions 16,764 3,261 20,025
Disposals (1,793) 0 (1,793)
Loss for the year - (2,252) (2,252)
Transfers 0 3,578 3,578
Exchange (490) 0 (490)
Balance at 31/01/2005 61,740 10,151 71,891
Balance at 01/02/2005 61,740 10,151 71,891
Acquisitions 16,899 4,661 21,560
Disposals (5,206) 0 (5,206)
Loss for the year 0 (619) (619)
Transfers 134 0 134
Effects of movements in (598) 0 (598)
Foreign exchange
Balance at 31/01/2006 72,969 14,193 87,162
2005 2004 Trade payables 1,015,796 794,203Trade payables due to associates 41 190Personnel 87,703 78,774Public entities 283,467 151,583Other current payables 122,519 50,703Total 1,509,526 1,075,453
56-89 CUENTAS 1.qxp 27/6/06 11:13 Página 80

The maturity of group debt with banks at 31 January 2006 and 2005 is as follows:
21. PROVISIONSDetails of and movement in this caption of the consolidated balance sheets during 2005 and 2004 are
as follows:
FINANCIAL PERFORMANCE INDITEX 2005 81
20. NET FINANCIAL POSITIONDetails of ¨Cash and cash equivalents¨ in the consolidated balance sheets are as follows:
Cash in hand and at banks 444,456 297,515
Short-team deposits 359,070 323,888
Fixed income securities 184,879 150,439
Total cash and cash equivalents 988,405 771,842
2005 2004
Less than one year 209,192 163,733
Between one and five years 76,098 74,793
More than five years 0 44,392
285,290 282,918
2005 2004
EEuurroo 110099,,336622
AAmmeerriiccaann DDoollllaarr 5577,,883333
OOtthheerr EEuurrooppeeaann ccuurrrreenncciieess 6622,,996655
OOtthheerr AAmmeerriiccaann ccuurrrreenncciieess 1111,,991199
OOtthheerr ccuurrrreenncciieess 4433,,221111
285,290
2005
Details of group debt with banks are as follows:
31/01/2006 31/01/2005
Current Non-current Total Current Non-current Total
Loans 167,922 56,621 224,543 49,866 78,816 128,682
Credit facilities 32,799 0 32,799 95,998 6,731 102,729
Finance leases 6,755 13,302 20,057 13,370 24,969 38,339
Derivatives 0 0 0 4,389 0 4,389
Subscribed shares 0 6,176 6,176 0 7,378 7,378
Other financial debt 1,716 0 1,716 109 1,292 1,401
209,192 76,099 285,291 163,733 119,185 282,918
At 31 January 2006, the Group has a drawdown limit of Euros 691,692 thousand on its credit facilities
(Euros 482,633 thousand at 31 January 2005).
Financial debt interest is negotiated by the Group on the respective financial markets and usually con-
sists of a monetary index plus a spread in line with the solvency of the company (parent or subsidiary)
contracting the debt.
Financial debt is stated in the following currencies:
56-89 CUENTAS 1.qxp 27/6/06 11:13 Página 81

FINANCIAL PERFORMANCE INDITEX 200582
Provision for pensions and similar obligations with personnel
In accordance with prevailing collective labour agreements, certain group companies are obliged to
pay retirement bonuses which do not constitute defined benefit plans and, accordingly, the Group is
not exposed to any investment or actuarial risk. The Group has created a provision to cover the liability
corresponding to the estimated accrued portion at the closing date (see note 28).
Balance at 01/02/2005 3,923 27,805 31,728
Provisions made during the year 657 12,420 13,077
Provisions used during the year (224) (3,484) (3,708)
Transfers (129) 129 0
Effect of movements in foreign exchange 80 789 869
Balance at 31/01/2006 4,307 37,659 41,966
Responsibilities Total Pensions and similar
obligations with personnel
Provision for responsibilities
Given the Group´s international presence, it has certain legal, customs, tax and other contingencies.
The amounts shown here correspond to current obligations from legal claims or implicit obligations
deriving from past actions which include a probable outflow of resources which has been reliably esti-
mated. At the date of preparation of these accounts, there are no litigation proceedings the final out-
come of which could significantly affect the Company´s equity situation.
The directors of Inditex consider that the provisions recorded in the consolidated balance sheet ade-
quately cover risks deriving from litigation proceedings, arbitration hearings and other contingencies,
and do not expect any additional liabilities to arise therefrom. Given the nature of the risks, it is not
possible to estimate the dates on which it may be necessary to settle any eventual liabilities.
22. OTHER NON-CURRENT LIABILITIESDetails of and movement in this caption of the consolidated balance sheets during 2005 and 2004 are
as follows:
Acquisitions through profit and loss have been recognised under ¨Other operating expenses¨ (Euros
31,672 thousand in 2005 and Euros 8,563 thousand in 2004) (see note 6) and ¨Net financing reve-
nue/costs¨ (Euros 340 thousand in 2005 and Euros 1,174 thousand in 2004) (see note 7) of the con-
solidated income statement.
Balance at 01/02/2004 164,214 29,396 11,558 5,233 210,401
Acquisitions 4,573 43,509 0 446 48,528
Changes throught profit and loss 9,736 (3,627) - - 6,109
Transfers of assets - 9,113 - - 9,113
Disposals (57,141) - (10,414) - (67,555)
Effect of movements
in foreign exchange 539 (14) 0 0 525
Balance at 31/01/2005 121,921 78,377 1,144 5,679 207,121
Balance at 01/02/2004 121,921 78,377 1,144 5,679 207,121
Acquisitions 32,221 42,537 0 8,843 83,601
Changes throught profit and loss 31,268 (6,879) 0 0 24,389
Disposals (39,721) 0 0 0 (39,721)
Transfers to current liabilities (67,451) 0 (1,144) 0 (68,595)
Effect of movements
in foreign exchange (432) 0 0 0 (432)
Balance at 31/01/2006 77,806 114,035 0 14,522 206,363
Non-currentpayables
Other TotalLease incentives
Options with partners
56-89 CUENTAS 1.qxp 27/6/06 11:13 Página 82

FINANCIAL PERFORMANCE INDITEX 2005 83
23. CAPITAL AND RESERVESShare capital
At 31 January 2006 and 2005, parent company share capital amounted to Euros 93,499,560 and is
represented by 623,330,400 registered shares of Euros 0.15 par value each, subscribed and fully paid.
All shares belong to a single class and series, have the same voting and profit sharing rights and are
represented by book entries.
Inditex shares are listed on the four Spanish stock exchanges and, consequently, the Company is una-
ware of exactly how its share capital is held. According to public information registered with the Spa-
nish Stock Exchange Commission, at 31 January 2006 the members of the board of directors or related
companies controlled approximately 59.90% of parent company share capital, which is the same per-
centage as at 31 January 2005 (see note 31).
Own shares
Own shares held by the Inditex Group comprise the following:
- 41,000 own shares at 31 January 2006 (same number as at 31 January 2005) with an average acqui-
sition cost of Euros 2.18 per share.
- 2,348,383 shares (2,517,981 at 31 January 2005) with an acquisition cost of Euros 2.93 per share,
corresponding to the following operation:
At the meetings held on 20 July 2000, 19 January and 20 April 2001 the shareholders of Inditex agre-
ed to launch a share option plan which allowed board members and management of Inditex and its
group of subsidiaries to obtain option rights over a maximum of 3,018,400 ordinary Inditex shares of
Euros 0,15 par value each.
In order to hedge the share option plan, Banco Bilbao Vizcaya Argentaria, S.A. subscribed
3,018,400 shares of a capital increase carried out in January 2001 and signed a call option agree-
ment in favour of Inditex whereby the latter could acquire the shares for sale to beneficiaries in
the event they exercised their option rights. This financial entity also subscribed a swap contract
with Inditex in order to set the return on the investment in the Company´s shares and regulate
the associated cash flows. Upon finalisation of the execution period of this plan, 2,348,383 resi-
dual shares remained, which the shareholders of Inditex at their annual general meeting may
use for new share option plans for the directors of Inditex and group company personnel.
In the event that Banco Bilbao Vizcaya Argentaria, S.A. holds any residual shares on 30 January 2007,
Inditex undertakes to propose to the shareholders at the first general meeting (whether ordinary or
extraordinary) held after that date that a capital reduction be carried out through the redemption of
any shares held by Banco Bilbao Vizcaya Argentaria, S.A. which have not been reacquired by Inditex
for Euros 2.93 per share.
24. INCOME TAXCompanies whose information is incorporated in these consolidated annual accounts file tax returns
on an individual basis, with the exception of Inditex, S.A. and Indipunt, S.L.
Inditex, S.A. is the parent of a group of companies which files consolidated tax returns in Spain. The
consolidated fiscal group is composed of Inditex, S.A., the parent, and Spanish subsidiaries which
comply with prevailing tax legislation for filing consolidated tax returns. The subsidiaries that make up
the aforementioned tax group are the following:
56-89 CUENTAS 1.qxp 27/6/06 11:13 Página 83

FINANCIAL PERFORMANCE INDITEX 200584
Indipunt, S.L. is also the parent company of a separate fiscal group whose sole subsidiary is Jema Cre-
aciones Infantiles, S.A.
"Income tax payable" in the consolidated balance sheet includes the liability for applicable taxes,
which in turn includes, inter alia, the 2005 income tax provision, net of withholdings and payments on
account made during the period. The “Trade and other payables” caption includes the liability for the
taxes other than income tax.
"Trade and other receivables" in the consolidated balance sheet mainly includes the difference betwe-
en VAT recoverable and VAT receivable during the year
Inditex, S.A. holds a 49% stake in nine economic interest groupings, the principal activity of which is
the leasing of assets. These groupings requested from the tax authorities, and were granted, tax incen-
tives regulated in the Fifth Additional Clause of the Revised Text on Income Tax Law.
This year, these economic interest groupings generated tax loss carryforwards which reduced the inco-
me tax expense and which Inditex has opted to apply to the taxable period in which the annual
accounts are approved. This investment is considered a financing and fiscal operation, the net estima-
ted result of which is included in income tax over its expected life. Forecast future years taxable and
accounting income have raised 2005 accrued income tax by Euros 21,754 thousand, and the net
impact of these investments, taking into account negative permanent differences and deductions, on
the income statement through income tax is revenue of Euros 4,247 thousand (see note 16).
The income tax expense includes both current and deferred income tax. The composition is as follows:
Choolet, S.A.
Comditel, S.A.
Denllo, S.A.
Confecciones Fíos, S.A.
Confecciones Goa, S.A.
Hampton, S.A.
Kenner, S.A.
Nikole, S.A.
Oysho España, S.A.
Trisko, S.A.
Zintura, S.A.
Often Textil, S.A.
Kettering, S.A.
Zara España, S.A.
Bershka BSK España, S.A.
Bershka Logística, S.A.
Zara Logística, S.A.
Inditex, S.A.
Pull & Bear España, S.A.
Kiddy´s Class España, S.A.
Zara Home España, S.A.
Grupo Massimo Dutti, S.A.
Goa-Invest, S.A.
Oysho Logística, S.A.
Lefties España, S.A.
Pull & Bear Logística, S.A.
Glencare, S.A.
Sircio, S.A.
Zara, S.A.
Plataforma Europa, S.A.
Stear, S.A.
Massimo Dutti Logística, S.A.
Samlor, S.A.
Zara Home Logística, S.A.
Stradivarius España, S.A.
Plataforma Logística León, S.A.
Current taxes 243,838 204,470
Deferred taxes 46,745 46,487
290,583 250,957
2005 2004
56-89 CUENTAS 1.qxp 27/6/06 11:13 Página 84

FINANCIAL PERFORMANCE INDITEX 2005 85
2005 2004Profit before taxes 1,101,446 896,754
Income tax using the domestic
corporation tax rate (35%) 385,506 313,864
Permanent differences (11,087) (27,395)
Effect of tax losses utilized (6,023) (2,278)
Effect of tax rates in foreign jurisdictions (37,612) (30,362)
Tax credits and deductions (83,077) (47,971)
Foreign taxes 11,422 7,591
Other concepts 31,454 37,508
Income tax expense 290,583 250,957Temporary differences (46,745) (46,421)
Net income tax 243,838 204,536
Positive permanent differences mainly correspond to non-deductible expenses, charges to non-deduc-
tible provisions and the portion of the contribution of rights to use certain assets to a subsidiary attri-
butable to taxable income.
Negative permanent differences basically correspond to tax loss carryforwards generated by the eco-
nomic interest groupings for the purposes of fiscal transparency.
Temporary differences have given rise to the corresponding deferred tax assets and liabilities, move-
ment in which during 2005 and 2004 is as follows:
As permitted by prevailing legislation, companies comprising the consolidated Spanish Group have,
in general, applied tax credits and deductions for double taxation and investments. Although these
companies have not yet filed their income tax returns for 2005, deductions and credits of Euros
Deferred tax liabilities: 2005 2004 Lease operations 6,014 8,103
Intragroup operations 62,854 53,967
Amortisation 21,846 15,703
Reinvestment of profits 5,690 5,895
Other 10,331 7,123
Total 106,735 90,791
Deferred tax assets: 2005 2004 Provisions 18,132 19,293
Amortisation 23,408 17,795
Tax losses 24,286 8,590
Other 11,890 15,689
Total 77,716 61,367
83,077 thousand (Euros 47,971 thousand in 2004) have been included in the income tax provision,
which is shown in the accompanying annual accounts.
A reconciliation of the income tax expense by applying the prevailing Spanish income tax rate to "Profit
before tax" and the expense recorded in the consolidated income statement, and a reconciliation
thereof with the net income tax expense for 2005 and 2004, is as follows:
56-89 CUENTAS 1.qxp 27/6/06 11:13 Página 85

FINANCIAL PERFORMANCE INDITEX 200586
At 31 January 2006, the Group has tax losses of Euros 75,796 thousand which may be offset
against future profits, the majority of which may be utilised indefinitely. Deferred tax assets in
respect of tax losses are only recognised when it is probable that future taxable profits will be
available against which the asset can be utilised.
Spanish group companies have open to inspection by the tax authorities all main applicable
taxes since 31 January 2001. The directors do not expect that any significant additional liabilities
affecting group equity or results would arise in the event of inspection.
25. OPERATING LEASESMost of the commercial premises from which the Group carries out its retail distribution activi-
ties are leased from third parties. These rental contracts are classified as operating leases since,
irrespective of the lease term and the amounts paid or due to the owners of the leased premi-
ses, there is no transfer of risks and benefits incidental to ownership thereof.
Due to the presence of the Group in different countries, the variety of legislation governing ren-
tal contracts, the diverse nature and economic status of the owners and other factors, there is a
large number of clauses regulating rental contracts.
In many cases the lease contracts simply establish a fixed rental payment, normally made on a
monthly basis and reviewed in accordance with a price index to take into account the effect of
inflation. In other cases the amounts payable to the lessor are a percentage of the sales obtai-
ned by the Group in the leased premises. These variable lease payments or contingent rent
may have minimum guaranteed amounts or certain rules of calculation attached. In some coun-
tries, lease contracts are subject to periodic indexing to market rates, which on occasion are
carried out when this would entail an increase in rent, but not when market rates are lower. On
occasion, staggered rental payments are agreed, which means it is possible to reduce cash out-
flows during the initial years of commercial premises use, even if the expense is recognised on
a straight-line basis (see note 35-r). Grace periods are also frequently established in order to
avoid having to pay rent when premises are being reformed and prepared for opening.
Rental contracts also sometimes require lessees to pay certain amounts to the lessor, which,
from an economic perspective, could be considered advance rental payments, or to the pre-
vious tenants so that they waive certain rights or transfer them to the Group (transfer rights or
different types of indemnities). These amounts are recognised as non-current assets (see note
14) and are generally amortised over the term of the lease contract.
On certain occasions, shopping centre developers or the proprietors of leased premises make
contributions towards the establishment of the Group’s business in their premises. These con-
tributions are considered to be lease incentives (see note 22) and are recognised in the income
statement over the lease term.
A wide variety of situations also apply to the duration of lease contracts, which generally
have an initial term of between 15 and 25 years. However, legislation in certain countries or
the situations in which lease contracts are typically used means the duration of contacts is
sometimes shorter. In some countries, legislation or the lease contracts themselves protect
the right of the lessee to terminate the contract providing sufficient advance notice (e.g.
three months) is given. In other cases, however, the Group is obliged to comply with the full
56-89 CUENTAS 1.qxp 27/6/06 11:13 Página 86

FINANCIAL PERFORMANCE INDITEX 2005 87
Minimun instalments 444,315 358,455
Contingent instalments 132,726 109,646
577,041 468,101
Sub-leasing instalments 4,186 2,833
2005 2004
term of the contract, or a significant part thereof. Some contracts combine these undertakings
with termination clauses that may only be exercised at certain times over the term of the con-
tract (e.g. every five years or at the end of the tenth year).
Details of operating lease expenses are as follows:
Future minimum payments under non-cancellable operating leases are as follows:
2005 2004
Less than 1year
Between 1and 5 years
More than5 years
Less than 1year
Between 1and 5 years
More than5 years
Lease payments 396,123 788,500 787,981 386,548 720,266 715,624
26. FINANCE LEASESThe Group has contracted finance leases mainly for commercial premises and logistics centres. The
corresponding leased assets are recorded under property, plant and equipment in the consolidated
balance sheet (see note 12), while the related debt is recognised as a financial liability (see note
20). The net carrying amount of items acquired under lease financing and the future amounts paya-
ble until the leases expire are as follows:
27. RISK MANAGEMENT AND FINANCIAL INSTRUMENTSFinancial risk management policies
The Group’s activities are exposed to certain types of financial risk: market risk (including exchange
rate risk), credit risk, liquidity risk and interest rate risk on cash flows. The Group´s risk management
policy centres on the uncertainty of financial markets and attempts to minimise potential adverse
effects on the Group’s profitability through the use of certain financial instruments as described
below.
Cost of the asset 75,968 84,758
Accumulated depreciation (14,294) (13,950)
61,674 70,808
2005 2004
Minimum payments Present value of minimum payments
2005 2004 2005 2004
Less than one year 8,166 8,756 7,505 7,898
Between one and five years 18,066 25,311 15,734 22,396
More than five years 3,475 4,396 3,227 4,071
29,708 38,463 26,467 34,365
56-89 CUENTAS 1.qxp 27/6/06 11:13 Página 87

FINANCIAL PERFORMANCE INDITEX 200588
� Exchange rate risk
The Group operates in an international environment and, accordingly, is exposed to exchange rate
risk, particularly as regards the US Dollar, the Mexican Peso, the Japanese Yen and the Pound Ster-
ling. Exchange rate risk arises on future commercial transactions, assets and liabilities recorded in
foreign currencies and net investments in foreign businesses.
In order to control the exchange rate risk on future commercial transactions and assets and liabili-
ties recorded in currencies other than the Company’s operating currency, group companies use for-
ward exchange contracts. The Group manages each currency’s net position through external foreign
currency contracts or other financial instruments.
Although the Group has not applied this year the hedge accounting established under EU-IFRS, the
Group hedges expected transactions, particularly imports and exports, for each upcoming season.
The Group has various investments in foreign businesses, the net assets of which are exposed to
exchange rate risk which is managed in line with group management policies.
� Credit risk
The Group is not exposed to significant concentrations of credit risk, as policies are in place to cover
sales to franchises and retail sales comprise the vast majority of revenue. Collections are primarily
made in cash or through credit card payments.
� Liquidity and interest rate risk
The Group is not exposed to significant liquidity risk, as it maintains sufficient cash and cash equiva-
lents to meet the outflows of normal operations. In the event the Group requires financing, either in
Euros or in other currencies, the Group reverts to loans, credit facilities or other types of financial
instruments (see note 20).
Interest rate fluctuations affect the fair value of assets and liabilities which accrue a fixed rate of
interest, as well as future cash flows and liabilities indexed to a variable interest rate. Group expo-
sure to this risk is not significant for the reasons mentioned above.
Financial instruments
The Group engages in derivative operations, mainly exchange rate derivatives, although for EU-IFRS
purposes it has not considered them this year to be hedging operations. The most widely used deri-
vatives are forward contracts and options.
Below are details of derivatives contracted by the Group and their fair value at 31 January 2006:
All of the above operations mature in less than 12 months.
The fair value valuations of exchange rate derivatives recorded under "Net financing revenue/costs"
in the 2005 consolidated income statement amount to Euros 1,729 thousand (expense of Euros
4,389 thousand at 31 January 2004).
Forward currency purchases EUR 42 GBP 172
USD 231 EUR 1,140
European options USD 23 EUR 451
Asian options GBP 33 EUR 351
MXP 693 USD (401)
Type of operation Currency purchase
Nominal purchase (foreign currency
thousands)
Currency sale
Fair value(euros thousand)
56-89 CUENTAS 1.qxp 27/6/06 11:13 Página 88

FINANCIAL PERFORMANCE INDITEX 2005 89
28. EMPLOYEE BENEFITSDefined benefit or contribution plan obligations
In general, the Group has no defined benefit or contribution plan obligations with its employees.
However, under prevailing labour legislation in certain countries, accident, illness, retirement and
other insurance policies are contracted, to which employees sometimes contribute. Furthermore, in
some countries employees receive a share of company profits, the liability for which is recognised
under “Trade and other receivables” and “Other non-current liabilities” in the consolidated balance
sheet. The impact of these obligations on the consolidated income statement and the consolidated
balance sheet is not significant.
As described in note 21, in accordance with collective labour agreements, certain group companies
are obliged to pay retirement bonuses which do not constitute defined benefit plans and, accor-
dingly, the Group is not exposed to any investment or actuarial risk. The Group has created a provi-
sion to cover the liability corresponding to the estimated portion accrued at the closing date, which
amounts to Euros 2,034 thousand at 31 January 2006.
Share-based remunerations
As mentioned in note 23, at the meetings held on 20 July 2000, 19 January and 20 April 2001 the
shareholders of Inditex agreed to launch a share option plan which allowed board members and
management of Inditex and its group of subsidiaries to obtain option rights over a maximum of
3,018,400 ordinary Inditex shares of Euros 0.15 par value each. Each option exercised entitled the
holder to one Inditex share. During 2001, option contracts were signed with a group of board mem-
bers and management whereby they could have been awarded a maximum of 1,382,913 share
options. The number of options to be awarded depended on the revaluation of Inditex shares on
the organised stock market in 2001, 2002 and 2003. The strike price of the options was Euros 2.93
and the exercise period commenced two years after each of the periods in which the revaluation
was calculated.
As the exercise of these options corresponded to share option plans accrued in previous years, no
amounts were accrued in 2005 and 2004 as a result of group employee share option plans.
29. INTEREST IN JOINT VENTURES
Inditex has a 50% share in the group formed by the parent Tempe, S.A. and its subsidiaries Tempe
México, S.A. de C.V., Tempe Brasil, S.A. and Tempe Logistica, S.A. The principal activity of these com-
panies is the design, supply and distribution of footwear to Inditex Group companies, their main cus-
tomer. The assets, liabilities, income and expenses of this joint venture are as follows:
Non-current assets 10,114 10,585
Current assets 68,029 53,185
Non-current liabilities (774) (2,525)
Current liabilities (46,545) (41,509)
Net assets 30,824 19,736
Revenues 18,484 13,475
Expenses (146,648) (126,825)
2005 2004
56-89 CUENTAS 1.qxp 27/6/06 11:13 Página 89

FINANCIAL PERFORMANCE INDITEX 200590
30. PROPOSED DISTRIBUTION OF PARENT COMPANY PROFITThe directors will propose that the 2005 net profit of the parent company, which amounts to Euros
520,669 thousand, be distributed as follows: Euros 417,631 thousand as dividends and Euros 103,038
thousand to voluntary reserves.
31. REMUNERATION OF THE BOARD OF DIRECTORS AND TRANSACTIONSWITH RELATED PARTIES
Remuneration of the board of directors
Remuneration received by the board of directors and top management during 2005 is shown in the
section on transactions with related parties.
As in 2004, the Group has no commitments in respect of pension plans or life insurance schemes.
Other information concerning the board of directors
According to the public registers of the Spanish Stock Exchange Commission (CNMV), at 31 January
2006 the members of the board of directors held the following direct and indirect investments in the
share capital of Inditex:w
As required by article 127 ter of the Companies Act, introduced by Law 26 of 17 July 2003, wich
modities the Stock Market Law 24 of 28 July 1988 and the Revised Text of the Companie Act to
underpin the transparency of publicly listed companies, below is a list of companies with a statutory
activity which is identical, similar or complementary to that of Inditex and in which members of its
board of directors hold investments or management positions.
Board member, manager or representative Number of direct Number of indirect % of share shares shares capital
Mr. Amancio Ortega Gaona 63 369,600,0001 52.294%
Mr. Pablo Isla Álvarez de Tejera 25,100 - 0.004%
Mr.. Carlos Espinosa de los Monteros Bernaldo de Quirós 34,385 - 0.006%
Mr. Francisco Luzón López 11,531 5652 0.002%
Ms. Irene R. Miller 30,239 - 0.005%
Mr. Juan Manuel Urgoiti López de Ocaña 27,739 - 0.004%
Mr.. José Luis Vázquez Mariño 3,000 - 0.000%
Mr. Antonio Abril Abadín 76,015 - 0.012%
GARTLER, S.L. 369,600,000 - 59.294%
Total 59.327%
1 Through Gartler, S.L.2 Through Cañabara, S.A.
90-109 CUENTAS 2 EN.qxp 27/6/06 10:31 Página 90

Name of board member Company tax number Company % ownership PostMr. Pablo Isla Álvarez de Tejera A78276854 Bershka BSK España, S.A. 0% Board member
Mr. Pablo Isla Álvarez de Tejera A15052160 Choolet, S.A. 0% Chairman of the board
Mr. Pablo Isla Álvarez de Tejera A15311368 Denllo, S.A 0% Chairman of the board
Mr. Pablo Isla Álvarez de Tejera A15037393 Confecciones Fíos, S.A 0% Chairman of the board
Mr. Pablo Isla Álvarez de Tejera A15018476 Confecciones Goa, S.A 0% Chairman of the board
Mr. Pablo Isla Álvarez de Tejera A15643620 Glencare, S.A 0% Chairman of the board
Mr. Pablo Isla Álvarez de Tejera A78115201 Grupo Massimo Dutti, S.A. 0% Board member
Mr. Pablo Isla Álvarez de Tejera A15155625 Hampton, S.A 0% Chairman of the board
Mr. Pablo Isla Álvarez de Tejera A15137318 Kenner, S.A 0% Chairman of the board
Mr. Pablo Isla Álvarez de Tejera A15049299 Nikole, S.A 0% Chairman of the board
Mr. Pablo Isla Álvarez de Tejera A15026347 Oysho España, S.A. 0% Board member
Mr. Pablo Isla Álvarez de Tejera A15108673 Pull&Bear España, S.A. 0% Board member
Mr. Pablo Isla Álvarez de Tejera A15022585 Samlor, S.A 0% Chairman of the board
Mr. Pablo Isla Álvarez de Tejera A15355290 Sircio, S.A 0% Chairman of the board
Mr. Pablo Isla Álvarez de Tejera A15568165 Stear, S.A 0% Chairman of the board
Mr. Pablo Isla Álvarez de Tejera A60348240 Stradivarius España, S.A. 0% Board member
Mr. Pablo Isla Álvarez de Tejera A15234065 Tempe, S.A. 0% Vice-Chairman of the board
Mr. Pablo Isla Álvarez de Tejera A15058324 Trisko, S.A 0% Chairman of the board
Mr. Pablo Isla Álvarez de Tejera A15022510 Zara España, S.A. 0% Board member
Mr. Pablo Isla Álvarez de Tejera A15121049 Zintura, S.A. 0% Chairman of the board
Mr. Pablo Isla Álvarez de Tejera ZME920824KM3 Zara México, S.A. de C.V. 0% Board member
Mr. Antonio Abril Abadín A78276854 Bershka BSK España, S.A. 0% Secretary, non-board member
Mr. Antonio Abril Abadín A78111671 Bershka Logística, S.A. 0% Secretary, non-board member
Mr. Antonio Abril Abadín A15114424 Comditel, S.A. 0% Secretary, non-board member
Mr. Antonio Abril Abadín A15052160 Choolet, S.A. 0% Secretary, non-board member
Mr. Antonio Abril Abadín A15311368 Denllo, S.A 0% Secretary, non-board member
Mr. Antonio Abril Abadín A15037393 Confecciones Fíos, S.A 0% Secretary, non-board member
Mr. Antonio Abril Abadín A15018476 Confecciones Goa, S.A 0% Secretary, non-board member
Mr. Antonio Abril Abadín A15643620 Glencare, S.A 0% Secretary, non-board member
Mr. Antonio Abril Abadín A15121031 Goa Invest, S.A. 0% Secretary, non-board member
Mr. Antonio Abril Abadín A78115201 Grupo Massimo Dutti, S.A. 0% Secretary, non-board member
Mr. Antonio Abril Abadín A15155625 Hampton, S.A 0% Secretary, non-board member
Mr. Antonio Abril Abadín G15632003 Inditex Cogeneración, A.I.E. 0% Joint administrator
Mr. Antonio Abril Abadín A80317043 Invercarpro, S.A. 0% Secretary, non-board member
Mr. Antonio Abril Abadín A15137318 Kenner, S.A 0% Secretary, non-board member
Mr. Antonio Abril Abadín A08478448 Kettering, S.A. 0% Secretary, non-board member
Mr. Antonio Abril Abadín A15388366 Kiddys Class España, S.A. 0% Secretary, non-board member
Mr. Antonio Abril Abadín A15334725 Lefties España, S.A. 0% Secretary, non-board member
Mr. Antonio Abril Abadín B83077594 Liprasa Cartera, S.A. 0% Secretary, non-board member
Mr. Antonio Abril Abadín A15569890 Massimo Dutti Logística, S.A. 0% Secretary, non-board member
Mr. Antonio Abril Abadín A15049299 Nikole, S.A 0% Secretary, non-board member
Mr. Antonio Abril Abadín A15346166 Often Textil, S.A. 0% Secretary, non-board member
Mr. Antonio Abril Abadín A15026347 Oysho España, S.A. 0% Secretary, non-board member
Mr. Antonio Abril Abadín A15327612 Oysho Logística, S.A. 0% Secretary, non-board member
Mr. Antonio Abril Abadín A15497225 Plataforma Europa, S.A. 0% Secretary, non-board member
Mr. Antonio Abril Abadín A70020714 Plataforma Logística de León, S.A. 0% Secretary, non-board member
Mr. Antonio Abril Abadín A15108673 Pull&Bear España, S.A. 0% Secretary, board member
Mr. Antonio Abril Abadín A15458128 Pull&Bear Logística, S.A. 0% Secretary, non-board member
Mr. Antonio Abril Abadín A15022585 Samlor, S.A 0% Secretary, non-board member
Mr. Antonio Abril Abadín A15355290 Sircio, S.A 0% Secretary, non-board member
Mr. Antonio Abril Abadín A15568165 Stear, S.A 0% Secretary, non-board member
Mr. Antonio Abril Abadín A60348240 Stradivarius España, S.A. 0% Secretary, non-board member
Mr. Antonio Abril Abadín A15234065 Tempe, S.A. 0% Vice-Secretary, board member
Mr. Antonio Abril Abadín A15058324 Trisko, S.A 0% Secretary, non-board member
Mr. Antonio Abril Abadín A08447427 Zara, S.A. 0% Secretary, non-board member
Mr. Antonio Abril Abadín A15022510 Zara España, S.A. 0% Secretary, board member
FINANCIAL PERFORMANCE INDITEX 2005 91
90-109 CUENTAS 2 EN.qxp 27/6/06 10:31 Página 91

Name of board member Company tax number Company % ownership PostMr. Antonio Abril Abadín A15710965 Zara Logística, S.A. 0% Secretary, non-board member
Mr. Antonio Abril Abadín A15121049 Zintura, S.A. 0% Secretary, non-board member
Mr. Antonio Abril Abadín 450661802 Zara Belgique, S.A. 0% Board member
Mr. Antonio Abril Abadín 895218121 Zara Canada, S.A. 0% Board member
Mr. Antonio Abril Abadín - Zara Chile, S.A. 0% Board member
Mr. Antonio Abril Abadín 24209717 Zara Danmark, S.A. 0% Board member
Mr. Antonio Abril Abadín 94352564 Zara Hellas, S.A. 0% Board member
Mr. Antonio Abril Abadín 803910010B01 Zara Vastgoed, B.V. 0% Board member
Mr. Antonio Abril Abadín 8753489B01 Zara Holding, B.V. 0% Supervisory Director
Mr. Antonio Abril Abadín - Zara Norge, S.A. 0% Board member
Mr. Antonio Abril Abadín 556569857701 Zara Sverige, Ab 0% Board member
Mr. Antonio Abril Abadín 548644 Zara Suisse, S.A.R.L. 0% Board member
Mr. Antonio Abril Abadín 213950900014 G.Zara Uruguay, S.A. 0% Board member
Mr. Antonio Abril Abadín 30536946-1 Zara Venezuela, S.A. 0% Board member
Furthermore, and in accordance with the above-mentioned law, no members of the board of direc-
tors carry out or have performed any activities in 2005 in companies with a statutory activity which
is identical, similar or complementary to that of Inditex.
Transactions with related parties
The Group maintains relations with related parties, such as subsidiaries, joint ventures and asso-
ciates, details of which are shown in Appendix I to the consolidated annual accounts, as well as
with significant or controlling shareholders, members of the board of directors of Inditex and
management.
Operations between Inditex and its subsidiaries, and the Group’s proportion of operations with joint
ventures, form part of regular activities, have been eliminated in the consolidation process and are
not shown in this note.
Following is shown the amount of operations between Inditex and joint ventures or associates which
have not been eliminated in the consolidation process as these are integrated by the proportional or
equity method.
Details operations with significant shareholders, the members of the board of directors and manage-
ment are as follows:
Significant shareholders:
According to the information in the public registers of the Spanish Stock Exchange Commission,
Mr. Amancio Ortega Gaona, through Gartler, S.L., holds 59.294% of Industria de Diseño Textil,
S.A. and is, therefore, the controlling shareholder of the Inditex Group. During 2005, operations
carried out by the Inditex Group with the controlling shareholder, or with persons or companies
related thereto, are as follows:
Associates 2,530 8,721
Joint Ventures 138,851 118,602
2005Entity
Thousand of euros
2004
Asset leasing (5,739) (6,054)
Works and lease contracts 8,608 3,014
Contractual
Contractual
2005Type of operationNature of the relationship
Amount (thousands of euros)
2004
FINANCIAL PERFORMANCE INDITEX 200592
90-109 CUENTAS 2 EN.qxp 27/6/06 10:32 Página 92

2005 2004
Remunerations 3,287 9,466
Indemnities 3,161 3,524
Share options - -
Board of directors Management
Remunerations 5,127 8,887
Indemnities 3,200 -
Share options 932 843
Board of directors Management
According to the table above, the Inditex Group has earned income on transactions with persons
or companies related to the controlling shareholder amounting to Euros 8,608 thousand. These
transactions correspond mainly to construction works performed by the group company Goa-
Invest, S.A., which were carried out under market conditions.
Various group companies have leased commercial premises belonging to companies related to
the controlling shareholder. The majority of these lease contracts were signed prior to 1994 and
mature between 2014 and 2016. According to the table above, lease payments made by the
Group on the aforementioned premises in 2005 amounted to Euros 5,739 thousand.
Members of the Board of Directors and Management:
In addition to remunerations and severance indemnities referred to in the corresponding
sections, the Group extended loans and advances to directors and management in 2005
amounting to Euros 708 thousand, which have been included under the caption "Trade and other
receivables" in the consolidated balance sheet at 31 January 2005, and which were repaid in full
during 2005.
Total remunerations and indemnities received by Inditex board members and management
during 2005 are as follows:
Total remunerations and indemnities received by Inditex board members and management
during 2004 are as follows:
32. EXTERNAL AUDITORSDetails of fees and expenses accrued by KPMG International (main auditor) and associated firms in
relation to services rendered to consolidated companies are as follows:
In addition to the audit of the Inditex Group annual accounts, audit services rendered by KPMG
International also include a limited review of the quarterly financial statements of certain group
companies.
Non-audit services, mainly relating to corporate social responsibility, include inspection of suppliers´
workshops and factories and other services rendered to certain foreign group subsidiaries.
According to information received from the auditors, fees received from the Inditex Group by KPMG
International or associated firms do not exceed 0.029% of total revenue.
Audit services 3,385 2,885
Other services 398 388
Total 3,783 3,273
FINANCIAL PERFORMANCE INDITEX 2005 93
90-109 CUENTAS 2 EN.qxp 27/6/06 10:32 Página 93

33. SUBSEQUENT EVENTS
Acquisition of the Zara franchise in Russia
On 31 January 2006, Inditex reached an agreement to acquire ZAO Stockmann Krasnoselskaya, a
company which operates the franchise for Zara stores in Russia. This acquisition must take place
before 31 May 2006, once the corresponding due diligence procedures have been carried out
and subject to approval from the Russian competition authorities. Inditex will have to pay Euros
41.5 million, net of financial and non-operating debts. At 31 January 2006, this company opera-
ted six stores.
Increase in investment in German stores
As described in note 6, Inditex reached an agreement in March 2006 to acquire 28% of the share
capital of Zara Deutschland GmbH, a company that operates Zara stores in Germany and which is
owned by Inditex and Otto GMBH and Co. When this agreement is exercised, subject to approval
from the German competition authorities, Inditex will increase its shareholding from 50% at 31
January 2006 to 78%. On the same date, the Group agreed to acquire the remaining 50% of the
rest of the subsidiaries domiciliated in Germany (see note 22).
Agreement for the incorporation of Zara Korea
Subsequent to the closing date, Inditex reached an agreement with Lotte Shopping Co, Ltd. to set up
operations in Korea during 2006. The agreement establishes that Lotte will hold a minority interest of
20% in Zara Korea, over which Inditex will have a call option. At the same time Lotte will hold a put
option over its entire interest. The options will not have any premium and the strike price will mainly
depend on the results of the subsidiary.
34. INTERNATIONAL FINANCIAL REPORTING STANDARDS These are the Inditex GroupÅfs first consolidated annual accounts prepared in accordance with
the International Financial Reporting Standards adopted by the European Union in conformity
with EC Regulation number 1606/2002 of the European Parliament and the Council of Europe.
The accounting policies set out in note 35 have been applied in the preparation of the consoli-
dated annual accounts for the year ended 31 January 2006, the comparative information pre-
sented in these consolidated annual accounts for the year ended 31 January 2005 and in the
preparation of an opening IFRS balance sheet at 1 February 2004 (date of transition). Accor-
dingly, in preparing its opening IFRS balance sheet, the Group has adjusted amounts reported
previously in annual accounts prepared by the board of directors in accordance with its former
basis of accounting (Spanish GAAP) and approved by the shareholders at the annual general
meetings.
The transition from Spanish GAAP to EU-IFRS involves retrospective application of these princi-
ples, except in the following cases where the Group has opted to apply the exemptions set out
in IFRS:
- Business combinations which occurred prior to 1 February 2004 have not been restated and
goodwill recorded under Spanish GAAP at that date has been maintained and tested for
impairment.
- Translation differences generated prior to 1 February 2004 have been taken to reserves.
EU-IFRS transition adjustments can be classified under the following categories:
- Adjustments which affect the recognition and measurement of assets and liabilities when the-
se criteria differ between EU-IFRS and Spanish GAAP.
- Presentation and classification changes in balance sheet and income statement entries.
FINANCIAL PERFORMANCE INDITEX 200594
90-109 CUENTAS 2 EN.qxp 27/6/06 10:32 Página 94

A summary of the impact of the main valuation adjustments on net equity, net of the tax effect,
together with an explanation thereof, is as follows:
VALUATION ADJUSTMENTS
The main valuation adjustments are as follows:
Amortisation of goodwill
As of the transition date, goodwill is no longer amortised but tested regularly for impairment.
The amount shown in the opening balance sheet corresponds to the net carrying amount of
goodwill under the accounting principles used prior to the transition date.
This adjustment has an impact of Euros 12,948 thousand on 2004 profit and equity, but does
not affect the opening balance sheet.
Reciprocal call/put options
As described in notes 6 and 22, at the transition date the Group had call options on inves-
tments held by partners in certain subsidiaries, which in turn had reciprocal sales options. This
is the case for a percentage of shares in Stradivarius España, S.A. and certain subsidiaries domi-
ciled in Germany, Italy, Japan and Mexico.
According to the economic substance of the transaction, reciprocal call/put options with simi-
lar strike prices should be treated as a deferred acquisition of the investments which constitu-
te the underlying asset. Consequently, the Inditex Group has control over these companies and
should consolidate all their assets, liabilities and results, and recognise a liability for the esti-
mated strike price of the options, any variations in which are taken to the income statement.
Equity or results attributable to minority interests are therefore not recognised, nor is goodwill
recorded when the options are exercised, as this involves the settlement of a liability pre-
viously recognised in the consolidated balance sheet.
Equity at Profit Equity at transition date 2004 at 31/01/2005
Spanish GAAP 2,105,947 628,130 2,502,692
Amortisation of goodwill 0 12,948 12,948
Purchase option over 9.95% of Stradivarius (13,593) 0 (16,103)
Purchase options in Germany, Japan, Italy and Mexico (114,969) (7,465) (122,036)
Straight-line recognition of rent (1,898) (2,722) (4,581)
Own shares (8,820) (815) (7,378)
Asset impairment (6,927) 9,326 2,399
Lease incentives (248) (1,048) (1,298)
Establishment costs and deferred expenses (6,468) 142 (6,296)
Exchange gains 376 (328) 125
Measurement of derivatives (3,037) 283 (2,754)
Presentation of minority interest 27,217 0 35,582
Total adjustments (128,367) 10,321 (109,392)
International Financial Reporting Standards (IFRS) 1,977,580 638,451 2,393,300
FINANCIAL PERFORMANCE INDITEX 2005 95
90-109 CUENTAS 2 EN.qxp 27/6/06 10:32 Página 95
The adjustment in respect of Stradivarius España, S.A. has reduced consolidated net equity by
Euros 16,103 thousand and Euros 13,593 thousand at 31 January 2005 and the transition date,
respectively, but does not affect profit for 2004.
The adjustment corresponding to the remaining companies has reduced equity by Euros
122,036 thousand and Euros 114,969 thousand at 31 January 2005 and the transition date, res-
pectively, and profit for 2004 by Euros 7,465 thousand.
Straight-line recognition of rent
Certain lease contracts for commercial premises in which the Group carries out its activity pro-
vide for grace periods or staggered rent during the lease period (see note 25). Under Spanish
GAAP, the lease expense was recorded as it was incurred in line with the specific conditions for
each period. Under EU-IFRS, operating lease instalments are recognised on a straight-line basis
over the lease period, irrespective of grace periods or staggered rent.
This adjustment has reduced equity by Euros 4,581 thousand and Euros 1,898 thousand at 31
January 2005 and the transition date, respectively, and net profit for 2004 by Euros 2,722
thousand.
Share call options
As described in note 23, Inditex has a call option on Inditex shares. Under EU-IFRS, this call
option subscribed with a financial entity should be recognised as a financial liability, and the
shares which constitute the underlying asset should be recorded as own shares by reducing
consolidated net equity.
Unlike the previous accounting treatment, the dividends on these shares do not reduce the
financial expense of the operation.
This adjustment has reduced equity by Euros 7,378 thousand and Euros 8,800 thousand at 31
January 2005 and the transition date, respectively, and net profit for 2004 by Euros 815 thousand.
Asset impairment
In the 2004 annual accounts prepared under Spanish GAAP, the Group recognised an impair-
ment loss of Euros 9.3 million on certain assets in which the discounted cash flows did not
exceed the value of the assets, which meant a portion of the investment would be irrecovera-
ble. As a result of the impairment test carried out under EU-IFRSs, this loss should have been
recognised prior to the transition date for an amount of Euros 6.9 million. Part of the remain-
der of the provision under Spanish GAAP does not strictly comply with the impairment requi-
rements established in EU-IFRS, and Euros 2.4 million was therefore reversed in the opening
balance sheet.
The corresponding impact has been an increase of Euros 2,399 thousand in consolidated net
equity at 31 January 2005, a reduction in consolidated net equity of Euros 6,927 thousand at
the transition date and an increase in net profit for 2004 of Euros 9,326 thousand.
Lease incentives
As described in note 25, the Group receives contributions from the owners of certain buildings
in which it carries out its activities. Under Spanish GAAP, these contributions are deferred and
recognised as income over the useful lives of the related assets as a reduction in the lease
expense.
According to EU-IFRS, these contributions should be considered lease incentives and deferred
and recognised as income over the lease period as a reduction in the lease expense.
FINANCIAL PERFORMANCE INDITEX 200596
90-109 CUENTAS 2 EN.qxp 27/6/06 10:32 Página 96
This adjustment has reduced consolidated net equity by Euros 1,298 thousand and Euros 248
thousand at 31 January 2005 and the transition date, respectively, and net profit for 2004 by
Euros 1,048 thousand.
Establishment costs and deferred expenses
Under Spanish GAAP, certain establishment costs and deferred expenses are stated at cost
less amortisation, which is generally calculated on a straight-line basis over a period of five
years.
In accordance with EU-IFRS, these costs are expensed as they are incurred.
These adjustments have reduced net consolidated equity by Euros 6,296 thousand and Euros
6,468 thousand at 31 January 2005 and the transition date, respectively, and increased net
profit for 2004 by Euros 142 thousand.
Translation differences
Under Spanish GAAP, foreign currency transactions were accounted for in euros at the rates of
exchange prevailing at the transaction date and adjusted at year end to the closing rate.
Exchange gains or losses on foreign currencies held by the Company were taken to profit or
loss, as appropriate, while exchange gains or losses arising on the translation of balances recei-
vable and payable to the closing rate were classified according to maturity and currency and
deferred and expensed, respectively.
According to EU-IFRS, exchange gains are also taken directly to profit and loss.
The corresponding impact has been an increase of Euros 125 thousand and Euros 376 thousand
in consolidated net equity at 31 January 2005 and the transition date, respectively, and a
reduction in net profit for 2004 of Euros 328 thousand.
Measurement of derivatives
The Group carries out certain financial operations (principally options and forward purchases of
foreign currencies) to hedge a portion of imports and exports carried out in foreign currencies.
Under Spanish GAAP, the gains or losses on these operations were taken to income or expense
when the instruments matured.
The Group has opted not to apply hedge accounting as defined under EU-IFRSs. Accordingly,
derivative financial instruments are recognised in the balance sheet at fair value through profit
and loss.
This adjustment has resulted in a reduction of Euros 2,754 thousand and Euros 3,037 thousand
in consolidated net equity at 31 January 2005 and the transition date, respectively, and an
increase of Euros 284 thousand in net profit for 2004.
Presentation of minority interest
Under Spanish GAAP, minority interests are shown under liabilities, whereas according to EU-
IFRS they should be presented in the consolidated balance sheet under equity and separate
from shareholders’equity attributable to the parent company.
This reclassification has entailed an increase in consolidated net equity of Euros 35,582 thou-
sand at 31 January 2005 and Euros 27,217 thousand at the transition date.
FINANCIAL PERFORMANCE INDITEX 2005 97
90-109 CUENTAS 2 EN.qxp 27/6/06 10:32 Página 97

CHANGES IN PRESENTATION AND CLASSIFICATION OF ACCOUNTING ENTRIES
The main changes in presentation and classification of accounting entries are as follows:
Sales of fabric to garment manufacturing centres
Under Spanish GAAP, net sales include sales of fabric to garment manufacturing centres with a
repurchase commitment for the finished product. According to EU-IFRS, these sales should not
be recognised as income, as the substantial risks have not been transferred to the correspon-
ding suppliers.
The impact on 2004 has been a reduction of Euros 154,959 thousand in net sales and cost of
goods sold, with no effect on equity or profit.
Extraordinary income/expense
The income statement under EU-IFRS does not contain extraordinary items and, therefore, the
corresponding amounts recorded in the consolidated income statement under Spanish GAAP
have been reclassified to other captions according to their nature.
This change in presentation has no effect on 2004 equity or profit.
The effect of the transition from Spanish GAAP to EU-IFRS on the opening balance sheet, the
2004 balance sheet and the 2004 income statement is as follows:
FINANCIAL PERFORMANCE INDITEX 200598
90-109 CUENTAS 2 EN.qxp 27/6/06 10:32 Página 98

CURRENT ASSETS 1,320,946 (13,589) 1,307,357 1,582,042 (20,329) 1,561,713
Cash and cash equivalents 496,365 571 496,936 773,260 (1,418) 771,842
Trade and other payables 328,856 (25,109) 303,747 268,415 (28,380) 240,035
Inventories 486,440 4,115 490,555 514,041 3,829 517,870
Income tax receivable 0 0 0 14,064 0 14,064
Other 9,285 6,834 16,119 12,262 5,640 17,902
NON-CURRENT ASSETS 2,189,406 51,088 2,240,494 2,627,129 24,024 2,651,153
Establishment expenses 528 (528) - 567 (567) -
Property, plant and equipment 1,588,169 110,384 1,698,553 1,892,538 109,613 2,002,151
Investment property 11,097 0 11,097 10,535 0 10,535
Rights over leased assets 319,671 4,925 324,596 364,875 1,757 366,632
Parent company shares 89 (89) - 89 (89) -
Other intangible assets 93,273 (80,698) 12,575 78,432 (69,334) 9,098
Goodwill 53,253 0 53,253 98,498 (29,721) 68,777
Investments 64,498 (44,416) 20,082 82,890 (29,420) 53,470
Investments in associates 23,188 (15,576) 7,612 42,793 (35,561) 7,232
Deferred expenses 17,902 (17,902) - 21,463 (21,463) -
Deferred tax assets 17,738 26,589 44,327 34,449 26,918 61,367
Other non-current assets 0 68,399 68,399 0 71,891 71,891
TOTAL ASSETS 3,510,352 37,499 3,547,851 4,209,171 3,695 4,212,866
CURRENT LIABILITIES 1,092,711 8,586 1,101,297 1,368,854 3,501 1,372,355
Trade and other receivables 1,010,316 2,608 1,012,924 1,074,941 512 1,075,453
Financial debt 81,492 5,978 87,470 160,744 2,989 163,733
Income tax payable 0 0 0 133,169 0 133,169
Other 903 0 903 0 0 0
CURRENT NON-LIABILITIES 284,477 184,497 468,974 302,043 145,168 447,211
Financial debt 156,568 15,070 171,638 10,346 11,839 119,185
Deferred tax 63,943 63,943 79,705 9,472 89,177
Provisions 23,079 (87) 22,992 31,932 (204) 31,728
Other non-current liabilities 75,167 135,234 210,401 6,577 200,544 207,121
Deterred income 29,663 (29,663) - 76,483 (76,483) -
MINORITY INTEREST 27,217 (27,217) - 35,582 (35,582) -
NET EQUITY 2,105,947 (128,367) 1,977,580 2,502,692 (109,392) 2,393,300
Net equity attributable to the parent 2,105,947 (139,338) 1,966,609 2,502,692 (126,614) 2,376,078
Net equity attributable to minority interest 10,971 10,971 0 17,222 17,222
TOTAL LIABILITIES 3,510,352 37,499 3,547,851 4,209,171 3,695 4,212,866
Spanish
GAAP
Transition
effect
1 February 2004
EU-IFRSSpanish
GAAP
Transition
effectEU-IFRS
31 January 2005
FINANCIAL PERFORMANCE INDITEX 2005 99
90-109 CUENTAS 2 EN.qxp 27/6/06 10:32 Página 99

35. SELECTED ACCOUNTING POLICIES
a) Foreign currency transactions
Foreign currency transactions are translated to euro using the exchange rate ruling at the date of the
transaction. Monetary assets and liabilities denominated in foreign currencies at the balance sheet
date are translated to euro at the foreign exchange rate ruling at that date. Foreign exchange diffe-
rences arising on translation are recognised in the income statement as financial income/expenses.
b) Property, plant and equipment
Items of property, plant and equipment are stated at cost, including additional costs incurred until the
asset enters into operation, less accumulated depreciation and any impairment losses or deprecia-
tion which should be recognised (see note 35-h).
Depreciation is charged to the income statement on a straight-line basis over the estimated useful
lives of each part of an item of property, plant and equipment.
The estimated useful lives are as follows:
The replacement or renewal of complete items which increase the useful life of an asset or improve its
economic capacity are recorded as an increase in the value of the asset, while items replaced or rene-
wed are derecognised.
Repair and maintenance costs are recognised in the income statement as an expense as incurred.
Buildings 25 to 50
Leasehold improvements, machinery and furniture 7 to 13
Other 4 to 13
Description Useful lives
CONSOLIDATED INCOME STATEMENT FOR THE YEAR ENDED 31 JANUARY 2005
Spanish Transition EU-IFRSGAAP effect
Revenue 5,670,411 (101,767) 5,568,644
Cost of merchandise (2,636,165) 152,724 (2,483,441)
GROSS PROFIT 3,034,246 50,957 3,085,203
Operating expenses (1,794,532) (54,732) (1,849,264)
Other operating expenses 0 (8,563) (8,563)
OPERATING PROFIT (EBITDA) 1,239,714 (12,338) 1,227,376
Amortisation and depreciation (314,494) 9,076 (305,418)
OPERATING PROFIT (EBIT) 925,220 (3,262) 92,958
Net financing costs (22,543) (2,303) (24,846)
Equity accounting losses (16,491) 16,133 (358)
PROFIT BEFORE TAX 886,186 10,568 896,754
Income tax (247,955) (3,002) (250,957)
PROFIT AFTER INCOME TAX 638,231 7,566 645,797
Profit attributable to minority interest (10,101) 2,755 7,346
PROFIT FOR THE PERIOD 628,130 10,321 638,451
FINANCIAL PERFORMANCE INDITEX 2005100
90-109 CUENTAS 2 EN.qxp 27/6/06 10:32 Página 100

c) Rights over leased assets
Rights over leased assets include the cost of transfer rights, access premiums or tenancy right waivers
paid to the proprietors and former tenants of commercial premises.
Rights over leased assets are recognised at cost of acquisition. Subsequent to initial recognition, they
are stated at cost less accumulated amortisation and any impairment losses and are amortised over the
term of the lease contract, except when, for legal reasons, the rights do not lose value, in which case
they are determined to be intangible assets with indefinite useful lives and are therefore systematically
tested for impairment.
d) Other intangible assets
(1) Industrial property is stated at cost of acquisition or usufruct, or at the cost of registering the
items developed by the Group, and is amortised on a straight-line basis over a maximum period of
ten years.
(2) Software is stated at cost and amortised on a straight-line basis over the five-year period of
expected use.
e) Investments
Financial instruments which represent less than 20% of share capital are stated at the lower of amorti-
sed cost and fair value through charges to the corresponding provisions.
f) Investment property
Investment properties are assets held to generate rental income, capital appreciation or both, and are
stated at cost of acquisition less accumulated depreciation and any impairment losses or depreciation
which should be recognised. Depreciation is calculated on a straight-line basis over the useful lives of
the corresponding assets.
Details of the market value of investment properties are shown in note 13.
g) Goodwill
Goodwill on acquisitions subsequent to 1 February 2004 represents the difference between the cost of
acquisition and fair value of the net identifiable assets acquired, while goodwill on acquisitions prior to
that date, on which the Group underwent the transition to EU-IFRS, is recognised at its net carrying
amount at the time in accordance with Spanish accounting principles. Following EU-IFRS, goodwill is not
amortised but tested regularly for impairment (see note 15).
h) Asset impairment
The Group systematically tests for impairment consolidated assets which are not considered biological
assets, financial assets, inventories, deferred tax assets and non-current assets classified as held for
sale, in order to determine whether the carrying amount exceeds the recoverable value (impairment).
In order to do this, the Group has developed a general, systematic procedure for carrying out these
impairment tests based on the monitoring of certain events or circumstances such as the performance
of commercial premises, operating decisions regarding the continuity of a particular location, or other
circumstances which indicate that the value of an asset may not be recovered in full.
The recoverable amount of goodwill or assets with indefinite useful lives is estimated at the closing
date. Upon transition to EU-IFRS, goodwill was tested for impairment, even though there were no indi-
cations that impairment had occurred, and remained unchanged. Impairment testing is carried out at
least once a year.
Calculation of recoverable amount
The recoverable amount of assets is the greater of fair value less selling costs and value in use.
Value in use takes into account expected future cash flows deriving from the use of the asset, fore-
cast variations in the amount or distribution of the cash flows, the time value of money, the risks
specific to the asset and other current market assessments.
FINANCIAL PERFORMANCE INDITEX 2005 101
90-109 CUENTAS 2 EN.qxp 27/6/06 10:32 Página 101

The recoverable amount is calculated for individual assets unless they do not generate largely
independent cash flows, in which case the recoverable amount is determined for the cash-genera-
ting unit to which the asset belongs
Based on actual management of operations, the Group has defined each of the commercial premi-
ses in which it carries out its activities (stores) as basic cash generating units, although these basic
units can be aggregated to chain-country level, or even to all the companies located in the same
country. Group assets which are not clearly assignable under this scheme (for example industrial or
logistical assets) are treated separately within the context of this general policy according to their
specific nature.
Impairment losses recognised in respect of cash-generating units are allocated first to reduce the
carrying amount of any goodwill allocated to cash-generating units and then to reduce the carr-
ying amount of the other assets in the unit on a pro rata basis.
Reversals of impairment
Impairment losses in respect of goodwill are not reversed in subsequent years. For assets other
than goodwill, impairment losses are reversed if there has been a change in the estimates used to
determine the recoverable amount.
An impairment loss is reversed only to the extent that an asset’s carrying amount does not exceed
the carrying amount that would have been determined, net of depreciation or amortisation, if no
impairment loss had been recognised.
The reversal of an impairment loss in a cash generating unit is distributed among its assets, except
for goodwill, which is distributed in accordance with its carrying amount and taking into account
the limitation set out in the previous paragraph.
i) Trade and other receivables
Trade and other receivables are recognised at fair value. Subsequent to initial recognition, they are sta-
ted at amortised cost in accordance with the effective interest rate method, less any provision for
impairment.
Provision is made for impairment of trade receivables when circumstances indicate doubtful collection.
This provision is calculated as the difference between the carrying amount and the present value of
future estimated cash flows discounted at the effective interest rate and is recognised in the income
statement.
j) Inventories
Inventories are measured at the lower of cost and net realisable value.
Net realisable value is the estimated selling price.
Cost is calculated on a FIFO basis and includes the cost of materials consumed, labour and manufactu-
ring expenses.
Obsolete, defective and slow-moving stocks are written down to their possible realisable value.
k) Cash and cash equivalents
Cash and cash equivalents comprise cash in hand in various currencies, immediately available
current account balances with banks and cash surpluses deposited in short-term, highly-liquid
investments.
l) Employee benefits
In line with prevailing collective labour agreements, certain group companies are obliged to pay early
retirement bonuses. The Group has created a provision to cover the actuarial liability of the estimated
portion accrued at 31 January 2006.
FINANCIAL PERFORMANCE INDITEX 2005102
90-109 CUENTAS 2 EN.qxp 27/6/06 10:32 Página 102

m) Provisions
Provisions are recognised in the balance sheet when:
- the Group has a present legal or constructive obligation as result of a past event;
- it is probable that an outflow of economic benefits will be required to settle the obligation;
and the amount can be reliably estimated.
Provisions are based on the best information available at the date of preparation of the annual accounts
and are revised at each balance sheet date.
n) Trade and other payables
Trade and other current payables do not accrue interest and are stated at nominal value.
o) Financial liabilities
Financial liabilities are generally recognised at the effective amount received, less costs incurred on the
transaction. Subsequent to initial recognition, financial liabilities are stated at amortised cost.
Underlying liabilities of derivative financial instruments are stated at fair value.
p) Derivative and hedging operations
Derivatives instruments used by the Group mainly comprise exchange rate hedging operations to elimi-
nate or significantly reduce the risk deriving from the underlying operations.
q) Income recognition
The sale of goods is recognised when the significant risks and rewards of ownership of the goods are
transferred
Rental income is recognised on a straight-line basis over the term of the contracts.
Income from royalties is recognised in line with the amounts accrued on the respective contracts.
r) Leases
Lease operations are classified as finance leases when the significant risks and rewards of ownership of
the asset are transferred. All other lease operations are considered operating leases.
Assets acquired under a finance lease are recognised as non-current assets at the present value of the
minimum future lease payment amounts or, if lower, the fair value of the leased asset, while the
corresponding debt with the lessor is recognised as a liability. Lease payments are apportioned betwe-
en the reduction of the outstanding liability and the finance charge, which is recorded as a financial
expense during the year.
In the case of operating leases, non-contingent or fixed rent payments are charged to the income sta-
tement on a straight-line basis over the term of the lease. Variable rent and consumer price index-lin-
ked increases in fixed rent are considered contingent rent and are not taken to the income statement
on a straight-line basis.
Incentives received by shopping centre developers or owners of commercial premises are recognised
as non-current liabilities and booked as a reduction in rental expense under ¨Other operating expenses¨
on a straight-line basis over the duration of the respective lease contracts.
s) Financial income and expenses
Financial income and expenses are recognised on an accrual basis using the effective interest method.
Dividend income is recognised when the right to receive payment is established.
t) Income tax
Income tax on the profit or loss for the year comprises current and deferred tax. Income tax, whether
current or deferred, is recognised in the income statement and included in the determination of net
FINANCIAL PERFORMANCE INDITEX 2005 103
90-109 CUENTAS 2 EN.qxp 27/6/06 10:32 Página 103

profit or loss for the year, except to the extent that it relates to a transaction which has been recognised
during the year, as a charge or a credit in equity, or to a business combination.
Current tax is the expected tax payable on the taxable income for the year, using tax rates enacted or
substantially enacted at the balance sheet date, and any adjustment to tax payable in respect of pre-
vious years.
Deferred tax is provided using the balance sheet method, providing for temporary differences between
the carrying amounts of assets and liabilities for financial reporting purposes and the amounts used for
taxation purposes. Deferred tax liabilities comprise income tax amounts payable in the future on
account of temporary differences while deferred tax assets are amounts recoverable due to the exis-
tence of temporary differences, tax loss carryforwards or deductions pending application.
The Group recognises deferred assets and liabilities derived from timing differences, except those rela-
ting to the initial recognition of goodwill, from the initial recognition of assets or liabilities on a transac-
tion which is not a business combination that,at inception, affected neither accounting nor taxable
profit. Timing differences relating to investments in subsidiaries are also recognised except when the
parent company can control the reversal and they will probably not reverse in the foreseeable future.
The amount of deferred tax provided is based on the expected manner of realisation or settlement of
the carrying amount of assets and liabilities, using tax rates enacted or substantially enacted at the
balance sheet date.
A deferred tax asset is recognised only to the extent that it is probable that future taxable profits will be
available against which the asset can be utilised. Deferred tax assets, whether recognised or not, are
reviewed at each balance sheet date. Deferred tax assets are reduced to the extent that it is no longer
probable that the related tax benefit will be realised.
Current tax assets and liabilities are only offset when prevailing legislation so permits, and the Com-
pany intends to settle the outstanding amount or simultaneously realise assets and settle liabilities.
Deferred tax assets and liabilities are offset when prevailing legislation so permits and they derive from
income tax corresponding to the same tax authority and the same or different tax payers which realise
or settle current tax assets and liabilities either on a net or simultaneous basis in each of the future
periods in which they are expected to be settled or recovered. Deferred tax assets and liabilities are
recognised in the consolidated balance sheet as non-current assets and liabilities, irrespective of their
expected realisation or settlement date.
u) Earnings per share
The calculation of basic earnings per share is based on the net profit for the period attributable to the
parent and a weighted average number of ordinary shares in circulation during the period, net of parent
company shares held by the Group.
The calculation of diluted earnings per share is obtained by dividing profit for the year by the number of
potential shares, i.e. ordinary shares, convertible bonds and any share options.
v) Current and non-current assets and liabilities
The Group classifies assets and liabilities as current and non-current, current being those which comply
with the following criteria:
- Assets are classified as current when they are expected to be realised, sold or consumed during
the normal cycle of group operations, are held primarily for business purposes, are forecast to be
realised within twelve months from the balance sheet date or comprise cash or cash equivalents,
except when they cannot be interchanged or used to settle a liability within at least twelve months
from the balance sheet date.
- Liabilities are classified as current when they are expected to be settled during the normal cycle
of group operations, are held primarily for business purposes, are to be settled within twelve
FINANCIAL PERFORMANCE INDITEX 2005104
90-109 CUENTAS 2 EN.qxp 27/6/06 10:32 Página 104

months from the balance sheet date or the Group has no unconditional right to extend the settle-
ment of the liabilities during the twelve-month period from the balance sheet date.
- Current liabilities such as trade receivables, liabilities for personnel expenses other than post-reti-
rement benefits or other long-term payments or contributions, and other operating costs are clas-
sified as current, irrespective of whether they mature more than twelve months from the balance
sheet date.
- Financial liabilities are classified as current when they are to be settled within twelve months of
the balance sheet date, even if the original period exceeds twelve months, and an agreement has
been reached to refinance or restructure the long-term payments after the closing date and befo-
re the annual accounts are prepared.
Assets and liabilities are not offset against each other unless there are specific requirements to the
contrary or a standard or interpretation so permits.
FINANCIAL PERFORMANCE INDITEX 2005 105
90-109 CUENTAS 2 EN.qxp 27/6/06 10:32 Página 105

Company Effective % Location Consolidation Year Chain Line of businessof ownership method end
SubsidiariesIndustria de Diseño Textil, S.A.
Comditel, S.A.
Inditex Asia, Ltd.
Zara Asia, Ltd.
Choolet, S.A.
Confecciones Fíos, S.A.
Confecciones Goa, S.A.
Denllo, S.A.
Hampton, S.A.
Jema Creaciones Infantiles, S.L.
Kenner, S.A.
Kettering, S.A.
Nikole, S.A.
Samlor, S.A.
Sircio, S.A.
Stear, S.A.
Textil Rase, S.A.
Trisko, S.A.
Zintura, S.A.
Glencare, S.A.
Indipunt, S.L.
UAB Rofestas
Zara España, S.A.
Zara Argentina, S.A.
Zara Belgique, S.A.
Zara Chile, S.A.
Zara USA Inc.
Zara France, S.A.R.L.
Zara UK, Ltd.
Zara Hellas, S.A.
Zara México, S.A. de C.V.
Zara Portugal Confecçoes Lda.
Zara Venezuela, S.A.
Grupo Zara Uruguay, S.A.
Zara Brasil, Lda.
Zara Nederland, B.V.
Zara Österreich Clothing, GmbH
Zara Danmark A/S
Zara Sverige, AB
Zara Norge, AS
Zara Canada, Inc.
Zara Suisse S.A.R.L.
Zara Luxembourg, S.A.
Za Giyim Ithalat Ihracat Ve Ticaret Ltd.
Zara Italia, S.R.L.
Zara Japan Corp.
Zara Ceská Republika, S.R.O.
Zara Puerto Rico, Inc.
Za Clothing Ireland, Ltd.
Zara Magyarorszag, KFT.
Zara Monaco, SAM
Zara Commercial (Shanghai), Co Ltd.
Young Fashion, Sp Zo.o.
Kiddy´s Class España, S.A.
Kiddy´s Class Portugal Conf. Lda.
Oysho España, S.A.
Oysho Venezuela, S.A.
Oysho Portugal, Conf. Lda.
Oysho Mexico, S.A. de C.V.
Oysho Italia, S.R.L.
Oysho Hellas, S.A
Oysho Österreich, GmbH
Oysho Giyim Ithalat Ihracat Ve Ticaret Ltd.
Oysho Polska, Sp zo.o
Grupo Massimo Dutti, S.A.
Parent Co.
100,00%
100,00%
100,00%
100,00%
100,00%
100,00%
100,00%
100,00%
45,90%
100,00%
100,00%
100,00%
100,00%
100,00%
100,00%
100,00%
100,00%
100,00%
100,00%
51,00%
100,00%
100,00%
100,00%
100,00%
100,00%
100,00%
100,00%
100,00%
100,00%
95,00%
100,00%
100,00%
100,00%
100,00%
100,00%
100,00%
100,00%
100,00%
100,00%
100,00%
100,00%
100,00%
100,00%
80,00%
100,00%
100,00%
100,00%
100,00%
100,00%
100,00%
100,00%
51,00%
100,00%
100,00%
100,00%
100,00%
100,00%
98,50%
80,00%
100,00%
100,00%
100,00%
100,00%
100,00%
La Coruña - Spain
Barcelona - Spain
Hong Kong - China
Hong Kong - China
La Coruña - Spain
La Coruña - Spain
La Coruña - Spain
La Coruña - Spain
La Coruña - Spain
La Coruña - Spain
La Coruña - Spain
Barcelona - Spain
La Coruña - Spain
La Coruña - Spain
La Coruña - Spain
La Coruña - Spain
Barcelona - Spain
La Coruña - Spain
La Coruña - Spain
La Coruña - Spain
La Coruña - Spain
Vilnius - Lithuania
La Coruña - Spain
Buenos Aires - Argentina
Brussels - Belgium
Santiago de Chile - Chile
New York - USA
Paris - France
London - United Kingdom
Athens - Greece
Mexico DF - Mexico
Lisbon - Portugal
Caracas - Venezuela
Montevideo -Uruguay
Sao Paulo -Brazil
Amsterdam - The Netherlands
Vienna - Austria
Copenhagen - Denmark
Stockholm - Sweden
Oslo - Norway
Montreal - Canada
Fribourg - Switzerland
Luxembourg - Luxembourg
Istanbul - Turkey
Milan - Italy
Tokyo - Japan
Prague - Czech Republic
San Juan - Puerto Rico
Dublin - Ireland
Budapest - Hungary
Montecarlo-Monaco
Shangai- China
Varsow- Poland
La Coruña - Spain
Lisbon - Portugal
Barcelona - Spain
Caracas - Venezuela
Lisbon - Portugal
Mexico DF - Mexico
Milan - Italy
Athens - Greece
Vienna - Austria
Istanbul - Turkey
Varsow- Poland
Barcelona - Spain
Fully Cons.
Fully Cons.
Fully Cons.
Fully Cons.
Fully Cons.
Fully Cons.
Fully Cons.
Fully Cons.
Fully Cons.
Fully Cons.
Fully Cons.
Fully Cons.
Fully Cons.
Fully Cons.
Fully Cons.
Fully Cons.
Fully Cons.
Fully Cons.
Fully Cons.
Fully Cons.
Fully Cons.
Fully Cons.
Fully Cons.
Fully Cons.
Fully Cons.
Fully Cons.
Fully Cons.
Fully Cons.
Fully Cons.
Fully Cons.
Fully Cons.
Fully Cons.
Fully Cons.
Fully Cons.
Fully Cons.
Fully Cons.
Fully Cons.
Fully Cons.
Fully Cons.
Fully Cons.
Fully Cons.
Fully Cons.
Fully Cons.
Fully Cons.
Fully Cons.
Fully Cons.
Fully Cons.
Fully Cons.
Fully Cons.
Fully Cons.
Fully Cons.
Fully Cons.
Fully Cons.
Fully Cons.
Fully Cons.
Fully Cons.
Fully Cons.
Fully Cons.
Fully Cons.
Fully Cons.
Fully Cons.
Fully Cons.
Fully Cons.
Fully Cons.
Fully Cons.
31/1/06
31/1/06
31/1/06
31/1/06
31/1/06
31/1/06
31/1/06
31/1/06
31/1/06
31/1/06
31/1/06
31/1/06
31/1/06
31/1/06
31/1/06
31/1/06
31/1/06
31/1/06
31/1/06
31/1/06
31/1/06
31/1/06
31/1/06
31/1/06
31/1/06
31/12/05
31/1/06
31/1/06
31/1/06
31/1/06
31/12/05
31/1/06
31/1/06
31/1/06
31/12/05
31/1/06
31/1/06
31/1/06
31/1/06
31/1/06
31/1/06
31/1/06
31/1/06
31/1/06
31/1/06
31/1/06
31/1/06
31/1/06
31/1/06
31/1/06
31/1/06
31/1/06
31/12/05
31/1/06
31/1/06
31/1/06
31/1/06
31/1/06
31/12/05
31/1/06
31/1/06
31/1/06
31/1/06
31/1/06
31/1/06
-
Zara
Zara
Zara
Zara
Zara
Zara
Zara
Zara
Zara
Zara
Zara
Zara
Zara
Zara
Zara
Zara
Zara
Zara
Zara
Zara
Zara
Zara
Zara
Zara
Zara
Zara
Zara
Zara
Zara
Zara
Zara
Zara
Zara
Zara
Zara
Zara
Zara
Zara
Zara
Zara
Zara
Zara
Zara
Zara
Zara
Zara
Zara
Zara
Zara
Zara
Zara
Zara
Kiddy´s Class
Kiddy´s Class
Oysho
Oysho
Oysho
Oysho
Oysho
Oysho
Oysho
Oysho
Oysho
Massimo Dutti
Parent Co.
Textil purchasing Co.
Textil purchasing Co.
Textil purchasing Co.
Textil manufacturing
Textil manufacturing
Textil manufacturing
Textil manufacturing
Textil manufacturing
Textil manufacturing
Textil manufacturing
Textil manufacturing
Textil manufacturing
Textil manufacturing
Textil manufacturing
Textil manufacturing
Textil manufacturing
Textil manufacturing
Textil manufacturing
Textil manufacturing
Textil manufacturing
Textil manufacturing
Retailing
Retailing
Retailing
Retailing
Retailing
Retailing
Retailing
Retailing
Retailing
Retailing
Retailing
Retailing
Retailing
Retailing
Retailing
Retailing
Retailing
Retailing
Retailing
Retailing
Retailing
Retailing
Retailing
Retailing
Retailing
Retailing
Retailing
Retailing
Retailing
Retailing
Retailing
Retailing
Retailing
Retailing
Retailing
Retailing
Retailing
Retailing
Retailing
Retailing
Retailing
Retailing
Retailing
ANNEX I. COMPOSITION OF THE INDITEX GROUP
The companies composing the consolidated Group as of 31 January 2006 are as folows
FINANCIAL PERFORMANCE INDITEX 2005106
90-109 CUENTAS 2 EN.qxp 30/6/06 14:17 Página 106

Company Effective % Location Consolidation Year Chain Line of businessof ownership method end
Massimo Dutti Hellas, S.A. 100,00% Athens - Greece Fully Cons. 31/1/06 Massimo Dutti Retailing
Massimo Dutti Giyim Ithalat Ih.Ve Tic. Ltd. 100,00% Istanbul - Turkey Fully Cons. 31/12/05 Massimo Dutti Retailing
Massimo Dutti Venezuela, S.A. 100,00% Caracas - Venezuela Fully Cons. 31/1/06 Massimo Dutti Retailing
Massimo Dutti France, S.A.R.L. 100,00% Paris - France Fully Cons. 31/1/06 Massimo Dutti Retailing
Massimo Dutti UK, Ltd. 100,00% London - United Kingdom Fully Cons. 31/1/06 Massimo Dutti Retailing
Massimo Dutti Suisse, S.A.R.L. 100,00% Fribourg - Switzerland Fully Cons. 31/1/06 Massimo Dutti Retailing
Massimo Dutti Sverige, AB 100,00% Stockholm - Sweden Fully Cons. 31/1/06 Massimo Dutti Retailing
Massimo Dutti Norge, AS. 100,00% Oslo - Norway Fully Cons. 31/1/06 Massimo Dutti Retailing
Massimo Dutti Italia, S.R.L. 80,00% Milan - Italy Fully Cons. 31/1/06 Massimo Dutti Retailing
Massimo Dutti Ireland., Ltd. 100,00% London - United Kingdom Fully Cons. 31/1/06 Massimo Dutti Retailing
Massimo Dutti USA, Ltd. 100,00% New York - USA Fully Cons. 31/1/06 Massimo Dutti Retailing
Massimo Dutti Danmark A/S 100,00% Copenhagen - Denmark Fully Cons. 31/1/06 Massimo Dutti Retailing
Pase Packaging, S.A. de C.V. 98,00% Mexico DF - Mexico Fully Cons. 31/12/05 Massimo Dutti Retailing
BCN Diseños, S.A. de C.V. 98,00% Mexico DF - Mexico Fully Cons. 31/12/05 Massimo Dutti Retailing
Zara Home Belgique, S.A. 100,00% Brussels - Belgium Fully Cons. 31/1/06 Massimo Dutti Retailing
Pull & Bear España, S.A. 100,00% La Coruña - Spain Fully Cons. 31/1/06 Pull & Bear Retailing
Pull & Bear Hellas, S.A. 100,00% Athens - Greece Fully Cons. 31/1/06 Pull & Bear Retailing
Pull & Bear Portugal Conf. Lda. 100,00% Lisbon - Portugal Fully Cons. 31/1/06 Pull & Bear Retailing
Pull & Bear Giyim Ith. Ihrac.Ve Tic. Ltd. 100,00% Istanbul - Turkey Fully Cons. 31/12/05 Pull & Bear Retailing
Pull & Bear Venezuela, S.A. 100,00% Caracas - Venezuela Fully Cons. 31/1/06 Pull & Bear Retailing
Pull & Bear Mexico, S.A. de C.V. 98,50% Mexico DF - Mexico Fully Cons. 31/12/05 Pull & Bear Retailing
Pull & Bear Belgique, S.A. 100,00% Brussels - Belgium Fully Cons. 31/1/06 Pull & Bear Retailing
Pull & Bear France, S.A.R.L. 100,00% Paris - France Fully Cons. 31/1/06 Pull & Bear Retailing
Pull & Bear Italia, S.R.L. 80,00% Milan - Italy Fully Cons. 31/1/06 Pull & Bear Retailing
Pull&Bear Ceska Republika, S.R.O. 100,00% Prague - Czech Republic Fully Cons. 31/1/06 Pull & Bear Retailing
Pull&Bear Ireland, Ltd. 100,00% Dublin - Ireland Fully Cons. 31/1/06 Pull & Bear Retailing
Pull & Bear Magyarország Kft. 100,00% Budapest - Hungary Fully Cons. 31/1/06 Pull & Bear Retailing
Pull & Bear Polska, Sp zo.o 100,00% Varsow- Poland Fully Cons. 31/1/06 Pull & Bear Retailing
Often España, S.A. 100,00% La Coruña - Spain Fully Cons. 31/1/06 Pull & Bear Retailing
Often Portugal, Conf. Soc. Unip. Lda. 100,00% Lisbon - Portugal Fully Cons. 31/1/06 Pull & Bear Retailing
Bershka BSK España, S.A. 100,00% Barcelona - Spain Fully Cons. 31/1/06 Bershka Retailing
Bershka Portugal Conf. Soc. Unip. Lda. 100,00% Lisbon - Portugal Fully Cons. 31/1/06 Bershka Retailing
Bershka Hellas, S.A. 100,00% Athens - Greece Fully Cons. 31/1/06 Bershka Retailing
Bershka Mexico, S.A. de CV 97,00% Mexico DF - México Fully Cons. 31/12/05 Bershka Retailing
Bershka BSK Venezuela, S.A. 100,00% Caracas - Venezuela Fully Cons. 31/1/06 Bershka Retailing
Bershka Giyim Ithalat Ihracat Ve Tic.Ltd. 100,00% Istanbul - Turkey Fully Cons. 31/12/05 Bershka Retailing
Bershka Belgique, S.A. 100,00% Brussels - Belgium Fully Cons. 31/1/06 Bershka Retailing
Bershka France, S.A.R.L. 100,00% Paris - France Fully Cons. 31/1/06 Bershka Retailing
Bershka Suisse, S.A.R.L. 100,00% Fribourg - Switzerland Fully Cons. 31/1/06 Bershka Retailing
Bershka Nederland, B.V. 100,00% Amsterdam - The Netherlands Fully Cons. 31/1/06 Bershka Retailing
Bershka Italia, S.R.L. 80,00% Milan - Italy Fully Cons. 31/1/06 Bershka Retailing
Bershka U.K., Ltd. 100,00% London - United Kingdom Fully Cons. 31/1/06 Bershka Retailing
Bershka Ireland., Ltd. 100,00% London - United Kingdom Fully Cons. 31/1/06 Bershka Retailing
Bershka Ceska Republica, S.R.O. 100,00% Prague - Czech Republic Fully Cons. 31/1/06 Bershka Retailing
Stradivarius España, S.A. 100,00% Barcelona - Spain Fully Cons. 31/1/06 Stradivarius Retailing
Stradivarius Hellas, S.A. 100,00% Athens - Greece Fully Cons. 31/1/06 Stradivarius Retailing
Stradivarius Portugal, Conf. Unip. Lda. 100,00% Lisbon - Portugal Fully Cons. 31/1/06 Stradivarius Retailing
Stradivarius Giyim Ithalat Ih. Ve Tic. Ltd. 100,00% Istanbul - Turkey Fully Cons. 31/12/05 Stradivarius Retailing
Stradivarius Polska, Sp zo.o 100,00% Varsow- Poland Fully Cons. 31/1/06 Stradivarius Retailing
Zara Home España, S.A. 100,00% La Coruña - Spain Fully Cons. 31/1/06 Zara Home Retailing
Zara Home Portugal, Conf. Soc. Unip. Lda. 100,00% Lisbon - Portugal Fully Cons. 31/1/06 Zara Home Retailing
Zara Home U.K., Ltd. 100,00% London - United Kingdom Fully Cons. 31/1/06 Zara Home Retailing
Zara Home Hellas, S.A. 100,00% Athens - Greece Fully Cons. 31/1/06 Zara Home Retailing
Zara Home Nederland, B.V. 100,00% Amsterdam - The Netherlands Fully Cons. 31/1/06 Zara Home Retailing
Zara Home Mexico, S.A. de C.V. 98,50% Mexico DF - Mexico Fully Cons. 31/12/05 Zara Home Retailing
Zara Home Italia, S.R.L. 100,00% Milan - Italy Fully Cons. 31/1/06 Zara Home Retailing
Zara Home Giyim Ithalat Ihracat Ve Ticaret Ltd. 100,00% Istanbul - Turkey Fully Cons. 31/12/05 Zara Home Retailing
Zara Home Francia, S.A.R.L. 100,00% Paris - France Fully Cons. 31/1/06 Zara Home Retailing
Bershka Logística, S.A. 100,00% Barcelona - Spain Fully Cons. 31/1/06 Bershka Logistics
Massimo Dutti Logística, S.A. 100,00% Barcelona - Spain Fully Cons. 31/1/06 Massimo Dutti Logistics
Oysho Logística, S.A. 100,00% Barcelona - Spain Fully Cons. 31/1/06 Oysho Logistics
Pull & Bear Logística, S.A. 100,00% La Coruña - Spain Fully Cons. 31/1/06 Pull & Bear Logistics
Zara Logística, S.A. 100,00% La Coruña - Spain Fully Cons. 31/1/06 Zara Logistics
Plataforma Europa, S.A. 100,00% Zaragoza - Spain Fully Cons. 31/1/06 Zara Logistics
Plataforma Logística León, S.A. 100,00% La Coruña - Spain Fully Cons. 31/1/06 Zara Logistics
Corporación de Servicios XX1, S.A. de C.V. 100,00% Mexico DF - Mexico Fully Cons. 31/12/05 Zara Services
Zara Financiën B.V. 100,00% Breda - The Netherlands Fully Cons. 31/1/06 Zaraº Finance
Zara Mexico, B.V. 100,00% Breda - The Netherlands Fully Cons. 31/1/06 Zara Finance
Zara Holding, B.V. 100,00% Breda - The Netherlands Fully Cons. 31/1/06 Zara Portfolio
Zalapa, B.V. 100,00% Breda - The Netherlands Fully Cons. 31/1/06 Zara Portfolio
FINANCIAL PERFORMANCE INDITEX 2005 107
90-109 CUENTAS 2 EN.qxp 27/6/06 10:32 Página 107

Company Effective Location Consolidation Year Chain Line of business% of ownership method end
Massimo Dutti Holding, B.V. 100,00% Breda - The Netherlands Fully Cons. 31/1/06 Massimo Dutti Portfolio
Liprasa Cartera, S.L. 98,00% Madrid - Spain Fully Cons. 31/12/05 Massimo Dutti Portfolio
ITX Merken, B.V. 100,00% Breda - The Netherlands Fully Cons. 31/1/06 Zara Explotation of trademarks
Goa-Invest, S.A. 100,00% La Coruña - Spain Fully Cons. 31/01/2005 Zara Construction & Real estate
Zara Vastgoed, B.V. 100,00% Breda - The Netherlands Fully Cons. 31/1/06 Zara Real Estate
Vastgoed Asia, Ltd. 100,00% Hong Kong - China Fully Cons. 31/1/06 Zara Real Estate
SNC Zara France Immobiliere 100,00% Paris - France Fully Cons. 31/12/05 Zara Real Estate
SCI Vastgoed Ferreol P03302 100,00% Paris - France Fully Cons. 31/12/05 Zara Real Estate
SCI Vastgoed France P03301 100,00% Paris - France Fully Cons. 31/12/05 Zara Real Estate
SCI Vastgoed General Leclerc P03303 100,00% Paris - France Fully Cons. 31/12/05 Zara Real Estate
SCI Vastgoed Nancy P03304 100,00% Paris - France Fully Cons. 31/12/05 Zara Real Estate
Invercarpro, S.A. 100,00% Madrid - Spain Fully Cons. 31/1/06 Zara Real Estate
Robustae S.G.P.S. Unip. Lda. 100,00% Lisbon - Portugal Fully Cons. 31/1/06 Zara Real Estate
Lefties España, S,A, 100,00% La Coruña - Spain Fully Cons. 31/1/06 Zara Real Estate
Inditex Cogeneración, A.I.E. 100,00% La Coruña - Spain Fully Cons. 31/1/06 Zara Cogeneration Plant
Inditex, S.A. 100,00% La Coruña - Spain Fully Cons. 31/1/06 Zara Inactive as of 31/01/06
Zara Italia, B.V. 100,00% Breda - The Netherlands Fully Cons. 31/1/06 Zara Inactive as of 31/01/06
Fruminga, B.V. 100,00% Breda - The Netherlands Fully Cons. 31/1/06 Zara Inactive as of 31/01/06
Zara, S.A. 100,00% La Coruña - Spain Fully Cons. 31/1/06 Zara Inactive as of 31/01/06
Zara, S.A. 100,00% Buenos Aires - Argentina Fully Cons. 31/1/06 Zara Inactive as of 31/01/06
Multigroup companiesTempe, S.A. 50,00% Alicante - Spain Proporcional 31/1/06 Zara Marketing of shoewear
Tempe México, S.A. de C.V. 50,00% Mexico DF - Mexico Proporcional 31/12/05 Zara Marketing of shoewear
Tempe Logística, S.A. 50,00% Alicante - Spain Proporcional 31/1/06 Zara Logistics
Tempe Brasil, Ltda. 50,00% Sao Paulo -Brazil Proporcional 31/12/05 Zara Marketing of shoewear
Zara Deutschland, GmbH 50,00% Hambourg - Germany Proporcional 31/1/06 Zara Retailing
Massimo Dutti Deutschland, GmbH 50,00% Hambourg - Germany Proporcional 31/1/06 Massimo Dutti Retailing
Oysho Deutschland, GmbH 50,00% Hambourg - Germany Proporcional 31/1/06 Oysho Retailing
Group Zara Australia Pty. Ltd. 50,00% Sidney - Australia Proporcional 31/1/06 Zara Inactive as of 31/01/06
Associated companiesFibracolor Decoración, S.A. 39,97% Barcelona - Spain Equity 31/12/05 Zara Decoration
Fibracolor, S.A. 39,97% Barcelona - Spain Equity 31/12/05 Zara Purchase and treatment of cloth
Naviera Elealva, A.I.E. 49,00% Las Palmas - Spain Equity 31/12/05 Zara Assets leasing
Naviera Celeste, A.I.E. 49,00% Las Palmas - Spain Equity 31/12/05 Zara Assets leasing
Naviera del Miño, A.I.E. 49,00% Las Palmas - Spain Equity 31/12/05 Zara Assets leasing
Naviera del Sil, A.I.E. 49,00% Las Palmas - Spain Equity 31/12/05 Zara Assets leasing
Naviera Venus, A.I.E 49,00% Las Palmas - Spain Equity 31/12/05 Zara Assets leasing
Naviera Berlín , A.I.E. 49,00% Las Palmas - Spain Equity 31/12/05 Zara Assets leasing
Naviera Covadonga , A.I.E. 49,00% Las Palmas - Spain Equity 31/12/05 Zara Assets leasing
Naviera Gran Sol , A.I.E. 49,00% Las Palmas - Spain Equity 31/12/05 Zara Assets leasing
Naviera Guadiana , A.I.E. 49,00% Las Palmas - Spain Equity 31/12/05 Zara Assets leasing
FINANCIAL PERFORMANCE INDITEX 2005108
90-109 CUENTAS 2 EN.qxp 29/6/06 11:57 Página 108

90-109 CUENTAS 2 EN.qxp 27/6/06 10:32 Página 109

FINANCIAL PERFORMANCE INDITEX 2005 110FINANCIAL PERFORMANCE INDITEX 2005110
110-128 informe EN.qxp 27/6/06 10:41 Página 110
9Consolidated Management Report
110-128 informe EN.qxp 27/6/06 10:41 Página 111

FINANCIAL PERFORMANCE INDITEX 2005112
CONSOLIDATED FINANCIAL STATEMENTS
Inditex Group
FY2005 PROFIT & LOSS STATEMENTMillions of euros
FY 2005
FY 2004
Var %05/04
Net sales 6,740.8 5,568.6 21%Cost of sales (2,953.1) (2,483.4)
Gross profit 3,787.8 3,085.2 23%Gross margin 56.2% 55.4%
Operating expenses (2,296.8) (1,849.3) 24%Other net operating income (losses) (31.7) (8.6)
Operating cash flow (EBITDA) 1,459.3 1,227,4 19%EBITDA margin 21.6% 22.0%
Amortisation and depreciation (365.7) (305.4) 20%Operating income (EBIT) 1,093.6 922.0 19%EBIT margin 16.2% 16.6%
Financial results 8.0 (24.8)Results from companies cons. by equity method (0.2) (0.4)
Income before taxes 1,101.4 896.8 23%EBT margin 16.3% 16.1%
Taxes (290.6) (251.0)Net income 810.9 645.8 26%Net income margin 12.0% 11.6%
Minorities 7.7 7.3Net income attrib. to the controlling company 803.2 638.5 26%Net income margin 11.9% 11.5%
Earnings per share, cents of euro (*) 129.3 102.8 26%
(*) Shares for EPS calculation 620.9 million for 2005 and 620.8 million for 2004
9.1
110-128 informe EN.qxp 27/6/06 10:41 Página 112

FINANCIAL PERFORMANCE INDITEX 2005 113
Inditex Group
CONSOLIDATED BALANCE SHEET AS OF 31 JANUARY 2006Millions of euros
31 Jan 2006
31 Jan2005
ASSETSCURRENT ASSETS 2,046.6 1,561.7Cash & cash equivalents 988.4 771.8Receivables 357.9 254.1Inventories 684.4 517.9Other 15.9 17.9
NON CURRENT ASSETS 3,156.3 2,651.2Tangible assets 2,424.3 2,012.7Intangible assets 499.1 444.5Financial investments 68.1 60.7Other 164.9 133.3
TOTAL ASSETS 5,202.9 4,212.9
TOTAL LIABILITIES & SHAREHOLDERS' EQUITYCURRENT LIABILITIES 1,850.8 1,372.4Payables 1,641.6 1,208.6Financial debt 209.2 163.7
NON CURRENT LIABILITIES 431.2 447.2Financial debt 76.1 119.2Deferred taxes 106.7 89.2Other 248.3 238.8
SHAREHOLDERS' EQUITY 2,920.9 2,393.3Equity attributable to the controlling company 2,898.9 2,376.1Minority interests 22.0 17.2
TOTAL LIABILITIES & SHAREHOLDERS' EQUITY 5,202.9 4,212.9
110-128 informe EN.qxp 27/6/06 10:41 Página 113

FINANCIAL PERFORMANCE INDITEX 2005114
FY2005
FY2004
Inditex Group
CONSOLIDATED STATEMENT OF CASH FLOWSMillions of euros
Var %05/04
Income before taxes 1,101.4 896.8 23%
Adjustments to income
Depreciation and amortization 365.7 305.4
Results on fixed assets disposals 1.1 4.5
Corporate income tax (290.6) (251.0)
Deferred and prepaid tax 0.3 8.0
Foreign exchange impact 2.9 17.8
Other 59.5 40.1
Funds from operations 1,240.3 1,021.6 21%
Changes in assets and liabilities
Inventories (164.2) (27.2)
Accounts receivable and current assets (69.5) 72.6
Current liabilities 414.1 172.8
Changes in working capital 180.4 218.2 - 37%
Cash from operations 1,420.7 1,239.8 11%
Intangible assets investments (81.7) (80.9)
Tangible assets investments (701.9) (559.4)
Acquisitions of businesses (14.0) (51.2)
Addition to other long-term financial investments (3.7) (17.7)
Other assets investments (27.6) (5.5)
Fixed assets sales and retirements 17.1 14.2
Sale of long-term financial investments 0.0 4.6
Capital expenditure (811.9) (695.9) 17%
Net decrease in long-term financial debt (25.7) (64.3)
Net decrease in other long-term debt (97.9) (56.6)
Net increase in current debt 26.1 82.4
Dividends (301.8) (219.4)
Other financing activities 0.5 0.5
Cash used in financing activities (398.9) (257.3) 55%
Net increase in cash and cash equivalents 210.0 286.6
Foreign exchange impact on cash & cash equivalents 6.6 (11.7)
Cash and cash equivalents at beginning of the year 771.8 496.9
Cash and cash equivalents at end of the year 988.4 771.8 28%
110-128 informe EN.qxp 29/6/06 12:00 Página 114

FINANCIAL PERFORMANCE INDITEX 2005 115
A list of quarterly openings and stores opened as at FYE by concept and by country is included
in Annexes II and III.
COMMENTS ON THE CONSOLIDATED RESULTS
Inditex consolidated balance sheets and income statement as at 31 January 2006 (FY 2005)
are prepared according to the IFRS adopted by the European Union (IFRS-UE) and include the
FY2004 figures on a fully comparable basis.
The results for FY2005 reflect significant growth in sales and gross margin improvement,
resulting in the Group maintaining its historical financial returns.
At FYE INDITEX operated 2,692 stores in 62 countries through eight different concepts: Zara,
Kiddy’s Class, Pull & Bear, Massimo Dutti, Bershka, Stradivarius, Oysho and Zara Home.
SALES
Net sales reached 6,740.8 million, an increase of 21% (20% on a constant currency basis) over
the previous year.
Number of stores and openings
The list of openings and existing stores at FYE is as follows:
Net openings
CONCEPT
Zara 129 97
Kiddy’s Class 20 26
Pull and Bear 56 21
Massimo Dutti 43 29
Bershka 66 49
Stradivarius 36 36
Oysho 50 28
Zara Home 48 36
Total 448 322
Total stores
31 Jan 31 Jan2006 2005
852 723
149 129
427 371
369 326
368 302
263 227
154 104
110 62
2,692 2,244
FY2005
FY2004
9.2
9.2.1
110-128 informe EN.qxp 27/6/06 10:41 Página 115

FINANCIAL PERFORMANCE INDITEX 2005116
Company-managed stores and franchises
The breakdown of company-managed stores and franchised stores at FYE is the following:
COMPANY-MANAGED AND FRANCHISED STORES
Co.Mag.
31 Jan2005
Chg%05/04
FY2004
Chg %05/04
Franchises Total TotalCo.Mag.
FranchisesFORMAT
CONCEPT
2005 2004
Zara 770 82 852 649 74 723
Kiddy’s Class 149 149 129 129
Pull and Bear 380 47 427 333 38 371
Massimo Dutti 275 94 369 228 98 326
Bershka 351 17 368 295 7 302
Stradivarius 208 55 263 183 44 227
Oysho 149 5 154 102 2 104
Zara Home 100 10 110 62 62
Total 2,382 310 2,692 1,981 263 2,244
square meters Sales per m2 (€)
SELLING AREA (SqM) IN COMPANY-MANAGED AND FRANCHISED STORES
Zara 961,791 811,100 19% 5,182 5,130 1%
Kiddy’s Class 28,999 25,265 15% 5,635 5,263 7%
Pull and Bear 95,179 73,774 29% 5,504 5,346 3%
Massimo Dutti 103,816 79,858 30% 6,609 7,921 -17%
Bershka 130,495 104,916 24% 5,551 5,441 2%
Stradivarius 67,297 57,301 17% 6,036 4,572 32%
OYSHO 21,197 13,938 52% 6,599 5,664 17%
Zara Home 25,978 14,259 82% 4,082 4,296 -5%
Total 1,434,752 1,180,411 22% 5,383 5,304 1%
Selling area
The selling area of company-managed stores and franchised stores at FYE is as follows:
Like-for-like sales (LFL)
Store sales are those that occur in company-managed stores and franchised stores of any of
the Group’s concepts, net of any consumption tax and converted to euros at the average
exchange rates for the fiscal year.
The Group’s like-for-like sales grew by 5% in FY2005. Like-for-like represents the annual
change in store sales of any concept of the Group that were opened for the whole of fiscal
years 2005 and 2004, converted to a fixed exchange rate.
Below is the increase in like-for-like sales bi-annually for the last two fiscal years:
31 Jan2006
FY2005
110-128 informe EN.qxp 29/6/06 12:00 Página 116
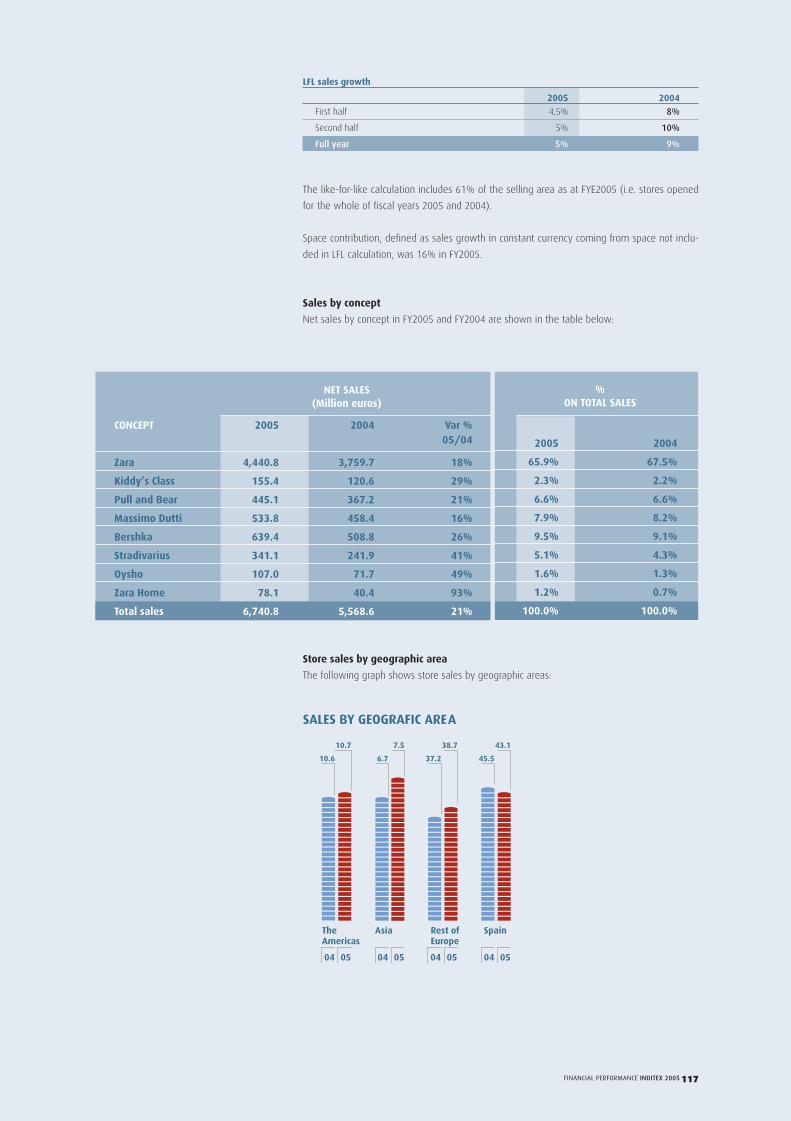
FINANCIAL PERFORMANCE INDITEX 2005 117
LFL sales growth
2005 2004
First half 4,5% 8%
Second half 5% 10%
Full year 5% 9%
The like-for-like calculation includes 61% of the selling area as at FYE2005 (i.e. stores opened
for the whole of fiscal years 2005 and 2004).
Space contribution, defined as sales growth in constant currency coming from space not inclu-
ded in LFL calculation, was 16% in FY2005.
Sales by concept
Net sales by concept in FY2005 and FY2004 are shown in the table below:
Store sales by geographic area
The following graph shows store sales by geographic areas:
NET SALES(Million euros)
CONCEPT 2005 2004 Var %05/04
Zara 4,440.8 3,759.7 18%
Kiddy’s Class 155.4 120.6 29%
Pull and Bear 445.1 367.2 21%
Massimo Dutti 533.8 458.4 16%
Bershka 639.4 508.8 26%
Stradivarius 341.1 241.9 41%
Oysho 107.0 71.7 49%
Zara Home 78.1 40.4 93%
Total sales 6,740.8 5,568.6 21%
%ON TOTAL SALES
2005 2004
65.9% 67.5%
2.3% 2.2%
6.6% 6.6%
7.9% 8.2%
9.5% 9.1%
5.1% 4.3%
1.6% 1.3%
1.2% 0.7%
100.0% 100.0%
SALES BY GEOGRAFIC AREA
10.7
10.6
7.5
6.7
38.7
37.2
43.1
45.5
SpainTheAmericas
Asia Rest of Europe
05 04 05 04 05 04 05 04
110-128 informe EN.qxp 29/6/06 12:02 Página 117

FINANCIAL PERFORMANCE INDITEX 2005118
15.6
78
European markets ex-Spain are absorbing the greatest part of the international growth.
The percentage of international store sales by concept is the following:
Sales in company-managed and franchised stores
The table below shows the breakdown of sales in company-managed and franchised stores for
each of the concepts of the Group:
GROSS PROFITThe gross profit rose to 3,787.8 million, 23% higher than the previous year. The Gross margin
improved 79 basis points to reach 56.2% (55.4% in FY2004). This improvement in the gross
margin has been achieved due to a tight inventory management. The currency impact turned
negative in the Second Half due mainly to a stronger dollar exchange rate versus the euro.
Under current circumstances, INDITEX considers 56.2% as its best estimate for the FY2006
gross margin.
% INTERNATIONAL STORE SALES
2005CONCEPT 2004
Zara 68.9% 65.8%
Kiddy’s Class 14.0% 12.8%
Pull and Bear 33.2% 30.2%
Massimo Dutti 45.6% 41.9%
Bershka 41.5% 35.7%
Stradivarius 17.4% 15.4%
Oysho 31.8% 31.5%
Zara Home 23.0% 12.7%
Total 56.9% 54.5%
2004
STORE SALES IN COMPANY-MANAGED AND FRANCHISED STORES
CompanyManaged
Franchised CompanyManaged
FranchisedCONCEPT2005 2004
Zara 90% 10% 91% 9%
Kiddy’s Class 100% 0% 100% 0%
Pull and Bear 91% 9% 91% 9%
Massimo Dutti 72% 28% 68% 32%
Bershka 97% 3% 98% 2%
Stradivarius 82% 18% 82% 18%
Oysho 98% 2% 98% 2%
Zara Home 96% 4% 100% 0%
Total 89% 11% 90% 10%
9.2.2
110-128 informe EN.qxp 27/6/06 10:41 Página 118

FINANCIAL PERFORMANCE INDITEX 2005 119
OPERATING INCOME (EBIT)
FY2005 EBITDA came to €1,459.3 million, an increase of 19% compared to the previous year,
standing at 21.6% of sales (22.0% in FY2004)
Below is a breakdown of Operating expenses over the last two years:
Million euros 2005 2004 var %
Personnel expenses 1,036.6 839.5 23%
Rental expenses 577.0 468.1 23%
Other operating expenses 683.1 541.7 26%
Total operating expenses 2,296.8 1,849.3 24%
At FYE 2005 the number of employees reached 58,190 (47,046 at FYE2004).
Operating expenses include all the start-up costs for new openings (essentially leases and sala-
ries paid for stores that are not yet open).
The future lease commitments as a result of the minimum non cancellable lease payments
amounted to 1,973 million at FYE2005.
INDITEX aims to reduce the spread between Operating expenses growth and Sales growth over
the next 3 years, while maintaining the growth strategy, thus aligning operating expenses
growth and sales growth by FYE2008.
Other net operating losses amounted 31.7 million, compared to ?8.6 million in FY2004. This
line includes all profits and losses in relation with the valuation and execution of options in the
joint-ventures the Group operates. Throughout FY2005, INDITEX has acquired a further 9.95%
stake in Stradivarius and a 15% in Zara Japan. INDITEX has also reached an initial agreement to
acquire an additional 28% in Zara Deutschland by FY2006. The result of this acquisition has
been expensed in FY2005.
EBIT came to 1,093.6 million, 19% higher, standing at 16.2% of sales (16.6% in FY2004).
EBIT excluding Other net operating income (losses) rose to 1,125.3 million, 21% higher, unchan-
ged at 16.7% of sales, and provides a fully comparable base of the operating performance.
9.2.3
110-128 informe EN.qxp 27/6/06 10:41 Página 119
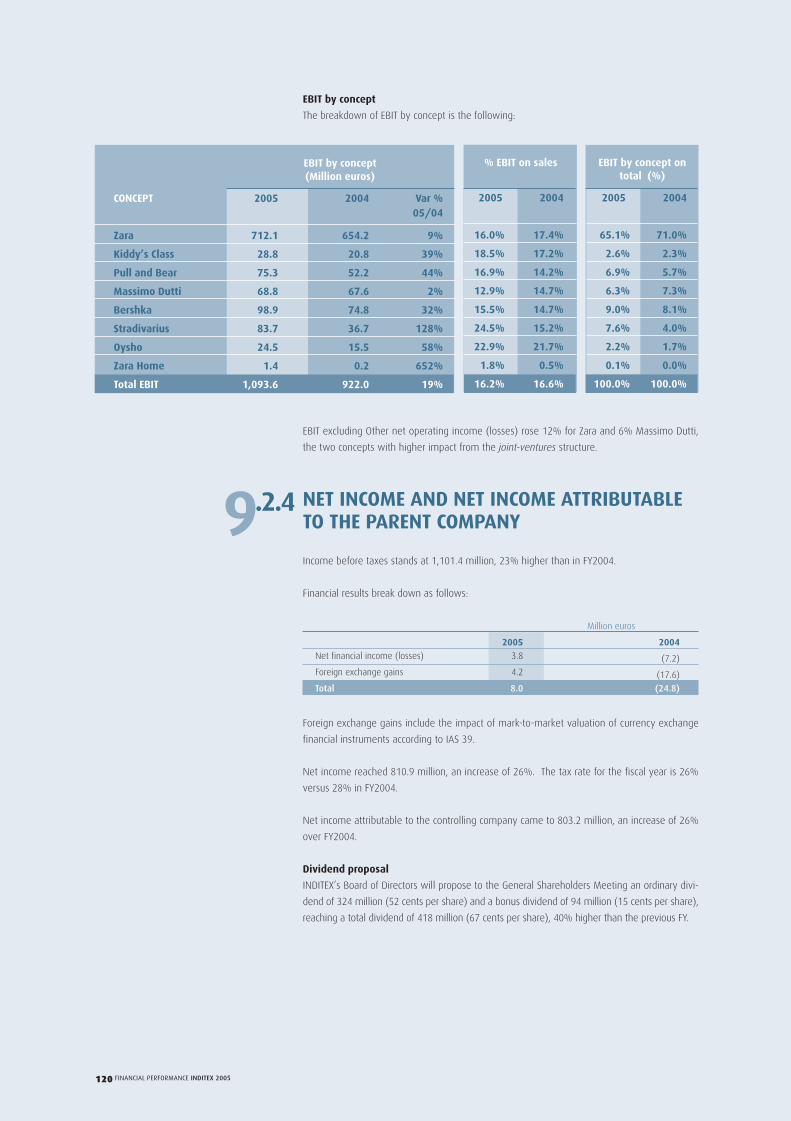
FINANCIAL PERFORMANCE INDITEX 2005120
EBIT by concept
The breakdown of EBIT by concept is the following:
EBIT excluding Other net operating income (losses) rose 12% for Zara and 6% Massimo Dutti,
the two concepts with higher impact from the joint-ventures structure.
NET INCOME AND NET INCOME ATTRIBUTABLETO THE PARENT COMPANY
Income before taxes stands at 1,101.4 million, 23% higher than in FY2004.
Financial results break down as follows:
Million euros
2005 2004
Net financial income (losses) 3.8 (7.2)
Foreign exchange gains 4.2 (17.6)
Total 8.0 (24.8)
Foreign exchange gains include the impact of mark-to-market valuation of currency exchange
financial instruments according to IAS 39.
Net income reached 810.9 million, an increase of 26%. The tax rate for the fiscal year is 26%
versus 28% in FY2004.
Net income attributable to the controlling company came to 803.2 million, an increase of 26%
over FY2004.
Dividend proposal
INDITEX’s Board of Directors will propose to the General Shareholders Meeting an ordinary divi-
dend of 324 million (52 cents per share) and a bonus dividend of 94 million (15 cents per share),
reaching a total dividend of 418 million (67 cents per share), 40% higher than the previous FY.
EBIT by concept(Million euros)
CONCEPT 2005 2004 Var %05/04
Zara 712.1 654.2 9%
Kiddy’s Class 28.8 20.8 39%
Pull and Bear 75.3 52.2 44%
Massimo Dutti 68.8 67.6 2%
Bershka 98.9 74.8 32%
Stradivarius 83.7 36.7 128%
Oysho 24.5 15.5 58%
Zara Home 1.4 0.2 652%
Total EBIT 1,093.6 922.0 19%
% EBIT on sales
2005 2004
16.0% 17.4%
18.5% 17.2%
16.9% 14.2%
12.9% 14.7%
15.5% 14.7%
24.5% 15.2%
22.9% 21.7%
1.8% 0.5%
16.2% 16.6%
EBIT by concept ontotal (%)
2005 2004
65.1% 71.0%
2.6% 2.3%
6.9% 5.7%
6.3% 7.3%
9.0% 8.1%
7.6% 4.0%
2.2% 1.7%
0.1% 0.0%
100.0% 100.0%
9.2.4
110-128 informe EN.qxp 29/6/06 12:03 Página 120

FINANCIAL PERFORMANCE INDITEX 2005 121
INDITEX maintains a long term growth strategy combined with a healthy balance sheet structu-
re. The financial strength of the company should provide flexibility enough to support the
expansion of the business under a disciplined financial approach to sustain returns.
This must be combined with a predictable shareholder remuneration policy.
Accordingly, INDITEX new shareholder remuneration policy will be based on an increase in the
proportion of net income distributed as ordinary dividend to around 50% from 2006 onwards.
In addition, the Board of Directors could propose bonus dividends.
Return on Equity (ROE)
The table below shows INDITEX Return on Equity, defined as net income on average Sharehol-
der’s equity.
RETURN ON EQUITY
Description 2005 2004
Net income 803.2 638.5
Shareholders equity - previous year 2,376.1 1,966.6
Shareholders equity - current year 2,898.9 2,376.1
Average equity 2,637.5 2,171.3
RETURN ON EQUITY 30% 29%
Return on Capital Employed (ROCE)
The table below shows INDITEX Return on Capital Employed, defined as EBIT on average capital
employed (Shareholder’s equity plus net financial debt).
RETURN ON CAPITAL EMPLOYED
Descriptión 2005 2004
EBIT 1,093.6 922.0
AVERAGE CAPITAL EMPLOYED:
Average shareholders' equity 2,637.5 2,171.3
Average net financial debt (*) 0.0 0.0
Total average capital employed 2,637.5 2,171.3
RETURN ON CAPITAL EMPLOYED 41% 42%
(*) Zero when net cash
110-128 informe EN.qxp 27/6/06 10:41 Página 121

FINANCIAL PERFORMANCE INDITEX 2005122
ROCE BY CONCEPT
2005CONCEPT 2004
ROCE ROCE
Zara 41% 42%
KIddy’s Class 67% 59%
Pull&Bear 47% 41%
M.Dutti 27% 43%
Bershka 42% 47%
Stradivarius 82% 41%
Oysho 50% 51%
Zara Home 3% 1%
Total 41% 42%
ROCE by concept
The table below shows the Return on Capital Employed by concept:
COMMENTS ON THE BALANCE SHEET
INDITEX Consolidated Balance Sheet maintains a similar structure to that it showed at FYE2004,
without net financial debt and with a negative operating working capital position, a conse-
quence of the business model.
Net financial position
The net financial position is shown in the table below:
NET FINANCIAL CASH (DEBT) (MillIons of euros)
Concept 31 Jan 2006 31 Jan 2005
Cash & cash equivalents 988.4 771.8
Current financial debt (209.2) (163.7)
Non current financial debt (76.1) (119.2)
NNEETT FFIINNAANNCCIIAALL CCAASSHH ((DDEEBBTT)) 770033..11 448888..99
The evolution of the net financial position during the last nine quarters has been the following:
9.3
-100
0
100
200
300
400
500
600
700
800
1Q04 2Q04 3Q04 4Q04 1Q05 2Q05 3Q05 4Q05
107171
489
376
197
367
703
110-128 informe EN.qxp 29/6/06 12:06 Página 122

FINANCIAL PERFORMANCE INDITEX 2005 123
Working capital
The table below shows a breakdown of working capital of the last two fiscal years:
WORKING CAPITAL (Million euros)
Concept 31 Jan 2006 31 Jan 2005
Inventories 684.4 517.9
Accounts receivable 357.9 254.1
Current liabilities (1,641.6) (1,208.6)
Other 15.9 17.9
Operating working capital (583.4) (418.8)
Cash and cash equivalents 988.4 771.8
Current financial debt (209.2) (163.7)
Financial working capital 779.2 608.1
Working capital 195.8 189.4
Operating working capital financing has increased by 39% to 583.4 million (418.8 million in
FY2004).
COMMENTS ON THE CASH FLOW STATEMENT
The summary of the cash flow statement is the following:
Funds from Operations grew by 21% in 2005, reaching 1,240.3 million. Working Capital finan-
cing has taken Cash from Operations to 1,420.7 million, 15% higher than in FY2004.
Capital Expenditure for the FY amounted to 811.9 million.
Free cash flow increased by 12% to 608.8 million and a 301.8 million dividend was paid to
shareholders.
CASH FLOW SUMMARY Var%FY 2005 FY 2004 05/04
Income before taxes 1,101.4 896.8 23%Funds from operations 1,240.3 1,021.6 21%Changes in working capital 180.4 218.2Cash from operations 1,420.7 1,239.8 15%Net capital expenditure (811.9) (695.9) 17%Free cash flow 608.8 543.9 12%Dividends (301.8) (219.4)Net debt decrease (307.5) (325.0)Others 0.5 0.5
9.4
110-128 informe EN.qxp 27/6/06 10:41 Página 123
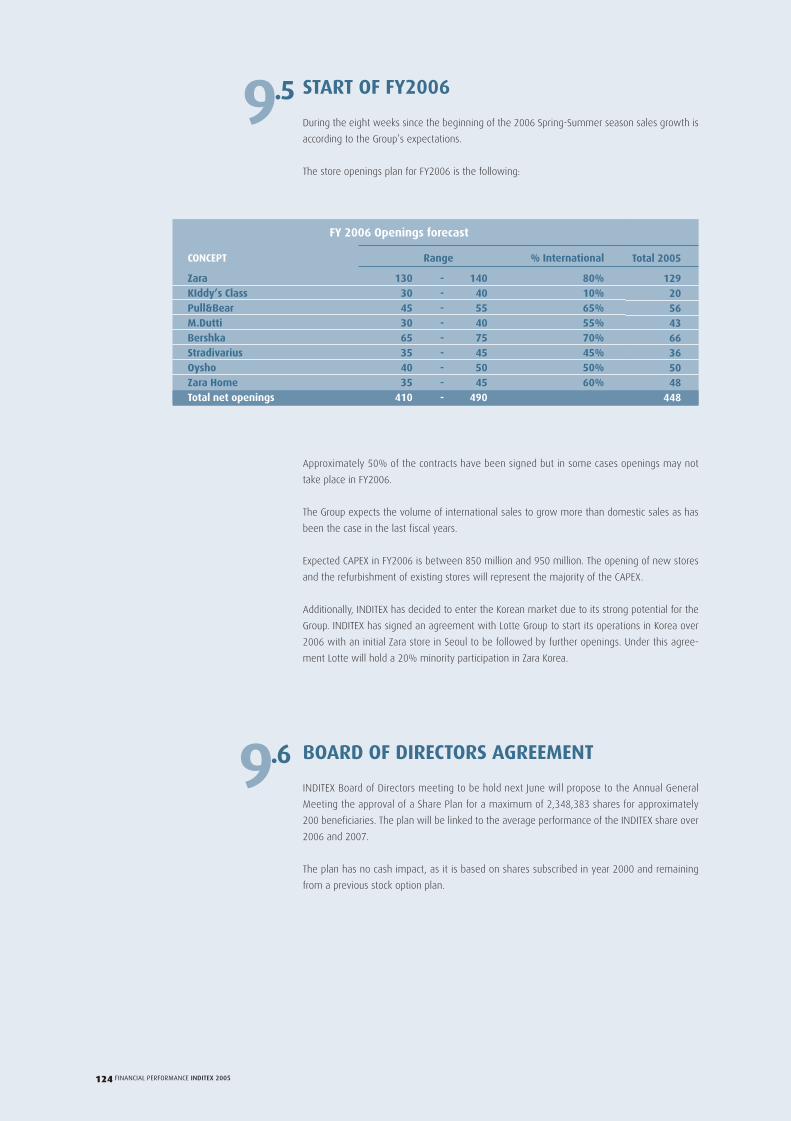
FINANCIAL PERFORMANCE INDITEX 2005124
START OF FY2006
During the eight weeks since the beginning of the 2006 Spring-Summer season sales growth is
according to the Group’s expectations.
The store openings plan for FY2006 is the following:
Approximately 50% of the contracts have been signed but in some cases openings may not
take place in FY2006.
The Group expects the volume of international sales to grow more than domestic sales as has
been the case in the last fiscal years.
Expected CAPEX in FY2006 is between 850 million and 950 million. The opening of new stores
and the refurbishment of existing stores will represent the majority of the CAPEX.
Additionally, INDITEX has decided to enter the Korean market due to its strong potential for the
Group. INDITEX has signed an agreement with Lotte Group to start its operations in Korea over
2006 with an initial Zara store in Seoul to be followed by further openings. Under this agree-
ment Lotte will hold a 20% minority participation in Zara Korea.
BOARD OF DIRECTORS AGREEMENT
INDITEX Board of Directors meeting to be hold next June will propose to the Annual General
Meeting the approval of a Share Plan for a maximum of 2,348,383 shares for approximately
200 beneficiaries. The plan will be linked to the average performance of the INDITEX share over
2006 and 2007.
The plan has no cash impact, as it is based on shares subscribed in year 2000 and remaining
from a previous stock option plan.
FY 2006 Openings forecast
CONCEPT Range % International
Zara 130 - 140 80%KIddy’s Class 30 - 40 10%Pull&Bear 45 - 55 65%M.Dutti 30 - 40 55%Bershka 65 - 75 70%Stradivarius 35 - 45 45%Oysho 40 - 50 50%Zara Home 35 - 45 60%Total net openings 410 - 490
Total 2005
12920564366365048
448
9.5
9.6
110-128 informe EN.qxp 27/6/06 10:41 Página 124

FINANCIAL PERFORMANCE INDITEX 2005 125
OTHER SUBJECTS
Research and development expenses
The Inditex Group has not carried out, and has not engaged third parties to carry out research
and development projects, to be performed over several years and for which investment is
earmarked to develop products expected to generate revenues in more than one year.
Nevertheless, since the incorporation of the company, management has applied available tech-
nology in all areas of its activity to improve manufacturing and distribution processes and deve-
loped, with own resources or the assistance of third parties, instruments with which to improve
business management. Examples include point-of-sale terminals, stock administration and
management systems, distribution centre systems, communication with stores and in-store
garment labelling systems.
Operations with own shares
No operations have been carried out by Group companies with shares of the Controlling Com-
pany in 2005.
9.7
110-128 informe EN.qxp 27/6/06 10:41 Página 125
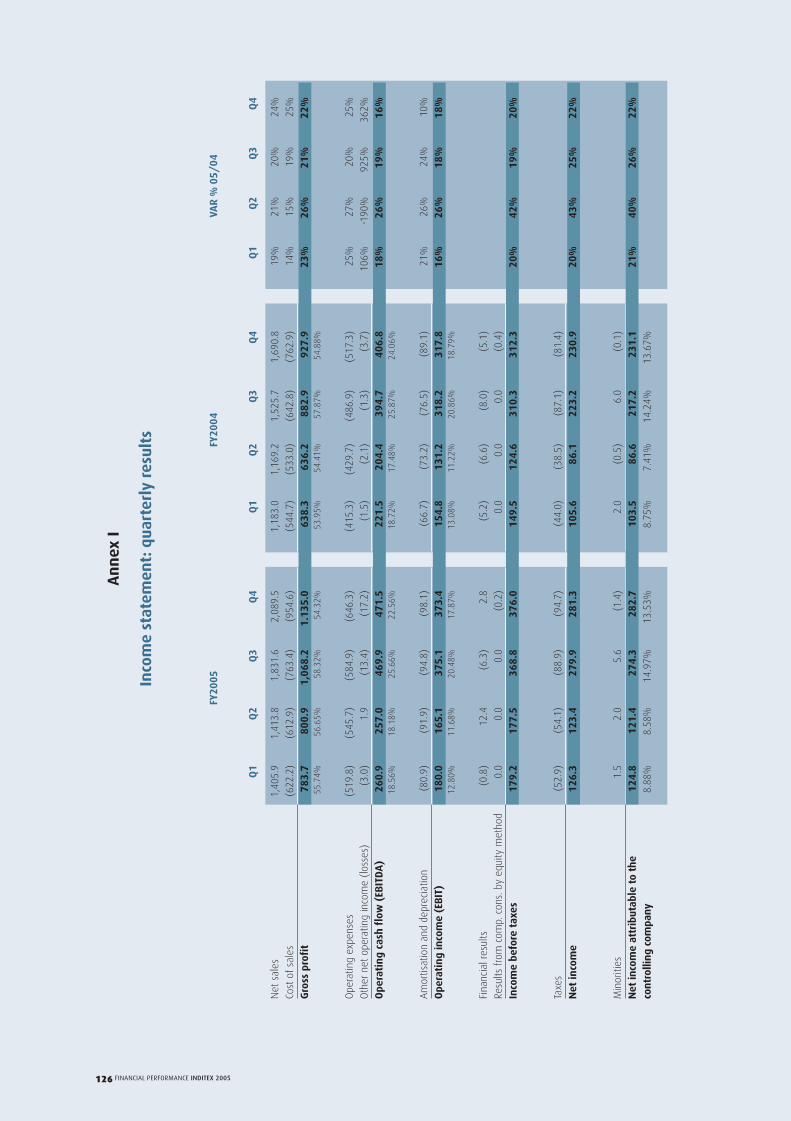
FINANCIAL PERFORMANCE INDITEX 2005126
Q1
Q2
Q3
Q4
Q1
Q2
Q3
Q4
Q1
Q2
Q3
Q4
FY20
05FY
2004
VAR
% 0
5/04
An
nex
I
Inco
me
stat
emen
t: q
uart
erly
res
ults
Net
sal
es1,
405.
91,
413.
81,
831.
62,
089.
51,
183.
01,
169.
21,
525.
71,
690.
819
%21
%20
%24
%
Cost
of
sale
s(6
22.2
)(6
12.9
)(7
63.4
)(9
54.6
)(5
44.7
)(5
33.0
)(6
42.8
)(7
62.9
)14
%15
%19
%25
%
Gro
ss p
rofi
t78
3.7
800.
91,
068.
21.
135.
063
8.3
636.
288
2.9
927.
923
%26
%21
%22
%55
.74%
56.6
5%58
.32%
54.3
2%53
.95%
54.4
1%57
.87%
54.8
8%
Ope
ratin
g ex
pens
es(5
19.8
)(5
45.7
)(5
84.9
)(6
46.3
)(4
15.3
)(4
29.7
)(4
86.9
)(5
17.3
)25
%27
%20
%25
%
Oth
er n
et o
pera
ting
inco
me
(los
ses)
(3.0
)1.
9(1
3.4)
(17.
2)(1
.5)
(2.1
)(1
.3)
(3.7
)10
6%-1
90%
925%
362%
Ope
rati
ng
cash
flo
w (
EBIT
DA
)26
0.9
257.
046
9.9
471.
522
1.5
204.
439
4.7
406.
818
%26
%19
%16
%18
.56%
18.1
8%25
.66%
22.5
6%18
.72%
17.4
8%25
.87%
24.0
6%
Am
ortis
atio
n an
d de
prec
iatio
n(8
0.9)
(91.
9)(9
4.8)
(98.
1)(6
6.7)
(73.
2)(7
6.5)
(89.
1)21
%26
%24
%10
%
Ope
rati
ng in
com
e (E
BIT
)18
0.0
165.
137
5.1
373.
415
4.8
131.
231
8.2
317.
816
%26
%18
%18
%12
.80%
11.6
8%20
.48%
17.8
7%13
.08%
11.2
2%20
.86%
18.7
9%
Fina
ncia
l res
ults
(0.8
)12
.4(6
.3)
2.8
(5.2
)(6
.6)
(8.0
)(5
.1)
Resu
lts f
rom
com
p. c
ons.
by
equi
ty m
etho
d0.
00.
00.
0(0
.2)
0.0
0.0
0.0
(0.4
)
Inco
me
befo
re t
axes
179.
217
7.5
368.
837
6.0
149.
512
4.6
310.
331
2.3
20%
42%
19%
20%
Taxe
s(5
2.9)
(54.
1)(8
8.9)
(94.
7)(4
4.0)
(38.
5)(8
7.1)
(81.
4)
Net
inco
me
126.
312
3.4
279.
928
1.3
105.
686
.122
3.2
230.
920
%43
%25
%22
%
Min
oriti
es1.
52.
05.
6(1
.4)
2.0
(0.5
)6.
0(0
.1)
Net
inco
me
attr
ibut
able
to
the
124.
812
1.4
274.
328
2.7
103.
586
.621
7.2
231.
121
%40
%26
%22
%co
ntro
lling
com
pany
8.88
%8.
58%
14.9
7%13
.53%
8.75
%7.
41%
14.2
4%13
.67%
110-128 informe EN.qxp 27/6/06 10:41 Página 126

FINANCIAL PERFORMANCE INDITEX 2005 127
An
nex
II
Sum
mar
y of
net
ope
nin
gs a
nd
net
sto
res
open
ed b
y qu
arte
r
ZAR
A74
476
281
685
264
165
369
572
3
KID
DY´
S CL
ASS
135
139
143
149
110
116
124
129
PULL
AN
D B
EAR
381
390
414
427
355
355
368
371
MA
SSIM
O D
UTT
I34
034
535
636
930
430
732
332
6
BER
SHK
A31
832
434
436
826
027
228
730
2
STR
AD
IVA
RIU
S23
424
225
426
319
920
721
622
7
OYS
HO
113
122
139
154
8086
9810
4
ZAR
A H
OM
E69
8010
111
034
4152
62
Tota
l sto
res
2,33
42,
404
2,56
72,
692
1,98
32,
037
2,16
32,
244
Q1
2005
Q2
2005
Q3
2005
Q4
2005
TOTA
L20
05Q
120
04Q
220
04Q
320
04
Q1
2005
Q2
2005
Q3
2005
Q4
2005
Q1
2004
Q2
2004
Q3
2004
Q4
2004
Q4
2004
TOTA
L20
04CO
NCE
PT
Form
at
ZAR
A21
1854
3612
915
1242
2897
KID
DY´
S CL
ASS
64
46
207
68
526
PULL
AN
D B
EAR
109
2413
565
013
321
MA
SSIM
O D
UTT
I14
511
1343
73
163
29
BER
SHK
A16
620
2466
712
1515
49
STR
AD
IVA
RIU
S7
812
936
88
911
36
OYS
HO
99
1715
504
612
628
ZAR
A H
OM
E7
1121
948
87
1110
36
Tota
l sto
res
9070
163
125
448
6154
126
8132
2
NU
MB
ER O
F ST
OR
ES B
Y TH
E EN
D O
F EA
CH Q
UA
RTER
NU
MB
ER O
F N
ET S
TOR
E O
PEN
ING
S IN
EA
CH Q
UA
RTER
110-128 informe EN.qxp 27/6/06 10:41 Página 127

FINANCIAL PERFORMANCE INDITEX 2005128
Annex IIIStores by concept and country as at 31 January 2006
ZARA
KIDDY´S CLA
SS
MASSIMO DUTTI
ZARA HOME
STRADIVARIUS
OYSHO
BERSH
KA
PULL AND B
EAR
INDITEX
SPAIN 259 130 275 211 212 205 93 76 1,461PORTUGAL 46 19 60 45 33 26 20 11 260FRANCE 90 1 10 21 1 123BELGIUM 18 19 6 1 44NETHERLANDS 6 1 4 1 12UNITED KINGDOM 45 8 2 1 56GERMANY 41 5 46SWEDEN 4 3 7NORWAY 2 2ANDORRA 1 1 1 1 4AUSTRIA 8 8DENMARK 4 4LUXEMBOURG 2 1 3ICELAND 1 1IRELAND 5 9 1 4 19FINLAND 4 4ITALY 36 7 5 12 11 3 74SWITZERLAND 8 4 1 13POLAND 11 1 12CZECH REPUBLIC 3 1 1 5GREECE 38 11 10 14 2 6 3 84SLOVENIE 3 3SLOVAKIA 2 2MALTA 1 4 1 6CYPRUS 3 2 1 3 2 1 12ISRAEL 14 12 26LEBANON 2 3 3 2 1 1 12TURKEY 13 1 3 1 1 1 1 21KUWAIT 4 3 1 2 1 1 12UAE 5 4 5 4 3 1 3 25SAUDÍ ARABIA 16 7 7 14 2 4 50BAHRAIN 1 1 1 3QATAR 1 1 1 1 4JORDAN 1 1 1 2 5CANADÁ 14 14USA 18 18PUERTO RICO 1 1DOMINICAN REP. 1 1MEXICO 39 18 18 30 18 3 126VENEZUELA 9 3 9 21EL SALVADOR 1 1BRAZIL 14 14 ARGENTINA 6 6CHILE 5 5URUGUAY 2 2JAPAN 18 18SINGAPORE 3 1 4RUSSIA 6 6 2 14MALAYSIA 3 3MARROCCO 1 1 2HONG KONG 4 4ESTONIA 1 1LATVIA 1 1ROMENIA 1 1 2HUNGARY 2 2LITHUANIA 2 2PANAMÁ 1 1COSTA RICA 1 1INDONESIA 2 2PHILIPINNES 1 1MONACO 1 1THAYLAND 1 1
Total 852 149 427 369 368 263 154 110 2,692
110-128 informe EN.qxp 27/6/06 10:41 Página 128

The book Economic and Financial Performance 2005 is printed on chlorine-free paper and has been manufactured following environmentally friendly processes.© June 2006, Inditex S.A. All rights reservedLegal Deposit: M-29377-2006
Editor: Communication and InstitutionalRelations Corporate DivisionInditex S.A.Edificio InditexAvda. de la Diputación, s/n15142 ArteixoA Coruña, Spain
The Annual Report 2004, printed on June 2005, is the previous Report published by the Company
Published: REPORTER S A, a division of MRM Worldwide Spain S.A. telf 0034 91 4360138
ultimas LIBROS ESÑOL+ingl.qxp 27/6/06 10:47 Página 1