annual report inditex 2003
TRANSCRIPT

A N N U A L R E P O R T I N D I T E X 2 0 0 3

A N N U A L R E P O R T I N D I T E X 2 0 0 3

CONTENTS
4 LETTER TO SHAREHOLDERS
8 FINANCIAL HIGHLIGHTS
12 BUSINESS PERFORMANCE
24 BOARD OF DIRECTORS
28 AUDITORS’ REPORT AND ANNUAL ACCOUNTS
70 CONSOLIDATED MANAGEMENT REPORT

LETTER TO SHAREHOLDERS

Dear shareholders:
Inditex has presented for your consideration in this Annual
Report the data for fiscal 2003 and on this occasion I once
again have the honour of addressing you. As in previous years,
we must first of all refer to the continuation of the effort made
by our human team, which has seen its fruit in the growth in
our net sales by 16% and the opening of more than 360
points of sale worldwide. The dedication of the professionals
making up our group have also allowed us to accomplish other achievements, such as the launch of a new
retail format or the setting in motion in record time of a new logistics centre for the Zara concept.
As regards financial performance over the year, after a first half in which the group increased its net income
by more than 20%, during the second half of the year the effects of an unfavourable environment reduced
this increase to 2% for the whole of the year. An especially hot and long summer throughout Europe led to
weak sales in the third quarter. The flexibility offered by our business model made it possible for us to adapt
our offer to this circumstance, which caused the number of units sold in this quarter to increase by 26% com-
pared to the previous year. However, the lower price per unit of the products sold, in accordance with the cli-
matic conditions, gave rise to a fall in like-for-like sales.
These circumstances, which affected the whole of the fashion distribution sector, resulted in a fourth quarter
marked by strong promotional activity in all the relevant markets for the Inditex group. To all this was added
the exchange rate effect, which decreased progressively throughout the course of the year leading finally to
a 4% reduction in consolidated sales.
Our projections, in view of the performance of our sales at the beginning of fiscal 2004, are indicating that we
are in a position in 2004 to recover from the decrease in profitability margins occurring in 2003. In order to do
this we are focusing our attention on improving certain aspects of the management of some of our retail for-
mats, so as to consolidate the main advantage of our model: flexibility to adapt our offer to market demands.
Furthermore, we are maintaining our targets for growth, fundamentally in the most important markets on
the European continent, where we will continue to concentrate openings both of Zara stores and of stores

from the other formats of the group. Likewise, it is our intention to increase Inditex’s stake in
our subsidiaries in Italy and Japan, thus assuming a comfortable majority in its companies in
two of the most profitable markets for the group, where we are also going to notably increa-
se our commercial presence in the next few years.
The dividend proposal made by the Board of Directors to the Shareholders Meeting, showing
a strong increase through surplus dividend, signals the beginning of an upwards curve in Indi-
tex’s dividend pay-outs, with the aim of getting to 40% in the mid-term. This does not signify
by any means a departure from our policy on investments, which are going to continue to
grow at the previous rate, but rather is proof of our business’s great capacity to generate funds.
Over 2003 we have continued to further the commitment of the company to the rules of
good governance, by trying not only to comply with the successive updates in the regula-
tions but also to progress in transparency towards shareholders and investors in general as
regards our decision-making mechanisms. Inditex is receiving acknowledgement for its
efforts in this respect, in which it will continue to persevere.
Another of the areas where we are going to continue to focus our attention is that of the
development of our corporate responsibility policy.Together with this Annual Report we will
publish, for the second year running, the group’s Sustainability Report, which will reflect the
work carried out in the economic, social and environmental fields. One of our objectives for
this year is to intensify dialogue with our stakeholders, with the aim of increasing the quality
of our actions in this field through their critical contribution.
To end, let me reiterate my confidence in the commitment of the professionals making up
this group and who, independently of the climate our operations develop in, demonstrate
every day that the key part of Inditex’s business model is its human capital.
Amancio Ortega Gaona
Chairman

FINANCIAL HIGHLIGHTS

ANNUAL REPORT 2003 INDITEX 9
The Inditex group’s consolidated net sales grew in fiscal 2003 to 4,598.9 million euros, 16% higher than the figure
obtained in 2002.With constant exchange rates, the increase in sales would have been 20%. Net income reached
446.5 million euros in this last year, 2% more than the previous year.The net margin on sales was 9.7%.
The results for the year reflect the effect on the performance of our sales and on the operating margin caused by
the situation experienced in the second half, with an adverse climate giving rise to strong price competition bet-
ween international competitors in the fashion distribution sector. Inditex’s sales grew strongly in this period as
regards units, but the decrease in the average price per unit moderated the effect on net sales. EBITDA increased
by 1% to 873.5 million euros, while EBIT decreased by 5% to 627 million euros. Like-for-like sales grew by 1%, ver-
sus 11% the previous year, as a consequence of a decrease of 2% in the second half.
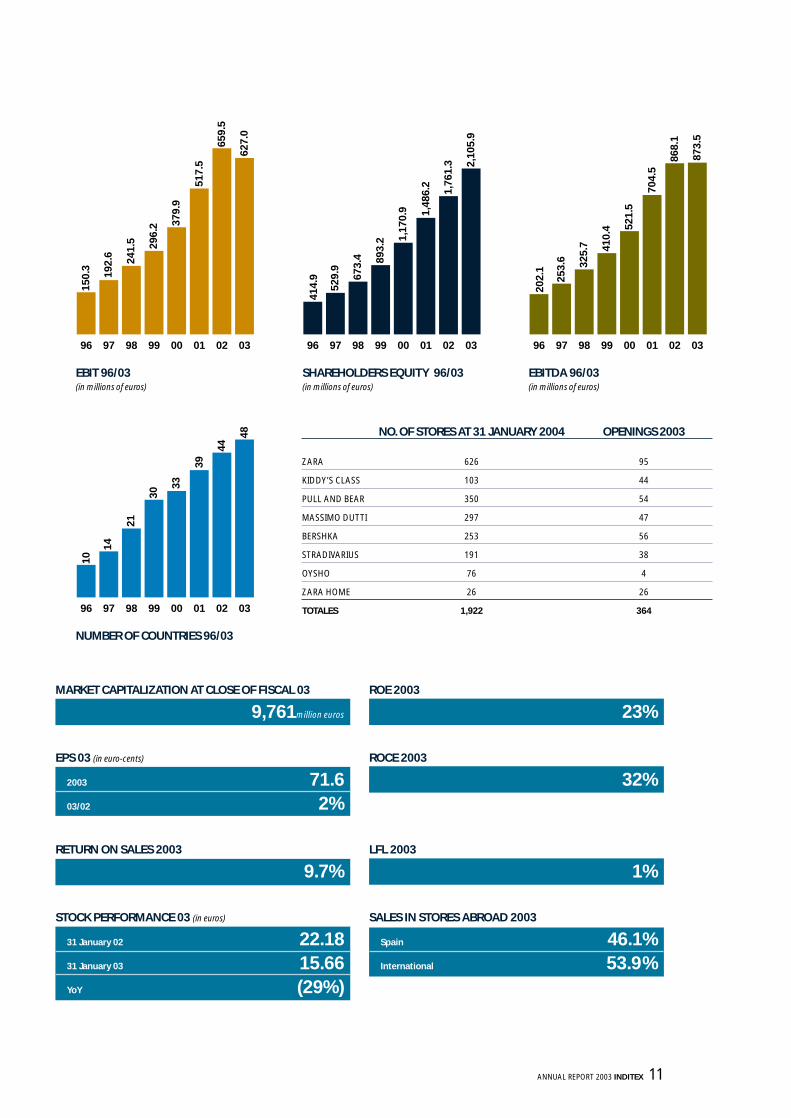
At the close of fiscal 2003, the Inditex group had 1,922 stores open in 48 countries, 364 more than the previous
year. A large part of these openings took place in Europe, with the sharp increase in Inditex’s presence in the main
markets of this continent, such as Italy, the United Kingdom or Germany, particularly standing out.This growth in
the number of stores has been reflected in an increase in selling area in 2003, which reached a total of 988,357 m2,
25% more than one year earlier. Over the course of the year, the group opened its first stores in four new markets:
Russia, Malaysia, Slovenia and Slovakia. The sales in stores outside Spain in 2003 accounted for 53.9% of the total
sales of the group, 0.1% more than in 2002. Sales from the European markets taken as a whole went from 80.1%
in 2002 to 81.6% in 2003.
GROWTH IN AN ADVERSE CONSUMER ENVIRONMENT
NET SALES 96/03CAGR 96/03 24%
(in millions of euros)
96 97 98 99 00 01 02 03
1,61
4.7
2,03
5.1 2,
614.
7
1,21
7.4
1,00
8.5
3,97
4.0 4,
598.
9
3,24
9.8
NET INCOME 96/03CAGR 96/03 30%
(in millions of euros)
96 97 98 99 00 01 02 03
153.
1 204.
7 259.
2
117.
4
72.7
438.
1
446.
5
340.
4
NO. OF STORES 96/03
96 97 98 99 00 01 02 03
748
922
1,08
0
622
541
1,55
8
1,92
2
1,28
4

10 INDITEX ANNUAL REPORT 2003
MAIN INDICATORS
CAGRDescription 2003 2002 2001 2000 1999 1998 1997 1996 03/96
Results:
Net sales* 4,598.9 3,974.0 3,249.8 2,614.7 2,035.1 1,614.7 1,217.4 1,008.5 24%
YOY % 16% 22% 24% 28% 26% 33% 21%
EBITDA* 873.5 868.1 704.5 521.5 410.4 325.7 253.6 202.1 23%
YOY % 1% 23% 35% 27% 26% 28% 25%
EBIT* 627.0 659.5 517.5 379.9 296.2 241.5 192.6 150.3 23%
YOY % -5% 27% 36% 28% 23% 25% 28%
Net income after minorities* 446.5 438.1 340.4 259.2 204.7 153.1 117.4 72.7 30%
YOY % 2% 29% 31% 27% 34% 30% 61%
Balance:
Shareholders equity* 2,105.9 1,761.3 1,486.2 1,170.9 893.2 673.4 529.9 414.9 26%
YOY % 20% 19% 27% 31% 33% 27% 28%
Total balance* 3,510.4 3,013.8 2,588.6 2,107.6 1,772.9 1,326.3 977.2 820.3 23%
YOY % 16% 16% 23% 19% 34% 36% 19%
Net financial position* 268.3 245.6 57.5 (50.6) (149.9) (93.0) (38.3) (105.8)
Stores:
Number of stores at year-end closing 1,922 1,558 1,284 1,080 922 748 622 541
Net openings 364 274 204 158 174 126 81 33
Number of countries 48 44 39 33 30 21 14 10
Other information:
International sales % 54% 54% 54% 52% 49% 46% 42% 36%
LFL sales 1% 11% 9% 9% 5% 11% 7% 4%
ROE 23% 27% 26% 25% 26% 25% 25% 20%
ROCE 32% 41% 39% 34% 33% 36% 35% 29%
Number of employees 39,760 32,535 26,724 24,004 18,200 15,576 10,891 8,412
*in millions of euros
Financial performance of recent fiscal years
SHAREHOLDERS EQUITY 96/03(in millions of euros)
96 97 98 99 00 01 02 0367
3.4 89
3.2 1,
170.
9
529.
9
414.
9
1,76
1.3 2,
105.
9
1,48
6.2
ANNUAL REPORT 2003 INDITEX 11
ROE 2003
23%
ROCE 2003
32%
LFL 2003
1%
SALES IN STORES ABROAD 2003
Spain 46.1%International 53.9%
MARKET CAPITALIZATION AT CLOSE OF FISCAL 03
9,761million euros
EPS 03 (in euro-cents)
2003 71.603/02 2%
RETURN ON SALES 2003
9.7%
STOCK PERFORMANCE 03 (in euros)
31 January 02 22.1831 January 03 15.66YoY (29%)
NO. OF STORES AT 31 JANUARY 2004 OPENINGS 2003
ZARA 626 95
KIDDY’S CLASS 103 44
PULL AND BEAR 350 54
MASSIMO DUTTI 297 47
BERSHKA 253 56
STRADIVARIUS 191 38
OYSHO 76 4
ZARA HOME 26 26
TOTALES 1,922 364
NUMBER OF COUNTRIES 96/03
96 97 98 99 00 01 02 03
21
30
33
14
10
44
48
39
EBIT 96/03 (in millions of euros)
96 97 98 99 00 01 02 03
241.
5 296.
2 379.
9
192.
6
150.
3
659.
5
627.
0
517.
5
EBITDA 96/03(in millions of euros)
96 97 98 99 00 01 02 03
325.
7 410.
4 521.
5
253.
6
202.
1
868.
1
873.
5
704.
5

15 FORMATS
20 INTERNATIONAL PRESENCE
22 STOCK PERFORMANCE
BUSINESS PERFORMANCE

GOBIERNO CORPORATIVO 13

In fiscal 2003 the Inditex group increased the pace of its international expansion, opening a total of 364 new
outlets, 90 more than in the previous year. As at 31 January 2004, the group had a total of 1,922 stores in 48 coun-
tries, having opened its first stores in Russia, Malaysia, Slovenia and Slovakia.
Some 90% of the new openings —325 stores— took place in Europe, where the group achieved a total of 1,650
stores. On the American continent, 27 new stores were opened, making a total of 172; in the Middle East there
were six new openings, reaching a total of 87; and in the Asian-Pacific area, another six openings took place, rai-
sing the total number of stores to 13. The company is thus continuing to consolidate its presence in the main
European markets while at the same time taking advantage of other opportunities in different geographic areas.
Fiscal 2003 saw the satisfactory completion of the building and setting in motion of Plataforma Europa in Zarago-
za, the second logistics centre for the Zara format. Plataforma Europa is located in the Pla-Za logistics platform in
Zaragoza, a complex with excellent infrastructures and good access to the transport network.Through this centre,
the necessary steps have been taken to adapt Zara’s distribution capacity to its rate of international growth.
In August 2003 a new commercial format devoted to home goods, Zara Home, was launched, becoming the
eighth format of the group. In its first six months of activity, Zara Home’s product offer has been well received by
the public and sales have exceeded the company’s expectations.
BUSINESS PEFORMANCE
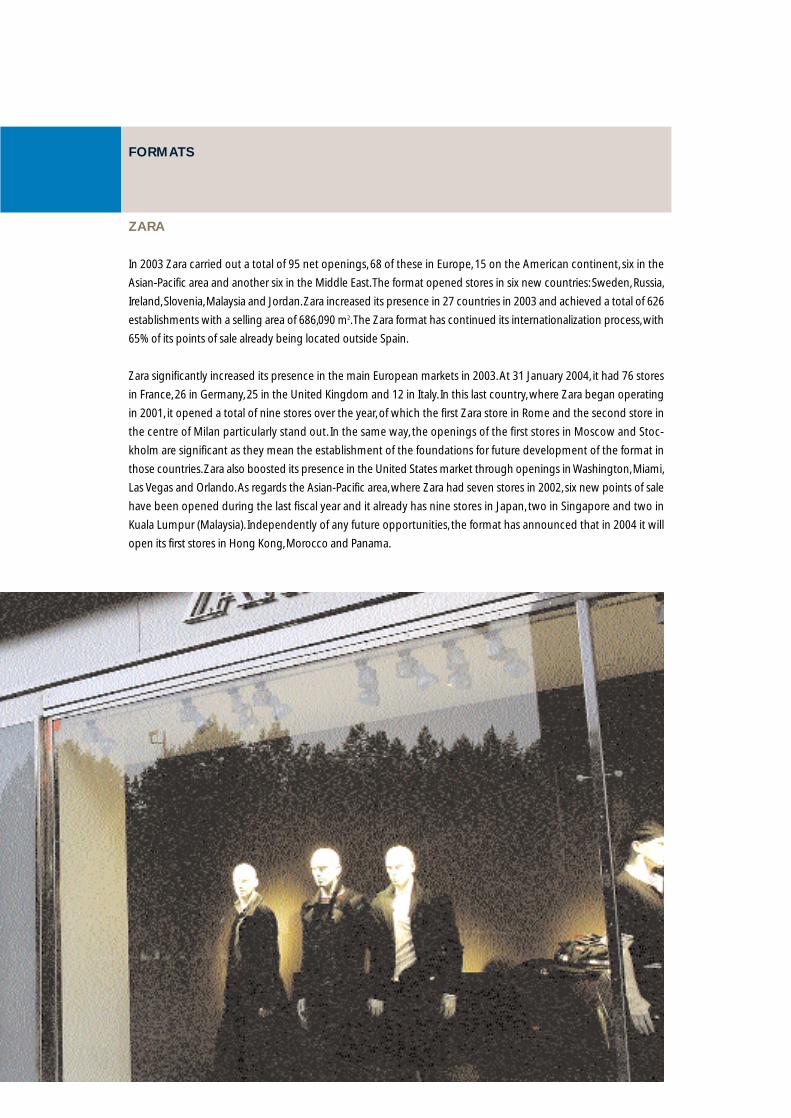
ZARA
In 2003 Zara carried out a total of 95 net openings, 68 of these in Europe, 15 on the American continent, six in the
Asian-Pacific area and another six in the Middle East.The format opened stores in six new countries: Sweden, Russia,
Ireland, Slovenia, Malaysia and Jordan. Zara increased its presence in 27 countries in 2003 and achieved a total of 626
establishments with a selling area of 686,090 m2.The Zara format has continued its internationalization process, with
65% of its points of sale already being located outside Spain.
Zara significantly increased its presence in the main European markets in 2003. At 31 January 2004, it had 76 stores
in France, 26 in Germany, 25 in the United Kingdom and 12 in Italy. In this last country, where Zara began operating
in 2001, it opened a total of nine stores over the year, of which the first Zara store in Rome and the second store in
the centre of Milan particularly stand out. In the same way, the openings of the first stores in Moscow and Stoc-
kholm are significant as they mean the establishment of the foundations for future development of the format in
those countries.Zara also boosted its presence in the United States market through openings in Washington, Miami,
Las Vegas and Orlando. As regards the Asian-Pacific area, where Zara had seven stores in 2002, six new points of sale
have been opened during the last fiscal year and it already has nine stores in Japan, two in Singapore and two in
Kuala Lumpur (Malaysia). Independently of any future opportunities, the format has announced that in 2004 it will
open its first stores in Hong Kong, Morocco and Panama.
FORMATS

16 INDITEX ANNUAL REPORT 2003
Zara’s turnover rose to 3,219.6 million euros, a figure which represents 70% of the group’s total.
In fiscal 2003 the building and setting in motion of Plataforma Europa, the second logistics centre for the Zara for-
mat, was completed. Plataforma Europa measures more than 123,000 m2 and has been provided with the latest
advances in the logistics field which have been specifically adapted to the fashion retail business, resulting in a
distribution capacity of 80,000 garments an hour.The distribution centre is located at the Logistics Centre in Zara-
goza, with direct access to the rail and motorway network and close to Zaragoza airport, which favours the han-
dling of international cargo.
KIDDY’S CLASS
The children’s fashion format, Kiddy’s Class, opened 44 new outlets in Spain and Portugal over the year and rea-
ched a total of 103 stores in those countries.The Inditex group decided last year to strengthen its presence in the
children’s fashion sector, leading to the establishment of Kiddy’s Class as an independent format. Kiddy's Class has
demonstrated great potential for development: its 44 openings in the year have meant a 74.5% increase in the
format’s number of points of sale in just the last year.The new stores were opened in Spain (38) and Portugal (6),
making the store total for this format 90 and 13 respectively in those countries. Selling area came to 20,614 m2.
Kiddy’s Class, with a turnover of 89.7 million euros, accounted for 1.9% of the group’s total.
PULL AND BEAR
The figure for net openings of Pull and Bear stores over the year was 54 outlets in eight countries, two of them in
markets where the concept had not been present before: Andorra and Slovenia.The total number of stores, with
a total selling area of 67,175 m2, rose to 350 in 18 countries.
Pull and Bear’s turnover for the year was 287.9 million euros, 6.3% of the group’s total.
MASSIMO DUTTI
The Massimo Dutti fashion concept opened 47 stores in fiscal 2003, which came to a total of 297 in 23 countries.
These openings took place in nine different markets. Its total selling area at 31 January 2004 was 62,060 m2. The
weight of Massimo Dutti in Inditex’s total sales was 8.5%, with turnover of 388.9 million euros.
In 2003 Massimo Dutti launched a range of children’s fashion, under the trade name Dutti Boys.This line is being
progressively introduced in several countries in stores which are large enough to accommodate a specific area
for Dutti Boys.


ANNUAL REPORT 2003 INDITEX 19
BERSHKA
Bershka had a total of 56 net openings in 2003. The young fashion chain had 253 stores in 13 countries at 31
January 2004.The openings in the past year took place in nine countries, of which four were countries where it had
not been present before: Italy, France, Holland and Lebanon.
Bershka’s turnover reached 395 million euros in 2003, which represents 8.6% of the group’s total. Its selling area at
year-end closing came to 85,835 m2.
STRADIVARIUS
With 38 new openings in the year, the Stradivarius concept ended 2003 with 191 points of sale in nine countries.
Its selling area at 31 January 2004 was 49,808 m2.
The turnover for this format —162 million euros— made up 3.5% of the group’s total in 2003.
OYSHO
Oysho had four net openings in fiscal 2003.The lingerie format ended the year with 76 stores in eight countries
and a selling area of 10,932 m2. During the last year, Oysho opened its first store in Saudi Arabia. Its turnover in 2003
was 45.1 million euros, 1% of the Inditex group’s total.
ZARA HOME
In fiscal 2003, the Inditex group opened the first stores of its Zara Home format, which became the eighth retail for-
mat of the group. Zara Home offers textile products for beds, tables and the bathroom, as well as household items,
small decorative objects and cosmetic items. Zara Home follows the same philosophy that Zara applies to fashion,
frequently renewing its range for the home and offering design products at attractive prices.
Zara Home had achieved 26 openings as at 31 January 2004, in barely six months since its launch in August 2003.
The format is present in Spain, Portugal, Greece and the United Kingdom. Its opening in London signifies an impor-
tant step in its international expansion plan, as it introduces the concept in a market where there is a high level of
competition in the segment. Its selling area at year-end closing was 5,843 m2 and its sales came to 10.6 million euros,
0.2% of the total.

INTERNATIONAL PRESENCE
AMERICA ZARA P&B MD BSK OYSHO
ARGENTINA 5
BRAZIL 13
CANADA 10
CHILE 5
DOMINICAN REPUBLIC 1
EL SALVADOR 1
MEXICO 33 12 17 25 11
UNITED STATES 12
URUGUAY 2
VENEZUELA 8 6 2 8 1
ASIA-PACIFIC ZARA
JAPAN 9
MALAYSIA 2
SINGAPORE 2

MIDDLE EAST ZARA P&B MD BSK STRAD OYSHO
BAHRAIN 1 1 1
ISRAEL 12 13
JORDAN 1 1 1 2KUWAIT 3 2 1 1 1
LEBANON 2 1 2 1
QATAR 1 1 1 1
SAUDI ARABIA 12 4 3 1UNITED ARAB EMIRATES 4 3 4 3 2
EUROPE ZARA KC P&B MD BSK STRAD OYSHO Z.HOME
ANDORRA 1 1 1AUSTRIA 4
BELGIUM 16 1 16 4
CYPRUS 3 2 1 2 2
CZECH REPUBLIC 1
DENMARK 3
FINLAND 3
FRANCE 76 2 3 1
GERMANY 26 4
GREECE 25 8 5 9 1 1
HOLLAND 4 1 2ICELAND 1IRELAND 1 6ITALY 12 1 2
LUXEMBOURG 2 1
MALTA 1 3
NORWAY 1
POLAND 6
PORTUGAL 40 13 47 40 26 20 10 2
RUSSIA 1
SLOVAKIA 1
SLOVENIA 1
SPAIN 221 90 241 181 167 159 49 22
SWEDEN 1 2
SWITZERLAND 3 3 2
TURKEY 10
UNITED KINGDOM 25 6 1

22 INDITEX ANNUAL REPORT 2003
The Inditex share underwent a decrease of 29% in its quotation in fiscal 2003. In the same period, the Ibex-35
index increased by 33%. The share closed at its highest annual price, 24 euros, on 3 September 2003. The mini-
mum closing price occurred on 22 December 2003 with a price per share of 15.50 euros.The average volume tra-
ded per trading day has exceeded 2.2 million shares.
Inditex’s market capitalization at the close of the fiscal year was 9,761 million euros, 6.73% above its value at its
initial listing on 23 May 2001.The Ibex-35 index fell by 20.57% over the same period.
STOCK PERFORMANCE
01/31/03 01/30/04
0
140
120
100
60
80
40
20
RELATIVE PERFORMANCE ITX vs. IBEX 35
IBEX100 index Value at 31 January 20035,947.7
INDITEX100 index Quotation at 31 January 200322.18 euros
inde
x m
illio
ns o
f eur
os
01/31/03 01/30/04
0
25
30
20
10
15
5
SHARE TRADED


BOARD OF DIRECTORS


26 INDITEX ANNUAL REPORT 2003
BOARD OF DIRECTORS
Composition as at 31 January 2004:
EXECUTIVE AUDIT NOMINATION AND TYPE
AND CONTROL REMUNERATION
CHAIRMAN
Amancio Ortega Gaona " Domanial-Executive
DEPUTY CHAIRMAN
José María Castellano Ríos " Executive
DIRECTORS
Carlos Espinosa de los Monteros " " Independent
Fred H. Langhammer " Independent
Francisco Luzón López " " " Independent
Rosalía Mera Goyenechea * Domanial
Irene Miller " Independent
Juan Carlos Rodríguez Cebrián " Executive
Juan Manuel Urgoiti López de Ocaña " " Independent
SECRETARY
Antonio Abril Abadín " Executive
"Member of the Committee
"Chairman of the Committee
*Rosalía Mera Goyenechea represents ROSP CORUNNA S.L., a company which is a member of the Board of Directors of the Company.
ANNUAL REPORT 2003 INDITEX 27
CHANGES DURING FISCAL 2003
The Board of Directors meeting on 20 March 2003 resolved to amend the name of the Audit and Compliance Com-
mittee to adapt it to the new nomenclature given by the Spanish law on measures of reform of the financial system
[Ley de Medidas de Reforma del Sistema Financiero], changing its name to the Audit and Control Committee.
Likewise, the Board of Directors approved on that date an amendment to its regulations, establishing that both
the Audit and Control Committee and the Nomination and Remuneration Committee will be made up exclusi-
vely of independent directors. In accordance with this, José María Castellano and Juan Carlos Rodríguez Cebrián
resigned as members, respectively, of the Audit and Control Committee and of the Nomination and Remunera-
tion Committee.
The Board of Directors meeting on 20 March 2003 also resolved to appoint Irene Miller and Fred H. Langhammer as
members, respectively, of the Audit and Control Committee and of the Nomination and Remuneration Committee.
MODIFICATIONS SUBSEQUENT TO THE CLOSE OF THE FISCAL YEAR
The Board of Directors on 10 June 2004 resolved to accept the resignation tendered by Rosp Corunna, S.L., through
its representative, Rosalía Mera Goyenechea, as a member of the Board of Directors of Inditex, the Board recording in
the minutes of the meeting its appreciation for the services rendered to the company and for her dedication in the
performance of her work as member of the Board of Directors.
Likewise, pursuant to the provisions of the Articles of Association and the Board of Directors’ Regulations, the Board
resolved, after a report from the Nomination and Remuneration Committee, to increase the number of members of
the Audit and Control Committee and the Nomination and Remuneration Committee from four to five members,
respectively, nominating Carlos Espinosa de los Monteros Bernaldo de Quirós as a new member of the Audit and
Control Committee and Irene Ruth Miller and Juan Manuel Urgoiti López de Ocaña as new members of the Nomi-
nation and Remuneration Committee.
28 GOBIERNO CORPORATIVO
AUDITORS’ REPORT AND ANNUAL ACCOUNTS
30 AUDITORS’ REPORT
32 CONSOLIDATED BALANCE SHEETS
34 CONSOLIDATED STATEMENTS OF INCOME
36 CONSOLIDATED ANNUAL ACCOUNTS


AUDITORS’ REPORT

32 INDITEX ANNUAL REPORT 2003
INDUSTRIA DE DISEÑO TEXTIL,S.A. AND SUBSIDIARIES
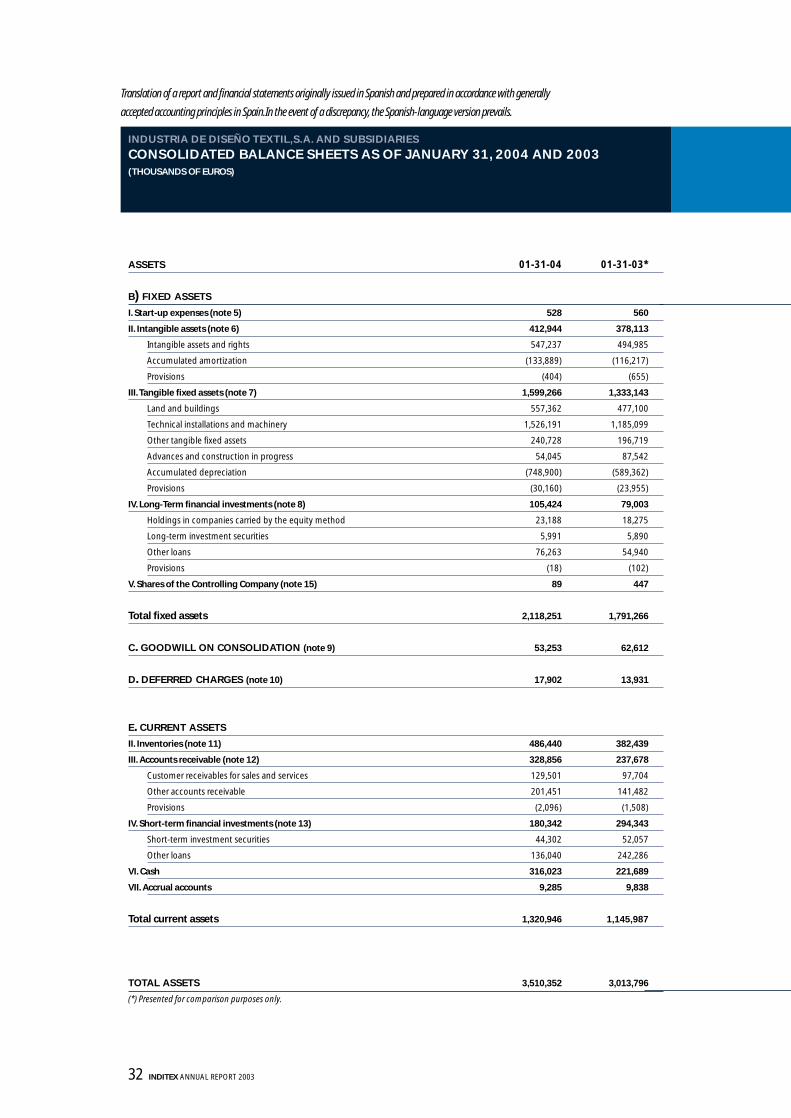
CONSOLIDATED BALANCE SHEETS AS OF JANUARY 31, 2004 AND 2003(THOUSANDS OF EUROS)
ASSETS 01-31-04 01-31-03*
B) FIXED ASSETS
I. Start-up expenses (note 5) 528 560
II. Intangible assets (note 6) 412,944 378,113
Intangible assets and rights 547,237 494,985
Accumulated amortization (133,889) (116,217)
Provisions (404) (655)
III. Tangible fixed assets (note 7) 1,599,266 1,333,143
Land and buildings 557,362 477,100
Technical installations and machinery 1,526,191 1,185,099
Other tangible fixed assets 240,728 196,719
Advances and construction in progress 54,045 87,542
Accumulated depreciation (748,900) (589,362)
Provisions (30,160) (23,955)
IV. Long-Term financial investments (note 8) 105,424 79,003
Holdings in companies carried by the equity method 23,188 18,275
Long-term investment securities 5,991 5,890
Other loans 76,263 54,940
Provisions (18) (102)
V. Shares of the Controlling Company (note 15) 89 447
Total fixed assets 2,118,251 1,791,266
C. GOODWILL ON CONSOLIDATION (note 9) 53,253 62,612
D. DEFERRED CHARGES (note 10) 17,902 13,931
E. CURRENT ASSETS
II. Inventories (note 11) 486,440 382,439
III. Accounts receivable (note 12) 328,856 237,678
Customer receivables for sales and services 129,501 97,704
Other accounts receivable 201,451 141,482
Provisions (2,096) (1,508)
IV. Short-term financial investments (note 13) 180,342 294,343
Short-term investment securities 44,302 52,057
Other loans 136,040 242,286
VI. Cash 316,023 221,689
VII. Accrual accounts 9,285 9,838
Total current assets 1,320,946 1,145,987
TOTAL ASSETS 3,510,352 3,013,796
(*) Presented for comparison purposes only.
Translation of a report and financial statements originally issued in Spanish and prepared in accordance with generally
accepted accounting principles in Spain.In the event of a discrepancy, the Spanish-language version prevails.

ANNUAL REPORT 2003 INDITEX 33
SHAREHOLDER’S EQUITY AND LIABILIES 01-31-04 01-31-03*
A) SHAREHOLDER’S EQUITY (note 15)
I. Share Capital 93,500 93,500
II. Additional paid-in capital 20,379 20,379
III. Revaluation Reserve 1,692 1,692
IV. Other reserves of the Controlling Company 871,527 773,302
Unrestricted reserves 852,582 753,999
Restricted reserves 18,945 19,303
V. Reserves at fully or proportionally consolidated companies 799,755 556,571
VI. Reserves at companies carried by the equity method (540) (874)
VII. Translation differences from fully consolidated companies (note 2.d) (126,817) (121,407)
VIII. Income attributable to the Controlling Company 446,451 438,091
Consolidated for the year (profit) 448,631 442,476
Attributed to minority Interest (profit and losses) (2,180) (4,385)
Total shareholder’s equity 2,105,947 1,761,254
B) MINORITY INTERESTS (nota 16) 27,217 19,336
D) DEFERRED REVENUES (note 17) 29,663 8,535
E) PROVISIONS FOR CONTINGENCIES AND EXPENSES (note 18) 23,079 41,147
F) LONG-TERM DEBT
II. Payable to credit entities (note 19) 156,568 129,343
III. Other accounts payable (note 20) 75,167 41,443
Total long-term debt 231,735 170,786
G) CURRENT LIABILITIES
II. Payable to credit entities (note 19) 81,492 144,522
III. Payable to companies carried by the equity method (note 14) 2,026 2,243
IV. Trade accounts payable 652,422 506,173
V. Other non-trade payables (note 20) 356,771 359,403
VII. Accrual accounts 0 397
Total current liabilities 1,092,711 1,012,738
TOTAL SHAREHOLDER’S EQUITY AND LIABILITIES 3,510,352 3,013,796
(*) Presented for comparison purposes only.

34 INDITEX ANNUAL REPORT 2003
INDUSTRIA DE DISEÑO TEXTIL,S.A. AND SUBSIDIARIES
CONSOLIDATED STATEMENTS OF INCOME FOR THE YEARS ENDED JANUARY 31, 2004 AND 2003(THOUSANDS OF EUROS)
DEBIT 01-31-04 01-31-03*
A) EXPENSES
Purchases 2,395,973 1,954,956
Personnel expenses 678,179 569,896
a) Wages, salaries, etc. 532,001 448,647
b) Employee welfare expenses (note 22) 146,178 121,249
Period depreciation and amortization 221,170 185,407
Variation in provisions 15,891 13,663
Other operating expenses 756,926 609,878
I. OPERATING INCOME 636,392 669,068
Financial and similar expenses 15,232 16,234
Variation in financial investment provisions (84) 0
Exchange losses 56,355 70,735
II. FINANCIAL INCOME 0 0
Share in losses of companies carried by the equity method 0 440
Amortization of goodwill in consolidation (note 9) 9,359 9,524
III. INCOME FROM ORDINARY ACTIVITIES 619,130 629,519
Variation in intangible and tangible fixed assets provisions (251) 0
Losses on fixed assets (note 22) 19,720 22,100
Extraordinary expenses (note 22) 15,066 24,005
Prior year’s expenses and losses 4,378 4,379
V. CONSOLIDATED INCOME BEFORE TAXES 613,438 615,050
Corporate income tax (note 21) 157,188 165,014
Other taxes (note 21) 7,619 7,560
VI. CONSOLIDATED INCOME FOR THE YEAR 448,631 442,476
Income attributed to minority interests 2,180 4,385
VII. INCOME FOR THE YEAR ATTRIBUTED
TO THE CONTROLLING COMPANY 446,451 438,091
(*) Presented for comparison purposes only.
Translation of a report and financial statements originally issued in Spanish and prepared in accordance with generally
accepted accounting principles in Spain. In the event of a discrepancy, the Spanish-language version prevails.

ANNUAL REPORT 2003 INDITEX 35
CREDIT 01-31-04 01-31-03*
B) REVENUES
Net revenues (note 22) 4,598,908 3,973,973
Increase in finished product and work-in-process inventories 103,020 28,786
Other operating revenues 2,603 109
I.OPERATING LOSS 0 0
Revenues from shareholdings 48 35
Other financial revenues 11,196 10,011
Gains of short-terms financial investments 542 0
Exchange gains 51,739 47,029
II. FINANCIAL LOSS 7,978 29,894
Share in the income of companies carried by the equity method (note 8) 75 309
III. LOSS ON ORDINARY ACTIVITIES 0 0
Gains on fixed asset disposals (note 22) 5,392 1,437
Gains from disposals of holdings in companies carried by the equity method 371 0
Deferred revenues transferred to income for the year (note 17) 1,263 2
Extraordinary revenues and income (note 22) 22,157 8,322
Prior year’s revenues and income 4,038 26,254
IV. EXTRAORDINARY LOSS 5,692 14,469
(*) Presented for comparison purposes only.
36 INDITEX ANNUAL REPORT 2003
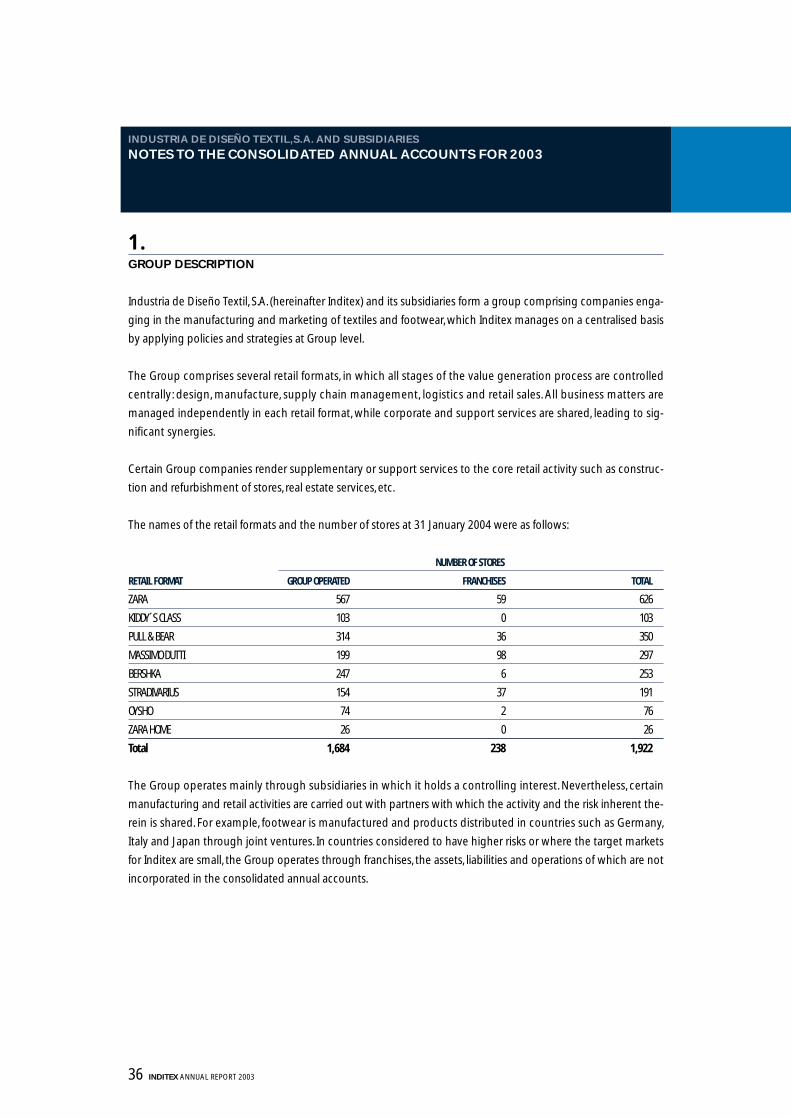
1.GROUP DESCRIPTION
Industria de Diseño Textil, S.A. (hereinafter Inditex) and its subsidiaries form a group comprising companies enga-
ging in the manufacturing and marketing of textiles and footwear, which Inditex manages on a centralised basis
by applying policies and strategies at Group level.
The Group comprises several retail formats, in which all stages of the value generation process are controlled
centrally: design, manufacture, supply chain management, logistics and retail sales. All business matters are
managed independently in each retail format, while corporate and support services are shared, leading to sig-
nificant synergies.
Certain Group companies render supplementary or support services to the core retail activity such as construc-
tion and refurbishment of stores, real estate services, etc.
The names of the retail formats and the number of stores at 31 January 2004 were as follows:
NUMBER OF STORES
RETAIL FORMAT GROUP OPERATED FRANCHISES TOTAL
ZARA 567 59 626
KIDDY´S CLASS 103 0 103
PULL & BEAR 314 36 350
MASSIMO DUTTI 199 98 297
BERSHKA 247 6 253
STRADIVARIUS 154 37 191
OYSHO 74 2 76
ZARA HOME 26 0 26
Total 1,684 238 1,922
The Group operates mainly through subsidiaries in which it holds a controlling interest. Nevertheless, certain
manufacturing and retail activities are carried out with partners with which the activity and the risk inherent the-
rein is shared. For example, footwear is manufactured and products distributed in countries such as Germany,
Italy and Japan through joint ventures. In countries considered to have higher risks or where the target markets
for Inditex are small, the Group operates through franchises, the assets, liabilities and operations of which are not
incorporated in the consolidated annual accounts.
INDUSTRIA DE DISEÑO TEXTIL,S.A. AND SUBSIDIARIES
NOTES TO THE CONSOLIDATED ANNUAL ACCOUNTS FOR 2003

ANNUAL REPORT 2003 INDITEX 37
Appendix I includes a detail of the consolidated subsidiaries, associated companies and multigroup companies
in which a direct or indirect interest is held by the Controlling Company.
At 31 January 2004 the Group retail formats have stores in 48 countries. Details are as follows:
NUMBER OF STORES
COUNTRY GROUP OPERATED FRANCHISES TOTAL
SPAIN 1,096 34 1,130
REST OF EUROPE 426 93 519
AMERICAS 153 19 172
REST OF WORLD 9 92 101
Total 1,684 238 1,922
2.BASIS OF PRESENTATION OF THE ANNUAL ACCOUNTS AND CONSOLIDATION PRINCIPLES
A) IDENTIFICATION
The year ended 31 January 2003 will henceforth be referred to as ‘2002’, the year ended 31 January 2004 will be
referred to as ‘2003’, and so on.
B) TRUE AND FAIR VIEW
The consolidated annual accounts at 31 January 2004 have been prepared on the basis of the accounting records
of Industria de Diseño Textil, S.A. and of the subsidiaries comprising the Inditex Group in the format established
by prevailing Spanish legislation to present fairly the shareholders’ equity, financial position and results of opera-
tions of the Group.
The consolidated annual accounts of the Inditex Group at 31 January 2003 were approved by the shareholders’
meeting within the legally stipulated period. The consolidated annual accounts for the year ended 31 January
2004 will be submitted for approval by the shareholders at their annual general meeting.The directors consider
that the consolidated annual accounts for the year ended 31 January 2004 will be approved without any changes.
The individual annual accounts of Inditex at 31 January 2004 have been prepared by the directors in a separate
document.
C) ACCOUNTING POLICIES
The consolidated annual accounts at 31 January 2004 have been prepared in accordance with the accounting
principles and criteria summarised in note 4. All mandatory accounting principles with an effect on Group’s net
worth, the financial position and results of operations have been applied in the preparation of these consolidated
annual accounts.

38 INDITEX ANNUAL REPORT 2003
D) CONSOLIDATION PRINCIPLES
The consolidated annual accounts for 2003 have been prepared in accordance with legislation governing conso-
lidation in Spain, deriving from European Union Directive 7. International Accounting Standards issued by the
International Accounting Standards Board have been applied to areas not governed by Spanish legislation.
The following basic principles have been applied in consolidation of the annual accounts:
1. Companies over which effective control is exercised have been fully consolidated. Multigroup companies,
which are managed jointly with third parties, have been consolidated by the proportional consolidation method.
Companies in which the Group has a significant influence but not ownership of a majority of the voting rights or
joint management with third parties are carried by the equity method.
2. All material accounts receivable and payable, transactions and profits between fully consolidated companies
have been eliminated.
Accounts receivable and payable, revenues, expenses and income of proportionally consolidated companies ari-
sing from transactions with other Group companies have been eliminated on consolidation in proportion to the
ownership interest held by Inditex.
3. The equity of minority interests in the net worth and results of the consolidated subsidiaries is recorded under
“Minority interests” and “Income attributed to minority interests” in the consolidated balance sheet and consoli-
dated statement of income, respectively.
4. In the case of subsidiaries whose accounting and valuation methods differ from those of the Controlling Com-
pany, where the effect is material, adjustments have been made so as to present the consolidated financial state-
ments on a uniform basis.
5. The financial statements of companies denominated in foreign currency have been translated to Euros using
current exchange rates which implies:
"The assets and liabilities of foreign consolidated companies are translated into Euros at the exchange rate pre-
vailing at year end. Equity is translated at the historic exchange rate and the average exchange rate for the year has
been used for income and expense.
Exchange gains or losses arising from application of the aforementioned methods are reflected in consolidated
equity under “Translation differences from fully consolidated companies” (note 15), less the portion attributable to
minority interests, which is shown under “Minority interests” in the consolidated balance sheet.

ANNUAL REPORT 2003 INDITEX 39
6. Exchange differences arising on operations between Group companies have been treated as follows:
"Exchange differences arising on monetary items with other consolidated companies which, in substance, form
part of the net investment made by the Group in foreign companies, and for which settlement is neither planned
nor likely to occur, are classified as net consolidated equity under “Translation differences from fully consolidated
companies”until the disposal of the investment in the subsidiary at which time they are recognised as income or
expense for that year. Exchange differences assigned to translation differences in 2003 amount to Euros 3,499
thousand and mainly reflect the effects of the devaluation of several Latin American currencies in which long
term Group investment has been made.
"On the other hand, exchange differences deriving from trade payables and receivables of consolidated com-
panies with other consolidated companies, or financing operations for which payment or collection is probable,
are taken to income or expenses during the year.
7. The balance sheets and statements of income of companies in Venezuela, Uruguay, Chile and Turkey have been
adjusted prior to translation into Euros for the effects of fluctuations in prices.The Euros 344 thousand effect of infla-
tion for the year on monetary assets and liabilities is included under “Exchange gains” in the consolidated statement
of income for the year.
8. In accordance with standard practice in Spain, these consolidated annual accounts do not reflect the tax effect
of including, where applicable, the reserves of subsidiary companies abroad in the accounting records of the
Controlling Company since it is considered that reserves not taxed at source will not be transferred and because
the consolidation process does not involve the distribution of reserves, since they will continue to be used as a
self-financing source by each of the consolidated companies.
9. The financial statements of companies closing their accounts at a different date from the consolidated annual
accounts have been consolidated at 31 December 2003 (Appendix I). Significant operations carried out between
the date such subsidiaries close their accounts and the date of the consolidated annual accounts are harmoni-
sed.Transactions between Group companies are eliminated on consolidation.
F) CHANGES IN THE CONSOLIDATED GROUP
The following companies have been incorporated and integrated into the consolidated Group in 2003:
ZARA HOME PORTUGAL, CONF. SOC. UNIP. LDA.
BERSHKA ITALIA, S.R.L.
TEMPE MEXICO, S.A. de C.V.
ZARA HOME UK, LTD.
MASSIMO DUTTI ITALIA, S.R.L.
ZARA HOME HELLAS, S.A.
NAVIERA GRAN SOL, A.I.E.
Furthermore, the company called Brettos BRT España, S.A. at 31 January 2003 has changed its name to Zara Home
España, S.A., Vehils, S.A. has been merged by Lefties España, S.A. and JSC Verpstas has been sold to third parties
outside of the Group.
These changes have not had a significant impact on the consolidated annual accounts for 2003.

40 INDITEX ANNUAL REPORT 2003
3.DISTRIBUTION OF THE INCOME OF THE CONTROLLING COMPANY
The board of directors will propose to the shareholders of the Controlling Company at their annual general mee-
ting that the net income for the year ended 31 January 2004 be distributed as follows:
Thousands of Euros
DIVIDENDS 218,165
Ordinary 87,266
Extraordinary 130,899
VOLUNTARY RESERVES 54,570
NET INCOME OF THE CONTROLLING COMPANY 272,735
4.SIGNIFICANT ACCOUNTING PRINCIPLES
The accompanying consolidated annual accounts of the Group at 31 January 2004 have been prepared in accor-
dance with accounting principles established in prevailing Spanish legislation, the most significant of which are
as follows:
A) START-UP EXPENSES
Start-up expenses are stated at cost net of amortisation generally calculated on a straight-line basis over a period
of five years.
B) INTANGIBLE ASSETS
Intangible assets include the following:
"Intellectual property, which is stated at cost of acquisition or rights to use including expenses incurred on the
registration of intellectual property developed by the Company. Intellectual property rights are amortised on a
straight-line basis over a maximum period of ten years.
"Computer software is stated at cost and amortised on a straight-line basis over a period of five years.
"Rights over leased assets: the financial lease contracts of all the consolidated companies are recorded as intangi-
ble assets at the cost of the related asset, and the total debt for lease payments plus the amount of the purchase
option are recorded as a liability.The difference between the two amounts, which represents the interest expenses
on the transaction, is recorded as a deferred expense and is taken to income each year by the interest method.
Rights recorded as intangible assets are amortized over the useful life of the related asset, as explained in section
c) below.The value of these rights and the related accumulated amortization are reclassified from these accounts
to tangible fixed assets when the purchase option is exercised.
"Leasehold assignment rights:These rights are recorded at the amounts paid to the owner or the former lessor
for use of leased premises.These rights are generally amortized over the term of lease contracts.

ANNUAL REPORT 2003 INDITEX 41
C) TANGIBLE FIXED ASSETS
Tangible fixed assets are carried at cost, which includes the additional expenses incurred to bring the assets into
operating condition. In exceptional circumstances, provided prevailing accounting legislation is complied with,
financial expenses incurred prior to the entry into service of assets are capitalized.
The costs of expansion, modernization or improvements which increase productivity, capacity or efficiency of
assets or extend their useful life are capitalized.
Repair and maintenance costs are expensed when incurred.
Depreciation is calculated on a straight-line basis over the estimated useful lives of the assets, as follows:
YEARS
Buildings 18 to 50
Machinery and technical installations 3 to 13
Furniture 7 to 10
Computer hardware 4 to 8
Other tangible fixed assets 3 to 15
Investments in leased premises are depreciated over a period not exceeding the term of the corresponding lease
contract.
Provision is made for possible future losses which may be incurred on refurbishment work carried out prior to
the expiry of the useful lives of certain tangible assets located at the commercial premises where the Group ope-
rates.These provisions are charged to operating expenses as “Variation in provisions”.
D) MARKETABLE SECURITIES AND OTHER SIMILAR FINANCIAL INVESTMENTS
Marketable securities representing the capital of companies which are not fully or proportionally consolidated
(Appendix I), but in which an interest exceeding 20% is held, are carried by the equity method, at the underlying
book value of the interest per the most recent balance sheet available of the investee.
Marketable securities representing interests of less than 20% are stated at the lower of cost or underlying book
value per the most recent balance sheet available of the investee company. Provision is made where cost exce-
eds the underlying book value.
The underlying book value is adjusted by the amount of latent unrecorded goodwill at the date of acquisition
which remains at the date of the subsequent valuation.
Short- and long-term non-trade loans are recorded at the amount disbursed.The difference between this amount
and the loan principal is recorded as “Deferred interest revenues”with a balancing entry under the related fixed or
current asset caption. Interest revenues are calculated by the interest method in the year in which they accrue.

42 INDITEX ANNUAL REPORT 2003
E) CONTROLLING COMPANY SHARES
This caption comprises own shares acquired by the Controlling Company (Inditex) and are stated at the lower of
cost, represented by the total amount paid for the acquisition, or market. In accordance with prevailing legisla-
tion, market is taken to be the lowest of average market price in the last quarter, market price at year end or the
corresponding underlying net book value.
F) GOODWILL ON CONSOLIDATION
This caption in the accompanying consolidated balance sheet reflects the unamortized consolidation differences
arising from the acquisition of consolidated subsidiary companies or companies carried by the equity method,
which are expected to be recovered through the income reported by these investees in the future.
These differences are generally amortised on a straight-line basis over the ten-year period estimated by manage-
ment of the Group to contribute to providing revenues (note 9).
G) DEFERRED CHARGES
This caption includes the following items:
"Differences between the face value of debts and the amount received, which are charged to income by the
interest method.
"Expenses incurred on the acquisition of fixed assets, which are stated at the amount incurred and are expen-
sed on a straight-line basis over a period of ten years.
H) INVENTORIES
Inventories are stated at cost of acquisition or production, which includes the cost of materials consumed, labour
costs and manufacturing overheads. Provision is made for inventories where cost of acquisition or production
exceeds market value and the decline in value is considered to be reversible. Market value is determined as follows:
"Commercial inventories, raw materials and supplies are stated at the lower of replacement cost or the net reali-
sable value.
"Finished products are stated at realisable value, net of the related marketing expenses.
"Work in process and semi-finished products are stated at the realisable value of finished products, net of the
total manufacturing costs not yet incurred and marketing expenses.
The method used to calculate the acquisition price is determined by the type of asset, and, basically, the “first in
– first out” (FIFO) method is used for fabrics and other textile supplies.
Obsolete, faulty or slow-moving inventories are restated at their possible realisable value.

ANNUAL REPORT 2003 INDITEX 43
I) CURRENT/LONG-TERM
Assets and liabilities are classified as current if maturing within twelve months and long-term if maturing more
than twelve months from the balance sheet date.
J) ACCOUNTS RECEIVABLE
The Group makes provision for doubtful accounts in respect of overdue balances and when circumstances indi-
cate doubtful collection.
K) PROVISIONS FOR CONTINGENCIES AND EXPENSES
The Inditex Group records provisions for the estimated amount required for probable or certain third-party liabi-
lity arising from litigation in progress or from outstanding indemnity payments or obligations of undetermined
amount, for collateral and other similar guarantees provided by the Group, and for other contingencies of any
other kind that might arise as a result of the Group’s activities. These provisions are recorded when the contin-
gency or obligation giving rise to the indemnity or payment arises (see note 18).
Certain Group companies are required to pay retirement bonuses under the applicable collective agreements.The
Group has provided for the actuarial estimation of the portion of retirement bonuses accrued at 31 January 2004.
L) DEBTS
Debts are recorded at face value and the difference between the face value and the amount received is recorded
as deferred charges and is expensed on an accruals basis by the interest method.
M) CAPITAL SUBSIDIES AND OTHER DEFERRED REVENUES
Deferred revenues are stated at the amount received and are taken to income on a straight line basis over the
estimated useful lives of the assets for which the subsidies have been received.
N) FOREIGN CURRENCY TRANSACTIONS
Foreign currency transactions are translated to Euros at the rates of exchange at the transaction date and are
adjusted at year end to the exchange rate prevailing at that date, except for operations covered by hedging con-
tracts, which are stated at the exchange rate negotiated.
Foreign exchange differences are recorded using the following criteria:
1. Exchange differences on foreign currency held by the companies are taken to income or expenses, as appropriate.
2. Exchange differences arising on the adjustment of foreign currency balances to year-end exchange rates are
classified by due date and currency. Losses are charged to expenses while gains are deferred.

44 INDITEX ANNUAL REPORT 2003
Ñ) RECOGNITION OF REVENUES AND EXPENSES
Revenue and expenses are recognised on an accruals basis.
Nevertheless, applying prudent criteria, the Group only records realised income at year end, while foreseeable
contingencies and estimated losses are recognised as soon as they become known.
O) CORPORATE INCOME TAX
Corporate income tax expense each year is calculated on the basis of the consolidated accounting income befo-
re taxes of each Inditex Group company, increased or decreased, as appropriate, by the permanent differences.
Tax relief and tax credits taken in the year are treated as a reduction of the corporate income tax expenses for
that year.
P) HEDGES
The Group arranges financial transactions (basically currency exchange rate hedges, options and forward con-
tracts) to hedge a portion of its foreign currency imports and exports. Since these hedging transactions are not
of a speculative nature, the gains or losses thereon are recorded on settlement of the transactions.
Q) COMPENSATION FOR TERMINATION OF EMPLOYMENT
Except in the case of justifiable cause, companies are liable to pay indemnities to employees whose services are
discontinued. No provision has been made in this regard, as the directors of the Group companies do not foresee
any significant dismissals in the future.
R) ENVIRONMENTAL ASSETS AND LIABILITIES
Installations and systems related to environmental management are not significant compared to the consolida-
ted assets of the Group and are recorded using the criteria applied to fixed assets of a similar nature. The Direc-
tors consider that no environment-related contingent liabilities exist.
The Group also publishes an annual Sustainability Report at the same time as the consolidated annual accounts,
providing details of its environmental policy and initiatives.

ANNUAL REPORT 2003 INDITEX 45
5.START-UP EXPENSES
The variations in 2003 in the accounts comprising this caption of the accompanying consolidated balance sheet
were as follows:
ITEM BALANCE AT 02.01.03 ADDITIONS TRANSFERS AMORTISATION OTHER BALANCE AT 01.31.04
Incorporation expenses 47 24 0 (32) 1 40
Pre-opening expenses 314 82 (7) (113) 1 277
Capital increase expenses 199 120 0 (108) 0 211
Total 560 226 (7) (253) 2 528
6.INTANGIBLE ASSETS
The variations in 2003 in the accounts comprising this caption of the accompanying consolidated balance sheet
were as follows:
INTANGIBLE ASSETS BALANCE AT 02.01.03 ADDITIONS REDUCTIONS TRANSFERS OTHER BALANCE AT 01.31.04
Intellectual property 14,930 1,270 (142) 0 (51) 16,007
Goodwill 1,879 0 0 0 0 1,879
Leasehold assignment rights 354,785 71,142 (1,675) 2,858 (5,428) 421,682
Computer software 4,197 627 (8) 23 27 4,866
Rights over leased assets 116,519 16,694 0 (34,871) 0 98,342
Advances and other intangible assets 2,675 4,003 (81) (2,136) 0 4,461
Provisions (655) 0 251 0 0 (404)
Total 494,330 93,736 (1,655) (34,126) (5,452) 546,833
ACCUMULATED AMORTISATION BALANCE AT 02.01.03 ADDITIONS REDUCTIONS TRANSFERS OTHER BALANCE AT 01.31.04
Intellectual property 8,563 1,222 0 0 (6) 9,779
Goodwill 752 376 0 0 0 1,128
Leasehold assignment rights 78,047 25,958 (412) 248 (1,832) 102,009
Computer software 2,172 741 (8) 0 0 2,905
Rights over leased assets 26,387 2,549 0 (11,332) (11) 17,593
Other intangible assets 296 206 (27) 0 0 475
Total 116,217 31,052 (447) (11,084) (1,849) 133,889
Additions mainly reflect investments during the year.
“Transfers” principally relate to leasing contracts that have expired during the year and have been transferred to
tangible fixed assets.The column entitled “Other” mainly reflects the effect of adjustments in countries with high
inflation rates (note 2, d-7), and the effect of translation differences in foreign subsidiaries.

46 INDITEX ANNUAL REPORT 2003
At 31 January 2004 details of lease contracts entered into by Inditex Group companies, mainly relating to com-
mercial premises, are as follows:
LEASED ASSETS AMOUNT
Total cost of the assets 98,342
Prior years’ lease payments 56,847
2003 lease payments 11,140
Outstanding lease payments 41,351
Purchase option 5,663
7.TANGIBLE FIXED ASSETS
Details and movement in tangible fixed assets in 2003 are as follows:
TANGIBLE FIXED ASSETS BALANCE AT 02.01.03 ADDITIONS REDUCTIONS TRANSFERS OTHER BALANCE AT 01.31.04
Land and buildings 477,100 36,829 (10,897) 55,220 (890) 557,362
Machinery and installations 1,185,099 332,760 (51,136) 64,965 (5,497) 1,526,191
Furniture 115,955 43,418 (8,078) 707 844 152,846
Computer hardware 33,913 7,646 (847) 276 (227) 40,761
Other tangible fixed assets 46,851 1,149 (761) (41) (77) 47,121
Advances and construction in progress 87,542 64,039 (7,109) (90,103) (324) 54,045
Provisions (23,955) (15,202) 8,549 253 195 (30,160)
Total 1,922,505 470,639 (70,279) 31,277 (5,976) 2,348,166
ACCUMULATED DEPRECIATION BALANCE AT 02.01.03 ADDITIONS REDUCTIONS TRANSFERS OTHER BALANCE AT 01.31.04
Buildings 78,305 18,145 (1,763) 3,656 678 99,021
Machinery and installations 439,451 139,329 (31,567) 7,696 408 555,317
Furniture 42,414 18,061 (3,180) (1,158) 875 57,012
Computer hardware 21,471 6,035 (245) (29) (196) 27,036
Other tangible fixed assets 7,721 3,679 (777) (42) (67) 10,514
Total 589,362 185,249 (37,532) 10,123 1,698 748,900
Additions comprise investments during the year, mainly in new stores and logistics centres, as well as refur-
bishments carried out in the premises where the Group operates.
Transfers reflect the cost of lease contracts which have expired during the year transferred to advances and cons-
truction in progress. Other tangible fixed assets reflects the effect of adjustment in countries with high inflation
rates (note 2, d-7), and the effect of translation differences in foreign subsidiaries.

ANNUAL REPORT 2003 INDITEX 47
Reductions mainly relate to disposals of technical installations, deriving from the refurbishment of commercial
premises where the Group operates, and the sale of assets.
The net book value of tangible fixed assets located outside Spain at year end amounts to approximately Euros
679 million and mainly comprises commercial premises, furniture and installations of opened stores.
At 31 January 2004 the gross cost of the Group’s fully depreciated assets is as follows:
ITEM AMOUNT
Buildings 380
Machinery and installations 75,962
Furniture 6,216
Computer hardware 9,289
Other tangible fixed assets 6,147
Total 97,994
At 31 January 2004 the Group has investment commitments totalling approximately Euros 600 million.
The Group contracts insurance policies to cover possible risks to which its tangible fixed assets are subject.
8.LONG-TERM FINANCIAL INVESTMENTS
Detail of “Holdings in companies carried by the equity method”and movement in 2003 are as follows:
HOLDINGS IN COMPANIES CARRIED BALANCE ADDITIONS REDUCTIONS PROFIT/(LOSS) BALANCE BY THE EQUITY METHOD AT 02.01.03 FOR THE YEAR AT 01.31.04
Fibracolor, S.A.and subsidiaries 7,537 0 0 75 7,612
JSC Verpstas 288 0 (288) 0 0
Other (note 21) 10,450 21,463 0 (16,337) 15,576
Total 18,275 21,463 (288) (16,262) 23,188
Other includes the investment in the Economic Interest Groupings.The profit or losses of these EIGs, are recorded
under “Corporate income tax” in the accompanying consolidated statement of income (note 21).
Fibracolor, S.A. is based in Tordera (Barcelona) and its activity consists of transforming all types of fabric through
dying, finishing, printing and other processes. Inditex holds a 39.97% interest in this company.
In accordance with the agreements entered into with the shareholders of Fibracolor, in the future Inditex could be
required to acquire shares to obtain the majority of the voting rights in this company.Were Inditex required to pur-
chase these shares, incorporation of the figures of Fibracolor would not have a significant effect on the Group. At 31
December 2003 the shareholders’equity of Fibracolor, S.A. totalled Euros 24.9 million, the profit after tax for 2003 was
Euros 0.19 million and its total assets amounted to Euros 66 million.

48 INDITEX ANNUAL REPORT 2003
Movement in long-term investment securities is as follows:
DESCRIPTION BALANCE AT 02.01.03 ADDITIONS REDUCTIONS BALANCE AT 01.31.04
Long-term investment securities 5,890 180 (79) 5,991
Provisions (102) (6) 90 (18)
Total 5,788 174 11 5,973
The Group’s long-term investment securities portfolio includes a Euros 4.96 million interest in Banco Gallego, S.A.
The remaining balance comprises interests in other companies.
Details of other loans and movement during the year are as follows:
DESCRIPTION BALANCE AT 02.01.03 ADDITIONS REDUCTIONS TRANSFERS OTHER BALANCE AT 01.31.04
Public entities 21,887 2,780 0 (6,929) 0 17,738
Loans to multigroup companies 0 3,250 0 0 0 3,250
Long-term guarantees and deposits 29,932 18,133 (714) 782 (430) 47,703
Other loans 3,121 6,010 (59) (1,500) 0 7,572
Total 54,940 30,173 (773) (7,647) (430) 76,263
9.GOODWILL ON CONSOLIDATION
Details and movement in 2003 are as follows:
SUBSIDIARY BALANCE AT 02.01.03 AMORTISATION FOR THE YEAR BALANCE AT 01.31.04
Stradivarius España, S.A. 62,612 (9,359) 53,253
10.DEFERRED CHARGES
Details of deferred charges and movement during the year are as follows:
DESCRIPTION BALANCE ADDITIONS TRANSFERS REDUCTIONS WRITE DOWNS BALANCE AT 02.01.03 AND OTHER AT 01.31.04
Deferred interest 4,141 1,956 (301) (573) (1,368) 3,855
Fixed asset acquisitions and other expenses 9,790 7,804 271 (226) (3,592) 14,047
Total 13,931 9,760 (30) (799) (4,960) 17,902
Deferred interest includes deferred interest on leasing contracts.
Reductions reflect the effect of interest rates revisions carried out by several leasing companies on deferred
expenses and the effect of translation differences in foreign subsidiaries on fixed asset acquisition expenses.

ANNUAL REPORT 2003 INDITEX 49
Write downs of deferred interest are recorded as financial expenses in the accompanying consolidated state-
ment of income. Write downs of expenses incurred on the acquisition of fixed assets are recorded as amortisa-
tion and depreciation.
11.INVENTORIES
At 31 January 2004 details are as follows:
ITEM BALANCE AT 01.31.04
Goods for resale 7,214
Raw materials 41,002
Other supplies 4,114
Work in progress 21,323
Finished products 412,661
Real-estate developments 593
Provisions (467)
Total 486,440
Inditex Group policy is to contract insurance coverage of potential risks to which inventories are subject.
12.ACCOUNTS RECEIVABLE
Customer receivables for sales and services mainly reflect balances receivable on the corresponding part of sales
made to franchises and multigroup companies, sales to workshops and deferred customer collections.
Details of “Other accounts receivable”are as follows:
ITEM BALANCE AT 01.31.04
Public entities (note 21) 195,706
Advances to personnel 613
Other 5,132
Total 201,451

50 INDITEX ANNUAL REPORT 2003
13.SHORT-TERM FINANCIAL INVESTMENTS
At 31 January 2004 details of other loans are as follows:
OTHER SHORT-TERM LOANS BALANCE AT 01.31.04
Time deposits 131,357
Short-term guarantees and deposits 2,768
Short-term loans to personnel 838
Other 1,077
Total 136,040
“Short-term investment securities” in the accompanying consolidated balance sheet reflect the placement of cash
surpluses in mutual funds, short-term deposits and other instruments, which generate interest at market rates.
14.BALANCES WITH MULTIGROUP AND ASSOCIATED COMPANIES
Details of accounts payable to and receivable from associated and multigroup companies are as follows:
COMPANY RECEIVABLE PAYABLE
Associated companies 0 2,026
Multigroup companies 11,929 15,348
Total 11,929 17,374
Accounts receivable from multigroup companies are recorded under “Customer receivables for sales and services”and
“Other accounts receivable – investments”. Accounts payable to multigroup companies are recorded under “Trade
accounts payable”and “Other non-trade payables”whereas accounts payable to associated companies are recorded
under “Payable to companies carried by the equity method”.
ANNUAL REPORT 2003 INDITEX 51
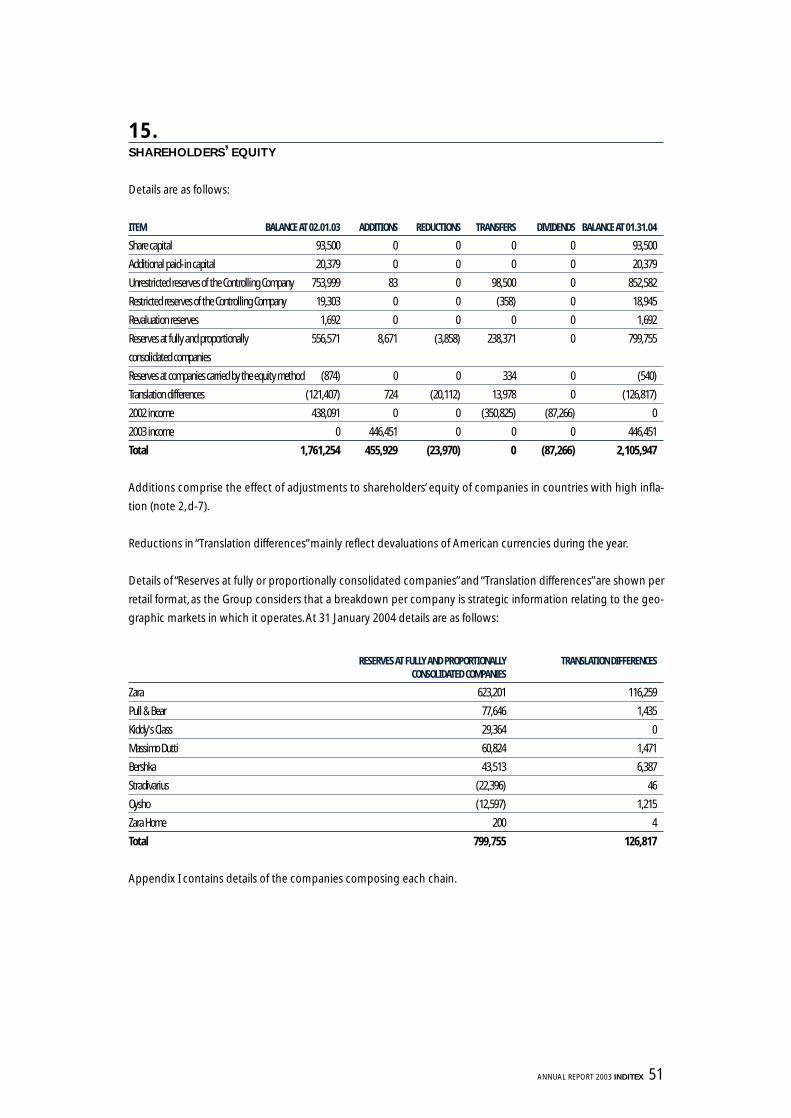
15.SHAREHOLDERS’ EQUITY
Details are as follows:
ITEM BALANCE AT 02.01.03 ADDITIONS REDUCTIONS TRANSFERS DIVIDENDS BALANCE AT 01.31.04
Share capital 93,500 0 0 0 0 93,500
Additional paid-in capital 20,379 0 0 0 0 20,379
Unrestricted reserves of the Controlling Company 753,999 83 0 98,500 0 852,582
Restricted reserves of the Controlling Company 19,303 0 0 (358) 0 18,945
Revaluation reserves 1,692 0 0 0 0 1,692
Reserves at fully and proportionally 556,571 8,671 (3,858) 238,371 0 799,755
consolidated companies
Reserves at companies carried by the equity method (874) 0 0 334 0 (540)
Translation differences (121,407) 724 (20,112) 13,978 0 (126,817)
2002 income 438,091 0 0 (350,825) (87,266) 0
2003 income 0 446,451 0 0 0 446,451
Total 1,761,254 455,929 (23,970) 0 (87,266) 2,105,947
Additions comprise the effect of adjustments to shareholders’ equity of companies in countries with high infla-
tion (note 2, d-7).
Reductions in “Translation differences”mainly reflect devaluations of American currencies during the year.
Details of “Reserves at fully or proportionally consolidated companies”and “Translation differences”are shown per
retail format, as the Group considers that a breakdown per company is strategic information relating to the geo-
graphic markets in which it operates. At 31 January 2004 details are as follows:
RESERVES AT FULLY AND PROPORTIONALLY TRANSLATION DIFFERENCESCONSOLIDATED COMPANIES
Zara 623,201 116,259
Pull & Bear 77,646 1,435
Kiddy's Class 29,364 0
Massimo Dutti 60,824 1,471
Bershka 43,513 6,387
Stradivarius (22,396) 46
Oysho (12,597) 1,215
Zara Home 200 4
Total 799,755 126,817
Appendix I contains details of the companies composing each chain.

52 INDITEX ANNUAL REPORT 2003
SHARE CAPITAL
At 31 January 2004 the Controlling Company’s share capital amounted to Euros 93,499,560 represented by
623,330,400 fully subscribed and paid shares of Euros 0.15 par value each. All these shares are of the same class
and series, carry identical voting and dividend rights, and are represented by book entries.
Inditex shares are listed on the four Spanish stock exchanges and, consequently, the Company is unaware of its
exact shareholder structure. On the basis of public information registered with the National Securities Market
Commission, at 31 January 2004 the members of the board of directors or related parties held approximately
67% of the share capital of the Controlling Company (note 24).
TREASURY STOCK
At 31 January 2004 Inditex held 41,000 treasury stock shares, representing 0.0066% of share capital. The average
acquisition price for these shares was Euros 2.18 per share.
In 2003 the Controlling Company sold a director 164,200 treasury stock shares as part of an stock option plan
set up in 1998. No further operations have been carried out by Group companies with shares of the Controlling
Company in 2003.
STOCK OPTION PLAN
On 20 July 2000, 19 January 2001 and 20 April 2001, the Shareholders’ Meeting of Inditex resolved to implement a
new Stock Option Plan under which option rights could be granted on a maximum of 3,018,400 common shares
of Inditex of Euros 0.15 par value each. This Plan related to the members of Inditex’s Board of Directors and to
senior executives and other key employees of its corporate Group. Each option, when exercised, would give enti-
tlement to one Inditex share.
The number of options to be granted depended on the appreciation of Inditex’s shares in the Spanish Stock
Exchange in 2001 and the two following calendar years.
Unless certain minimum appreciation levels are reached in any one of the above-mentioned years, no rights will
vest for any of the Plan’s beneficiaries in that year.The option exercise price is Euros 2.93, and the periods for exer-
cise will commence two years after each of the periods for calculating the above-mentioned appreciation.
The Shareholders’ Meeting delegated to the Board of Directors the power to determine how the directors, execu-
tives and other key employees will be chosen as beneficiaries of the Plan, and the number of options to be gran-
ted to each. In 2001 option contracts were entered into with a group of directors and executives under which up
to 1,382,913 stock options could be awarded.
To cover the stock option plan, Banco Bilbao Vizcaya Argentaria, S.A. subscribed 3,018,400 of the shares in the
capital increase carried out in January 2001, and signed a purchase option contract whereby Inditex could acqui-
re the shares to be sold to the beneficiaries who exercise their options, should these options vest. Furthermore,
ANNUAL REPORT 2003 INDITEX 53
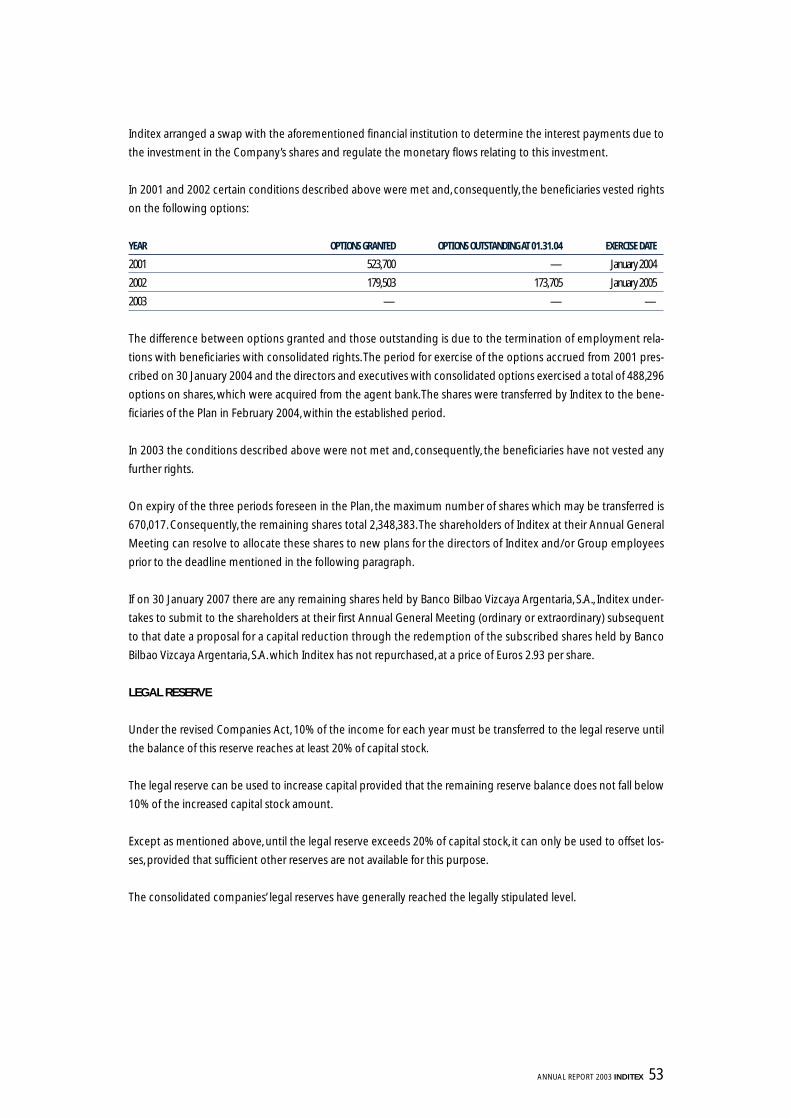
Inditex arranged a swap with the aforementioned financial institution to determine the interest payments due to
the investment in the Company’s shares and regulate the monetary flows relating to this investment.
In 2001 and 2002 certain conditions described above were met and, consequently, the beneficiaries vested rights
on the following options:
YEAR OPTIONS GRANTED OPTIONS OUTSTANDING AT 01.31.04 EXERCISE DATE
2001 523,700 — January 2004
2002 179,503 173,705 January 2005
2003 — — —
The difference between options granted and those outstanding is due to the termination of employment rela-
tions with beneficiaries with consolidated rights. The period for exercise of the options accrued from 2001 pres-
cribed on 30 January 2004 and the directors and executives with consolidated options exercised a total of 488,296
options on shares, which were acquired from the agent bank.The shares were transferred by Inditex to the bene-
ficiaries of the Plan in February 2004, within the established period.
In 2003 the conditions described above were not met and, consequently, the beneficiaries have not vested any
further rights.
On expiry of the three periods foreseen in the Plan, the maximum number of shares which may be transferred is
670,017. Consequently, the remaining shares total 2,348,383. The shareholders of Inditex at their Annual General
Meeting can resolve to allocate these shares to new plans for the directors of Inditex and/or Group employees
prior to the deadline mentioned in the following paragraph.
If on 30 January 2007 there are any remaining shares held by Banco Bilbao Vizcaya Argentaria, S.A., Inditex under-
takes to submit to the shareholders at their first Annual General Meeting (ordinary or extraordinary) subsequent
to that date a proposal for a capital reduction through the redemption of the subscribed shares held by Banco
Bilbao Vizcaya Argentaria, S.A. which Inditex has not repurchased, at a price of Euros 2.93 per share.
LEGAL RESERVE
Under the revised Companies Act, 10% of the income for each year must be transferred to the legal reserve until
the balance of this reserve reaches at least 20% of capital stock.
The legal reserve can be used to increase capital provided that the remaining reserve balance does not fall below
10% of the increased capital stock amount.
Except as mentioned above, until the legal reserve exceeds 20% of capital stock, it can only be used to offset los-
ses, provided that sufficient other reserves are not available for this purpose.
The consolidated companies’ legal reserves have generally reached the legally stipulated level.
54 INDITEX ANNUAL REPORT 2003
REVALUATION RESERVES ROYAL DECREE-LAW 7/1996 JUNE, 7
From the date on which the tax authorities have reviewed and approved the balance of the “Revaluation Reser-
ve” Royal Decree-Law 7/1996 June, 7 account (or the three-year period for review has expired), the aforementio-
ned balance can be used, free of tax, to offset recorded losses (both prior years’ accumulated losses and current
year losses or losses which might arise in the future), and to increase capital stock. From February 1, 2007 (ten
years from the date of the balance sheet which reflected the revaluation transactions), the balance of this account
can be taken to unrestricted reserves, provided that the monetary surplus has been realized. The surplus will be
deemed to have been realized when deprecation has been taken for accounting purposes or when the revalued
assets have been transferred or written-off the accounting records.
If leased assets are revalued, the corresponding revaluation reserve cannot be used until the purchase option has
been exercised.
If this balance were used for purposes other than those foreseen in royal Decree-Law 7/1996, it would be
subject to tax.
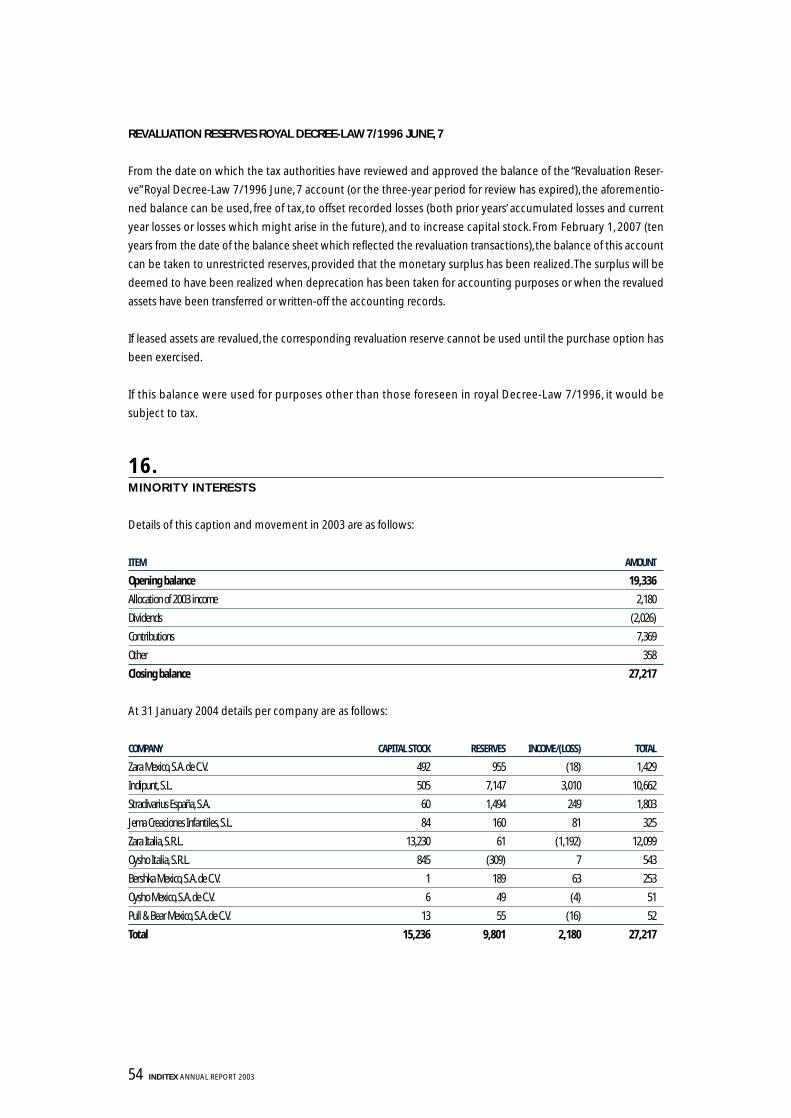
16.MINORITY INTERESTS
Details of this caption and movement in 2003 are as follows:
ITEM AMOUNT
Opening balance 19,336
Allocation of 2003 income 2,180
Dividends (2,026)
Contributions 7,369
Other 358
Closing balance 27,217
At 31 January 2004 details per company are as follows:
COMPANY CAPITAL STOCK RESERVES INCOME/(LOSS) TOTAL
Zara Mexico, S.A.de C.V. 492 955 (18) 1,429
Indipunt, S.L. 505 7,147 3,010 10,662
Stradivarius España, S.A. 60 1,494 249 1,803
Jema Creaciones Infantiles, S.L. 84 160 81 325
Zara Italia, S.R.L. 13,230 61 (1,192) 12,099
Oysho Italia, S.R.L. 845 (309) 7 543
Bershka Mexico, S.A.de C.V. 1 189 63 253
Oysho Mexico, S.A.de C.V. 6 49 (4) 51
Pull & Bear Mexico, S.A.de C.V. 13 55 (16) 52
Total 15,236 9,801 2,180 27,217

ANNUAL REPORT 2003 INDITEX 55
Inditex has a purchase option on 9.95% of the share capital of Stradivarius España, S.A. owned by a minority sha-
reholder which, in turn, has an option to sell this interest to Inditex.The period for exercising these options, which
were granted when Inditex acquired a controlling interest, is from 2005 to 2010. The options were granted
without any premium and can be exercised for Euros 11,960,000, plus 9.95% of the undistributed income of Stra-
divarius España, S.A. from the date of acquisition of the holding by Inditex until the date either of the options is
exercised. The Group acquired its holding in Stradivarius España, S.A. in 1999 for Euros 108,242 thousand, which
will be paid between 1999 and 2005 (note 20).
Inditex also has a purchase option on 50% of the share capital of Zara Deutschland, GmbH; Oysho Deutschland,
GmbH and Massimo Dutti Deutschland, GmbH owned by Otto, GmbH which, in turn, has an option to sell its hol-
dings in the aforementioned companies to Inditex. The period for exercising these options commenced in Sep-
tember 2001 and extends over the term of the agreement between the shareholders.The options were granted
without any premiums and the exercise price will depend on the equity of the investee and the number of stores
operated by this company at the date on which either option is exercised.
Inditex has a purchase option on 50% of the share capital of Zara Japan Corporation owned by Bigi Group. The
period for exercising this option is the term of the agreement between the shareholders.The option was granted
without any premium and the exercise price will depend on the equity of the investee and the number of stores
operated by this company at the date on which either option is exercised.
In December 2003 Inditex began negotiations to purchase a 35% interest in Zara Japan Corporation from the
other shareholder and thereby acquire a majority shareholding. As a result, a new contract of association is also
being negotiated to govern the relationship between Inditex and the minority shareholder. At the date of these
annual accounts these negotiations have not yet concluded, although a final agreement is expected to be rea-
ched in the first half of 2004. This acquisition will not significantly affect the consolidated balance sheet or the
results of the Group.
Inditex has a purchase option on 5% of the share capital of Zara Mexico, S.A. de C.V., 3% of Bershka Mexico, S.A. de
C.V., 1.5% of Oysho Mexico, S.A. de C.V. and 1.5% of Pull & Bear Mexico, S.A. de C.V., owned by the minority share-
holder.The periods for exercising these options are the terms of the agreements between the shareholders.The
options were granted without any premium and the exercise price will depend on the equity of the investees.
Furthermore, Inditex has a purchase option on 49% of the share capital of Zara Italia, S.R.L. and Oysho Italia, S.R.L.
owned by the Percassi Group, which in turn has an option to sell its interest to Inditex. The period for exercising
this option is the term of the agreement between the shareholders. The option was granted without any pre-
mium and the exercise price will depend on the equity of the investee and on the number of stores operated by
this company at the date on which either option is exercised.
Subsequent to the year end Inditex began negotiations to increase its majority shareholding in Zara Italia, S.R.L.
by acquiring a 30% interest in that company from a minority shareholder. As a result, a new contract of associa-
tion is also being negotiated to govern the relationship between Inditex and the minority shareholder. At the
date of these annual accounts these negotiations have not yet concluded, although a final agreement is expec-
ted to be reached in the first half of 2004. This acquisition will not significantly affect the consolidated balance
sheet or the results of the Group.
56 INDITEX ANNUAL REPORT 2003
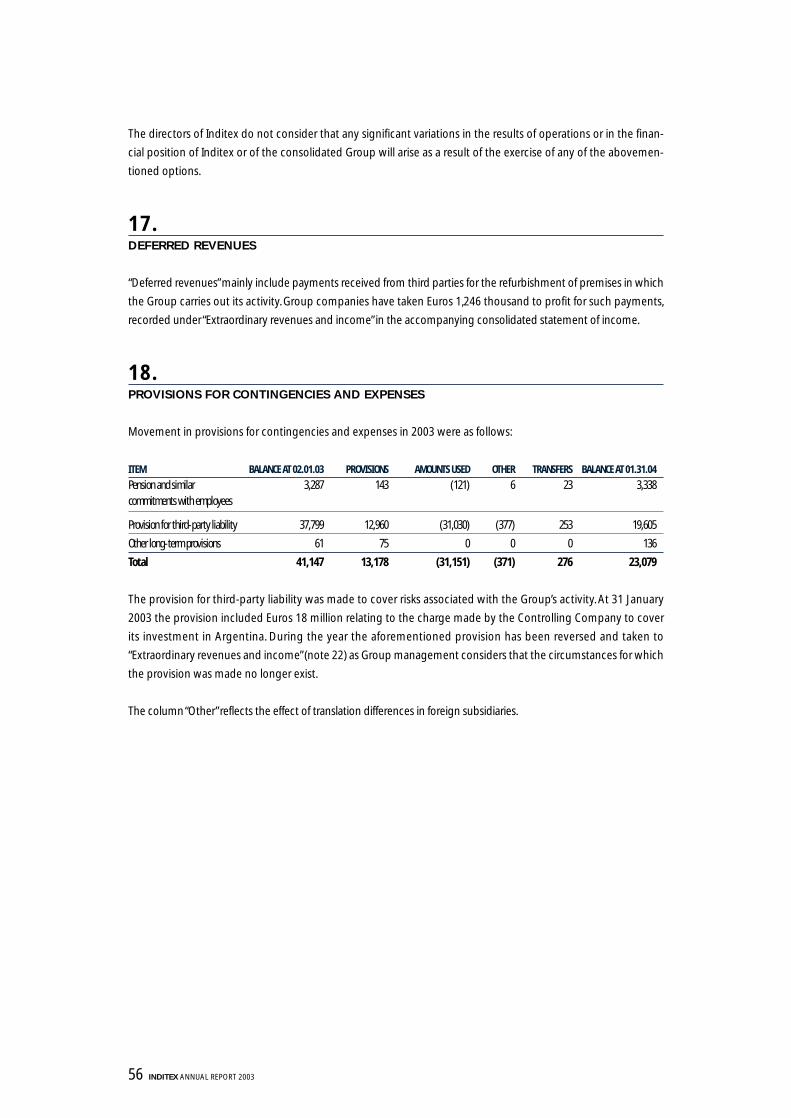
The directors of Inditex do not consider that any significant variations in the results of operations or in the finan-
cial position of Inditex or of the consolidated Group will arise as a result of the exercise of any of the abovemen-
tioned options.
17.DEFERRED REVENUES
“Deferred revenues”mainly include payments received from third parties for the refurbishment of premises in which
the Group carries out its activity. Group companies have taken Euros 1,246 thousand to profit for such payments,
recorded under “Extraordinary revenues and income”in the accompanying consolidated statement of income.
18.PROVISIONS FOR CONTINGENCIES AND EXPENSES
Movement in provisions for contingencies and expenses in 2003 were as follows:
ITEM BALANCE AT 02.01.03 PROVISIONS AMOUNTS USED OTHER TRANSFERS BALANCE AT 01.31.04
Pension and similar 3,287 143 (121) 6 23 3,338commitments with employees
Provision for third-party liability 37,799 12,960 (31,030) (377) 253 19,605
Other long-term provisions 61 75 0 0 0 136
Total 41,147 13,178 (31,151) (371) 276 23,079
The provision for third-party liability was made to cover risks associated with the Group’s activity. At 31 January
2003 the provision included Euros 18 million relating to the charge made by the Controlling Company to cover
its investment in Argentina. During the year the aforementioned provision has been reversed and taken to
“Extraordinary revenues and income”(note 22) as Group management considers that the circumstances for which
the provision was made no longer exist.
The column “Other”reflects the effect of translation differences in foreign subsidiaries.

ANNUAL REPORT 2003 INDITEX 57
19.PAYABLE TO CREDIT ENTITIES
Details of the Inditex Group’s debts to credit entities as of January 31, 2004, are as follows:
TYPE OF DEBT LIMIT BALANCE AT 01.31.04
Loans 139,222
Credit facilities 424,199 50,258
Lease transactions 47,014
Other financial debts 1,566
Total 424,199 238,060
All accounts payable to credit entities bear interest at the corresponding financial market rates.
At 31 January 2004 maturities of accounts payable by the Inditex Group to credit entities are as follows:
MATURITY AMOUNT
To 31 January 2004 81,492
To 31 January 2005 47,827
To 31 January 2006 17,763
To 31 January 2007 11,305
Subsequent years 79,673
Total 238,060
20.OTHER NON-TRADE PAYABLES
At 31 January 2004 details of “Long-term debt – other accounts payable”and “Current liabilities – other non-trade
payables”are as follows:
LONG-TERM DEBT – OTHER ACCOUNTS PAYABLE BALANCE AT 01.31.04
Guarantees received 221
Payable to fixed assets and other suppliers 11,558
Accrued taxes payable (note 21) 58,583
Personnel 3,717
Other long-term accounts payable 1,088
Total 75,167
CURRENT LIABILITIES – OTHER NON-TRADE PAYABLES BALANCE AT 01.31.04
Accrued taxes payable (note 21) 272,859
Personnel 52,130
Payable to fixed assets suppliers 8,281
Current account with multigroup companies 13,946
Other accounts payable 9,555
Total 356,771

58 INDITEX ANNUAL REPORT 2003
Long-term accounts payable to fixed assets and other suppliers include Euros 6,070 thousand relating to defe-
rred payments for the acquisition of the Group’s holding in Stradivarius España, S.A. (note 16).
Accrued taxes payable include deferred taxes, amounts payable for withholdings, mainly from personnel, income
tax,VAT and social security for the last month of the year.
21.TAX MATTERS
The consolidated companies file individual tax returns, except for Inditex and Indipunt, S.L. which file consolidated
tax returns. Inditex is the Controlling Company of a tax group comprising the following companies:
Choolet, S.A. Kettering, S.A. Lefties España, S.A. Comditel, S.A.
Zara España, S.A. Pull & Bear Logística, S.A. Denllo, S.A. Bershka BSK España, S.A.
Glencare, S.A. Confecciones Fíos, S.A. Bershka Logística, S.A Sircio, S.A.
Confecciones Goa, S.A. Zara Logística, S.A. Zara, S.A. Hampton, S.A.
Inditex, S.A. Plataforma Europa, S.A. Kenner, S.A. Pull & Bear España, S.A.
Stear, S.A. Nikole, S.A. Kiddy’s Class España, S.A. Massimo Dutti Logística, S.A.
Oysho España, S.A. Zara Home España, S.A. Samlor, S.A. Trisko, S.A.
Grupo Massimo Dutti, S.A. Textil Rase, S.A. Zintura, S.A. Goa-Invest, S.A.
Stradivarius España, S.A. Yeroli, S.A. Oysho Logística, S.A.
Indipunt, S.L. is the Controlling Company of a subgroup with the subsidiary Jema Creaciones Infantiles, S.A.
The tax inspections which commenced in 2001 on the tax group comprising 36 companies headed by Inditex
concluded during the year.The result of these inspections did not lead to any material adjustments to the conso-
lidated statement of income.The years subsequent to 31 January 2001 are open to inspection.
“Other non-trade payables” include the liability for applicable taxes, including the provision for income tax for
2003, net of withholdings and prepayments made during the year.
“Accounts receivable – other accounts receivable” include the amounts recoverable from the tax authorities,
including net recoverable VAT and prepaid taxes.
Inditex has a 49% interest in nine economic interest groupings engaged in the lease of assets, which have availed
themselves of the tax incentives provided for in Additional Provision Fifteen of the Corporate Income Tax Law, having
requested and obtained this tax benefit from the Ministry of the Economy and Finance. During the current year tax
losses were incurred which reduced the income tax expense of Inditex.The Company has opted to allocate tax bases
to the tax period in which the financial statements are approved.This investment is deemed to be a financial transac-
tion and the estimated net return will be taken to income over the foreseeable life of the investment.The projected
tax bases and accounting results for future years have given rise to a thousands of Euros 27,278 increase in the corpo-
rate income tax expense. As a result, considering the permanent differences recorded in relation to this item, the net
effect of these investments on the income statement is income tax revenue of Euros 5,826 thousand.

ANNUAL REPORT 2003 INDITEX 59
The corporate income tax expense for 2003 was calculated on the basis of income reported for accounting
purposes, by applying generally accepted accounting principles, which does not necessarily coincide with
taxable income.
The corporate income tax expense of the companies composing the Spanish consolidated tax subgroups of
which Inditex and Indipunt are the controlling companies, respectively, was determined in accordance with the
Resolution of 9 October 1997 of the ICAC (the Spanish Accounting and Audit Institute), taking into account, in
addition to the individual tax parameters, timing and permanent differences deriving from the consolidation pro-
cess and the tax credits and tax relief for the amount applicable under the tax regime for corporate groups.
The corporate income tax expense for the Group was calculated by aggregating the tax expense of each of the
individual companies determined in accordance with prevailing corporate and tax legislation in force in the
countries where the different Group companies operate, taking into account the adjustments deriving from the
application of consolidation methods, pursuant to Article 60 of Royal Decree 1815 of 20 December 1991 enac-
ting the regulations governing the preparation of consolidated annual accounts.
A reconciliation of the Group’s 2003 accounting income with taxable income for corporate income tax purposes
is as follows:
AMOUNT
Accounting income for the year 446,451
Accrued corporate income tax 164,807
Net permanent differences:
Individual companies (90,773)
Consolidation adjustments 8,041
Net timing differences:
Individual companies (13,151)
Consolidation adjustments (59)
Offset of prior years’ losses (1,192)
Taxable income 514,124
Positive permanent differences mainly reflect non-deductible expenses, charges to non-deductible provisions,
the recognition of a portion of the tax revenue generated on the contribution of rights over certain fixed assets
to a subsidiary, and the exemption of profit generated through a permanent establishment based abroad.
Negative permanent differences mainly relate to the recognition, for fiscal transparency purposes, of tax losses
incurred by economic interest groupings.
The Group has charged Euros 7,619 thousand relating to withholding tax to the “Other taxes” caption in the
accompanying statement of income.

60 INDITEX ANNUAL REPORT 2003
The companies have recorded the prepaid and deferred income taxes arising from timing differences relating to
the different methods for recognising certain revenues and expenses for accounting and tax purposes.The rela-
ted cumulative amounts as of 31 January 2003 and 2004 are as follows:
BALANCE AT 01/31/03 BALANCE AT 01/31/04
Deferred tax liabilities 61,031 67,867
Deferred tax assets 39,306 38,766
These amounts include Euros 14,923 thousand of deferred taxes relating to transactions between the companies
composing the tax group.
The companies comprising the consolidated Group have availed themselves of the tax credits provided by
current corporate income tax legislation. Although the companies have not yet filed their corporate income tax
returns for 2003, the provision for corporate income tax in the accompanying consolidated financial statements
includes tax credits totalling Euros 39,411 thousand.
22.REVENUES AND EXPENSES
A) TRANSACTIONS WITH MULTIGROUP AND ASSOCIATED COMPANIES
Details of the Inditex Group’s transactions in 2003 with equity accounted and multigroup companies are as follows:
PURCHASES AND SERVICES RECEIVED SALES AND SERVICES RENDERED FINANCIAL EXPENSES FINANCIAL REVENUES
Associated companies 8,402 0 0 0
Multigroup companies 90,585 42,895 141 33
Total 98,987 42,895 141 33
B) NET SALES
La distribución del importe neto de la cifra de negocios por actividades y por mercados geográficos ha sido la
siguiente:
TOTAL SPANISH COMPANIES FOREIGN COMPANIES
Net sales at Group operated stores 4,019,087 2,086,497 1,932,590
Net sales to franchises 271,582 261,968 9,614
Other textile sales 253,401 251,218 2,183
Services rendered 39,109 16,520 22,589
Other sales 15,729 15,729 0
Total 4,598,908 2,631,932 1,966,976
The accompanying directors’ report provides more detailed information relating to net sales.

ANNUAL REPORT 2003 INDITEX 61
C) EMPLOYEES
The headcount as of 31 January 2004 was as follows:
NUMBER OF EMPLOYEES
Spain 22,114
Abroad 17,646
Total 39,760
The breakdown of the employee welfare expenses is as follows:
AMOUNT
Employer social security costs 129,012
Other employee welfare expenses 17,166
Total 146,178
D) DISTRIBUTION OF NET INCOME
The detail of the net income contributed by the consolidated companies, grouped by line of business, is as follows:
LINE OF BUSINESS AMOUNT
Retail distribution 403,345
Manufacturing 30,198
Others 12,908
Total 446,451
E) FOREIGN CURRENCY TRANSACTIONS
The transactions performed by the Group in the year, by currency, are as follows (in thousands of Euros):
CURRENCY NET SALES % OF NET SALES
Euro 3,802,513 83%
Other European currencies 246,039 5%
US Dollar 56,736 1%
Other American currencies 461.395 10%
Other currencies 32.225 1%
Total 4,598,908 100%
Approximately 20% of the purchases were made in US Dollars and the remaining 80% in Euros.

62 INDITEX ANNUAL REPORT 2003
F) EXTRAORDINARY RESULTS
The losses on fixed assets relate mainly to the write-off of installations due to refurbishing of commercial premi-
ses where the Group operates.
Other extraordinary expenses comprise non-recurring expenses, which are not individually significant.
Other extraordinary revenues mainly include the reversal of the provision for contingencies and expenses (note 18).
23.HEDGING OPERATIONS
As it has a global presence, the Inditex Group is exposed to exchange rate fluctuations affecting the currencies
in which it operates. The Group monitors its risk positions and its policy is to systematically hedge the main
currency flows.
Hedging operations in different currencies have been negotiated and carried out in 2003, mainly for the US Dollar,
Pound Sterling, Japanese Yen and Mexican Peso. Hedging operations at 31 January 2004 are as follows:
TYPE OF COVERAGE PURCHASE CURRENCY SALE CURRENCY NOMINAL PURCHASE TYPE OF OPTION
Forward currency purchase USD EUR 84,500,000
European options USD EUR 30,000,000 Call purchase
Average exchange rate options (Asia) EUR GBP 11,000,000 Put purchase
Average exchange rate options (Asia) EUR GBP 11,000,000 Call sale
Average exchange rate options (Asia) MXN USD 920,000,000 Put purchase
Average exchange rate options (Asia) MXN USD 920,000,000 Call sale
All the abovementioned operations mature in the short term.

ANNUAL REPORT 2003 INDITEX 63
24.DIRECTORS’ COMPENSATION AND TRANSACTIONS WITH RELATED PARTIES
DIRECTORS’ COMPENSATION
In 2003 the members of the Controlling Company’s board of directors earned total remuneration of Euros 4,928,
as follows:
EXECUTIVE DIRECTORS DIRECTORS OF GROUP AND ASSOCIATED COMPANIES TOTAL
Fixed and variable remuneration 3,954 0 3,954
Remuneration for board members 415 559 974
Total 4,369 559 4,928
The Inditex Group has not granted any loans or advances to any of the directors and it does not have any pen-
sion or life insurance commitments with the board. In accordance with the relevant employment contracts, the
executive directors, except for the Chairman, receive an indemnity equivalent to one year’s salary if they resign or
their services are terminated.
TRANSACTIONS WITH RELATED COMPANIES
In 2003 the Group has earned revenues on transactions with the members of the board of directors and related
companies totalling Euros 4,243 thousand , mainly in relation to work carried out by the Group construction com-
pany.These transactions have been invoiced at market prices.
Group companies have leased a total of 31 commercial premises owned by a company related to Directors of
the Controlling Company. The majority of these lease contracts were entered into prior to 1994 and expire bet-
ween 2014 and 2016. Rental instalments paid by the Group in 2003 for the aforementioned premises, calculated
at market prices, amount to Euros 5,304 thousand.
In 2003 the Group sold two premises forming part of a Zara store to a company controlled by one of the its direc-
tors for Euros 1,322 thousand and a lease contract was established between the seller and the purchaser.The afo-
rementioned director had previously obtained ownership of the remaining premises which form part of the store
and are also leased to Zara España. S.A. Rental instalments paid by the aforementioned store are included in the
preceding paragraph.
In December 2003 a Group company acquired an entity in order to open a Zara store on the premises the inves-
tee owned. The acquired company had previously been purchased through an auction by an entity related to
one of the directors, who transferred the investment for the same price and expenses incurred.The director obtai-
ned no profit on this operation, which amounted to Euros 17,432 thousand.
Furthermore, in 2003 one of the Group companies made a contribution of Euros 150 thousand to the Fundación
Paideia Galiza, which is related to one of the members of the board of directors, pursuant to a mutual collabora-
tion agreement.This was the last contribution in relation to this contract.

64 INDITEX ANNUAL REPORT 2003
At 31 January 2004 Group company balances receivable from and payable to members of the board of directors
and related companies total Euros 148 thousand and Euros 61 thousand respectively.These balances derive from
the aforementioned transactions.
The aforementioned transactions have been carried out under market conditions and have not had, either indivi-
dually or as a whole, a significant effect on net sales or the Company’s balance sheet.
INTERESTS HELD BY THE MEMBERS OF THE BOARD OF DIRECTORS IN SHARE STOCK
According to the public records of the National Securities Market Commission (CNMV), at 31 January 2004 the
members of the board of directors held the following direct or indirect interests in the capital stock of Inditex:
BOARD MEMBER OR REPRESENTATIVE OWNER OF SHARES NUMBER OF SHARES PERCENTAGE OWNERSHIP
D.Amancio Ortega Gaona Gartler, S.L. 369,600,063 59.29%
Dª Rosalía Mera Goyenechea Rosp Corunna Participaciones Empresariales, S.L. 43,590,000 6.99%
D.Juan Carlos Rodríguez Cebrián Individual 2,722,067 0.44%
D.José María Castellano Ríos Individual 1,373,863 0.22%
D.Antonio Abril Abadín Individual 168,276 0.03%
D.Carlos Espinosa de los Monteros Individual 11,646 0.00%
D.J.Manuel Urgoiti López de Ocaña Individual 5,000 0.00%
D.Francisco Luzón López Individual 98,565 0.02%
Total 417,569,480 66.99%
The board members not mentioned in the above table held no shares at year end.
25.EXTERNAL AUDITORS
In addition to the audit of the annual accounts of the Inditex Group, audit services rendered by KPMG Audito-
res, S.L. include limited review procedures for quarterly closes of certain Group companies.
Details of the fees and expenses accrued by firms associated to KPMG International in relation to the services ren-
dered to Group companies in 2003 are as follows:
ITEM AMOUNT
Audit services 2,847
Corporate responsibility services 142
Other services 145
Total 3,134

ANNUAL REPORT 2003 INDITEX 65
Services not included in audit services is as follows:
"Corporate responsibility services include the review of suppliers’ workshops and factories.
"Other services comprise legal and tax advisory services rendered to foreign subsidiaries, advice in the imple-
mentation of international accounting standards, and other work.
On the basis of information received from the auditors, fees received from the Inditex Group by KPMG or associated
firms do not exceed 0.032% of total revenues.
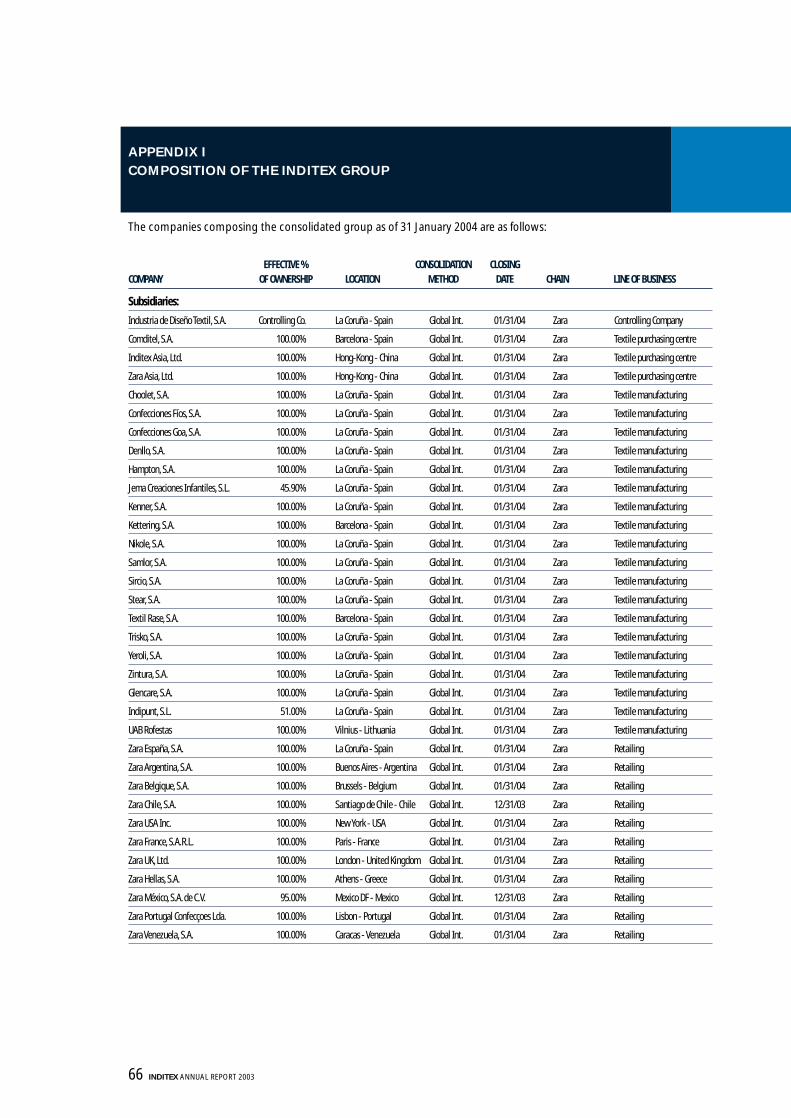
66 INDITEX ANNUAL REPORT 2003
APPENDIX I
COMPOSITION OF THE INDITEX GROUP
The companies composing the consolidated group as of 31 January 2004 are as follows:
EFFECTIVE % CONSOLIDATION CLOSING
COMPANY OF OWNERSHIP LOCATION METHOD DATE CHAIN LINE OF BUSINESS
Subsidiaries:
Industria de Diseño Textil, S.A. Controlling Co. La Coruña - Spain Global Int. 01/31/04 Zara Controlling Company
Comditel, S.A. 100.00% Barcelona - Spain Global Int. 01/31/04 Zara Textile purchasing centre
Inditex Asia, Ltd. 100.00% Hong-Kong - China Global Int. 01/31/04 Zara Textile purchasing centre
Zara Asia, Ltd. 100.00% Hong-Kong - China Global Int. 01/31/04 Zara Textile purchasing centre
Choolet, S.A. 100.00% La Coruña - Spain Global Int. 01/31/04 Zara Textile manufacturing
Confecciones Fíos, S.A. 100.00% La Coruña - Spain Global Int. 01/31/04 Zara Textile manufacturing
Confecciones Goa, S.A. 100.00% La Coruña - Spain Global Int. 01/31/04 Zara Textile manufacturing
Denllo, S.A. 100.00% La Coruña - Spain Global Int. 01/31/04 Zara Textile manufacturing
Hampton, S.A. 100.00% La Coruña - Spain Global Int. 01/31/04 Zara Textile manufacturing
Jema Creaciones Infantiles, S.L. 45.90% La Coruña - Spain Global Int. 01/31/04 Zara Textile manufacturing
Kenner, S.A. 100.00% La Coruña - Spain Global Int. 01/31/04 Zara Textile manufacturing
Kettering, S.A. 100.00% Barcelona - Spain Global Int. 01/31/04 Zara Textile manufacturing
Nikole, S.A. 100.00% La Coruña - Spain Global Int. 01/31/04 Zara Textile manufacturing
Samlor, S.A. 100.00% La Coruña - Spain Global Int. 01/31/04 Zara Textile manufacturing
Sircio, S.A. 100.00% La Coruña - Spain Global Int. 01/31/04 Zara Textile manufacturing
Stear, S.A. 100.00% La Coruña - Spain Global Int. 01/31/04 Zara Textile manufacturing
Textil Rase, S.A. 100.00% Barcelona - Spain Global Int. 01/31/04 Zara Textile manufacturing
Trisko, S.A. 100.00% La Coruña - Spain Global Int. 01/31/04 Zara Textile manufacturing
Yeroli, S.A. 100.00% La Coruña - Spain Global Int. 01/31/04 Zara Textile manufacturing
Zintura, S.A. 100.00% La Coruña - Spain Global Int. 01/31/04 Zara Textile manufacturing
Glencare, S.A. 100.00% La Coruña - Spain Global Int. 01/31/04 Zara Textile manufacturing
Indipunt, S.L. 51.00% La Coruña - Spain Global Int. 01/31/04 Zara Textile manufacturing
UAB Rofestas 100.00% Vilnius - Lithuania Global Int. 01/31/04 Zara Textile manufacturing
Zara España, S.A. 100.00% La Coruña - Spain Global Int. 01/31/04 Zara Retailing
Zara Argentina, S.A. 100.00% Buenos Aires - Argentina Global Int. 01/31/04 Zara Retailing
Zara Belgique, S.A. 100.00% Brussels - Belgium Global Int. 01/31/04 Zara Retailing
Zara Chile, S.A. 100.00% Santiago de Chile - Chile Global Int. 12/31/03 Zara Retailing
Zara USA Inc. 100.00% New York - USA Global Int. 01/31/04 Zara Retailing
Zara France, S.A.R.L. 100.00% Paris - France Global Int. 01/31/04 Zara Retailing
Zara UK, Ltd. 100.00% London - United Kingdom Global Int. 01/31/04 Zara Retailing
Zara Hellas, S.A. 100.00% Athens - Greece Global Int. 01/31/04 Zara Retailing
Zara México, S.A. de C.V. 95.00% Mexico DF - Mexico Global Int. 12/31/03 Zara Retailing
Zara Portugal Confecçoes Lda. 100.00% Lisbon - Portugal Global Int. 01/31/04 Zara Retailing
Zara Venezuela, S.A. 100.00% Caracas - Venezuela Global Int. 01/31/04 Zara Retailing

ANNUAL REPORT 2003 INDITEX 67
EFFECTIVE % CONSOLIDATION CLOSING
COMPANY OF OWNERSHIP LOCATION METHOD DATE CHAIN LINE OF BUSINESS
Grupo Zara Uruguay, S.A. 100.00% Montevideo -Uruguay Global Int. 01/31/04 Zara Retailing
Zara Brasil, Lda. 100.00% São Paulo -Brazil Global Int. 12/31/03 Zara Retailing
Zara Nederland, B.V. 100.00% Amsterdam - Holland Global Int. 01/31/04 Zara Retailing
Zara Österreich Clothing, GmbH 100.00% Vienna - Austria Global Int. 01/31/04 Zara Retailing
Zara Danmark A/S 100.00% Copenhagen - Denmark Global Int. 01/31/04 Zara Retailing
Zara Sverige, AB 100.00% Stockholm - Sweden Global Int. 01/31/04 Zara Retailing
Zara Norge, AS 100.00% Oslo - Norway Global Int. 01/31/04 Zara Retailing
Zara Canada, Inc. 100.00% Montreal - Canada Global Int. 01/31/04 Zara Retailing
Zara Suisse S.A.R.L. 100.00% Freiburg - Switzerland Global Int. 01/31/04 Zara Retailing
Zara Luxembourg, S.A. 100.00% Luxembourg - Luxembourg Global Int. 01/31/04 Zara Retailing
Za Giyim Ithalat Ihracat Ve Ticaret Ltd. 100.00% Istambul - Turkey Global Int. 01/31/04 Zara Retailing
Zara Italia, S.R.L. 51.00% Milan - Italy Global Int. 01/31/04 Zara Retailing
Zara Ceská Republika, S.R.O. 100.00% Prage - Czech Republic Global Int. 01/31/04 Zara Retailing
Zara Puerto Rico, Inc. 100.00% San Juan - Puerto Rico Global Int. 01/31/04 Zara Retailing
Za Clothing Ireland, Ltd. 100.00% Dublin - Ireland Global Int. 01/31/04 Zara Retailing
Kiddy´s Class España, S.A. 100.00% La Coruña - Spain Global Int. 01/31/04 Kiddy´s Class Retailing
Kiddy´s Class Portugal Conf. Lda. 100.00% Lisbon - Portugal Global Int. 01/31/04 Kiddy´s Class Retailing
Oysho España, S.A. 100.00% Barcelona - Spain Global Int. 01/31/04 Oysho Retailing
Oysho Venezuela, S.A. 100.00% Caracas - Venezuela Global Int. 01/31/04 Oysho Retailing
Oysho Portugal, Conf. Lda. 100.00% Lisbon - Portugal Global Int. 01/31/04 Oysho Retailing
Oysho Mexico, S.A. de C.V. 98.50% Mexico DF - Mexico Global Int. 12/31/03 Oysho Retailing
Oysho Italia, S.R.L. 51.00% Milan - Italy Global Int. 01/31/04 Oysho Retailing
Oysho Nederland, B.V. 100.00% Amsterdam - Holland Global Int. 01/31/04 Oysho Retailing
Oysho Hellas, S.A. 100.00% Athens - Greece Global Int. 01/31/04 Oysho Retailing
Oysho Österreich, GmbH 100.00% Vienna - Austria Global Int. 01/31/04 Oysho Retailing
Grupo Massimo Dutti, S.A. 100.00% Barcelona - Spain Global Int. 01/31/04 Massimo Dutti Retailing
Massimo Dutti Hellas, S.A. 100.00% Athens - Greece Global Int. 01/31/04 Massimo Dutti Retailing
Massimo Dutti Giyim Ithalat Ih.Ve Tic. Ltd. 100.00% Istambul -Turkey Global Int. 12/31/03 Massimo Dutti Retailing
Massimo Dutti Venezuela, S.A. 100.00% Caracas - Venezuela Global Int. 01/31/04 Massimo Dutti Retailing
Massimo Dutti France, S.A.R.L. 100.00% Paris - France Global Int. 01/31/04 Massimo Dutti Retailing
Massimo Dutti UK, Ltd. 100.00% London - United Kingdom Global Int. 01/31/04 Massimo Dutti Retailing
Massimo Dutti Suisse, S.A.R.L. 100.00% Freiburg - Switzerland Global Int. 01/31/04 Massimo Dutti Retailing
Massimo Dutti Sverige, AB 100.00% Stockholm - Sweden Global Int. 01/31/04 Massimo Dutti Retailing
Massimo Dutti Norge, AS. 100.00% Oslo - Norway Global Int. 01/31/04 Massimo Dutti Retailing
Massimo Dutti Italia, S.R.L. 100.00% Milan - Italy Global Int. 01/31/04 Massimo Dutti Retailing
Vajo, N.V. 100.00% Brussels- Belgium Global Int. 01/31/04 Massimo Dutti Retailing
Pull & Bear España, S.A. 100.00% La Coruña - Spain Global Int. 01/31/04 Pull & Bear Retailing
Pull & Bear Hellas, S.A. 100.00% Athens - Greece Global Int. 01/31/04 Pull & Bear Retailing
Pull & Bear Portugal Conf. Lda. 100.00% Lisbon - Portugal Global Int. 01/31/04 Pull & Bear Retailing
Pull & Bear Giyim Ith. Ihrac.Ve Tic. Ltd. 100.00% Istambul -Turkey Global Int. 31/12/03 Pull & Bear Retailing
Pull & Bear Venezuela, S.A. 100.00% Caracas - Venezuela Global Int. 01/31/04 Pull & Bear Retailing

68 INDITEX ANNUAL REPORT 2003
EFFECTIVE % CONSOLIDATION CLOSING
COMPANY OF OWNERSHIP LOCATION METHOD DATE CHAIN LINE OF BUSINESS
Pull & Bear Mexico, S.A. de C.V. 98.50% Mexico DF - Mexico Global Int. 12/31/03 Pull & Bear Retailing
Pull & Bear Belgique, S.A. 100.00% Brussels - Belgium Global Int. 01/31/04 Pull & Bear Retailing
Bershka BSK España, S.A. 100.00% Barcelona - Spain Global Int. 01/31/04 Bershka Retailing
Bershka Portugal Conf. Soc. Unip. Lda. 100.00% Lisbon - Portugal Global Int. 01/31/04 Bershka Retailing
Bershka Hellas, S.A. 100.00% Athens - Greece Global Int. 01/31/04 Bershka Retailing
Bershka Mexico, S.A. de C.V. 97.00% Mexico DF - Mexico Global Int. 12/31/03 Bershka Retailing
Bershka BSK Venezuela, S.A. 100.00% Caracas - Venezuela Global Int. 01/31/04 Bershka Retailing
Bershka Giyim Ithalat Ihracat Ve Tic.Ltd. 100.00% Istambul -Turkey Global Int. 12/31/03 Bershka Retailing
Bershka Belgique, S.A. 100.00% Brussels - Belgium Global Int. 01/31/04 Bershka Retailing
Bershka France, S.A.R.L. 100.00% Paris - France Global Int. 01/31/04 Bershka Retailing
Bershka Suisse, S.A.R.L. 100.00% Freiburg - Switzerland Global Int. 01/31/04 Bershka Retailing
Bershka Nederland, B.V. 100.00% Amsterdam - Holland Global Int. 01/31/04 Bershka Retailing
Bershka Italia, S.R.L. 100.00% Milan - Italy Global Int. 01/31/04 Bershka Retailing
Stradivarius España, S.A. 90.05% Barcelona - Spain Global Int. 01/31/04 Stradivarius Retailing
Stradivarius Hellas, S.A. 90.05% Athens - Greece Global Int. 01/31/04 Stradivarius Retailing
Stradivarius Portugal, Conf. Unip. Lda. 90.05% Lisbon - Portugal Global Int. 01/31/04 Stradivarius Retailing
Stradivarius Giyim Ithalat Ih.Ve Tic. Ltd. 90.15% Istambul -Turkey Global Int. 12/31/03 Stradivarius Retailing
Zara Home España, S.A. 100.00% La Coruña - Spain Global Int. 01/31/04 Zara Home Retailing
Zara Home Portugal, Conf. Soc. Unip. Lda. 100.00% Lisbon - Portugal Global Int. 01/31/04 Zara Home Retailing
Zara Home UK, Ltd. 100.00% London - United Kingdom Global Int. 01/31/04 Zara Home Retailing
Zara Home Hellas, S.A. 100.00% Athens - Greece Global Int. 01/31/04 Zara Home Retailing
Bershka Logística, S.A. 100.00% Barcelona - Spain Global Int. 01/31/04 Bershka Logistics
Massimo Dutti Logística, S.A. 100.00% Barcelona - Spain Global Int. 01/31/04 Massimo Dutti Logistics
Oysho Logística, S.A. 100.00% Barcelona - Spain Global Int. 01/31/04 Oysho Logistics
Pull & Bear Logística, S.A. 100.00% La Coruña - Spain Global Int. 01/31/04 Pull & Bear Logistics
Zara Logística, S.A. 100.00% La Coruña - Spain Global Int. 01/31/04 Zara Logistics
Plataforma Europa, S.A. 100.00% Zaragoza - Spain Global Int. 01/31/04 Zara Logistics
Corporación de Servicios XXI, S.A. de C.V. 100.00% Mexico DF - Mexico Global Int. 12/31/03 Zara Services
Zara Financiën, B.V. 100.00% Breda - Holland Global Int. 01/31/04 Zara Finance
Zara Mexico, B.V. 100.00% Breda - Holland Global Int. 01/31/04 Zara Finance
Zara Holding, B.V. 100.00% Breda - Holland Global Int. 01/31/04 Zara Portfolio
Massimo Dutti Holding, B.V. 100.00% Breda - Holland Global Int. 01/31/04 Massimo Dutti Portfolio
Zalapa, B.V. 100.00% Breda - Holland Global Int. 01/31/04 Zara Portfolio
Zara Merken, B.V. 100.00% Breda - Holland Global Int. 01/31/04 Zara Exploitation of trademarks
Goa-Invest, S.A. 100.00% La Coruña - Spain Global Int. 01/31/04 Zara Construction and real estate
Zara Vastgoed, B.V. 100.00% Breda - Holland Global Int. 01/31/04 Zara Real estate
Vastgoed Asia, Ltd. 100.00% Hong Kong - China Global Int. 01/31/04 Zara Real estate
SNC Zara France Immobiliere 100.00% Paris - France Global Int. 12/31/03 Zara Real estate
SCI Vastgoed Ferreol P03302 100.00% Paris - France Global Int. 12/31/03 Zara Real estate
SCI Vastgoed France P03301 100.00% Paris - France Global Int. 12/31/03 Zara Real estate
SCI Vastgoed General Leclerc P03303 100.00% Paris - France Global Int. 12/31/03 Zara Real estate
SCI Vastgoed Nancy P03304 100.00% Paris - France Global Int. 12/31/03 Zara Real estate
Zara Vastgoed Hellas, S.A. 100.00% Athens - Greece Global Int. 01/31/04 Zara Real estate

ANNUAL REPORT 2003 INDITEX 69
EFFECTIVE % CONSOLIDATION CLOSING
COMPANY OF OWNERSHIP LOCATION METHOD DATE CHAIN LINE OF BUSINESS
Invercarpro, S.A. 100.00% Madrid - Spain Global Int. 01/31/04 Zara Real estate
Robustae S.G.P.S. Unip. Lda. 100.00% Lisbon - Portugal Global Int. 01/31/04 Zara Real estate
Inditex Cogeneración, AIE 100.00% La Coruña - Spain Global Int. 01/31/04 Zara Cogeneration plant
Inditex, S.A. 100.00% La Coruña - Spain Global Int. 01/31/04 Zara Inactive as of 01/31/04
Zara Italia, B.V. 100.00% Breda - Holland Global Int. 01/31/04 Zara Inactive as of 01/31/04
Fruminga, B.V. 100.00% Breda - Holland Global Int. 01/31/04 Zara Inactive as of 01/31/04
Zara, S.A. 100.00% La Coruña - Spain Global Int. 01/31/04 Zara Inactive as of 01/31/04
Zara, S.A. 100.00% Buenos Aires - Argentina Global Int. 01/31/04 Zara Inactive as of 01/31/04
Lefties España, S.A. 100.00% La Coruña - Spain Global Int. 01/31/04 Zara Inactive as of 01/31/04
Multigroup companies:
Tempe, S.A. 50.00% Alicante - Spain Prop. Int. 01/31/04 Zara Marketing of footwear
Tempe México, S.A. de C.V. 50.00% Mexico DF - Mexico Prop. Int. 12/31/03 Zara Marketing of footwear
Tempe Logística, S.A. 50.00% Alicante - Spain Prop. Int. 01/31/04 Zara Logistics
Zara Japan Corp. 50.00% Tokyo - Japan Prop. Int. 01/31/04 Zara Retailing
Zara Deutschland, GmbH 50.00% Hamburg - Germany Prop. Int. 01/31/04 Zara Retailing
Massimo Dutti Deutschland, GmbH 50.00% Hamburg - Germany Prop. Int. 01/31/04 Massimo Dutti Retailing
Oysho Deutschland, GmbH 50.00% Hamburg - Germany Prop. Int. 01/31/04 Oysho Retailing
Group Zara Australia Pty. Ltd. 50.00% Sidney - Australia Prop. Int. 01/31/04 Zara Inactive as of 01/31/04
Associated companies:
Fibracolor Decoración, S.A. 39.97% Barcelona - Spain Equity 12/31/03 Zara Decoration
Fibracolor, S.A. 39.97% Barcelona - Spain Equity 12/31/03 Zara Purchase and treatment of cloth
Naviera Elealva, A.I.E. 49.00% Las Palmas - Spain Equity 12/31/03 Zara Assets leasing
Naviera Celeste, A.I.E. 49.00% Las Palmas - Spain Equity 12/31/03 Zara Assets leasing
Naviera del Miño, A.I.E. 49.00% Las Palmas - Spain Equity 12/31/03 Zara Assets leasing
Naviera del Sil, A.I.E. 49.00% Las Palmas - Spain Equity 12/31/03 Zara Assets leasing
Naviera Venus, A.I.E 49.00% Las Palmas - Spain Equity 12/31/03 Zara Assets leasing
Naviera Berlín, A.I.E. 49.00% Las Palmas - Spain Equity 12/31/03 Zara Assets leasing
Naviera Covadonga, A.I.E. 49.00% Las Palmas - Spain Equity 12/31/03 Zara Assets leasing
Naviera Gran Sol, A.I.E. 49.00% Las Palmas - Spain Equity 12/31/03 Zara Assets leasing
Naviera Guadiana, A.I.E. 49.00% Las Palmas - Spain Equity 12/31/03 Zara Assets leasing

CONSOLIDATED MANAGEMENT REPORT


72 INDITEX ANNUAL REPORT 2003
INDITEX GROUP
2003 PROFIT & LOSS ACCOUNT (Millions of euros)
FY 2003 FY 2002 VAR % 03/02
Net Sales 4,598.9 3,974.0 16%
Cost of sales (2,293.0) (1,926.2)
Gross Profit 2,306.0 2,047.8 13%Gross Margin 50.1% 51.5%
Operating expenses (1,432.5) (1,179.7) 21%
Operating cash flow (EBITDA) 873.5 868.1 1%EBITDA margin 19.0% 21.8%
Fixed assets depreciation (221.2) (185.4) 19%
Goodwill amortisation (9.4) (9.5)
Provisions (15.9) (13.7)
Operating income (EBIT) 627.0 659.5 -5%EBIT margin 13.6% 16.6%
Net financial expenses (7.9) (30.0)
Ordinary income 619.1 629.5 -2%Ordinary margin 13.5% 15.8%
Extraordinary income (loss) (5.7) (14.5)
Income before taxes 613.4 615.1 0%EBT margin 13.3% 15.5%
Taxes (164.8) (172.6)
Net income before minorities 448.6 442.5 1%9.8% 11.1%
Minorities (2.2) (4.4)
Net Income 446.5 438.1 2%Net income margin 9.7% 11.0%
Earnings per share, euro cents (*) 71.6 70.3 2%
* On 623,330,400 shares
1. CONSOLIDATED FINANCIAL STATEMENTS

ANNUAL REPORT 2003 INDITEX 73
INDITEX GROUP
CONSOLIDATED BALANCE SHEET AS OF JANUARY 31, 2004 (Millions of euros)
JANUARY 31 2004 JANUARY 31 2003
ASSETS
Net fixed assets * 2,118.3 1,791.3
Goodwill 53.3 62.6
Deferred charges 17.9 13.9
Total fixed assets 2,189.4 1,867.8
Inventories 486.4 382.4
Receivables 328.9 237.7
Cash & cash equivalents 496.4 516.0
Accruals 9.3 9.8
Total current assets 1,320.9 1,146.0
TOTAL ASSETS 3,510.4 3,013.8
SHAREHOLDERS' EQUITY & LIABILITIES
Shareholders' equity 2,105.9 1,761.3
Minority interest, deferred revenues & provisions 80.0 69.0
Long term financial debt 156.6 129.3
Other long term payables 75.2 41.4
Long term liabilities 311.7 239.8
Short term financial debt 81.5 144.5
Trade and other non-trade payables 1,011.2 868.2
Current liabilities 1,092.7 1,012.7
TOTAL LIABILITIES 3,510.4 3,013.8
* Includes Treasury stock for 89,313¤ in Jan 2004 and 447,000¤ in Jan 2003
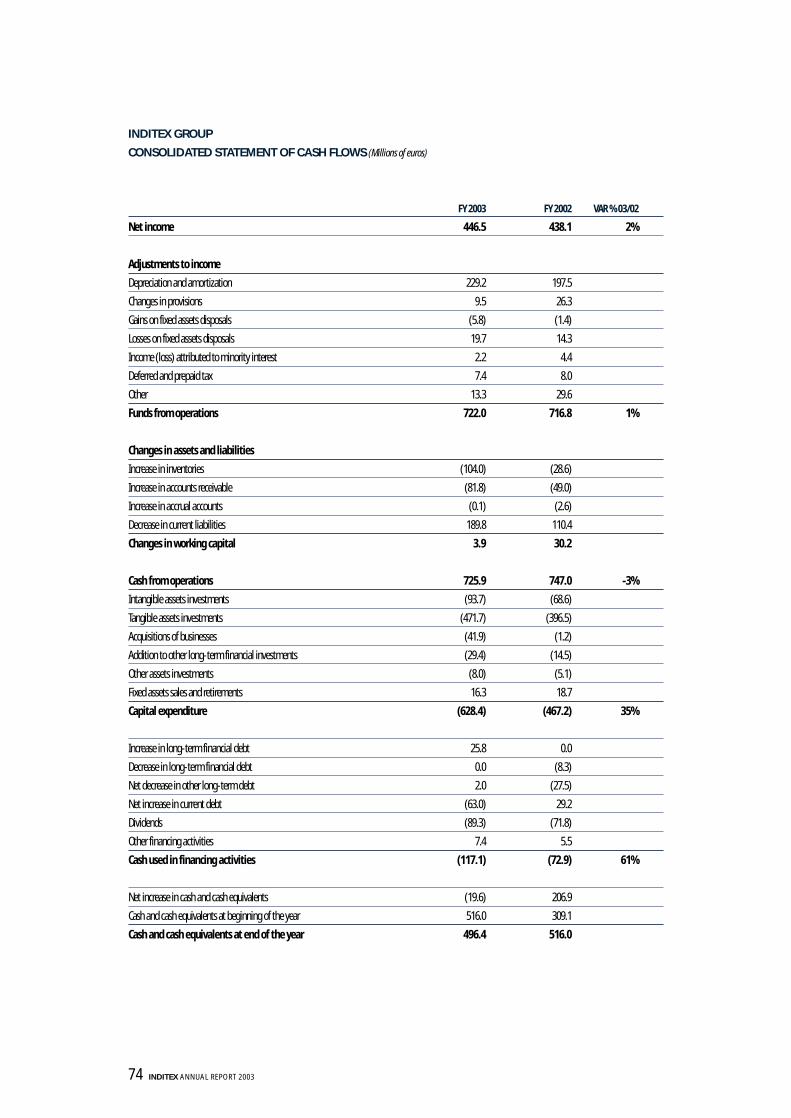
74 INDITEX ANNUAL REPORT 2003
INDITEX GROUP
CONSOLIDATED STATEMENT OF CASH FLOWS (Millions of euros)
FY 2003 FY 2002 VAR % 03/02
Net income 446.5 438.1 2%
Adjustments to income
Depreciation and amortization 229.2 197.5
Changes in provisions 9.5 26.3
Gains on fixed assets disposals (5.8) (1.4)
Losses on fixed assets disposals 19.7 14.3
Income (loss) attributed to minority interest 2.2 4.4
Deferred and prepaid tax 7.4 8.0
Other 13.3 29.6
Funds from operations 722.0 716.8 1%
Changes in assets and liabilities
Increase in inventories (104.0) (28.6)
Increase in accounts receivable (81.8) (49.0)
Increase in accrual accounts (0.1) (2.6)
Decrease in current liabilities 189.8 110.4
Changes in working capital 3.9 30.2
Cash from operations 725.9 747.0 -3%
Intangible assets investments (93.7) (68.6)
Tangible assets investments (471.7) (396.5)
Acquisitions of businesses (41.9) (1.2)
Addition to other long-term financial investments (29.4) (14.5)
Other assets investments (8.0) (5.1)
Fixed assets sales and retirements 16.3 18.7
Capital expenditure (628.4) (467.2) 35%
Increase in long-term financial debt 25.8 0.0
Decrease in long-term financial debt 0.0 (8.3)
Net decrease in other long-term debt 2.0 (27.5)
Net increase in current debt (63.0) 29.2
Dividends (89.3) (71.8)
Other financing activities 7.4 5.5
Cash used in financing activities (117.1) (72.9) 61%
Net increase in cash and cash equivalents (19.6) 206.9
Cash and cash equivalents at beginning of the year 516.0 309.1
Cash and cash equivalents at end of the year 496.4 516.0

ANNUAL REPORT 2003 INDITEX 75
2. COMMENTS ON THE CONSOLIDATED RESULTS
INDITEX results for FY2003 reflect a difficult trading environment in the second half of the year.The high tempera-
tures in Europe over the third quarter resulted in weak sales performance and a strong discounting activity during
the fourth quarter in the major markets where INDITEX operates.
As a consequence of this and the effect of exchange rates, the gross margin has decreased by 140 b.p. in the FY.
The growth in LFL sales over the period has not been enough to offset the costs involved in the new openings,
resulting in a decrease in the EBIT margin of almost 300 b.p.
At FYE INDITEX operated 1,922 stores in 48 countries through eight different concepts: Zara, Kiddy’s Class, Pull &
Bear, Massimo Dutti, Bershka, Stradivarius, Oysho and Zara Home. A list of the stores as at FYE by concept and by
country is shown in Annex III.
2.1SALES
Net sales reached ¤4,598.9 million, an increase of 16% over the previous year (20% constant currency basis).
NUMBER OF STORES AND OPENINGS
The list of openings and existing stores at FYE is as follows:
NET OPENINGS CURRENT STORES
CONCEPT FY 2003 FY 2002 31 JAN 2004 31 JAN 2003
Zara 95 65 626 531
Kiddy´s Class 44 18 103 59
Pull & Bear 54 47 350 296
Massimo Dutti 47 27 297 250
Bershka 56 46 253 197
Stradivarius 38 33 191 153
Oysho 4 38 76 72
Zara Home 26 0 26 0
Total 364 274 1.922 1.558
A detail of quarterly openings and stores opened as at FYE by concept and by country is included in Annexes
II and III.

76 INDITEX ANNUAL REPORT 2003
COMPANY-MANAGED STORES AND FRANCHISES
The breakdown of company-managed stores and franchised stores at FYE is the following:
Company-managed and franchised stores
2003 2002
CONCEPT CO. MAG. FRANCHISES TOTAL CO. MAG. FRANCHISES TOTAL
Zara 567 59 626 487 44 531
Kiddy's Class 103 — 103 59 — 59
Pull & Bear 314 36 350 262 34 296
Massimo Dutti 199 98 297 162 88 250
Bershka 247 6 253 191 6 197
Stradivarius 154 37 191 118 35 153
Oysho 74 2 76 71 1 72
Zara Home 26 — 26 — — —
Total 1,684 238 1,922 1,350 208 1,558
SELLING AREA
The selling area of company-managed stores and franchised stores at FYE is as follows:
Selling area (sqM) in company-managed and franchised stores
TOTAL SELLING AREA SALES PER SQM (E)
31 JAN 2004 31 JAN 2003 CH % 03/02 2003 2002 VAR % 03/02
Zara 686,090 561,800 22% 5,192 5,511 -6%
Kiddy's Class 20,614 12,200 69% 5,926 6,145 -4%
Pull & Bear 67,175 51,700 30% 4,819 6,254 -23%
Massimo Dutti 62,060 51,600 20% 7,742 6,720 15%
Bershka 85,835 64,400 33% 5,064 5,028 1%
Stradivarius 49,808 39,100 27% 3,474 3,922 -11%
Oysho 10,932 11,100 -2% 4,371 2,109 107%
Zara Home 5,843 — — — — n/a
Total 988,357 791,900 25% 5,220 5,525 -6%
LIKE-FOR-LIKE SALES (LFL)
Store sales are those that occur in company-managed stores and franchised stores of any of the Group’s concepts,
net of any consumption tax and converted to euros at the average exchange rates for the fiscal year.
The Group’s like-for-like sales grew by 1% in FY2003. Like-for-like represents the annual change in store sales of
any concept of the Group that were opened for the whole of fiscal years 2003 and 2002, converted to a fixed
exchange rate.

ANNUAL REPORT 2003 INDITEX 77
Below is the increase in like-for-like sales bi-annually for the last six fiscal years:
LFL sales
2003 2002 2001 2000 1999 1998
First Half 6% 12% 9% 13% 6% 13%
Second Half (2%) 10% 9% 9% 5% 12%
Full Year 1% 11% 9% 9% 5% 11%
The like-for-like calculation of the year includes 56% of the selling area as at FYE 2003 (stores opened for the who-
le two last years).
Sales growth in constant currency coming from space not included in LFL calculation, was 19% in FY2003.
EXCHANGE RATES IMPACT ON SALES
The table below shows the growth in sales by accumulative quarters without considering the effect of variations
in exchange rates:
1Q 2Q 3Q 4Q
Sales growth with average exchange rates 15% 19% 16% 16%
Sales growth at constant rates 22% 25% 20% 20%
Difference (7%) (6%) (4%) (4%)
The weakness of the USD vs.∑ over the last months of the FY is the reason why the exchange rate impact for all the
year 2003 has been similar to that of the first nine months of the FY.
SALES BY CONCEPT
A detail of net sales by concept in FY2003 and FY2002 is shown in the table below:
NET SALES (Million ¤) % ON TOTAL
CONCEPT 2003 2002 VAR % 03/02 2003 2002
Zara 3,219.6 2,913.4 11% 70.0% 73.3%
Kiddy's Class 89.7 60.4 49% 1.9% 1.5%
Pull & Bear 287.9 266.2 8% 6.3% 6.7%
Massimo Dutti 388.9 287.3 35% 8.5% 7.2%
Bershka 395.0 299.3 32% 8.6% 7.5%
Stradivarius 162.0 124.1 31% 3.5% 3.1%
Oysho 45.1 23.4 93% 1.0% 0.6%
Zara Home 10.6 — n/a 0.2% n/a
Total sales 4,598.9 3,974.0 16% 100.0% 100%

78 INDITEX ANNUAL REPORT 2003
STORE SALES BY GEOGRAPHIC AREA
The following graph shows the breakdown of store sales by geographic areas:
European markets (ex-Spain) are absorbing the greatest part of the international growth (140 b.p.) while the
weight of the Americas has decreased (150 b.p.) mainly due to the depreciation of the currencies of the area.
The percentage of international store sales by concept in relation to total stores sales is the following:
% International store sales
CONCEPT 2003 2002
Zara 63.5% 62.5%
Kiddy's Class 13.4% 14.7%
Pull & Bear 31.0% 29.6%
Massimo Dutti 40.9% 40.6%
Bershka 33.8% 32.0%
Stradivarius 16.6% 18.5%
Oysho 35.1% 46.5%
Zara Home 8.5% n/a
Total sales 53.9% 54.0%
SALES IN COMPANY-MANAGED AND FRANCHISED STORES
The table below shows the breakdown of sales in company-managed and franchised stores for each of the con-
cepts of the Group:
2003
46.1%
35.5% 34.1%
6.7%
11.7%AMERICAS
2002
REST OF THE WORLD
REST OF EUROPE
SPAIN
46.0%6.8%
13.2%AMERICAS
REST OF THE WORLD
REST OF EUROPE
SPAIN

ANNUAL REPORT 2003 INDITEX 79
Store sales in company-managed and franchised stores
2003 2002
CONCEPT COMPANY MANAGED FRANCHISED COMPANY MANAGED FRANCHISED
Zara 92% 8% 92% 8%
Kiddy's Class 100% 0% 100% 0%
Pull & Bear 91% 9% 92% 8%
Massimo Dutti 65% 35% 60% 40%
Bershka 97% 3% 98% 2%
Stradivarius 80% 20% 79% 21%
Oysho 98% 2% 99% 1%
Zara Home 100% 0% — —
Total 90% 10% 90% 10%
2.2GROSS MARGIN
The gross margin has increased to ¤2,306.0 million, 13% higher than the previous year. As a percentage of sales it
decreased by 140 basis points to reach 50.1% (51.5% in FY2002). This was mainly due to the effect of exchange
rates on margins in countries where the local currency depreciated vs. euro (84 b.p.), to the price harmonization
in some euro-zone countries (14 b.p.) and to the impact of higher markdowns during the end-of-season sales
period (42 b.p.) compared to last year.
2.3OPERATING CASH FLOW (EBITDA)
The EBITDA of FY2003 amounts to ¤873.5 million, an increase of 1% compared to the previous year.
Below is a breakdown of operating expenses over the last two years:
2003 2002 VAR 03/02
Personnel expenses 678.2 569.9 19%
Other operating expenses 754.3 609.8 24%
Total operating expenses 1,432.5 1,179.7 21%
(millions of euros)
At FYE 2003 the number of employees reached 39,760 (32,535 at FY2002).
The growth in LFL sales over the year has not been enough to offset the increase in operating costs due to the
new selling space which has resulted in a 140 b.p. operating de-leverage. This effect and the above-mentioned
decrease in gross margin has situated the EBITDA margin at 19.0% of sales (21.8% in FY2002).

80 INDITEX ANNUAL REPORT 2003
2.4OPERATING INCOME (EBIT)
EBIT for the year amounts to ¤627.0 million, which represents a decrease of 5% in relation to the previous year,
and a 13.6% of sales (16.6% in FY2002).
Ordinary provisions charged to the profit and loss account mainly relate to the Group’s estimated write-downs of
not fully depreciated assets due to the refurbishment of existing stores.
The increase in depreciation charges and its quarterly evolution included in Annex I reflects the calendar effect of
store openings and of the start into operation of new logistic assets.
EBIT BY CONCEPT
The breakdown of the operating income (EBIT) by concept is the following:
EBIT BY CONCEPT (Million ¤) % EBIT ON SALES EBIT BY CONCEPT ON TOTAL (%)
CONCEPT 2003 2002 % CHNG. 03/02 2003 2002 2003 2002
Zara 476.1 540.4 (12%) 14.8% 18.5% 75.9% 81.9%
Kiddy's Class 18.0 14.1 27% 20.0% 23.4% 2.9% 2.1%
Pull & Bear 18.9 34.9 (46%) 6.6% 13.1% 3.0% 5.3%
Massimo Dutti 60.1 37.5 60% 15.5% 13.1% 9.6% 5.7%
Bershka 57.3 48.1 19% 14.5% 16.1% 9.1% 7.3%
Stradivarius 4.4 8.7 (50%) 2.7% 7.0% 0.7% 1.3%
Oysho 2.1 (14.9) n/a 4.7% (63.5%) 0.3% (2.3%)
Zara Home (0.5) 0.0 n/a (4.5%) n/a (0.1%) 0.0%
Goodwill (9.4) (9.4) n/a (0.2%) (0.2%) (1.5%) (1.4%)
Total EBIT 627.0 659.5 (5%) 13.6% 16.6% 100.0% 100.0%
2.5ORDINARY INCOME
Ordinary income amounts to ¤619.1 million, which represents a 2% decrease over FY2002
Net financial results breakdown is as follows:
2003 2002
Net financial expenses (3.4) (6.2)
Foreign exchange losses (4.6) (23.7)
Net losses of companies carried by the equity method 0,1 (0.1)
Total (7.9) (30.0)
(millons of euros)

ANNUAL REPORT 2003 INDITEX 81
Net financial expenses are lower than in FY2002 due to the evolution of the net financial position. Foreign exchan-
ge losses are principally due to the impact of exchange rates over inter-company financing operations and cash
balances, mainly in Latin American subsidiaries.
2.6INCOME BEFORE TAXES
Income before taxes amounts to ¤613.4 million, similar to that of FY2002.
Extraordinary results include write-offs of fixed assets. At year end it has not been considered necessary to main-
tain the provisions booked in previous quarters for possible assets write-offs.
2.7NET INCOME BEFORE MINORITIES AND NET INCOME
Net income before minorities reached ¤448.6 million, an increase of 1% in relation to FY2002. The tax rate for
2003 is 27% versus a 28% in FY2002.
Net income amounts to ¤446.5 million, an increase of 2% over FY2002.
DIVIDEND PROPOSAL
Inditex’s Board of Directors will propose to the General Shareholders Meeting an ordinary dividend of ¤87 million
(¤14 cents per share) and a bonus dividend of ¤131 million (¤21 cents per share), resulting a total dividend of
¤218 million (¤35 cents per share).
The Board of Directors has agreed to increase progressively the proportion of net income distributed as ordinary
dividend in the coming years.
RETURN ON EQUITY (ROE)
The table below shows the Group’s Return on Equity, defined as net income divided by average Shareholder’s
equity.
Return on equity
DESCRIPTION 2003 2002 2001 2000 1999 1998 1997
Net income 446.5 438.1 340.4 259.2 204.8 153.1 117.4
Shareholders equity - previous year 1,761.3 1,486.2 1,170.9 893.2 673.4 529.9 414.9
Shareholders equity - current year 2,105.9 1,761.3 1,486.2 1,170.9 893.2 673.4 529.9
Average equity 1,933.6 1,623.7 1,328.5 1,032.0 783.3 601.6 472.4
Return on equity 23% 27% 26% 25% 26% 25% 25%

82 INDITEX ANNUAL REPORT 2003
RETURN ON CAPITAL EMPLOYED (ROCE)
The table below shows Inditex Return on Capital Employed, defined as EBIT divided by average capital employed
(Shareholder’s equity plus net financial debt).
Return on Capital Employed (ROCE)
DESCRIPTION 2003 2002 2001 2000 1999 1998 1997
EBIT 627.0 659.5 517.5 379.9 296.2 241.5 191.5
Average capital employed
Average shareholders' equity 1,933.6 1,623.7 1,328.5 1,032.0 783.3 601.6 472.4
Average net financial debt (*) 0.0 0.0 0.0 100.3 121.5 73.1 72.1
Total average capital employed 1,933.6 1,623.7 1,328.5 1,132.3 904.8 674.7 544.5
Return on capital employed 32% 41% 39% 34% 33% 36% 35%
(*) Zero when net cash
ROCE BY CONCEPT
The table below shows the Return on Capital Employed by concept:
ROCE by concept
2003 2002
CONCEPT ROCE ROCE
Zara 33% 43%
Kiddy's Class 80% 131%
Pull & Bear 16% 39%
Massimo Dutti 56% 49%
Bershka 46% 49%
Stradivarius (*) 5% 12%
Oysho 7% —
Zara Home — —
Total 32% 41%
(*) Before goodwill amortisation

ANNUAL REPORT 2003 INDITEX 83
Q401 Q102 Q202 Q302 Q402 Q103 Q203 Q303 Q4030
-100
-200
100
200
300
NET FINANCIAL POSITION 2002 & 2003 (millions of euros)
245.6
9.5
143.1
73.5 70.8
268.3
57.5
(45.1)
(86.0)
3. COMMENTS ON THE BALANCE SHEET
The Consolidated Balance Sheet of INDITEX maintains a similar structure to that of FY2002, without net financial
debt and with negative working capital, a consequence of the business model.
NET FINANCIAL POSITION
The net financial position is shown in the table below:
Net financial position (millions of euros)
DESCRIPTION JANUARY 31 2004 JANUARY 31 2003
Cash & cash equivalents 496.4 516.0
Long term financial deposits 6.5 0.0
Long term financial debt (156.6) (129.3)
Short term financial debt (81.5) (144.5)
Deferred financial expenses 3.5 3.4
Net financial cash (debt) 268.3 245.6
The evolution of the net financial position during the last nine quarters has been the following:
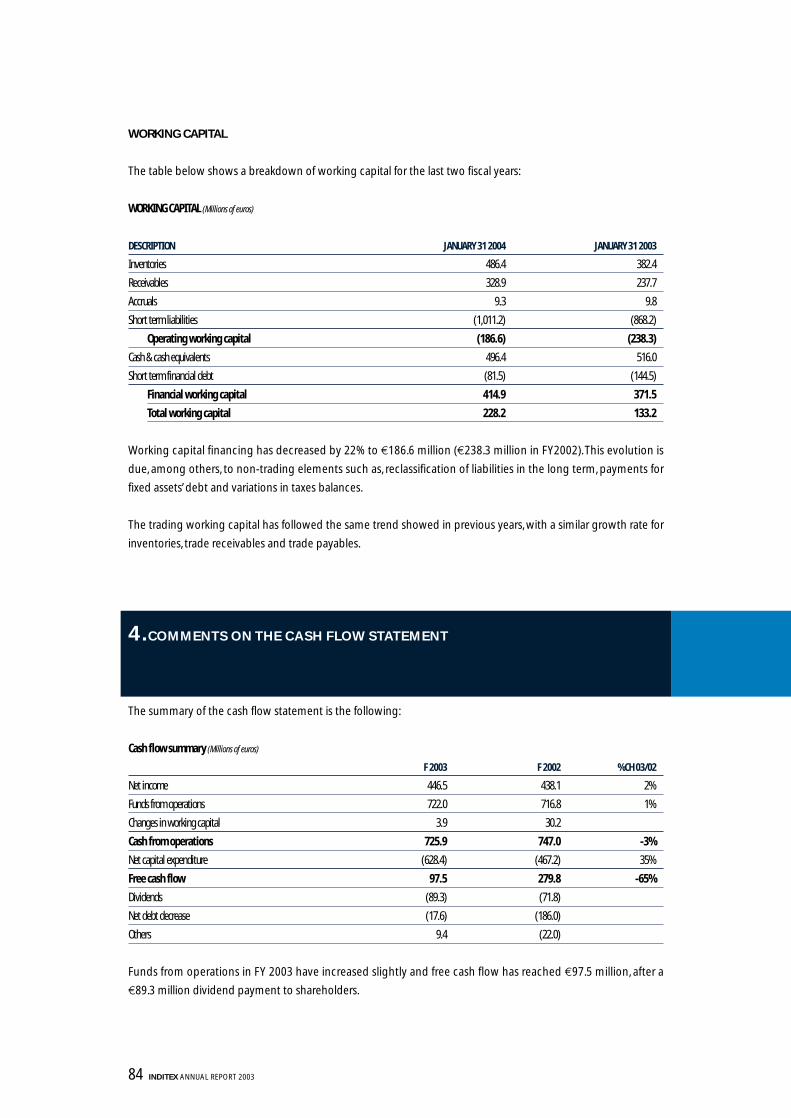
84 INDITEX ANNUAL REPORT 2003
WORKING CAPITAL
The table below shows a breakdown of working capital for the last two fiscal years:
WORKING CAPITAL (Millions of euros)
DESCRIPTION JANUARY 31 2004 JANUARY 31 2003
Inventories 486.4 382.4
Receivables 328.9 237.7
Accruals 9.3 9.8
Short term liabilities (1,011.2) (868.2)
Operating working capital (186.6) (238.3)
Cash & cash equivalents 496.4 516.0
Short term financial debt (81.5) (144.5)
Financial working capital 414.9 371.5
Total working capital 228.2 133.2
Working capital financing has decreased by 22% to ¤186.6 million (¤238.3 million in FY2002). This evolution is
due, among others, to non-trading elements such as, reclassification of liabilities in the long term, payments for
fixed assets’ debt and variations in taxes balances.
The trading working capital has followed the same trend showed in previous years, with a similar growth rate for
inventories, trade receivables and trade payables.
4.COMMENTS ON THE CASH FLOW STATEMENT
The summary of the cash flow statement is the following:
Cash flow summary (Millions of euros)
F 2003 F 2002 %CH 03/02
Net income 446.5 438.1 2%
Funds from operations 722.0 716.8 1%
Changes in working capital 3.9 30.2
Cash from operations 725.9 747.0 -3%
Net capital expenditure (628.4) (467.2) 35%
Free cash flow 97.5 279.8 -65%
Dividends (89.3) (71.8)
Net debt decrease (17.6) (186.0)
Others 9.4 (22.0)
Funds from operations in FY 2003 have increased slightly and free cash flow has reached ¤97.5 million, after a
¤89.3 million dividend payment to shareholders.

ANNUAL REPORT 2003 INDITEX 85
5. START OF FY2004
The Spring-Summer 2004 collections have been well-received by our customers.
The store openings plan for FY2004 is the following:
FY2004 openings forecast
CONCEPT RANGE % INTERNATIONAL TOTAL 2003
Zara 100-110 80% 95
Kiddy's Class 20-30 10% 44
Pull & Bear 20-30 25% 54
Massimo Dutti 30-40 50% 47
Bershka 50-55 50% 56
Stradivarius 30-35 10% 38
Oysho 20-25 25% 4
Zara Home 30-35 5% 26
Total openings 300-360 364
Approximately 70% of the contracts have been secured but in some cases openings may not take place in
FY2004.
Despite the fact that nearly half of the new openings will be in Spain, the Group expects the volume of interna-
tional sales to grow more than domestic sales, as has been happening in the last fiscal years.
Expected CAPEX in FY2004 is between ¤650 million and ¤700 million. The opening of new stores and the refur-
bishment of existing stores will represent the majority of the CAPEX.
INDITEX has initiated negotiations with its partners both in Italy and Japan to increase its stake to a larger con-
trolling position in the joint ventures for Zara in each country. The total investment is included in the above
mentioned CAPEX Plan.

86 INDITEX ANNUAL REPORT 2003
6. OTHER INFORMATION
RESEARCH AND DEVELOPMENT EXPENSES
The Inditex Group has not carried out, and has not engaged third parties to carry out research and development
projects, to be performed over several years and for which investment is earmarked to develop products expec-
ted to generate revenues in more than one year.
Nevertheless, since the incorporation of the company, management has applied available technology in all areas
of its activity to improve manufacturing and distribution processes and developed, with own resources or the
assistance of third parties, instruments with which to improve business management. Examples include point-of-
sale terminals, stock administration and management systems, distribution centre systems, communication with
stores and in-store garment labelling systems.
OPERATIONS WITH OWN SHARES
The only operation with shares of the controlling company carried out by Group companies is described in note
15 of the consolidated annual accounts for the year 2003.

ANNUAL REPORT 2003 INDITEX 87
XXXXXXXXXXXXXXXXXXXXXXXXXXXXXXX
2003 2002 % 03/ 02
1Q 2Q 3Q 4Q 1Q 2Q 3Q 4Q 1Q 2Q 3Q 4Q
Net Sales 979.4 999.9 1,220.6 1,399.0 850.4 809.8 1,097.9 1,215.8 15% 23% 11% 15%
Cost of sales (480.1) (509.9) (582.8) (720.1) (412.8) (398.0) (497.0) (618.4) 16% 28% 17% 16%
Gross Profit 499.3 490.0 637.8 678.9 437.6 411.8 601.0 597.4 14% 19% 6% 14%
Gross Margin 50.98% 49.00% 52.25% 48.53% 51.46% 50.85% 54.74% 49.14%
Operating expenses (319.9) (333.9) (372.7) (406.0) (271.5) (270.3) (302.7) (335.1) 18% 24% 23% 21%
33% 33% 31% 29% 32% 33% 28% 28%
Operating cash flow (EBITDA) 179.4 156.1 265.0 272.9 166.2 141.4 298.2 262.3 8% 10% -11% 4%
EBITDA margin 18.3% 15.6% 21.7% 19.5% 19.5% 17.5% 27.2% 21.6%
Fixed assets depreciation (48.5) (52.4) (56.5) (63.8) (43.0) (48.5) (49.0) (44.9) 13% 8% 15% 42%
Goodwill amortisation (2.3) (2.4) (2.3) (2.3) (2.4) (2.4) (2.5) (2.3)
Provisions (4.3) (1.9) (2.6) (7.1) (4.9) (2.6) (3.1) (3.1)
Operating income (EBIT) 124.3 99.4 203.6 199.7 115.9 87.9 243.6 212.1 7% 13% -16% -6%
EBIT margin 12.7% 9.9% 16.7% 14.3% 13.6% 10.9% 22.2% 17.4%
Net financial expenses 1.2 (3.2) (3.9) (2.0) (14.0) (6.1) (7.1) (2.9)
Ordinary income 125.5 96.2 199.7 197.7 101.8 81.9 236.6 209.2 23% 17% -16% -6%
Extraordinary income (loss) (5.0) (8.0) (6.9) 14.2 (0.1) (8.6) (7.9) 2.1
Income before taxes 120.5 88.2 192.8 211.9 101.7 73.3 228.7 211.3 18% 20% -16% 0%
Taxes (36.1) (24.4) (51.9) (52.4) (33.6) (18.9) (72.6) (47.4)
Net income before minorities 84.4 63.8 140.9 159.5 68.2 54.3 156.1 163.9 24% 17% -10% -3%
Minorities (2.3) 0.2 (2.3) 2.3 (1.3) (0.3) (2.8) 0.1
Net Income 82.1 64.0 138.6 161.8 66.8 54.1 153.2 164.0 23% 18% -10% -1%
Net income margin 8.4% 6.4% 11.4% 11.6% 7.9% 6.7% 14.0% 13.5%
APPENDIX IINCOME STATEMENTS: QUATERLY RESULTS

88 INDITEX ANNUAL REPORT 2003
APPENDIX IISUMMARY OF NET OPENINGS AND NET STORES OPENED BY QUARTER IN 2003 AND 2002
NUMBER OF NET STORE OPENINGS IN EACH QUARTER
CONCEPT 1Q 2003 2Q 2003 3Q 2003 4Q 2003 TOTAL 2003 1Q 2002 2Q 2002 3Q 2002 4Q 2002 TOTAL 2002
Zara 19 11 32 33 95 15 3 31 16 65
Kiddy’s Class 11 6 18 9 44 0 1 8 9 18
Pull & Bear 18 8 18 10 54 9 5 18 15 47
Massimo Dutti 9 8 20 10 47 5 5 8 9 27
Bershka 15 13 11 17 56 5 8 18 15 46
Stradivarius 8 12 8 10 38 3 8 13 9 33
Oysho (4) 3 0 5 4 16 9 11 2 38
Zara Home 0 0 16 10 26 0 0 0 0 0
Total stores 76 61 123 104 364 53 39 107 75 274
NUMBER OF STORES BY THE END OF EACH QUARTER
CONCEPT 1Q 2003 2Q 2003 3Q 2003 4Q 2003 1Q 2002 2Q 2002 3Q 2002 4Q 2002
Zara 550 561 593 626 481 484 515 531
Kiddy’s Class 70 76 94 103 41 42 50 59
Pull & Bear 314 322 340 350 258 263 281 296
Massimo Dutti 259 267 287 297 228 233 241 250
Bershka 212 225 236 253 156 164 182 197
Stradivarius 161 173 181 191 123 131 144 153
Oysho 68 71 71 76 50 59 70 72
Zara Home 0 0 16 26 — — — —
Total stores 1,634 1,695 1,818 1,922 1,337 1,376 1,483 1,558

ANNUAL REPORT 2003 INDITEX 89
APPENDIX IIISTORES BY CONCEPT AND COUNTRY AS AT 31 JANUARY 2004
Zara Kiddy’s Class Pull&Bear M.Dutti Bershka Stradivarius Oysho Zara Home Total Co.Mag.
Spain 221 90 241 181 167 159 49 22 1,130 1,096Portugal 40 13 47 40 26 20 10 2 198 158France 76 2 3 1 82 82Belgium 16 1 16 4 37 21Holland 4 1 2 7 6United Kingdom 25 6 1 32 32Germany 26 4 30 30Sweden 1 2 3 3Norway 1 1 1Andorra 1 1 1 3Austria 4 4 4Denmark 3 3 3Luxembourg 2 1 3 2Iceland 1 1Ireland 1 6 7 1Finland 3 3Italy 12 1 2 15 15Switzerland 3 3 2 8 8Poland 6 6Czech Republic 1 1 1Greece 25 8 5 9 1 1 49 49Slovenia 1 1Slovakia 1 1Malta 1 3 4Cyprus 3 2 1 2 2 10Israel 12 13 25Lebanon 2 1 2 1 6Turkey 10 10 10Kuwait 3 2 1 1 1 8United Arab Emirates 4 3 4 3 2 16Saudi Arabia 12 4 3 1 20Bahrain 1 1 1 3Qatar 1 1 1 1 4Jordan 1 1 1 2 5Canada 10 10 10United States 12 12 12Dominican Republic 1 1Mexico 33 12 17 25 11 98 81Venezuela 8 6 2 8 1 25 25El Salvador 1 1Brazil 13 13 13Argentina 5 5 5Chile 5 5 5Uruguay 2 2 2Japan 9 9 9Singapore 2 2Russia 1 1Malaysia 2 2
626 103 350 297 253 191 76 26 1,922 1,684

90 INDITEX ANNUAL REPORT 2003
XXXXXXXXXXXXXXXXXXXXXXXXXXXXXXXAPPENDIX IVEIGHT-YEAR FINANCIAL SUMMARY
DESCRIPTION 2003 2002 2001 2000 1999 1998 1997 1996 CAGR 03/96
P&L:
Net Sales 4,598.9 3,974.0 3,249.8 2,614.7 2,035.1 1,614.7 1,217.4 1,008.5 24%YoY% 16% 22% 24% 28% 26% 33% 21%
EBITDA 873.5 868.1 704.5 521.5 410.4 325.7 253.6 202.1 23%YoY% 1% 23% 35% 27% 26% 28% 25%
EBIT 627.0 659.5 517.5 379.9 296.2 241.5 192.6 150.3 23%YoY% -5% 27% 36% 28% 23% 25% 28%
Net Income 446.5 438.1 340.4 259.2 204.7 153.1 117.4 72.7 30%YoY% 2% 29% 31% 27% 34% 30% 61%
Balance sheet:
Shareholders' equity 2,105.9 1,761.3 1,486.2 1,170.9 893.2 673.4 529.9 414.9 26%YoY% 20% 19% 27% 31% 33% 27% 28%
Total balance sheet 3,510.4 3,013.8 2,588.6 2,107.6 1,772.9 1,326.3 977.2 820.3 23%YoY% 16% 16% 23% 19% 34% 36% 19%
Net financial position 268.3 245.6 57.5 (50.6) (149.9) (93.0) (38.3) (105.8)
Stores:
Number of stores at FY-end 1,922 1,558 1,284 1,080 922 748 622 541
Net openings 364 274 204 158 174 126 81 33
Number of countries with stores 48 44 39 33 30 21 14 10
Other information:
% International sales 54% 54% 54% 52% 49% 46% 42% 36%
LFL 1% 11% 9% 9% 5% 11% 7% 4%
ROE 23% 27% 26% 25% 26% 25% 25% 20%
ROCE 32% 41% 39% 34% 33% 36% 35% 29%
Number of employees 39,760 32,535 26,724 24,004 18,200 15,576 10,891 8,412


The Annual Report 2003 is available in its totality at the following address:http://www.inditex.com
Individual Shareholders:[email protected]: +34 901 120 101 Fax: +34 981 185 365
Investor Relations:[email protected]: +34 981 185 364 Fax: +34 981 185 365
Corporate Communications:[email protected]: +34 981 185 400 Fax: +34 981 185 544
Inditex S.A.Edificio InditexAvda. de la Diputación s/n15142 ArteixoA Coruña, Spain+34 981 18 54 00
www.inditex.com
© 2004 Grupo Inditex Legal Deposit: C-1484/2004