sustainability balance sheet - inditex
TRANSCRIPT

SUSTAINABILITY BALANCE SHEET

Sustainability balance sheet - Sustainable management: indicators
102-7, 102-8, 102-9, 103-3, 203-1, 302-3, 302-5, 305-4, 405-1, 412-1, 414-1, 416-1, AF2, AF8, AF21
2017 2016
OUR PEOPLE
Total number of employees 171,839 162,450
Employees by gender (percentage)
Men 25% 24%
Women 75% 76%
Employees by activity (percentage)
Stores 87% 87%
Logistics 5% 5%
Manufacture 1% 1%
Central Services 7% 7%
Number of Nationalities 97 99
Average length of service to the company
Less than 5 years 70% 69%
Between 5 and 10 years 15% 18%
Over 10 years 15% 13%
Type of contract
Permanent 73% 80%
Temporary 27% 20%
Type of workday
Full-time 50% 39%
Part-time 50% 61%
SOCIALLY RESPONSIBLE SUPPLY CHAIN
Number of product suppliers with purchase (1) 1,824 1,805
Number of A suppliers 661 694
Number of B suppliers 962 917
Number of C suppliers 101 83
Number of CAP suppliers 71 61
Number of PR suppliers 29 50
Number of rejected suppliers 64 76
Number of active suppliers 1,760 1,729
Number of active factories 7,210 6,959
Number of audits 11,247 10,833
Number of pre-assessment audits 2,252 2,302
Number of social audits 4,215 4,011
Number of special audits 2,159 1,794
Number of raceability audits 2,621 2,776
Number of external audits 7,118 7,245
Number of internal audits 4,129 3,638
SUSTAINABLE MANAGEMENT: INDICATORS
2017 2016
EXCELLENCE OF OUR PRODUCTS
Join Life garments put on sale (in millions) 73.6 44
Number of chemical products regulated by The List by Inditex (2) 19,780 19,736
Number of audits in the Programme Ready to Manufacture 1,735 1,702
Inspections for the Programme Picking 59,687 51,619
Number of analysis conducted on garments in the Programme Picking 756,265 619,854
CIRCULARITY AND EFFICIENT USE OF RESOURCES
Number of stores participating in the Programme Closing the Loop 598 394
Tonnes of garments collected through Closing the Loop 12,229 7,102
Global relative power consumption (MJ/garment) (3) 4.40 4.83
Generation of renewable energies and purchase of renewable energy (kWh) 734,567 520,678
Emissions of CO2 per garment placed
on the market (g CO2eq/garment) (4) 315.57 405.83
Products recovered to be sent for recycling (t) (5) 18,421 16,848
CONTRIBUTION TO COMMUNITY WELFARE
Corporate Community Investment (CCI) (euros) 48,129,552 40,042,744
Number of direct beneficiaries 1,584,446 1,092,941
Number of community organisations supported 409 367
Number of CCI projects performed 594 519
Number of garments donated to social causes 3,673,993 2,083,980
Number of hours spent by employees on CCI activities during working hours 73,457 64,327
Number of Social Board meetings 3 2
TRANSPARENCY AND GOOD GOVERNANCE
Assessment of Dow Jones Sustainability Index 78/100 80/100
FTSE4Good Assessment 4.8/5 4.6/5
SUSTAINABILITY TEAM
Total number of people in the Sustainability Team 4,901 5,131
Internal Team 145 135
External Team 4,756 4,996
(1) Supplier A: Complies with Code of Conduct Supplier B: Does not comply with some non-material aspect of the Code of Conduct. Supplier C: Does not comply with some sensitive aspect of the Code of Conduct. Supplier in Corrective Action Plan (CAP): Breaches of the Code of Conduct triggering the immediate implementation of a Corrective Action Plan Supplier PR: Undergoing an auditing process.
(2) Data of the III edition of the programme that started in 2015 and ended in March 2017.(3) The ratios per garment ((absolute value of the year/number of garments placed on the market during the year) x 1000) include the product units placed on the market through
all stores, either owned or franchised.(4) Includes scope 1 and 2 emissions.(5) Includes waste generated in the head office, chain head offices, all Inditex plants and logistics centres.
|SUMMARY OF INDICATORS

Sustainability balance sheet - Sustainable management: indicators
Awards EntityScore /
Position
Dow Jones Sustainability Index 78/100
Financial Times Stock Exchange For Good (FTSE4Good)
4.8/5
The Most Innovative Companies 70
Global 2000 276
MercoEmpresas 1
MercoTalento 1
MercoResponsabilidad and Corporate Governance
3
Sustainability Yearbook Gold
The Gartner Supply Chain Top 25 3
Awards EntityScore /
Position
The World’s Most Reputable Companies 99
CSR RepTrak®: The World’s Best Regarded Companies for CSR
99
Mention EntityScore /
Position
Best Global Brands 24
The World’s Most Valuable Brands 51
BrandZ Top 100. Most Valuable Global Brands
(Millward Brown)
34
Global 500 The World’s Most Valuable Brands
90
| AWARDS RECEIVED BY THE INDITEX GROUP IN 2017
Zara store employee at Moscow (Russia)

Sustainability balance sheet - Sustainable management: indicators
102-9, 103-1, 103-2, 103-3
|INDICATORS OF SOCIALLY RESPONSIBLE SUPPLY CHAIN
| CLUSTERS OF PRODUCT SUPPLIERS - TRACEABILITY
2017 2016
SPAIN
Number of suppliers with purchase in the year 198 208
Number of garment factories associated with suppliers with purchase 149 167
Number of factories involved in other processes associated with suppliers with purchase(1) 298 299
Workforce of manufacturers working for Inditex in Spain 10,553 10,928
PORTUGAL
Number of suppliers with purchase in the year 161 170
Number of garment factories associated with suppliers with purchase 819 868
Number of factories involved in other processes associated with suppliers with purchase(1) 525 489
Workforce of manufacturers working for Inditex in Portugal 49,694 49,714
MOROCCO
Number of suppliers with purchase in the year 130 121
Number of garment factories associated with suppliers with purchase 237 207
Number of factories involved in other processes associated with suppliers with purchase(1) 73 76
Workforce of manufacturers working for Inditex in Morocco 77,946 73,772
TURKEY
Number of suppliers with purchase in the year 177 175
Number of garment factories associated with suppliers with purchase 704 732
Number of factories involved in other processes associated with suppliers with purchase(1) 755 695
Workforce of manufacturers working for Inditex in Turkey 213,711 192,173
INDIA
Number of suppliers with purchase in the year 131 136
Number of garment factories associated with suppliers with purchase 231 224
Number of factories involved in other processes associated with suppliers with purchase(1) 151 170
Workforce of manufacturers working for Inditex in Spain 217,608 200,139
BANGLADESH
Number of suppliers with purchase in the year 114 94
Number of garment factories associated with suppliers with purchase 166 151
Number of factories involved in other processes associated with suppliers with purchase(1) 130 111
Workers of manufacturers working for Inditex in Bangladesh 541,029 479,859
2017 2016
VIETNAM
Number of suppliers with purchase in the year 5 4
Number of garment factories associated with suppliers with purchase 128 132
Number of factories involved in other processes associated with suppliers with purchase(1) 17 2
Workers of manufacturers working for Inditex in Vietnam 151,395 152,101
CAMBODIA
Number of suppliers with purchase in the year 2 1
Number of garment factories associated with suppliers with purchase 92 99
Number of factories involved in other processes associated with suppliers with purchase(1) 35 26
Workers of manufacturers working for Inditex in Cambodia 126,529 126,843
CHINA
Number of suppliers with purchase in the year 425 393
Number of garment factories associated with suppliers with purchase 1,396 1,243
Number of factories involved in other processes associated with suppliers with purchase(1) 470 411
Workers of manufacturers working for Inditex in China 406,733 368,428
PAKISTAN
Number of suppliers with purchase in the year 45 42
Number of garment factories associated with suppliers with purchase 72 68
Number of factories involved in other processes associated with suppliers with purchase(1) 35 39
Workers of manufacturers working for Inditex in Pakistan 161,950 125,316
ARGENTINA (2)
Number of suppliers with purchase in the year 37 45
Number of garment factories associated with suppliers with purchase 36 41
Number of factories involved in other processes associated with suppliers with purchase(1) 31 42
Workers of manufacturers working for Inditex in Argentina 4,355 5,099
BRAZIL (2)
Number of suppliers with purchase in the year 12 15
Number of garment factories associated with suppliers with purchase 25 45
Number of factories involved in other processes associated with suppliers with purchase(1) 19 20
Workers of manufacturers working for Inditex in Brazil 11,328 10,712
(1) Includes fabric, cutting, dying and washing, printing and finishing.
(2) All suppliers and active factories of the region are included for these data to be representative.

Sustainability balance sheet - Sustainable management: indicators
103-3
| WORKER AT THE CENTRE. 2017 REVIEW
PROGRAMME KPI Training and awareness ParticipationImprovement of management systems
WORKER PARTICIPATION
Suppliers 135 n.a n.a
Factories n.a 60 22
Workers 51,644 53,557 10,510
Countries Portugal, Vietnam, Morocco, Tunisia and Turkey Morocco, Tunisia and Vietnam Bangladesh, Bulgaria, Morocco, Turkey and Tunisia
Inditex employees n.a n.a n.a
Others n.a n.a n.a
LIVING WAGES
Suppliers n.a n.a
Factories n.a n.a 13
Workers n.a n.a 5,836
Countries n.a
Cambodia, Myanmar, Turkey and Vietnam (ACT)Bangladesh, Bulgaria, Morocco, Portugal, Tunisia, Turkey and Vietnam (GFA)
China, Turkey, India
Inditex employees Participation in purchasing practices self-assessment exercise n.a n.a
Others n.a n.a. n.a
RESPONSIBLE PURCHASING PRACTICES
Suppliers n.a n.a n.a
Factories n.a n.a n.a
Workers n.a n.a n.a
Countries n.a n.a n.a
Inditex employees 1,148 buyers66,000 employees with access to online training n.a n.a
Others n.a n.a Participation in a responsible purchasing group in ACT
WOMEN EMPOWERMENT
Suppliers n.a n.a
Factories 1 n.a 34
Workers 277 n.a 15,482
Countries India, Turkey n.a India, Morocco
Inditex employees n.a n.a n.a
Others 1,210 community members (schoolchildren, parents, agents) 235 young people 16 grievance channels created
OCCUPATIONAL HEALTH AND SAFETY
Suppliers 88 15 101
Factories 57 7 277
Workers 41,113 63,881 379,076
Countries Morocco, Tunisia, Portugal, India Bangladesh Morocco, Tunisia, India, Bangladesh, and China
Inditex employees n.a n.a n.a
Others n.a n.a n.a
PROTECTION OF MIGRANTS
Suppliers 90 n.a n.a
Factories n.a n.a 40
Workers 27,833 n.a 2,255
Countries Turkey and China n.a Turkey
Inditex employees n.a n.a n.a
Others Project of Social Security coverage with ETI n.a 155 individual remediation cases
TRAINING AND AWARENESS
Suppliers 1,122 suppliers trained754 individual sessions n.a. n.a.
Factories n.a n.a n.a
Workers n.a n.a n.a
Countries n.a n.a n.a
Inditex employees28 members of the Sustainability team242 buyers180 employees from other areas
n.a n.a
Others 121 external auditors n.a n.a
n/a. not applicable

Sustainability balance sheet - Sustainable management: indicators
103-2
| STRATEGIC PLAN FOR THE SUPPLY CHAIN 2014 - 2018. 2017 REVIEW
CLASSIFICATION AND PRODUCTION VOLUME OF SUPPLIERS WITH PURCHASE IN 2017 (*)
2017 2016 2017 2016
No. of suppliers % Suppliers No. of suppliers % Suppliers % production % production
A 661 36% 694 38% 37% 40%
B 962 53% 917 51% 58% 55%
C 101 5% 83 5% 2% 1%
Subject to CAP 71 4% 61 3% 2% 3%
PR 29 2% 50 3% 1% 1%
Total 1,824 100% 1,805 100% 100% 100%
CLASSIFICATION AND PRODUCTION VOLUME OF SUPPLIERS WITH PURCHASE IN 2017 BY REGION (*)
2017 2016 2017 2016
Africa No. of suppliers % Suppliers No. of suppliers % Suppliers % production % production
A 66 44% 63 45% 53% 45%
B 59 39% 59 42% 35% 42%
C 8 5% 6 4% 5% 4%
Subject to CAP 15 10% 10 7% 6% 8%
PR 3 2% 3 2% 1% 1%
Total 151 100% 141 100% 100% 100%
Americas No. of suppliers % Suppliers No. of suppliers % Suppliers % production % production
A 28 58% 44 68% 36% 40%
B 18 38% 17 26% 63% 58%
C 2 4% 1 1% 1% 1%
Subject to CAP 0 0% 3 5% 0% 1%
PR 0 0% 0 0% 0% 0%
Total 48 100% 65 100% 100% 100%
Asia No. of suppliers % Suppliers No. of suppliers % Suppliers % production % production
A 269 27% 253 27% 30% 28%
B 616 63% 598 64% 66% 67%
C 62 6% 57 6% 2% 2%
Subject to CAP 31 3% 21 2% 2% 3%
PR 2 1% 9 1% 0% 0%
Total 980 100% 938 100% 100% 100%
Europe (non EU) No. of suppliers % Suppliers No. of suppliers % Suppliers % production % production
A 62 34% 84 47% 47% 57%
B 85 47% 70 39% 44% 38%
C 15 8% 5 3% 4% 1%
Subject to CAP 15 8% 15 8% 4% 3%
PR 5 3% 5 3% 1% 1%
Total 182 100% 179 100% 100% 100%
European Union No. of suppliers % Suppliers No. of suppliers % Suppliers % production % production
A 236 51% 250 52% 43% 54%
B 184 40% 173 36% 56% 43%
C 14 3% 14 3% 0% 0%
Subject to CAP 10 2% 12 2% 0% 1%
PR 19 4% 33 7% 1% 2%
Total 463 100% 482 100% 100% 100%
(*) Supplier A: Complies with Code of Conduct.
Supplier B: Does not comply with some non-material aspect of the Code of Conduct.
Supplier C: Does not comply with some sensitive aspect of the Code of Conduct.
Supplier Subject to Corrective Action Plan (CAP): Breaches of the Code of Conduct triggering the immediate implementation of a Corrective Action Plan.
Supplier PR: Undergoing an auditing process.

Sustainability balance sheet - Sustainable management: indicators
412-1, 414-1, AF8, AF16
EVOLUTION OF SUPPLIER CLASSIFICATION OVER THE LAST THREE YEARS (*)
2017
2016
CAP PRCBA
2015724
694
661
794
917
962
116
83
101
35
61
71
56
50
29
(*) Supplier A: Complies with Code of Conduct
Supplier B: Does not comply with some non-material aspect of the Code of Conduct.
Supplier C: Does not comply with some sensitive aspect of the Code of Conduct.
Supplier in Corrective Action Plan (CAP): Breaches of the Code of Conduct triggering the immediate implementation of a Corrective Action Plan
Supplier PR: Undergoing an auditing process.
TOTAL AUDITS PER GEOGRAPHIC AREA 2017
Geographical area Pre-Assessment Social Special (*) Traceability Total
Africa 97 265 142 485 989
Americas 19 91 82 664 856
Asia 1,551 2,012 1,700 513 5,776
Europe (non EU) 275 787 163 927 2,152
European Union 310 1,060 72 32 1,474
Total 2,252 4,215 2,159 2,621 11,247
EXTERNAL AND INTERNAL AUDITS 2017
Pre-Assessment Social Special (*) Traceability Total
Internal 29 1,003 1,349 1,748 4,129
External 2,223 3,212 810 873 7,118
Total 2,252 4,215 2,159 2,621 11,247
CORRECTIVE ACTION PLAN FOR FACTORIES IN 2017
Geographical area Factories that initiated the
improvement processFactories that improved
their complianceFactories in the process
of improvement % CAPs completed successfully
Africa 59 25 29 83%
Americas 4 2 1 67%
Asia 202 56 98 54%
Europe (non EU) 185 20 102 24%
European Union 64 18 27 49%
TOTAL GENERAL 514 121 257 47%
(*) The special audits include, among others, health and safety verifications and competence visits to verify the degree of compliance with the Corrective Action Plans.

Sustainability balance sheet - Sustainable management: indicators
103-2, 103-3, 416-1
|INDICATORS OF THE EXCELLENCE OF OUR PRODUCTS
I RESULTS OF THE PICKING PROGRAMMEThe Picking Programme allows to validate that our products comply with the health and safety standards of the Group, Clear to Wear (CTW) and Safe to Wear (STW). In 2017, the degree of initial compliance with our CTW and STW standards was 97.6%.
For those initially non complying cases (2.4%), retrieving protocols are applied, so that goods are modified accordingly and limited use substances are removed or improving parameters such as colour fastness in order to comply with the standards.
DEGREE OF INITIAL COMPLIANCE
2017 2016 2015
CTW - Chemical Substances 99.1% 99.2% 98.9%
CTW - Parameters 98.9% 98.2% 98.7%
CTW 98.0% 97.5% 97.6%
STW - Parameters 99.8% 99.9% 100.0%
STW - Design 99.8% 99.7% 99.9%
STW 99.6% 99.6% 99.9%
CTW + STW 97.6% 97.1% 97.5%
DEGREE OF INITIAL COMPLIANCE PER GEOGRAPHICAL AREA
Africa 2017 2016 2015
CTW 98.40% 98.00% 98.50%
STW 99.00% 99.20% 99.70%
CTW+STW 97.40% 97.30% 98.10%
Americas 2017 2016 2015
CTW 97.70% 98.70% 83.10%
STW 100.00% 100.00% 100.00%
CTW+STW 97.70% 98.70% 83.10%
Asia 2017 2016 2015
CTW 97.70% 97.10% 97.40%
STW 99.80% 99.80% 99.90%
CTW+STW 97.60% 96.90% 97.30%
European Union 2017 2016 2015
CTW 98.70% 98.20% 98.20%
STW 99.30% 99.30% 99.90%
CTW+STW 98.10% 97.50% 98.00%
Europe (non EU) 2017 2016 2015
CTW 98.70% 97.30% 91.80%
STW 100.00% 99.00% 100.00%
CTW+STW 98.70% 96.20% 91.80%
Store employee at Zara Home in Shanghai (China)

Sustainability balance sheet - Sustainable management: indicators
103-3, 416-1, AF19
The List by Inditex contains a register of chemical products available on the market that are used in the manufacturing processes of textiles and leather. The Third edition of the programme started in 2015 and ended in 2017, with a total of 19,780 chemical products.
EVOLUTION OF SUBSTANCES REGULATED BY THE LIST, BY INDITEX BY EDITION (*)
2017Edition III
2015 Edition II
CBA
2013Edition I
3,500
6,735
13,165
426
856
3,593
298
692
3,022
(*) Chemical products ‘A’: Their use is permitted in the production of Inditex without additional analysis of the installations using them.
Chemical products ‘B’: The use of these products in Inditex’s supply chain of Inditex involves performing additional analysis during production, as set out in the Ready To Manufacture Protocol.
Chemical products ‘C’: These are chemical products which are prohibited in Inditex production.
Chemical products are grouped by use in dyes and auxiliaries for textiles and leather. 19,736 chemical products registered, and in water and oil repellents, are 44 chemical products are registered, and they are classified according to their degree of compliance with the Clear to Wear standard.
FACILITIES AUDITED IN THE READY TO MANUFACTURE PROGRAMME BY GEOGRAPHICAL AREA
Dry cleaners Laundries Stamping Tanneries Mix
2017 2016 2017 2016 2017 2016 2017 2016 2017 2016
Africa 15 10 10 6 4 4 0 0 3 2
Asia 373 299 173 98 138 97 20 17 140 121
European Union 75 72 14 17 68 70 14 17 26 29
Total general 463 381 197 121 210 171 34 34 169 152
Mix: These are wet process facilities where more than one manufacturing activity is performed.
The Ready To Manufacture (RTM) Programme defines a number of rules and requirements applicable to all direct Inditex suppliers, both of textiles and leather, as well as their wet process facilities (dry cleaners, laundries, tanneries and stamping).
To ensure compliance with the Ready To Manufacture code, a supervision and control programme is applied to the facilities involved in our production. In 2017, 1,735 audits were performed.
| READY TO MANUFACTURE PROGRAMME
| PROGRAMME THE LIST, BY INDITEX

Sustainability balance sheet - Sustainable management: indicators
In addition, the data for the purchase of energy of renewable origin and the emissions of Scope 2 have changed from the data reported in the Management Report because it has been identified that there is more energy that comes from renewable sources.
| FACTORS USED IN THE CALCULATIONFor the greenhouse gas calculations, the indications of the Intergovernmental Panel on Climate Change, IPCC (Guidelines for National Greenhouse Gas Inventories, 2006) and the World Resources Institute GHG Protocol (2015) are followed. The emission factors used are as follows:
- Natural gas: 0.2021 Kg CO2eq/kWh.
- Diesel: 2.6853 Kg CO2eq/litre.
The emission factors applied to natural gas and diesel come from the GHG Protocol tool for the calculation of emissions derived from stationary combustion, version 4.1 of the World Resources Institute (WRI), 2015. For the To calculate emissions for electricity consumption, the emission factor for the energy mix of each market where Inditex is present has been used. The database used corresponds to the tool of GHG Protocol of calculation of emissions derived from the electricity purchased, version 4.9 of the World Resources Institute (WRI), 2017.
- Conversion factors:
⋅ 1 tonne of diesel = 1.035 equivalent tonnes of oil (tep.).
Inditex’s environmental indicators and results obtained during 2017 are given below. These quantitative indicators allow the advances obtained through the management of natural and energy resources during the year to be assessed.
| SCOPE OF THE INDICATORSThe environmental indicators system encompasses the data obtained between 1 February 2017 and 31 January 2018.
The data is shown in absolute and relative terms, with the latter being calculated based on the garments placed on the market and the level of net sales, for the purpose of representing the efficiency reached after the company activities and continuous improvement derived from the management.
The scope of the indicators includes the facilities of the Inditex group, specifically:
- The Inditex headquarters and the headquarters of all brands: Zara, Pull&Bear, Massimo Dutti, Bershka, Stradivarius, Oysho, Zara Home, Uterqüe and Tempe, all located in Spain.
- All Group factories, all located in Spain.
- All Group logistics centres.
- All own and franchised stores of the Group in the world.
International offices are not included within the scope. Indicators where the scope is different are given together with the relevant data.
|INDICATORS OF EFFICIENT RESOURCE USE

Sustainability balance sheet - Sustainable management: indicators
302-1, 302-3, 302-4, 302-5
⋅ Diesel density = 0.832 kg/litre at 15oC (Joint Research Centre, 2007).
⋅ 1 tep = 41.868 GJ.
⋅ 1 GJ = 277.728 KWh.
| CALCULATION OF RELATIVE INDICATORSThe calculation of relative indicators is performed according to the following formulae:
- Ratio per garment = (absolute value of the year/number of garments placed on the market in the year) x 1000
GARMENTS PLACED ON THE MARKET*
2017 1,550,152,707
1,382,359,5902016
(*) The product units placed on the market through all stores,, either own or franchised, are included.
- Ratio per accounting sales = (absolute value of the year/€) x 1000**
(**) Includes sales made by our stores and to franchises.
| CALCULATIONS OF ENVIRONMENTAL INDICATORS
I ENERGY CONSUMPTION This indicator gathers all energy consumed in our own factories, offices, logistics centres and Group stores across the world. The energy used comes mainly from the supply network and, to a lesser extent, the consumption of natural gas and diesel.
GLOBAL ENERGY CONSUMPTION (GJ)*
2014 2015 2016 2017
Global energy consumption (GJ) Global relative energy consumption (kJ/€)
Global relative energy consumption (MJ/garment)
269.34
6,824,105
4.40
350.95
6,357,960
6.24
313.06
6,543,195
5.56
286.36
6,675,402
4.83
(*) The energy consumption of logistics centres has been estimated for January 2018.
Zara store employees, Miami (United States)

Sustainability balance sheet - Sustainable management: indicators
302-1,302-3, 302-4, 302-5, AF21
GLOBAL ENERGY CONSUMPTION (MWh)*
2014 2015 2016 2017
Global energy consumption (MWh) Relative energy consumption (KWh/garment)
Global relative energy consumption (Wh/€)
1.22
1,895,244
74.80
1.73
1,765,782
97.47
1.54
1,817,227
86.95
1.34
1,853,945
79.53
(*) The energy consumption of logistics centres has been estimated as at January 2018.
The energy consumed is expressed in Gigajoules (GJ) and Megawatts (MWh). The graphs show that this consumption follows a slightly growth trend in absolute terms. However, a marked reduction of 9% is seen in the relative values for garments and of 6% for sales as compared to 2016.
GLOBAL NETWORK ELECTRICAL ENERGY CONSUMPTION (MWh)*
2014 2015 2016 2017
Global electricity consumption (MWh)
Relative electricity consumption (Wh/garment)
Relative electricity consumption (Wh/€)
1,163.48
1,803,572
71.19
1,629.69
1,660,651
91.66
1,446.69
1,703,885
81.52
1,267.19
1,751,713
75.15
(*) The electricity consumption of the logistics centres has been estimated as at January 2018.
In the case of electricity consumption, we have achieved a reduction of 8% per garment and 5% based on sales. In addition, it must be noted that the purchase of energy of certified renewable origin has continued to grow, reaching a total of 733,867 MWh that has been consumed in our facilities in Spain, Germany, Austria, Brazil, Poland, Switzerland, Portugal, The Netherlands, Turkey, Belgium, Luxembourg and in our LEED stores in the US, France, Italy, Switzerland and India.
GLOBAL NATURAL GAS CONSUMPTION (MWh)*
2014 2015 2016 2017
Global natural gas consumption (MWh) Relative natural gas consumption (Wh/garment)
Relative natural gas consumption (Wh/€)
58.94
91,373
3.61
102.32
104,262
5.76
95.14
112,051
5.36
73.70
101,875
4.37
(*) The natural gas consumption of logistics centres has been estimated as at January 2018.
GLOBAL DIESEL CONSUMPTION (MWh)*
2014 2015 2016 2017
Global diesel consumption (MWh) Relative diesel consumption (Wh/garment)
Relative diesel consumption (Wh/€)
0.19299
0.01
0.85
869
0.05
1.10
1,291
0.06
0.26
357
0.02
(*) The diesel consumption of logistics centres has been estimated as at January 2018.
During 2017 we moved sharply towards achieving our ambitious goal for 2025, where we commit to 80% of our energy needs coming from renewable sources.
We are thus working in energy transition matters, reducing our needs for natural gas and diesel consumption, increasing the purchase of energy from a certified renewable origin, so we also move forwards with the reduction of our greenhouse gas emissions.
In addition, we invest in our own renewable energy generation facilities when technically feasible, which provides our solar thermal, photovoltaic and wind energy, as well as facilities for the use of geothermal resources.
The combination of both actions has allowed 41% of the Group's energy needs in 2017 to be covered by clean energy; this has involved a total consumption of 734,567 MWh obtained sustainably.

Sustainability balance sheet - Sustainable management: indicators
302-1, 302-3, 302-4, 302-5, AF21
At Inditex we have co-generation and tri-generation systems, that together with the purchase of renewable energies and those generated at our renewable facilities, has allowed us to reach a total power consumption of 753,315 MWh.
ELECTRICITY CONSUMPTION COMES FROM RENEWABLE SOURCES (MWh) *
2014 2015 2016 2017
Total consumption (MWh) Relative consumption (Wh/garment)
Relative consumption (Wh/€)
473.87
734,567
28.99
41.96
42,759
2.36150.86
177,679
8.50
376.66
520,678
22.34
(*) In the case of Spain, Austria, Switzerland, The Netherlands, Turkey, Belgium, Luxembourg and LEED stores in the US, France, Italy, Switzerland and India, the period of the data is the calendar year instead of the tax year (time period established in this report).
' OWN LOGISTICS CENTRES, OWN OFFICES AND OWN FACTORIES. Our buildings are built according to our eco-efficiency criteria. Their daily management promotes best practices in our employees, which together with the implementation of the Efficiency Plan, allows control of the consumption of resources to be obtained and measures to reduce them applied.
ELECTRICITY CONSUMPTION AT OUR OWN LOGISTICS CENTRES, OFFICES AND FACTORIES (MWh)*
2014 2015 2016 2017
Total electricity consumption (MWh) Relative electricity consumption (Wh/garment)
Relative electricity consumption (Wh/€)
95.55
148,118
5.85
123.10
125,434
6.92
118.48
139,540
6.68
102.11
141,156
6.06
(*) The electricity consumption of the logistics centres has been estimated as at January 2018.
Thanks to these measures, as shown in the above graph, we have obtained a 6% reduction in electricity consumption per garment placed on the market and a 3% reduction from sales, compared to 2016. The measures implemented include mainly the renewal of old equipment, the replacement of fluorescent lamps by high-efficiency LED bulbs and lithium ion batteries, thus reducing power requirements.
' OWN STORESThe application of measures set out in the Manual of Eco-Efficient Store across new store openings and renovations, has allowed us to reach a total of 5,068 eco-efficient stores in 2017, which means nearly 80% of the total of our own Group stores.
This year we continued to connect our stores to Inditex's centralised management platform, which allows efficiency to be improved in real time. At the end of 2017, we reached 2,981 stores all over the world. Thanks to all these sustainability and energy efficiency measures implemented, an 8% reduction has been achieved in electricity consumption per garment placed on the market, despite the increased number of store openings and the increased surface area of our facilities. On the other hand, compared with sales, it has decreased by 5% since the previous year.
ESTIMATED ELECTRICITY CONSUMPTION IN OWN STORES (MWh)*
2014 2015 2016 2017
Global electricity consumption in stores (MWh)
Relative electricity consumption in stores (Wh/garment)
Global relative electricity consumption in stores (Mh/€)
1,067.93
1,655,454
65.34
1,506.60
1,535,218
84.74
1,328.21
1,564,345
74.85
1,165.08
1,610,556
69.09
(*) Electricity consumption has been calculated from real data of the central monitoring platform. To estimate average consumption, data from 1,222 stores have been considered, and 100% of them were eco-efficient. The goal is that 100% of our own stores will be eco-efficient by 2020.
Sustainability balance sheet - Sustainable management: indicators
305-1, 305-2, 305-4, 305-5
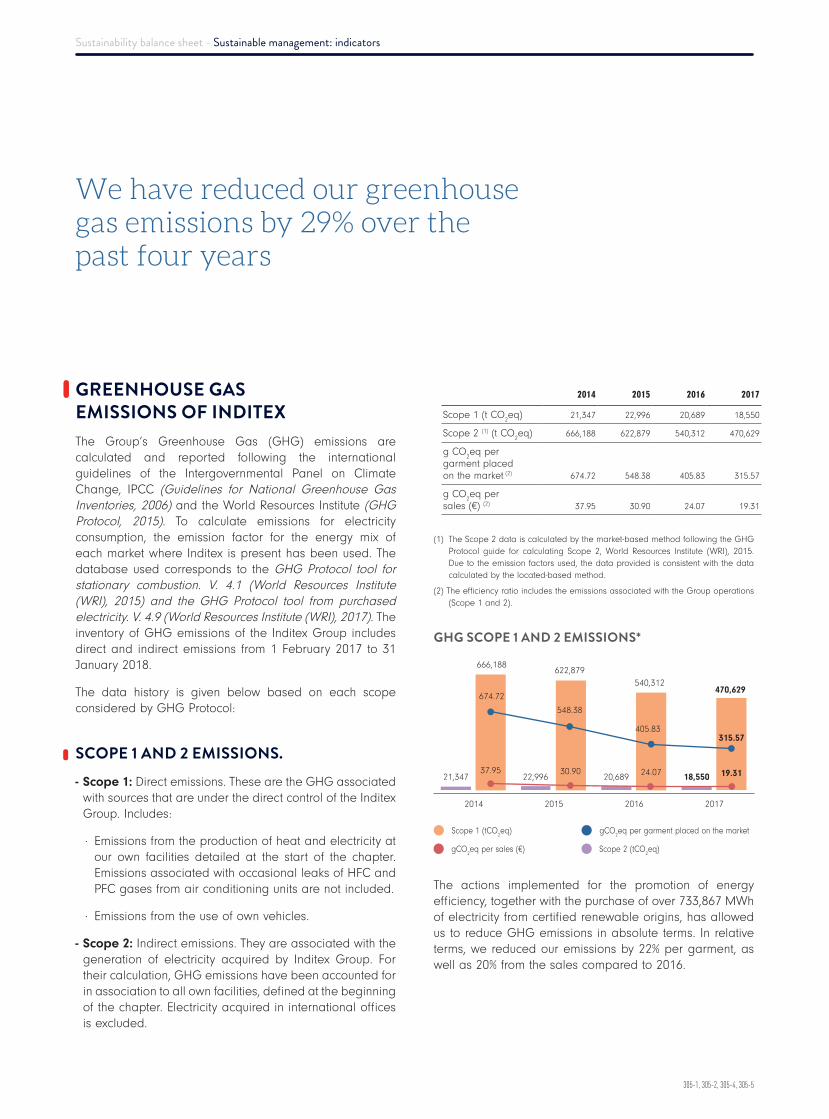
I GREENHOUSE GAS EMISSIONS OF INDITEXThe Group’s Greenhouse Gas (GHG) emissions are calculated and reported following the international guidelines of the Intergovernmental Panel on Climate Change, IPCC (Guidelines for National Greenhouse Gas Inventories, 2006) and the World Resources Institute (GHG Protocol, 2015). To calculate emissions for electricity consumption, the emission factor for the energy mix of each market where Inditex is present has been used. The database used corresponds to the GHG Protocol tool for stationary combustion. V. 4.1 (World Resources Institute (WRI), 2015) and the GHG Protocol tool from purchased electricity. V. 4.9 (World Resources Institute (WRI), 2017). The inventory of GHG emissions of the Inditex Group includes direct and indirect emissions from 1 February 2017 to 31 January 2018.
The data history is given below based on each scope considered by GHG Protocol:
' SCOPE 1 AND 2 EMISSIONS. - Scope 1: Direct emissions. These are the GHG associated with sources that are under the direct control of the Inditex Group. Includes:
⋅ Emissions from the production of heat and electricity at our own facilities detailed at the start of the chapter. Emissions associated with occasional leaks of HFC and PFC gases from air conditioning units are not included.
⋅ Emissions from the use of own vehicles.
- Scope 2: Indirect emissions. They are associated with the generation of electricity acquired by Inditex Group. For their calculation, GHG emissions have been accounted for in association to all own facilities, defined at the beginning of the chapter. Electricity acquired in international offices is excluded.
2014 2015 2016 2017
Scope 1 (t CO2eq) 21,347 22,996 20,689 18,550
Scope 2 (1) (t CO2eq) 666,188 622,879 540,312 470,629
g CO2eq per
garment placed on the market (2) 674.72 548.38 405.83 315.57
g CO2eq per
sales (€) (2) 37.95 30.90 24.07 19.31
(1) The Scope 2 data is calculated by the market-based method following the GHG Protocol guide for calculating Scope 2, World Resources Institute (WRI), 2015. Due to the emission factors used, the data provided is consistent with the data calculated by the located-based method.
(2) The efficiency ratio includes the emissions associated with the Group operations (Scope 1 and 2).
GHG SCOPE 1 AND 2 EMISSIONS*
2014 2015 2016 2017
Scope 1 (tCO2eq) gCO
2eq per garment placed on the market
gCO2eq per sales (€) Scope 2 (tCO
2eq)
315.57
470,629
18,550
674.72
666,188
21,34737.95 30.90 24.07 19.31
548.38
622,879
22,996
405.83
540,312
20,689
The actions implemented for the promotion of energy efficiency, together with the purchase of over 733,867 MWh of electricity from certified renewable origins, has allowed us to reduce GHG emissions in absolute terms. In relative terms, we reduced our emissions by 22% per garment, as well as 20% from the sales compared to 2016.
We have reduced our greenhouse gas emissions by 29% over the past four years

Sustainability balance sheet - Sustainable management: indicators
302-2, 305-3, 305-4, 305-5, 306-2
SCOPE 3 EMISSIONS
- Scope 3: Additional scope includes indirect emissions associated with the production chain of goods and services, produced outside the organisation. Emissions associated with the transport of products from our suppliers to our logistics centres (upstream) and from these to stores (downstream), both performed by external logistics operations (air, sea, land transport), as well as the emissions associated with electricity consumption in franchised stores.
For the purpose of improving our efficiency associated with distribution and logistics operations, we have continued to improve the efficiency of our fleet and included measures to optimise packing and packaging to thus reduce emissions associated with transport. In the case of indirect emissions from our franchised stores, we saw a slight increase in them, derived from the growth of the franchised commercial surface area.
2014 2015 2016 2017
Scope 3 - Downstream transport (t CO
2eq) 596,316 672,307 825,294 921,405
Scope 3 - Upstream transport (t CO
2eq) n.a. 428,258 549,913 639,039
Scope 3 - Franchised stores (t CO
2eq)* 113,094 94,262 103,923 121,171
n.a.: Not available
(*) Electricity consumption has been calculated using real data from the central monitoring platform. To estimate mean consumption, data from 1,222 stores was been considered, and 100% of them were eco-efficient.
The transport calculation is based on the weight of the product delivered and the number of kilometres by each mode of transport. The following emission factors are used, proposed by the GHG Protocol for mobile combustion V.2.6. tool. (World Resources Institute (WRI), 2015).
- Kg of CO2 /tonnes and km truck (load above 33 t)=
0.08678
- Kg of CH4 /tonnes and km truck (load above 33 t)=
2.3973*10-6
- Kg of N2O /tonnes and km truck (load above 33 t)=
1.8494*10-6
- Kg of CO2 /tonnes and km short flight (< 463 Km)= 1.96073
- Kg of CH4 /tonnes and km short flight (< 463 Km)=
2.8562*10-5
- Kg of N2 /tonnes and km short flight (< 463 Km)=
3.2809*10-5
- Kg of CO2 /tonnes and km mid distance flight (from 463 to
1108 Km)= 1.47389
- Kg of CH4 /tonnes and km mid distance flight (from 463 to
1108 Km)= 2.8562*10-5
- Kg of N2O /tonnes and km mid distance flight (from 463
to 1108 Km)= 3.2809*10-5
- Kg of CO2 /tonnes and km long flight (< 1108 Km)=
0.61324
- Kg of CH4 /tonnes and km long flight (< 1108 Km)=
2.8562*10-5
- Kg of N2O /tonnes and km long flight (< 1108 Km)=
3.2809*10-5
- Kg of CO2 /tonnes and km ship= 0.0079
- Kg of CH4 /tonnes and km ship= 2.8083*10-6
- Kg of N2 /tonnes and km ship= 9.5892*10-7
I INDITEX ZERO WASTE TO LANDFILLContinuing with our Sustainable Strategic Plan, we work to achieve that in 2025, through the integration of circular economy in our business model, none of the waste from our activities is send to landfill. We have different tools, such as the Waste Minimisation Plan or the Manual for the Management of Waste from Stores, which allow waste to be managed more efficiently at our centres. In addition, we promote actions for reduction at source and improvement of recycling through projects to train our employees.
Therefore, we continue working to improve projects such as the Closing the Loop or the Green to Pack Programmes, that continue improving efficiency in our deliveries, allow waste to be reduced and give them a second life.
The waste generation data provided below reference the waste generated in our headquartes brand’s offices, all Inditex factories and logistics centres. Waste generated in stores is not included.
' EVOLUTION OF PRODUCTS RECOVERED TO BE SENT TO RECYCLING (KG)
In Inditex, legally authorised managers collect and manage all products generated. This is sent to recycling (such as paper and cardboard, plastics, metal, other textiles, etc.) or are handled in a manner which allows recovery. In 2017, 88% of our waste was managed so that it is not harmful to the environment.

Sustainability balance sheet - Sustainable management: indicators
306-2
PRODUCTS RECOVERED TO BE SENT TO RECYCLING (KG)
2014 2015 2016 2017
18,420,632
14,286,773 16,479,17916,847,749
' ANNUAL GENERATION OF URBAN OR SIMILAR WASTEWe classify our waste according to the European Waste List (EWL) and its transposition into national and regional regulation. The main waste is cardboard and paper, plastic, wood, metal and other textiles, which is managed by legally authorised managers who send it to recycling. The increased generation of this waste is due to the expansion of the Group's logistics capacity, in addition to the current facilities being maintained and the improvement in the separation at source process.
ABSOLUTE DATA (kg)
Textile waste Cardboard and paper Plastic Wood
Metal Other urban waste
619,656
9,233,987
415,158
2,037,907
1,980,065
2014
2015
575,812
1,831,142
523,258
12,243.127
11,065,644
13,111,084
776,277
744,934
689,985
2,898,468
2,070,567
3,726,574
2,401,428
1,966,431
254,799
720.345
2016
2017
300,050
2,578,800
' EVOLUTION OF THE MAIN HAZARDOUS WASTE Thanks to separation at source and subsequent delivery to a legally authorised manager, during 2017, we managed recycle over 80% of our hazardous waste which was valued, and suitably processed for recovery. This avoids our hazardous waste being sent to landfill and reduces the need to obtain new raw materials.
The generation of the main hazardous waste is given below
Type of waste (kg) Final processing 2014 2015 2016 2017
Batteries Recycling 5,597 9,532 7,945 6,580
Waste electronics Recycling 6,901 10,094 9,776 10,149
FluorescentsGas extraction and recycling 3,183 5,387 26,000 6,207
Used mineral oil Recycling 8,302 15,080 8,242 5,083
Contaminated absorbents
Energy recovery and controlled disposal 4,262 2,786 4,969 5,818
Contaminated plastic containers Recycling 1,578 1,366 1,521 1,740
' DESTINATION OF WASTE BY TYPE AND PROCESSING According to our Waste Minimisation Plan and thanks to the effort and commitment of our employees, the waste generated by Inditex is separated at source and collected and managed by legally authorised managers who send the waste to recycling (for paper and cardboard, wood, plastics, metal and other textiles, mainly) and other appropriate processing which allows to recovery and environmentally suitable management.
PERCENTAGE OF WASTE GENERATED IN WEIGHT
WOOD
PLASTIC
TEXTILE WASTE
METAL
OTHER URBAN WASTE
HAZARDOUS WASTE
CARDBOARD AND PAPER
17.8%
3.3%
2.5%
1.4%
12.3%
0.2%
62.5%

Sustainability balance sheet - Sustainable management: indicators
103-1, 103-2, 103-3, 303-1, 303-2, 303-3, 306-1
Associated with our products, we place packing and packaging materials (cardboard and plastic bags, labels, protective elements) on the market that must be adequately managed by authorised managers. Therefore, Inditex adheres to the Packing and Packaging Management Integrated Systems available in the markets where it operates. This means that every Inditex brand pays an authorised not-for-profit managing entity in each country (for instance, in Spain, Ecoembes) the cost involved in the collection and management of waste generated by the stores, ensuring that they are recycled suitably.
As there is no specific collection and management system for textiles globally, it is not possible to assess the volume generated and its suitable management worldwide. Inditex contributes to the creation of a channel which allows the reuse and recycling of products through our Closing the Loop programme.
I WATER CONSUMPTION IN OFFICES, INDITEX FACTORIES, LOGISTICS CENTRES AND OWNED STORESTo obtain water consumption we directly measure and assess the bills of suppliers (public supply networks) of our offices, Inditex factories, logistics centres and owned stores.
This year we have been able to continue our decreasing trend in relative water consumption per garment by 1%, thanks to the efficiency and water saving measures undertaken at our centres. With regard to relative water consumption per sale, a slight increase of 2% is seen compared to 2016. Both increases seen in absolute and relative terms per sale is due to company growth.
WATER CONSUMPTION (m3)*
2014 2015 2016 2017
Water consumption (m3) Relative water consumption (litres/garment)
Relative water consumption (mL/€)
51.41
1,302,539
0.84
60.06
1,088,105
1.07
55.09
1,151,401
0.98
50.49
1,177,082
0.85
(*) The expense of water in all our brands’ own stores during the second half has been estimated from the data of the first half multiplied by two.
(*) The water consumption of logistics centres has been estimated as at January 2018.
Authorised public supply networks provide water to all centres and is used both for consumption and for processes. The highest water consumption is domestic, mainly for cleaning and bathrooms, ensuring its discharge into municipal wastewater systems.
Meanwhile, in industry, water is mainly for the generation of steam and closed-circle industrial refrigeration, where recirculation systems are used. Refrigeration systems are closed cycle as there are no production processes where water is consumed. This allows the estimate that the water discharged is equal to water consumed. Wastewater discharges from all facilities are into sewage networks, always with the required administrative permissions and ensuring compliance with current regulations through periodic analysis. Inditex has no impact on protected habitats.

Sustainability balance sheet - Sustainable management: indicators
103-3, 203-1, AF34
|INDICATORS OF CONTRIBUTION TO COMMUNITY WELFARE
2017 2016 Variation
Corporate Community Investment (CCI) (in euros) 48,129,552 40,042,744 20%
Corporate Community Investment (CCI) / Net profit 1.43% 1.14% 25.53%
FORM OF CONTRIBUTION 2017 (in euros) 2017 (in %) 2016 (in euros) 2016 (in %) Variation
Cash 31,563,507 65% 27,980,509 70% 13%
% management costs
included
Time 2,204,859 5% 1,929,798 5% 14%
In kind 13,812,547 29% 9,584,482 24% 44%
Management costs 548,639 1% 547,955 1% 0%
TOTAL 48,129,552 100% 40,042,744 100% 20%
DRIVER FOR CONTRIBUTION 2017 (in euros) 2017 (in %) 2016 (in euros) 2016 (in %) Variation
Charitable gifts 3,263,743 7% 3,395,686 9% -4%% management
costs excluded
Community Investment 37,020,063 78% 29,245,004 74% 27%
Commercial initiatives in the community 7,297,107 15% 6,854,099 17% 6%
TOTAL 47,580,913 100% 39,494,789 100% 20%
ISSUE ADDRESSED 2017 (in euros) 2017 (in %) 2016 (in euros) 2016 (in %) Variation
Education 7,727,769 16% 6,396,302 16% 21%
% management costs excluded
Health 3,725,615 8% 1,964,536 5% 90%
Economic development 1,735,233 4% 1,246,446 3% 39%
Environment 2,653,158 6% 2,368,334 6% 12%
Arts and Culture 870,516 2% 1,069,238 3% -19%
Social welfare 20,180,975 42% 15,768,106 40% 28%
Emergency relief 10,687,647 22% 10,681,827 27% 0%
TOTAL 47,580,913 100% 39,494,789 100% 20%
LOCATION OF ACTIVITY 2017 (in euros) 2017 (in %) 2016 (in euros) 2016 (in %) Variation
Spain 20,893,381 44% 18,230,407 46% 15%
% management costs
excluded
Europe (excluding Spain) 5,356,042 11% 5,364,428 14% 0%
Americas 11,387,545 24% 10,459,233 26% 9%
Africa 1,215,654 3% 822,485 2% 48%
Asia 8,282,973 17% 4,429,605 11% 87%
Australia 445,318 1% 188,631 1% 136%
TOTAL 47,580,913 100% 39,494,789 100% 20%

Sustainability balance sheet - Sustainable management: indicators
103-3, 201-1, 203-1
SDG 2017 (in euros) 2017 (in %) 2016 (in euros) 2016 (in %) Variation
1. End of poverty 1,459,180 3.1% 1,373,014 3.5% 6%
% costs of management
excluded
2. Zero hunger 221,255 0.5% 498,408 1.3% -56%
3. Health and well-being 6,778,230 14.2% 4,467,632 11.3% 52%
4. Quality education 6,228,674 13.1% 4,755,360 12.0% 31%
5. Gender equality 1,744,451 3.7 1,086,758 2.8% 61%
6. Clean water and sanitation 812,227 1.7% 869,033 2.2% -7%
7. Affordable and clean energy 135,237 0.3% 70,850 0.2% 91%
8. Decent work and economic growth 9,857,883 20.7% 7,433,487 18.8% 33%
9. Industry, innovation and infrastructure 950,353 2.0% 1,069,291 2.7% -11%
10. Reducing inequality 8,630,758 18.1% 6,784,429 17.2% 27%
11. Sustainable cities and communities 1,225,581 2.6% 1,608,358 4.1% -24%
12. Responsible production and consumption 7,453,651 15.7% 6,673,675 16.9% 12%
13. Climate action 109,290 0.2% 65,514 0.2% 67%
14. Underwater life 215,708 0.4% 453,811 1.1% -52%
15. Life of terrestrial ecosystems 153,172 0.3% 492,714 1.2% -69%
16. Peace, justice and strong institutions 470,933 1.0% 590,613 1.5% -20%
17. Partnerships to achieve goals 1,134,331 2.4% 1.201.842 3.0% -6%
TOTAL 47,580,913 100.0% 39,494,789 100.0% 20%
IMPACT INDICATORS2017
(nº of people) 2017 (in %)2016
(nº of people) 2016 (in %) Variation
Number of direct beneficiaries for which impact has been measured 1,527,237 571,577 167%Depth of impact (number of beneficiaries that):
Made a connection as a result of the initiative 89,846 6% 63,692 11% 41%
Made an improvement as a result of the initiative 993,661 65% 415,059 73% 139%
Made a transformation as a result of the initiative 443,730 29% 92,826 16% 378%
Type of impact (number of beneficiaries that):
Experienced a positive change in their behaviour or attitude 604,199 40% 227,878 40% 165%
Developed new skills or an increase in their personal effectiveness 56,312 4% 77,561 14% -27%
Experienced a direct positive impact on their quality of life 1,377,413 90% 452,681 79% 204%
SOCIAL CASH FLOW (in millions of euros) 2017 2016
Net cash received for the sale of products and services 25,336 23,311
Flow received from financial investments 26 21
Cash received for the sale of assets 381 n.a.
Total value added flow 25,743 23,332
Distribution of value added flow
Remuneration to employees for services 3,961 3,643
Tax on profits paid 1,029 798
Return of financial debt -47 53
Dividends delivered to shareholders 2,127 1,871
Corporate Community Investment 48 40
Cash retained for future growth 759 833
Payments made outside the Group for the purchase of goods, raw materials and services 16,088 14,649
Payments made for investments in new productive assets 1,778 1,445
Total distribution of value added flow 25,743 23,332
OUTPUT INDICATORS 2017 2016 Variation
Number of hours spent by employees on CCI activities during working hours 73,457 64,327 14%
Number of CCI projects performed 594 519 14%
Number of garments donated to social causes 3,673,993 2,083,980 76%
Number of direct beneficiaries 1,584,446 1,093,401 45%
Number of community organisations supported 409 367 11%
No. of children with access to education 30,461 46,406 -34%
No. of people receiving professional training 27,311 38,096 -28%
No. of migrants, refugees and displaced persons assisted 306,702 185,262 66%
No. of people receiving medical care 867,671 255,078 240%
No. of jobs created among beneficiaries of CCI projects 12,200 14,290 -15%

Sustainability balance sheet - Sustainable development goals in Inditex’s strategy
SUSTAINABLE DEVELOPMENT GOALS IN INDITEX'S STRATEGY
SUSTAINABLE DEVELOPMENT GOAL Targets PRIORITIES Main related indicator or content Pages
1.2 Contribution to community welfare GRI 203-2 170-184
2.1 Contribution to community welfare GRI 203-2 170-184
2.4 Contribution to community welfare GRI 203-2 170-184
3.3 Our people GRI 403-2 64
3.8 Contribution to community welfare GRI 203-2 170-184
3.9 Socially responsible supply chainWorkers benefiting from health and safety programmes
98-101
3.9 Circularity and efficient use of resources GRI 305-1 248
3.9 Excellence of our products GRI 306-1 251
4.4 and 4.5 Our people GRI 404-1 58
4.4 and 4.5 Contribution to community welfare GRI 203-2 170-184
5.1 Our people GRI 405-1 52, 60, 61, 236
5.1 Socially responsible supply chain GRI 406-1 111, 113
5.1 Corporate governance GRI 405-1 204
5.2 Socially responsible supply chain GRI 414-2 111,113
5.4 Contribution to community welfare GRI 203-2 170-184
5.5 Corporate governance GRI 102-22 201-205
6.3 Excellence of our products GRI 306-1 251
6.3 Circularity and efficient use of resources GRI 303-3 251
6.4 Circularity and efficient use of resources GRI 303-1 251
6.4 Contribution to community welfare GRI 203-2 170-184
7.2 Circularity and efficient use of resources GRI 302-1 245-247
7.2 Contribution to community welfare GRI 203-2 170-184
7.3 Circularity and efficient use of resources GRI 302-4 245-247
7.3 Excellence of our products GRI 302-5 236, 245-247
Indicators selected based on the Guide: Business Reporting on the SDGs: An Analysis of Goals and Targets.
Indicators established by Inditex corresponding to contents present in the GRI standards.
Internal indicators established by Inditex.

Sustainability balance sheet - Sustainable development goals in Inditex’s strategy
SUSTAINABLE DEVELOPMENT GOAL Targets PRIORITIES Main related indicator or content Pages
8.5 Our people GRI 102-28 208
8.5 Socially responsible supply chainWorkers involved in Workers at the Centre programmes
239
8.5 Contribution to community welfare GRI 203-2 170-184
8.5 Corporate governancePolicies formalising Inditex's commitment to decent work
227-228
8.6 Our people GRI 401-1 372
8.6 Contribution to community welfare GRI 203-2 170-184
8.7 Socially responsible supply chain GRI 408-1 111-113
8.7 Socially responsible supply chain GRI 409-1 111-113
8.7 Contribution to community welfare GRI 203-2 170-184
8.8 Socially responsible supply chain GRI 407-1 111-113
9.2 Tax transparency GRI 201-1 253
9.4 Contribution to community welfare GRI 203-1 168,169,252,253
9.4 Excellence of our productsNumber of facilities involved in the Ready to Manufacture Programme
243
9.4 Circularity and efficient use of resources Eco-efficient stores 144,145
10.2 Contribution to community welfare GRI 203-2 170-184
10.3 Our people GRI 102-8 50,51,61,236
10.7 Socially responsible supply chainWorkers benefiting from protection of migrants programmes
102,103
11.2 Contribution to community welfare GRI 203-1 168,169,252,253
12.2 Innovation in supply chain management Identification of suppliers and manufacturers 71,73
12.2 Socially responsible supply chain Suppliers trained 104,105
12.2 Our peopleNumber of internal people dedicated to sustainability
236
12.2 Excellence of our products GRI 301-2 122
12.2 Circularity and efficient use of resources GRI 302-2 249
12.2 Contribution to community welfare GRI 203-2 170-184
12.4 Excellence of our productsChemical substances regulated in The List, by Inditex
243
12.4 Circularity and efficient use of resources GRI 306-1 251
12.5 Excellence of our products GRI 301-2 122
12.5 Circularity and efficient use of resources GRI 306-2 249, 250
12.8 Excellence of our products GRI 417-1 119
12.8 Our clientsNumber of enquiries received through the different customer service channels
45
13.1 Excellence of our products GRI 305-5 144
13.1 Contribution to community welfare GRI 203-2 170-184
14.3 Circularity and efficient use of resources GRI 305-1 248
14.3 Contribution to community welfare GRI 203-2 170-184
15.1 Excellence of our products GRI 304-2 123
15.2 Circularity and efficient use of resources GRI 305-2 248
15.2 Contribution to community welfare GRI 203-2 170-184
16.3 Contribution to community welfare GRI 203-2 170-184
16.5 Corporate governance GRI 205-1 107, 227,228
16.7 Corporate governance GRI 102-24 205,206, 217-219
16.7 Creating value for the shareholdersNumber of requests attended by the Shareholders Office
190
17.16 Socially responsible supply chainCooperation relationships with international entities
80,84,87
17.17 Contribution to community welfare GRI 203-2 170-184
17.17 Socially responsible supply chain Public-private partnerships 83
17.17 Corporate governance Meetings of the Social Advisory Board 229
17.17 Contribution to community welfare GRI 203-2 170-184

Sustainability balance sheet - Tools for dialogue with stakeholders
TOOLS FOR DIALOGUE WITH STAKEHOLDERS
Transparency and dialogue with the stakeholders
The transparent and open manner in which we reach out to our stakeholders is designed to deliver sustainable value creation and is vital to tackling the challenges and opportunities that arise in the course of doing business.
Inditex regularly reviews its stakeholder map as part of a process that involves several areas. Once identified, it classifies and prioritises its stakeholders in a manner that is consistent with its business model. On the basis of this prioritisation, we develop the strategy for engaging with each stakeholder group and put in place the tools for doing
so. These tools are reviewed and updated constantly. To ensure that dialogue with our stakeholders is constant and smooth, it is crucial that the tools and channels match the needs of each stakeholder group and are available to all of the individuals and/or organisations that comprise them.
Below are the specific tools used by Inditex to engage in dialogue with each stakeholder group. Note that there are additional tools that are common to all stakeholder groups (not shown in the table), such as the Annual Report and the company’s corporate website (www.inditex.com).

Sustainability balance sheet - Tools for dialogue with stakeholders
102-21, 102-33, 102-43, 102-44, 103-2
STAKEHOLDER DIALOGUE TOOLS FREQUENCY OBJECTIVES MAIN COMMITMENT
EXAMPLES OF STAKEHOLDERS
OUR PEOPLE
- Ethics Committee - On demand - Motivation of the human team
- Strengthen the commitment to the Code of Conduct and Responsible Practices
- Respect for Human and labour Rights
- Fair and decent treatment
- Store employees
- Office employees
- Logistics centres employees
- Trade unions
- UNI Global Union Agreement
- Constant
- Internal training and promotion
- Constant
- Internal communications
- Constant
- Volunteer programme - Constant
CLIENTS
- Specialised customer care teams
- On demand - Quick response to customer demands
- Customer care segmented by countries and services which allow more customised service
- Provide latest-trend on ethical and responsible products
- Offer the best service and customer care through all of our channels
- Protection of privacy and personal data
- Store and online customer
- Potential customer
- Brick-and-mortar and online stores
- Constant
- Social networks - Constant - Product quality, health and safety team
- Constant
SUPPLIERS
- Clusters of suppliers - Constant - Ensure compliance with the Code of Conduct for Manufacturers and Suppliers
- Promotion and protection of Fundamental Human and labour Rights
- Promotion of sustainable production environments
- Direct suppliers
- Manufacturers
- Workers
- Trade unions
- Ethics Committee - On demand - Commercial and sustainability teams
- Constant
- Global Framework Agreement with IndustriALL
- Constant
COMMUNITY
- Social Advisory Board - Biannual - Achieve maximum reach and impact in the programmes developed
- Contribution to social and economic development
- Commitment to improving global welfare
- NGOs
- Governments and public administrations
- Academic institutions
- Civil society
- Media
- Cooperation with NGOs
- Constant
- Sponsorship and Patronage Committee
- Biannual
SHAREHOLDERS
- General Shareholders' Meeting
- Annual - Consolidation of sustainability indexes
- Corporate transparency
- Social interest and common interest of all shareholders
- Promotion of informed participation
- Institutional investors
- Private investors - Sustainability indexes - Annual
- Investors relations - Constant
ENVIRONMENT
- Social Advisory Board - Biannual - Apply the Strategic Environmental Plan
- Respect for the environment
- Protection of biodiversity
- Sustainable management of resources
- Environmental protection organisations
- Governments
- Commitments with NGOs
- Constant
- Environmental sustainability teams
- Constant

Sustainability balance sheet - Balance of material topics
102-44, 102-46, 102-47, 103-1
Material topics GRI standards Content Boundary* Implication**
OUR CLIENTS
Commitment to costumers GRI 103: Management approach 2016 103-1 to 103-3
Purchasing habits GRI 103: Management approach 2016 103-1 to 103-3
Integration of sales channels GRI 103: Management approach 2016 103-1 to 103-3
Cyber-security and data protection GRI 103: Management approach 2016GRI 418: Customer Privacy 2016
103-1 to 103-3418-1
OUR PEOPLE
Labour practices
GRI 103: Management approach 2016GRI 401: Employment 2016GRI 402: Labor/management relations 2016GRI 403: Occupational health and safety 2016GRI 407: Freedom of association and collective bargaining 2016
103-1 to 103-3401-1 to 401-3402-1403-1 to 403-4407-1
Attracting and retaining talent GRI 103: Management approach 2016GRI 401: Employment 2016
103-1 to 103-3401-1 to 401-3
Human capital development GRI 103: Management approach 2016GRI 404: Training and education 2016
103-1 to 103-3404-1 to 404-3
Diversity and integrationGRI 103: Management approach 2016GRI 405: Diversity and equal opportunity 2016GRI 406: Non-discrimination 2016
103-1 to 103-3405-1 to 405-2406-1
INNOVATION IN THE MANAGEMENT OF THE SUPPLY CHAIN
Transparency and traceability of the supply chain GRI 103: Management approach 2016 103-1 to 103-3
SOCIALLY RESPONSIBLE SUPPLY CHAIN
Respecting labour rights in the supply chain
GRI 103: Management approach 2016GRI 408: Child labor 2016 GRI 409: Forced or compulsory labour 2016 GRI 412: Human rights assessment 2016GRI 414: Social assessment of suppliers 2016
103-1 to 103-3408-1409-1412-1 to 412-2414-1 to 414-2
Responsible purchasing practices GRI 103: Management approach 2016 103-1 to 103-3
Health and safety in suppliers and manufacturers GRI 103: Management approach 2016GRI 414: Supplier social assessment 2016
103-1 to 103-3414-1 to 414-2
BALANCE OF MATERIAL TOPICS
Within the organisation Outside the organisation Within and outside the organisation Direct Indirect
(*) Indicates where the impact occurs, within the organisation, outside it or both.(**) Indicates the organization’s involvement with the impact.
Direct: The organisation is directly linked to the impact.
Indirect: The organisation is linked to the impact through its business relations.

Sustainability balance sheet - Balance of material topics
102-44, 102-46, 102-47, 103-1
Material topics GRI standards Content Boundary* Implication**
EXCELLENCE OF OUR PRODUCTS
Sustainable products GRI 103: Management approach 2016GRI 301: Materials 2016
103-1 to 103-3301-1 to 301-3
Protection of biodiversity GRI 103: Management approach 2016GRI 304: Biodiversity 2016
103-1 to 103-3304-1 to 304-4
Animal welfare GRI 103: Management approach 2016GRI 304: Biodiversity
103-1 to 103-3304-1 to 304-4
Management of chemicals and sustainable processes in manufacture
GRI 103: Management approach 2016GRI 306: Effluents and waste 2016GRI 308: Supplier Environmental Assessment 2016
103-1 to 103-3306-1 to 306-5308-1 to 308-2
Product quality, health and safety GRI 103: Management approach 2016GRI 416: Customer Health Safety 2016
103-1 to 103-3416-1 to 416-2
Product information and labelling GRI 103: Management approach 2016GRI 417: Marketing and labelling 2016
103-1 to 103-3417-1 to 417-3
CIRCULARITY AND EFFICIENT USE OF RESOURCES
CircularityGRI 103: Management approach 2016GRI 301: Materials 2016GRI 306: Effluents and wastes 2016
103-1 to 103-3301-1 to 301-3306-1 to 306-5
Energy and climate changeGRI 103: Management approach 2016GRI 302: Energy 2016GRI 305: Emissions 2016
103-1 to 103-3302-1 to 302-5305-1 to 305-7
Use of waterGRI 103: Management approach 2016GRI 303: Water 2016GRI 306: Effluents and wastes 2016
103-1 to 103-3303-1 to 303-3306-1, 306-3, 306-5
Packaging GRI 103: Management approach 2016GRI 301: Materials 2016
103-1 to 103-3301-1 to 301-3
TAX TRANSPARENCY
Socioeconomic impact on societyGRI 103: Management approach 2016GRI 201: Economic performance 2016GRI 203: Indirect economic impacts 2016
103-1 to 103-3201-1 to 201-4203-1 to 203-2
Transparency and tax contribution GRI 103: Management approach 2016GRI 203: Indirect economic impacts 2016
103-1 to 103-3203-2
CONTRIBUTION TO COMMUNITY WELFARE
Corporate Community InvestmentGRI 103: Management approach 2016GRI 203: Indirect economic impacts 2016GRI 413: Local communities 2016
103-1 to 103-3203-1 to 203-2413-1 to 413-2
Relationship with stakeholders GRI 103: Management approach 2016 103-1 to 103-3
CREATING VALUE FOR THE SHAREHOLDERS
Regulatory compliance and responsible practices
GRI 103: Management approach 2016GRI 206: Anti-competitive behaviourGRI 307: Environmental compliance 2016GRI 419: Socioeconomic compliance 2016
103-1 to 103-3206-1307-1419-1
CORPORATE GOVERNANCE
Corporate governance GRI 103: Management approach 2016GRI 415: Public Policy 2016
103-1 to 103-3415-1
Risk management and control systems GRI 103: Management approach 2016 103-1 to 103-3
Corruption and bribery
GRI 103: Management approach 2016GRI 205: Anti-corruption 2016GRI 415: Public policy 2016GRI 419: Socioeconomic compliance 2016
103-1 to 103-3205-1 to 205-3415-1419-1
The following organizations, among others, have benn consulted for the definition of material topics in 2017:
Inditex Social Advisory Board, AECA, Baptist World Aid, Caritas Española, Centre for Business and Public Sector Ethics de Cambridge, COGAMI (Confederacion Galega de Persoas con Discapacidade), Cruz Roja Española, Every Mother Counts, Fundación Seres. Sociedad y Empresa Responsable , Medicus Mundi, University of Santiago de Compostela, The Humane Society of the United States,the International Labour Organization (ILO) Oxfam Intermón, Sustainable Apparel Coalition, Sustainalytics.