in the western balkans - british council · in the western balkans report for the british council...
TRANSCRIPT

STUDY OF THE CHALLENGES THAT HINDER MSME DEVELOPMENT IN THE WESTERN BALKANSReport for the British Council and Swedish Institute
www.britishcouncil.org

Country AuthorsNigel Culkin and Richard SimmonsEnterprise and Business Development University of Hertfordshire
STUDY OF THE CHALLENGES THAT HINDER MSME DEVELOPMENT IN THE WESTERN BALKANSReport for the British Council and Swedish Institute

5Western Balkans Entrepreneurial Capability Report
CONTENTS
TERMS OF REFERENCE, APPROACH AND TARGET OUTCOMES . . . . . . . . . . . . . . . . . . . . . .9IN A NUTSHELL . . . . . . . . . . . . . . . . . . . . . . . . . . . . . . . . . . . . . . . . . . . . . . . . . . . . . . . . . . . . . . . . . . 11SUMMARY OF OBSERVATIONS . . . . . . . . . . . . . . . . . . . . . . . . . . . . . . . . . . . . . . . . . . . . . . . . . . .13OUR FINDINGS . . . . . . . . . . . . . . . . . . . . . . . . . . . . . . . . . . . . . . . . . . . . . . . . . . . . . . . . . . . . . . . . . .15
The Brief . . . . . . . . . . . . . . . . . . . . . . . . . . . . . . . . . . . . . . . . . . . . . . . . . . . . . . . . . . . . . . . . . . . . . . .15Study Components . . . . . . . . . . . . . . . . . . . . . . . . . . . . . . . . . . . . . . . . . . . . . . . . . . . . . . . . . . . . .15
Economic and Political Background . . . . . . . . . . . . . . . . . . . . . . . . . . . . . . . . . . . . . . . . . . . . . . . . . . . . . . . . . . . . 15Appetite for Entrepreneurship in the Western Balkans . . . . . . . . . . . . . . . . . . . . . . . . . . . . . . . . . . . . . . . . . . . 16Wider Societal / Economic Context. . . . . . . . . . . . . . . . . . . . . . . . . . . . . . . . . . . . . . . . . . . . . . . . . . . . . . . . . . . . . 30Chart 13. Support needs by country . . . . . . . . . . . . . . . . . . . . . . . . . . . . . . . . . . . . . . . . . . . . . . . . . . . . . . . . . . . . 31
Access To Finance . . . . . . . . . . . . . . . . . . . . . . . . . . . . . . . . . . . . . . . . . . . . . . . . . . . . . . . . . . . . . .32Support Mechanisms . . . . . . . . . . . . . . . . . . . . . . . . . . . . . . . . . . . . . . . . . . . . . . . . . . . . . . . . . . .36Conclusions . . . . . . . . . . . . . . . . . . . . . . . . . . . . . . . . . . . . . . . . . . . . . . . . . . . . . . . . . . . . . . . . . . .36
CASE STUDIES . . . . . . . . . . . . . . . . . . . . . . . . . . . . . . . . . . . . . . . . . . . . . . . . . . . . . . . . . . . . . . . . . .39CASE STUDY 1. THEMED WEDDING COMPLEX . . . . . . . . . . . . . . . . . . . . . . . . . . . . . . . . . . . . . .39CASE STUDY 2. OPENING GLOBAL MARKETS . . . . . . . . . . . . . . . . . . . . . . . . . . . . . . . . . . . . . . .40CASE STUDY 3. BUILDING A LEADING EDGE CONSULTANCY . . . . . . . . . . . . . . . . . . . . . . . . .41CASE STUDY 4. BRINGING “BEST PRACTICE” TO INSURANCE CLAIMS MANAGEMENT . . .42POLITICAL BACKGROUND . . . . . . . . . . . . . . . . . . . . . . . . . . . . . . . . . . . . . . . . . . . . . . . . . . . . . . . .43
The Western Balkans Nations . . . . . . . . . . . . . . . . . . . . . . . . . . . . . . . . . . . . . . . . . . . . . . . . . . . .43Geo-Political Focus on Stability . . . . . . . . . . . . . . . . . . . . . . . . . . . . . . . . . . . . . . . . . . . . . . . . . .43
ECONOMIC BACKGROUND . . . . . . . . . . . . . . . . . . . . . . . . . . . . . . . . . . . . . . . . . . . . . . . . . . . . . . .45Rent-Seeking Rather Than Entrepreneurial Business Environment . . . . . . . . . . . . . . . . . . .46
Predatory Entrepreneurship and Economic Rent Extraction . . . . . . . . . . . . . . . . . . . . . . . . . . . . . . . . . . . . . . 46Major Institution Interventions . . . . . . . . . . . . . . . . . . . . . . . . . . . . . . . . . . . . . . . . . . . . . . . . . . .47A 15-Year Roller Coaster . . . . . . . . . . . . . . . . . . . . . . . . . . . . . . . . . . . . . . . . . . . . . . . . . . . . . . . .47
ECONOMIC DEVELOPMENT NEEDS FOR ENTREPRENEURS AND SMALL AND MEDIUM-SIZED FIRMS . . . . . . . . . . . . . . . . . . . . . . . . . . . . . . . . . . . . . . . . . . . . . . . . . . . . . .49
A Sustainable Development Model . . . . . . . . . . . . . . . . . . . . . . . . . . . . . . . . . . . . . . . . . . . . . . .49Small Firm / Entrepreneurial Success Factors . . . . . . . . . . . . . . . . . . . . . . . . . . . . . . . . . . . . .50Products and Strategic vs Tactical Marketing . . . . . . . . . . . . . . . . . . . . . . . . . . . . . . . . . . . . . .50Foreign Direct Investment Created Anchor Firms In The Western Balkans . . . . . . . . . . . .51Alternative Anchors for Innovative Entrepreneurship . . . . . . . . . . . . . . . . . . . . . . . . . . . . . . .53Entrepreneurial Success Conditions . . . . . . . . . . . . . . . . . . . . . . . . . . . . . . . . . . . . . . . . . . . . . .56
LOOKING TO THE FUTURE . . . . . . . . . . . . . . . . . . . . . . . . . . . . . . . . . . . . . . . . . . . . . . . . . . . . . . .59Major Challenges . . . . . . . . . . . . . . . . . . . . . . . . . . . . . . . . . . . . . . . . . . . . . . . . . . . . . . . . . . . . . . .59Raising The Status of Entrepreneurship . . . . . . . . . . . . . . . . . . . . . . . . . . . . . . . . . . . . . . . . . . .59Growing Entrepreneurs into Businesspeople . . . . . . . . . . . . . . . . . . . . . . . . . . . . . . . . . . . . . .60
Becoming a Businessperson who can Create Business Success . . . . . . . . . . . . . . . . . . . . . . . . . . . . . . . . . . 61Constructing a Program To Improve the Skills of Aspiring Entrepreneurs . . . . . . . . . . . . .61
“One Size Fits Nobody” … How do I know which size fits me? . . . . . . . . . . . . . . . . . . . . . . . . . . . . . . . . . . . . . . 61Building Individual Support Programs . . . . . . . . . . . . . . . . . . . . . . . . . . . . . . . . . . . . . . . . . . . . . . . . . . . . . . . . . . 63
The Entrepreneurial Support Space . . . . . . . . . . . . . . . . . . . . . . . . . . . . . . . . . . . . . . . . . . . . . .66The “Entrepreneurial University” . . . . . . . . . . . . . . . . . . . . . . . . . . . . . . . . . . . . . . . . . . . . . . . . . . . . . . . . . . . . . . . 67
Turning Aspiration into Reality . . . . . . . . . . . . . . . . . . . . . . . . . . . . . . . . . . . . . . . . . . . . . . . . . . .67Three Possible Deliverables . . . . . . . . . . . . . . . . . . . . . . . . . . . . . . . . . . . . . . . . . . . . . . . . . . . . .71
SUMMARY SUGGESTIONS / DELIVERABLES . . . . . . . . . . . . . . . . . . . . . . . . . . . . . . . . . . . . . . .73REFERENCES . . . . . . . . . . . . . . . . . . . . . . . . . . . . . . . . . . . . . . . . . . . . . . . . . . . . . . . . . . . . . . . . . . . .75
About The Report Authors . . . . . . . . . . . . . . . . . . . . . . . . . . . . . . . . . . . . . . . . . . . . . . . . . . . . . . .80

6 7Western Balkans Entrepreneurial Capability Report
LIST OF TABLESTable 1. Sector preferences . . . . . . . . . . . . . . . . . . . . . . . . . . . . . . . . . . . . . . . . . . . . . . . . . . . . .18Table 2. Entrepreneurial type classification. . . . . . . . . . . . . . . . . . . . . . . . . . . . . . . . . . . . . . . .19Table 3. Sectoral split of entrepreneurial aspirations (number of observations) . . . . . . .22Table 4. Aspiration in opportunity-driven sectors . . . . . . . . . . . . . . . . . . . . . . . . . . . . . . . . . .26Table 5. Self-employment in the Western Balkans . . . . . . . . . . . . . . . . . . . . . . . . . . . . . . . . . .29Table 6. Estimated number of Western Balkans entrepreneurs per year . . . . . . . . . . . . .30Table 7. Support and training needs . . . . . . . . . . . . . . . . . . . . . . . . . . . . . . . . . . . . . . . . . . . . . .30Table 8. Small firm financing constraints (firm data) . . . . . . . . . . . . . . . . . . . . . . . . . . . . . . . .33Table 9. Seed capital estimate . . . . . . . . . . . . . . . . . . . . . . . . . . . . . . . . . . . . . . . . . . . . . . . . . . .35Table 10. Overall annual financing need estimates for small and medium-sized firms in the Western Balkans . . . . . . . . . . . . . . . . . . . . . . . . . . .35Table 11. USD 2011 constant price per capita income for Western Balkan countries . .45Table 12. Western Balkans trade deficits as a percentage of GDP . . . . . . . . . . . . . . . . . . .45Table 13. Consumption expenditure in millions 2010 constant US dollars . . . . . . . . . . . .45Table 14. Gross capital formation in millions 2010 constant US dollars . . . . . . . . . . . . . . .46Table 15. Sample cash flow presentation to assess economic sustainability . . . . . . . . . .49Table 16. Relative investment flows from Germany to Poland and Serbia . . . . . . . . . . . . .51Table 17. Some suggested guiding principles . . . . . . . . . . . . . . . . . . . . . . . . . . . . . . . . . . . . .56
LIST OF CHARTSChart 1. Age distribution . . . . . . . . . . . . . . . . . . . . . . . . . . . . . . . . . . . . . . . . . . . . . . . . . . . . . . . .17Chart 2. Educational background of aspiring entrepreneurs in the Western Balkans . . .17Chart 3. Entrepreneurial aspiration . . . . . . . . . . . . . . . . . . . . . . . . . . . . . . . . . . . . . . . . . . . . . . .20Chart 4. Economic ecosystems . . . . . . . . . . . . . . . . . . . . . . . . . . . . . . . . . . . . . . . . . . . . . . . . . .21Chart 5. Main sectors across the region . . . . . . . . . . . . . . . . . . . . . . . . . . . . . . . . . . . . . . . . . .23Chart 6. “Other” categories across all countries (observations) . . . . . . . . . . . . . . . . . . . . .23Chart 7. Entrepreneurial sector preferences across countries . . . . . . . . . . . . . . . . . . . . . .24Chart 8. Divergence between countries . . . . . . . . . . . . . . . . . . . . . . . . . . . . . . . . . . . . . . . . . .25Chart 9. Age distribution by industry . . . . . . . . . . . . . . . . . . . . . . . . . . . . . . . . . . . . . . . . . . . . .26Chart 10. Employment status of the survey sample . . . . . . . . . . . . . . . . . . . . . . . . . . . . . . . .27Chart 11. Aspirational employment status . . . . . . . . . . . . . . . . . . . . . . . . . . . . . . . . . . . . . . . . .27Chart 12. Entrepreneurial density . . . . . . . . . . . . . . . . . . . . . . . . . . . . . . . . . . . . . . . . . . . . . . . .28Chart 13. Support needs by country . . . . . . . . . . . . . . . . . . . . . . . . . . . . . . . . . . . . . . . . . . . . . .31Chart 14. Financing needs . . . . . . . . . . . . . . . . . . . . . . . . . . . . . . . . . . . . . . . . . . . . . . . . . . . . . . .32Chart 15. Small firm financing constraints (firm data) . . . . . . . . . . . . . . . . . . . . . . . . . . . . . . .32Chart 16. Bank lending criteria in Serbia . . . . . . . . . . . . . . . . . . . . . . . . . . . . . . . . . . . . . . . . . .33Chart 17. Collateral required for small firm loans. . . . . . . . . . . . . . . . . . . . . . . . . . . . . . . . . . .34Chart 18. Reliance on support from friends and family . . . . . . . . . . . . . . . . . . . . . . . . . . . . .36Chart 19. The entrepreneur’s world . . . . . . . . . . . . . . . . . . . . . . . . . . . . . . . . . . . . . . . . . . . . . .50Chart 20. European business hot spots . . . . . . . . . . . . . . . . . . . . . . . . . . . . . . . . . . . . . . . . . . .51Chart 21. Map of 2016 German foreign direct investment flows . . . . . . . . . . . . . . . . . . . . .52Chart 22. 2016 direct investment flows into the Western Balkans (USD millions) . . . . . .52Chart 23. Internal regional capital flows 2016 (USD millions) . . . . . . . . . . . . . . . . . . . . . . . .53Chart 24. Entrepreneurial support mechanisms . . . . . . . . . . . . . . . . . . . . . . . . . . . . . . . . . . .55Chart 25. Western Balkans support context . . . . . . . . . . . . . . . . . . . . . . . . . . . . . . . . . . . . . . .56Chart 26. Potential issues facing entrepreneurs . . . . . . . . . . . . . . . . . . . . . . . . . . . . . . . . . . .62Chart 27. Stylised health check process . . . . . . . . . . . . . . . . . . . . . . . . . . . . . . . . . . . . . . . . . .63Chart 28. Support preferences for entrepreneurs . . . . . . . . . . . . . . . . . . . . . . . . . . . . . . . . .63Chart 29. Support mechanisms . . . . . . . . . . . . . . . . . . . . . . . . . . . . . . . . . . . . . . . . . . . . . . . . . .64Chart 30. Perceived barriers to success . . . . . . . . . . . . . . . . . . . . . . . . . . . . . . . . . . . . . . . . . .65Chart 31. Perceived barriers to success (2) . . . . . . . . . . . . . . . . . . . . . . . . . . . . . . . . . . . . . . .65Chart 32. Percentage expressing needs for particular support . . . . . . . . . . . . . . . . . . . . .66Chart 33. Proposed sales skills module . . . . . . . . . . . . . . . . . . . . . . . . . . . . . . . . . . . . . . . . . . .68Chart 34. Proposed marketing skills module . . . . . . . . . . . . . . . . . . . . . . . . . . . . . . . . . . . . . .68Chart 35. Proposed module on access to finance . . . . . . . . . . . . . . . . . . . . . . . . . . . . . . . . .69Chart 36. Entrepreneurial process . . . . . . . . . . . . . . . . . . . . . . . . . . . . . . . . . . . . . . . . . . . . . . .69Chart 37. The nurturing role of the entrepreneurial university . . . . . . . . . . . . . . . . . . . . . .70

9Western Balkans Entrepreneurial Capability Report
TERMS OF REFERENCE, APPROACH AND TARGET OUTCOMES
This study was commissioned by the British Council and the Swedish Institute to establish the need for a youth entrepreneurship programme in the Western Balkans, and design a roadmap to establish one if necessary. It follows and expands a European Union (EU) process designed to encourage youth involvement through an annual youth participation conference. In 2017, this initiative highlighted the need to support youth entrepreneurship through training, improved institutional support and access to finance (DG Enlargement, 2017).
The objective of this study is to identify training and development needs and propose an appropriate delivery framework to help young entrepreneurs build quality businesses. It takes account of the local entrepreneurial and small firm landscape. It emphasises capability and linkage building, recognising that the region has received modest amounts of foreign direct investment in the past ten years, mostly used to enhance productivity and build business capital. These modest levels of investment have reduced the important supply chain pull factor that large foreign direct anchor investments can often give to entrepreneurs (Gereffi, 2014) and micro, small and medium-sized enterprises (MSMEs).
There is wider evidence that ‘best in class’ well-managed supply chains can support entrepreneurial growth in firms by providing:
assured customer orders (increasing certainty, which helps in raising external finance); community, encouragement and mentoring; innovation support; implicit protection in patent and intellectual property disputes; capability gap-filling through introducing appropriate partners; and encouragement to build open, sharing cultures.
Other entrepreneurial settings that have not been involved in such supply chains (such as some Silicon Valley disrupters) have sometimes benefited from ‘smart’ venture capital instead, which has provided some of these features. Evidence suggests, however, that smart venture capital has very limited reach or impact in the Western Balkans. The program set out in this report aims to incorporate initiatives to fill these gaps.
In this paper, economic growth and rising living standards are seen through the eyes of an individual entrepreneur, in a bottom up rather than top down approach. We aim to establish practical mechanisms, and build entrepreneurial competencies to manage real-world challenges. The shape of the delivery process is especially important in this, and needs to take into account the specific local challenges in the Western Balkans, and also that ‘one size does not fit all’. It is therefore designed to be tailored to specific entrepreneurial needs across the region.
The resulting vision focuses on building economically-sustainable entrepreneurial ventures through a program of action learning initiatives developed specifically for the Western Balkans. The aim is to work in partnership with UK-based resources to deliver a positive international multiplier effect to local initiatives. Our focus on young entrepreneurs allows us to recognise the very special qualities young people can bring to the entrepreneurial process and help to support and unlock these by blending formal education, action learning and mentoring into a cohesive delivery program (Lackéus, 2015).
By supporting improved and flexible entrepreneurial education, we hope to create sustainable value-adding businesses that can trade internationally and will contribute towards achieving World Bank (2017d) Sustainable Development Goals SDG 4 (Quality Education), SDG 8 (Decent Work and Economic Growth) and SDG 9 (Industry Innovation and Infrastructure). These goals are in turn linked to the UK Prosperity Fund (UK Government, 2017), which is linked to the National Security Strategy and
10 11Terms of Reference, Approach and Target Outcomes Western Balkans Entrepreneurial Capability Report
IN A NUTSHELL
The Western Balkans is a region that is rich in contrasts, recovering from the Balkan Wars of the 1990s and looking for a better future. Some characteristics are common across the region, such as the importance placed on family and friends. Each state, however, is different and has its own aspirations and hopes. The 605 respondents in this study suggest that these aspirations are to build a better future for themselves and their families, to rebuild their nations, and to work collaboratively across borders. For example, one of our case study subjects was a female entrepreneur from FYR Macedonia who wanted to help forge an international business working with rural artisans in FYR Macedonia and Kosovo.
Most of our entrepreneurs saw themselves as self-employed rather than as entrepreneurs or businesspeople. The word “entrepreneur” still has some unfortunate connotations with wealthy and well-connected individuals, able to profit from their position or perhaps linked to less legal parts of the shadow economy1. Supporting and raising levels of entrepreneurship requires an improved understanding of the concept, partly through teaching in schools and colleges, and partly through well-placed media coverage linked to successful case studies and perhaps awards programs.
Entrepreneurs in our sample were most likely to be between 25 and 45, using their skills and knowledge to improve their lot and provide for their families. There were few aspiring Bill Gates, Steve Jobs, or Larry Pages. Most wanted to open a business in retail, car repair, personal services (e.g. hairdressing) or, if qualified, professional services. There were some IT start-ups, especially in FYR Macedonia and Serbia but these were the exception, and by their very nature may benefit from a dedicated and targeted initiative.
These entrepreneurs may have big dreams, but are most concerned about putting bread on the table. An overriding theme in the case studies was the desire for safety and moderate risk. To succeed, entrepreneurs need to be able to assess and take risks, but their aspirations are often more limited. It is therefore important to build confidence, community and competences to enable entrepreneurs to develop the risk-taking capacity to seize opportunities, as many expressed a desire to do.
Other countries closer to the main European Union centres of economic activity (e.g. Poland) have benefited from higher levels of foreign direct investment than the Western Balkans, especially supply chain-related investment. The Fiat investment in the former Yugo car factory in Serbia is notable for its singularity and importance. Complex supply chain investments build their own supply chains, help transfer technology, increase innovation, help implement pan-European quality and regulatory standards and give entrepreneurs business and connections to help them raise finance. The Western Balkans, partly as a result of location and partly as a result of the Balkan Wars, missed out on the great post-Soviet Union reordering of European (especially automotive) supply chains. What we know is that, in terms of supply chain deepening flows from the EU (similar to that of Germany to Poland) there appears to be some modest levels reaching Serbia (in value and as a percentage of GDP). We also know that Russia has invested primarily in energy assets. This leaves China.
China has stated that Serbia is a strategic “waypoint” in their global “One Belt One Road” initiative, which are expected to grow over time. The challenge is to ensure that there is a “network effect” as the new infrastructure is implemented; and that Serbia in particular, and the rest of the region in general, does not become a rapid transit corridor for Chinese goods to reach Northern European markets. Together these different interests and range of historic ties locate the Western Balkans in a both interesting and somewhat challenging position, where it needs to balance competing interests from three great power blocks and at the same time use these as a spur to economic development.
1 The shadow economy is defined as all market-based legal production activities that are deliberately concealed from public authorities to evade payment of income, value added, or other taxes or social security contributions; certain legal labour market standards (e.g. minimum wages, maximum working hours and/or safety standards); and particular administrative procedures, such as completing statistical questionnaires or administrative forms (Schneider, 2010)
Strategic Defence and Security Review (UK Government, 2015) and the Department for International Development Strategy (DFID, 2017) aims 3, 4, 5, 6 and 9.This report draws on three sources: -
1. A survey of potential entrepreneurs, to establish and understand their needs;2. A review of the available statistical data to try to establish which economic environments
support entrepreneurship; and3. The learning and experience gained from other projects and academic literature, to avoid
repeating mistakes.
The output is a set of recommendations that could form an action plan with associated delivery packages, embedded into and using local institutional frameworks wherever possible, proposing new business infrastructure where appropriate and suggesting partnership opportunities with UK economic actors and institutions.

12 13In A Nutshell Western Balkans Entrepreneurial Capability Report
SUMMARY OF OBSERVATIONS
No Observation
1
Under 25s lack entrepreneurship perceptions and aspirations
One of our interviewees described entrepreneurship as for “big fish” who have at least one of money, business connections, political influence and links to the informal economy. It is risky, demands capital and can result in failure. Many people see that safer options may be more attractive, although potentially far less rewarding financially.
2
Aspirant entrepreneurs’ educational background differs by country
The differences in aspirant entrepreneur educational background across the region may be a reflection of a known ‘brain drain’ (Zeneli, 2017) that is drawing graduates away from some countries and also engaging IT specialists to provide lower cost outsourced services for EU-based firms.
3
There is a large body of involuntary entrepreneurs
Not all entrepreneurs are trying to build a “Google”. The evidence suggest that about three quarters just want to earn a stable living. These entrepreneurs tend to be focused on sectors with low barriers to entry and exit. This raises three questions:1. How can we help these aspiring entrepreneurs to improve their chances of building a long-term stable business?2. How much do we understand about the needs of these entrepreneurs?3. Can we help move some of these entrepreneurs towards opportunity-seeking?
4
Ambition matters but Western Balkans entrepreneurs sense a ceiling
Ambition is one of the key ingredients in delivering growth. There is, however, a lack of belief that an entrepreneur from the Western Balkans could globalise their product and achieve worldwide success.
5Support measures need to align to local ecosystems
Each business is different, and there is no “one size fits all”. Support measures will need to be adapted to fit each local ecosystem.
6
“Most popular” sectors are similar across countries
The most popular sectors—retail, car repair, personal services and agriculture—are similar across all the countries of the Western Balkans. Beyond those sectors, there is a wide range of less popular sectors.
7
Age matters. Aspirations change with age and education
Not all aspiring entrepreneurs are the same. Age and education matter, and drive different aspirations and risk appetite. Both these factors need to be taken into account in targeting initiatives.
8
Opportunity-driven entrepreneurs are mostly not IT-focused
There is a perception that opportunity-driven entrepreneurship is focused on the hi-tech, internet and web markets. This is largely not the case in the Western Balkans, although FYR Macedonia has a higher level of aspiration in this area.
9
Most survey respondents aspire to be self-employed, not entrepreneurs
The desire to be self-employed, rather than running a business or being an entrepreneur is striking. This may reflect a lack of confidence or ambition, or perhaps the views of survey respondents on businesspeople and entrepreneurs. It means that any entrepreneurship program needs to account for the number who aspire to self-employment.
10
Realised entrepreneurship rates differ by country
There are similar aspirations in terms of sector, but realised entrepreneurship, as measured by limited liability company formation, differs by country. This may be partly because of choices about self-employment and company creation in different countries, although there is no specific evidence for this.
We know that local GDP per capita levels are significantly below other former Eastern Bloc states, and a fraction of those in Western Europe. Capital accumulation opportunities are therefore restricted, and availability of seed capital and early stage finance are key. Lenders facing regulatory capital requirements that penalise small business lending (in comparison to, say, residential mortgage lending) price small business loans accordingly. An overwhelming majority of small business owners find these loans too expensive, so tend to rely on friends and family for finance. There is evidence that this constraint is hurting companies and restricting growth.
Even if a loan can be obtained, it often needs to be matched or exceeded by personal collateral. Banks do not have experience of lending to start-ups and early-stage businesses. Automation and global regulatory changes means that small firms are often dealt with by retail, rather than corporate, teams within the bank. In many cases, this restricts lending decisions to credit scores and remote loan officers. The days of the local bank manager, with wide local business knowledge, acting as lending officer for start-ups are largely gone. There is a gap between the lending decision and forward-looking local knowledge, and collateral is seen as the solution to this.
Facing these challenges, aspiring entrepreneurs have asked for help. They want support to connect them to markets and customers, improve their management skills, build the required technical competence to deal with the regulatory environment and finally, to obtain finance. They also want this support delivered flexibly, by combining formal training, mentoring and building collaborative networks. All these factors interact to create an opportunity to establish an integrated set of complementary initiatives that could address each issue but also add something extra, in the form of an entrepreneurial environment. This would foster start-ups, accelerate growth, and help connect entrepreneurs and markets. Program support would also lead to more sympathetic lending officer consideration.
This report brings together the testimony of 605 aspiring entrepreneurs, four in-depth case studies, experience from previous start-up and growth stage companies and knowledge from a wide variety of academic and public resources. We join the 605 aspiring entrepreneurs in thanking the British Council and Swedish Institute for making it possible for their voices to be heard. We hope this report will act as an inspiration to formulate and implement some simple initiatives that can be integrated and delivered by existing institutions to help hopeful entrepreneurs in the region.
14 15Summary of Observations Western Balkans Entrepreneurial Capability Report
OUR FINDINGS
The Brief
The British Council commissioned the University of Hertfordshire to work on a study with the following brief:
The Swedish Institute and the British Council (hereinafter jointly referred to as: the ‘Clients’) are currently preparing programmes that will target young leaders in various fields such as responsible business and entrepreneurship. The programmes are designed to strengthen the capacity of the participants by sharing concepts, practical tools and skills…..Programmes will also focus on strengthening the competitiveness of small and medium sized enterprises in the Western Balkans….The focus … is … a pre-study designed to support the Swedish Institute and the British Council in designing and planning a leadership programme in the Western Balkans. …. There is a need for better understanding of the context and the challenges that hinder the development of small and medium sized enterprises.
Study Components
This study combines three strands to provide a view of the current landscape, and to identify some of the key themes and suggest ways in which these could be addressed in the Western Balkans. The three strands in the report are:
Economic and Political BackgroundFirst, we review the general political and economic background of the Western Balkans. This area is a long way from Europe’s main economic centres (the so-called Golden Triangle of the Rhine, Paris and London, and the Spanish and North Italian “hot spots”). The region was also late entering the post-1990 economic integration of Central and Eastern Europe because of the Balkan Wars (Gapinski et al., 1989). These two factors have meant the region has had less foreign direct investment (Dunford et al., 2013; Eichengreen and Gupta, 2016; Kurtovic, 2014). There is a general agreement (known as the Washington Consensus) that economic regeneration emerges through (i) privatisation, the reduction of the state sector and liberalisation of regulations, (ii) improvements in governance and reduction in the informal economy, (iii) macro-economic stabilisation through reducing public sector deficits, (iv) foreign direct investment revitalising, retooling and reskilling the private sector to make it globally competitive (and where appropriate, include it in global supply chains), and (v) relatively free trade through membership of the World Trade Organisation and possibly the European Union’s Single Market (Lin, 2015; Williamson, 2005).
The adjustment programs sponsored by the European Union to help candidate states accede to the European Union aim to combine economic reforms mirroring the Washington Consensus with regulatory alignment to the European Union, through the adoption of the aquis communitaire. Structural adjustment to enter the European Union is much easier for a European Union Candidate Accession State if large European companies establish new operations or revitalise ageing ones in the region. The requires adapting, updating and integrating operations and linking them to the wider company. This integration process ensures that supply chain components follow European standards and practices, and that working practices, plant and machinery are updated to meet current competitive practice. It also provides a sales outlet for products. These operations act as regenerative loci, building their own supply chains and nurturing small firms and entrepreneurs who work with them.
The Fiat investment in the Serbian Yugo factory is an excellent example of this. However, none of the major German automotive companies has moved into the region. Contrast this with the impact of these companies in Poland or the earlier Volkswagen investment in Seat. Major supply chain players act as
No Observation
11
There is a clear set of support needs
The main needs were around: 1. Finding and expanding a potential customer base and targeting marketing to support this;2. Developing management and business skills;3. Understanding technical areas such as regulations;4. Improving skills; and5. Obtaining finance.
12Finding connections to markets is an entrepreneurial priority
Finding customers is a priority, and assistance is sought to build customer links and networks.
13Entrepreneurs want support to develop their management skills
Respondents felt they needed to improve their management skills. This might be an opportunity to help transform aspirations from self-employment to running businesses.
14Small firms feel constrained financially
Small firms feel locked-out of finance, mainly because of perceptions of high interest rates, complex loan application processes and requirements for collateral.
15
There is a gap in seed and early stage financing provision
There is general recognition that young companies are financially constrained, but may also offer the most rapid growth. Some measures have been established to help ease the flow of funds, such as the EU COSME guarantee framework, but these are small compared with the need.
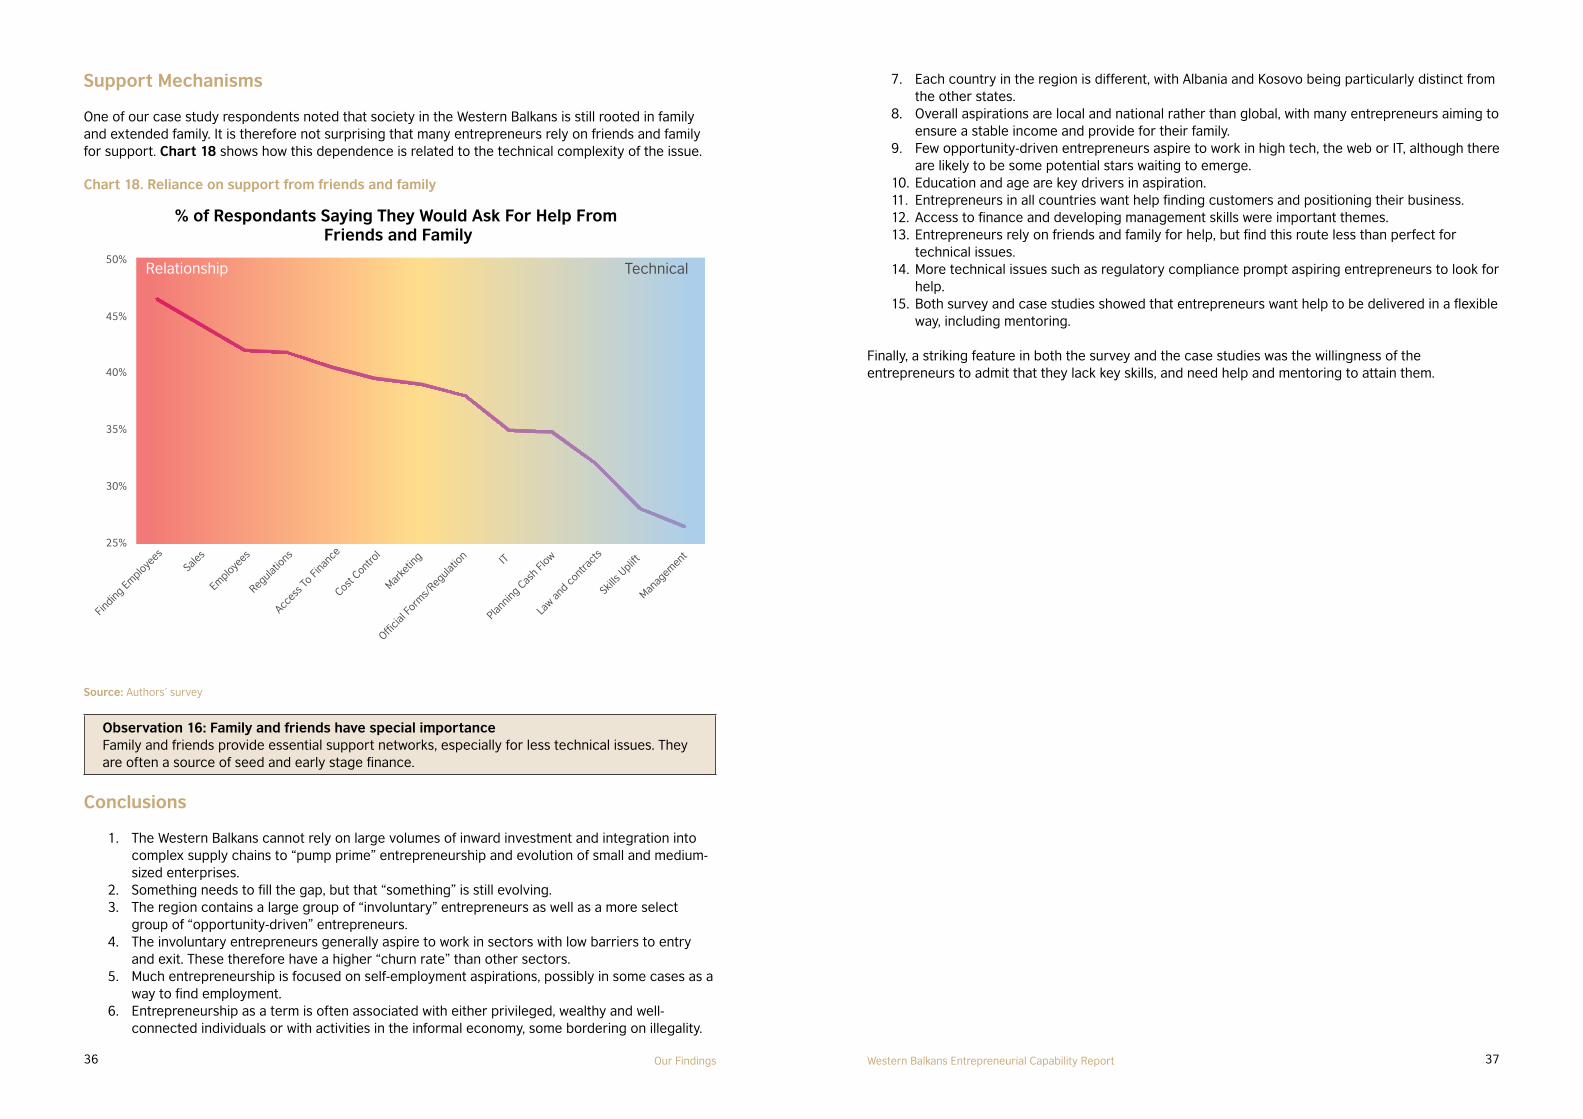
16Family and friends have special importance
Family and friends provide essential support networks, especially for less technical issues. They are often a source of seed and early stage finance.

16 17Our Findings Western Balkans Entrepreneurial Capability Report
Chart 1. Age distribution
Age Distribution By Country
60%
50%
40%
30%
20%
10%
0%
Under 2525-34
35-44
SerbiaBosnia and HerzegovinaMontenegroMacedoniaAlbaniaKosovo
West Balkans Entrepreneurship Survey AgeDistribution
35-4439%
Under 2514%
25-3447%
Source: Authors’ survey
Observation 1: Under 25s lack entrepreneurship perceptions and aspirations One of our interviewees described entrepreneurship as for “big fish” who have at least one of money, business connections, political influence and links to the informal economy. It is risky, demands capital and can result in failure. Many people see that safer options may be more attractive, although potentially far less rewarding financially.
There were significant inter-country differences in the educational background of aspiring entrepreneurs. The sample of 605 entrepreneurs—100 per country with 105 in FYR Macedonia—is small in comparison to the overall population. As with any study, there are risks in building the sample. The sample was sourced from previous telephone surveys in which respondents expressed an interest in entrepreneurship, plus a review of the commercial register and referrals from respondents. The prospects were additionally screened so all potential entrepreneurs were under 45, to fit the brief. Four individual entrepreneurs were chosen to participate in further in-depth discussions. They form the basis of the case studies in this report.
Chart 2 shows that the education level of aspiring entrepreneurs rises as we move south. The sample results for Kosovo did not include anyone whose highest level of education was high school, so the numbers from there need to be viewed with caution.
Chart 2. Educational background of aspiring entrepreneurs in the Western Balkans
SerbiaBosnia
and Herzegovina MontenegroMacedonia
AlbaniaKosovo
Postgraduate
Educational Profile - Country Split
Graduate
Technical
School Leaver
60%
70%
50%
40%
30%
20%
10%
0%
Graduate
39%
West Balkans Split by Educational Level
Postgraduate16%
Technical14%
School Leaver31%
Source: Authors’ survey
engines of innovation and growth, not only for themselves, but also for all around them. This is partly because of their economic power, partly by their power to enforce standards and improvements in product and partly through their ability to nurture and support small firm innovation clusters.
All of this is largely missing in the Western Balkans, as a result of historical accident, geographic location and timing. Once a supply chain is set (e.g. in Poland), it will take a major economic event to dislodge it. Some commentators hope that the One Belt, One Road initiative in China could support a transformation in north–south European flows, but it is not yet clear if this will be the case.
Any new initiatives therefore need to start from the current position, with relatively little foreign direct investment from supply chain anchor companies. We have to ask what is lost by the absence of these companies and how can this gap be closed.
Appetite for Entrepreneurship in the Western BalkansThe second strand of this report views issues from another perspective. Through a survey and interviews, we explored the views of 605 budding entrepreneurs at the “coal face”, to better understand them and their needs.
The first revelation is that although the Western Balkans is made up of separate nations, aspiring entrepreneurs share some similarities. They can be split into two groups:
• Opportunity-driven entrepreneurs: many of this group would be at home in TechCity in London, or Silicon Valley in California, and others share characteristics of non-tech transformational entrepreneurs such as the Reichmann family, who redeveloped part of Toronto and then went on to build Canary Wharf in London. These entrepreneurs are defined by their ability to see a gap in the market and seek to fill it. This report includes three case studies of these entrepreneurs, none of which are in high tech sectors, but all reflecting the entrepreneur’s desire to plug a basic commercial gap.
• Involuntary entrepreneurs: members of this group want to start a business or enter self-employment to give themselves financial security and feed their family.
There are a number of differences between the groups. Involuntary entrepreneurs are often older, perhaps unemployed, and have lower educational attainment. Many younger and more qualified people may also join this group, but others have a different perspective. These are the “opportunity-seeking” entrepreneurs, who tend to be in their mid- to late 20s to mid-30s, well-educated, cosmopolitan, passionate about their country (which is why they have not emigrated) and determined to do something different.
Chart 1 shows the age distribution of the aspiring entrepreneurs in our survey. There were fewer under 25s than older groups. Our qualitative research suggest that this may reflect (i) the poor reputation of entrepreneurship, including within the family home, (ii) a desire for safer, less risky jobs, and (iii) a lack of seed capital to start a business.

18 19Our Findings Western Balkans Entrepreneurial Capability Report
The Standard Industrial Classification is shown in Table 2.
Table 2. Entrepreneurial type classificationSIC Code Industry Classification 2008
Rev 4.0 Entrepreneurial Classification SIC Comments
Agriculture, forestry and fishingIV
InvoluntaryA
Mining and quarryingO
Opportunity-focusedB Large capital investments required
ManufacturingO
Opportunity-focusedC Large capital investments required
Energy and HVACO
Opportunity-focusedD Capital investments required
Water and wasteO
Opportunity-focusedE Large capital investments required
ConstructionIV
InvoluntaryF
Wholesale and retail, car and motorcycle repair IV
InvoluntaryG
Transportation and storageIV
InvoluntaryH
Accommodation and food serviceIV
InvoluntaryI
Information and communicationO
Opportunity-focusedJ
Financial and insurance O
Opportunity-focusedK
Real estate activitiesO
Opportunity-focusedL
Professional, scientific and technical O
Opportunity-focusedM
Administrative and support service IV
InvoluntaryN Car leasing through to office cleaning
Public administration Public Sector O Not entrepreneurial
EducationIV
InvoluntaryP
Private tutors to clubs and formal education system
Human health and social work activitiesIV
InvoluntaryQ
Care workers to healthcare centres and hospitals.
Arts, entertainment and recreationO
Opportunity-focusedR
Individual artists to opening entertainment venues
Other service activitiesIV
InvoluntaryS
Personal services (e.g. hair dressing, computer repair)
Households as employers Domestic Labour V Should be nothing in this
Extraterritorial organizations and bodies Public Sector and NGOs U Should be nothing in this
Source: Adapted from UN Statistics Division (2008)
In total, 24% seem to be opportunity-driven entrepreneurs and the remaining 76% involuntary entrepreneurs. The top three sectors are retail, car and motorcycle repairs, other services—for example, hairdressing and computer repair—and agriculture-related activities. These all offer low barriers to entry for relatively low skilled entrepreneurs with little seed capital to open a business where they can earn a living (Gkypali and Roper, 2017).
Observation 2: Aspirant entrepreneurs’ educational background differs by countryThe differences in aspirant entrepreneur educational background across the region may be a reflection of a known ‘brain drain’ (Zeneli, 2017) that is drawing graduates away from some countries and also engaging IT specialists to provide lower cost outsourced services for EU-based firms.
Table 1 ranks the sectors in which entrepreneurs wish to start businesses. The major sectors accounted for 95% of the responses2.
Table 1. Sector preferences
Rank TypeSector (Top Level Standard
Industrial Classification 2008)
Tota
l
Cu
m %
Serb
ia
Bo
snia
an
d
Her
zeg
ovin
a
Mo
nte
neg
ro
Mac
edo
nia
Alb
ania
Ko
sovo
1 IVWholesale and retail trade;
repair of motor vehicles and motorcycles
27% 27% 17% 34% 33% 22% 29% 26%
2 IV O ther service activities 15% 41% 20% 20% 18% 3% 9% 18%
3 IV Agriculture, forestry and fishing 14% 55% 6% 20% 30% 9% 5% 12%
4 OProfessional, scientific and
technical12% 67% 23% 6% 13% 12% 6% 13%
5 O Manufacturing 9% 76% 7% 6% 1% 24% 3% 10%
6 IVAccommodation and food
service8% 83% 6% 4% 4% 4% 25% 4%
7 OInformation and communication
3% 87% 5% 2% 0% 11% 0% 1%
8 IV Education 3% 90% 4% 5% 0% 9% 1% 1%
9 IVAdministrative and support
service activities3% 93% 2% 1% 1% 2% 7% 4%
10 IV Transportation and storage 2% 95% 4% 2% 0% 0% 6% 2%
11 IV Construction 2% 97% 2% 0% 0% 1% 2% 8%
Source: Authors’ survey
2 These sectors follow the Standard Industrial Classification (SIC, 2008) and have also been classified to show the type of entrepreneur attracted to the sector. O represents a sector dominated by opportunity-seeking entrepreneurs; and IV one dominated by involuntary entrepreneurs.

20 21Our Findings Western Balkans Entrepreneurial Capability Report
It is important to secure the home market before seeking to conquer the world. Chart 4 locates Western Balkan entrepreneurs in their own “home eco-system”. This chart aims to help understand how support can be crafted to match individual sector needs.
Chart 4. Economic ecosystems
Agriculture
Manufacturing
Core Skills
Urban Economy
Rural Economy
Sup
ply
Cha
in
Pro
fessional
Institutes
CustomersFinance
Regulations
ProfessionalServices
Sector“Ecosystems”
Accommodation& Catering
Retail & CarRepairs
Other ServicesHairdressing
Beauty Parloursetc
Source: Authors
Observation 5: Support measures need to align to local ecosystemsEach business is different, and there is no “one size fits all”. Support measures will need to be adapted to fit each local ecosystem.
Observation 3: There is a large body of involuntary entrepreneursNot all entrepreneurs are trying to build a “Google”. The evidence suggest that about three quarters just want to earn a stable living. These entrepreneurs tend to be focused on sectors with low barriers to entry and exit. This raises three questions:
How can we help these aspiring entrepreneurs to improve their chances of building a long-term stable business?How much do we understand about the needs of these entrepreneurs?Can we help move some of these entrepreneurs towards opportunity-seeking?
Chart 3 looks at entrepreneurial aspiration, to help assess how ambition and financial resources combine to suggest sectors to aspiring entrepreneurs.
Chart 3. Entrepreneurial aspiration
Enterpreneurial Aspiration Grid
Financial Resources
Capital LightLow Barrier To Entry(Mainly Skills Barrier)
Am
biti
on
BeautyServices
GlobalExporter
IT TechStartup
ProfServices
AccomCatering
Manuf
Biotech
Retail &Repair
PersonalServices
Agricult-ure
Source: Authors
This chart suggests that it is not clear whether aspiring entrepreneurs are constrained by finance or ambition. The case studies showed evidence that finance is a significant issue, but there are also constraints to ambition. There were exceptions, but these constraints seemed to centre around a belief that global markets are not open to entrepreneurs from the Western Balkans. Ambition is important in driving success (Levie, 2014), and entrepreneurs who are ambitious are more likely to succeed. UK longitudinal data on small and medium-sized enterprises and entrepreneurship suggest that entrepreneurs who work in goal-focused teams, rather than being self-employed or in family-only firms, will be far more successful in achieving growth (Saridakis, Lai, Muñoz Torres and Mohammed, 2017).
Observation 4: Ambition matters but Western Balkans entrepreneurs sense a ceilingAmbition is one of the key ingredients in delivering growth. There is, however, a lack of belief that an entrepreneur from the Western Balkans could globalise their product and achieve worldwide success..

22 23Our Findings Western Balkans Entrepreneurial Capability Report
We looked at the top sectors to see whether they were common across the whole region. The results are in Chart 5, and Chart 6 shows the split across ‘other’ sectors.
Chart 5. Main sectors across the region
Other Service Activities: 88
Agriculture: 82
Professional Services: 74
West Balkans: 605
Manufacturing: 52
Accommodation, Food Service: 47
The Rest: 100
Retail, Car Repairs: 162
Source: Authors’ survey
Chart 6. “Other” categories across all countries (observations)
Admin Support: 17
Education: 20
Information Technology: 20
Transportation and Storage: 14
Construction: 13
Human Health: 5
Real Estate: 4
Electricity: 4
Water: 2Arts: 1
Other Sectors: 100
Source: Authors’ survey
Our first review of the data looked in percentage terms. Table 3 shows the data restated by numbers.
Table 3. Sectoral split of entrepreneurial aspirations (number of observations)R
ank Standard Industrial Classification
2008 High Level Sector Numbers of People (Total 605)
No higher education after school leaving age
Technical qualification or higher
TotalUnder
25 25-34 35-44 Under 25 25-34 35-44
1Wholesale and retail trade; repair of motor
vehicles and motorcycles9 30 31 14 53 25 162
2 Other service activities 10 14 11 8 30 15 88
3 Agriculture, forestry and fishing 5 11 18 3 18 27 82
4Professional, scientific and tehnical
activities2 4 0 3 38 27 74
5 Manufacturing 2 4 11 2 17 16 52
6Accommodation and food service
activities1 4 4 7 17 14 47
7 Information and communication 0 2 3 3 9 3 20
8 Education 0 3 1 2 6 8 20
9Administrative and support service
activities1 1 2 4 5 4 17
10 Transportation and storage 2 0 1 1 4 6 14
11 Construction 0 2 0 2 5 4 13
12 Human health and social work activities 0 0 0 0 5 0 5
13 Real estate activites 0 0 0 1 1 2 4
14Electricity, gas, steam and air conditioning
supply0 1 0 1 0 2 4
15Water supply; sewerage, waste
management and remediation activities0 0 0 0 0 2 2
16 Arts, entertainment and recreation 0 0 0 1 0 0 1
Source: Adapted from UN Statistics Division (2008)
24 25Our Findings Western Balkans Entrepreneurial Capability Report
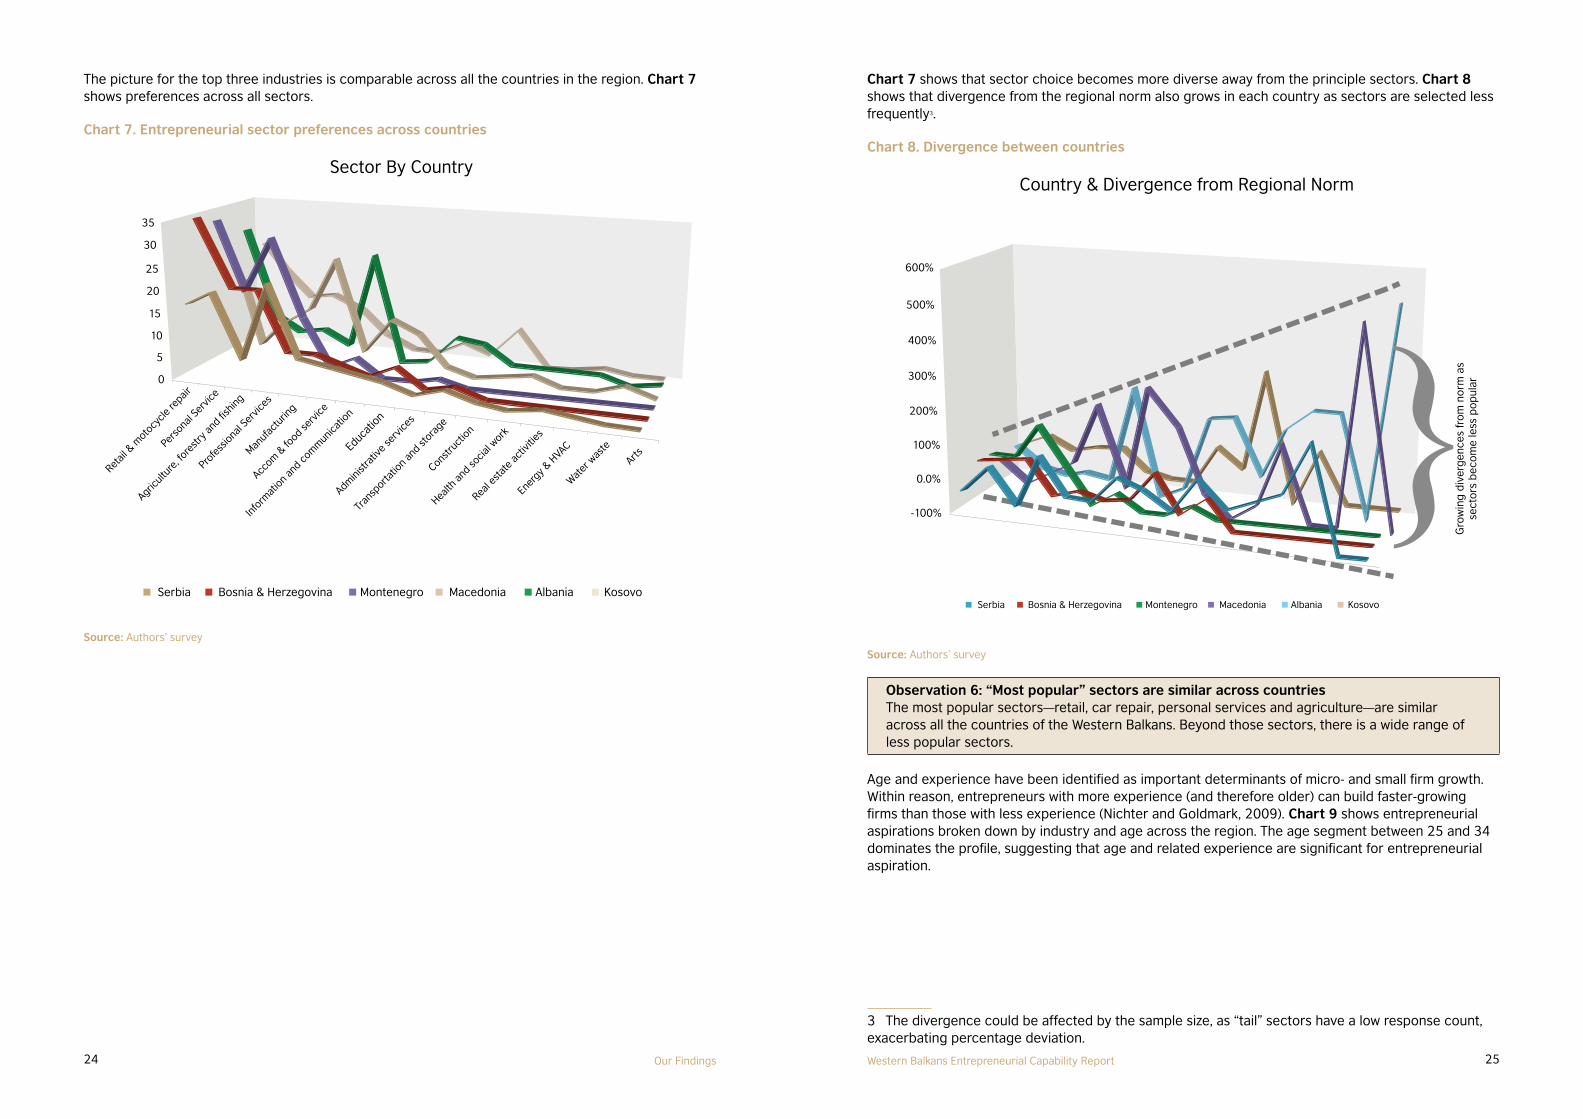
Chart 7 shows that sector choice becomes more diverse away from the principle sectors. Chart 8 shows that divergence from the regional norm also grows in each country as sectors are selected less frequently3.
Chart 8. Divergence between countries
Serbia Bosnia & Herzegovina Montenegro Macedonia Albania Kosovo
600%
500%
400%
300%
200%
0.0%
100%
-100%
Country & Divergence from Regional Norm
Gro
win
g d
iver
gen
ces
fro
m n
orm
as
sect
ors
bec
om
e le
ss p
op
ular
Source: Authors’ survey
Observation 6: “Most popular” sectors are similar across countriesThe most popular sectors—retail, car repair, personal services and agriculture—are similar across all the countries of the Western Balkans. Beyond those sectors, there is a wide range of less popular sectors.
Age and experience have been identified as important determinants of micro- and small firm growth. Within reason, entrepreneurs with more experience (and therefore older) can build faster-growing firms than those with less experience (Nichter and Goldmark, 2009). Chart 9 shows entrepreneurial aspirations broken down by industry and age across the region. The age segment between 25 and 34 dominates the profile, suggesting that age and related experience are significant for entrepreneurial aspiration.
3 The divergence could be affected by the sample size, as “tail” sectors have a low response count, exacerbating percentage deviation.
The picture for the top three industries is comparable across all the countries in the region. Chart 7 shows preferences across all sectors.
Chart 7. Entrepreneurial sector preferences across countries
35
Sector By Country
30
25
20
15
10
5
0
Retail
& m
otocy
cle re
pair
Agricult
ure,
fore
stry a
nd fis
hing
Pers
onal S
ervic
e
Profe
ssiona
l Ser
vices
Manuf
actu
ring
Accom
& fo
od serv
ice
Info
rmat
ion an
d com
mun
icatio
n
Educ
ation
Admini
strat
ive se
rvice
s
Tran
sporta
tion
and st
orage
Constru
ction
Health
and so
cial w
ork
Real e
state
activ
ities
Ener
gy & H
VAC
Wat
er w
aste
Arts
Serbia Bosnia & Herzegovina Montenegro Macedonia Albania Kosovo
Source: Authors’ survey

26 27Our Findings Western Balkans Entrepreneurial Capability Report
Observation 8: Opportunity-driven entrepreneurs are mostly not IT-focusedThere is a perception that opportunity-driven entrepreneurship is focused on the hi-tech, internet and web markets. This is largely not the case in the Western Balkans, although FYR Macedonia has a higher level of aspiration in this area.
Chart 10 shows employment status by country. The main survey cohorts were either employed or unemployed, rather than self-employed, even though self-employment is important economically in several countries.
Chart 10. Employment status of the survey sample
Serbia
70%
60%
50%
40%
30%
20%
10%
0%
Bosnia andHerzegovina
Survey Question 3Employment Status By Country
Montenegro
Unemployed Self-employed Employed
MacedoniaAlbania
Kosovo
Employed54%
Self-employed6%
Survey Sample Employment StatusSurvey Question 3
Unemployed40%
Source: Authors’ survey
The current employment status of most survey respondents contrasts significantly with their aspirations. Many wished to be self-employed, which fits with their stated motivational preference to both make money and find financial security. Chart 11 shows survey respondents’ aspirations for their future employment status. It again shows marked national differences. Entrepreneurship aspiration varies by country, perhaps showing that some societies anecdotally correlate entrepreneurship with extreme wealth, the use or misuse of powerful connections and activities associated with the “shadow” or “informal” economy.
Chart 11. Aspirational employment status
Status Aspiration OverallSurvey Question 10b
Self-employed57%
A businessman10%
An entrepreneur33%
Serbia
70%
80%
60%
50%
40%
30%
20%
10%
0%
Bosnia andHerzegovina Montenegro
A businessman
An entrepreneur
Self-employed
Status Aspiration By CountrySurvey Question 10b
MacedoniaAlbania
Kosovo
Chart 9. Age distribution by industry
30405060708090
20100
Retail
& ca
r rep
air
Agricult
ure,
fore
stry a
nd fis
hing
Profe
ssio
nal S
ervic
es
Manuf
actu
ring
Accom
& fo
od serv
ice
Info
rmat
ion
and co
mm
unica
tion
Educ
atio
n
Admin
Support
Other
serv
ice ac
tivitie
s
Tran
sporta
tion
and st
orage
Constru
ctio
n
Health
and so
cial w
ork
Real e
state
activ
ities
Ener
gy & H
VAC
Wat
er W
aste
Arts
West Balkans Entrepreneur Interest By IndustryAge Split
Under 25 25-34 35-44
Source: Authors’ survey
Aspiration, unsurprisingly, also evolves with age and experience. For example, professional services is likely to be more suitable for more experienced entrepreneurs.
Observation 7: Age matters. Aspirations change with age and educationNot all aspiring entrepreneurs are the same. Age and education matter, and drive different aspirations and risk appetite. Both these factors need to be taken into account in targeting initiatives.
We also separated out the opportunity-driven sectors and ranked them in Table 4. Only 3% of entrepreneurs aspired to create a classic high-tech start-up, which is well-placed to raise seed and early stage venture capital only. Our survey suggests that even opportunistic businesses are not well-adapted to the pan-European venture and seed capital markets.
Table 4. Aspiration in opportunity-driven sectors
Ran
k
Typ
e
Sector (Top Level Standard Industrial Classification 2008) Total Cum % Se
rbia
Bo
snia
an
d
Her
zeg
ovin
a
Mo
nte
neg
ro
Mac
edo
nia
Alb
ania
Ko
sovo
1 OProfessional, scientific
and technical 12% 12% 23% 6% 13% 12% 6% 13%
2 O Manufacturing 9% 21% 7% 6% 1% 24% 3% 10%
3 OInformation and communication
3% 24% 5% 2% 0% 11% 0% 1%
Source: Adapted from UN Statistics Division (2018) and authors’ survey

28 29Our Findings Western Balkans Entrepreneurial Capability Report
Observation 9: Most survey respondents aspire to be self-employed, not an entrepreneurThe desire to be self-employed, rather than running a business or being an entrepreneur is striking. This may reflect a lack of confidence or ambition, or perhaps the views of survey respondents on businesspeople and entrepreneurs. It means that any entrepreneurship program needs to account for the number who aspire to self-employment.
Chart 12 shows significant differences between countries in realised entrepreneurship rates, defined as the number of new limited companies per 1000 head of working population.
Chart 12. Entrepreneurial densityEntrepreneurial Density
60%
70%
Limited Liability Company Registrations Per 1000 of Working PopulationVs % in Self Employment
(Bubble Size Set By Entrepreneurial Density)
Percentage per 1000 Working Population
Albania1.4%%
Kosovo3.1%%
Serbia1.8%%
Bosnia and Herzegovina1.1%%
FYR Macedonia3.9%%
Montenegro6.7%%
% in
Sel
f Em
plo
ymen
t 50%
40%
30%
20%
10%
0%
0.0%
1.0%
2.0%
3.0%
4.0%
5.0%
6.0%
7.0%
8.0%
Source: ILO (2018); World Bank (2017g)
Table 5 looks at the evolution of self-employment over the region since 2010. The data are patchy, and in some cases, may have been subject to significant revision, but the self-employment numbers look stable or in gentle decline. This masks an inevitable churn of people in and out of self-employment.
Table 5. Self-employment in the Western Balkans000s Employees 2010 2011 2012 2013 2014 2015 2016
Albania
Total Employees 1,167 1,159 1,133 1,024
Self Employed 661 666 715 609
% Self Employed 56.6% 57.5% 63.1% 59.5%
Change Self Employed 5 49 -106
Bosnia Herzogivna
Total Employees 620 610 591 613 624 622 605
Self Employed 176 163 185 170 117 136 134
% Self Employed 28.4% 26.7% 31.3% 27.7% 18.8% 21.9% 22.1%
Change Self E mployed
-13 22 -15 -53 19 -2
FYR Macedonia
Total Employees 637 645 650 678 690 705 723
Self Employed 181 182 174 190 184 184 174
% Self E mployed 28.4% 28.2% 26.8% 28.0% 26.7% 26.1% 24.1%
Change Self E mployed
1 -8 16 -6 0 -10
Montenegro
Total Employees 174 163 164 175 176
Self E mployed 32 17 14 20 23
% Self E mployed 18.4% 10.4% 8.5% 11.4% 13.1%
Change Self Employed -15 -3 6 3
Serbia
Total Employees 2,397 2,253 2,228 2,310 2,559 2,558 2,719
Self Employed 777 678 677 749 811 770 851
% Self Employed 32.4% 30.1% 30.4% 32.4% 31.7% 30.1% 31.3%
Change Self E mployed
-99 -1 72 62 -41 81
Kosovo
Total Employees 225 221 211 232
Self Employed 34 76 63 75
% Self Employed 15.1% 34.4% 29.9% 32.3%
Change Self Employed -13 12
Source: ILO (2018)
Observation 10: Realised entrepreneurship rates differ by countryThere are similar aspirations in terms of sector, but realised entrepreneurship, as measured by limited liability company formation, differs by country. This may be partly because of choices about self-employment and company creation in different countries, although there is no specific evidence for this..

30 31Our Findings Western Balkans Entrepreneurial Capability Report
These support needs vary significantly by country (Chart 13).
Chart 13. Support needs by country
60%
50%
40%
30%
20%
10%
0%
Support Requested By CountryQuestion 16
Marke
ting
Sales &
Custo
mers
Manag
ement
Regulatory
Skills
Train
ing
Funding O
ptions
IT & W
eb
Employee R
egs
Serbia Bosnia & Herzegovina Montenegro Macedonia Albania Kosovo
Source: Authors’ survey
Observation 11: There is a clear set of support needsThe main needs were around: Finding and expanding a potential customer base and targeting marketing to support this;Developing management and business skills;Understanding technical areas such as regulations;Improving skills; andObtaining finance.
Getting access to a market and growing a customer base are important for all new businesses, but these issues may be especially pertinent in the Western Balkans. The region has suffered from the division and mistrust sown by the Balkan Wars of the 1990s, and lack of trust inevitably limits cross-border flows and transactions. The region is also remote from many of the main European markets and has not benefited from the same levels of inward investment (as a percentage of GDP) as other countries such as Poland. Building customer networks, including ones that work inter- and extra-regionally, will be a long-term challenge.
Observation 12: Finding connections to markets is an entrepreneurial priorityFinding customers is a priority, and assistance is sought to build customer links and networks.
Survey respondents felt that they needed to develop their management skills. These skills could, for example, help them prepare plans and materials to use in raising finance.
Observation 13: Entrepreneurs want support to develop their management skillsRespondents felt they needed to improve their management skills. This might be an opportunity to help transform aspirations from self-employment to running businesses.
Table 6 draws on this to estimate the number of potential start-ups and entries into self-employment. The data for start-ups come from the World Bank and the estimate for self-employment is based on a 5% entry and exit from self-employment each year.
Table 6. Estimated number of Western Balkans entrepreneurs per yearEconomy Number of New Limited Liability New Self Employed Estimate
Albania 2679 30,000
Bosnia and Herzegovina 2814 7,000
Kosovo 3993 4,000
FYR Macedonia 5686 9,000
Montenegro 2818 1,000
Serbia 8236 43,000
Source: Authors’ own calculations; ILO (2018); World Bank (2017g); Serbstat (2016).
Wider Societal / Economic Context
The third strand of this report looks outwards to see the context in which the survey respondents are working and how this fits with the results of our survey. For example, in FYR Macedonia, survey respondents counter-intuitively suggested that they did not see trade credit as a big potential help to their business. This is easier to understand in the context of a wider body of sources that tell us that for small and medium-sized enterprises in FYR Macedonia, trade credit has been plagued with default and non-payment (Risteska et al., 2014; Janeska et al., 2016).
Training and Support Need
Table 7 shows the support needs identified by entrepreneurs, and these in turn relate to the overall Western Balkans context.
Table 7. Support and training needs
Ran
k
Question 16 Responses To
tal
Serb
ia
Bo
snia
an
d
Her
zeg
ovin
a
Mo
nte
neg
ro
FYR
M
aced
on
ia
Alb
ania
Ko
sovo
1 Marketing 44% 58% 32% 33% 55% 60% 26%
2 Sales and Customers 42% 50% 45% 40% 52% 45% 21%
3 Management 33% 38% 24% 19% 30% 56% 29%
4 Regulatory 32% 43% 23% 6% 35% 50% 34%
5 Skills Training 32% 42% 23% 27% 32% 40% 26%
6 Funding O ptions 31% 34% 25% 34% 45% 25% 23%
7 IT and Web 25% 33% 16% 7% 31% 46% 14%
8 E mployee Regs 22% 32% 7% 21% 28% 31% 16%
Source: Authors’ survey
32 33Our Findings Western Balkans Entrepreneurial Capability Report
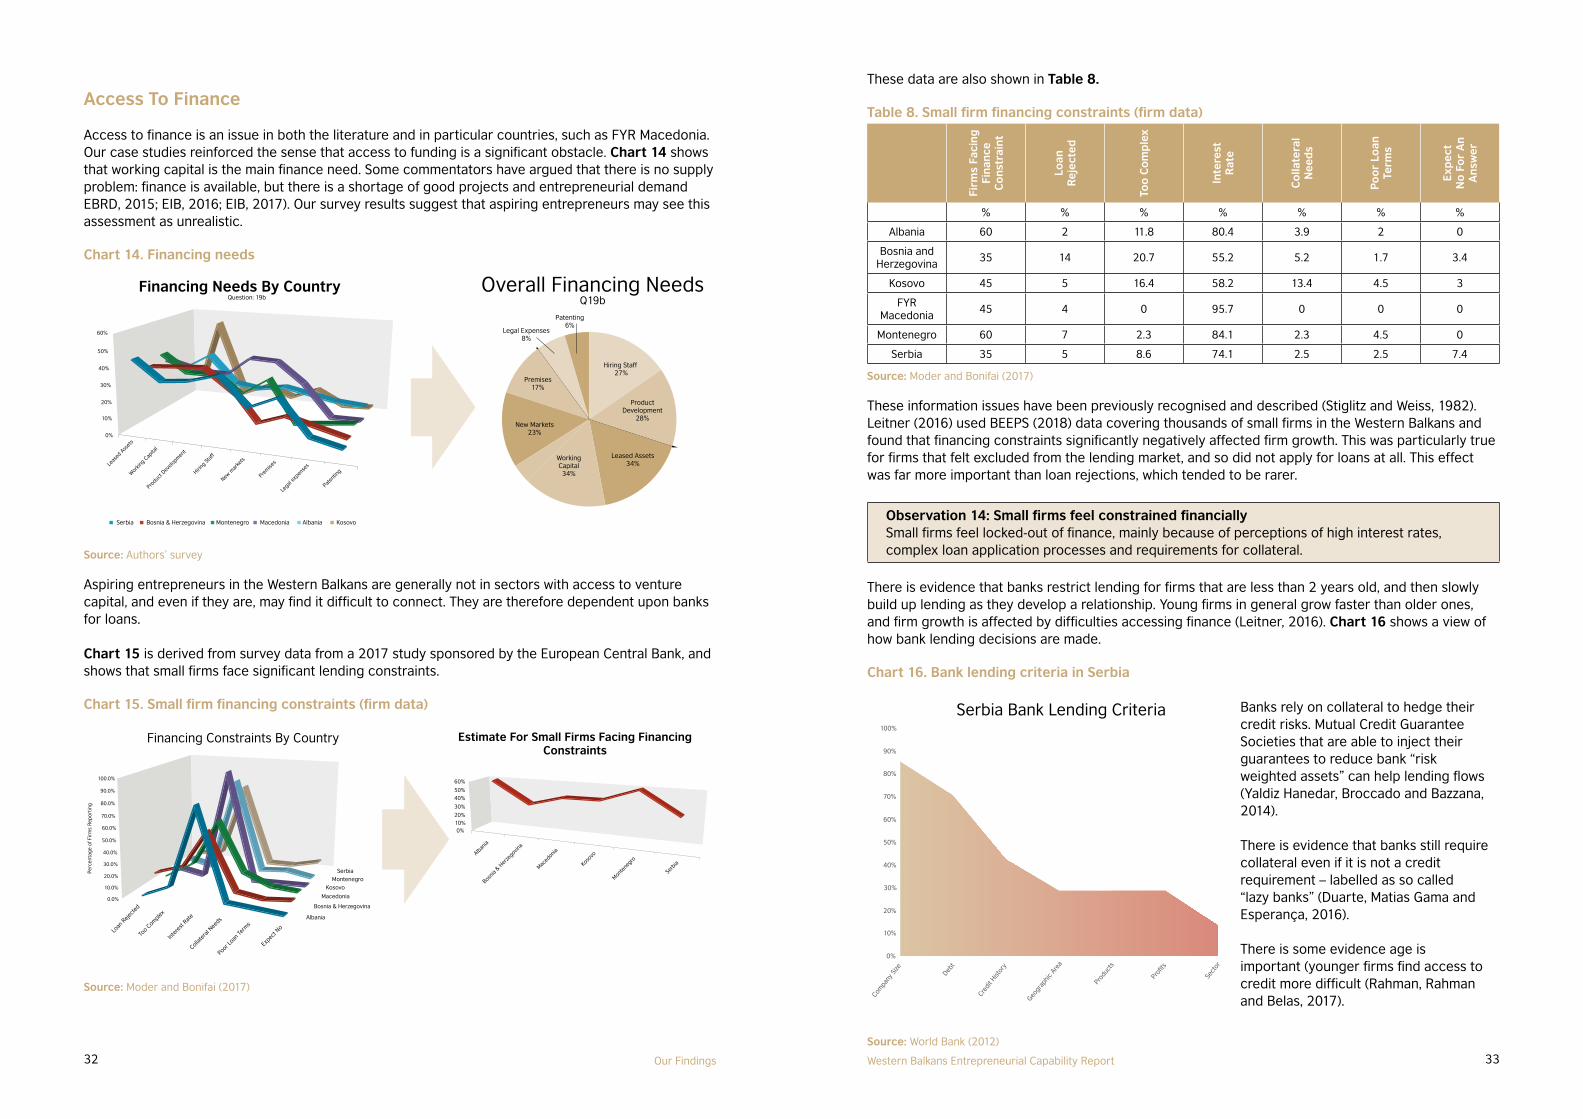
These data are also shown in Table 8.
Table 8. Small firm financing constraints (firm data)
Firm
s Fa
cin
g
Fin
ance
C
on
stra
int
Loan
R
ejec
ted
Too
Co
mp
lex
Inte
rest
R
ate
Co
llate
ral
Nee
ds
Po
or
Loan
Te
rms
Exp
ect
No
Fo
r A
n
An
swer
% % % % % % %
Albania 60 2 11.8 80.4 3.9 2 0
Bosnia and Herzegovina
35 14 20.7 55.2 5.2 1.7 3.4
Kosovo 45 5 16.4 58.2 13.4 4.5 3
FYR Macedonia
45 4 0 95.7 0 0 0
Montenegro 60 7 2.3 84.1 2.3 4.5 0
Serbia 35 5 8.6 74.1 2.5 2.5 7.4
Source: Moder and Bonifai (2017)
These information issues have been previously recognised and described (Stiglitz and Weiss, 1982). Leitner (2016) used BEEPS (2018) data covering thousands of small firms in the Western Balkans and found that financing constraints significantly negatively affected firm growth. This was particularly true for firms that felt excluded from the lending market, and so did not apply for loans at all. This effect was far more important than loan rejections, which tended to be rarer.
Observation 14: Small firms feel constrained financiallySmall firms feel locked-out of finance, mainly because of perceptions of high interest rates, complex loan application processes and requirements for collateral.
There is evidence that banks restrict lending for firms that are less than 2 years old, and then slowly build up lending as they develop a relationship. Young firms in general grow faster than older ones, and firm growth is affected by difficulties accessing finance (Leitner, 2016). Chart 16 shows a view of how bank lending decisions are made.
Chart 16. Bank lending criteria in Serbia
Serbia Bank Lending Criteria
0%
10%
20%
30%
40%
50%
60%
70%
80%
90%
100%
Com
pany
Size
Debt
Cred
it Hist
ory
Geogr
aphi
c Ar
ea
Prod
ucts
Prof
its
Sect
or
Source: World Bank (2012)
Banks rely on collateral to hedge their credit risks. Mutual Credit Guarantee Societies that are able to inject their guarantees to reduce bank “risk weighted assets” can help lending flows (Yaldiz Hanedar, Broccado and Bazzana, 2014).
There is evidence that banks still require collateral even if it is not a credit requirement – labelled as so called “lazy banks” (Duarte, Matias Gama and Esperança, 2016).
There is some evidence age is important (younger firms find access to credit more difficult (Rahman, Rahman and Belas, 2017).
Access To Finance
Access to finance is an issue in both the literature and in particular countries, such as FYR Macedonia. Our case studies reinforced the sense that access to funding is a significant obstacle. Chart 14 shows that working capital is the main finance need. Some commentators have argued that there is no supply problem: finance is available, but there is a shortage of good projects and entrepreneurial demand EBRD, 2015; EIB, 2016; EIB, 2017). Our survey results suggest that aspiring entrepreneurs may see this assessment as unrealistic.
Chart 14. Financing needs
60%
Question: 19b
50%
40%
30%
20%
10%
0%
Leas
ed A
sset
s
Working
Cap
ital
Produc
t Dev
elopm
ent
Hiring
Staf
f
New m
arke
ts
Prem
ises
Legal
expen
ses
Paten
ting
Financing Needs By Country
Serbia Bosnia & Herzegovina Montenegro Macedonia Albania Kosovo
Overall Financing Needs
Q19b
ProductDevelopment
28%New Markets
23%
Premises17%
Legal Expenses8%
Patenting6%
Hiring Staff 27%
WorkingCapital34%
Leased Assets34%
Source: Authors’ survey
Aspiring entrepreneurs in the Western Balkans are generally not in sectors with access to venture capital, and even if they are, may find it difficult to connect. They are therefore dependent upon banks for loans.
Chart 15 is derived from survey data from a 2017 study sponsored by the European Central Bank, and shows that small firms face significant lending constraints.
Chart 15. Small firm financing constraints (firm data)
20.0%
30.0%
40.0%
50.0%
60.0%
70.0%
Perc
enta
ge
of F
irm
s R
epo
rtin
g 80.0%
90.0%
100.0%
10.0%
0.0%
Serbia
Bosnia & Herzegovina
Financing Constraints By Country
Montenegro
Macedonia
Albania
Loan
Reje
cted
Too C
omplex
Inte
rest
Rate
Collate
ral N
eeds
Poor L
oan Te
rms
Expec
t No
Kosovo
Serb
ia
Bosnia
& Her
zegov
ina
Estimate For Small Firms Facing FinancingConstraints
Monten
egro
Maced
oniaAlbania
Koso
vo
60%
50%
40%
30%
20%10%0%
Source: Moder and Bonifai (2017)

34 35Our Findings Western Balkans Entrepreneurial Capability Report
number of new firms registered per annum and assumed the start-up of a firm (that is, more than self-employment) will require a seed capital of 5,000 EUR. Table 9 estimates seed capital needs by country.
Table 9. Seed capital estimate
Economy Num
ber
of
New
Lim
ited
New
Sel
f Em
plo
yed
Es
timat
e
Euro
Per
C
ap G
DP
2
015
Seed
Per
Li
mite
d
Liab
ility
Seed
Pe
r Se
lf Em
plo
yed
Lim
ited
Li
abili
ty
Seed
Self
Emp
loye
d
Seed
Tota
l Est
Se
ed R
eq
Albania 2,679 30,000 3,280 5,000 820 13,395,000 24,600,790 37,995,790
Bosnia and Herzegovina
2,814 7,000 3,489 5,000 872 14,070,000 6,106,259 20,176,259
Kosovo 3,993 4,000 2,922 5,000 730 19,965,000 2,921,811 22,886,811
Macedonia, FYR 5,686 9,000 4,046 5,000 1,011 28,430,000 9,102,698 37,532,698
Montenegro 2,818 1,000 5,388 5,000 1,347 14,090,000 1,346,977 15,436,977
Serbia 8,236 43,000 4,365 5,000 1,091 41,180,000 46,922,483 88,102,483
Source: Authors’ calculations; ILO (2017); IMF (2018); World Bank (2017g)
Table 9 only covers financing needs for year 1. The need is likely to be anything between the same again and double for year 2, when some will drop out, some will stay the same and struggle to survive, and some will grow. Growing companies will require more substantial financing and move towards overall loan demand norms. Our overall estimates for seed and early stage financing needs are set against estimates from a European Investment Bank study in Table 10.
Table 10. Overall annual financing need estimates for small and medium-sized firms in the Western Balkans
Number Euros % Millions Euros
No SMEs Av Loan%SMEs
Needing A Loan
Total Demand
Seed Year 1 Est.
Demand
Early Stage Year 2 Est.
Demand
Total Early Stage Est.
Demand
%Early Stage
Albania 111,059 35,668 36.0% 1,426 38 62 100 7.0%
Bosnia and Herzegovina
186,341 34,409 51.5% 3,302 20 44 65 2.0%
Kosovo 45,985 30,507 52.2% 732 23 53 76 10.4%
Macedonia, FYR 70,453 45,052 40.1% 1,273 38 102 139 10.9%
Montenegro 22,313 47,519 52.8% 560 15 49 64 11.5%
Serbia 280,845 25,753 61.8% 4,470 88 141 229 5.1%
Regional Total In Millions Euro 11,763 222 451 673 5.7%
Source: Authors’ analysis; Hauser, Dolgaya, Revenko and Kortenbusch (2016) A guarantee of 50 to 55 million EUR looks modest when compared to a seed and early stage annual financing requirement of more than 650 million EUR.
Observation 15: There is a gap in seed and early stage financing provisionThere is general recognition that young companies are financially constrained, but may also offer the most rapid growth. Some measures have been established to help ease the flow of funds, such as the EU COSME guarantee framework, but these are small compared with the need.
There is some venture capital provision and a few business angel networks, with moves to connect these to wider individual country diasporas. Both venture capital and angel network provision are, however, thin, as well as sector-focused. They are therefore unlikely to help to bridge the finance gap for lower technology, self-employment start-ups and very early stage companies. To complete the picture, there is European R and D and innovation funding available, but again, this is unlikely to address the funding gap for lower technology and self-employed start-ups.
As automated credit scoring has replaced relationship lending practices, it has become harder for banks to assess which entrepreneur or project will succeed. Small companies have been separated from their larger peers, and are managed by bank retail teams, rather than corporate teams (World Bank, 2012). Credit allocation is increasingly automated through credit scoring (World Bank, 2012) and smaller companies are more expensive to lend to under the Basel Capital Accords framework, implemented through the EU Capital Requirements Directives. Within the regulatory and cost framework, banks do not have the necessary information to make a lending decision, and will therefore tend to say no. They must also price the loan using regulatory capital costs, making it uneconomic for entrepreneurs even if granted. This has led to credit for small and medium-sized firms being more expensive and less available than for larger firms (Rahman et al., 2017).
Banks like to lend to firms with business track records, which start-ups do not have. They also charge start-ups a high interest rate relative to other borrowers and tend to demand collateral.
Chart 17 shows the value of collateral required by country. Some state bodies will guarantee loans, such as the European Union COSME program, which provides guarantees for working capital or physical investment normally up to 150,000 EUR, and up to 500,000 EUR in the Western Balkans (WBEDIF, 2018). This helps to address the collateral issue, but not the interest rate.
Chart 17. Collateral required for small firm loans
Serb
ia
Bosnia
& Her
zegov
ina
Monten
egro
Maced
oniaAlbania
Koso
vo
50%
100%
150%
200%
250%
Small Firm Collateral Requirements By Country
Co
llate
ral R
equi
red
In E
xces
s o
f % O
f Lo
an V
alue
0%
Source: Moder and Bonifai (2017)
The expectation (EU Commission, 2017c) that loan guarantees may free lending volumes in the range of 20 to 30 times the guarantee volume may be ambitious. It also seems to have been reduced to about double for the Western Balkans region. Current expectations are that the guarantee will free around 110 million EUR, suggesting a guarantee capability of around 50 to 60 million EUR, although the terms of the initiative are unclear (WBEDIF, 2018).
We have tried to formulate some idea of the demand for loans. First, if self-employment rates are broadly static, this will mask an annual turnover as new people become self-employed and others leave self-employment. For the purposes of the calculation, we assume this turnover is 5%, and that new entrants require 3 months of per capita GDP to cover their start-up costs until they can break even. Both these assumptions are open to debate, and further study is recommended. We used the
36 37Our Findings Western Balkans Entrepreneurial Capability Report
7. Each country in the region is different, with Albania and Kosovo being particularly distinct from the other states.
8. Overall aspirations are local and national rather than global, with many entrepreneurs aiming to ensure a stable income and provide for their family.
9. Few opportunity-driven entrepreneurs aspire to work in high tech, the web or IT, although there are likely to be some potential stars waiting to emerge.
10. Education and age are key drivers in aspiration.11. Entrepreneurs in all countries want help finding customers and positioning their business.12. Access to finance and developing management skills were important themes.13. Entrepreneurs rely on friends and family for help, but find this route less than perfect for
technical issues.14. More technical issues such as regulatory compliance prompt aspiring entrepreneurs to look for
help.15. Both survey and case studies showed that entrepreneurs want help to be delivered in a flexible
way, including mentoring.
Finally, a striking feature in both the survey and the case studies was the willingness of the entrepreneurs to admit that they lack key skills, and need help and mentoring to attain them.
Support Mechanisms
One of our case study respondents noted that society in the Western Balkans is still rooted in family and extended family. It is therefore not surprising that many entrepreneurs rely on friends and family for support. Chart 18 shows how this dependence is related to the technical complexity of the issue.
Chart 18. Reliance on support from friends and family
% of Respondants Saying They Would Ask For Help From Friends and Family
Relationship
25%
Finding
Em
ployee
s
Employ
ees
Sales
Regula
tions
Acces
s To Fi
nanc
e
Cost Cont
rol
Marke
ting
Officia
l Form
s/Reg
ulatio
n IT
Plannin
g Cas
h Flo
w
Law an
d cont
ract
sSk
ills U
plift
Manag
emen
t
35%
30%
40%
50%
45%
Technical
Source: Authors’ survey
Observation 16: Family and friends have special importanceFamily and friends provide essential support networks, especially for less technical issues. They are often a source of seed and early stage finance.
Conclusions
1. The Western Balkans cannot rely on large volumes of inward investment and integration into complex supply chains to “pump prime” entrepreneurship and evolution of small and medium-sized enterprises.
2. Something needs to fill the gap, but that “something” is still evolving.3. The region contains a large group of “involuntary” entrepreneurs as well as a more select
group of “opportunity-driven” entrepreneurs.4. The involuntary entrepreneurs generally aspire to work in sectors with low barriers to entry
and exit. These therefore have a higher “churn rate” than other sectors.5. Much entrepreneurship is focused on self-employment aspirations, possibly in some cases as a
way to find employment.6. Entrepreneurship as a term is often associated with either privileged, wealthy and well-
connected individuals or with activities in the informal economy, some bordering on illegality.

39Western Balkans Entrepreneurial Capability Report
CASE STUDIES
Case Study 1. Themed Wedding Complex
The Entrepreneur: Žarko Cvijić
Žarko is a 24 year old graduate. He worked for a government institution for some years after graduating, but has now felt the “entrepreneurial call” to start his own business. He is clear that he wants to build something in his home town and not follow the path of so many well-qualified local young people who have left to find work in Germany and other European Union states.
The business: A new wedding hall in the Banja Luka4 region.
Strategic positioning: A premium hall for the “wedding experience of a lifetime”, and the only wedding hall locally that can offer themed weddings. As a premium location, it is expected to be able to charge 10% over the current market price. Competitive advantages come from:
Quality of decoration, experience and service; Ability to offer themed weddings; and Modern look and feel to attract millennial customers.
Key supporters: His family, who already have an agricultural business and are doing all they can to help Žarko establish his own business, by offering him support and land on which he can build the venue.
Unhelpful advice: Žarko has found that when he asks people for an opinion on the project, many of them wait for the person next to them to speak and then agree. In his experience, it makes no difference if the original opinion is negative or positive, others will always copy it.
Tactical marketing: To make the product visible to customers through Facebook, Twitter, Instagram, YouTube, TV, billboard and press advertising. Žarko notes that “this type of customer is different and much more complicated than the usual single customer of an agricultural business”.
Top Three Needs Finance: Žarko has his seed capital and land, but he needs additional finance to build the
hall and pay for the marketing and start up. A local bank might offer finance, but would want to secure the loan against the land. Žarko would like to know if there is any other financing available, maybe from the funds available to EU candidate states?
Reducing risk: Žarko is willing to take risks but wants to find a way to avoid losing everything. He might benefit from working with an independent expert to prepare and rank the risks and possible mitigating actions, or from involving a sleeping equity partner like a venture capital fund, so that he does not risk taking all the losses.
A great architect and design service: To make sure his wedding hall has the best possible design.
Anticipated time before trading: 2 years to raise the cash and build the wedding hall.
4 Banja Luka has a population of nearly 200,000 and is the second largest city in Bosnia andHerzegovina. It currently has four wedding halls, which all offer traditional services.
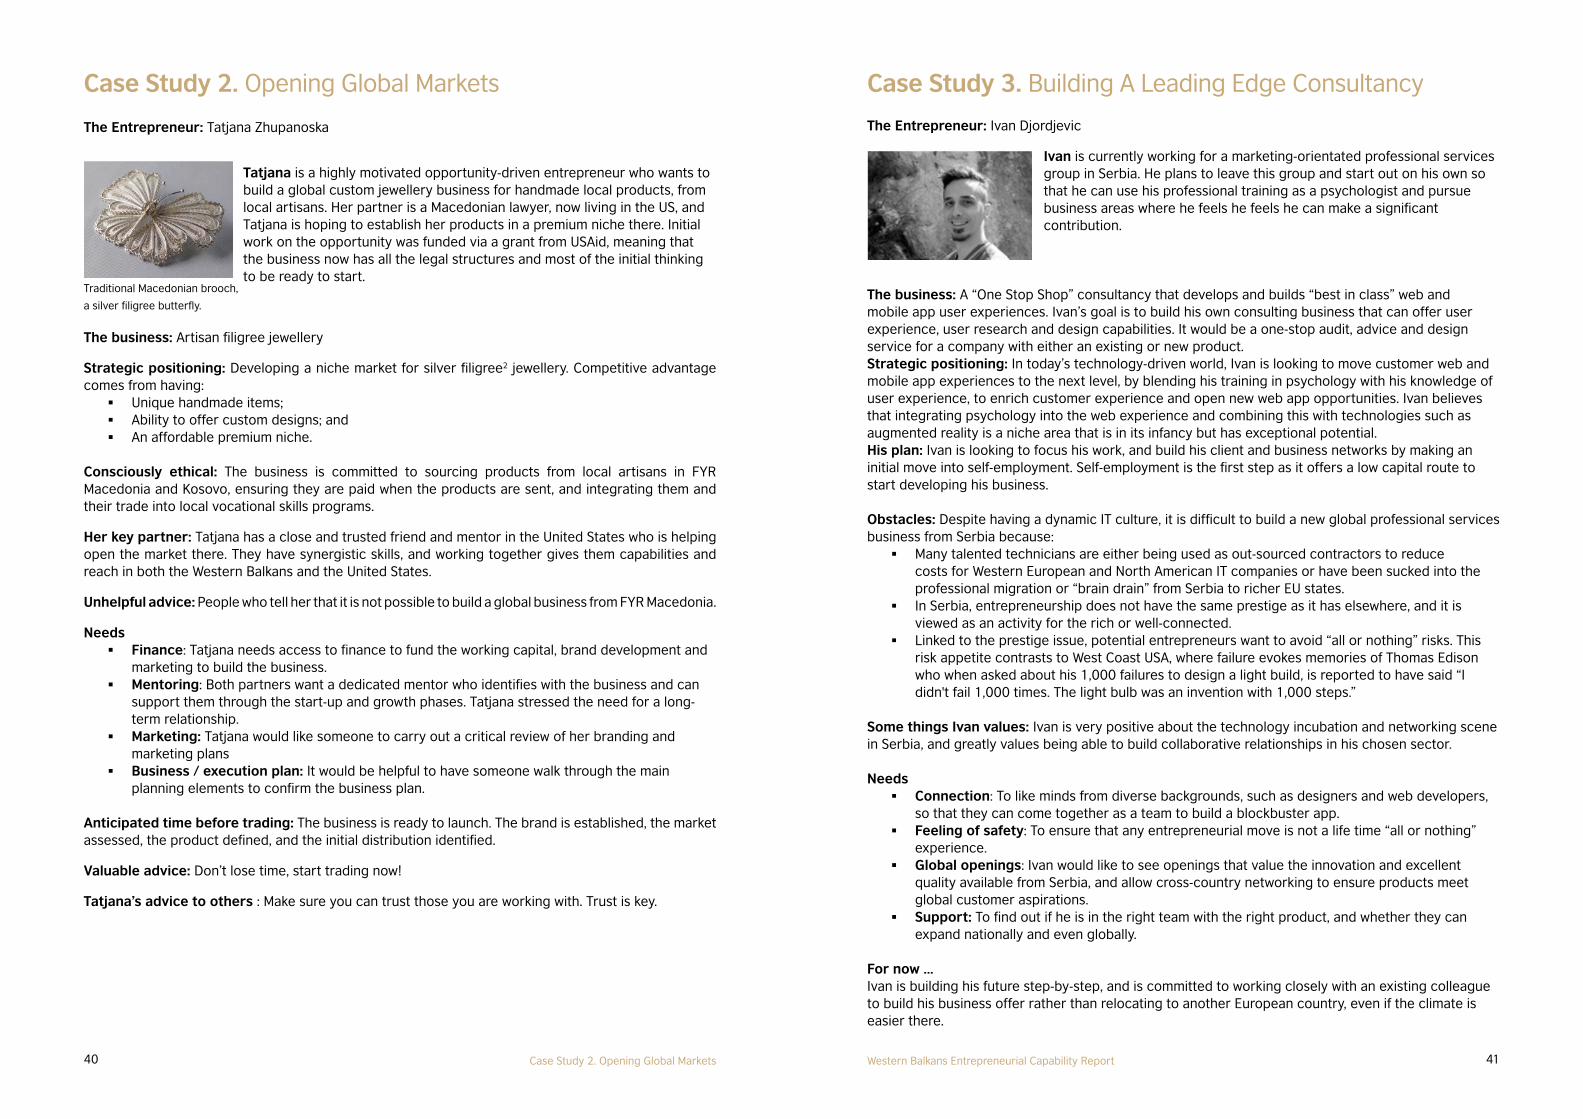
40 41Case Study 2. Opening Global Markets Western Balkans Entrepreneurial Capability Report
Case Study 3. Building A Leading Edge Consultancy
The Entrepreneur: Ivan Djordjevic
Ivan is currently working for a marketing-orientated professional services group in Serbia. He plans to leave this group and start out on his own so that he can use his professional training as a psychologist and pursue business areas where he feels he feels he can make a significant contribution.
The business: A “One Stop Shop” consultancy that develops and builds “best in class” web and mobile app user experiences. Ivan’s goal is to build his own consulting business that can offer user experience, user research and design capabilities. It would be a one-stop audit, advice and design service for a company with either an existing or new product.Strategic positioning: In today’s technology-driven world, Ivan is looking to move customer web and mobile app experiences to the next level, by blending his training in psychology with his knowledge of user experience, to enrich customer experience and open new web app opportunities. Ivan believes that integrating psychology into the web experience and combining this with technologies such as augmented reality is a niche area that is in its infancy but has exceptional potential. His plan: Ivan is looking to focus his work, and build his client and business networks by making an initial move into self-employment. Self-employment is the first step as it offers a low capital route to start developing his business.
Obstacles: Despite having a dynamic IT culture, it is difficult to build a new global professional services business from Serbia because:
Many talented technicians are either being used as out-sourced contractors to reduce costs for Western European and North American IT companies or have been sucked into the professional migration or “brain drain” from Serbia to richer EU states.
In Serbia, entrepreneurship does not have the same prestige as it has elsewhere, and it is viewed as an activity for the rich or well-connected.
Linked to the prestige issue, potential entrepreneurs want to avoid “all or nothing” risks. This risk appetite contrasts to West Coast USA, where failure evokes memories of Thomas Edison who when asked about his 1,000 failures to design a light build, is reported to have said “I didn't fail 1,000 times. The light bulb was an invention with 1,000 steps.”
Some things Ivan values: Ivan is very positive about the technology incubation and networking scene in Serbia, and greatly values being able to build collaborative relationships in his chosen sector.
Needs Connection: To like minds from diverse backgrounds, such as designers and web developers,
so that they can come together as a team to build a blockbuster app. Feeling of safety: To ensure that any entrepreneurial move is not a life time “all or nothing”
experience. Global openings: Ivan would like to see openings that value the innovation and excellent
quality available from Serbia, and allow cross-country networking to ensure products meet global customer aspirations.
Support: To find out if he is in the right team with the right product, and whether they can expand nationally and even globally.
For now …Ivan is building his future step-by-step, and is committed to working closely with an existing colleague to build his business offer rather than relocating to another European country, even if the climate is easier there.
Case Study 2. Opening Global Markets
The Entrepreneur: Tatjana Zhupanoska
The business: Artisan filigree jewellery
Strategic positioning: Developing a niche market for silver filigree2 jewellery. Competitive advantage comes from having:
Unique handmade items; Ability to offer custom designs; and An affordable premium niche.
Consciously ethical: The business is committed to sourcing products from local artisans in FYR Macedonia and Kosovo, ensuring they are paid when the products are sent, and integrating them and their trade into local vocational skills programs.
Her key partner: Tatjana has a close and trusted friend and mentor in the United States who is helping open the market there. They have synergistic skills, and working together gives them capabilities and reach in both the Western Balkans and the United States.
Unhelpful advice: People who tell her that it is not possible to build a global business from FYR Macedonia.
Needs Finance: Tatjana needs access to finance to fund the working capital, brand development and
marketing to build the business. Mentoring: Both partners want a dedicated mentor who identifies with the business and can
support them through the start-up and growth phases. Tatjana stressed the need for a long-term relationship.
Marketing: Tatjana would like someone to carry out a critical review of her branding and marketing plans
Business / execution plan: It would be helpful to have someone walk through the main planning elements to confirm the business plan.
Anticipated time before trading: The business is ready to launch. The brand is established, the market assessed, the product defined, and the initial distribution identified.
Valuable advice: Don’t lose time, start trading now!
Tatjana’s advice to others : Make sure you can trust those you are working with. Trust is key.
Tatjana is a highly motivated opportunity-driven entrepreneur who wants to build a global custom jewellery business for handmade local products, from local artisans. Her partner is a Macedonian lawyer, now living in the US, and Tatjana is hoping to establish her products in a premium niche there. Initial work on the opportunity was funded via a grant from USAid, meaning that the business now has all the legal structures and most of the initial thinking to be ready to start.
Traditional Macedonian brooch,
a silver filigree butterfly.
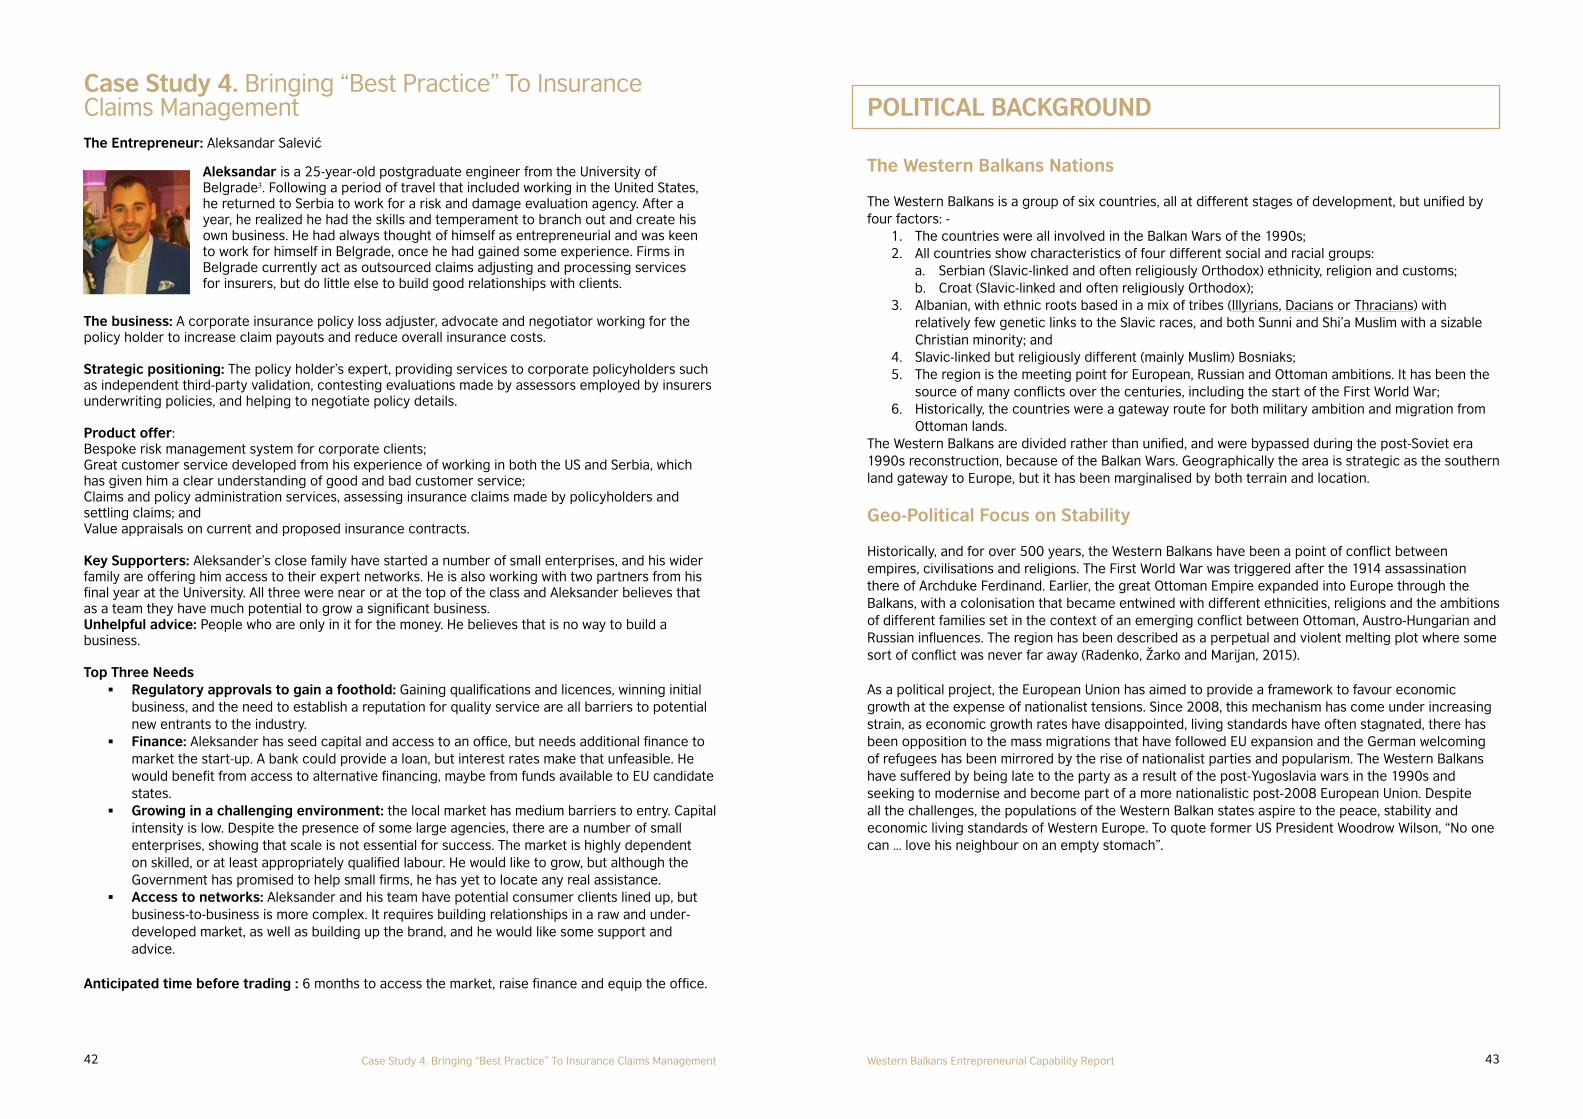
42 43Case Study 4. Bringing “Best Practice” To Insurance Claims Management Western Balkans Entrepreneurial Capability Report
POLITICAL BACKGROUND
The Western Balkans Nations
The Western Balkans is a group of six countries, all at different stages of development, but unified by four factors: -
1. The countries were all involved in the Balkan Wars of the 1990s;2. All countries show characteristics of four different social and racial groups:
a. Serbian (Slavic-linked and often religiously Orthodox) ethnicity, religion and customs; b. Croat (Slavic-linked and often religiously Orthodox);
3. Albanian, with ethnic roots based in a mix of tribes (Illyrians, Dacians or Thracians) with relatively few genetic links to the Slavic races, and both Sunni and Shi’a Muslim with a sizable Christian minority; and
4. Slavic-linked but religiously different (mainly Muslim) Bosniaks;5. The region is the meeting point for European, Russian and Ottoman ambitions. It has been the
source of many conflicts over the centuries, including the start of the First World War;6. Historically, the countries were a gateway route for both military ambition and migration from
Ottoman lands.The Western Balkans are divided rather than unified, and were bypassed during the post-Soviet era 1990s reconstruction, because of the Balkan Wars. Geographically the area is strategic as the southern land gateway to Europe, but it has been marginalised by both terrain and location.
Geo-Political Focus on Stability
Historically, and for over 500 years, the Western Balkans have been a point of conflict between empires, civilisations and religions. The First World War was triggered after the 1914 assassination there of Archduke Ferdinand. Earlier, the great Ottoman Empire expanded into Europe through the Balkans, with a colonisation that became entwined with different ethnicities, religions and the ambitions of different families set in the context of an emerging conflict between Ottoman, Austro-Hungarian and Russian influences. The region has been described as a perpetual and violent melting plot where some sort of conflict was never far away (Radenko, Žarko and Marijan, 2015).
As a political project, the European Union has aimed to provide a framework to favour economic growth at the expense of nationalist tensions. Since 2008, this mechanism has come under increasing strain, as economic growth rates have disappointed, living standards have often stagnated, there has been opposition to the mass migrations that have followed EU expansion and the German welcoming of refugees has been mirrored by the rise of nationalist parties and popularism. The Western Balkans have suffered by being late to the party as a result of the post-Yugoslavia wars in the 1990s and seeking to modernise and become part of a more nationalistic post-2008 European Union. Despite all the challenges, the populations of the Western Balkan states aspire to the peace, stability and economic living standards of Western Europe. To quote former US President Woodrow Wilson, “No one can … love his neighbour on an empty stomach”.
Case Study 4. Bringing “Best Practice” To Insurance Claims ManagementThe Entrepreneur: Aleksandar Salević
Aleksandar is a 25-year-old postgraduate engineer from the University of Belgrade3. Following a period of travel that included working in the United States, he returned to Serbia to work for a risk and damage evaluation agency. After a year, he realized he had the skills and temperament to branch out and create his own business. He had always thought of himself as entrepreneurial and was keen to work for himself in Belgrade, once he had gained some experience. Firms in Belgrade currently act as outsourced claims adjusting and processing services for insurers, but do little else to build good relationships with clients.
The business: A corporate insurance policy loss adjuster, advocate and negotiator working for the policy holder to increase claim payouts and reduce overall insurance costs.
Strategic positioning: The policy holder’s expert, providing services to corporate policyholders such as independent third-party validation, contesting evaluations made by assessors employed by insurers underwriting policies, and helping to negotiate policy details.
Product offer: Bespoke risk management system for corporate clients; Great customer service developed from his experience of working in both the US and Serbia, which has given him a clear understanding of good and bad customer service;Claims and policy administration services, assessing insurance claims made by policyholders and settling claims; andValue appraisals on current and proposed insurance contracts.
Key Supporters: Aleksander’s close family have started a number of small enterprises, and his wider family are offering him access to their expert networks. He is also working with two partners from his final year at the University. All three were near or at the top of the class and Aleksander believes that as a team they have much potential to grow a significant business.Unhelpful advice: People who are only in it for the money. He believes that is no way to build a business.
Top Three Needs Regulatory approvals to gain a foothold: Gaining qualifications and licences, winning initial
business, and the need to establish a reputation for quality service are all barriers to potential new entrants to the industry.
Finance: Aleksander has seed capital and access to an office, but needs additional finance to market the start-up. A bank could provide a loan, but interest rates make that unfeasible. He would benefit from access to alternative financing, maybe from funds available to EU candidate states.
Growing in a challenging environment: the local market has medium barriers to entry. Capital intensity is low. Despite the presence of some large agencies, there are a number of small enterprises, showing that scale is not essential for success. The market is highly dependent on skilled, or at least appropriately qualified labour. He would like to grow, but although the Government has promised to help small firms, he has yet to locate any real assistance.
Access to networks: Aleksander and his team have potential consumer clients lined up, but business-to-business is more complex. It requires building relationships in a raw and under-developed market, as well as building up the brand, and he would like some support and advice.
Anticipated time before trading : 6 months to access the market, raise finance and equip the office.

45Western Balkans Entrepreneurial Capability Report
ECONOMIC BACKGROUND
Other areas of Eastern Europe have seen continued convergence between their per capita incomes and those of Western European countries. Per capita GDP in the Western Balkans, however, has stagnated at about 30% of the West European norm since 2008 (IMF, 2017d). There has been some limited progress, but estimates suggest it will take about 60 years for the Western Balkans to catch up with the average Western European per capita income at today’s growth rates (World Bank, 2017h).
The growth trajectory over the early years following the end of the Balkan Wars was rapid, with a slow-down in growth after the 2008 financial crash (IMF, 2015; World Bank, 2017h). Each country has a different growth performance. Table 11 shows the US dollar per capita GDP, in 2011 constant USD prices.
Table 11. USD 2011 constant price per capita income for Western Balkan countries
Country 2000 2008 2012 2016 Growth 2000/ 2008
Growth 2008/ 2012
Growth 2012/ 2016
Albania 5,669 9,154 10,370 11,359 61.5% 13.3% 9.5%
Bosnia and Herzegovina 6,325 9,824 9,929 11,327 55.3% 1.1% 14.1%
Kosovo 4,605 7,497 8,333 9,332 62.8% 11.2% 12.0%
Macedonia, FYR 8,621 11,044 11,550 13,055 28.1% 4.6% 13.0%
Montenegro 10,397 14,559 14,066 15,725 40.0% -3.4% 11.8%
Serbia 7,985 12,916 12,899 13,723 61.8% -0.1% 6.4%
Source: Authors, using data from World Bank (2017a)
The balance of payments current account (reflecting trade flows) shown in Table 12 highlights the significant deficits over the period 2000–2016. Table 13 shows that much of this trade deficit was caused by a dramatic rise in both household and state consumption.
Table 12. Western Balkans trade deficits as a percentage of GDPCountry 2000 2003 2006 2008 2009 2013 2016
Albania -7.1 -7.7 -6.1 -15.8 -15.9 -9.3 -7.6
Bosnia and Herzegovina -7.1 -19.2 -7.9 -14.1 -6.4 -5.3 -4.5
Kosovo -20.1 -8.1 -7.2 -16.2 -9.2 -3.6 -9.8
FYR Macedonia -1.8 -3.9 -0.4 -12.8 -6.8 -1.6 -3.1
Montenegro no data -6.8 -31.3 -49.8 -27.9 -14.5 -19
Serbia -1.9 -7.2 -9.6 -21 -6.2 -6.1 -4
Source: IMF (2017a)
Table 13. Consumption expenditure in millions 2010 constant US dollarsCountry 2000 2003 2006 2008 2009 2013 2016
Albania 3,213 4,842 7,608 11,731 10,846 11,480 10,637
Bosnia and Herzegovina 6,952 11,219 13,685 20,144 18,309 18,583 16,446
Kosovo 0 0 4,494 6,112 5,865 7,078 6,718
FYR Macedonia 3,486 4,839 6,557 9,631 9,009 9,656 8,827
Montenegro 905 1,724 2,811 5,097 4,318 4,486 4,215
Serbia 6,142 20,237 29,172 46,647 41,118 42,360 33,847
Source: World Bank (2017b)
Investment also rose and fell but not so steeply, as can be seen in Table 14. The more modest rise in investment suggests that the increase in the trade deficit reflected a consumption boom in the years leading up to the financial crisis in 2008 (IMF, 2015). This, in turn, was the result of an expansion

46 47Economic Background Western Balkans Entrepreneurial Capability Report
Current social and regulatory structures in the Western Balkans can risk imposing economic rents on the profit or surplus cash generated by genuine innovative firms, as a result of rent-seeking by powerful actors and petty officials. The IMF, World Bank and European Union are clear that this unsatisfactory situation needs to be corrected.
Major Institution Interventions
External institutional focus from organisations such as the EU, IMF and World Bank has largely focused on:
(i) removing large company inefficiency through privatisation; (ii) improving governance to reduce the informal economy, crime and corruption;(iii) support for infrastructure improvements, (iv) encouraging improvements to legal frameworks; and (v) encouraging regulatory simplification (e.g. European Commission 2017a; IMF, 2015; World
Bank, 2017h).
There has also been some important work on entrepreneurship by national bodies such as the British Council and the German Federal Ministry for Economic Cooperation.
In a rent-seeking state, privatisation risks introducing predatory entrepreneurship, as asset purchasers buy assets, strip out the labour costs and then break them up to make a quick return. Some important successes such as Fiat’s 2008 investment in Serbia provide models of a good privatisation process.
A 15-Year Roller Coaster
Since 2000, and the end of the post-Yugoslavia wars, economic development has focused on the institutional, legal, political and structural changes necessary to allow accession to the European Union. Part of this process can be described as taking on board the aquis communitaire, or the legal rules that govern operation of the European Union, a second and in some senses more immediate element of the transition is activity to turn the Western Balkans into functioning market economies. This includes privatisation of state assets, measures to reduce corruption and macro-economic stabilisation. This process, sometimes called the Washington Consensus, is expected to create conditions for inbound direct investment to transform the economy towards private sector growth (Wojciechowski, 2013).
West Serbian inward investment accelerated in the period from 2000 to 2008, but was mainly concentrated in the service sector (Estrin and Uvalic, 2014), with percentages ranging from 50% in FYR Macedonia to 73% in Serbia. Substantial amounts of this investment went into building a local banking system, and this in turn funded a consumer boom. Investment that found its way into gross capital formation mainly ended up in construction activity rather than in reequipping and building new productive capacity (European Commission, 2009). This period, which saw economic expansion, was typified by a domestic credit boom driving household consumption and not investment (European Commission, 2009). Balance of payments current account deficits grew but were funded by inbound capital flows. The 2008 financial crisis ended the capital flows and resulted in consolidation, as we have already noted.
in bank credit in those years, which largely funded consumption, rather than investment increases. The trade deficit was mainly funded by inbound banking capital flows from parent companies to subsidiaries, but this abruptly stopped in 2008, leaving a legacy of weak local bank balance sheets and tightening lending conditions5 (IMF, 2017d).
Table 14. Gross capital formation in millions 2010 constant US dollarsCountry 2000 2003 2006 2008 2009 2013 2016
Albania 1,855 2,850 3,468 3,911 3,949 3,459 3,640
Bosnia and Herzegovina 0 0 2,815 4,638 3,324 3,229 3,984
Kosovo 0 0 1,215 1,563 1,733 1,801 2,076
FYR Macedonia 1,401 1,474 1,738 2,407 2,393 3,006 3,300
Montenegro 0 0 0 1,502 1,018 861 1,153
Serbia 2,901 6,605 8,619 12,460 7,804 7,950 9,109
Source: World Bank (2017c)
Some important direct foreign investments were made in the period. For example, Fiat transformed both the local factory and its local supply chain when it invested in the former Yugo works in Zastava, Serbia, in 2008 (World Bank, 2017h). Investments such as this reinvigorated local capabilities and provided anchors to local supply chains, including small and medium-sized firms.
Rent-Seeking Rather Than Entrepreneurial Business Environment
The World Bank (World Bank, 2017h), the International Monetary Fund (IMF) (IMF, 2015) and the European Union (European Commission, 2017a) have all described the Western Balkans as a challenging business environment dominated by inefficient state-owned enterprises, significant regulations and corruption. It is therefore a rent-seeking rather than entrepreneurial environment. Economic rent can be defined as payments to a capital holder that are in excess of the marginal product of products produced by that asset. For example, rents paid on fertile land can include an element above the least productive producer on the same land, as the overall price is set by this producer (Ricardo, 1815). The surplus over the profit required to be in the industry is known as the economic rent.
Predatory Entrepreneurship and Economic Rent ExtractionEconomic rent can now be extracted by (i) monopoly (or in some cases oligopoly); (ii) licenses reflecting “regulatory capture” by vested interests; and (iii) by mis-sold services or products such as complex derivative contracts provided to small and medium-sized firms (as has happened in the UK). An unscrupulous entrepreneur can, for example, try to corner the market in certain licences and then extract economic rents from working companies that need access to these licences. This activity does not increase productivity, provide new products or raise added value. Instead, it acts as an overhead, reducing added value in productive firms. In some parts of the Western Balkans, the term “entrepreneur” is generally seen as synonymous with “predatory entrepreneur”, although the actual definitions are quite different. Predatory entrepreneurs are rent-seeking and entrepreneurs seek growth and innovation. Correcting this misconception could be helpful in raising the status and aspirations of those seeking to become entrepreneurs.
Many people also define capitalism as meaning “private ownership”, distinct from public ownership, but this definition too is incorrect. We define capitalism as:
Using the market mechanism to allocate scarce capital resources to the best and most innovative firms and their ideas; with success being measured by increases in productivity, sales, market share and profitability.
5 Commentary from the IMF is misleading on the dynamics of the bank sector, mistakenly suggesting that lending capacity comes from “loanable funds” rather than credit creation subject to (i) capital reserves under Basel Process international banking regulations, (ii) liquidity constraints to back-created loan volumes, and critically (iii) capital inflows to finance any consequent trade deficit. The ultimate constraint is arguably the trade balance, which was funded by inbound capital flows. In the Western Balkans, this was largely spent on consumption rather than made available for capital investment.

49Western Balkans Entrepreneurial Capability Report
ECONOMIC DEVELOPMENT NEEDS FOR ENTREPRENEURS AND SMALL AND MEDIUM-SIZED FIRMS
A Sustainable Development Model
The World Bank (2017e) defines sustainability as based on three pillars: economic growth, environmental stewardship and social inclusion. This report focuses on just one of these pillars, economic growth, albeit in the implied context of the other two. To provide a measurable outcome, we define entrepreneurial or small firm economic growth as:
“The ability after 3 calendar years of operation (or longer in some circumstances such as medical device, pharmaceutical or biotech innovation businesses) to generate positive net operating cashflows after including all (including implicit) capital and entrepreneurial costs and removing the financial benefits of any subsidies received.”
Implicit capital costs include an imputed capital charge for any own capital invested that is not receiving dividends, and entrepreneurial costs include any time or salary and rewards that are not being paid to the entrepreneur at the time of evaluation (see Table 15).
Table 15. Sample cash flow presentation to assess economic sustainabilityYear 1 Year 2 Year 3 Year 4 Year 5
O pening Cash
Plus
Cash from Sales
Cash from Loans
Cash from Equity
O ther inbound cash
L ess
Payments to Suppliers
Wages and Salaries
Taxes and Public Payments
Interest
D ividends
O ther payments
Closing Cash Reconciles to Bank Statements
L ess
Allowance For Late PaymentsCalculated allowance for payment delays
- can be negative or positive against a standard payment delay (30 days?)
Imputed Capital Charge Proxy dividend rate against "own capital"
Imputed Entrepreneur Charge Reflects and deferred payments to entrepreneurs
O pening Cash
N et Cash Generated This is the sustainability measure
Source: Authors
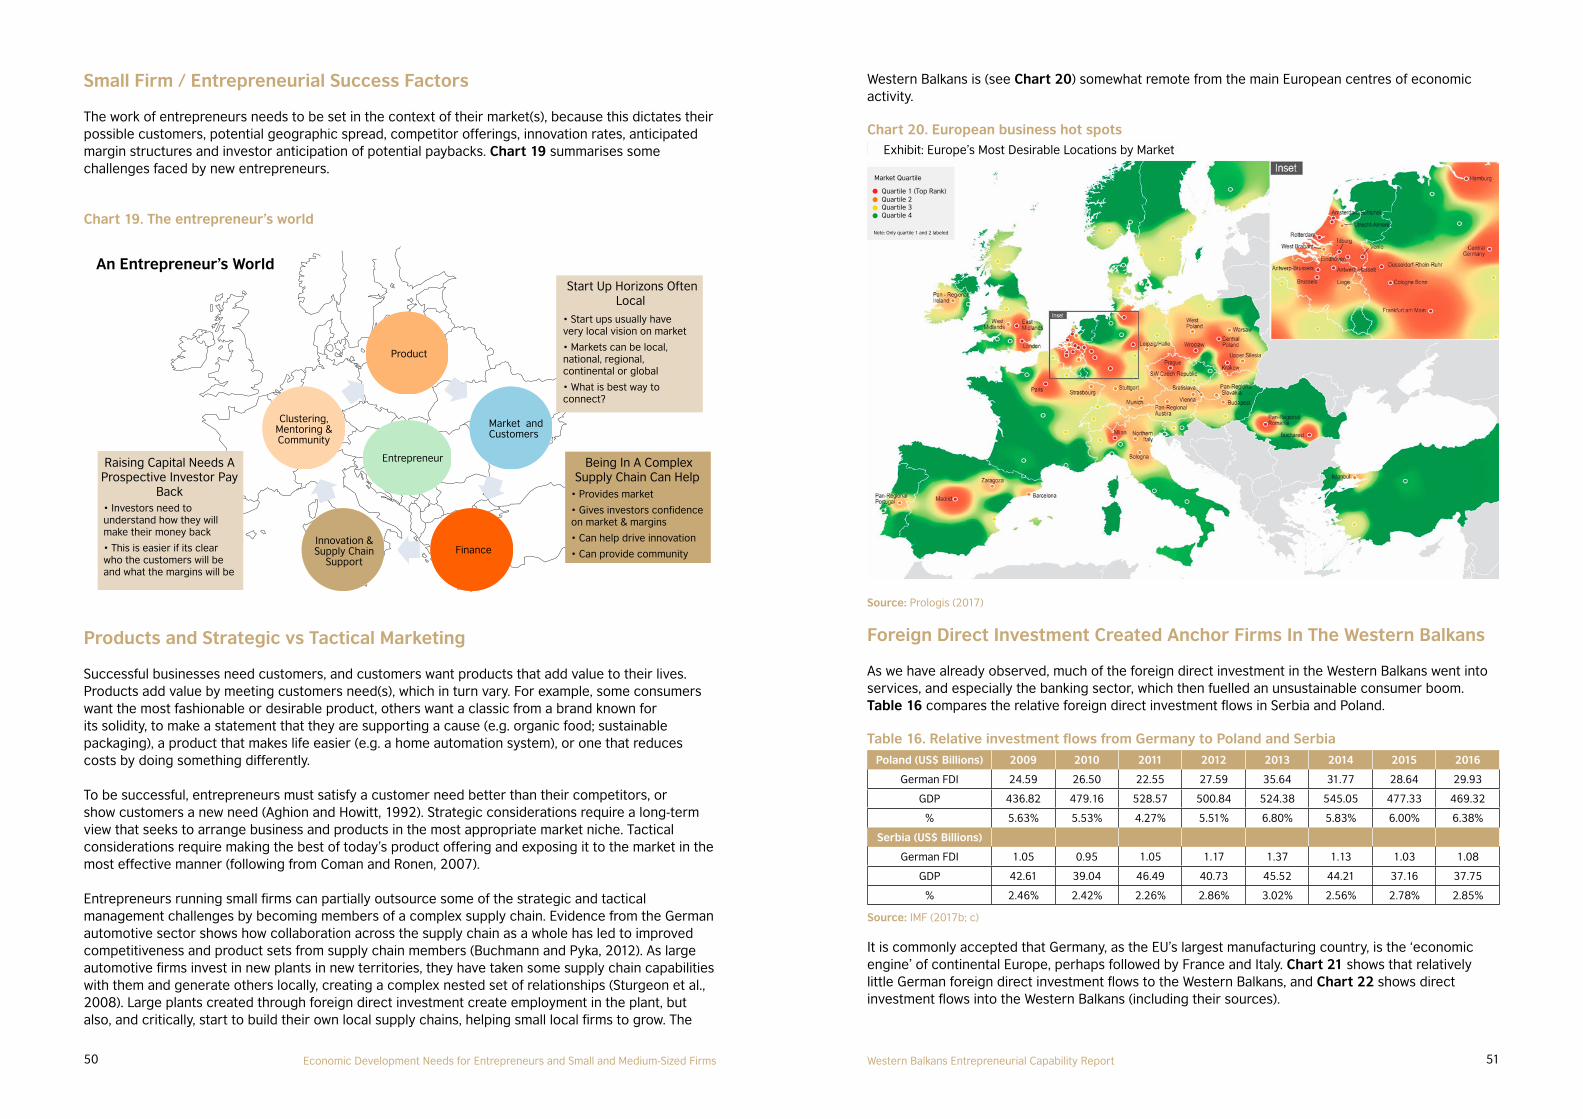
50 51Economic Development Needs for Entrepreneurs and Small and Medium-Sized Firms Western Balkans Entrepreneurial Capability Report
Western Balkans is (see Chart 20) somewhat remote from the main European centres of economic activity.
Chart 20. European business hot spotsExhibit: Europe’s Most Desirable Locations by Market
Market Quartile
Quartile 1 (Top Rank)Quartile 2Quartile 3Quartile 4
Note: Only quartile 1 and 2 labeled
Source: Prologis (2017)
Foreign Direct Investment Created Anchor Firms In The Western Balkans
As we have already observed, much of the foreign direct investment in the Western Balkans went into services, and especially the banking sector, which then fuelled an unsustainable consumer boom. Table 16 compares the relative foreign direct investment flows in Serbia and Poland.
Table 16. Relative investment flows from Germany to Poland and SerbiaPoland (US$ Billions) 2009 2010 2011 2012 2013 2014 2015 2016
German FDI 24.59 26.50 22.55 27.59 35.64 31.77 28.64 29.93
GDP 436.82 479.16 528.57 500.84 524.38 545.05 477.33 469.32
% 5.63% 5.53% 4.27% 5.51% 6.80% 5.83% 6.00% 6.38%
Serbia (US$ Billions)
German FDI 1.05 0.95 1.05 1.17 1.37 1.13 1.03 1.08
GDP 42.61 39.04 46.49 40.73 45.52 44.21 37.16 37.75
% 2.46% 2.42% 2.26% 2.86% 3.02% 2.56% 2.78% 2.85%
Source: IMF (2017b; c)
It is commonly accepted that Germany, as the EU’s largest manufacturing country, is the ‘economic engine’ of continental Europe, perhaps followed by France and Italy. Chart 21 shows that relatively little German foreign direct investment flows to the Western Balkans, and Chart 22 shows direct investment flows into the Western Balkans (including their sources).
Small Firm / Entrepreneurial Success Factors
The work of entrepreneurs needs to be set in the context of their market(s), because this dictates their possible customers, potential geographic spread, competitor offerings, innovation rates, anticipated margin structures and investor anticipation of potential paybacks. Chart 19 summarises some challenges faced by new entrepreneurs.
Chart 19. The entrepreneur’s world
Product
Market andCustomers
Entrepreneur
Finance
Clustering,Mentoring &Community
Raising Capital Needs AProspective Investor Pay
Back• Investors need to understand how they will make their money back
• This is easier if its clear who the customers will be and what the margins will be
• Start ups usually have very local vision on market
• Markets can be local, national, regional, continental or global
• What is best way to connect?
• Provides market
• Gives investors confidence on market & margins
• Can help drive innovation
• Can provide community
Being In A ComplexSupply Chain Can Help
Start Up Horizons OftenLocal
An Entrepreneur’s World
Innovation &Supply Chain
Support
Products and Strategic vs Tactical Marketing
Successful businesses need customers, and customers want products that add value to their lives. Products add value by meeting customers need(s), which in turn vary. For example, some consumers want the most fashionable or desirable product, others want a classic from a brand known for its solidity, to make a statement that they are supporting a cause (e.g. organic food; sustainable packaging), a product that makes life easier (e.g. a home automation system), or one that reduces costs by doing something differently.
To be successful, entrepreneurs must satisfy a customer need better than their competitors, or show customers a new need (Aghion and Howitt, 1992). Strategic considerations require a long-term view that seeks to arrange business and products in the most appropriate market niche. Tactical considerations require making the best of today’s product offering and exposing it to the market in the most effective manner (following from Coman and Ronen, 2007).
Entrepreneurs running small firms can partially outsource some of the strategic and tactical management challenges by becoming members of a complex supply chain. Evidence from the German automotive sector shows how collaboration across the supply chain as a whole has led to improved competitiveness and product sets from supply chain members (Buchmann and Pyka, 2012). As large automotive firms invest in new plants in new territories, they have taken some supply chain capabilities with them and generate others locally, creating a complex nested set of relationships (Sturgeon et al., 2008). Large plants created through foreign direct investment create employment in the plant, but also, and critically, start to build their own local supply chains, helping small local firms to grow. The

52 53Economic Development Needs for Entrepreneurs and Small and Medium-Sized Firms Western Balkans Entrepreneurial Capability Report
Chart 21. Map of 2016 German foreign direct investment flows
German Foreign Direct Investment Flows 2017Heat Map - darker shading indicates higher volume(US Dollars at Current Prices, Source IMF, 2017b)
Source: IMF (2017b)
Chart 22. 2016 direct investment flows into the Western Balkans (USD millions)
West Balkans: 32,740
Italy: 5,503
Austria: 4,697
Russian Federation: 3,330
Netherlands: 2,731
Slovenia: 2,441
Greece: 1,845
Germany: 1,752
Luxembourg: 1,561
France: 975Turkey: 871Hungary: 728Albania: 298United States: 243Poland: 227Kosovo, Republic of: 110Korea, Republic of: 101Macedonia: 86Bosnia and Herzegovina: 75 United Kingdom: 6
Other: 3,558
Republic of Serbia: 1,602
Source: IMF (2017b)
The chart shows flows from the Netherlands and Luxembourg that are likely to be repurposed financial flows, routed through financial funds in these jurisdictions. These therefore probably show “asset management”-type investment rather than investment in new capital assets, but the data is not sufficiently granular to prove this. From a cursory view of banking statistics for Serbia (BIS, 2017), much of the Austrian inbound capital flow is probably financial in nature rather than focused on new capital investment. Chart 23 shows investment flows within the Western Balkans, which are very modest in comparison to the flows from outside the region.
Chart 23. Internal regional capital flows 2016 (USD millions)
Republic of Serbia: 1,602
Kosovo, Republic of: 110
Macedonia: 86
Bosnia and Herzegovina: 75
West Balkans: 1,873
Source: IMF (2017b)
The investment flow data suggest that with some notable exceptions such as the Fiat investment in Serbia, the Western Balkans cannot rely on a model of business anchored in foreign direct investment flows. This begs the question of how else growth and entrepreneurship can be anchored.
Alternative Anchors for Innovative Entrepreneurship
Growth and economic improvement result from “innovative entrepreneurship” investing new capital to introduce new products to new markets. Entrepreneurs and small firms need some focus, an anchor upon which they can build growth.
This may come from several sources, such as being a member of a complex supply chain with an enlightened supply chain lead firm, through a strategic venture capitalist who works with the firm to develop their business model, or a market opportunity where the ability of a firm to connect with a customer need drives the internal processes (Gilad and Levine, 1986; Grilo and Irigoyen, 2006).

54 55Economic Development Needs for Entrepreneurs and Small and Medium-Sized Firms Western Balkans Entrepreneurial Capability Report
Box 1 describes some of these models.
Box 1 Start-Up Support Models
Enlightened Supply ChainSupply chain managers develop the businesses that they need. For example, when Boeing started the Boeing 787 Dreamliner development program, it developed the main assemblies (wings, fuselage etc.) through subcontractors. The approach aimed to extend supply chain innovations introduced by Toyota and other Japanese automotive firms. The initial program, working on a “hands off” contractual basis, started to fail and required the introduction of a Boeing-based central supply chain function. This started to build and nurture innovation and social relationships across the supply chain. This intervention had a significant cost (rising from six to ten billion USD) but fostered the essential collaborative partnerships across the supply chain and delivered the aircraft (Tang, Zimmerman and Nelson, 2009).
Strategic Venture CapitalistInternet search megalith Google started small in the mid-1990s, but attracted two key venture fund investors in its 1999 25 million USD second round financing, Sequoia Capital and Kleiner Perkins Caufield and Byers. In addition to providing money, Sequoia also provided a market by linking Google to Yahoo. Google provided search facilities for Yahoo from 2000 until 2004, when Yahoo acquired Google competitor Overture. Kleiner Perkins Caufield and Byers provided an introduction to Eric Schmidt, the CEO who developed Google’s business model to deliver profitability (O’Shaughnessy, 2017).
New Market OpportunityIn 2009, a little-known private Finnish games manufacturer was facing a cash crisis. The company had been manufacturing and selling games since 2004, via big distributors. The management team worked on developing a game for download though the rapidly emerging App Stores. Their big break came when Apple agreed to feature the game Angry Birds on the UK App Store in 2010, combined with the launch of a free “lite” version and a YouTube video (Cheshire, 2011). Success was almost instant, and then became driven by the market, although this came after years of hard learning.
Companies benefit from participating in business communities, as they can draw on information, knowledge, support and business that helps them grow and develop. Communities provide specific skills and technical developments, but also access to “soft” cultural and networking learning that can help in building collaborative businesses (Barnes and Liao, 2012).
Cooperation is rewarded by improved order rates, cash flows and profitability (Cruz and Liu, 2011). Chart 24 suggests how some of these factors are developed and supported by major business actors such as supply chain managers or venture capitalists.
Chart 24. Entrepreneurial support mechanisms
Supply Chain
SupplyChain
Open discussion
Discussandintroducepartners
Introduce/suggestpartners
SupplyChainLeaderorders andforecasts
Links tootherholdingse.g. Yahoo& Googlein 1999
Productplans
Implicitprotection
Fundingandexpertise toprotect
Otherchainmembers
Networking
VentureCapital
Some EntrepreneurialSupport Mechanisms
VentureCapital
SupplyChain
VentureCapital
SupplyChain
VentureCapital
SupplyChain
VentureCapital
SupplyChain
VentureCapital
SupplyChain
VentureCapital
Source: Authors
Can the state provide a substitute for a missing anchor? The evidence on this is mixed and controversial. The UK government in the 1970s had a strategy of “picking winners”, but this failed in the face of British Leyland, the Meriden Motorcycle Cooperative and De Lorean cars. It did, however, produce Inmos (see Box 2).
Box 2 Inmos
Inmos was a UK company founded in 1978, and largely financed by the UK government through the National Enterprise Board. It aimed to bring microchip design and manufacture to the UK. The design work for early memory products happened in the USA with production in Wales. Later, the Transputer parallel processing chip was designed in Bristol. The company manufactured and sold memory products, and established a leading position in the SRAM market in the early 1980s. In 1984, Inmos was sold to Thorn EMI, giving the UK government a profit of £30 million on its investment of £65 million (Selwood, 2007). Thorn EMI had neither the financial weight nor the management understanding to develop the Transputer, although it found a promising market in graphics cards and printer technology. Eventually the company was sold and merged into Thompson Electronic (then SGS Thompson). Various spin-off businesses developed in the Bristol area and helped build competence in this area (Selwood, 2007). A key issue in the failure to develop Inmos to become a global player was the lack of understanding in both government and top management of the markets and technology (Dyerson, 1992).

56 57Economic Development Needs for Entrepreneurs and Small and Medium-Sized Firms Western Balkans Entrepreneurial Capability Report
Entrepreneurial Success Conditions
Boxes 1 and 2 highlight the importance of appropriate support for entrepreneurs (Ballinger and Rockmann, 2010; Brint, 2017). The guiding principles to determine the support are outlined in Table 17.
Table 17. Some suggested guiding principles
No Guiding principle Some examples of what not to do
1Support must meet the entrepreneur where they are, by
working in their language and linking to their markets
Do not expect mentors from big companies to understand the issues and pressures on small business
Do not expect a mentor whose skill is in finance to be able to advise on protecting emergent technology intellectual property
2Each support component must add value to the
entrepreneur’s world
Do not force an entrepreneur to learn things that are not relevant. Entrepreneurs are busy, and their commitment to listen is earned by
adding value to help them in the challenges they face.
3Encourage an open learning process that allows
businesses to adapt to correct mistakes.
Do not assume that an entrepreneur’s business plan is similar to a company budget and try to force correction against variance. An
entrepreneur’s business plan is a road map and adaptable if the terrain turns out to be different from expected.
4Emphasise the benefits of collaborative working – teams that work well deliver more than individuals on their own.
Do not reinforce defensive cultures that repel outsiders or assume that everyone else is a fool or a threat. Entrepreneurial pressures to deliver
can often tempt entrepreneurs to cut themselves off, but they may need inspiration and help from those around them.
5Make sure mentors realise they too are on a journey of discovery and learning, and that shared learning builds
respect and trust.
Do not pretend the educator or mentor knows everything. In entrepreneurial situations, everyone can learn.
6Value the words “help” and “I need to find better
resources”
Do not expect everyone to grow with the business. People and skills that were once crucial can easily become less relevant or obsolete.
Do not handle this aggressively. Most entrepreneurs are very loyal to those who were with them in the early days.
Delivering a successful framework requires learning from previous successes and seeing how experience from these can be applied to the situation in hand (Borozan and Pfeifer, 2014; Posnett, 2015; Littera et al., 2017). Chart 25 suggests a framework for delivering this support in the Western Balkans.
Chart 25. Western Balkans support context
EntrepreneurialUniversity
UK UniversityOutputs
NetworkingFormal Education
and Mentoring
Links ToUK
Business
Innovation
Orders
ReplicatingConventional Support Mechanisms
Gap Filling
Culture
Community
IntellectualProperty
Action Learning
SupplyChain
VentureCapital
SupplyChain
VentureCapital
SupplyChain
VentureCapital
SupplyChain
VentureCapital
SupplyChain
VentureCapital
SupplyChain
SupplyChainLeaderorders andforecasts
Links tootherholdingse.g. Yahoo& Googlein 1999
VentureCapital
Open discussion
Discussandintroducepartners
Introduce/suggestpartners
Productplans
Implicitprotection
Fundingandexpertise toprotect
Otherchainmembers
Networking
Source: Authors
This framework has potential to be developed into a work program, but this will need closer examination of the landscape of small and medium-sized firms in the Western Balkans. This could draw on both official data and the results of our survey.

59Western Balkans Entrepreneurial Capability Report
LOOKING TO THE FUTURE
Historically, one of Tito’s successes was to allow an MSME sector to develop in Yugoslavia in certain non-strategic sectors, including agriculture, catering, crafts and tourism, even though the rest of Eastern Europe was managed by Soviet Central Planning (Gapinsky et al., 1989; Liotta, 2001). Unlike Russia in 1991, but like Poland in 1990 (Chepurenko and Vilenski, 2016), Yugoslavia therefore had experience of running and growing MSMEs when the Soviet Bloc fell. Commentators have found that MSMEs generally have two main needs, apart from support in managing state bureaucracy:
(i) training in entrepreneurship skills; and, (ii) access to finance (e.g. Stefanovića et al., 2009).
In 2017, Bobić found that these issues, along with the cumbersome and bureaucratic nature of the State, were key barriers to youth entrepreneurship in Serbia. There are more specific barriers for particular groups, such as people with disabilities or low educational attainment, and women. There is, however, an entrepreneurial or small business culture, and it is therefore a question of nurturing and affirming existing “green shoots”.
Major Challenges
Our survey among aspiring entrepreneurs and review of the situation in the Western Balkans have identified a number of challenges. These are:
The status of entrepreneurship and its confusion with “predatory entrepreneurship”; The difficulty of building a customer base and connecting to wider markets; Relatively low levels of inward investment and the region’s remoteness from main European
supply chains, which deprive the entrepreneurial community of a key source of business, innovation and access to finance;
Poor access to venture and angel capital; The perception that entrepreneurship is mainly hi-tech, which is not the case in this region; The need to develop management skills; and The shortage of specific technical knowledge about regulatory issues.
Possible solutions have previously been identified by the British Council (British Council, 2016) in a report on young entrepreneurs in the Western Balkans. This chapter follows up some of those solutions, but with a focus on the entrepreneur, rather than how to embed entrepreneurship into existing institutions. There is significant crossover with the previous report, and the two can be seen as looking at the same issues from different perspectives.
Raising The Status of Entrepreneurship
Our case studies and survey work confirmed that there are difficulties distinguishing entrepreneurship from predatory entrepreneurship. Entrepreneurship is seen as only available to rich and well-connected people, or to powerful players in the shadow economy. It is important to change perceptions, and make clear that entrepreneurship is about creating innovative businesses with products that “excite and delight” customers, rather than drawing on high level connections and substantial pre-existing wealth.
The British Council (2016) suggested that engaging students with entrepreneurship concepts and activities may help. Programs targeted at school students and undergraduates can help to deepen

60 61Looking To The Future Western Balkans Entrepreneurial Capability Report
understanding of entrepreneurship, and encourage practical experimentation through awards ceremonies. Initiatives run by the Peter Jones Foundation6 in the UK offer some helpful examples.
Suggestion 1. Improve the status of entrepreneurs through educational intervention Introduce entrepreneurship awareness teaching to encourage early entrepreneurial experimentation. Modules should be made available in schools and undergraduate courses, and effort rewarded with awards. Encourage a risk-taking culture that sees any failure as a lesson on the road to success.
Publicising entrepreneurial awards and local success stories via social and mainstream media can also raise the status of entrepreneurs. One very practical suggestion would be to create a social media group for each major centre of population and ask every entrepreneur to link to it on their website. Ideally, each social media group should be sponsored by the local Chamber of Commerce, linking entrepreneurs to their local Chamber.
Suggestion 2. Build local social network pages hosted by the local Chamber of Commerce and promote local entrepreneurship awards
Encourage all entrepreneurs to link their websites to the local Chamber of Commerce, making the local Chamber a focal point to facilitate local entrepreneurial networks. Each local Chamber of Commerce should also build and host a local business directory, with links from the directory to the social networking pages, and run local awards events to reward the best local entrepreneurs. These award systems should be linked to themed awards (for example “Climate Change Entrepreneur of the Year”), and media coverage should be coordinated to promote awareness of entrepreneurship.
Growing Entrepreneurs into Businesspeople
Our survey results showed that only 11% of our respondents aspired to become businesspeople, 33% entrepreneurs and 57% self-employed. Entrepreneurs are, by definition, simply businesspeople who innovate. These findings suggest that there is some misunderstanding about the nature of being a businessperson. It may be that people link the term ‘businessperson’ with a stereotype of the powerful deal-maker, rather than the risk-taking innovator described by Schumpeter (1934) and Keynes (1936). There needs to be a universally accepted definition of the term “businessperson”.
Our study also identified both “opportunity-focused” and “involuntary” entrepreneurs. This distinction was expressed in slightly different terms by Smith and Miner (1983), who identified entrepreneurs as either “craftsmen” or “driven by opportunity”. Craftsmen are focused on their product and their customer, and opportunity-driven entrepreneurs pursue a bigger vision, and innovate to command an attractive niche in the market. Both types of entrepreneur are, however, businesspeople, and therefore need the skills to run a business.
Entrepreneurship needs to blend customer-focused innovation with business competence. Neither of these is sufficient without the other. Both entrepreneurship and running a business (being a businessperson) are misunderstood. A businessperson running an entrepreneurial company is the inspirer, the innovator, and the deal maker, but also the person running the business to drive profit and positive cash flow.
Large organisations can separate the different roles, but small companies and new entrepreneurs do not have this luxury. They need to become effective businesspeople from day one. The good news is that the key skills for this can be learned, and any gaps can be filled through recruitment or by using external services. The starting point must be to define a “businessperson”.
6 The Tycoon in Schools program is a good example http://www.peterjonesfoundation.org/about-us/our-work/tycoon-schools
Suggestion 3. Promote a common and positive definition of “businessperson”, particularly for those running MSMEs
We propose the following definition:
“An MSME businessperson has the interpersonal, technical and financial skills to (i) decide upon a product that customers want, and (ii) provide it at a price that customers can afford and that is competitive with alternative offers, and the necessary skills to translate (i) and (ii) into a profitable business that generates cash.”
Becoming a Businessperson who can Create Business Success
It is important to identify the skills that businesspeople need to create business success. A study of Canadian business (Chamberlain et al., 2010) examined 3,701 firms over 34 service sectors, to identify levels of innovation and critical success factors in the period 2001–2003. The factors contributing to success were ranked, with the top factors being (i) exciting and delighting customers, (ii) quality control, and (iii) ensuring that staff had appropriate skills and inexperienced staff learned from others. To “excite and delight” customers in a service sector means having great staff who deliver a top quality product. Interestingly, access to venture capital trailed in the results in non-ICT or mining firms, probably because venture capitalists tend to have less interest in low-capital, lower-return service industries.
The challenges and therefore the blend of skills required varies by industry. Some success factors will therefore depend on the sector in which the business operates. Where success factors differ radically, it is likely that different support elements will be required. Lower technology industries such as retail or servicing and repair tend to be less dependent on locality than higher technology industries such as ICT, which have a preference for being closer to academic institutions. ICT and communication technology firms are also far more likely to be innovators than, for example, scientific consulting services firms.
Some skills are core and are required in all capitalist system businesses. For example, anyone running a business needs to understand cash flows, financial planning and accounting, so that they know when they are making money. They also need to know which regulatory frameworks apply, even if they are not experts on every detail. It is also highly likely that the people running MSMEs will want to know how their product compares to others in the market, what is their competitive edge and how can they find more customers and grow. Entrepreneurs tend to operate alone, or in small teams, so any process to help develop aspiring entrepreneurs into businesspeople needs to start with the entrepreneur as the decision-maker.
Suggestion 4. Entrepreneurs must decide what support they need
In designing a program to develop aspiring entrepreneurs into MSME businesspeople, each aspiring entrepreneur needs to “own” and take responsibility for deciding what additional help and skills they need.
Constructing a Program To Improve the Skills of Aspiring Entrepreneurs
“One Size Fits Nobody” … How do I know which size fits me?
An aspiring entrepreneur will often just want to start their business. In a simple business, say trading vegetables at a market stall, the necessary lessons will be clear very quickly. First the stall has to have the right position in the right market, so customers know it is there, then the product must be competitive in both price and quality, and third, the mark-up has to cover the costs of the day (the products on the stall, the rental for the space in the market and any products that do not sell). Finally,

62 63Looking To The Future Western Balkans Entrepreneurial Capability Report
there has to be enough of a surplus to provide an income for the stall holder. If any of these are wrong, the impact is immediately visible and things can be changed the next day. Most new businesses, however, are more complex than trading at a market, and both costs and risks rise with complexity.
We suggest that it may not be helpful to provide a wide range of courses for entrepreneurs to choose. Instead, there needs to be a rapid learning or screening process to help entrepreneurs understand their needs. Chart 26 shows the different areas and challenges that may be relevant for entrepreneurs. Entrepreneurs will also face multiple time pressures, so support arrangements will need to align to both needs and available time.
Chart 26. Potential issues facing entrepreneurs
Question: Which of these will affect me if I am an entrepreneur?
Market&Customers
SkillsMain Pillars Reflecting Needs Identified In Survey
Team Regulatory Finance&Money
Sale
sO
pp
ort
uniti
es
FinancingStrateg
y
Source: Authors
Whether entrepreneurs are opportunity- driven, involuntary or a “craftsman”, they want to make an income, and will probably have some skills shortages. Most will also want to make sure they are following a sound direction of travel in their business.
To identify where help is most needed, we suggest that aspiring entrepreneurs should be offered a “health check” on their thoughts and plans, to identify areas where they could benefit from assistance and to boost their confidence in their plans. This health check could be viewed as trying different size options to find the best fit.
Chart 27 sets out this process.
Chart 27. Stylised health check process
The Screening ExperienceA weekend’s journey through entrepreneurship
Plenary Sessions
Group Works Individual
Elective SessionsProgram Structure and Objectives
Modular structure
How to sign up and delivery process
Program experiences from current and previousentrepreneurs
Wrap Up & Feedback
Sales Strategies & Tactical Marketing
Strategic Marketing
Regulatory
Finance
Positive thinking
Mentoring and outside advice
Individual goals and objectives (15 mins)
Program elements (1hr)
Program member responsibilities and expectations
(15 mins)
Sign up papers (15 minutes)
Any other issues (15 minutes)
Entrepreneurs are assigned to groups that combinebusiness from different sector (no competitorthreat)
Each Entrepreneur presents their product/businessidea to the group in one session and then in a separatesession their team
Moderated discussion gives group feedback onstrenghts and weaknesses
Source: Authors
Suggestion 5. Enable entrepreneurs to identify their needs
Provide a structured process for entrepreneurs to talk through their business ideas and identify their development needs. Ideally, entrepreneurs could attend screening weekends to help them understand their business and their needs.
Building Individual Support Programs
Chart 28. Support preferences for entrepreneurs
Aspiring entrepreneurs were asked how they would like support to be delivered. They clearly value human interaction, but were concerned about allocating and managing time across many activities. Task overload is an everyday hazard and reality for an entrepreneur. Support therefore has to deliver what entrepreneurs perceive they need in the most effective and time optimal manner.
Percentage Requesting Support By...Question 17
On LineCourses
27%
In PersonCourses
56%
Networking33%
Peer to PeerSupport
37%
Subsidies26%
Mentoring16%
Incubators/Innovation Hubs
15%
Source: Authors’ Survey
Each business has different needs, and the aim of the screening day would be to focus and match these needs to specific program elements. Following Michael (2006), our support and learning framework is based on ensuring project work and learning is focused on a goal that is aligned to a business imperative for the entrepreneur. This goal needs to be clearly expressed and articulated at the outset, as this greatly increases the chances of successful learning.
For example, an entrepreneur might identify the need to build a tactical marketing campaign to prospect new customers. The formal teaching would look at options and methods to execute this, and

64 65Looking To The Future Western Balkans Entrepreneurial Capability Report
the practical work and deliverable would be to develop a tactical marketing plan for the business that could then be reviewed and adjusted with course supervisers and mentors.
The learning elements will be delivered through a variety of mechanisms, such as:
1. Online training courses created by universities, complemented by project work directly related to the entrepreneur’s business and formal teaching weekends;
2. Active Learning assignments based on the prospective entrepreneur’s business; and3. Formal mentoring, informal networking, and where appropriate incubation.
To fit entrepreneurial time constraints and ensure optimal resource use, support must be delivered flexibly from existing resources. The suggested support framework is shown in Chart 29.
Chart 29. Support mechanisms
Support Mechanisms
Formal Sessions
University PreparedDelivered and Moderated
Mentor / Incubator Delivered/ Local Chamber of
Commerce Supported
Could be either
Online Materials
Active Learning Assignments
Formal
Informal
Mentoring / Support
Networking Events
Source: Authors
Suggestion 6. Support needs to be focused on MSME objectives, and flexibly delivered
The nature of entrepreneurs and the time pressures on them mean that support needs to be delivered as flexibly as possible, mixing formal with informal and blending practical with taught skills. In effect this is a “two birds with one stone” strategy, enabling entrepreneurs to learn and develop key skills while building their business.
Formal instruction can often be delivered online in the form of a series of quality “mass open online courses” (open to all). Supervision should be based around Active Learning assignments created jointly by formal teaching and mentoring staff. Active Learning is developed partly in formal sessions and partly in mentored sessions. The outputs of the Active Learning activities should be focused on the individual business and the barriers perceived by that entrepreneur.
This approach will build specific skills within an entrepreneurial culture that evangelises advance thinking and planning (but not procrastination) as key risk reduction weapons. This risk reduction is enhanced by a commitment to continual status review. Entrepreneurs will be encouraged to ask whether their plans are working, and if not, whether they need more time, amendment, or rethinking
completely, because “You cannot dig a hole in a different place by digging the same hole deeper” (De Bono, 1970).
Suggestion 7. Encourage entrepreneurs to pursue continual learning and improvement
By propagating a culture of active learning, realistic planning and continual execution, entrepreneurs should be encouraged to learn continuously, and particularly to learn to identify the point at which it is best to shift direction if the current plan is failing.
Charts 30 and 31 show the barriers perceived by our aspiring entrepreneurs.
Chart 30. Perceived barriers to success
Econo
mic
Situa
tion
Taxe
s and
bur
eacr
acy
Lack
of s
ubsid
ies
Compet
ition
No obsta
cles
Acces
s to fin
ance
Poor m
arke
t
Failu
re R
isk
Other
Poor s
taff
skills
Paym
ent d
elays
Lack
of id
eas
Not ent
repre
neur
Low p
rices
(Question 12)
Perceived Barriers To Success
20.0%
Kosovo
Total
Macedonia
Bosnia & Herzegovina
30.0%
40.0%
50.0%
60.0%
10.0%
0.0%
Source: Authors’ Survey
Chart 31. Perceived barriers to success (2)
Ran
k
Barrier
Tota
l
Serb
ia
Bo
snia
an
d
Her
zeg
ovin
a
Mo
nte
neg
ro
Mac
edo
nia
Alb
ania
Ko
sovo
1 Economic Situation 30.5% 41.2% 54.1% 35.0% 0.0% 27.0% 28.0%
2 Taxes and bureacracy 18.7% 28.9% 16.3% 12.0% 0.0% 43.0% 13.0%
3 Lack of subsidies 15.2% 3.1% 7.1% 11.0% 19.0% 15.0% 35.0%
4 Competition 11.3% 12.4% 5.1% 9.0% 13.3% 12.0% 16.0%
5 No obstacles 9.5% 9.3% 2.0% 24.0% 16.2% 1.0% 4.0%
6 Access to finance 6.7% 0.0% 0.0% 0.0% 38.1% 0.0% 0.0%
7 Poor market 3.8% 7.2% 10.2% 1.0% 0.0% 3.0% 2.0%
8 Failure Risk 3.5% 4.1% 15.3% 0.0% 0.0% 1.0% 1.0%
9 Low prices 2.7% 0.0% 0.0% 16.0% 0.0% 0.0% 0.0%
10 O ther 1.8% 0.0% 0.0% 0.0% 4.8% 6.0% 0.0%
11 Poor staff skills 1.7% 2.1% 0.0% 0.0% 4.8% 3.0% 0.0%
12 Payment delays 1.2% 0.0% 0.0% 0.0% 6.7% 0.0% 0.0%
13 Lack of ideas 0.7% 2.1% 2.0% 0.0% 0.0% 0.0% 0.0%
14 Not an entrepreneur 0.7% 0.0% 0.0% 0.0% 3.8% 0.0% 0.0%
Source: Authors’ Survey
Countries have some striking differences, but main themes seem to be:• Securing customers and business
in face of poor economy and competitive response;
• Lack of subsidy (and in some places lack of finance);
• Some perceive no barriers.
Access to finance is especially important in FYR Macedonia
Tax and bureaucracy important in most states

66 67Looking To The Future Western Balkans Entrepreneurial Capability Report
Chart 32 shows how these barriers are translated into “needs” in the minds of our aspiring entrepreneurs. These needs split into three areas:
1. Skills required to find customers, drive sales and build marketing plans; 2. Skills required to run a company – management, knowledge of regulatory environments and
finding funding; and 3. Other skills, for example, IT and websites and how to deal with employment law.
Chart 32. Percentage expressing needs for particular support
Summary Needs -% Expressing NeedResponses to Question 16
Marketing44%
Sales &Customers
42%
Management33%
Regulatory32%
SkillsTraining
32%
FundingOptions
31%
IT & Web25%
EmployeeRegs22%
Tier 3Other Issues
Tier 1Finding Customers, Sales
and Marketing
Tier 2Running and Funding the
Company
Source: Authors’ Survey
Our aspiring entrepreneurs want assistance to (i) build their sales, customer acquisition (and retention) and marketing plans; (ii) develop the skills and resources (including financial) to run and grow their company; and (iii) manage technical issues such as the web or employment law. Both case study comments and the survey results suggest that entrepreneurs value interpersonal contact and learning by engaging with experts, mentors and peers. Three further elements also emerged. First, the case studies showed that aspiring entrepreneurs want to reduce their personal risk. Second, both the case studies and survey showed a need to build entrepreneurs’ confidence in their own abilities. Third, our research suggests a need to substitute for the market and innovative pull of belonging to a global supply chain.
The Entrepreneurial Support Space
Formal learning, action-based assignments, mentoring, information-sharing and business networking will be easier if there is a single place providing entrepreneurial support. These places are sometimes called “incubators” or “accelerators”, and are often associated with provision of office space, perhaps coupled with some mentoring or advice.
The survey results suggest something broader may be more appropriate in the Western Balkans. We suggest it may be helpful to establish a place to provide entrepreneurs with a “safe haven”, where
they can network with other entrepreneurs (current, former and aspiring), and participate in learning, including through a regular program of events designed to broaden horizons. This would be linked to or provided by an “anchor institution” for entrepreneurial activity, such as an entrepreneurial university (Culkin, 2016), which would act as a non-profit locus for entrepreneurial activity in the region.
Suggestion 8. Build an “anchor” entrepreneurial space in each region
Provide a place in each region where entrepreneurs can access training and support resources, network with others and engage with appropriate mentors.
The “Entrepreneurial University”
Most universities would claim to be outward-looking and entrepreneurial. Brint (2017) provided a valuable insight into the role of universities in actively engaging and sponsoring innovators, including supporting the top 50 innovations in the past 50 years. Stanford on the US West Coast, for example, is famous for its close links to the Silicon Valley technology community, and provided early support to Google as a university research project (O’ Shaughnessy, 2016). Entrepreneurial universities, however, do more than hosting and nurturing early-stage technology innovators. Universities have a range of highly relevant knowledge in both business-facing activities (though business schools) and technical development through science, engineering and technology schools. Undergraduate and taught postgraduate courses are by necessity inwardly-focused to enable awarding of degrees. An entrepreneurial university, however, takes these teaching and learning capabilities and makes them outward-facing and demand-driven components of entrepreneurs’ personal active learning experience (Culkin, 2016).The output of this process is the building of a diverse local community of vibrant, innovative, growing and entrepreneurial firms. The metrics for success relate to firm profitability and life, serial entrepreneurship, firm growth, innovation, and penetration or disruption of new and existing markets. Success in this area feeds back into the university’s research, on both technologies and business methods and strategies.“University” status for the entrepreneurial program helps to attract appropriate mentors, because it offers the opportunity to publicise mentors’ careers and achievements. The university’s detailed engagement with business support organisations such as the local Chamber of Commerce opens new and exciting two-way learning and dialogue opportunities between local business and academia.
Suggestion 9. Nurture outward looking “entrepreneurial universities”
Develop an outward-looking ethos in nominated “entrepreneurial universities”, to complement their standard formal teaching, degree-awarding and research functions. Measure the “entrepreneurial university” component by its contribution to establishing and growing small entrepreneurial and innovative firms in the area.
Turning Aspiration into Reality
Entrepreneurial aspirations become reality through the coordinated and positive working of multiple factors (Isenberg, 2015). These factors are sometimes overt and sometimes hidden, and also combine uniquely for each individual success. It is a common mistake to assume that the state or some external organisation can sprinkle “magic dust” and make these elements come together into successful businesses. The orchestrator, and the key element in driving success, is the individual entrepreneur or entrepreneurial team, although others can help.
Success will not come immediately. Sometimes failure can be considered success, if it enables learning that supports future success. Isenberg (2011) described failure as coming early and successes taking time. Entrepreneurs need to be encouraged to see that their road to success is exactly that: a journey, which can be shortened by taking certain shortcuts. The role of the entrepreneurial support program is to help propagate and develop these shortcuts for each business. We now give a few examples as to how this process could work in practical terms.

68 69Looking To The Future Western Balkans Entrepreneurial Capability Report
Chart 33 suggests a teaching module to help aspiring entrepreneurs drive sales, Chart 34 suggests some elements for a marketing skills module, and Chart 35 describes learning about access to finance.
Chart 33. Proposed sales skills module
Sales Skills & Sales Connections
Sample On Line Modules Sample Group SessionsReaching Your Customers (sales outlets, online
New sale
Angry customer with failed product
Customer types/modes of acquisition/Sales Channels
Relationship ladderCosts to serve
Friends and Family
Co-workers/peers
Industry contracts personally know
Online with businesses in any sector
Face to face in any sector
Online with businesses in same sector
Face to face in same sector
Serbian Business Support Network
Other
Eur Bank Reconstruction & Development
1.2.3.4.5.6.7.8.9.
10.
44.3%38.1%32.0%23.7%20.6%19.6%13.4%12.4%2.1%1.0%
(sources and
(some customers cheaper to serve
(search for the win-win, tactics, trial
(how to be specified and
channels and distributors) Target Outcomes: list outpossible outlets - and identify where you talk directlywith your customers and whre you rely on others to do it for you
costs). Target Outcomes: retaining a happy customerusually cheaper than finding a new one; estimate own acquisition costs.
than others). Target Outcomes: estimate how much yourcustomers cost to keep happy (what offer do youneed to make to excite and delight yout customers).
closure and full closure) Target Outcomes, prepare for agroup session role play
recommended) Target Outcomes: identify who canrecommend and specify you to end customers
“These are my customers and this is how I am goingto reach them”
Negotiation Role Play
Cost To Serve
Relationship Ladder
Negotiation
Customer Acquisition and Retention
Objective: Understand the sales process and relationship ladder, identify potential customers and develop negotiating skills
Who Do You Ask For Help To Find Customers?Survey Question 15
Enhance customeracquisition and selling
skills to complementexisting acquisition
routes and capabilities
Source: Authors
Chart 34. Proposed marketing skills module
Marketing
Sample On Line Modules Sample Group Sessions
Who Do You Ask For Help In Marketing
Strategic Marketing 101 (market defiition & sizing,competitor analysis, positioning and branding) TargetOutcomes: Marketing situation analysis, strenghts andweakness analysis and opportunity matrix
Competitor & Market AnalysisBranding and Positioning Plan Strengths and Weaknesses
Friends and Family
Co-workers/peers
Industry contacts personally know
Online with businesses in any sector
Face to face with business in any sector
Online with businesses in same sector
Serbian Business Support Network
Face to face with businesses in same sector
Bank of Reconstruction and Development (Bosnia)
Other
Macedonian Entrepreneurship Agency
1.
2.
3.
4.
5.
6.
7.
8.
9.
10.
11.
39.0%
33.0%
28.0%
25.0%
19.0%
13.0%
12.0%
12.0%
6.0%
3.0%
1.0%
“P’s - Product, Place, Promotion and Price). TargetOutcome: build launch plan.
this links to market research; database lists). TargetOutcomes: How to build a list of target customers tcontact
and returns handling). Target Outcomes: Transformingcomplainers into loyal customers.
blogging, email campaigns, web design). Target Outcome:build a digital campaign.
(4x1 units) (launch plan, four
(web advertising, social media,
(customer types, drivers and how
(complaint
(1hr Each)
Tactical Marketing
Digital Marketing
Customer Profiling
Customer Service As A Marketing Tool
Marketing Situation Analysis
Launch Plan
Digital Marketing Plan
Survey Question 15
Objective: Understand strategic and tactical marketing, build a strategic marketing plan and construct product launch plan
Co
mp
lem
ent
Exis
ting
Cap
abili
ties
Source: Authors
Chart 35. Proposed module on access to finance
Access To FinanceUnderstand strategic and tactical marketing, build a strategic marketing plan and construct product launch plan
Co
mp
lem
ent
Exis
ting
Cap
abili
ties
Sample On Line ModulesFinance Strategy
Raising Equity (1)
Raising Equity (2)
Raising Equity (3)
Leasing
Valuation
Asset Based Finance
Sample Group Sessions(types and sources of finance)
elevator pitch, pitch desk and business plan.business plan, valuations. Target outcomes: Understand
Targetoutcomes: Understanding finance sources/costs.
(selecting target funders) Targetoutcomes: build a target funders list.
(process, contact, presentation,term sheets, shareholder agreement) Target outcomes:Understand funding process
(valuation methods). Target outcomes:Understand ways to value a business
Target outcomes: Understand types of leasing and availability
Target outcomes: Understand invoice factoring
Elevator Pitch
Pitch Desk
Fund Raising Role Play
Who do you ask for help to access finance?Survey Question 15
1. Friends and Family
2. Co-workers/peers
3. Online with businesses in any sector
4. Serbian business support sector
5. Face to face with business in any sector
6. Face to face with business in same sector
7. Industry contacts personally know
8. Online with businesses in same sector
9. Bank for Reconstruction and Development (Bosnia)
10. Other
11. Macedonian Entrepreurship Agency
12. Montenegro Agency for SMEs
40,5%
32%
24,2%
19,6%
19%
15%
15%
14,4%
8,5%
7,2%
3,9%
1,3%
Source: Authors
Chart 36 shows the entrepreneurial process, and Chart 37 the role of the entrepreneurial university in this.
Chart 36. Entrepreneurial process
Win
Cus
tom
ers
Res
our
ce B
usin
ess
Produce / Product Service
Obtain Resources
QualityRegulatory CompliancePayments and ReceiptsLogistics
Customer Service
ConstantLearning AndImprovement
FinanceStockEquipmentSkillsEmployees
Buils A Tactical Marketing Plan
Identiifes customer prospectsThat motivates prospects totry product
Help entrepreneur to identifyniche market that is
Under servedOpen for new entrantsWithin their “skills potential”space and
Entrepreneur can offer a productor service with a special “edge”
Del
ight
Cus
tom
ers
Targ
et M
arke
t
Source: Authors

71Western Balkans Entrepreneurial Capability Report
Ch
art
37
. Th
e n
urt
uri
ng
ro
le o
f th
e en
trep
ren
euri
al u
niv
ersi
ty
Hel
p e
ntre
pre
neur
to
iden
tify
nich
e m
arke
t th
at is
Bui
ld A
Tac
tical
Mar
ketin
g P
lan
Entr
epre
neur
can
off
er a
pro
duc
to
r se
rvic
e w
ith a
sp
ecia
l “ed
ge”
Und
er s
erve
dO
pen
for
new
ent
rant
sW
ithin
the
ir “
skill
s p
ote
ntia
l”sp
ace
and
Pro
duc
t/P
rod
uct
Serv
ice
Qua
lity
Reg
ulat
ory
Co
mp
lianc
eP
aym
ents
and
Rec
eip
tsLo
gis
tics
Cus
tom
er S
ervi
ce
Ob
tain
Res
our
ces
Fina
nce
Sto
ckEq
uip
men
tSk
ills
Emp
loye
es
Iden
tifie
s cu
sto
mer
pro
spec
tsTh
at m
otiv
ates
pro
spec
ts t
otr
y p
rod
uct
Target Market Win Customers
Resource BusinessDelight Customers
Nur
turi
ng O
urEn
trep
rene
urs
Und
erTh
e U
mb
rella
of
An
“Ent
rep
rene
uria
lU
nive
rsity
”
Men
tori
ngN
etw
ork
ing
Act
ive
Lear
ning
Ass
ignm
ent
Co
nsta
ntLe
arni
ng A
ndIm
pro
vem
ent
Sou
rce:
Aut
hors
Three Possible Deliverables
This process is designed to deliver some important tangible elements.
Deliverable 1. Pre-Start-Up Screening
Entrepreneurs need to understand if their aspirations could work as a business. To do so, they need to understand markets, identify customers and their needs, define possible products and services and combine these into a view of the potential business. Identifying ideas that are unworkable early on saves later failure and may help to identify better alternatives. This deliverable goes some way to addressing aspiring entrepreneurs’ desire to reduce their risks.This process aims to ensure that start-ups grow, rather than failing in years one or two.
Deliverable 2. Entrepreneurial Confidence
Confidence comes from knowing how the business will acquire customers and that it has a competitive edge. This provides support at times when there seem to be more challenges than immediate successes.
Deliverable 3. Potential For Easier Access to Finance
A considered and costed business plan provides something for entrepreneurs to show lenders or capital providers to give them confidence. This confidence can be substantially raised if the entrepreneurial university develops a certification framework with local lenders, to give lenders confidence in the process used to develop plans.
There are good examples of this working in practice. Sufi (2009) demonstrated that financial markets are more accepting of debt for a company with a Ratings Agency score. The independent review gives investors more confidence in the firm’s ability to service debt. Bosch and Steffen (2010) showed that in the absence of certification, investor syndicates (where more than one investor buys issued debt) can also add confidence and provide a certification effect to help encourage others to buy the debt. Personal experience suggests that the same effects work in the private equity and venture capital markets, where some less obvious ventures can be made more interesting to investors by having accountant-verified feasibility studies or business plans.
There is also scope for the entrepreneurial university to host a community currency network, like the Sardex community currency used in Sardinia. This provides free working capital to local MSMEs who are network members, to enable trade between them. The results in Sardinia have been positive (BBC, 2018) and this type of network may help where initial working capital is either too expensive or difficult to obtain.
Suggestion 10. Develop a business plan certification standard to help access to finance
Business plan certification to a known standard reduces risk to lenders and investors. Developing a locally-acceptable certification standard could help improve access to finance.

73Western Balkans Entrepreneurial Capability Report
SUMMARY SUGGESTIONS / DELIVERABLES
No Suggestion
1
Improve the status of entrepreneurs through educational intervention Introduce entrepreneurship awareness teaching to encourage early entrepreneurial experimentation.
Modules should be made available in schools and undergraduate courses, and effort rewarded with awards. Encourage a risk-taking culture that sees any failure as a lesson on the road to success.
2
Build local social network pages hosted by the local Chamber of Commerce and promote local entrepreneurship awards
Encourage all entrepreneurs to link their websites to the local Chamber of Commerce, making each Chamber a focal point to facilitate local entrepreneurial networks. Each Chamber of Commerce should also build and host a local business directory, with links to the social networking pages, and run local awards events to reward the
best local entrepreneurs. These award systems should be linked to themed awards (for example “Climate Change Entrepreneur of the Year”), and media coverage should be coordinated to promote awareness of entrepreneurship.
3
Promote a common and positive definition of “businessperson”, particularly for those running MSMEsWe propose the following definition:
“An MSME businessperson has the interpersonal, technical and financial skills to (i) decide upon a product that customers want, and (ii) provide it at a price that customers can afford and that is competitive with alternative offers,
and the necessary skills to translate (i) and (ii) into a profitable business that generates cash.”
4Entrepreneurs must decide what support they need
In designing a program to develop aspiring entrepreneurs into MSME businesspeople, each aspiring entrepreneur needs to “own” and take responsibility for deciding what additional help and skills they need.
5
Enable entrepreneurs to identify their needsProvide a structured process for entrepreneurs to talk through their business ideas and identify their development needs. Ideally, entrepreneurs could attend screening weekends to help them understand their business and their
needs.
6
Support needs to be focused on MSME objectives, and flexibly deliveredThe nature of entrepreneurs and the time pressures on them mean that support needs to be delivered as flexibly as possible, mixing formal with informal and blending practical with taught skills. In effect this is a “two birds with one
stone” strategy, enabling entrepreneurs to learn and develop key skills while building their business.
7
Encourage entrepreneurs to pursue continual learning and improvementBy propagating a culture of active learning, realistic planning and continual execution, entrepreneurs should be
encouraged to learn continuously, and particularly to learn to identify the point at which it is best to shift direction if the current plan is failing.
8Build an “anchor” entrepreneurial space in each region
Provide a place in each region where entrepreneurs can access training and support resources, network with others and engage with appropriate mentors.
9
Nurture outward looking “entrepreneurial universities” Develop an outward-looking ethos in nominated “entrepreneurial universities”, to complement their standard formal
teaching, degree-awarding and research functions. Measure the “entrepreneurial university” component by its contribution to establishing and growing small entrepreneurial and innovative firms in the area.
10Develop a business plan certification standard to help access to finance
Business plan certification to a known standard reduces risk to lenders and investors. Developing a locally-acceptable certification standard could help improve access to finance.
Some Possible Deliverables
1
Pre-Start-up ScreeningEntrepreneurs need to understand if their aspirations could work as a business. To do so, they need to understand markets, identify customers and their needs, define possible products and services and combine these into a view
of the potential business.
2Entrepreneurial Confidence
Confidence comes from knowing how the business will acquire customers and that it has a competitive edge. This provides support in the inevitable moment when there seem to be more challenges than immediate successes.
3
Potential For Easier Access to FinanceA considered and costed business plan provides something for entrepreneurs to show lenders or capital providers
to give them confidence. This confidence can be substantially raised if the entrepreneurial university develops a certification framework with local lenders, to give lenders confidence in the process used to develop plans.

75Western Balkans Entrepreneurial Capability Report
REFERENCES
Aghion, P., and Howitt, P. (1992). A model of growth through creative destruction. Econometrica, 60(2), 323–351.
Ballinger, G. A., and Rockmann, K. W. (2010). Chutes versus ladders: Anchoring events and a punctuated-equilibrium perspective on social exchange relationships. The Academy of Management Review, 35(3), 373–391.
Barnes, J., and Liao, Y. (2012). The effect of individual, network, and collaborative competencies on the supply chain management system. International Journal of Production Economics, 140(2), 888–899.
BEEPS (2018). Business Environment and Enterprise Performance Survey. European Bank of Reconstruction and Development: London. Waves 4 and 5. Retrieved from http://ebrd-beeps.com/data/
BIS (2017). Consolidated positions on counterparties resident in Serbia, Table B.4. Bank of International Settlements: Basel. Retrieved from https://www.bis.org/statistics/b4-RS.pdf
Bobić, D. (2017). Youth entrepreneurship in Serbia - mapping barriers to youth entrepreneurship. Centre for Advanced Economic Studies, Belgrade. Retrieved from http://odskoledoposla.org/wp-content/uploads/2017/05/Mapping-barriers-to-youth-entrepreneurship.pdf
Borozan, D., and Pfeifer, S. (2014). Exploring entrepreneurs’ motivation: Comparison of Croatia, European post-socialist and developed countries. The Journal of Entrepreneurship, 23(2), 263–287.
Brint, S. (2017). The role of university researchers in 50 top inventions, 1955–2005. Retrieved from http://www.education.ox.ac.uk/about-us/events/events-archive/
Buchmann, T., and Pyka, A. (2012). The evolution of innovation networks: the case of the German automotive industry. Economics and Management, 2012. University of Hohenheim, Economics Institute, Innovation Economics, Stuttgart. Retrieved from https://economics.handels.gu.se/digitalAssets/1393/1393467_pyka-paper.pdf
Chepurenko A and Vilenski A (2016). SME policy of the Russian State (1990–2015): from a “generalist” to a “paternalist” approach. Working Paper WP1/2016/02 National Research University Higher School of Economics, Moscow (Series WP1 Institutional Problems of Russian Economy). Retrieved from https://publications.hse.ru/en/preprints/198175573
Cheshire T. (2011). In depth: How Rovio made Angry Birds a winner (and what’s next) [blog post]. Retrieved from http://www.wired.co.uk/article/how-rovio-made-angry-birds-a-winner
Coman, A., and Ronen, B. (2007). Managing strategic and tactical constraints in the hi-tech industry. International Journal of Production Research, 45(4), 779–788.
Cruz, J. M., and Liu, Z. (2011). Modeling and analysis of the multiperiod effects of social relationship on supply chain networks. European Journal of Operational Research, 214(1), 39–52.
Culkin, N. (2016). Entrepreneurial universities in the region: the force awakens? International Journal of Entrepreneurial Behavior and Research, 22(1), 4-16.
DG Enlargement (2017). EU – West Balkans Youth Forum Summary Conclusions. European Commission DG Neighbourhood Enlargement: Brussels, Trieste Conference July 2017. Retrieved from https://ec.europa.eu/neighbourhood-enlargement/sites/near/files/conclusions_of_working_groups_-eu-wb_youth_forum_trieste_2017.pdf
DFID (2017). DFID: Economic Development Strategy: prosperity, poverty and meeting global challenges 2017. Retrieved from https://www.gov.uk/government/uploads/system/uploads/attachment_data/file/587374/DFID-Economic-Development-Strategy-2017.pdf

76 77References Western Balkans Entrepreneurial Capability Report
Duarte, D. F., Matias Gama, A. P., and Esperança, J. P. (2017). Collateral-based in SME lending: The role of business collateral and personal collateral in less-developed countries. Research in International Business and Finance, 39, 406–422. 10.1016/j.ribaf.2016.07.005
Dunford, M., Lee, K. H., Liu, W., and Yeung, G. (2013). Geographical interdependence, international trade and economic dynamics: The Chinese and German solar energy industries. European Urban and Regional Studies, 20(1), 14–36. doi:10.1177/0969776412448093
Dyerson, R. (1992). Inmos: A case of unsuitable corporate governance? Business Strategy Review, 3(1), 13–27.
EBRD (2015). Macedonian SMEs are becoming more competitive thanks to EU and EBRD. EBRD: London, European Bank for Reconstruction and Development. Retrieved from http://www.ebrd.com/news/2015/macedonian-smes-are-becoming-more-competitive-thanks-to-eu-and-ebrd.html
EIB (2017). Where to access finance - EIF financial intermediaries. European Investment Bank: Luxembourg. Retrieved from: http://www.eif.org/what_we_do/where/index.htm
EIB (2016). FYROM Assessment of financing needs of SMEs in the Western Balkans countries. European Investment Bank: Luxembourg. Retrieved from: http://www.eib.org/attachments/efs/assessment_of_financing_needs_of_smes_fyrom_en.pdf
Eichengreen, B., and Gupta, P. (2016). Managing sudden stops. Retrieved from http://documents.worldbank.org/curated/en/877591468186563349/Managing-sudden-stops
Estrin, S., and Uvalic, M. (2014). FDI into transition economies: Are the Balkans different? Economics of Transition, 22(2), 281–312. doi:10.1111/ecot.12040
European Commission (2009). The West Balkans in transition. Occasional Paper 46 May 2009, European Commission DG Economic and Financial Affairs : Brussels, Retrieved from: http://ec.europa.eu/economy_finance/publications/pages/publication15155_en.pdf
European Commission (2016). 2016 SBA Fact Sheet Serbia. Retrieved http://bit.ly/2ojHtkw
European Commission (2017a). Serbia 2016 Report. Commission Staff Working Document. Retrieved from https://ec.europa.eu/neighbourhood-enlargement/sites/near/files/pdf/key_documents/2016/20161109_report_serbia.pdf
European Commission (2017b). Commission Implementing Decision C(2017) 1042, Annex I, C(2017) 4563 final. Retrieved from http://ec.europa.eu/DocsRoom/documents/24803
European Commission (2017c). 2017 SBA Fact Sheet Serbia. Retrieved from https://ec.europa.eu/neighbourhood-enlargement/sites/near/files/serbia_sba_fs_2017.pdf
Freevectormaps (2017). Outline map for Europe. Retrieved from https://freevectormaps.com/world-maps/europe/WRLD-EU-01-0003
Gapinski J., Škegro B., and Zuehlke T. (1989). Modeling the Economic Performance of Yugoslavia. New York: Praeger, 1989, p. 32
Gkypali, A., and Roper, S. (2017). Home Alone: Innovation and sales growth intentions among the sole self-employed. Research Paper No 59. Retrieved from https://www.enterpriseresearch.ac.uk/our-work/publications/
Gereffi G. (2014). Global value chains in a post-Washington Consensus world. Review of International Political Economy, 21(1), 9–37. DOI: 10.1080/09692290.2012.756414
Gilad, B., and Levine, P. (1986). A behavioral model of entrepreneurial supply. Journal of Small Business Management, 24(4), 45–53.
Grilo, I., and Irigoyen, J. (2006). Entrepreneurship in EU: To wish and not to be. Small Business Economics, 26(4), 305–318.
Hauser P., Dolgaya T., Revenko S., Kortenbusch M. (2016). Assessment of financing needs of SMEs in the Western Balkans countries. Synthesis report, Regional Studies and Roundtables, European Investment Bank (EIB): Luxembourg. Retrieved from http://www.eib.org/infocentre/publications/all/econ-synthesis-report-assessment-of-financing-needs-of-smes-in-the-western-balkans.htm
ILO (2017). Employees By Status. Retrieved from http://www.ilo.org/ilostat/faces/ilostat-home/download?_adf.ctrl-state=1dk6b4s0b4_62&_afrLoop=296250666539916#!
IMF (2015). The Western Balkans: 15 Years of Economic Transition. Retrieved from http://www.imf.org/external/pubs/ft/reo/2015/eur/eng/erei0315.htm
IMF (2017a). Current Account as a % of GDP. Retrieved from http://www.imf.org/external/datamapper/BCA_NGDPD@WEO/OEMDC/ADVEC/WEOWORLD/ADO/ALB
IMF (2017b). Foreign Direct Investment Flows (CDIS). Retrieved from Table 3 http://data.imf.org/?sk=40313609-F037-48C1-84B1-E1F1CE54D6D5&sId=1482331048410
IMF (2017c). GDP Current Price Data. Retrieved from http://www.imf.org/external/datamapper/NGDPD@WEO/OEMDC/ADVEC/WEOWORLD/POL
IMF (2017d). Europe Hitting Its Stride. Europe Regional Economic Survey, Nov 2017, IMF, Washington. Retrieved from https://www.imf.org/en/Publications/REO/EU/Issues/2017/11/06/Eurreo1117
IMF (2018). GDP Per Capital: Current US$ Prices. Retrieved from: http://www.imf.org/external/datamapper/NGDPDPC@WEO/OEMDC/ADVEC/WEOWORLD
Janeska, V., Mojsovska S., and Lozanoska, A. (2016). Brain Drain From The Republic Of Macedonia - Trends, Implications, Policies. Economic Development. 2016, 18(3), 22-37.
Kurtovic, S., Todorovic, J. Đ., and Siljkovic, B. (2014). Determinants of foreign direct investments and transition countries of the Western Balkans. International Journal of Economic Perspectives, 8(2), 43–57.
Leitner, S. M. (2016). Financing constraints and firm growth in emerging Europe. South East European Journal of Economics and Business, 11(1), 18-40.
Lackéus, M. (2015). Entrepreneurship in education-What, why, when, how. Background paper for OECD-LEED. Retrieved from https://www.oecd.org/cfe/leed/BGP_Entrepreneurship-in-Education.pdf.
Levie, J. (2014). State of Small Business Britain Conference 2014 -- The Ambition Gap. Enterprise Research Centre. Retrieved from http://strathprints.strath.ac.uk/59371/
Lin, J. Y. (2015). The Washington Consensus revisited: a new structural economics perspective. Journal of Economic Policy Reform, 18(2), 96–113.
Liotta P. (2001). Paradigm lost: Yugoslav self-management and the economics of disaster. Balkanologie, V(1–2). Retrieved from http://journals.openedition.org/balkanologie/681
Littera, G., Sartori, L., and Dini, P. (2017). From an idea to a scalable working model: merging economic benefits with social values in Sardex. International Journal of Community Currency Research, 21(Winter), 6–21 Retrieved from http://dx.doi.org/10.15133/j.ijccr.2017.002
Moder, I. and Bonifai, N. (2017). Access to finance in the Western Balkans. Occasional Paper #197 Sept 2017, European Central Bank, Frankfurt. Retrieved from: https://www.ecb.europa.eu/pub/pdf/scpops/ecb.op197.en.pdf?24296e890f7f5c039848046670a9769a
Nichter, S., and Goldmark, L. (2009). Small firm growth in developing countries. World Development, 37(9), 1453–1464.
O’Shaughnessy, K. (2017). History of the Internet Part Eight: The Google Story [blog post]. Retrieved from https://simpleprogrammer.com/2017/12/15/history-internet-eight-google-story/
Prologis (2017). Europe’s Most Desirable Logistics Locations. Retrieved from: https://www.prologis.com/logistics-industry-research/customer-growth-strategies-europes-most-desirable-logistics-locations
Posnett E. (2015, September 18). The Sardex Factor. Financial Times: Retrieved from https://www.ft.com/content/cf875d9a-5be6-11e5-a28b-50226830d644
Radenko, Š., Žarko, L., and Marijan, P. (2015). Political developments and unrests in Stara Raška (Old Rascia) and old Herzegovina during Ottoman rule. Balcanica, 2015(46), 79–106. doi:10.2298/BALC1546079S

78 79References Western Balkans Entrepreneurial Capability Report
Rahman, A., Rahman, M. T., and Belas, J. (2017). Determinants of SME finance: Evidence from three central European countries. Review of Economic Perspectives, 17(3), 263–285. 10.1515/revecp-2017-0014
Ricardo, D. (1815). An essay on the influence of a low price of corn on the profits of stock. In P. Sraffa (Ed.) The Works and Correspondence of David Ricardo (1951), Vol. 4 Pamphlets and Papers 1815-1823 [1815]. Cambridge University Press: Cambridge UK.
Risteska, A., Nikoloski, D., Gveroski, M., Spaseska, T., and Risteska, F. (2014). Analysis Of Smes Financing In The Republic Of Macedonia – Conditions And Perspectives. Analele Universităţii Constantin Brâncuşi Din Târgu Jiu: Seria Economie, 1(3), 9-16
Saridakis, G., Lai, Y., Muñoz Torres, R. I. and Mohammed, A-M. (2017). Actual and intended growth in family firms and non-family owned firms: Are they different? Research Paper No 60, July, Enterprise Research Centre. Retrieved from: https://www.enterpriseresearch.ac.uk/publications/actual-intended-growth-family-firms-non-family-owned-firms-different-research-paper-no-60/
Schneider, F. (2010). The influence of public institutions on the shadow economy: An empirical investigation for OECD countries. Review of Law and Economics, 6(3), 441-468.
Selwood, R. (2007). The INMOS Legacy [blog post]. Retrieved from http://www.inmos.com/inmos_legacy.html
Serbstat (2016). Statistical Year Book 2016 showing 2014 data. Retrieved from http://pod2.stat.gov.rs/ObjavljenePublikacije/G2016/pdf/G20162019.pdf
SIC (2008). International Standard Industrial Classification Rev 4.0. United Nations, New York. Retrieved from https://unstats.un.org/unsd/cr/registry/regdnld.asp?Lg=1
Stefanovića, I. D., Miloševićb, D., and Miletića, S. (2009). Significance and development problems of SMEs in contemporary market economy. Serbian Journal of Management, 4(1), 127–136. Retrieved from http://www.sjm06.com/SJM%20ISSN1452-4864/4_1_2009_May_1-136/4_1_127-136.pdf
Stiglitz, J., and Weiss, A. (1981). Credit rationing in markets with imperfect information. American Economic Review, 71, 393–410.
Sturgeon, T., Biesebroeck, J. V., and Gereffi, G. (2008). Value chains, networks and clusters: Reframing the global automotive industry. Journal of Economic Geography, 8(3), 297–321.
Tang, C. S., Zimmerman, J. D., and Nelson, J. I. (2009). Managing new product development and supply chain risks: The Boeing 787 case. Supply Chain Forum: An International Journal, 10(2), 74-86.
UK Government (2015). National Security Strategy and Strategic Defence and Security Review 2015. Retrieved from: https://www.gov.uk/government/uploads/system/uploads/attachment_data/file/555607/2015_Strategic_Defence_and_Security_Review.pdf
UK Government (2017). Prosperity Fund Annual Report. Retrieved from : https://www.gov.uk/government/publications/prosperity-fund-annual-report-2016-to-2017
Williamson, J. (2005). The strange history of the Washington Consensus. Journal of Post Keynesian Economics, 27(2), 195–206.
WBEDIF (2018). Loan Guarantee Facility of the European Investment Fund, Luxembourg. Retrieved from http://www.wbedif.eu/about-wb-edif/guarantee-facility/
Wojciechowski, L. (2013). The determinants of FDI flows from the EU-15 to the Visegrad Group Countries - a panel gravity model approach. Entrepreneurial Business and Economics Review, 1(1), 7–22. doi:http://dx.doi.org/10.15678/EBER.2013.010102
World Bank (2012). Bank lending to small and medium enterprises: the Republic of Serbia. Retrieved from https://openknowledge.worldbank.org/handle/10986/12796.
World Bank (2017a). Per capita GDP at constant 2011 US$ prices. Retrieved from https://data.worldbank.org/indicator/NY.GDP.PCAP.PP.KD
World Bank (2017b). Consumption at constant 2010 US$ prices. Retrieved from https://data.worldbank.org/indicator/NE.CON.TOTL.KD
World Bank (2017c). Gross Capital Formation at constant 2010 US$ prices. Retrieved from https://data.worldbank.org/indicator/NE.GDI.TOTL.KD
World Bank (2017d). Sustainable Development Goals. Retrieved from https://sustainabledevelopment.un.org/sdgs
World Bank (2017e). Sustainable Development. Retrieved from http://www.worldbank.org/en/topic/sustainabledevelopment
World Bank (2017f). New Businesses Registered. Retrieved from https://data.worldbank.org/indicator/IC.BUS.NREG?view=chart.
World Bank (2017g). Entrepreneurship – Doing Business Survey 2017. Retrieved from http://www.doingbusiness.org/data/exploretopics/entrepreneurship.
World Bank (2017h). Revving up the engines of growth and prosperity in the Western Balkans. Retrieved from http://www.worldbank.org/en/region/eca/publication/revving-up-engines-of-growth-and-prosperity-in-western-balkans
Yaldiz Hanedar, E., Broccardo, E., and Bazzana, F. (2014). Collateral requirements of SMEs: The evidence from less-developed countries. Journal of Banking and Finance, 38(1), 106–121. 10.1016/j.jbankfin.2013.09.019
Zeneli, V. (2017). Migration, Brain Drain and the West Balkans. The Globalist. Retrieved from: https://www.theglobalist.com/european-union-migration-brain-drain-and-the-western-balkans/
80 References
About The Report Authors
Nigel Culkin is Professor of Enterprise and Entrepreneurial Development at the University of Hertfordshire. He has published widely in the areas of small business leadership, entrepreneurial universities, graduate entrepreneurship and the creative industries, as well as leading projects for UK and overseas government agencies, large multinational organisations and research councils. In 2014, he was elected to the post of President at the Institute for Small Business and Entrepreneurship (ISBE); and, in 2015, was invited to join the prestigious Peer Review College at the Economic and Social Research Council (ESRC). He is a regular attendee at the UNCTAD Expert Meeting on entrepreneurship and building productive capacities, held in Geneva.
Richard Simmons is an economist with enduring expertise in MSMEs as innovation engines. He has a strong belief in market solutions, with interests in growth processes, ethical financing and dynamic (including monetary) equilibrium in an entrepreneurially driven and financially sophisticated world. Formerly holding senior regional and global management roles in various leading-edge high technology and medical device firms, he has lived and worked globally. He now advises a senior global investor based in Riyadh and is a Researcher at the Univrsity of Hertfordshire.
The report authors new book, will be available in May 2018.Culkin, N. and Simmons, R. (2018). Mastering Brexits Through The Ages: Entrepreneurial Innovators and Small Firms -The Catalysts for Success. Emerald Publishing.
(Footnotes)1 Banja Luka has a population of nearly 200,000 and is the second largest city in Bosnia and Herzegovina. It currently has four wedding halls, which all offer traditional services.2 Filigree jewellery has very ornate metalwork designs and is an ancient art that started in Mesopotamia, was popular in Etruscan times and in more recent times has been associated with a geographical band stretching from Bodrum in Asiatic Turkey through European Turkey and into the Balkans.3 Belgrade is located in Serbia with an insurance market dominated by non-life business (76.3%). Motor claims represented about 50% of total Q1 2017 claim payouts of around 66 million EUR, giving an estimated claims volume of around 250 million EUR on an estimated premium income of around 0.5 and 1 billion EUR (source xprimm.com).

© British Council 2018 The British Council is the United Kingdom’s international organisation for cultural relations and educational opportunities.
www.britishcouncil.org
ISBN 978-0-86355-894-8