financial health, exports and firm survival: a comparison of british
TRANSCRIPT

Financial health, exports and firm survival: A comparison of British and French firms by Holger Görg and Marina-Eliza Spaliara
No. 1568| October 2009

Kiel Institute for the World Economy, Düsternbrooker Weg 120, 24105 Kiel, Germany
Kiel Working Paper No. 1568| October 2009
Financial health, exports and firm survival: A comparison of British and French firms
Holger Görg and Marina-Eliza Spaliara
Abstract: We examine the differential effects of financial status and exporting activity on the likelihood of survival for firms in the UK and France - two countries with different financial systems. We aim to answer two main questions: What is the direct impact of financial characteristics and different facets of exporting activity on the likelihood of survival? Do the sensitivities of survival incidence to financial variables vary with the exporting status of firms? We find strong evidence that continuous exporters face a higher probability of survival compared to starters, continuous non-exporters and firms exiting the exporting market. Further, important sensitivities of survival prospects to financial indicators are observed for the UK firms which might be explained by the "market based" economy. Finally, a within and across countries comparison reveals that the survival of exporting groups varies substantially depending on firms' financial status, the financial system and the prolonged participation in the export market..
Keywords: Financial health, exports, firm survival
JEL classification: F1, L2, G3 Holger Görg Kiel Institute for the World Economy 24100 Kiel, Germany Telephone +49 431 8814 258 E-Mail: [email protected]
Marina-Eliza Spaliara University of Loughborough Loughborough, United Kingdom E-Mail: [email protected]
*Acknowledgements: The authors would like to thank Spiros Bougheas, Alessandra Guariglia, and seminar participants at the 2009 RES conference in Surrey, the 2009 EARIE conference in Ljubljana, the 2009 ETSG conference in Rome, the University of Patras and the Kiel Institute for the World Economy for constructive comments and suggestions. Holger Görg is also affiliated with GlobID at Aarhus School of Business and GEP Nottingham. This research was supported by the European Cooperation in Science and Technology, grant COST ISO701, STSM. Any remaining errors are our own. ____________________________________ The responsibility for the contents of the working papers rests with the author, not the Institute. Since working papers are of a preliminary nature, it may be useful to contact the author of a particular working paper about results or caveats before referring to, or quoting, a paper. Any comments on working papers should be sent directly to the author. Coverphoto: uni_com on photocase.com

1 Introduction
One of the most visible threats from the current financial crisis for economic performance, at
least as portrayed by the media, is the closure of firms and the resulting employment losses
in the economy. Drop in demand and lack of access to external finance may seriously impede
firms with the result that some have to shut down. The recent debate about the efforts to
ensure the survival of the European carmaker Opel is a prominent example for this.
The recent crisis highlight two important aspects that may influence firm survival: fi-
nancial health and access to export markets. Financial health or, on the flip side of the
coin, constraints in access to finance, is important as it has implications for investment, firm
growth and survival as shown in recent theoretical and empirical work (e.g., Clementi and
Hopenhayn (2006) and Bond et al. (2003)). Access to export markets is also important, as
shown recently by Greenaway et al. (2008), who find empirical evidence that the exporting
status of a firm is positively correlated with its probability of survival.
This paper brings together these two aspects and looks in detail at the link between
financial health of a firm, export status, and firm survival. Disentangling these two effects is
not only of academic interest but also highly relevant for policy, in particular, but not only,
in the current economic climate. If access to finance is the sole determinant of survival, then
government policy concerned with firm exit need to target financial markets and institutions.
If the export status of firms matters, then government policy needs to think very carefully
about any moves towards more protectionism. From an economic policy point of view,
understanding firms’ survival is important, as exit, survival and growth of firms are important
aspects of industry dynamics, forming the competitive landscape in an economy.
We analyse this issue modelling empirically the determinants of firm survival using firm
level panel data for the United Kingdom and France.1 This allows us to compare the per-
formance of firms in these two countries with different financial systems – the UK having a
more “market based” and France more “bank based” approach to company finance (Benito
(2005); Bond et al. (2003); Carlin and Mayer (2000) and Rajan and Zingales (2003)). Us-
ing short term debt to total debt as a proxy for bank dependence, our data indicate that
the ratio has a mean of 0.90 for France and 0.68 for the UK giving further support to the
literature.
1Bridges and Guariglia (2008) examine with UK data the relationship between access to finance andfirm survival, distinguishing between foreign and domestic firms and exporters and non-exporters. Mussoand Schiavo (2008) use French firm level data to examine the relationship between financial constraints andsurvival. We expand on their analysis using more up-to-date data for the UK and France, distinguishing theUK and France using comparable firm level data, and examining different aspects of the exporting status(starters, stoppers, continuers). Another related paper for the UK is by Disney et al. (2003). They analysedeterminants of establishment exit but do not consider finance or export status.
2

We might expect that financial variables play a different role for firms’ survival in the
“market based” UK, than in “bank based” France. Specifically, financial variables may be
less important in the “bank based” system, as banks provide effectively a monitoring process
by acquiring information about firms and managers. On a different point, the choice of the
two countries is also motivated by the fact that the UK and France are two of the largest
exporters in Europe and thus it is interesting to look at the nexus between exporting, finance
and firm survival.2 In our dataset 67% of French firms export their products whilst 44% of
the UK firms are exporters.3
We employ Amadeus, a rich firm-level dataset which is particularly suited to our work be-
cause it provides detailed financial information for the two countries that we use to calculate
a number of indicators that proxy for the financial health of firms. Amadeus is complemented
by the Zephyr database which is used to identify firms that are mistakenly coded as ‘dead’
in the former data due to mergers and acquisitions. We look in detail at the export status
of a firm, in particular whether a firm is an export starter, exiter, continuous exporter or
continuous non-exporter. According to Chaney (2005) being an exporter provides a signal
that the firm is wealthy and liquid enough to pay the sunk cost to enter the foreign market.4
Nevertheless, Greenaway et al. (2007) argue that continuous exporters enjoy better financial
health compared to export starters in the UK. Therefore, it is not clear whether all exporters
face similar survival prospects, and whether the link between financial health and survival
is the same for different types of exporters.
Hence, an important aim of the study is to look at interactions between financial health
and exporting status. We intend to assess whether the response to financial indicators varies
with the exporting status of firms, in order to examine whether access to finance is less (or
more) important for the survival of exporters than for other firms. According to Blalock
et al. (2008), Bridges and Guariglia (2008) and Desai and Forbes (2008) global engage-
ment improves firms’ performance by shielding them from financial constraints. But how
2According to the statistics presented by Mayer and Ottaviano (2007), France and the UK are the secondand the third biggest European exporters. Germany is the top exporter but due to lack of exporting datain the Amadeus database we have been unable to include it in this study.
3These preliminary statistics are in line with Bellone et al. (2008) and Mayer and Ottaviano (2007)who show that French exporters are 62% and 65% respectively. A common characteristic of our dataset(Amadeus) and their French data is that not only small and medium sized firms are included in our samplebut also large that are more likely to export. On the contrary, Eaton et al. (2004) show that only 21% of themanufacturing firms export their output. An explanation is that their French data are nearly comprehensiveand contain many more small firms who are less likely to export. As for our UK sample the percentage ofthe exporting firms is higher compared to Mayer and Ottaviano (2007) and lower compared to Greenawayet al. (2007). Both papers employ the Fame data with the former to find that 28% of the UK firms to exporttheir products and the latter 62%.
4Manova (2008) expands on this paper by showing how financial constraints matter for countries’ exportpatterns, using a heterogeneous firm type model.
3

do export starters and exiters cope with the sunk cost payment compared with continuous
exporters and non-exporters? Does established reputation by continuous exporting improve
their probability of survival? We expect to find that financial indicators have a differential
impact on particular classes of exporting firms’ likelihood of failure.
We find that both access to finance and export status matter for firm survival. Our results
suggest that continuous exporters face significantly higher survival prospects compared to
starters, continuous non-exporters and exiters and this might be due to their good financial
health and established reputation. Equally important is the finding that the “market based”
UK firms exhibit greater sensitivities of their survival probabilities to cash-flow and profits
terms in contrast to the “bank based” French firms. We also show that there are important
interactions between financial characteristics and different aspects of exporting activity. Our
results are robust to changes in specifications, to allowing for endogeneity of regressors in
an instrumental variables set-up and to estimating discrete time proportional hazard models
that are used in firm failure studies.
The rest of the paper is organised as follows. In Section two we present the empirical
methodology and introduce the variables to be used in the econometric analysis. Section
three describes the data and provides some descriptive statistics. Section four presents the
estimation results. Section five reports the robustness checks. Section six concludes the
paper.
2 Econometric Methodology
In this study we model the effects of financial variables and exporting activity on the proba-
bility of firm survival. In line with the literature (e.g., Greenaway et al. (2008) and Zingales
(1998)) we start with a probit model, which can be used to provide an estimate of the firm’s
survival prospects based on a range of relevant variables.
We assume that there is an underlying response variable, y∗it , the probability of failure
as a function of the vector of determinants of failure, Xit. This is defined by the regression
relationship, with slope parameters given by the vector β and a normally distributed error
term εit :
y∗it = Xitβ + εit (2.1)
In practice, y∗it is unobservable, and what we observe is a dummy variable yi defined by
4
yi =
1 if firm fails (die) at any time in the sample period,
0 if the firm does not fail.
yi = 1(y∗i > 0)
yi = 0(y∗i = 0)(2.2)
Our empirical specifications are motivated by the theoretical model by Clementi and
Hopenhayn (2006) in which they generate a role for capital structure and create a repeated
moral hazard model (i.e the Modigliani-Miller proposition does not hold). Their model
predicts that the failure rate decreases with size and age and the conditional probability of
survival increases with the value of the firm’s equity.5
Based on this model and related empirical work, we include among the explanatory
variables size and the age of the firm (Audretsch and Mahmood (1995); Geroski (1995) and
Dunne et al. (1988)). Hence, we introduce size (SIZE) measured as the logarithm of firm’s
i real sales at time t.6 Small firms may face higher restrictions on capital markets leading to
a higher risk of insolvency and illiquidity and consequently a higher risk of failure compared
to their counterparts. We also incorporate its square (SIZE2) to allow for non-linearities.
Furthermore, we include a variable defined as the current age (AGE) of firm i at time t.
New entrants face a greater risk of failure compared to older firms because of the ‘liability
of newness’ effect, which might be explained by noisy selection models (Jovanovic (1982)).
In line with the theory, a large number of empirical papers have shown that younger firms
are more likely to fail (e.g., Audretsch and Mahmood (1995); Disney et al. (2003) and Mata
and Portugal (1994)). Thus, we should expect the age of the firm to be positively related
with the probability of survival.
To incorporate a role for finance in the survival model, as suggested by Clementi and
Hopenhayn (2006), we include four variables which capture various aspects of the financial
health of a firm. The first is the profitability ratio (PROFITABILITY ) defined as the
ratio of firm’s profits before interests and tax to its total assets. Following Bridges and
Guariglia (2008) and Bunn and Redwood (2003) we anticipate a positive relationship between
profitability and the likelihood of survival.
Leverage (LEV ERAGE) is measured as the firm’s short-term debt to assets ratio. A
high leverage ratio is associated with a worse balance sheet situation, which would increase
moral hazard and adverse selection problems, and lead to the inability of firms to obtain
external finance at a reasonable cost. Bridges and Guariglia (2008) and Zingales (1998)
5The theoretical frameworks on survival introduced by Hopehayn (1992) and Jovanovic (1982), producesimilar results, without relying on moral hazard.
6However, Audretsch et al. (1999b,a) and Wagner (1994) find no clear-cut nexus between size and theprobability of survival. To check the robustness of our results we use two alternative measures of size suchas the number of employees and real total assets. Our results remain largely unaffected.
5
argue that higher leverage results in higher failure probabilities. Should this effect prevail,
one would expect a negative relationship between leverage and the probability of survival.
Yet, some authors argue that the probability for external finance increases for firms with high
leverage (see Dennis and Mihov (2003)). A high rate of leverage can be seen as an indicator
of a good credit standing and high borrowing capacity of firms. One would therefore expect
a positive relationship between leverage and the probability of survival. In any case, we
expect financial leverage to significantly affect the firm’s probability of survival.
As an additional financial indicator we use the coverage ratio (COV ERAGE), or cash
flow on interest payments, which measures the extent to which cash flow is sufficient to pay
for financial costs and is therefore related to credit worthiness. Coverage ratio has been used
in earlier studies (see Gertler and Gilchrist (1994) and Guariglia (1999)), as a measure of
the balance sheet strength. The higher the coverage ratio the stronger the balance sheet is.
We expect to find a positive impact of coverage on survival prospects.
We also include solvency (SOLV ENCY ) (shareholder’s funds/total assets), which is an
indicator of the liquid assets of the firm. Low solvency indicates the need to raise funds
due to low shareholder’s equity (Mateut et al. (2006)). Evidence provided by Farinha and
Santos (2002) give further support to the idea that less liquid firms show greater demand for
external funds compared to more liquid firms which have substantial internal sources. We
expect to find that more solvent firms face a lower likelihood of failure.
Last but not least, we include a set of dummy variables to examine the impact of exporting
activity on the likelihood of survival. As in Greenaway et al. (2008), we first make the
distinction between exporters and non-exporters by creating the dummy Exportit to be
equal to 1 if firm i reports a positive amount of exports in year t.7 Further, we split firms
into export starters, exiters, continuous exporters and continuous non-exporters. Specifically,
Startersit are those firms that exported in t, but not in t-1 and t-2, Exitersit are defined as
those firms that exported in t-1 and t-2 but not in t. The continuousit are defined as those
firms that exported in all sample years. The continuous non − exportersit are those firms
that never exported in our sample.
Before we analyse in depth the relationship between finance, exporting status and sur-
vival, we set a baseline model to test directly how firm survival prospects are affected by
simple export status, using a dummy equal to 1 if firm i exports in year t, and 0 otherwise.
Hence, our baseline probit model has the following format:
7Amadeus data do not provide detailed information on exports at the product level and export destina-tions.
6

Pr(FAILit = 1) = F (a0 + a1SIZEi(t−1) + a2SIZE2i(t−1) + a3AGEi(t−1) + a4PROFITi(t−1)
+ a5LEV ERAGEi(t−1) + a6SOLV ENCYi(t−1) + a7COV ERAGEi(t−1) + a8EXPORTit + εit)
(2.3)
where FAIL is a dummy variable that equals 1 if firm i fails in year t, and 0 otherwise.
We discuss the construction of the failure dummy in the next section.8 F (.) denotes the
standard normal distribution function. Our specification includes regressors evaluated at
time t-1 to mitigate potential endogeneity concerns.9 In addition, our model includes a full
set of time dummies accounting for common trends and business cycle effects and a full
set of industry dummies (calculated at the 4-digit level) to control for fixed effects across
industries.
When the different exporting status dummies are incorporated in the model, the baseline
specification has the following form:
Pr(FAILit = 1) = F (a0 + a1SIZEi(t−1) + a2SIZE2i(t−1) + a3AGEi(t−1) + a4PROFITi(t−1)
+ a5LEV ERAGEi(t−1) + a6SOLV ENCYi(t−1) + a7COV ERAGEi(t−1) + a8STARTERSit
+ a9CONTINUOUSit + a10CONTINUOUSNON − EXPORTERit + εit) (2.4)
We also aim to assess whether the response to financial characteristics varies with the ex-
porting status of firms. To test this hypothesis we modify equation 2.4 to contain interaction
terms with variables proxying for different aspects of exporting activity. Using the dummies
starters, continuous, exiters and continuous non-exporters as exporting indicators (INDit)
we interact these with the set of financial variables employed in the previous models.
3 Data and summary statistics
To investigate the link between firms’financial shape and their survival prospects, we focus
on two large European export countries, namely France and the United Kingdom. This is
of particular importance considering that the financial systems in the UK and France set
8Note that we use the terms failure and survival interchangeably.9 We corroborate our findings using regressors at time t. Both empirical models suggest a common
story. These results are not reported for brevity, but are available upon request. We also dig deeper intoendogeneity using endogenous probits in a robustness check, see section 5.
7

different institutional frameworks for firm survival, and in particular the role of finance in
this context. Thus far, a number of studies have documented heterogeneity across countries
in terms of firms real activities (Benito (2005); Bond et al. (2003); Carlin and Mayer (2000)
and Rajan and Zingales (2003)). In addition, along with Germany, the UK and France are
the top exporters in Europe that might present variations in their likelihood of exit given
their exporting status. It has to be noted though, that Germany is excluded from our sample
because of the lack of exporting data in our database.
We use data from company accounts recorded in the Amadeus database and data on
mergers and acquisitions from the Zephyr database, both distributed by Bureau Van Dijk.
Amadeus is a pan-European financial database that includes firm-level accounting data in
standardized financial format for balance sheet items, profit and loss items, and financial
ratios. In addition to financial information, Amadeus also assigns companies a four-digit
NACE code—the European standard of industry classification—which we use to classify
firms and construct industry dummy variables. The NACE codes follow the NACE Revision
1 classification.
One important characteristic of the dataset is that it covers a large fraction of new
and SME companies along with large firms across all industries.10 Further, it provides
information on both listed and unlisted companies. This feature of the data allows for a wide
degree of variation across observations in our sample. Having such detailed financial data on
two large EU exporters, the UK and France, is of particular importance for the comparison
of their survival prospects given the high degree of heterogeneity across firms in the extent of
their size.11 Our sample is limited only to firms that operate in the manufacturing industry
and we provide information on financial accounts for UK and French manufacturing firms
for the years 1998-2005.12
As is common in the literature (Bridges and Guariglia (2008) and Bunn and Redwood
(2003)), we define a firm as failed (dead) in a given year if its company status is that of
receivership, liquidation, or dissolved. One concern with such a measure is that it may
falsely classify a firm as dead if it disappears in the sample due to a takeover or merger.
In order to avoid this problem we also employ the Zephyr database to identify firms that
10To be included in Amadeus companies must satisfy at least one of the following criteria: i) turnovergreater than 10 million EUR; ii) number of employees greater than 150; iii) total assets greater than 10million EUR.
11Further, in the absence of sales data for the UK firms in the Amadeus database, we rely on the FAMEdatabase -distributed by the Bureau Van Dijk- to extract information for our sample.
12Firms are allocated to one of the following nine industrial groups: food, drink and tobacco; textiles,clothing, leather and footwear; chemicals and man made fibres; other minerals and mineral products; metaland metal goods; electrical and instrument engineering; motor vehicles and parts, other transport equipment;mechanical engineering; and others (Blundell et al. (1992).
8
merged with another firm but that are mistakenly coded as ‘dead’ in the Amadeus data.
This ensures that our dependent variable has been accurately constructed to capture firms
that failed and did not exit the sample due to mergers and acquisitions.
In order to clean our data we apply selection criteria that are common in the literature,
and exclude companies that did not have complete records on our explanatory variables, and
firm-years with negative sales and profits. To control for the potential influence of outliers,
we excluded observations in the 0.5 percent from the upper and the lower tails of the distri-
bution of the regression variables. These cut-offs are aimed at eliminating extraordinary firm
shocks, or coding errors. Next we delete from our sample firms that report only consolidated
statements, to avoid double-counting firms and subsidiaries or operations abroad. For most
firms in Amadeus, unconsolidated statements are reported and consolidated statements are
provided when available. Our panel therefore has an unbalanced structure with a total of
26,698 annual observations (firm-years) on 3,569 UK firms and 35,966 observations on 4,855
French firms.
Tables 1 and 2 present descriptive statistics for the UK and French data respectively.
Means and standard deviations of the main variables of interest are reported for the entire
sample (column 1), for surviving firms and failed firms (columns 2 and 3). Further, the p-
values of a test for the equality of means are presented in column 4. For the UK sample, 384
out of 26,698 firm-years were recorded as failed whereas for the French sub-sample 1,516 out
of 35,966. We observe that the percentage of firm failure is higher for French firms (4.2%)
compared to their UK counterparts (1.4%).13
Looking at the size measures (employees and sales), we observe that there appear to
be no strong differences between the two groups of firms. By contrast we observe that
surviving firms are in general older. Regarding the financial variables, surviving firms display
higher levels of profitability, cash flow (coverage), they are more liquid (solvency) and less
indebted (leverage). In most cases the differences between surviving and failed firm-years
are statistically significant and show great consistency for both countries.
We now look at the export dummy which shows that the incidence of survival is higher for
exporters compared to non-exporters. This is the case for both UK and France though it is
significantly different only for the latter country. This suggests that being an exporter plays
an important role in reducing the probability of failure for both countries and merits further
investigation. Hence, we further break down exporting activity into four different aspects,
namely, export starters, exiters, continuous exporters and continuous non-exporters. In the
French sample we observe that survival is higher for continuous exporters and starters, and
13These statistics are in line with previously reported UK evidence (see Bridges and Guariglia (2008) andBunn and Redwood (2003)).
9

lower for continuous non-exporters. In the UK sample these patters are similar, although
we find statistically significant differences only for continuous exporters.
Two points can be highlighted from these preliminary statistics. First, a firm’s financial
health is correlated with the survival probability. Second, being engaged in exporting activity
is significantly associated with better survival prospects. However, the effects of exporting
may vary depending on the exporting status. We find preliminary evidence that having
established a reputation in the exporting market through continuous exporting is positively
associated with the probability of survival but the results are less clear for the remaining
exporting categories. In the sections to follow we provide formal econometric analysis to
account for the confounding effects of financial and other factors that may influence the
incidence of survival.
4 Econometric Results
4.1 Firm Survival and Exporting Activity
In this section we begin by presenting in Table 3 the estimated results of equations (2.3)
and (2.4) for the UK and French sub-samples. The predicted probability of exit, evaluated
at the mean of the independent variables, is 1.46% and 3.98% for the UK and France,
which are close to the actual exit rates reported in the summary statistics. To provide some
interpretation of the estimated coefficients in columns 1 to 4, we also report the marginal
changes, evaluated at the sample means for each variable, in the Appendix.
Estimations based on equation (2.3) are presented in columns 1 and 2. The results
suggest that there is a non-linear relationship between firm size and probability of failure.14
Firm age returns negative coefficients but with a significant impact on failure only for the
UK group of firms. This finding is in line with previous theoretical and empirical evidence
which show that younger firms are more likely to fail (e.g., Audretsch and Mahmood (1995)
and Jovanovic (1982)).
Turning to the role of financial variables on the likelihood of survival we see some differ-
ences between British and French firms. We observe that an increase in profitability lowers
the likelihood of failure in both the UK and France. This result is consistent with previ-
14Based on the marginal changes, we can calculate the turning points, which are around 156 and 809 forthe UK and French sample, respectively. Hence, for our data (with average size of well over 400 and 500in the UK and France, respectively) the probability of survival is positive for the average sized firm in theUK and negative in France. We do not find clear positive associations between size and survival probablybecause our data set does not include very small firms, which generally show the highest incidence of exit.However, some previous papers, such as Audretsch et al. (1999b,a) and Wagner (1994) also find no clear-cutnexus between size and probability of survival.
10
ous findings that more profitable firms are less likely to fail (Bridges and Guariglia (2008)
and Bunn and Redwood (2003)). However, marginal changes evaluated at the mean of the
independent variables show that increasing profitability by one percent from the mean is
associated with increases in survival by 6.620% for the UK sample and by 1.818% for their
French counterparts. This implies a reduction in the predicted exit probability by 46% for
the French sample (1.818 / 3.98), while the result for the UK is more difficult to interpret,
given that the predicted failure probability is at 1.46%. However, as shown in the summary
statistics, mean profitability for all firms is very high, and substantially higher than for failed
firms. This, combined with the very low failure rate we observe in our data, suggests that
further increases in profitability above the mean imply substantial improvements in survival
prospects, and are only observed for firms that do not exit.
Be that as it may, our results clearly show that the impact of profitability on survival
is much higher for the UK than for French firms. The stronger reliance on profits for UK
firms is consistent with the findings by Benito (2005) and Bond et al. (2003) that financial
constraints may be more severe in “market based” than in “bank based” financial systems.
In the “market based” systems, firms need high profits in order to signal to potential lenders
that they are able to repay debts.
As regards other financial variables, firms with high levels of leverage are expected to
face higher probabilities of failure compared to those with low leverage. Yet, even though
the coefficients on leverage attract the expected positive sign, their impact on failure is
insignificant for both countries. By contrast, the coefficients on solvency show that liquidity
affects negatively the likelihood of failure. This is in line with expectations since evidence
presented by other studies (Farinha and Santos (2002) and Mateut et al. (2006)) show that
solvency has a strong impact on firms’ real decisions. Again, we find that there are differences
in the magnitude of the relationship between the UK and France.
The coefficient on coverage is significant and carries the expected negative sign only for
the UK sub-sample. Coverage has been used in the literature (Gertler and Gilchrist (1994)
and Guariglia (1999)) as a measure of the balance sheet strength. Firms that are able to
repay debts by using their cash flow, are more creditworthy and, hence, are expected to
achieve higher probability of survival. This appears more important in the “market based”
than in the “bank based” system, consistent with previous findings by Benito (2005) and
Bond et al. (2003) that cash flow and profits terms are more important for firm investment
in the UK than in other continental European countries.
Finally, the results on the export dummy (equal to one if firms export), are in line
with previous findings in the literature (Bridges and Guariglia (2008) and Greenaway et al.
(2008)) that exporting firms have higher probabilities of survival. However, we observe an
11
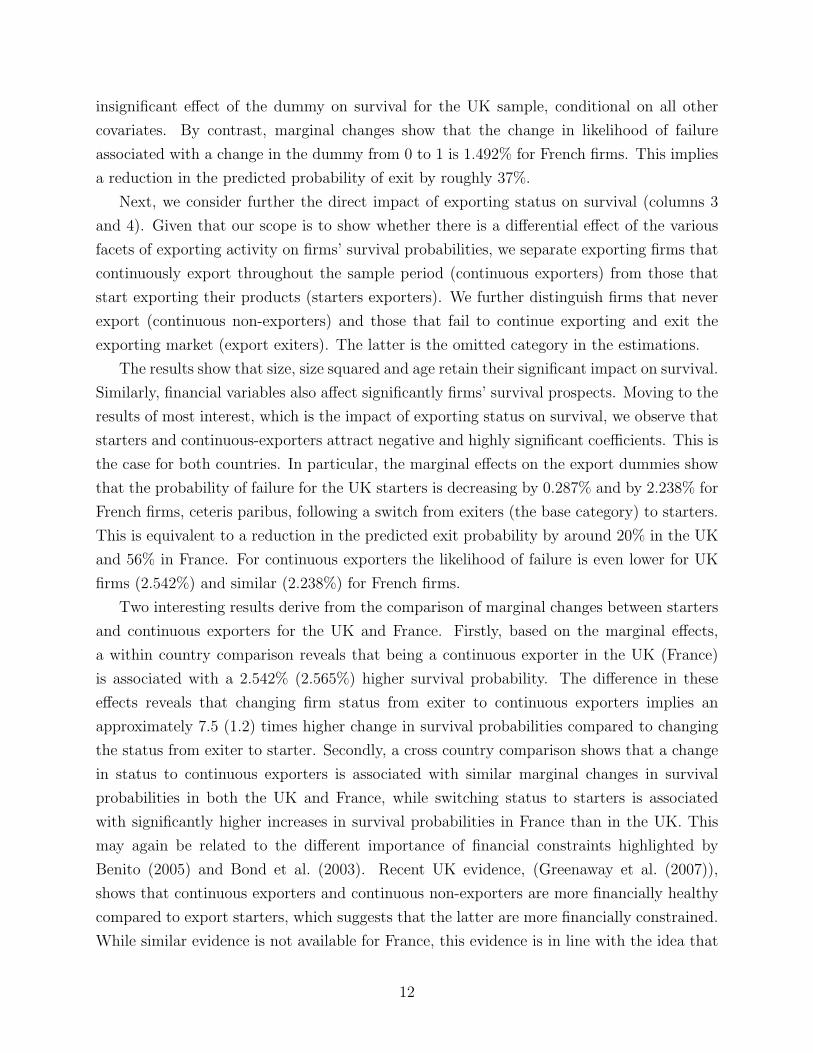
insignificant effect of the dummy on survival for the UK sample, conditional on all other
covariates. By contrast, marginal changes show that the change in likelihood of failure
associated with a change in the dummy from 0 to 1 is 1.492% for French firms. This implies
a reduction in the predicted probability of exit by roughly 37%.
Next, we consider further the direct impact of exporting status on survival (columns 3
and 4). Given that our scope is to show whether there is a differential effect of the various
facets of exporting activity on firms’ survival probabilities, we separate exporting firms that
continuously export throughout the sample period (continuous exporters) from those that
start exporting their products (starters exporters). We further distinguish firms that never
export (continuous non-exporters) and those that fail to continue exporting and exit the
exporting market (export exiters). The latter is the omitted category in the estimations.
The results show that size, size squared and age retain their significant impact on survival.
Similarly, financial variables also affect significantly firms’ survival prospects. Moving to the
results of most interest, which is the impact of exporting status on survival, we observe that
starters and continuous-exporters attract negative and highly significant coefficients. This is
the case for both countries. In particular, the marginal effects on the export dummies show
that the probability of failure for the UK starters is decreasing by 0.287% and by 2.238% for
French firms, ceteris paribus, following a switch from exiters (the base category) to starters.
This is equivalent to a reduction in the predicted exit probability by around 20% in the UK
and 56% in France. For continuous exporters the likelihood of failure is even lower for UK
firms (2.542%) and similar (2.238%) for French firms.
Two interesting results derive from the comparison of marginal changes between starters
and continuous exporters for the UK and France. Firstly, based on the marginal effects,
a within country comparison reveals that being a continuous exporter in the UK (France)
is associated with a 2.542% (2.565%) higher survival probability. The difference in these
effects reveals that changing firm status from exiter to continuous exporters implies an
approximately 7.5 (1.2) times higher change in survival probabilities compared to changing
the status from exiter to starter. Secondly, a cross country comparison shows that a change
in status to continuous exporters is associated with similar marginal changes in survival
probabilities in both the UK and France, while switching status to starters is associated
with significantly higher increases in survival probabilities in France than in the UK. This
may again be related to the different importance of financial constraints highlighted by
Benito (2005) and Bond et al. (2003). Recent UK evidence, (Greenaway et al. (2007)),
shows that continuous exporters and continuous non-exporters are more financially healthy
compared to export starters, which suggests that the latter are more financially constrained.
While similar evidence is not available for France, this evidence is in line with the idea that
12

French export starters are less financially constrained in the bank based system than their
counterparts in the UK.
Our result that being a continuous non-exporter is associated with significant increases
in the likelihood of survival in the UK is also in line with the finding by (Greenaway et al.
(2007)) that non-exporters are more financially healthy. By contrast, for France it is the
case that being a continuous non-exporter is positively associated with the failure rate.
All in all we find evidence that good financial health is associated with better survival
prospects for French and UK firms. However, a distinct difference between the two European
countries is that the sensitivity of firms’ survival to cash flow (coverage) and profitability
is both statistically and quantitatively more significant in the UK than in France.15 This
finding provides evidence in favour of the financial systems argument that Anglo-American
market-oriented financial systems, where lenders offer funds through commercial papers,
corporate bond and equity markets, are more likely to show greater sensitivity to cash flow
and profits. Bank-oriented systems such as the French are likely to follow more transparent
arrangements that allow them to exercise greater scrutiny over borrowers, and as a result
investors will be less sensitive to cash flow and profits. This is in line with previous work,
Benito (2005) and Bond et al. (2003), that shows that the financial system has an important
role to play in firms’ real decisions, and that financial variables have a more prominent role
on firms’ investment in the market-based UK, whereas the effect is weaker in bank-based
countries like France, Germany and Spain.
4.2 The interaction between exporting and finance
In this section we investigate whether firms with different exporting status exhibit statisti-
cally significant differences in sensitivities of their survival probabilities to financial variables.
Since the previous section shows that there is a significant association between financial vari-
ables and firms’ survival probabilities, it would be interesting to examine how firms’ financial
status affects the survival prospects of starters, continuous exporters, exiters and continuous
non-exporters. Our objective is to verify whether there is a differential impact of financial
variables on the failure probabilities of four phases of exporting activity. Thus, by interacting
our financial variables with the indicators of the exporting activity, INDit, we can determine
the indirect influence of the export orientation on firms’ likelihood of survival. The empirical
results are reported in Tables 4 and 5.
In columns 1 and 2 of Table 4, a dummy variable for export starters is interacted with
15In the Appendix we present probit models with additional firm and industry level covariates. This showsthat the results reported here are robust to the inclusion of these additional variables. Hence, in the textand further analysis, we prefer to stick with the more parsimonious model reported thus far.
13

the financial variables to gauge the change in the response relative to any other exporting
status (continuous, exiters, continuous non-exporters). The net response for starters is found
by summing the coefficients. Columns 3 and 4 present the interaction between a dummy for
continuous exporters and financial characteristics. Note that the coefficients on size and age
do not change compared to our earlier results.
As for export starters, we find that the interaction of starters and profitability returns a
negative and significant coefficient in the UK, but not in the French sample.16 Hence, in the
UK, export starters are more sensitive to changes in profits in terms of survival prospects
than other firms, while this is not the case in France. This may again reflect the finding by
Greenaway et al. (2007) that export starters in the UK are strongly financially constrained
and, therefore, need high profits. In the “bank based” French system there is less need for
high profits, as firms do not need to signal to the market that they are able to repay their
debts; this is done through the monitoring by banks.
The coefficients on leverage and solvency for export starters are similar in sign and
magnitude in the UK and French sample, although the coefficient on leverage for French firms
is statistically insignificant. However, there is a strong difference in the effect of coverage
between the two countries. Starting with leverage, there is a statistically significant and
positive relationship between leverage and survival only for export starters and no other
firms in the UK sample. The coefficients on solvency exert a positive and significant impact
on failure for the UK and France. In the French sample all firms are sensitive in their survival
probabilities to changes in coverage, but there is no difference between starters and other
firms. In the UK sample, by contrast, coverage ratio affects positively the probability of
failure for UK starters, even though high levels of cash flow indicate a lower external finance
premium and better financial health. This finding is in accordance with the idea that the
sunk cost payment make starters more vulnerable and less likely to survive compared to
other exporters.
Looking at the continuous exporters, we find even stronger differences between the UK
and France. In the UK sample, the only statistically significant interaction term relates
to leverage. The effect of leverage on survival is positive for continuous exporters, but
not for other firms. This suggests that high levels of debt is a signal of high borrowing
capacity. This result is in line with our summary statistics and is not surprising given
previous evidence that continuous exporters have a better financial status compared to export
starters (Greenaway et al. (2007)). The survival prospects of the UK continuous exporters do
16According to Ai and Norton (2003) when evaluating interaction effect for nonlinear models one shouldcompute the cross derivative, rather than simply rely on the sign, magnitude, or statistical significance of thecoefficient. We follow their technique by using the inteff command available in STATA 10 and we concludethat overall our results are robust to this criticism.
14

not present any sensitivities to profitability, solvency and coverage, consistent with previous
evidence (Blalock et al. (2008); Bridges and Guariglia (2008) and Desai and Forbes (2008))
that globally engaged firms are less vulnerable to financial constraints.17
Results for the French sample are quite different. In fact, the results on the interaction
terms for continuous exporters are quite similar to the results obtained in the UK sample for
export starters. This may seem surprising at a first glance. However, it supports previous
finding by the International Study Group on Exports and Productivity (2008) (ISGEP) that
there is no evidence for learning by exporting in France, but there is in the UK. In other
words, in France exporters are not able to improve their productivity post-export entry and
to recover the sunk cost payments through an increase in their profits, while this seems to
be the case in the UK. Taking the finding by ISGEP (2008) and ours in conjunction, may
suggest that, in France, continuous exporters are more financially constrained than other
types of firms, in contrast to the UK.
The significant relationship between survival and financial indicators in France may be
due to other factors. One potential candidate is the industry affiliation of French continuous
exporters. Manova (2008) shows that firms belonging in certain industries (Electric ma-
chinery, machinery and equipment, glass and products, drugs, petroleum and coal products)
require more external finance in order to engage in exporting. This is also confirmed by
Rajan and Zingales (1998) who argue that the same industries depend heavily on external
finance primarily due to technological reasons. In our data, more than 60% of French con-
tinuous exporters belong to the above mentioned industries and are therefore more likely
to face greater financing needs. However, given that French firms are mainly bank depen-
dent, due to the “bank based” nature of its financial system, it is reasonable to assume that
they mainly form relationships with their banks. These financial intermediaries have limited
liquidity, that is, they are willing to finance investment projects only up to a certain scale
because they seek to maintain a diversified loan portfolio. Therefore, financial indicators for
these firms play a critical role in determining survival.
Summarising our findings, we show that for UK export starters, profitability, debt, sol-
vency and coverage have a large impact on survival probabilities, whilst the same financial
indicators do not significantly affect the failure prospects of UK continuous exporters or
exert a smaller impact on them. Due to the sunk cost payment that draws down liquidity
or increases leverage, firms entering the foreign markets have to exhibit a good financial
health in order to increase their likelihood of survival. On the other extreme, prolonged par-
17Bridges and Guariglia (2008) argue that the insignificant impact of financial variables on failure forexporters could be due to the signalling effect that having paid the sunk export market entry costs, thesefirms must be sufficiently productive to generate enough profits in foreign markets to recover the entry costs.
15
ticipation of continuous exporters provides a positive signal to lenders that these firms are
profitable, creditworthy and they are more likely to meet their debt obligations. Establishing
a successful track record in the export markets enables firms to access financial markets and
to attract external funding. Reputational effects for continuous exporters might therefore
be proved beneficial for their survival prospects. The results are less clear for French firms.
Columns 1 and 2 of Table 5 look at whether firms that are forced to exit the exporting
market face differential effects of financial variables on the likelihood of survival compared
to other exporters (i.e. starters, continuous, continuous non-exporters) and the remaining
columns show the equivalent analysis for continuous non-exporters. Looking at columns
1 and 2, we observe that UK exiters present a similar picture to the UK export starters.
Specifically, leverage, solvency and coverage increase the likelihood of failure suggesting that
their bad financial health in principle, worsen their survival prospects. As for the French
export exiters, it appears that financial variables have a moderate impact on survival with
the only exception being the positive impact of solvency.
Turning to the impact of financial status on the continuous non-exporters’ likelihood of
survival (columns 3 and 4), we obtain an intriguing result. We find that financial health
affects positively the probability of survival for UK and French continuous non-exporters. We
show that leverage, profitability and solvency significantly decrease failure prospects. This
result is stronger for the French sub-sample. Good financial status proves to be beneficial
for continuous non-exporters. According to Greenaway et al. (2007) the most financially
constrained firms are not the continuous non-exporters, but export starters, since those firms
finance the sunk start-up costs by increasing their leverage or decreasing their liquidity.
5 Robustness Checks
One potential criticism is that our specifications include a number of firm-specific and finan-
cial variables that are likely to be endogenous regressors. In order to shield our results from
the potential problem of endogeneity, we follow Wooldridge (2002) and use the instrumental
variable technique for probit models.18 The estimation of probit models with continuous
endogenous explanatory variables involves two steps: i) run the OLS regression for each en-
dogenous variable on the instrumental variables and all other exogenous regressors and save
the residual terms, and ii) estimate a probit model by including the residual terms from step
(i) in the list of regressors. The residual terms are correction terms for the endogeneity prob-
lem. Looking at the jointly statistically significant coefficients we can draw our conclusions
18Instruments are the levels of size, size2, profitability, leverage, solvency and coverage, lagged by twoor more periods.
16
on whether the variables are endogenous or not. In all cases, but one, the tests cannot reject
the null of exogeneity in our regressors, pointing out that our previously reported results
(Tables 3-5) are not subject to endogeneity concerns. For the sake of comparison we also
report the endogenous Probit estimates in Tables 6-8. It can be seen that our results remain
largely unchanged.
Thus far, our models have been estimated using probit techniques, but firm failure studies
often employ Cox proportional hazard model (e.g., Audretsch and Mahmood (1995) and
Disney et al. (2003)). To ensure that our results are robust to hazard models we use the
complementary log-log model (cloglog) which is equivalent to the discrete time version of
the proportional hazard model. Given that our data are collected on a yearly basis, the
cloglog model is more appropriate compared to the Cox model. 19 As we see in Tables 9-11,
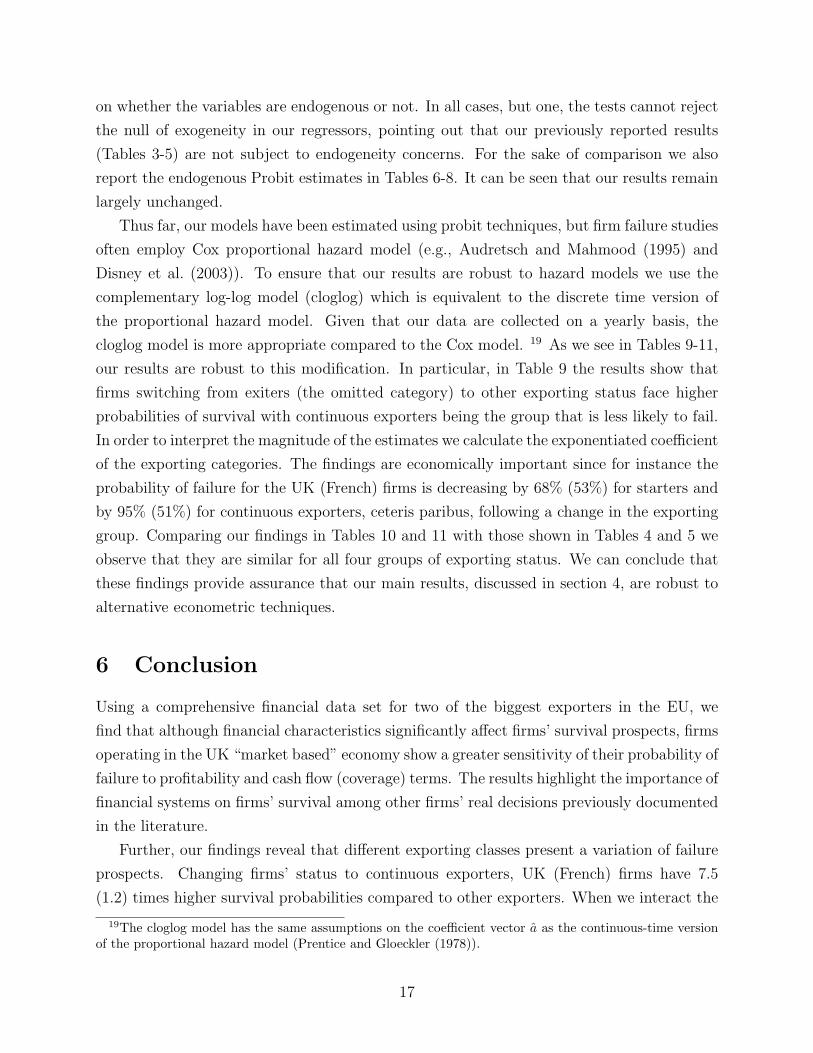
our results are robust to this modification. In particular, in Table 9 the results show that
firms switching from exiters (the omitted category) to other exporting status face higher
probabilities of survival with continuous exporters being the group that is less likely to fail.
In order to interpret the magnitude of the estimates we calculate the exponentiated coefficient
of the exporting categories. The findings are economically important since for instance the
probability of failure for the UK (French) firms is decreasing by 68% (53%) for starters and
by 95% (51%) for continuous exporters, ceteris paribus, following a change in the exporting
group. Comparing our findings in Tables 10 and 11 with those shown in Tables 4 and 5 we
observe that they are similar for all four groups of exporting status. We can conclude that
these findings provide assurance that our main results, discussed in section 4, are robust to
alternative econometric techniques.
6 Conclusion
Using a comprehensive financial data set for two of the biggest exporters in the EU, we
find that although financial characteristics significantly affect firms’ survival prospects, firms
operating in the UK “market based” economy show a greater sensitivity of their probability of
failure to profitability and cash flow (coverage) terms. The results highlight the importance of
financial systems on firms’ survival among other firms’ real decisions previously documented
in the literature.
Further, our findings reveal that different exporting classes present a variation of failure
prospects. Changing firms’ status to continuous exporters, UK (French) firms have 7.5
(1.2) times higher survival probabilities compared to other exporters. When we interact the
19The cloglog model has the same assumptions on the coefficient vector a as the continuous-time versionof the proportional hazard model (Prentice and Gloeckler (1978)).
17

financial variables with the different facets of exporting activity we find within and across
countries evidence that the survival of exporting groups varies substantially depending on
firms’ financial status, the financial system and the prolonged participation in the export
market.
For policy makers, our results suggest that if there are government efforts at aiding firms’
survival, providing access to finance as well as access to export markets can be important
tools for the implementation of such policies.
Appendix: Adding additional industry-specific and other
firm-specific characteristics to the estimation
A number of control variables that have been previously found important to explain the
firm’s probability of survival are incorporated in our models. We include two firm-specific
characteristics i.e a dummy for subsidiaries to control for the benefits of being a member of
a group and the foreign ownership dummy to control for firms’ ownership status. We also
include the industry variable capital intensity.
A number of studies have looked at the impact of ownership on survival probabilities.
Gorg and Strobl (2003), Bernard and Sjoholm (2003) using data from Ireland and Indonesia
show that multinationals are more likely to exit than domestic firms. To proxy for ownership
we use a dummy variable (FOREIGN − OWNED) which is equal to 1 if the share of
foreign ownership in a firm’s equity exceeds 24.99%. We expect a negative impact of foreign
ownership on survival. We also consider the effect of subsidiaries on survival prospects
(SUBSIDIARIES). According to Disney et al. (2003) if the firm is part of a group is
likely to have better access to capital markets and to respond more quickly to shocks than
single firms due to better information processing. We might expect firms with subsidiary
plants to face a lower probability of failure.
Apart from the firm-specific variables we also incorporate in our model an industry vari-
able to control for industry effects. Empirical evidence concerning the influence of capital
intensity on firm survival is ambiguous. While Audretsch and Mahmood (1995) find that
capital intensity has a negative influence on the survival rate, Acs and Audretsch (1990)
show that firms are not significantly deterred from entering industries that are relatively
capital intensive. Following Audretsch and Mahmood (1995) we define capital intensity
(CAPITAL− INTENSITY ) as the ratio of capital over the total number of employees at
the industry-level (calculated at the 4-digit level). We expect capital intensity to significantly
affect firm survival but its sign will be determined by the data.
18

Looking at Tables A1 and A2, we observe that when we add the two firm-specific vari-
ables and the industry indicator in succession, results remain largely unchanged compared
to those reported in Table 3. UK and French firms with subsidiary plants face a lower
probability of failure. Further, consistent with Bernard and Sjoholm (2003) and Gorg and
Strobl (2003), foreign-owned firms and firms operating in capital intensive industries exhibit
higher probabilities of failure (Audretsch and Mahmood (1995)). This is not true for the
French sub-sample. It turns out that foreign ownership and capital intensity reduce failure
prospects.
19

ReferencesAcs, Z. and Audretsch, D.: 1990, Innovation and Small Firms, MIT.
Ai, C. and Norton, E.: 2003, Interaction terms in logit and probit models, Economic Letters 80, 123–129.
Audretsch, D. and Mahmood, T.: 1995, New firm survival: New results using a hazard function, Review ofEconomics and Statistics 97, 97–103.
Audretsch, D., Santarelli, E. and Vivarelli, M.: 1999a, Does the startup size influence the likelihood of sur-vival?, in D. Audretsch and R. Thurik (eds), Innovation, Industry Evolution, and Employment, CambridgeUniversity Press, UK.
Audretsch, D., Santarelli, E. and Vivarelli, M.: 1999b, Start up size and industrial dynamics: Some evidencefrom Italian manufacturing, International Journal of Industrial Organization 17, 965–983.
Bellone, F., Musso, P., Nesta, L. and Schiavo, S.: 2008, Financial constraints as a barrier to export partici-pation, Mimeo.
Benito, A.: 2005, Financial pressure, monetary policy effects and inventories: Firm-level evidence from amarket based and bank based financial system, Economica 72, 201–224.
Bernard, A. and Sjoholm, F.: 2003, Foreign owners and plant survival, Working Paper 10039, NBER.
Blalock, G., P.Gertler and Levine, D.: 2008, Financial constraints on investment in an emerging crisis,Journal of Monetary Economics 55, 568–591.
Blundell, R., Bond, S. and Schiantarelli., F.: 1992, Investment and Tobin’s q: Evidence from company paneldata, Journal of Econometrics 51, 233–257.
Bond, S., Elston, J., Mairesse, J. and Mulkay, B.: 2003, Financial factors and investment in Belgium, France,Germany, and the United Kingdom: A Comparison using Company Panel Data, Review of Economicsand Statistics 85, 153–165.
Bridges, S. and Guariglia, A.: 2008, Financial constraints, global engagement, and firm survival in the UK:Evidence from micro data, Scottish Journal of Political Economy 55, 444–464.
Bunn, P. and Redwood, V.: 2003, Company accounts based modelling of business failures and the implica-tions for financial stability, Working Paper 210, Bank of England.
Carlin, W. and Mayer, C.: 2000, How do financial systems affect economic performance?, in X. Vives (ed.),Corporate Governance: Theoretical and Empirical Perspectives, Cabridge University Press.
Chaney, T.: 2005, Liquidity constrained exporters, Mimeo, University of Chicago.
Clementi, L. and Hopenhayn, H.: 2006, A theory of financing constraints and firm dynamics, QuarterlyJournal of Economics 54, 229–265.
Dennis, D. and Mihov, V.: 2003, The choice among bank debt, non-bank private debt: Evidence from newcorporate borrowings, Journal of Financial Economics 70, 3–28.
Desai, M. and Forbes, K.: 2008, Financial constraints and growth: Multinational and local firm responsesto currency depreciations, Review of Financial Studies 21, 2857 – 2888.
Disney, R., Haskel, J. and Heden, Y.: 2003, Entry, exit and establishment survival in UK manufacturing,Journal of Industrial Economics 51, 91–112.
Dunne, T., Roberts, M. and Samuelson, L.: 1988, Patterns of firm entry and exit in US manufacturingindustries, Rand Journal of Economics, 19, 495–515.
Eaton, J., Kortum, S. and Kramaz, F.: 2004, An anatomy of international trade: Evidence from Frenchfirms, Mimeo.
Farinha, L. and Santos, J.: 2002, Switching from single to multiple bank lending relationships: Determinantsand implications, Journal of Financial Intermediation 11, 124–151.
20

Geroski, P.: 1995, What do we know about entry?, International Journal of Industrial Organization 13, 421–440.
Gertler, M. and Gilchrist, S.: 1994, Monetary policy, business cycles, and the behavior of small manufacturingfirms, Quarterly Journal of Economics 109, 309–340.
Gorg, H. and Strobl, E.: 2003, Multinational companies, technology spillovers and plant survival, Scandina-vian Journal of Economics 105, 581–595.
Greenaway, D., Guariglia, A. and Kneller, R.: 2007, Financial factors and exporting, Journal of InternationalEconomics 73, 377–395.
Greenaway, D., Gullstrand, J. and Kneller, R.: 2008, Surviving globalisation, Journal of InternationalEconomics 74, 264–277.
Guariglia, A.: 1999, The effects of financial constraints on inventory investment: Evidence from a panel ofUK firms, Economica 66, 43–62.
Hopehayn, R.: 1992, Entry, exit and firm dynamics in long run equilibrium, Econometrica 60, 1127–1155.
International Study Group on Exports and Productivity: 2008, Understanding cross-country differences inexporter premia: Comparable evidence for 14 countries, Review of World Economics 144, 596–635.
Jovanovic, B.: 1982, Selection and evolution of industry, Econometrica 50, 3–37.
Manova, K.: 2008, Credit constraints, heterogeneous firms, and international trade, Working Paper 14531,NBER.
Mata, J. and Portugal, P.: 1994, Life duration of new firms, Journal of Industrial Economics 27, 227–243.
Mateut, S., Bougheas, S. and Mizen, P.: 2006, Trade credit, bank lending and monetary policy transmission,European Economic Review 50, 603–629.
Mayer, T. and Ottaviano, G.: 2007, The Happy Few: The Internationalisation of European Firms, BruegelBlueprint Series.
Musso, P. and Schiavo, S.: 2008, The impact of financial constraints on firm survival and growth, Journalof Evolutionary Economics 15, 135–149.
Prentice, R. and Gloeckler, L.: 1978, Regression analysis of grouped survival data with application to breastcancer data, Biometrics 34, 57–67.
Rajan, R. and Zingales, L.: 1998, Financial dependence and growth, American Economic Review 88, 559–586.
Rajan, R. and Zingales, L.: 2003, Banks and markets: The changing character of European finance, WorkingPaper 9595, NBER.
Wagner, J.: 1994, The post-entry performance of new small firms in german manufacturing industries,Journal of Industrial Economics 42, 141–154.
Wooldridge, J.: 2002, Econometric Analysis of Cross Section and Panel Data, MIT Press.
Zingales, L.: 1998, Survival of the fittest or the fattest? Exit and financing in trucking industry, Journal ofFinance 53, 905–938.
21

Table 1: Summary Statistics for UK Firms
Total Sample Surviving Firms Failed Firms Diff.(1) (2) (3) (4)
Failit 0.014 0.000 1.000(0.119) (0.000) (0.000)
Employeesit 360.096 360.705 306.237 0.116(541.231) (543.287) (305.233)
RealSalesit 354.634 359.044 243.041 0.008(578.751) (581.542) (241.923)
Ageit 29.487 29.553 24.937 0.000(26.831) (26.867) (23.773)
Leverageit 0.241 0.241 0.300 0.000(0.237) (0.237) (0.248)
Solvencyit 0.374 0.374 0.368 0.704(0.283) (0.282) (0.318)
Profitabilityit 0.065 0.066 0.021 0.000(0.136) (0.135) (0.121)
Coverageit 1.025 1.028 0.747 0.255(3.608) (3.616) (2.870)
Exportit 0.835 0.835 0.814 0.413(0.371) (0.371) (0.389)
Starters Exportersit 0.045 0.045 0.036 0.412(0.207) (0.208) (0.187)
Exiters Exportersit 0.033 0.033 0.036 0.712(0.178) (0.179) (0.187)
Continuous Exportersit 0.537 0.540 0.163 0.000(0.498) (0.499) (0.370)
Continuous non− Exportersit 0.136 0.135 0.166 0.179(0.342) (0.341) (0.373)
Observations 26698 26314 384
Notes: The table presents sample means. Standard deviations are reported in parentheses. The p-value of a test of the equality
of means is reported. The subscript i indexes firms, and the subscript t, time, where t = 1998-2005. Failit is a dummy that
equals 1 if firm i fails in year t, and 0 otherwise. Real assets and real sales are expressed in thousands of pounds. Leverageit
measured as the firm’s short-term debt to assets ratio. Solvencyit defined as the ratio of the firm’s shareholder’s funds to its
total assets. Profitabilityit is the ratio of the firm’s profits before interest and tax to its total assets. Coverageyit is defined as
the ratio of the firm’s cash flow over its interest payment. Subsidiariesi is a dummy variable equal to 1 if firm i has subsidiaries,
and 0 otherwise. Exportit is a dummy variable equal to 1 if firm i reports a positive amount of exports in year t. Startersit
are those firms that exported in t, but not in previous years. Exitersit are defined as those firms exiting the exporting market.
The continuous exportersit are defined as those firms that exported in all sample years. The continuous non − exportersit
are defined as those firms that never exported over the sample period.
22

Table 2: Summary Statistics for French Firms
Total Sample Surviving Firms Failed Firms Diff.(1) (2) (3) (4)
Failit 0.042 0.000 1.000(0.200) (0.000) (0.000)
Employeesit 254.934 255.299 246.243 0.377(331.372) (331.583) (326.311)
RealSalesit 552.641 552.049 566.616 0.540(820.874) (822.197) (789.197)
Ageit 21.150 21.193 20.173 0.066(21.199) (21.192) (21.340)
Leverageit 0.073 0.073 0.080 0.014(0.107) (0.106) (0.114)
Solvencyit 0.349 0.352 0.290 0.000(0.202) (0.202) (0.197)
Profitabilityit 0.062 0.064 0.037 0.000(0.103) (0.101) (0.111)
Coverageit 0.432 0.434 0.386 0.211(1.311) (1.300) (1.360)
Exportit 0.792 0.794 0.726 0.000(0.405) (0.403) (0.445)
Starters Exportersit 0.221 0.224 0.157 0.000(0.415) (0.417) (0.364)
Exiters Exportersit 0.183 0.183 0.172 0.284(0.386) (0.387) (0.378)
Continuous Exportersit 0.479 0.483 0.369 0.000(0.499) (0.499) (0.482)
Continuous non− Exportersit 0.084 0.080 0.166 0.000(0.277) (0.272) (0.373)
Observations 35966 34450 1516
Notes: The table presents sample means. Standard deviations are reported in parentheses. The p-value of a test of the equality
of means is reported. The subscript i indexes firms, and the subscript t, time, where t = 1998-2005. Also see notes to Table 1.
23

Table 3: Baseline Model and Exporting Status
UK France UK FrancePooled Probit Pooled Probit Pooled Probit Pooled Probit
(1) (2) (3) (4)Sizei(t−1) 0.939** 0.844*** 1.122*** 0.816***
(2.53) (5.30) (2.90) (5.16)
Size2i(t−1) -0.090*** -0.063*** -0.107*** -0.060***(-2.68) (-4.84) (-3.02) (-4.66)
Agei(t−1) -0.008*** -0.001 -0.008*** -0.001(-3.77) (-1.06) (-3.68) (-0.80)
Profitabilityi(t−1) -0.841*** -0.872*** -0.862*** -0.871***(-4.66) (-3.39) (-4.72) (-3.21)
Leveragei(t−1) 0.074 0.052 0.192 0.022(0.45) (0.37) (1.11) (0.16)
Solvencyi(t−1) -0.333* -0.527*** -0.342* -0.479***(-1.80) (-5.84) (-1.79) (-5.32)
Coveragei(t−1) -0.037* 0.021 -0.037* 0.018(-1.66) (1.64) (-1.68) (1.33)
Exportit -0.117 -0.172***(-1.11) (-4.98)
Starters Exportersit -0.549*** -0.341***(-3.13) (-7.38)
Continuous Exportersit -1.231*** -0.334***(-10.10) (-8.53)
Continuous non− Exportersit -0.456*** 0.136***(-3.82) (2.69)
Constant -4.886*** -4.021*** -4.041*** -3.880***(-4.65) (8.43) (-3.86) (-8.16)
Log − likelihood -454.1 -3852 -391.835 -3793.582
Notes: The dependent variable is a dummy equal to one if the firm i fails in year t, and zero otherwise. Robust z-statistics are
presented in the parentheses. * significant at 10%; ** significant at 5%; *** significant at 1%. Time dummies and industry
dummies were included in the model. Numbers of observations are 6581 and 23802, respectively. Also see notes to Table 1.
24

Table 4: Pooled Probit: Starters, Continuous Exporters and the Likelihood of Survival
UK France UK FranceInd=Starters Ind=Starters Ind=Continuous Ind=Continuous
(1) (2) (3) (4)Sizei(t−1) 0.916*** 0.698*** 1.113*** 0.863***
(2.80) (4.68) (3.00) (5.43)
Size2i(t−1) -0.087*** -0.052*** -0.106*** -0.064***(-2.95) (-4.33) (-3.14) (-4.95)
Agei(t−1) -0.007*** -0.001 -0.007*** -0.001(-3.98) (-1.24) (-3.40) (-0.99)
Profitabilityi(t−1) -0.840*** -1.020*** -0.894*** -0.214(-3.32) (-5.17) (-2.79) (-0.96)
Profitabilityi(t−1) ∗ Indit -1.771* 0.316 -0.906 -1.557***(-1.86) (0.75) (-1.60) (-4.13)
Leveragei(t−1) 0.171 -0.225* 0.468*** -0.415**(1.04) (-1.48) (2.37) (-1.96)
Leveragei(t−1) ∗ Indit 0.791** 0.275 -0.992*** 0.779***(2.18) (0.76) (-3.26) (2.73)
Solvencyi(t−1) -0.137 -0.690*** -0.165 -0.685***(-0.69) (-6.95) (-0.72) (-6.15)
Solvencyi(t−1) ∗ Indit 0.997** 0.432** -0.033 0.405**(2.52) (2.05) (-0.07) (2.18)
Coveragei(t−1) -0.059 0.028** -0.035* -0.012(-1.56) (2.06) (-1.66) (-0.62)
Coveragei(t−1) ∗ Indit 0.100** -0.034 -0.198 0.076***(2.36) (-0.82) (-1.04) (2.82)
Indit -0.597*** -0.333*** -0.589** -0.349***(-2.66) (-3.99) (-2.70) (-4.95)
Constant -4.124*** -3.528*** -4.492*** -4.058***(-4.66) (-7.86) (-4.44) (-8.52)
Log − likelihood -557.028 -4083.305 -433.965 -3869.228
Notes: The dependent variable is a dummy equal to one if the firm i fails in year t, and zero otherwise. Robust z-statistics are
presented in the parentheses. * significant at 10%; ** significant at 5%; *** significant at 1%. Time dummies and industry
dummies were included in the model. Indit is a dummy and indicates in turn starters and continuous exporters. Numbers of
observations are 7586, 6670, 24732 and 23973, respectively. Also see notes to Table 1.
25
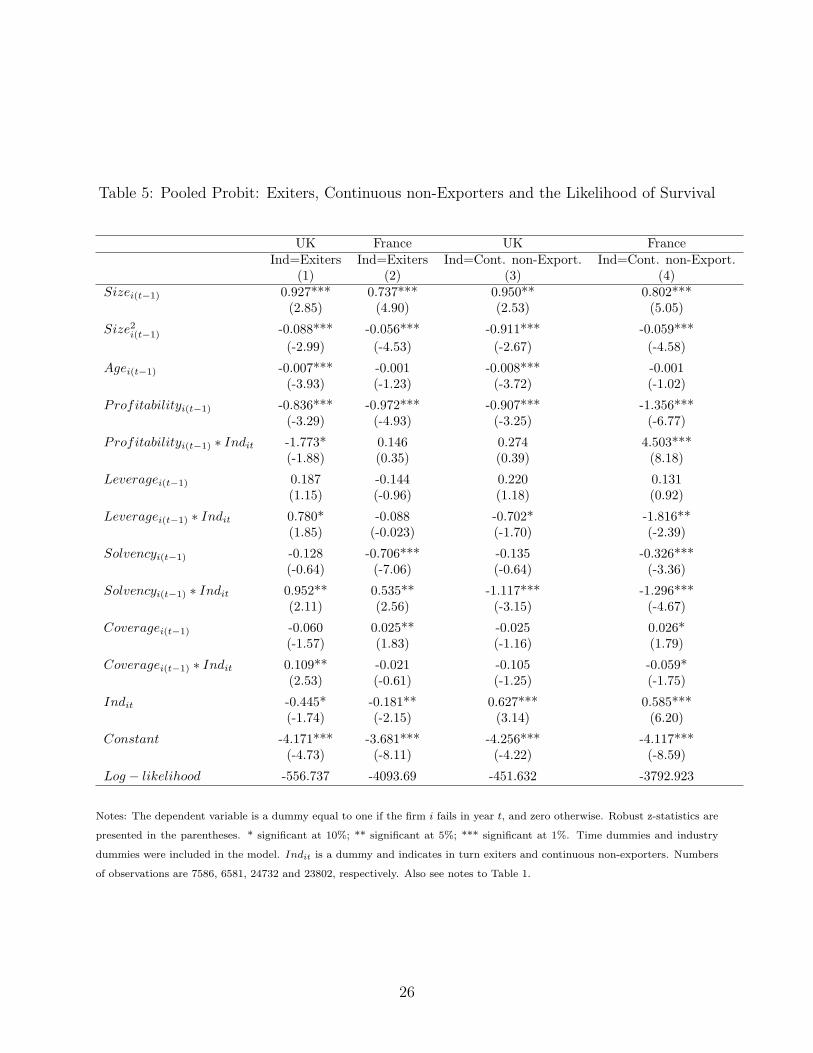
Table 5: Pooled Probit: Exiters, Continuous non-Exporters and the Likelihood of Survival
UK France UK FranceInd=Exiters Ind=Exiters Ind=Cont. non-Export. Ind=Cont. non-Export.
(1) (2) (3) (4)Sizei(t−1) 0.927*** 0.737*** 0.950** 0.802***
(2.85) (4.90) (2.53) (5.05)
Size2i(t−1) -0.088*** -0.056*** -0.911*** -0.059***(-2.99) (-4.53) (-2.67) (-4.58)
Agei(t−1) -0.007*** -0.001 -0.008*** -0.001(-3.93) (-1.23) (-3.72) (-1.02)
Profitabilityi(t−1) -0.836*** -0.972*** -0.907*** -1.356***(-3.29) (-4.93) (-3.25) (-6.77)
Profitabilityi(t−1) ∗ Indit -1.773* 0.146 0.274 4.503***(-1.88) (0.35) (0.39) (8.18)
Leveragei(t−1) 0.187 -0.144 0.220 0.131(1.15) (-0.96) (1.18) (0.92)
Leveragei(t−1) ∗ Indit 0.780* -0.088 -0.702* -1.816**(1.85) (-0.023) (-1.70) (-2.39)
Solvencyi(t−1) -0.128 -0.706*** -0.135 -0.326***(-0.64) (-7.06) (-0.64) (-3.36)
Solvencyi(t−1) ∗ Indit 0.952** 0.535** -1.117*** -1.296***(2.11) (2.56) (-3.15) (-4.67)
Coveragei(t−1) -0.060 0.025** -0.025 0.026*(-1.57) (1.83) (-1.16) (1.79)
Coveragei(t−1) ∗ Indit 0.109** -0.021 -0.105 -0.059*(2.53) (-0.61) (-1.25) (-1.75)
Indit -0.445* -0.181** 0.627*** 0.585***(-1.74) (-2.15) (3.14) (6.20)
Constant -4.171*** -3.681*** -4.256*** -4.117***(-4.73) (-8.11) (-4.22) (-8.59)
Log − likelihood -556.737 -4093.69 -451.632 -3792.923
Notes: The dependent variable is a dummy equal to one if the firm i fails in year t, and zero otherwise. Robust z-statistics are
presented in the parentheses. * significant at 10%; ** significant at 5%; *** significant at 1%. Time dummies and industry
dummies were included in the model. Indit is a dummy and indicates in turn exiters and continuous non-exporters. Numbers
of observations are 7586, 6581, 24732 and 23802, respectively. Also see notes to Table 1.
26
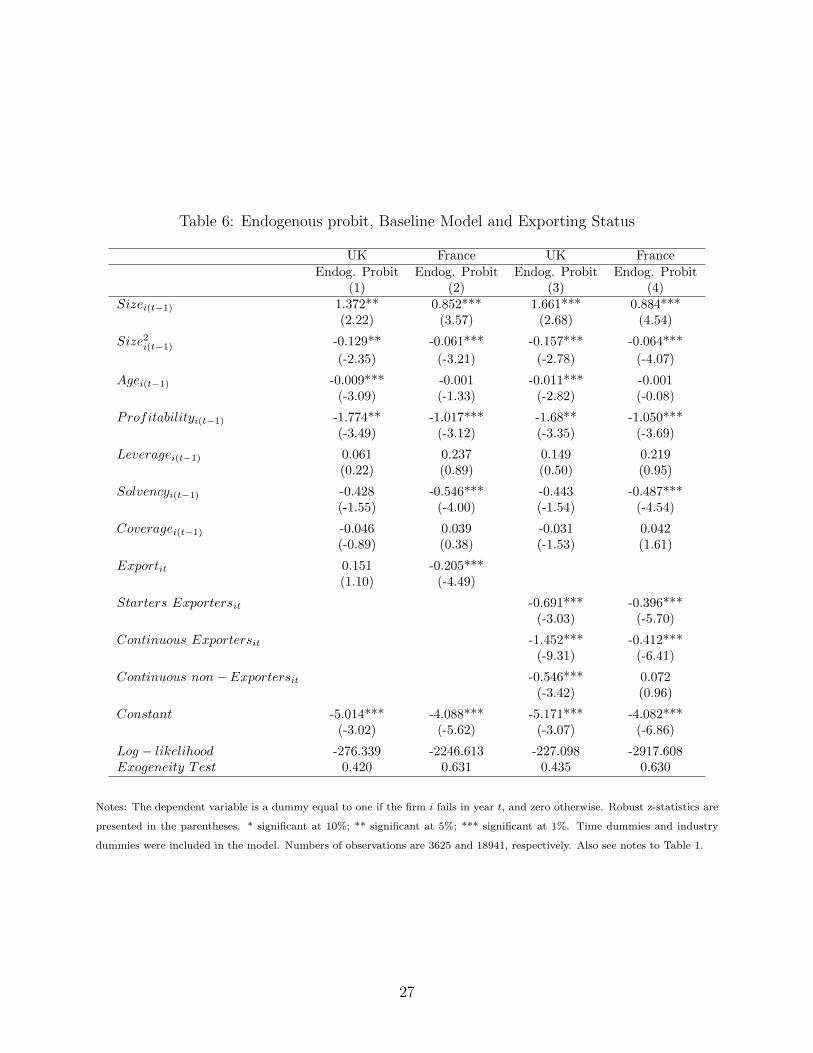
Table 6: Endogenous probit, Baseline Model and Exporting Status
UK France UK FranceEndog. Probit Endog. Probit Endog. Probit Endog. Probit
(1) (2) (3) (4)Sizei(t−1) 1.372** 0.852*** 1.661*** 0.884***
(2.22) (3.57) (2.68) (4.54)
Size2i(t−1) -0.129** -0.061*** -0.157*** -0.064***(-2.35) (-3.21) (-2.78) (-4.07)
Agei(t−1) -0.009*** -0.001 -0.011*** -0.001(-3.09) (-1.33) (-2.82) (-0.08)
Profitabilityi(t−1) -1.774** -1.017*** -1.68** -1.050***(-3.49) (-3.12) (-3.35) (-3.69)
Leveragei(t−1) 0.061 0.237 0.149 0.219(0.22) (0.89) (0.50) (0.95)
Solvencyi(t−1) -0.428 -0.546*** -0.443 -0.487***(-1.55) (-4.00) (-1.54) (-4.54)
Coveragei(t−1) -0.046 0.039 -0.031 0.042(-0.89) (0.38) (-1.53) (1.61)
Exportit 0.151 -0.205***(1.10) (-4.49)
Starters Exportersit -0.691*** -0.396***(-3.03) (-5.70)
Continuous Exportersit -1.452*** -0.412***(-9.31) (-6.41)
Continuous non− Exportersit -0.546*** 0.072(-3.42) (0.96)
Constant -5.014*** -4.088*** -5.171*** -4.082***(-3.02) (-5.62) (-3.07) (-6.86)
Log − likelihood -276.339 -2246.613 -227.098 -2917.608Exogeneity Test 0.420 0.631 0.435 0.630
Notes: The dependent variable is a dummy equal to one if the firm i fails in year t, and zero otherwise. Robust z-statistics are
presented in the parentheses. * significant at 10%; ** significant at 5%; *** significant at 1%. Time dummies and industry
dummies were included in the model. Numbers of observations are 3625 and 18941, respectively. Also see notes to Table 1.
27
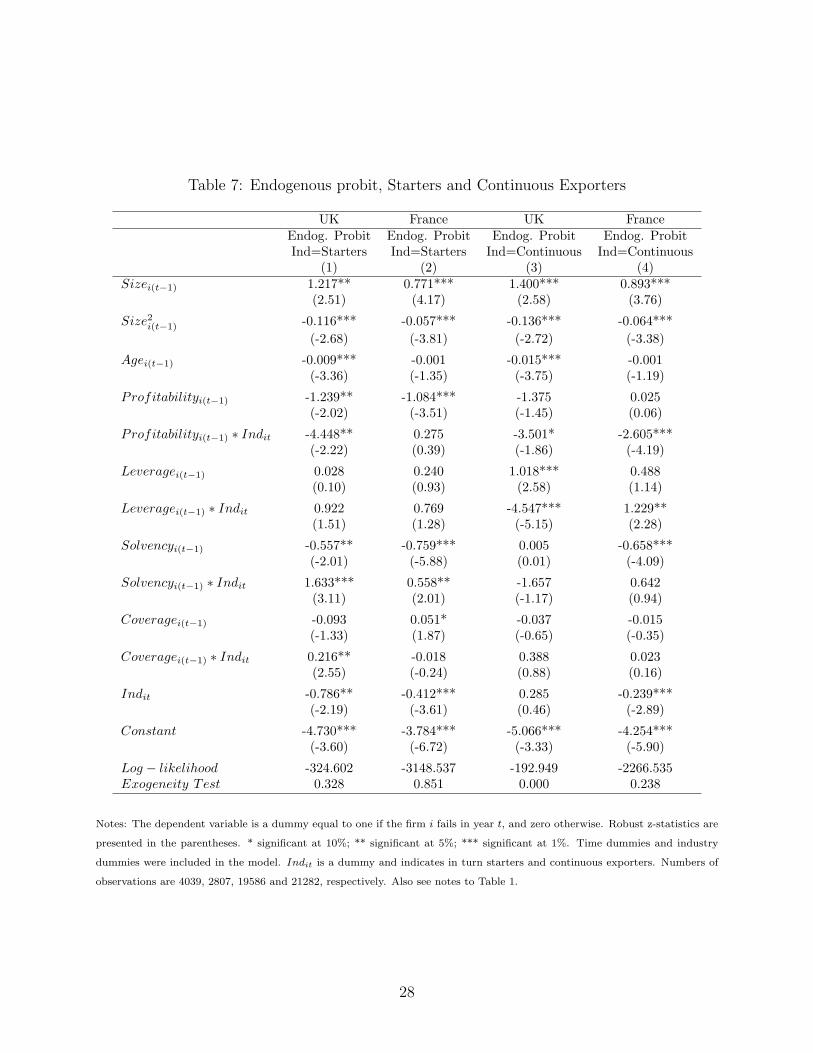
Table 7: Endogenous probit, Starters and Continuous Exporters
UK France UK FranceEndog. Probit Endog. Probit Endog. Probit Endog. ProbitInd=Starters Ind=Starters Ind=Continuous Ind=Continuous
(1) (2) (3) (4)Sizei(t−1) 1.217** 0.771*** 1.400*** 0.893***
(2.51) (4.17) (2.58) (3.76)
Size2i(t−1) -0.116*** -0.057*** -0.136*** -0.064***(-2.68) (-3.81) (-2.72) (-3.38)
Agei(t−1) -0.009*** -0.001 -0.015*** -0.001(-3.36) (-1.35) (-3.75) (-1.19)
Profitabilityi(t−1) -1.239** -1.084*** -1.375 0.025(-2.02) (-3.51) (-1.45) (0.06)
Profitabilityi(t−1) ∗ Indit -4.448** 0.275 -3.501* -2.605***(-2.22) (0.39) (-1.86) (-4.19)
Leveragei(t−1) 0.028 0.240 1.018*** 0.488(0.10) (0.93) (2.58) (1.14)
Leveragei(t−1) ∗ Indit 0.922 0.769 -4.547*** 1.229**(1.51) (1.28) (-5.15) (2.28)
Solvencyi(t−1) -0.557** -0.759*** 0.005 -0.658***(-2.01) (-5.88) (0.01) (-4.09)
Solvencyi(t−1) ∗ Indit 1.633*** 0.558** -1.657 0.642(3.11) (2.01) (-1.17) (0.94)
Coveragei(t−1) -0.093 0.051* -0.037 -0.015(-1.33) (1.87) (-0.65) (-0.35)
Coveragei(t−1) ∗ Indit 0.216** -0.018 0.388 0.023(2.55) (-0.24) (0.88) (0.16)
Indit -0.786** -0.412*** 0.285 -0.239***(-2.19) (-3.61) (0.46) (-2.89)
Constant -4.730*** -3.784*** -5.066*** -4.254***(-3.60) (-6.72) (-3.33) (-5.90)
Log − likelihood -324.602 -3148.537 -192.949 -2266.535Exogeneity Test 0.328 0.851 0.000 0.238
Notes: The dependent variable is a dummy equal to one if the firm i fails in year t, and zero otherwise. Robust z-statistics are
presented in the parentheses. * significant at 10%; ** significant at 5%; *** significant at 1%. Time dummies and industry
dummies were included in the model. Indit is a dummy and indicates in turn starters and continuous exporters. Numbers of
observations are 4039, 2807, 19586 and 21282, respectively. Also see notes to Table 1.
28
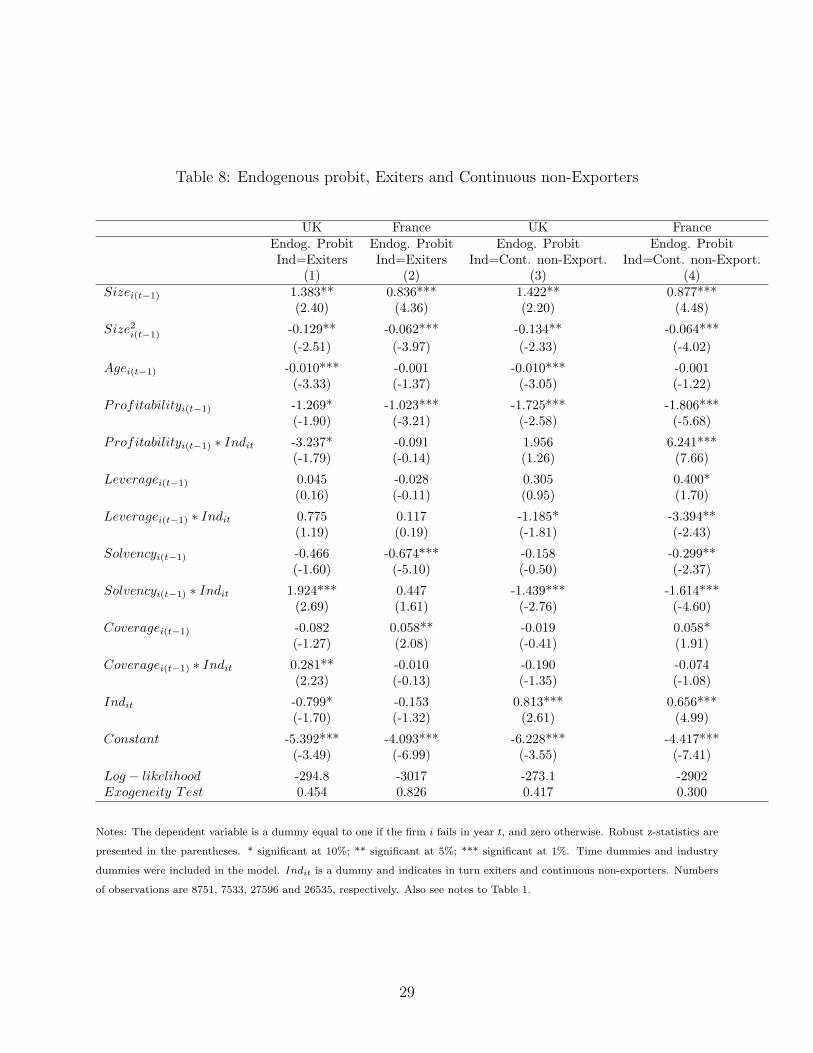
Table 8: Endogenous probit, Exiters and Continuous non-Exporters
UK France UK FranceEndog. Probit Endog. Probit Endog. Probit Endog. ProbitInd=Exiters Ind=Exiters Ind=Cont. non-Export. Ind=Cont. non-Export.
(1) (2) (3) (4)Sizei(t−1) 1.383** 0.836*** 1.422** 0.877***
(2.40) (4.36) (2.20) (4.48)
Size2i(t−1) -0.129** -0.062*** -0.134** -0.064***(-2.51) (-3.97) (-2.33) (-4.02)
Agei(t−1) -0.010*** -0.001 -0.010*** -0.001(-3.33) (-1.37) (-3.05) (-1.22)
Profitabilityi(t−1) -1.269* -1.023*** -1.725*** -1.806***(-1.90) (-3.21) (-2.58) (-5.68)
Profitabilityi(t−1) ∗ Indit -3.237* -0.091 1.956 6.241***(-1.79) (-0.14) (1.26) (7.66)
Leveragei(t−1) 0.045 -0.028 0.305 0.400*(0.16) (-0.11) (0.95) (1.70)
Leveragei(t−1) ∗ Indit 0.775 0.117 -1.185* -3.394**(1.19) (0.19) (-1.81) (-2.43)
Solvencyi(t−1) -0.466 -0.674*** -0.158 -0.299**(-1.60) (-5.10) (-0.50) (-2.37)
Solvencyi(t−1) ∗ Indit 1.924*** 0.447 -1.439*** -1.614***(2.69) (1.61) (-2.76) (-4.60)
Coveragei(t−1) -0.082 0.058** -0.019 0.058*(-1.27) (2.08) (-0.41) (1.91)
Coveragei(t−1) ∗ Indit 0.281** -0.010 -0.190 -0.074(2.23) (-0.13) (-1.35) (-1.08)
Indit -0.799* -0.153 0.813*** 0.656***(-1.70) (-1.32) (2.61) (4.99)
Constant -5.392*** -4.093*** -6.228*** -4.417***(-3.49) (-6.99) (-3.55) (-7.41)
Log − likelihood -294.8 -3017 -273.1 -2902Exogeneity Test 0.454 0.826 0.417 0.300
Notes: The dependent variable is a dummy equal to one if the firm i fails in year t, and zero otherwise. Robust z-statistics are
presented in the parentheses. * significant at 10%; ** significant at 5%; *** significant at 1%. Time dummies and industry
dummies were included in the model. Indit is a dummy and indicates in turn exiters and continuous non-exporters. Numbers
of observations are 8751, 7533, 27596 and 26535, respectively. Also see notes to Table 1.
29
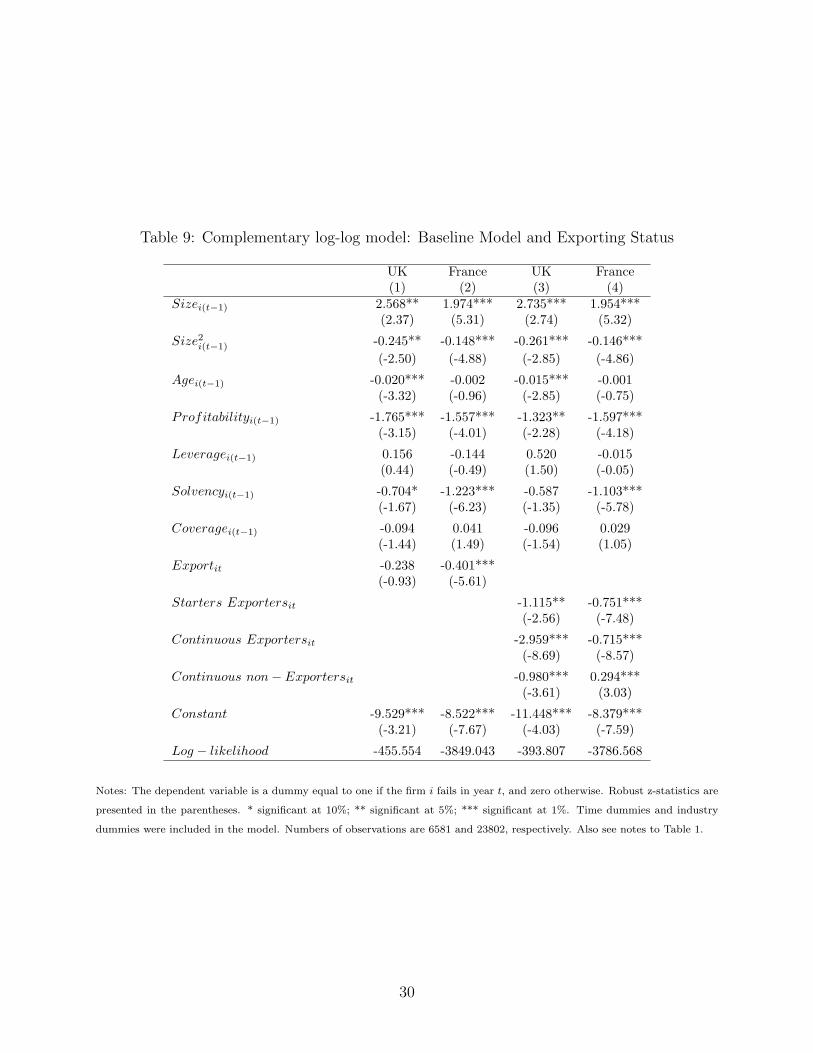
Table 9: Complementary log-log model: Baseline Model and Exporting Status
UK France UK France(1) (2) (3) (4)
Sizei(t−1) 2.568** 1.974*** 2.735*** 1.954***(2.37) (5.31) (2.74) (5.32)
Size2i(t−1) -0.245** -0.148*** -0.261*** -0.146***(-2.50) (-4.88) (-2.85) (-4.86)
Agei(t−1) -0.020*** -0.002 -0.015*** -0.001(-3.32) (-0.96) (-2.85) (-0.75)
Profitabilityi(t−1) -1.765*** -1.557*** -1.323** -1.597***(-3.15) (-4.01) (-2.28) (-4.18)
Leveragei(t−1) 0.156 -0.144 0.520 -0.015(0.44) (-0.49) (1.50) (-0.05)
Solvencyi(t−1) -0.704* -1.223*** -0.587 -1.103***(-1.67) (-6.23) (-1.35) (-5.78)
Coveragei(t−1) -0.094 0.041 -0.096 0.029(-1.44) (1.49) (-1.54) (1.05)
Exportit -0.238 -0.401***(-0.93) (-5.61)
Starters Exportersit -1.115** -0.751***(-2.56) (-7.48)
Continuous Exportersit -2.959*** -0.715***(-8.69) (-8.57)
Continuous non− Exportersit -0.980*** 0.294***(-3.61) (3.03)
Constant -9.529*** -8.522*** -11.448*** -8.379***(-3.21) (-7.67) (-4.03) (-7.59)
Log − likelihood -455.554 -3849.043 -393.807 -3786.568
Notes: The dependent variable is a dummy equal to one if the firm i fails in year t, and zero otherwise. Robust z-statistics are
presented in the parentheses. * significant at 10%; ** significant at 5%; *** significant at 1%. Time dummies and industry
dummies were included in the model. Numbers of observations are 6581 and 23802, respectively. Also see notes to Table 1.
30

Table 10: Complementary log-log: Starters and Continuous Exporters
UK France UK FranceInd=Starters Ind=Starters Ind=Continuous Ind=Continuous
(1) (2) (3) (4)Sizei(t−1) 2.573*** 1.612*** 2.711*** 2.014***
(2.68) (4.64) (2.84) (5.44)
Size2i(t−1) -0.242*** -0.123*** -0.259*** -0.152***(-2.81) (-4.33) (-2.96) (-5.00)
Agei(t−1) -0.018*** -0.002 -0.014*** -0.001(-3.46) (-1.07) (-2.78) (-0.92)
Profitabilityi(t−1) -1.716*** -1.931*** -1.529** -0.198(-2.95) (-4.64) (-2.46) (-0.43)
Profitabilityi(t−1) ∗ Indit -2.831* 0.446 -2.378* -3.704***(-1.76) (0.48) (-1.65) (-4.73)
Leveragei(t−1) 0.356 -0.481 0.872*** -1.010**(0.97) (-1.52) (2.37) (-2.16)
Leveragei(t−1) ∗ Indit 1.496* 0.555 -2.123*** 1.843***(1.88) (0.70) (-3.02) (3.02)
Solvencyi(t−1) -0.268 -1.512*** -0.281 -1.517***(-0.52) (-7.12) (-0.56) (-6.43)
Solvencyi(t−1) ∗ Indit 1.945** 0.855* -0.145 0.894**(2.09) (1.82) (-0.12) (2.20)
Coveragei(t−1) -0.183 0.052* -0.089 -0.029(-1.48) (1.95) (-1.53) (-0.67)
Coveragei(t−1) ∗ Indit 0.268** -0.068 -0.704 0.149***(2.09) (-0.64) (-1.05) (2.67)
Indit -1.187** -0.713*** -1.462*** -0.781***(-1.96) (-3.91) (-2.68) (-5.23)
Constant -9.909*** -7.318*** -10.221*** -8.605***(-3.79) (-7.02) (-3.94) (-7.77)
Log − likelihood -558.581 -4081.884 -436.305 -3864.714
Notes: The dependent variable is a dummy equal to one if the firm i fails in year t, and zero otherwise. Robust z-statistics are
presented in the parentheses. * significant at 10%; ** significant at 5%; *** significant at 1%. Time dummies and industry
dummies were included in the model. Indit is a dummy and indicates in turn starters and continuous exporters. Numbers of
observations are 7586, 6670, 24732 and 23973, respectively. Also see notes to Table 1.
31

Table 11: Complementary log-log: Exiters and Continuous non-Exporters
UK France UK FranceInd=Exiters Ind=Exiters Ind=Cont. non-Export. Ind=Cont. non-Export.
(1) (2) (3) (4)Sizei(t−1) 2.593*** 1.674*** 2.570** 1.871***
(2.71) (4.78) (2.34) (5.10)
Size2i(t−1) -0.244*** -0.128*** -0.244** -0.139***(-2.84) (-4.45) (-2.47) (-4.63)
Agei(t−1) -0.018*** -0.002 -0.020*** -0.001(-3.42) (-1.06) (-3.28) (-0.84)
Profitabilityi(t−1) -1.708*** -1.858*** -1.867*** -2.941***(-2.91) (-4.42) (-3.08) (-7.09)
Profitabilityi(t−1) ∗ Indit -2.635* 0.166 0.819 8.625***(-1.74) (0.19) (0.54) (9.20)
Leveragei(t−1) 0.396 -0.310 0.479 0.305(1.08) (-1.00) (1.15) (1.03)
Leveragei(t−1) ∗ Indit 1.306 -0.297 -1.337 -4.533**(1.46) (-0.36) (-1.51) (-2.36)
Solvencyi(t−1) -0.247 -1.592*** -0.266 -0.703***(-0.48) (-7.35) (-0.50) (-3.29)
Solvencyi(t−1) ∗ Indit 1.768* 1.199*** -2.109*** -2.244***(1.72) (2.64) (-2.84) (-4.33)
Coveragei(t−1) -0.186 0.050* -0.071 0.053(-1.49) (1.73) (-1.14) (1.64)
Coveragei(t−1) ∗ Indit 0.285** -0.038 -0.277 -0.126*(2.19) (-0.49) (-1.25) (-1.89)
Indit -0.743 -0.399** 1.202*** 1.161***(-1.14) (-2.20) (2.86) (6.72)
Constant -10.013*** -7.583*** -12.337*** -8.751***(-3.85) (-7.19) (-4.00) (-7.93)
Log − likelihood 558.234 -4093.098 -453.535 -3781.746
Notes: The dependent variable is a dummy equal to one if the firm i fails in year t, and zero otherwise. Robust z-statistics are
presented in the parentheses. * significant at 10%; ** significant at 5%; *** significant at 1%. Time dummies and industry
dummies were included in the model. Indit is a dummy and indicates in turn exiters and continuous non-exporters. Numbers
of observations are 7586, 6581, 24732 and 23802, respectively. Also see notes to Table 1.
32

Table A-1: Baseline Model and Control Variables
UK France UK FrancePooled Probit Pooled Probit Pooled Probit Pooled Probit
(1) (2) (3) (4)Sizei(t−1) 0.895** 0.775*** 0.931** 0.844***
(2.37) (4.77) (2.53) (5.30)
Size2i(t−1) -0.082** -0.053*** -0.090*** -0.063***(-2.42) (-3.98) (-2.68) (-4.84)
Agei(t−1) -0.007*** -0.001 -0.008*** -0.001(-3.24) (-1.14) (-3.77) (-1.06)
Profitabilityi(t−1) -0.879*** -0.813*** -0.872*** -0.841***(-3.33) (-4.49) (-3.39) (-4.66)
Leveragei(t−1) 0.092 0.068 0.074 -0.052(0.55) (0.49) (0.45) (-0.37)
Solvencyi(t−1) -0.387** -0.368*** -0.333 -0.527***(-2.07) (-3.98) (-1.80) (-5.84)
Coveragei(t−1) -0.038* 0.012 -0.037* 0.022*(-1.66) (0.86) (-1.67) (1.67)
Subsidiariesit -0.348*** -0.668***(-3.73) (-18.03)
Foreign Ownedit 0.249*** -0.261***(2.59) (-6.28)
Capital Intensityj 0.063** -0.046***(2.29) (-2.56)
Exportit -0.131 -0.174*** -0.117 -0.172***(-1.22) (-4.92) (-1.11) (-4.98)
Constant -3.958*** -3.728*** -5.013*** -3.974***(-3.91) (-7.65) (-4.57) (-8.29)
Log − likelihood -443.844 -3638.178 -454.021 -3852.192
Notes: The dependent variable is a dummy equal to one if the firm i fails in year t, and zero otherwise. Robust z-statistics are
presented in the parentheses. * significant at 10%; ** significant at 5%; *** significant at 1%. Time dummies and industry
dummies were included in the model. Numbers of observations are 6581 and 23802, respectively. Also see notes to Table 1.
33
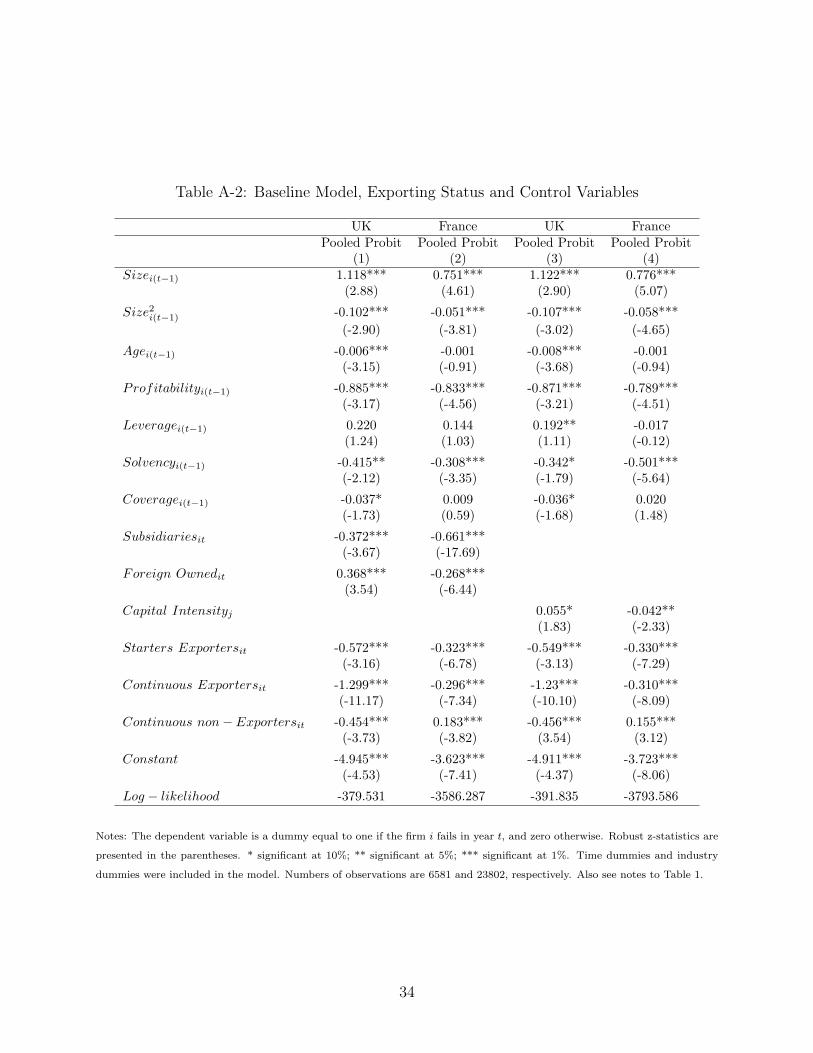
Table A-2: Baseline Model, Exporting Status and Control Variables
UK France UK FrancePooled Probit Pooled Probit Pooled Probit Pooled Probit
(1) (2) (3) (4)Sizei(t−1) 1.118*** 0.751*** 1.122*** 0.776***
(2.88) (4.61) (2.90) (5.07)
Size2i(t−1) -0.102*** -0.051*** -0.107*** -0.058***(-2.90) (-3.81) (-3.02) (-4.65)
Agei(t−1) -0.006*** -0.001 -0.008*** -0.001(-3.15) (-0.91) (-3.68) (-0.94)
Profitabilityi(t−1) -0.885*** -0.833*** -0.871*** -0.789***(-3.17) (-4.56) (-3.21) (-4.51)
Leveragei(t−1) 0.220 0.144 0.192** -0.017(1.24) (1.03) (1.11) (-0.12)
Solvencyi(t−1) -0.415** -0.308*** -0.342* -0.501***(-2.12) (-3.35) (-1.79) (-5.64)
Coveragei(t−1) -0.037* 0.009 -0.036* 0.020(-1.73) (0.59) (-1.68) (1.48)
Subsidiariesit -0.372*** -0.661***(-3.67) (-17.69)
Foreign Ownedit 0.368*** -0.268***(3.54) (-6.44)
Capital Intensityj 0.055* -0.042**(1.83) (-2.33)
Starters Exportersit -0.572*** -0.323*** -0.549*** -0.330***(-3.16) (-6.78) (-3.13) (-7.29)
Continuous Exportersit -1.299*** -0.296*** -1.23*** -0.310***(-11.17) (-7.34) (-10.10) (-8.09)
Continuous non− Exportersit -0.454*** 0.183*** -0.456*** 0.155***(-3.73) (-3.82) (3.54) (3.12)
Constant -4.945*** -3.623*** -4.911*** -3.723***(-4.53) (-7.41) (-4.37) (-8.06)
Log − likelihood -379.531 -3586.287 -391.835 -3793.586
Notes: The dependent variable is a dummy equal to one if the firm i fails in year t, and zero otherwise. Robust z-statistics are
presented in the parentheses. * significant at 10%; ** significant at 5%; *** significant at 1%. Time dummies and industry
dummies were included in the model. Numbers of observations are 6581 and 23802, respectively. Also see notes to Table 1.
34

Table A-3: Baseline Model and Exporting Status
UK France UK FranceMarginal Changes Marginal Changes Marginal Changes Marginal Changes
(1) (2) (3) (4)Sizei(t−1) 1.9** 6.643*** 1.064*** 6.19***
(2.53) (5.30) (2.90) (5.16)
Size2i(t−1) -0.188*** -0.496*** -0.101*** -0.458***(-2.68) (-4.84) (-3.02) (-4.66)
Agei(t−1) -0.018*** -0.006 -0.007*** -0.004(-3.77) (-1.06) (-3.68) (-0.80)
Profitabilityi(t−1) -6.620*** -1.818*** -6.54*** -0.825***(-4.66) (-3.39) (-4.72) (-3.21)
Leveragei(t−1) 0.155 0.41 0.182 0.171(0.45) (0.37) (1.11) (0.16)
Solvencyi(t−1) -0.695* -4.152*** -0.324* -3.635***(-1.80) (-5.84) (-1.79) (-5.32)
Coveragei(t−1) -0.073* 0.169 -0.034* 0.137(-1.66) (1.64) (-1.68) (1.33)
Exportit -0.272 -1.492***(-1.11) (-4.98)
Starters Exportersit -0.287*** -2.238***(-3.13) (-7.38)
Continuous Exportersit -2.542*** -2.565***(-10.10) (-8.53)
Continuous non− Exportersit -0.282*** 1.150***(-3.82) (2.69)
Log − likelihood -454.1 -3852 -391.835 -3793.582
Notes: The dependent variable is a dummy equal to one if the firm i fails in year t, and zero otherwise. Robust z-statistics are
presented in the parentheses. * significant at 10%; ** significant at 5%; *** significant at 1%. Time dummies and industry
dummies were included in the model. Numbers of observations are 6581 and 23802, respectively. Also see notes to Table 1.
35
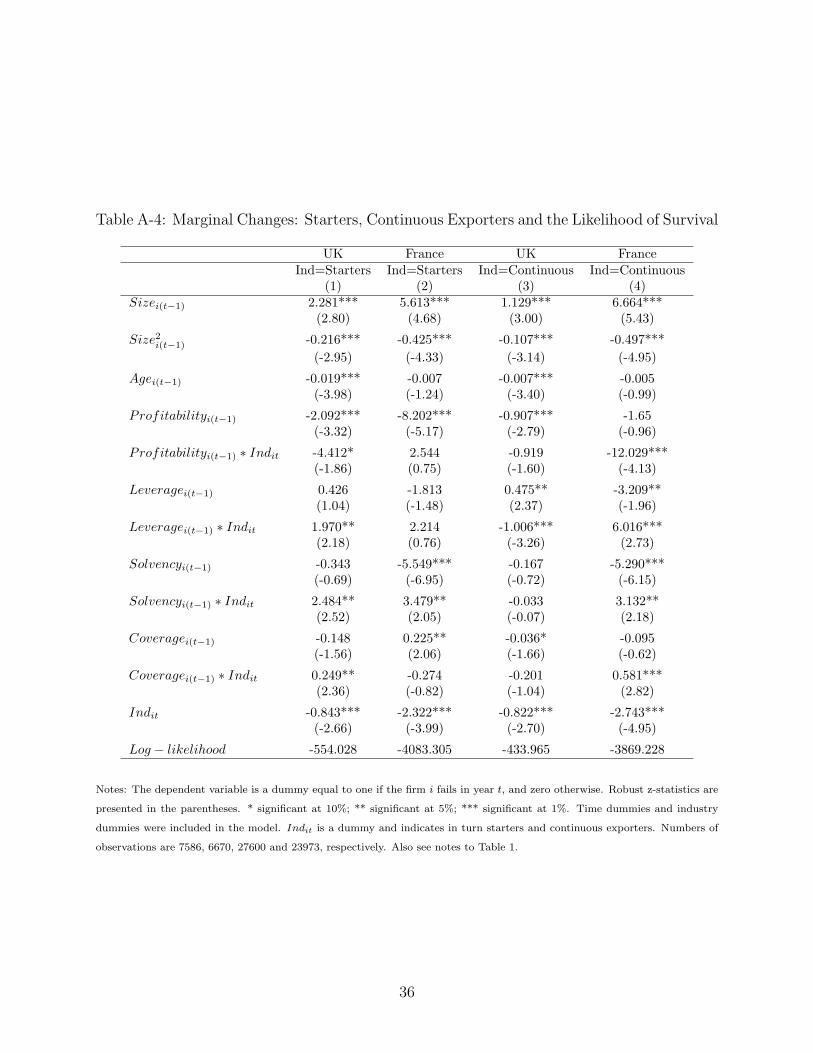
Table A-4: Marginal Changes: Starters, Continuous Exporters and the Likelihood of Survival
UK France UK FranceInd=Starters Ind=Starters Ind=Continuous Ind=Continuous
(1) (2) (3) (4)Sizei(t−1) 2.281*** 5.613*** 1.129*** 6.664***
(2.80) (4.68) (3.00) (5.43)
Size2i(t−1) -0.216*** -0.425*** -0.107*** -0.497***(-2.95) (-4.33) (-3.14) (-4.95)
Agei(t−1) -0.019*** -0.007 -0.007*** -0.005(-3.98) (-1.24) (-3.40) (-0.99)
Profitabilityi(t−1) -2.092*** -8.202*** -0.907*** -1.65(-3.32) (-5.17) (-2.79) (-0.96)
Profitabilityi(t−1) ∗ Indit -4.412* 2.544 -0.919 -12.029***(-1.86) (0.75) (-1.60) (-4.13)
Leveragei(t−1) 0.426 -1.813 0.475** -3.209**(1.04) (-1.48) (2.37) (-1.96)
Leveragei(t−1) ∗ Indit 1.970** 2.214 -1.006*** 6.016***(2.18) (0.76) (-3.26) (2.73)
Solvencyi(t−1) -0.343 -5.549*** -0.167 -5.290***(-0.69) (-6.95) (-0.72) (-6.15)
Solvencyi(t−1) ∗ Indit 2.484** 3.479** -0.033 3.132**(2.52) (2.05) (-0.07) (2.18)
Coveragei(t−1) -0.148 0.225** -0.036* -0.095(-1.56) (2.06) (-1.66) (-0.62)
Coveragei(t−1) ∗ Indit 0.249** -0.274 -0.201 0.581***(2.36) (-0.82) (-1.04) (2.82)
Indit -0.843*** -2.322*** -0.822*** -2.743***(-2.66) (-3.99) (-2.70) (-4.95)
Log − likelihood -554.028 -4083.305 -433.965 -3869.228
Notes: The dependent variable is a dummy equal to one if the firm i fails in year t, and zero otherwise. Robust z-statistics are
presented in the parentheses. * significant at 10%; ** significant at 5%; *** significant at 1%. Time dummies and industry
dummies were included in the model. Indit is a dummy and indicates in turn starters and continuous exporters. Numbers of
observations are 7586, 6670, 27600 and 23973, respectively. Also see notes to Table 1.
36
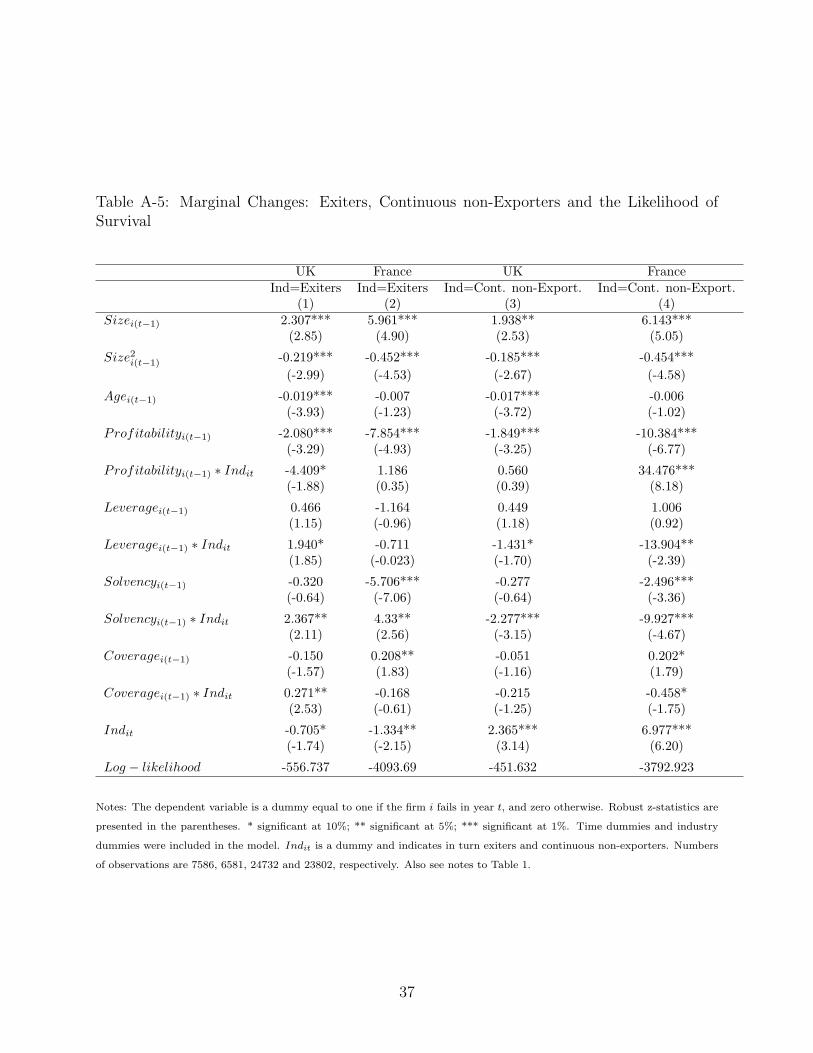
Table A-5: Marginal Changes: Exiters, Continuous non-Exporters and the Likelihood ofSurvival
UK France UK FranceInd=Exiters Ind=Exiters Ind=Cont. non-Export. Ind=Cont. non-Export.
(1) (2) (3) (4)Sizei(t−1) 2.307*** 5.961*** 1.938** 6.143***
(2.85) (4.90) (2.53) (5.05)
Size2i(t−1) -0.219*** -0.452*** -0.185*** -0.454***(-2.99) (-4.53) (-2.67) (-4.58)
Agei(t−1) -0.019*** -0.007 -0.017*** -0.006(-3.93) (-1.23) (-3.72) (-1.02)
Profitabilityi(t−1) -2.080*** -7.854*** -1.849*** -10.384***(-3.29) (-4.93) (-3.25) (-6.77)
Profitabilityi(t−1) ∗ Indit -4.409* 1.186 0.560 34.476***(-1.88) (0.35) (0.39) (8.18)
Leveragei(t−1) 0.466 -1.164 0.449 1.006(1.15) (-0.96) (1.18) (0.92)
Leveragei(t−1) ∗ Indit 1.940* -0.711 -1.431* -13.904**(1.85) (-0.023) (-1.70) (-2.39)
Solvencyi(t−1) -0.320 -5.706*** -0.277 -2.496***(-0.64) (-7.06) (-0.64) (-3.36)
Solvencyi(t−1) ∗ Indit 2.367** 4.33** -2.277*** -9.927***(2.11) (2.56) (-3.15) (-4.67)
Coveragei(t−1) -0.150 0.208** -0.051 0.202*(-1.57) (1.83) (-1.16) (1.79)
Coveragei(t−1) ∗ Indit 0.271** -0.168 -0.215 -0.458*(2.53) (-0.61) (-1.25) (-1.75)
Indit -0.705* -1.334** 2.365*** 6.977***(-1.74) (-2.15) (3.14) (6.20)
Log − likelihood -556.737 -4093.69 -451.632 -3792.923
Notes: The dependent variable is a dummy equal to one if the firm i fails in year t, and zero otherwise. Robust z-statistics are
presented in the parentheses. * significant at 10%; ** significant at 5%; *** significant at 1%. Time dummies and industry
dummies were included in the model. Indit is a dummy and indicates in turn exiters and continuous non-exporters. Numbers
of observations are 7586, 6581, 24732 and 23802, respectively. Also see notes to Table 1.
37