in situ testing of peaty organic soils: a case...
TRANSCRIPT

10 TRANSPORTATION RESEARCH RECORD 1235
In Situ Testing of Peaty Organic Soils: A Case History
NANCY J. NICHOLS, JEAN BENOIT, AND FREDERIC E. PRIOR
In 1985, a section of a New Hampshire roadway located over a deposit of peaty organic soil 20 ft (6 m) thick was widened and raised. On the basis of vane shear strengths, the required embank· ment height increase of 5 ft was implemented in three stages over a 6-month period. Two years after the initial loading, more than 6.5 ft (2 m) of vertical displacement was observed. This paper presents the results of various in situ tests conducted following these events in material located away from and below the road embankment. The tests included plate load tests, self-boring and full-displacement pressuremeter tests, standard penetration tests, field vane tests, and dilatometer tests. Assessment of the effec· liveness of these tests in evaluating useful geotechnical soil param· eters for embankment design over very soft peaty organic soils is discussed.
Construction of embankments over highly organic soil deposits is often accomplished by. using design rules based on minimal characterization of soil properties with a design-as-yougo approach. Often, large and unacceptable settlements occur during and after construction . In response to these problems, organic foundations are commonly compacted with blasting or excavation and replacement methods, which alleviate the problem but at very high cost. Very soft, peaty organic soils are extremely difficult to sample undisturbed and are not well suited for conventional laboratory testing. Furthennore, peaty organic deposit are very variable within a given. ite, and thus extensive sampling is necessary for adequate characterization. Becau e of the heterogeneous and anisotropic nature of organic ·oi ls, full- cale field testing i · the most accurate approach to predicting the behavior of a fini hed design. uch tests are generally expensive and often impractical. However, with recent advances, in situ testing methods can be used to characterize such variable deposits more ec nomically and efficiently.
In 1985, a section of the New Boston Road in andia, New Hampshire, was widened and raised to accommodate safer two-way traffic and to prevent flooding from the nearby North Dranch Riv1;:1 . Thi~ section of the road mbankment is located over a deposit of peaty organic soil approximately 20 ft (6 m) in thickne .
After the last of three stages of fill placement nearly 1.5 ft (0.5 m) of differential movement occurred acr ss the centerline, separated by a longitudinal crack approximately 4.5 ft (1.4 m) deep and 100 ft (30.5 m) 10.ng. In the 2 years after the initial loading, more than 6.5 ft (2 m) of vertical displace-
N. J. Nichols, Haley and Aldrich, lnc., 360-8 Route IOJ, Bcdf rd , N.H. 03102. J. Benoit, Department of ivil Engineering, U1Jiversity of New Hampshire, Kingsbury Hall , Durham , N.H. 03824-3591. F . E. Prior, Srote f New Hampshire Department of ransportation, Concord, N.H. 03301.
ment was observed , twice that predicted by u ing a New Y rk Department of Transportafi n ( YD T) Bureau of Soil Mechanics (1) method based on water c ntent. As of July 22. 1988, the settlement rate wa about 2.7 in ./year (6.9 cm!year) and decrea. ing. The design of thi renovated embankment was based on vane shear trength and water content profiles.
After these events, everal in situ tests wer ondu ted to examine the properties of both the virgin material located away from the road embankment and the consolidated material below the road surface. The techniques included the use of the self-boring pressuremeter ( BPM , full-displacement pw uremeter (fDPM) , , tandard penetrati n test (SPT) field vane test (V T) , dilatometer (DMT) , and plate load test (PL T).
This paper pre ems a brief overview of lh composition and structure of organic soil , highlighting th difference fr m m re conventional soil types. The New Bo ron Road project is ummarized and used as a basis for evaluating the in . itu testing investigation program. The results of the various in situ tests allow an assessment of the effectiveness of these te ts in evaluating useful geotechnical soil parameters for mbankment design ov r very soft peaty organic soils.
COMPOSITION AND STRUCTURE OF ORGANIC SOILS
The composition of organic soil greatly depends on the extent of dee mposition, which is the breakdown of organic matter by microbial processes. Decomp ·ition leads to the disintegration of large organic particle. and reduction of th organic fraction of the soil. By-products of thi proce. in.elude water, bacterial ell , methane ga , and nondegradable organic matter termed humus. The rate of decomposition is a function of the type of plant tissue decaying, the pH and water content of the ii the oxygen and n11triMt nvailability, and the type of bacteria respon ible for the decomposition.
Highly organic soils are comp sed of b th fiber and granul.es in varying proportions and arrangements. These geometric elements range in siz from large tree trunks to clay· ized particles. An organic oil that consi ts predominantly of
colloidal ·oil particle i termed amorphou,-gran11lar , wh r a one that contain larg particle uch a ro ts , grasses and leaves is term d fibrou . Elc Ir n micr scop phot graphs of fibrou and amorphous-granular ·amples btai ned from the site show porous diatoms coating the organic particles. The composit i.on and structure of organic deposits are gen rally highly variable in plan and in cro · ection. Variations in types of plants , d gre.e and rates of decompoviticn, water content,

Nichols el al.
and porosity can occur over distances and depths that are much smaller than the width or thickness of a highway embankment (2).
The structure and composition of organic soils greatly affect their affinity for water and their shearing resistance. Finefibrous organic soils absorb and hold more water than coarsefibrous or amorphous-granular soils. On the other hand, coarsefibrous soils have the greatest shear strength (3). Because the structure and composition typically vary within an organic deposit, the engineering properties vary greatly as well. A brief discussion of organic soil index properties that are used as indicators of engineering behavior is presented below.
Organic Content
The organic content is approximately equal to the percentage of weight loss measured when a dry soil specimen is submerged in a caustic solution or combusted. The fraction of mass retained is termed the ash content. Although firing methods are most commonly used, these methods may lead to overestimation of the organic content by as much as 15 percent because of the combustion of inorganic carbon (3) . Various firing methods for determining the organic content were investigated by Andrejko et al. (4). Test results were found to depend significantly on sample preparation, duration of time allowed for ashing, firing temperatures, and the fraction and type of mineral matter in the specimens.
The range of organic contents associated with organic soil types depends on the system of classification. Throughout this paper, organic soils are classified according to a system introduced by Landva and Pheeney (5). "Peat" is defined as having no more than 20 percent ash content by dry weight. If a soil has more than 20 percent ash content but less than 40 percent , it is classified as a "peaty organic" soil. Moreover, "organic soil" and "soil with organic content" are defined as soils having an ash content from 40 to 95 percent, and from 95 to 99 percent, respectively.
Water Content
Because water content increases with increasing porosity at depths below the water table, and fibrous organic soils are typically more porous than are amorphous-granular soils, water content is generally greater for peats that are more fibrous. Furthermore, because compressibility is directly related to porosity, a high water content indicates high compressibility (3). A wholly organic peat (minimal ash content) typically has a water content ranging from 750 to 1500 percent, although values greater than 2000 percent have been reported (6). The water contents of peaty organic and organic soils are generally much lower.
Void Ratio
Void ratios typically range from 4 to 7 for amorphous-granular soils and from 7 to 15 for fibrous soils (7). However, values as low as 2 have been reported for deep amorphous deposits (8), and values as high as 28 have been reported for deep
11
fibrous deposits (6). Void ratios near the ground surface are generally between 2 and 5. The lower values are the results of shrinkage upon drying.
Gas Content
Landva and La Rochelle (2) report that wholly organic peat generally contains at least 10 percent gas. Saturated organic soils containing some mineral matter (9) are likely to contain less gas. Determination of the gas content, although very difficult, is quite important because it significantly influences permeability, rate of consolidation, and pore pressure measurement.
Specific Gravity
The specific gravity of the solids in an organic soil ranges from 1.1 to 2.5 (3). It is highest for soils having considerable mineral content. Amorphous-granular soils typically have a specific gravity of 1.9, whereas the specific gravity of fibrous soils ranges from 1.4 to 1. 7. Except for wholly organic peat, specific gravity has been found to decrease linearly with increasing water content (10).
Unit Weight
The unit weights of organic soils are usually very low due to their high porosity and low specific gravity of solids. The unit weight is highest for amorphous-granular soils and for organic soils with significant mineral content. Dry unit weights typically range from 5 to 20 pounds per cubic foot (pcf) (0.78 to 3.14 kN/m3
). Saturated, wholly organic peat may have nearly the same saturated unit weight as water. Due to the low saturated unit weight of organic soils, the in situ effective stresses in organic deposits are frequently also very low.
CASE HISTORY: NEW BOSTON ROAD, CANDIA, NEW HAMPSHIRE
A portion of the New Boston Road, located in Candia on the banks of the North Branch River near the Deerfield/Candia border (Figure 1), was renovated in 1985. The purpose of the project was to raise the road surface above seasonal flood waters and to widen it for safer two-way traffic. The plan included increases of grade and width of about 5 and 8 ft, respectively (1.5 and 2.4 m). The existing bridge was also replaced with a new structure at the proposed grade.
Site Conditions
Before renovations, 23 test borings were drilled to depths of up to 40 ft (12 m). The stratigraphy away from the road and near the river channel (Figure 2) generally consists of about 30 ft (9 m) of highly organic soil overlying 2 to 4 ft (0.6 to 1.2 m) of sandy silt with organic content and 6 to 12 ft (1.8 to 3.6 m) of blue, poorly graded, dense sandy gravel. The bedrock surface profile is approximately U-shaped, with the

HIGHEST WATER EL. 530.6 PROPOSED GRADE
EXISTING BRIDGE AVERAGE HIGH WATER EL. 327.4
~ 330 ,, Rl~R CHANNEL
/ GREY, POORLY GRADED SAND AND GRAVEL FILL
DENSE, SANDY GRAVEL
ro~ / ~ PEATY / ORGANIC SILT I 0
310 z ,,. ITl ITl
SANDY SILT WITH
1 300 ~ ORGANIC CONTENT r
0-..... ....____.......
'177-NEW HAMPSHIRE ............
~ -l 290 0 BEDROCK SMILES
98 100 102 104 106
STATION NUMBER (FEET X 100)
FIGURE 1 Site location and profile of the New Boston Road embankment before 1985 construction.

Nichols et al. 13
ORGANIC MAT
330 :; en ::;: ,_- COARSE - FIBROUS ORGANIC SILT
=:'.".'."'.".'.".:==:::::==:~~~=======--==.-~======::::!PR~:_R~'O::~~~~~~---- :-lJJ
~ FINE - FIBROUS PEATY ORGANIC SILT
z 310 0
AMORPHOUS - GRANULAR PEATY ORGANIC SILT ~ > lJJ
SILT WITH ORGllNI CONT N __J lJJ
290 BLUE, DENSE, SANDY
120 100 80
---
60 40
(OLD) SANO a GRAVEL FILL---- ----------FINE - FIBROUS
AMORPHOUS
SllJ WITH ORGA
~
GREY, DENSE, SANDY GRAVEL
BEDROCK
20 20 40 60
DISTANCE (FEET)
FIGURE 2 Cross-section of the New Boston Road embankment at STA 101+50 as of July 1988.
greatest depth to bedrock directly underneath the river channel (Figure 1). The highly organic deposit is deepest at about Station 102 + 00, where it ranges from 19 to 25 ft (5.8 to 7 .6 m) in thickness and pinches out on each side of the river channel. The sand and gravel fill is deepest under the river banks, where its depth ranges from 5 to 13 ft (1.5 to 4 m). At distances greater than 175 ft (53 m) from the river channel, the depth of fill is about 5 ft (1.5 m). The water table was observed to fluctuate with stream flow , with an average elevation near the existing ground surface at the toe of the embankment.
The highly organic soil deposit is composed predominantly of fine-fibrous and amorphous-granular organic silt. The ash content was found by firing to range from 34 to 68 percent ; it thus spans the borderline between peaty organic and organic silt. The fibers are both woody and non woody, consisting of wood fragments, twigs, rootlets , sedge, grass, and leaves. The fibrosity of the soil decreases with increasing depth. In general, coarse-fibrous organic silt is found only near the top of the organic deposit to depths of 4 and 8 ft (1.2 to 2.4 m) beneath the roadway and beneath the organic mat in the adjacent wetlands, respectively. Below this layer, the organic deposit gradually changes from fine-fibrous to amorphous. Occasional pockets of coarse-woody fibers located below the road surface are believed to be remnants of a preexisting corduroy road typical of early roadways over marshes. Pockets of sand and gravel fill are also found within the organic deposit at distances less than 50 ft (15 m) from the centerline. At depths greater than 14 ft (4.3 m), the soil is amorphousgranular with traces of fine fibers.
Before the roadway renovations, the water content of the organic soil varied with depth in a manner typical of a consolidating layer. Under the road and in the adjacent wetlands, water content increased with increasing depth to a maximum at depths of 15 to 20 ft (4.6 to 6.1 m) , and then decreased from that point to the underlying blue sandy gravel (Figure 3). Water contents also increased with increasing distance from the embankment. The maximum water content measured under the roadway, 6 ft (1.8 m) left of centerline at Station 102 + 27, was about 500 percent. In the virgin soil
northwest of the bridge, the highest water content measurement was 850 percent. Organic contents varied similarly.
Field vane shear strength profiles were obtained before renovations at Station 102 + 25 near the toe and the centerline of the existing embankment (Figure 3). Measurements were obtained after insertion of a standard tapered vane through a cased borehole. The results near the toe seem to indicate an average increase of shear strength with depth , from 150 to 325 psf (7 to 16 kN/m2). Directly underneath the roadway, the results show significantly greater strengths than near the toe, as expected from consolidation processes that have taken place through time.
Design Settlement and Stability Analyses
Total primary settlements were estimated during the design stage by an empirical method based on water content data developed by the NYDOT. The primary settlement due to the placement of 5 ft (1.5 m) of fill was predicted to be as much as 3 ft (0.9 m). Preliminary stability analyses were performed for several embankment slopes at Station 102 + 25. Analyses were performed using the vane shear data according to the modified Bishop method of slices, as well as with the wedge method. Although 4:1 slopes were found safe against sliding with a safety factor of 1.25 , a polypropylene woven geotextile was laid on or slightly below existing grade as a precautionary measure. Furthermore, the fill was placed in stages over a period of about 5 months.
Sequence of Events
In early April 1985, the existing road was graded, and the geotextile was placed loosely over the surface , with the sewn seams aligned perpendicular to the centerline of the road. To protect the geotextile, approximately 2 ft (0.6 m) of sand and gravel fill was immediately placed over the fabric. An additional 6 ft (1.8 m) of fill was placed on the embankment over the next 4 months. On September 9, 1985, a crack with a

14
325
320
315
--t:i 310 UJ u..
z 0 305 ~ > w ...J UJ 300
295
WATER CONTENT C°lv) 0 900
UNDER ROAD
STATION 102 BEFORE CONSTRUCTION (a,b,c,d l
STATION 101 + 50 AFTER CONSTRUCTION (e)
4
I e I
160 LEFT
80
3
I
TRANSPORTATION RESEARCH RECORD 1235
SHEAR STRENGTH (psf)
0 750
STATION 102 + 25 BEFORE CONSTRUCTION STANDARD VANE
--- STATION 101 + 50 AFTER CONSTRUCTION GEONOR VANE
2 I
I I d c b 0
111 I
I ~
...J
...J u: 9 0
~ iii S:! z <[ C) a: 0 .... >-~ w a..
!:J u;
...J
~ a: C)
a:o ""c:r ~o ;:,a:
~ iii S:! z <[ C) a: 0 .... >-~ w a..
~ (ii
uJ ~ a: (!)
a.. :::!!! <[
~ If)
~
DISTANCE FROM ct_ (FEET) RIGHT
FIGURE 3 water content and vane shear strength profiles under the New Boston Road embankment before construction and in the swamp.
depth of 1 in. (2.5 cm) was first noted in the pavement across the centerline between Stations 101 + 50 and 102 + 50. On October 10, 1985, the same crack extended to a depth of 4.5 ft (1.4 m). The vertical and horizontal relative displacements across the crack were 1.34 ft (0.41 m) and 1 in. (2.5 cm), respectively. At this time, an adjacent parallel crack of much smaller dimension was observed. Moreover, a large cavity had developed under the approach slabs due to the movement of fill. In August 1986, a 1-ft (0.30-m) surcharge was added to accelerate secondary settlement. It was removed in October 1986, at which time a maintenance program of regrading and filling was initiated to maintain final conditions.
Performance of the embankment during construction was monitored by two settlement platforms and one slope inclinometer. The platforms \Vere placed near the upper surface
of the existing road surface at offsets of 102 + 25, left 11, and 103 + 50, right 11. The latter platform was abandoned shortly after construction, because settlement at its location was minimal. The slope indicator was installed 5 months after the initiation of construction at an offset of 102 + 00, 37 ft left.
Vertical and horizontal displacements monitored at the west bank with the settlement platform and slope indicator, respectively, are plotted against time in Figure 4. Horizontal displacements monitored at depths of 6, 14, and 21 ft (1.8, 4.3, and 6.4 m) below the initial elevation of the settlement platform are shown. The time at zero displacement corresponds with the time of installation of the settlement platform. Total vertical displacement as of day 888 (September 3, 1987) was 6.4 ft (1.95 m), which is more than twice the amount predicted. Much of the observed vertical movement was related

Nichols et al. 15
"C ., "C al al "C"C .,
"C ., i.i: "C ~ "'O o.c .., II) "C .o e - .. in 0 E
"C CD al ., 51 "'
[;: ;g ~ ~~ "C "C "' ., ., "C "C .ca:. ,,;~~ • "C "' .,
"C 0 0 "C., 0 e' 0 __: u-o ~-0 ., "'O -·~ = 0.,
Olo °' "C.., .c 0 = a. i.i: i.i: 0> e o ~ .c LL~ ~o
~ -II) -~ 2tE g :J e -N Cf) :J <t ~~ 0: - a: -- Cf)
- 2 c: lnilial Conditions (lime :.Q)
~ Elev (f1 l < rTI
z 0
t SLOPE
~~NCLINOMETER
\~~·-.......
~-m - -300
2 :::0 -I (")
3 J>
LL.I 6 ....J
l!:i 0
~-- n, ..... ~ ' u, .... , I I I I
40 20 0 Ols1ance I f1)
0 4 rTI
'Tl
....J
~ 10
'' ', ',', ........ , ,,,, ................ I rTI (")
z 2 a: 0
··rv-...,,, ;::... 6n.... "'-A.).("\,... ... :::. .... .... ... ""6-. .....
5 ::j 0
'"'\.J•Q:) '' ';I!.....__ ......... SETTLEMENT PLAJFORM
~·········Q. .... ~i.ee;-i.-... ----6 ad 6 z
::r: 14 :.:a:·""-...,::::;:·······o -- .... _Ci c ------- b
--7 -....... 0 400 600
TIME (days) 1200
FIGURE 4 Vertical displacement as measured by the settlement platform at STA 102 + 25, left 11 feet, versus time; and horizontal displacements measured at depths of 6 feet, 14 feet, and 21 feet with the slope inclinometer at ST A 102 + 00, left 37 feet, versus time.
to horizontal displacement of the embankment foundation away from the road centerline. At least 6.7 in. (17 cm) of horizontal displacement occurred within the first year after the beginning of construction. The total horizontal displacement is unknown, because the slope indicator was not installed until after most of the construction had been completed. As of July 22, 1988, about 1,210 days from installation of the settlement platform, the rates of vertical settlement and horizontal displacement at mid-depth within the organic foundation were 2.7 in./year (7.0 cm/year) and 1.2 in./year (3.1 cm/year), respectively.
POSTCONSTRUCTION SITE INVESTIGATION
An extensive in situ site investigation program was started 2 years after construction to ascertain the mechanisms responsible for the excessive movements and cracking of the renovated road embankment and to assess the feasibility of using in situ testing methods in organic soils. Laboratory tests were conducted to determine unit weights and water contents. Furthermore, results from a limited number of laboratory strength and compressibility tests were compared to those from in situ tests. The unit weight determined from the undisturbed tube specimens ranged from 69.4 pcf (10.9 kN/m3
) under the road to 64.9 pcf (10.2 kN/m3
) in the coarse-fibrous soil of the wetlands. The unit weight of the amorphous-granular soil was
about 65.5 pcf (10.3 kN/m3). Water contents before and after
renovations are shown in Figures 3 and 5, respectively. After renovations, water content profiles indicate a reduction of water content at all depths. The postconstruction peak values were measured at nearly the same elevation as the preconstruction values but were 150 to 250 percent lower. This reduction indicates that the load of the new fill induced consolidation settlement.
In situ tests performed at the roadway location included standard penetration and flat plate dilatometer testing. SPT sampling was conducted continuously from the road surface through the organic deposit in two boreholes located at approximately the same station but on opposite sides of the road. Nine dilatometer tests were performed within the organic strata in a third borehold located about 30 ft (9 m) from the SPT boreholes.
In the wetland area, 2 vane shear profiles (20 tests), 4 dilatometer profiles (140 tests), 3 plate load tests, 12 fulldisplacement pressuremeter tests, and 3 self-boring pressuremeter tests were performed at varying distances from the embankment. The boreholes were located within a crosssection through Station 101+50 at distances left of the centerline ranging from 40 to 160 ft (12 to 49 m). Each plate load test was performed at a distance less than 30 ft (9 m) from the toe of the embankment and within 10 ft (3 m) of either a vane shear or a dilatometer testing location. The pressuremeter tests were performed outside of the influence of the
16 TRANSPORTATION RESEARCH RECORD 1235
BEFORE AFTER embankment at about 165 ft (50 m) left of the embankment
STATION Elev.(ft) centerline. One of the vane shear and one of the dilatometer
z 331.7 profiles were also located in that area. Elev. (f1) 1'11 :E
328.5 0 102 + 27, LT .., x 101 + 28, RT r 5 /:). . 101+50, LT r
_J + 101 + 50, RT _J
Li: ...... , Plate Load Testing 5 0 ',, x FABRIC/
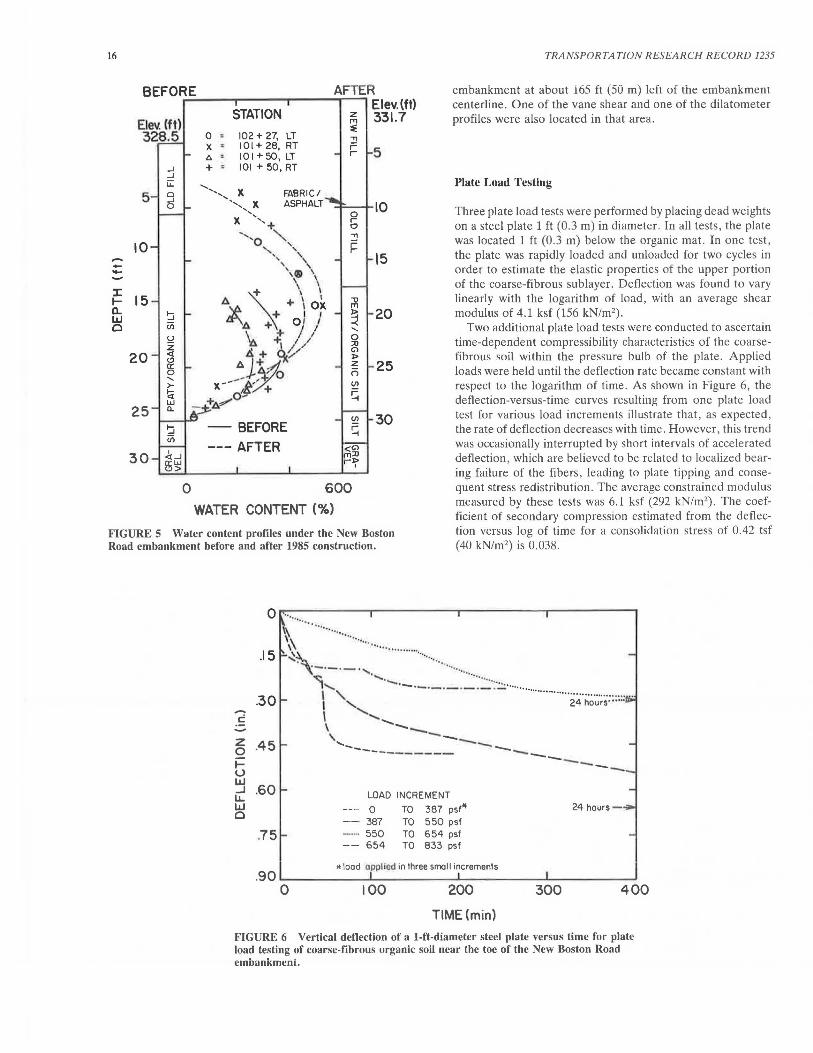
_J ... ........ .... x ASPHALT 0 10 Three plate load tests were performed by placing dead weights ' , 0 x ' ' + r on a steel plate 1 ft (0 .3 m) in diameter. In all tests, the plate 0
'-o "- :!! was located 1 ft (0 .3 m) below the organic mat. In one test, 10 ' r ...... ' r the plate was rapidly loaded and unloaded for two cycles in ' , ', 15 - ' \~ \ order to estimate the elastic properties of the upper portion .... \ \
J: \ \ \ of the coarse-fibrous sublayer. Deflection was found to vary
..... 15 A + \OX "tJ linearly with the logarithm of load, with an average shear a.. 1'11
modulus of 4.1 ksf (156 kN/m2). ~ + I I ~ 20 LL.I ~ o) / 0 Vi -< Two additional plate load tests were conducted to ascertain '
~ \. {~/ 0 time-dependent compressibility characteristics of the coarse-z ::0
20 <( ..s.+ W/ G'l fibrous soil within the pressure bulb of the plate. Applied (!) l>
er ~J)r z 25 0 i'i loads were held until the deflection rate became constant with
' >- x--at' + Ul respect to the logarithm of time. As shown in Figure 6, the t:i ~ w - +A?"' deflection-versus-time curves resulting from one plate load
25 a. 30 test for various load increments illustrate that, as expected,
~ - BEFORE the rate of deflection decreases with time. However, this trend Vi
--- AFTER was occasionally interrupted by short intervals of accelerated .!x-1
<G'l
30 m::o deflection, which are believed to be related to localized bear-~!$!
rl> I
ing failure of the fibers, leading to plate tipping and conse-
0 600 quent stress redistribution. The average constrained modulus
WATER CONTENT(%) measured by these tests was 6.1 ksf (292 kN/m2
). The coef-ficient of secondary compression estimated from the deflec-
FIGURE 5 Water content profiles under the New Boston tion versus log of time for a consolidation stress of 0.42 tsf Road embankment before and after 1985 construction. (40 kN/m2
) is O.D38 .
--c: z 0 ~ u LL.I ....I LL LL.I 0
0
.15
. 30
.45
.......
~'\ ..... ·· ····· ........... .... .. - ....... . ... ·-·-·-· 1 ....... , .................... _._,_.~·:::·:::· :·.::.:. ....... ................. 24·h~·~;5:::::; .. I '---..... I ....... _
\ --'..... ---------------- ............... ------.60 LOAD INCREMENT
0 TO 387 psflf 24 hours -
-·-- 387 TO 550 psf
.75 --··· 550 TO 654 psf -- 654 TO 833 psf
*load applied in three smol I increments .90..._~~~~-'-~~~~--L~~~~~..__~~~~~
0 100 200
TIME(min)
300 400
FIGURE 6 Vertical deflection of a I-ft-diameter steel plate versus time for plate load testing of coarse-fibrous organic soil near the toe of the New Boston Road embankment.

Nichols et al.
Standard Penetration Testing
The stratigraphy underlying the embankment at Station 101+50 determined from the split-spoon sampling is illustrated in Figure 2. As shown, the preexisting road surface is now located at a depth of about 10 ft (3 m). Sandy silt with organic content was encountered at a depth of 28 ft (8.5 m) in each borehole. The split-spoon samples were also used to develop the water content profiles within the embankment. Standard penetration testing in the fill above and below the geotextile yielded average penetration resistance corrected for overburden pressures (N, in blows per foot) of 34 and 23, respectively. The SPT results before construction in the organic soil below the fill ranged from 0 to 7. On average, the postconstruction values of N in the organic soil were increased by 2 blows/ft, indicating an increased density of the organic soil subsequent to construction.
Field Vane Shear Testing
Field vane shear tests were performed after renovation with a Geonor vane apparatus at Station 101+35, 68 and 160 ft (21and49 m) left of centerline (Figure 3). The Geonor vane, which is nearly half the dimensions of the vane that was used during preconstruction investigations, was advanced according to the manufacturer's instructions for minimum soil disturbance. Rotation of the vane was commenced immediately after vane penetration and was maintained at a standard rate of 0.1 degree/sec. Due to the soft nature of the organic soil, the insertion of the Geonor vane was easily accomplished by hand.
Consistent with the vane shear profiles developed before renovations, the postconstruction profiles obtained with the Geonor vane shear apparatus (Figure 3) indicate that a sublayer with higher shear strength exists near the surface. Typically, the presence of such a sublayer is the result of overconsolidation due to water table fluctuations and other environmental and physiochemical changes. At the Candia site, the high strength values may also reflect the presence of large fibers. Landva (11) suggests that vane shear testing of fibrous soils yields estimates of shear strength that are too high due to the compression of fibers into ropelike bundles. Scatter of the vane shear data may also be due to localized fiber-induced anisotropy.
However, unlike the preconstruction vane shear strengths, the postconstruction values decrease with increasing depth and water content within the fine-fibrous sublayer. Others have found the same relation between vane shear strength, water content, and depth in fine-fibrous organic soils (3, 12). Vane shear strength reaches a minimum at a depth of about 17 ft (5.2 m), where water content is greatest and the soil is amorphous-granular. Because of the consolidating effect of lateral spreading, water content decreases and shear strength increases at locations nearer to the embankment.
Flat Plate Dilatometer Testing
For the four dilatometer profiles conducted at the site, dilatometer indices were used to evaluate the capability of
17
dilatomcter testing to detect changes in organic soil types. Dilatometer tests were performed at 0.75-ft (0.23-m) intervals. At three locations away from the embankment, the dilatometer blade was advanced to the base of the organic strata by hand, using two operators.
The di lalometer indice we re computed assuming a hydrostatic water pressure di tribution . ince marsh ga es may have been present the actual pore water pre ·sure and effective overburden pressure probably differed from the. assumed values. Consequently, the computed values of the material index (Id) and the horizontal stress index (Kd) should not be quantitatively interpreted by conventional methods. On the other hand, the dilatometer modulus (Ed) is computed independent of pore water and overburden pressures, and thus the measured values of Ed should be representative of the in situ soil characteristics.
Values of the DMT indices at Station 101+50 and 160 ft (49 m) from the centerline are shown in Figure 7. These profiles show several of the same trends found at other DMT testing locations. For instance, at all locations away from the embankment, Ed and Id tend to decrease with increasing depth within the upper coarse-fibrous sublayer and remain fairly constant with depth in the amorphous-granular sublayer. The near-surface reductions of Ed and Id correspond to a reduction of fibrosity and soil stiffness. Moreover, Kd noticeably decreases with depth within the upper half of the amorphous-granular sublayer and increases with depth in the lower half. This trend parallels that of the water content profi les and mirrors that of the vane hear strength profiles. Because of significant scatter, the change of Kd with depth in the coarse-fibrous sublayer are unclear. There does not appear to be any clear trend for all the DMT indices in the fine-fibrous sublayer. The DMT index value averages and ranges for each of the sublayers are listed in Table 1.
Although the Id and Kd values found from testing beneath the road are similar to those found at other locations in the amorphous-granular soil, the Ed values from the road sounding are much higher than elsewhere (Figure 8) . The consistency of Id reflects the fairly homogeneous composition of the Candia organic soil, whereas the variation of Ed manifests the greater consolidation and resulting increases in stiffness of the embankment foundation.
Accord ing to the chart developed by Marchetti (13) for the determination of soil type and unit weight based on Ed and Id, the high values of Ed inaccurately place the tiff organic foundation soil in the silty clay category. Moreover, the Ed values for the virgin amorphous-granular and fine-fibrous soil are less than the Ed values earmarked in the chart for muck and peat. In all cases , the chart overestimates the unit weight of the Candia highly organic soil by a factor of about 1.5.
Dilatometer determinations of constrained modulus and undrained shear strength are based on Kd and Ed. Because much uncertainty is associated with the calculated value of Kd due to the unknown hydrau lic onditi n in the organic soil. and uncertain drainage conditi n · during DMT te ·ting the reliability of the dilaromerer undrained ·hear trength und constrained modulus values are questionable. The constrained modulus (M) was calculated at every DMT test depth. Because M is proportional to Ed, it varies with depth and distance from the embankment according to the same trends as Ed. Away from the embankment and under the road surface, the

18
5
10
= 15
:c ..... ~ 20 Cl
25
30
>
0 6 12 0
TRANSPORTATION RESEARCH RECORD 1235
) I Ill 3l ::I .. 0 8..0 (.)~
Ill I ::I
!e Ill ~:e c.> LL ·c: c e' ... 0 ..2
6
::I c: c ... l!)
I Ill ::I 0
.s:::. e-0
~
.5
Id Ed (ksf)
3
Kd
FIGURE 7 Profiles of Id, Ed, and Kd at STA 101 +SO, 160 feet left.
TABLE 1 DILATOMETER INDICES
Road Foundation: Fine-Fibrous
Wetlands
Amorphous Coarse-Fibrous
Index Range Avg. Range
Id 0.4-0.7 0.50 0.3-5.2 Ed (ksf) 37-117 68.0 4-113 Kd 0.7-2.0 1.4 1.4-17.3
constrained modulus of the highly organic soil ranged from 2.5 to 64.3 ksf (120 to 3080 kN/m2) and 31. 7 to 100.3 ksf (1520 to 4800 kN/m2
), respectively. In general, dilatometer testing measured an increase of
shear strength with depth in the coarse-fibrous sublayer and a decrease with depth from the top to the middle of the amorphous-granular sublayer. As shown in Figure 9, dilatometer shear strength values in the uppermost fibrous soil far from the embankment were generally half of those near the toe. Under the embankment, the shear strength values were much higher, thus reflecting the expected increase in strength due to consolidation of the embankment foundation.
Pressuremeter Testing
The pressuremeter used at the Candia site is of the British self-boring type designed by the University of New Hampshire
Fine-Fibrous Amorphous-Granular
Avg. Range Avg. Range Avg.
1.09 0.1-0.7 0.43 0.1-1.4 0.46 17.l 2-15 8.6 2-15 7.2 5.6 1.2-11.9 4.9 0.2-7.5 3.4
to have three levels of strain measurement arms along the length of the probe, which independently track the thin flexible rubber membrane expansion. After insertion of the probe into the ground with minimum disturbance, the pressure used to expand the membrane and its deflection are recorded continuously. For each strain arm, values of the in situ horizontal stress, shear modulus, and shear strength can be determined from the test results. On each side of the probe are located two pore pressure cells, which can also measure pore water pressures during probe expansion. Self-boring was accomplished using drilling guidelines appropriate for soft clays to achieve minimum disturbance during probe insertion (14). Full-displacement pressuremeter tests were also conducted using the self-boring probe fitted with a 60-degree cone tip . It was pushed into the ground at a rate of advance ranging from 24 to 30 in./min (61 to 76 cm/min).
Even for the pressuremeter tests in which the rate of advance of the probe was most rapid, negligible excess pore pressures

Nichols el al.
0
5
10
........ 15 --
:::r: .... a..
20 LLJ Cl
25
30
35 0
10 I
10
Under embankment
~ 2
10 3
10
19
Ed (ksf)
FIGURE 8 Profiles of Ed under the New Boston Road embankment and in the adjacent marsh.
were measured after penetration. Moreover, during all tests the difference between pore pressure cell readings at different depths was less than the estimated difference in the hydrostatic pressure at those elevations. Pore pressure response and pore pressure measurement may have been affected by the presence of gases in the organic soil, by seepage forces, or by incomplete saturation of the pore pressure cells.
Typical total-pressure-versus-strain curves for the expansion of a single strain arm during SBPM and FDPM testing at the Candia site are depicted in Figure 10. As shown, the shapes of the expansion curve are significantly different. However, elastic properties obtained from the unload-reload cycles are similar and in agreement with findings by others (15).
Total horizontal stress in the ground was measured from the total pressure at which expansion begins to occur for each of the strain arms. In general, SBPM measurements of total horizontal stress were similar to those from FDPM measurements. This is contrary to findings by other investigators (16) , which have shown FDPM testing to yield greater lateral stress than SBPM testing.
As shown in Figure 11, the total horizontal stress estimates in the wetlands range from slightly less than hydrostatic to slightly greater than total overburden pressure. Since total horizontal stress cannot be less than hydrostatic in a fully saturated medium with a single piezometric surface, one or more unusual factors must be influencing the existing stress state or measurement technique. The same factor(s) may also
be related to the unusually low effective stresses measured by the pore pressure cells.
Also shown in Figure 11 are the values of limit pressure from both SBPM and FDPM testing. The limit pressure was defined as the pressure corresponding to 100-percent volume change. The shaded area bounds the lower and upper values of limit pressure . This area seems to indicate that the lowest resistance is at the transition between the fine-fibrous and amorphous zone. Below that transition, the limit pressures increase with depth in a manner similar to that observed in the total horizontal stress measurements. For both SBPM and FDPM tests conducted in the coarse-fibrous zone, the results show significant scatter, probably due to the high heterogeneity from the presence of roots and twigs.
As shown in Figure 12, the shear modulus values estimated by pressuremeter testing generally decrease with depth to the top of the amorphous zone. This trend is evident from both the SBPM and FDPM test results , although at each depth the average SBPM shear modulus values appear to be slightly less than the average FDPM values . Below the transition, the values seem to increase with depth . The shear modulus values found with different strain arms at the same depth differ by as much as 75 percent.
The shear strength values estimated from the SBPM data using the Gibson and Anderson method (17) ranged from 54 to 86 psf (2.6 to 4.1 kN/m2). This method assumes undrained conditions and elastoplastic behavior. The values obtained

20
5
10
- 15 --:::c !i: 20 w 0
25
54 ft Left of ct_ !:;. !:;.
!:;. !:;. 0 !:;.
!:;.
!:;.!:;.
!:;. !:;.
!:;. !:;.
!:;. 0 !:;. !:;.
!:;. !:;.
!:;. 0 !:;. C;. !:;. go
15
t9 10f1 lefl of It_
!:;. !:;.
&o ",. • !:;. . !:;. .
!:;. 30
TRANSPORTATION RESEARCH RECORV 12:3)
160 ft Left of ct_ !:;.
+ 0
0 0
0
0 ... ... ~ 0 :I c
0 ... (!)
I
~
l • " t
~
Ill :I 0 &. 0. ... 0 E <(
0
0
= 30
0 750
0 = VST
C;. = DMT
+ = SBPM
'CD > c ... (!)
35L-~-L~~_l._~__J~____::::r~1=:~:..--1.~~_J_~~L.=._J
0 200 400 0 300
SHEAR STRENGTH (psf)
FIGURE 9 Shear strength profiles obtained by vane shear, dilatometer, and self-boring pressuremeter testing.
are shown in Figure 9. The undrained shear strength may also be estimated using an empirical method introduced by Menard (18) based on the difference between the limit pressure and the horizontal stress. The difference, divided by a factor that generally varies between 4.5 and 7.5, can be used to evaluate the shear strength. As experience grows for a certain soil type and region, this empirical method increases in accuracy. From Figure 11, it is evident that two nearly constant zones of differences exist within the fibrous and the amorphous layers.
SUMMARY OF COMPRESSIBILITY AND SHEAR STRENGTH CHARACTERISTICS
The DMT estimates of the constrained modulus were foun<!l to depend greatly on location, increasing from an average of 6.6 ksf (320 kN/m2) in the virgin soil to 58 ksf (2780 kN/m2
)
at the embankment. Although this trend is consistent with expectations due to the consolidating effect of the embankment, the values of the constrained modulus obtained in and near the embankment appear to be too high considering the large magnitude of observed settlement. The amount of settlement predicted to occur in response to embankment renovation, according to Schmertmann's procedure (19) and the DMT estimates of M obtained near the toe, is 0.28 ft (0.09 m), which is only 4 percent of the 6.5 ft (2 m) measured at
the settlement platform. The average constrained modulus measured by plate load testing in the coarse-fibrous soil was 6.1 ksf (290 kN/m2
). This value is similar to the 6.6 ksf (320 kN/m2) estimated by the DMT in the virgin fine-fibrous and amorphous-granular organic soil.
In general, secondary compression of an organic foundation is as significant as initial (elastic and primary) compression (6, 9, 20). The observed behavior of the New Boston Road embankment and the plate load and pressuremeter test estimates of soil compressibility indicate that the Candia organic foundation responded to loading in the usual fashion. Recall that the settlement of the embankment was most rapid immediately after the placement of fill, although long-term settlement of appreciable magnitude continues to occur. Estimates of initial and secondary settlement from the field and laboratory test results range from 1.1 to 2 ft (0.3 to 0.6 m) and from 1.5 to 2 ft (0.5 to 0.6 m), respectively.
According to the results of the VST, DMT, and SBPM testing, the shear strength increases with depth within the fibrous soil, decreases with depth from the top to the middle of the amorphous-granular sublayer, and thereafter increases with depth. However, as shown in Figure 9, the vane shear strength values are greater than either DMT or SBPM shear strength values by a factor of about 2.
The reliability of the dilatometer and pressuremeter compressibility and shear strength estimates is uncertain. DMT and SBPM testing methods are based on the assumption of

Nichols et al. 21
1600 .------r---.---~----.,.---. undrained conditions; yet drained conditions may prevail due to the unusually high permeability of the organic soil. The DMT and SBPM testing methods also fail to account for the unusually large magnitude of strain that accompanies compression and fajJ ure of the organic soil as indicated by laboratory consolidation and strength testing. In addition, considerable uncertainty is associated with Kd and Id, and thus with DMT correlations. Consequently, estimates of shear strength and constrained modulus are uncertaih because of the difficulty of pore water pressure estimation in the presence of marsh gas .
...... I/)
0.
w 0:: :::>
1200
~ 800 w 0:: a.. _J
~ f:?
400
0 0
--- FDPM -SBPM
DEPTH : 14.6 ft MARCH,1988 SOIL TYPE: PEATY ORGANIC SILT
6 12 STRAIN(%)
CONCLUSION
FIGURE 10 Typical total-pressure-versus-strain curves for self-boring and full-displacement pressuremeter testing in the Candia virgin peaty organic silt.
In accord with field and laboratory test estimates of the shear moduli, constrained moduli, and coefficients of secondary compression, the maximum prediction of combined initial and secondary settlement of the New Boston Road embankment 3 years after renovation is 4 ft (1.2 m). This is similar to the 3 ft (0.9 m) predicted with the NYDOT empirical method based on water content. Yet it is about 2.5 ft (0.8 m) less than the cumulative settlement monitored by the settlement platform at th.is time. The discrepancy could be xplai·ned by lateral spreading as manifested by decreasing water content, increasing shear strength, and increasing stiffness at distances closer to the embankment. Vertical settlement occurs as a result of compression in both the horizontal and vertical directions. The predictions made from the laboratory and in situ soil test results assume compression in one direction only.
---:::c: ....... a.. w 0
5
10
15
20
25
30
Hydrostatic
Limit Pressure
• 0
Total Horizonlal Slress
FDPM SBPM
35 _____ ...._ ___ __._ ___ __. _ _ _.__,_...__ ___ ~
0 1200
STRESS ( psf) 2400
FIG URE 11 Total horizontal stress and limit pressure profile measured by selfhoring and full-displacement pressuremeter testing in the Candia \•irgin peaty organic silt.

22 TRANSPORTATION RESEARCH RECORD 1235
0
5
10 --:::c 15 I-a. w 0
20 ~ SBPM
D FDPM
25
30 0 200 400 600
SHEAR MODULUS (psf)
FIGURE 12 Shear modulus profiles measured by self-boring and full-displacement pressuremeter testing in the Candia virgin peaty organic silt.
Localized embankment slope failure may also account for some of the discrepancy. However, it is impossible to separate the horizontal displacements due to slow lateral shear from those due to rapid horizontal compression by analyzing the measurements of a single slope inclinometer. Moreover, the longitudinal cracks that developed over several months after construction and which revealed minimal horizontal displacement were not typical of circular shear failure.
Dilatometer testing was found to yield useful information in an efficient and economical manner. DMT profiling was fast, simple, and, where the soil was particularly soft, did not require the use of a drill rig. Despite problems of Kd and Id interpretation due to the presence of marsh gas , variations of Ed yielded valuable information regarding changes of organic soil type from fibrous to amorphous-granular and changes of soil stiffness with distance from the embankment. With further DMT experience in organic soils, Marchetti 's chart for the determination of soil type and unit weight could probably be modified to include different types of organic soils. Moreover, the accuracy of DMT test results could be improved by modifying the blade for greater expansion and by installing a more sensitive membrane.
As indicated by the shape of the SBPM expansion curves, advancement of the pressuremeter into the Candia organic soil with the self-boring technique probably induced some soil disturbance. However, comparison of the SBPM curves with the FDPM expansion curves suggests that the self-boring technique still induced less disturbance than the full-displacement technique. Thus there is hope that further adaptation of the SBPM apparatus and technique to the fibrous and gaseous nature of organic soils will minimize this effect. Moreover, pore pressure cell performance in partially saturated, gaseous organic soils s4ould be improved. It is possible that methods of analysis based on limit pressure are better suited for use in highly compressible soils. As with the DMT. the pressure-
meter needs to be expanded to larger strains to truly model the observed behavior of organic soils.
ACKNOWLEDGMENTS
The writers would like to express their appreciation of Michael J. Atwood, Craig R. Findlay, Adam N. Jones, and Louis A. Nejame for lheir help during postconstruction in situ and laboratory soil testing.
REFERENCES
1. New York Department of Transportation, Soil Mechanics Bureau. Design Manual. New York Department of Transportation, New York, March 1978.
2. A. 0. Landva and P. La Rochelle. Compressibility and Shear Characteristics of Radforth Peats. In Testing of Peats and Organic Soils (P. M. Jarrett, ed.), ASTM STP 820, ASTM, Philadelphia, Pa., 1983, pp. 141-156.
3. I. C. Macfarlane. Engineering Characteristics of Peat. In Muskeg Engineering Handbook (I. C. Macfarlane, ed.), University of Toronto Press, Toronto, Canada, 1969, chapter 4.
4. J. J. Andrejko, F. Fiene , and A. D. Cohen. Comparison of Ashing Techniques for Determination of the Inorganic Content of Peats. In Testing of Peats and Organic Soils (P. M. Jarrett, ed.), ASTM STP 820, ASTM, Philadelphia, Pa., 1983, pp. 5-20.
5. A. 0. Landva and P. E. Pheeney. Peat Fabric and Structure. Canadian Geotechnical Journal, Vol. 17, 1980, pp . 416-415
6. L. Casagrande. Construction of Embankments across Peaty Soils. Journal of the Boston Society of Civil Engineers , Vol. 53 , No. 3, pp. 272- 317.
7. K. Kare. niemi. Dependence of Humification Degree on Certain Properties of Peat. Proc., 4th International Peat Congress, Vol. 2, 1972, pp . 273-282.
8. S. F. Hillis and C. 0. Brawner. The Compressibility of Peat and Reference to Major Highway Construction in British Columbia.

Nichols et al.
Proc., 7th Muskeg Research Conference, Ottawa, Canada, Technical Memorandum 71. NRC Associate Committee on Soil and Snow Mechanics, National Research Council, Ottawa, Canada, 1961, pp. 204-227.
9. W. G. Weber. Performance of Embankments Constructed over Peat. Journal of the Soil Mechanics and Foundations Division, ASCE, Vol. 95, No. SMl , 1969, pp. 53-77.
10. N. D. Lea and C. 0. Brawner. Highway Design and Construction ver Pent Deposit · in Lower British Columbia . In Highway
RI!. e(lrclr l?ecord 7. HRB, Nmional Research ouncil, Washington, D .. , 1963 pp. 1- 33.
11. A. 0 . Landva. Vane Testing in Peat. Canadian Geotechnical Journal, Vol. 17, No. 1, 1980.
12. T. J. Kaderabek, D. Barreiro, and M.A. Call. In Situ Tests on a Fl rida Peat. In U. e of hi iltl Te11ts and Geo1ec/111ical £11gi-11eeri11g ( . P. leme nce, ed .), A CE Gcotechnical pecial Publication 6. A CE, New York, 1986, pp . 649- 666.
13. S. Mnrcheui. In-Situ Tests by Flat Dilatometer. l ounm( of Geo-1ech11ical E11gi11eerillg, Vol. 106, o. GT3, 19 0, pp. 299- 321.
14. J . Benoit and G. W. lough. elf-Boring Pre urcmelcr Te i. in Soft lay. Jo11mal of Geoteclmicnl E11gi11eeri11g , Vol. l l2 , No. J, 19 6, pp. 60- 78.
15. N. J. Withers, L. H.J. Schaap, and C. P. Dalton. The Devel-
23
opment of the Full Displacement Pressuremeter. In The Pres· suremeter and Its Marine Applications (J. L. Briaud and M. E. Audibert, eds.), ASTM STP 950. ASTM, Philadelphia, Pa., 1986, pp. 38- 56.
16. A. Mar land and D. Windle. Development in Offshore ite Investigatio n. Oceanology /111ematio11al, Briglrto11, Vol. I, 1982.
17. R. E. Gibson and W. F. Ander on . ln-Situ Measurement of Soil Properties with Pressuremeter. Civil Engineering and Public Works Review Vol. 56, 1961, pp. 615- 618.
18. L. Menard . Mesurcment in- itu des proprietes phy iques des sols. A111111/es des Pants et /1a11s tes, Paris . Vol. 127. No. 3, 1957, pp. 357-377
19. J . H. Schmcrtmann. Dilatometcr ro ompute oundation e ttlcment. In Use of In i111 Test in Geotec/111ical E11gi11eeri11g (S. P. lcmcnce, ed.) , AS E Gcotcchnical • pccial Publication No. 6, (A CE, New York, 1986, pp. 303- 321.
20. L. Samson and P. LaRochelle. Design and Performance of an Expre sway onstructed over Peat by Preloading. Canadian Geoted111iclll Jo11mal , Vol. 9, 1972, pp. 447-466.
Publication of this paper sponsored by Committee on Soil and Rock Properties.