design parameters of cohesionless soils from in situ...
TRANSCRIPT
TRANSPORTATION RESEARCH RECORD 1235 45
Design Parameters of Cohesionless Soils from In Situ Tests
R. BELLOTTI, v. N. GHIONNA, M. JAMIOLKOWSKI, AND p. K. ROBERTSON
A critical review of interpretation methods for estimating the design parameters of cohesionless soils from in situ test methods is presented. The latest correlations and results from more than 10 years of research using large calibration chambers are presented and discussed. Correlations are also evaluated and discussed using field data from several well-documented sites. Emphasis is placed on the estimation of in situ state parameters (DR), soil stiffness (G, £ 1
),
and soil strength (cj>') using in situ test methods such as the cone penetration test (CPT), the standard penetration test (SPT), and the flat dilatometer test (DMT). Guidelines are provided regarding the limitations of existing interpretation methods.
One of the major advantages of in situ testing is that it can be used to test soil deposits in which undisturbed sampling is very difficult and often unreliable. Hence the use of in situ testing, especially penetration testing, in cohesion less soils has always played an important role in geotechnical engineering.
In this paper the authors attempt to summarize the experi ence that they have gained from more than 10 years of research using in situ test techniques in cohesionless soils . This research has included controlled laboratory studies using large calibration chambers (CCs), as well as field experience in many natural deposits.
Because of space limitations, discussion will be limited to the evaluation of relative density , deformation moduli, and friction angle from various penetration tests (i .e. , SPT, CPT, and DMT).
The methods for interpreting in situ tests used to obtain geotechnical parameters can be divided into three main categories (1) :
• The soil elements follow very similar effective stress paths. Therefore, with appropriate assumptions on drainage conditions and stress-strain relationships, the solution of a more or less complex boundary value problem can lead to the determination of stress-strain and strength characteristics. This category of interpretation method is used for tests including pressuremeter tests, especially the self-boring pressuremeter test (SBPT), and seismic tests.
• The soil elements follow different effective stress paths depending on the geometry of the problem and the magnitude of the applied load. In this case, a rational interpretation of the test is very difficult. Even with appropriate assumptions concerning the drainage conditions and soil model, the solu-
R. Bellotti, ENEL-CRIS, Via Ornato, 90/14, Milano , Italy. V. N. Ghionna and M. Jamiolkowski, Technical University of Turin , Department of Structural Engineering, Corso Duca degli Abruzzi , 24 I-10129 Turin , Italy. P. K. Robertson , Civil Engineering Department, University of Alberta, Edmonton, Alberta, Canada, T6G 2G7.
tion of a complex boundary value problem leads to something like "average" soil characteristics. Comparisons between these average values and the behavior of a typical soil element tested in the laboratory, or the use of these values in the specific design calculation, are far from straightforward. Typical examples of tests subject to this category of interpretation method are the plate load test (PL T) and the cone penetration test (CPT) when interpreted for evaluating soil strength.
• The soil elements follow different effective stress paths, and the in situ test results are empirically correlated to selected soil properties. Typical examples are the widely used correlations between penetration resistance measured in the standard penetration test (SPT) and CPT and deformation moduli (E). Because these correlations are purely empirical in nature, they are subject to many limitations, which are not always fully recognized by potential users. In addition, it is important to recognize that these empirical correlations are formulated for either fully drained or fully undrained conditions.
Interpretations of all penetration tests fall into the last two groups.
The major sources of uncertainty in the interpretation of many in situ tests are related to the following:
• Complex boundary value problem; • Complex, and often unknown, drainage conditions; • Complex variation in stress and strain levels; and • Complex influence of stress path-dependent soil behav
ior, i.e . , anisotropy, and plasticity.
Because of these uncertainties, interpretation of most penetration tests is based on empirical correlations to selected soil properties. Because of the purely empirical nature of these correlations, it is important to be aware of their many limitations. Often the correlations are only partly able to account for soil nonlinearity and plasticity , as well as other complexities in natural soils, such as mineralogy, in situ stress state, stress-strain history, cementation, sensitivity, aging, anisotropy, and structure (fabric) .
To fully define soil behavior, it is necessary to identify the following main characteristics:
• Initial state, which includes stress-strain history; • Strength; • Deformation; and • Flow and consolidation.
For most soils, this requires a minimum of about 9 or 10 independent parameters. Unfortunately, most existing pen-
46
etration tests only provide 2 or 3 independent measurements for interpretation. Therefore, it is presently impossible to fully identify ;ill the p;irnmeters thilf r:cmtrnl soil heh;ivior. However, there is clearly potential in the newer combined in situ tests that provide additional independent measurements, such as the seismic cone penetration test (2 ,3) and the cone pressuremeter test ( 4 ,5).
DISCUSSION OF EXISTING CORRELATIONS
The term initial state incorporates the following:
• Macro- and microstructure; • Initial total vertical and horizontal geostatic stresses (uvo
and ah0 , respectively); • Initial pore pressure (u0 ), which is not necessarily hydro
static; • Initial void ratio (e0 ) and/or relative density (DR); and • Vertical yield stresses (u~Y = a~) or overconsolidation
ratio (OCR).
Unfortunately, most of the initial state factors are difficult to individually identify and quantify using in s~tu testing, especially penetration tests, because the penetration resistance is generally influenced to different degrees by almost all of the factors.
The dominant influence of initial horizontal stress ( u~0) on penetration resistance has long been well recognized on the basis of the results of large calibration chamber tests (6-11).
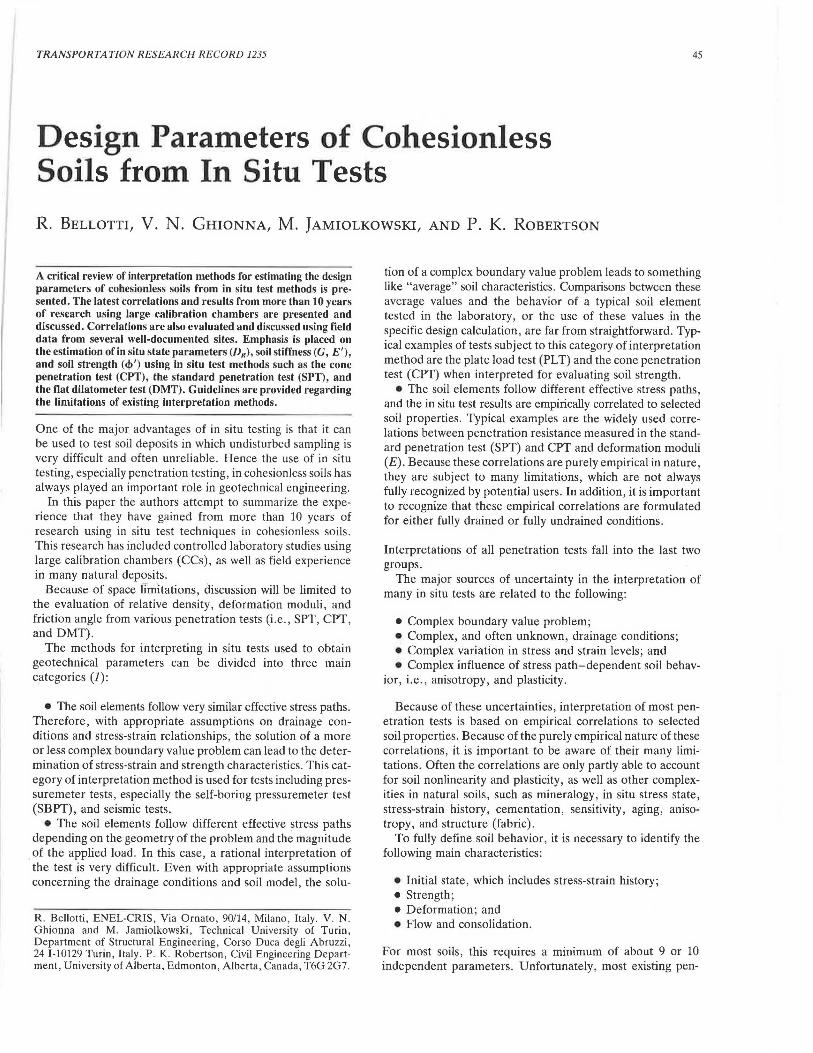
Figure 1 presents a summary of CPT penetration resistance (qe) data for very dense Ticino sand obtained from calibration chamber tests. The CPT qe data has been correlated with the effective horizontal stress acting on the boundary of the CC during penetration (u~ 75). Because the qe data was obtained at a penetration depth of 75 cm in the 1.5-m-deep CC, the horizontal stress has been designated u~75 • Details of the method adopted for measuring u~75 have been described by Belotti et al. (8). Figure 1, which refers to very dense samples, shows that the influence of CC size and boundary effects is essentially removed if correlations are based on the effective horizontal stress acting on the boundary at the time of penetration. The data in Figure 1 also indicate the dominant influence of the in situ horizontal stress on penetration resistance.
The importance of u~0 for the penetration resistance measured by any penetration test (e.g., SPT or CPT) has important implications for the interpretation of parameters such as relative density (DR) and friction angle (<!>').
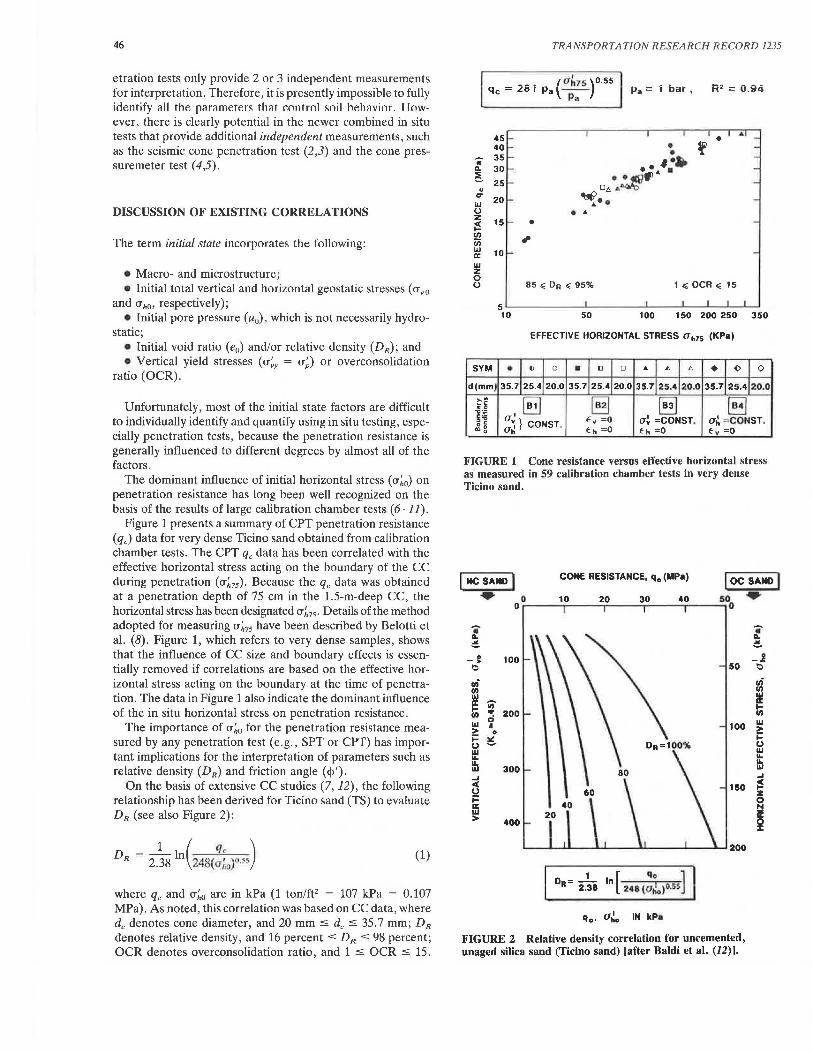
On the basis of extensive CC studies (7, 12), the following relationship has been derived for Ticino sand (TS) to evaluate DR (see also Figure 2):
1 ( q, ) DR = 2.38 In 248( ;,0)9 ~~ (1)
where qe and u~0 are in kPa (1 ton/ft2 = 107 kPa = 0.107 MPa). As noted, this correlation was based on CC data, where de denotes cone diameter, and 20 mm s des 35.7 mm; DR denotes relative density, and 16 percent s DR s 98 percent; OCR denotes overconsolidation ratio, and 1 s OCR s 15.
TRANSPORTATION RESEARCH RECORD 1235
_ _ / al,15 )0.55 qc = ;.::ti i Pa\-- Pa= bar, R2 = 0.94
45 40
.. 35 a.. 30
~ 25 u
~ 20 u z ~ UI iii w a: w z 0 u
15
10
• ,,.
Pa
• • •
.. , .• ... •• f(f}fl
o,. .. "bib
~-. ...
1.;; OCR.:; 15
5 .._ _____ .__ ___ _,__ _ _ ~-~~~~
10 50 100 150 200 250 350
EFFECTIVE HORIZONTAL STRESS ah75 (KPa)
SYM • o o • D o A " ,. + (> 0
d(mm) 35.7 25.4 20.0 35.7 25.4 20.0 35.7 25.4 20.0 35.7 25.4 20.0
H ~ §l El ~ ~~ ~h~} CONST. ty =O a~ =CONST. a~ = CONST. "'8 v, th=O th=O tv'=O
FIGURE 1 Cone resistance versus effective horizontal stress as measured in 59 calibration chamber tests in very dense Ticino sand.
I NC SAND l CONE RESISTANCE, qc (MPa) I OC SAND I ~ 00~ __ 1_0 ___ 2_0 ___ 3_o ___ 4_o __ ~so0 ~ .. a. ~
- ~ 100 e 50
Iii UI
~ ., I-Ill .... 200 w 0
II 100 > 0 ~ ~ CJ w IL. IL. w 300 ...J C( 150 CJ ~ a: w 20 > 400
q 0 , a.!., IN kPa
FIGURE 2 Relative density correlation for uncemented, unaged silica sand (Ticino sand) [after Baldi et al. (12)].
.. a. :!.
-1 e Iii Ill
:!\! I-Ill w > ~ CJ w IL. IL. w ...J
~ ~
i

Bellotti et al.
Bellotti et al. also derived this correlation from CC data, using all the available boundary conditions (8).
Robertson and Campanella (13) have stressed the importance of the effect of sand compressibility on penetration resistance. Figure 3 illustrates the variation in the DR correlations from CC studies around the world due to changes in sand compressibility for predominantly silica sands (14). Highly compressible sands, such as sands with a high carbonate content (greater than 80 percent), may fall outside the range shown in Figure 3.
Figure 2 can be used as a guide for evaluation of in situ relative density (DR) for clean, predominantly silica sand. Figure 3 can be used to evaluate the uncertainties involved in the determination of DR from qc for sands that may be more or less compressible than Ticino sand. The compressibility of sands tends to increase with decreasing uniformity of grading, increasing angularity of grains, increasing fines content, and increasing mica or carbonate content. Ticino sand is a uniform, clean, predominantly silica sand (Dsa = 0.53 mm) with subangular to subrounded grains. For normally consolidated (NC) sands, the vertical effective stress (<T~a) can be applied to Figure 2, assuming Ka = 0.45. If overconsolidated (OC) sands are encountered, the horizontal effective stress (<T~a) should be applied in Figure 2. However, the application to OC sands is difficult because of the inherent difficulties in evaluating an appropriate value of Ka.
Recently, Skempton (15) has demonstrated the importance of aging in the interpretation of the SPT in cohesionless soils. Because the CC correlations were developed on pluvially
10
80
60
40
20
qo ( OJo)o.55 (FOR Ko=0.45) I NC SANDS I
100
LOW COMPRESSIBILITY
o ...._~ ..... ~~~~~ ........ ._._~~~~~~~~~ 10 100 1000
I oc SANDS I
qe & a~o (bua)
(NOTE: 1bu=1 OOkPa=0.93t/tt2)
FIGURE 3 Influence of compressibility on evaluation of relative density from CPT.
47
deposited unaged and uncemented sands, it is likely that the DR-versus-qc correlations (Figure 2) will lead to overestimation of DR when applied. to natural sand deposits. However, the same correlations will underestimate DR if they are applied to more crushable and compressible sands or to sands containing more than 5 to 10 percent fines.
In conclusion, the evaluation of DR from penetration resistance suffers from some uncertainties because all the correlations were established on freshly deposited, uncemented sands, and because the correlations are referenced to <T~a, so that their application is correct only in NC, unaged sand deposits.
DEFORMATION CHARACTERISTICS
There has always been great practical interest in estimating deformation characteristics (moduli) from penetration resistance in cohesionless soils (16-18), because undisturbed sampling is almost impossible or is not cost-effective. However, as mentioned earlier, the interpretation of penetration tests suffers from many limitations that make the assessment of deformation characteristics very difficult. The matter is further complicated by the tenuous links to the relevant drainage conditions, stress paths, and stress or strain level of the specific design project.
The deformation characteristics of a given soil depend on
• The stress and strain history of the deposit, intended in the broadest sense of the term (10);
• The current level of mean effective stress; • The induced level of shear strain; • The effective stress path followed, reflecting both soil
anisotropy and plasticity; and • A time factor whereby factors such as viscous hardening
(aging) and creep (in shear) influence the stress-strain response.
Therefore, the correct, safe use of correlations between penetration resistance and soil moduli is influenced, at least qualitatively, by the engineer's skill in taking all of the above factors into account.
In the last decade, significant improvements in our theoretical understanding of the stress-strain behavior of sands, combined with a large number of experimental observations, have resulted in a more rational understanding of the reliability and limitations of such empirical correlations.
These findings can be summarized as follows:
1. The influence of overconsolidation on a cohesionless soil can be considered twofold: strain hardening due to accumulated plastic strains, and an increase in Ka (i.e., K~c > Jq;lc). The latter is conventionally linked with mechanical overconsolidation and possibly aging, whereas plastic hardening generally appears as a consequence of all types of preconsolidation mechanisms, i.e., aging, cementation, desiccation, low-strain cyclic stress history, and so forth.
2. Small- and large-scale laboratory (CC) tests have shown that penetration resistance is strongly influenced by the current level of <T;,a and is almost totally insensitive to the effects of plastic strain hardening (19). This indicates that the large strains caused by penetration mostly destroy the effects of

48
plastic hardening, which is often the predominant factor caused by overconsolidation.
3. Results of CC tests show that all kimls uf penelration resistances are more sensitive to u~0 than to u~0 •
Figures 4 and 5 show correlations between the CC results of CPTs and flat dilatometer tests (DMTs), and the deformation characteristics (E;) of the predominantly silica Ticino sand (TS) (9,12).
The following comments should be of help in the examination of these figures:
• Cone resistance is denoted by qc, and E 0 is the dilatometer modulus measured at mid-height in pluvially deposited CC specimens.
• E; corresponds to the secant drained Young's modulus inferred from CK0D triaxial compression tests performed on pluvially deposited TS in a Bishop-Wesley triaxial cell. The E; values refer to a given effective mean consolidation stress ((J"~,0 ) and to a level of axial strain ("Ea) of 0.1 percent in OC sand and 0.1 and 0.25 percent in NC sand. On the basis of a numerical study of shallow foundations in TS performed using finite element methods, Battaglia and Jamiolkowski (20) concluded that these values of ea correspond to the upper limit and operational range of the average strain levels of practical interest for OC and NC sand.
A review of Figures 4 and 5 reveals some common features, which can be summarized as follows:
• Even for the same sand, the ratio of the reference modulus (E;), to the penetration test result (q0 E0 ) is substantially
25
I TICINO SAND I
21
17
13
9
5 l';. ~0.1% OCR=l < ·~-
~-,:0.253~ 1
0 20 40 60 80 100
RELATIVE DENSITY, DR (%)
FIGURE 4 Drained Young's modulus of Ticino sand versus cone resistance.
TRANSPORTATION RESEARCH RECORD 1235
FOR NC TICINO SAND E'
(37 TESTS): -• =1.05 ± 0.25 Eo
FOR OC TICINO SAND
E~ (22 TESTS): - =3.66 ± 0.80
Eo
E~ 6
SAND
TICINO
HOKKSUND
Eo o~ a 5
4
OCR SYM
1 • 1.5 to8.5 0
1 • 3.0to8.3 D
0 0
o
0
~ 3
0 0
Coo~ 2
1.0
D 0 0
0 0
0
D .. . , . . '• .. "- -•--.• • I • •
10
Ko
FIGURE 5 Drained Young's modulus versus dilatometer modulus from CC tests. E; = drained Young's modulus from TX-CKoD tests at i::. = 0.1 %.
higher for mechanically OC specimens than for NC specimens. This trend, which is observed in all silica sands and for all kinds of penetration tests validated in CCs around the world, reflects very high sensitivily of the reference moduli and low sensitivity of the penetration test results to the strain and stress history of the sand.
• The ratio under discussion decreases as the relative density (DR) of sand increases. This reflects the different effects of a change in Dn on the reference modulus and the penetration resistance.
In view of the above statements it appears obvious that, for a given sand, no unique correlation exists between penetration resistance and the nonlinear deformation moduli. The nonlinear moduli are defined here as the moduli at a strain level greater than the elastic threshold strain -y; (21). Below -y; = 10-s, the she<lr modulus is practically constant and equal to the maximum shear modulus (G0 ).
The above statements result from CC studies performed on freshly deposited silica sands. Further research is necessary to evaluate to what extent these findings are applicable to natural sands and to sands that are not silica. The writers believe, however, that at least qualitatively similar overall trends should be expected in natural aged sands.
For natural aged sand deposits (age :e:: 1,000 years), the writers believe that the correlations between penetration resistance and moduli , for example E; and qc , may lie somewhere between the NC and OC sand correlations developed for unaged sands in the CC studies, as shown in Figure 6.
The correct application of empirical correlations between

Bellotti et al.
24 E' . l.=0.1%
qc 20 oc
SANDS qc} a~0 IN kPa E' •
16
12 AGED NC
SANDS
8
RECENT 4 NC
SANDS
0 200 500 1000 2000 3000
FIGURE 6 Evaluation of drained Young's modulus from CPT for silica sands.
penetration resistance and moduli must take into account the strong influence of stress and strain history. Most existing methods that estimate the settlement of shallow foundations on sands from SPT, CPT, and DMT results make a clear distinction between NC and OC sands. However, in practice, the OCR of sands is usually unknown, which is a major limitation of these correlations. Further developments are required to quantify the improvement due to stress history and to evaluate this stress history on the basis of results of penetration tests or other in situ tests.
The foregoing statements and comments lead to a rather negative attitude as far as the reliability of existing correlations between penetration resistance and nonlinear deformation moduli is concerned. However, correlations with the maximum shear modulus ( G0) measured at shear strain levels less than 10-s are a notable exception (13, 22-27).
A large amount of experimental data show that G0 in cohesionless soils is influenced very little by the stress and strain history. For a given sand, G0 is primarily a function of three variables (28):
(2)
where
u~ = effective stress acting in the direction of seismic wave propagation, and
u~ = effective stress acting in the direction of soil particle displacement.
These same basic variables (DR and u') influence penetration resistance. This suggests that correlations between G0
and penetration resistance (e.g., qc or NsPT) might be more reliable than those relating penetration resistance to larger strain moduli. To support this point, an example of the Ohta
49
and Goto correlation (23) between NsPn corrected to an energy ratio of 60 percent, and shear wave velocity (Vs), is shown in Figure 7, where it is compared with measured Vs from crosshole (CH) tests. Figure 7 shows that the Ohta and Goto (23) correlation provides a good estimate of Vs for clean Holocene sands. However, with increasing age and gravel content, the correlation underestimates the shear wave velocity.
Examples of CPT and DMT correlations for the evaluation of G0 are shown in Figures 8 and 9. These corr.elations are based on extensive CC studies. Figures 8 and 9 also include data from crosshole and seismic cone penetration tests performed at the Po River sand site, near Viadana, Italy. Although the CC data was obtained on recently deposited, unaged sand, the results in Figures 8 and 9 for Viadana Po River sand, which has an age of up to about 20,000 years at 30 m depth, show remarkably good agreement.
The application of correlations such as those shown in Figures 7 through 9 depends heavily on the development of a link between the evaluated moduli and the geotechnical design problem. The type of link will depend on the "average" strain level expected in the design problem. Geotechnical engineers have traditionally considered small strain moduli ( G0) to be applicable only to dynamic problems, such as machine foundations or low-magnitude earthquakes. However, recent studies (20,29) have shown that with an appropriate correction for strain level, the G0 moduli can also be useful for most well-designed static foundation problems in sand. These studies have shown that for most well-designed foundations in sand, the "average" strain in the soil is generally less than 0.1 percent.
SHEAR STRENGTH
Interpretation of in situ test results to assess shear strength has always been done with reference to either fully undrained or fully drained conditions (saturated cohesive deposits or cohesionless deposits, respective! y). In coarse-grained soils where penetration takes place under drained conditions, the test results are used to evaluate the drained shear strength expressed as the friction angle (<l>'). In fine-grained saturated soils where penetration takes place under essentially undrained conditions, the test results are used to evaluate shear strength in terms of total stresses expressed as the undrained shear strength (su). The results of penetration testing involving intermediate (partially drained) conditions cannot be rationally interpreted at present.
The most important aspect of the shear strength behavior of granular soils is their nonlinear failure envelope (30,31). Because of the nonlinearity of the strength envelope, the angle <J>' of a given sand is not uniquely defined but depends on the magnitude of the effective normal stress on the failure plane at failure (ujt)· Therefore, any value of <l>' inferred from in situ test results corresponds to a secant angle of friction whose magnitude is related to some value of u!t·
For many in situ tests, u[t is usually taken as the average value acting on the failure plane around the in situ device. Unfortunately, the evaluation of uj1 around most in situ test devices is difficult, especially for penetration tests.
Existing methods for estimating <J>' from penetration test results are based on the following:

50 TRANSPORTATION RESEARCH RECORD 1235
600
• • 500 ·~,~ o~ . ()
()
u 400 ~~ ., ... .. e ~ A
£ ll 6 ~"'
.~ ~ 300
>.
200 •• ·' 100
0 0 100 200 300 400 500 600
V, (SPT), m/sec
FINES GRAVEL DllO N. v. (SPT) ISCI (Erl LOCATION AGE CONTENT CONTENT IOF TEST v:1Ctil"1 SYMBOL
" " mm " VIADANA HOLOCENE o TOH 0
PO RIVER SAND 0.1 TQ 0;4 29 1.0b0.11 7.2 •
SALUGGIA 0 TO 10 0.5 • DORA RIVER HOLOCENE I TO 2% 10 TO 50 0.3 TO 0.1 21.5
,__ 10 0.74%0.0t ll
SAND AND GRAVEL >SO 7 TO 11 -D
GIOIA TAURO HOLOCENE OTO 10 0.1 TO 0.1 .... 10 TO 50 0.3 TO 1.0
,..._ SAND AND GRAVEL 7 1TO20 33 O.Hio0.12 14.0 .... ,..._
PLEISTOCENE >50 3 TO I "' TRINO VERCELLESE I TO 25 0 TO 10 0.2 TO 0.5 t± PO RIVER PLEISTOCENE 10 TO 12 10 TO 10 0.2 TO 0.1 11 0.6b0.09 36.5 SAND AND GRAVEL I TO 10 >50 4.Z TO 10.1 0
FIGURE 7 Shear wave velocity from Nsl'r [using formula by Ohta and Goto (23)] .
• Empirical correlations, where the nonlinearity of the strength envelope may or may not be included.
• Bearing capacity theories based on rigid plastic soil models. These theories are unable to account for the influence of soil compressibility or crushability .
• Cavity expansion theories, which can account for nonlinearity of strength envelope and soil compressibility. However, they require a knowledge of additional soil parameters such as K0 , G, and volumetric strain (e .. ); their use in practice is therefore difficult.
The cavity expansion theories (32,33), have been shown to model the measured response of cone penetration extremely well (12,34). However, the cavity expansion analysis is somewhat complex and requires considerable input data regarding soil compressibility and shear strength.
Bearing capacity theories, such as those presented by Durgunoglu and Mitchell (35), will give conservatively low estimates of<!>' for compressible sands (i.e ., carbonate sands).
A recent approach that deserves further comment is the empirical method developed by Bolton (36). The shear strength of cohesionless soils is related to the rate of dilation at failure, which in turn depends on the relative density, the level of mean effective stress, and the soil compressibility. These factors are reflected in Rowe's stress-dilatancy theory (37), which
recently was given a simple but conceptually sound formulation by Bolton (36,38). Bolton (36) showed that the peak secant friction angle ( <1>; ) from triaxial tests of many sands can be estimated from the empirical expression
(3)
where <1>; .. is the friction angle at constant volume, and IR is a relative dilatancy index given by
(4)
DR being the relative density, P! the mean effective stress at failure, and Q a constant depending on the compressibility and mineralogy of the sand. Bolton (36) suggested a general value of Q = 10 for most silica sands.
The generalized variation of <1>; - <?; .. for silica sand proposed by Bolton (36) is shown in Figure 10. Figure 11 presents results of triaxial tests on Hokksund sand to evaluate Bolton's generalized formulation. Although Hokksund sand is a predominantly silica sand, Bolton's formulation underpredicts <1>; by about 2 to 3 degrees.
Bolton's formulation represents a useful tool for evaluating cp; from cone penetration resistance (qc). A method that uses Bolton's furmulaliun Lu derive <1>; was pruposeJ by Jamiol-

Bellotti et al.
" ~
D
•
20
16
12
RANGE FOR PLUVIALLY DEPOSITED TICINO SAND, G0 FROM R.C.
TESTS, qCT FROM CC TESTS
8 -- OCR= 1 ----OCR= 10
4
o~~~~~~~~~~~~~~~~~~~
200 300
SITE
VIA DANA
VIA DANA
$.PROSPERO
GIOIA TAURO
500 1000 2000 3000 ~ var.,
SOIL G0 SOURCE BOREHOLE
MEDIUM SAND CROSS-HOLE 4017
MEDIUM SAND SEISMIC CONE 4017
MEDIUM SAND SEISMIC CONE 16 17
SAND WITH GRAVEL CROSS-HOLE 209 219
DEPTH BELOW G.L. CONSIDERED: 5.5 TO 43.5 m
FIGURE 8 Correlation of qcr versus G0 in uncemented, predominantly quartz sands. Depth below ground level considered: 5.5-43.5 m.
4 NUMBER}
Go OF DMT 11 1
.. I TESTS
Eo 1SD
3 j
"1 2 1! • DMT's IN CC IN TICINO SAND
Ill DMT's IN PO RIVER SAND
1 0 20 40 60 80 100
DR(%)
FIGURE 9 G0 versus Ed for Ticino sand (G0 from RCTs) and Po River sands (G0 from cross-hole test).
20
16
a • 12 :!!.
'P~v=FRICTION ANGLE AT a~ CONSTANT VOLUME
(%)
'oo
-~ e-I 8 -. $-
4
20 0 10 100 267 1000 10000
MEAN EFFECTIVE STRESS AT FAILURE, pj (kPa)
FIGURE 10 Generalized variation of triaxial peak <!>~ with mean effective stress [after Bolton (36)].
50
48 HOKKSUND SAND
<p!,., =34° o. 0
46 • gi,~
0 0 44
0 •• Q • w 42 a: :::>
0 (/) c re.@ w 40 ~ ~~ -.t. •
38 0 0 • NC } SPECIMENS °' ,
4~0 0 oc
36
36 311 40 42 44 46 41 50
qJ~(PREDICTED)
FIGURE 11 Validation of Bolton's dilatancy theory (38).
51
kowski et al. (1). Figure 12 shows the proposed correlation for silica sand relating CPT qc to peak secant friction angle <!>b defined at a stress level of uj1 = 267 kPa.
The peak secant friction angle in Figure 12 has been defined at a specific stress level (uj1 = 267 kPa) because of the nonlinearity of the failure envelope. This stress level results from the application of the nonlinear strength envelope proposed by Baligh (33) where;
tan <1>; = tan <!>b + tan ex (2~3 - log10 ;~) (5)
where
<1>; = peak secant friction angle at uj1
uj1 = effective normal stress on the failure plane at failure, Pa = reference stress, assumed equal to 98.1 kPa, <!>b = secant angle of friction at uj1 = 267 kPa, and

52
Ko
FIGURE 12 Friction angle <!>h of silica sand using Bolton's stress-dilatancy theory (36) [adapted from Jamiolkowski et al. (1)].
ex = angle that describes the curvature of the failure envelope.
Full details on the derivation of the correlation shown in Figure 12 are given by Jamiolkowski et al. (1).
Baldi et al. (12) have shown that ex increases with increasing DR. As a first approximation, the value of ex can be evaluated for silica sands using the following expression:
tp~(TX) [ 0 I 49 ,--~-.-~--r--.---....----.---..---.-----.
46
44
42
40
38
36
34
q.>~. 32
I NC HOKKSUND SAND I .. ., 55 TESTS
••
...... : .,
.. ·" . . .... I
'P~ (TX) -----1.03±0.03 'P~ (qc )
30...._ _ _._ _ _.__~.__-~~~~~~~~~~ 30 32 34 36 38 40 42 44 46
TRANSPORTATION RESEARCH RECORD 1235
('( - for ex 2': 0 degrees (6)
The <J>; mobilized at stress levels higher than a[J = 267 kPa can be evaluated using Baligh's (33) expression.(Equation 5) and an estimate of ex calculated from Equation 6. The variation of <J>; with stress level can also be estimated using Figure 10 and the following relationship to relate a[J to pj, which is derived from Mohr's circle at failure:
, , (3 - sin <1>:) Pt = aft cosi <!>.; (7)
However, the correct evaluation and application of <J>; also require an evaluation of the appropriate average stress at failure applicable to the relevant design problem (30).
To evaluate the effectiveness of the correlation shown in Figure 12, a comparison was made between measured <1>; in triaxial tests and those obtained from CPT qc . Results of the comparison for Hokksund sand, which is a uniform, medium (D 50 = 0.4 mm) silica sand, is shown in Figure 13.
Figure 13 shows good agreement between measured <J>; and predicted <J>; using Figure 12. However, Bolton's formulation again tends to underpredict <J>; by about 2 degrees for Hokksund sand (see Figure 11). To incorporate variations in sand compressibilities, there is a need to define the empirical constant Q in relation to sand compressibility and mineralogy. Fortunately, the prediction of <J>; from penetration resistance is not sensitive to moderate variations in sand compressibility, especially for predominantly silica sands.
A review of Figure 12 also shows that the prediction of <1>; is not sensitive to K0 • Therefore, if K0 is unknown it is reasonable to assume a value of K 0 = 0.5 for most NC sands and 0.5 -=::: K 0 < 1.0 for most OC sands in order to evaluate <1>:.
<p~(TX) I 0 I 48 ..--~-,-~---,-~~.-~-.-----,--....----.-----,
46 I oc HOKKSUND SAND I
.. 44 TESTS ·"/ 44
42
40 •
38 . ... 36 . / .. <p~ (TX)
-1.05±0.03 34 . q.>~ (qc) <p~.
32
FIGURE 13 Evaluation of <1>; from CPT (qc) for Hokksund sand using Bolton's stress-dilatancy theory (36).
Bellotti et al.
To improve the interpretation of <1>; from penetration test results, further improvements are required to take into account
• Soil compressibility, • In situ stress state (K0); and • Nonlinearity of the strength envelope ( u[1).
However, when <1>; is to be evaluated from penetration tests in predominantly silica sands , reasonable predictions can be obtained using correlations such as that shown in Figure 12.
SUMMARY
A brief review of interpretation methods for estimating design parameters of cohesionless soils on the basis of in situ tests has been presented. This discussion has concentrated on the interpretation of relative density (DR), deformation moduli (E;, G0), and friction angle(<!>') from cone penetration tests (CPT) and the flat dilatometer test (DMT), and G0 from the standard penetration test (SPT).
Experience gained from over 10 years of testing using large calibration chambers has shown that the existing empirical correlations are often unable to fully account for complexities in natural soils resulting from stress-strain nonlinearity, mineralogy, in situ stress state, stress-strain history, and aging. Research has also shown the following main points:
• Penetration resistance (qc, Nsn) is dominated by the in situ horizontal stress (u;,0 );
• Correlations for the evaluation of DR are strongly influenced by soil compressibility;
• No unique correlations exist between penetration test results (q0 E0 ) and nonlinear deformation moduli (E;, M,) because the correlations are strongly influenced by the stress history (OCR) of the deposit;
• Good correlations exist between penetration resistance (q"' NsPT) and the small strain shear modulus (G0), at least for most clean, unaged, silica sands; and
• Correlations between penetration resistance (qc) and peak secant friction angle ( <J>;) are not very sensitive to in situ (K0).
Further improvements are required to account for soil compressibility and in situ stress state in the interpretation of penetration tests in cohesionless soils. Further developments are also required to improve the link between interpreted geotechnical parameters and specific design problems.
ACKNOWLEDGMENTS
The writers would like to acknowledge the support provided by the Hydraulic and Structural Research Center of the Italian National Electricity Board (ENEL-CRIS) of Milan, the Experimental Institute for Models and Structures (ISMES) of Bergamo, the Technical University of Turin , and the University of British Columbia.
REFERENCES
1. M. Jamiolkowski, V. N. Ghionna, R . Lancellotta, and E. Pasqualini. New Correlations of Penetration Tests for Design Prac-
53
tice. Proc., Penetration Testing 1988, JSOPT-1, Orlando, Fla., 1988.
2. R. G. Campanella and P. K. Robertson. A Seismic Cone Penetrometer to Measure Engineering Properties of Soil. Proc., 54th Annual International Meeting and Exposition of the Society of Exploration Geophysicisls, Atlanta, Georgia, 1984.
3. P. K. Robertson, R. G . Campanella, D. Gillespie, and A. Rice. Seismic CPT to Measure In Situ Shear Wave Velocity. Journal ofGeotechnical Engineering, Vol. 112, No. 8, 1986, pp. 791-803.
4. N. J. Withers, L. H.J . Schaap, K. J . Kolk, and J.C. P. Dalton. The Development of the Full Displacement Pressuremeter. In The Pressuremeter and Its Marine Applications (L. J. Briaud and M. E. Audibert , eds.), ASTM STP 950, ASTM, Philadelphia , Pa., 1986.
5. R. G. Campanella and P. K. Robertson. Research and Development of the UBC Cone Pressuremeter. Proc., 3rd Canadian Conference on Marine Geotechnical Engineering, Newfoundland , Canada, 1986.
6. J. Holden. Research on the Performance of Soil Penetrometers. Churchill Fellowship 1970, Country Road Board of Victoria, 1971.
7. J. H. Schmertmann. An Updated Correlation between Relative Density, DR, and Fugro-Type Electric Cone Bearing, qC' Unpublished report. U.S. Army Waterways Experiment Station, Vicksburg, Miss ., 1976.
8. R. Bellotti , G. Bizzi, and V. Ghionna. Design, Construction and Use of a Calibration Chamber. Proc., 2nd European Symposium on Penetralion Testing, ESOPT fl , Amsterdam, The Netherlands, 1982.
9. G. Baldi, R. Bellotti, V. Crippa, C. Fretti, V. N. Ghionna, M. Jamiolkowski, D. Ostricati, E. Pasqualini, and S. Pedroni. Laboratory Validation of In Situ Tests. Proc., 11th Internalional Conference on Soil Mechanics and Foundation Engineering, San Francisco, Calif. AGI Jubilee Volume , 1985.
10. M. Jamiolkowski, C. C. Ladd, J. T. Germaine, and R. Lancellona. New Developments in Field and Laboratory Tc ·ting of Soil .. Theme Lecture. Proc., 11th /111 11rnatio11al Conference on Soil Mechanics and Foundmion Engineering, San Francisco, Calif., 1985.
11. G. Houlsby and R. Hitchmann. Calibration Chamber Tests of a Cone Penetrometer in Sand. Oxford University Report OUEL 1699/87, Soil Mechanics Report No . SM074/87. Oxford University, Oxford, England, 1987.
12. G. Baldi, R. Bellotti, N. Ghionna, M. Jamiolkowski, and R. Lancellotta. Interpretation of CPT's and CPTU's: Part II, Drained Penetration on Sands. Proc., 4th Internalional Geotechnical Sem/11ar 0 11 Field Ins1rw11 e11ta1ion n11d In Situ Measurements, Nanyang Tedrnicnl Institute , ingaporc, 1986.
13 . P. K. Robertson and R. G. Campanella. Interpretation of Cone Penetration Tests. Canadian Geotechnical Journal , Vol. 20, 1983.
14. R. Lancellotta. Analisi di affidabilita in ingegneria geotecnica. Aui Istituto Scienza Costruzioni, No. 625, Politecnico di Torino, 1983.
15. A. W. Skempton. Standard Penetration Test Procedures and the Effects in Sands of Overburden Pressure, Relative Density , Particle Size, Aging, and Overconsolidation. Geo/eclznique, Vol. 36, No. 3, pp. 425-447.
16. K. Terzaghi and R. B. Peck. Soil Mechanics in Engineering Practice. John Wiley & Sons, New York , 1948.
17. E. De Beer. Settlements Records of Bridges Founded on Sand. Proc., 2nd International Conference on Soil Mechanics and Foundaiion Engineering, Rotterdam, The Netherlands, 1948.
18. G. G. Meyerhoff. Discussion of Session 1. Proc., 4th Iniernational Conference 011 Soil Mechanics and Founda1io11 Engineering, London , England, 1957.
19. J. R. Lambrechts and G. A. Leonards. Effects of Stress History on Deformation of Sand. Journal of the Geotechnical Engineering Division, ASCE, Vol. 104, No. GTll, 1978.
20. M. Battaglia and M. Jamiolkowski. Analisi delle deformazioni. XIII Cicio Conferenze di Geotecnica di Torino, Italy, 1987.
21. R. Dobry, D. J. Powell, F. Y. Yokel, a.nd R. S. Ladd . Liquefaction Potential of Saturated Sand-The Liffncss Mc1hod. Proc., 7th World Conference on Earthquake Engineering, Istanbul , Turkey, 1980.
22. Y. Ohta and N. Goto. Estimation of S-Wave Velocity in Terms of Characteristic Indices of Soil (in Japanese). Bitsuri-Tanko, Vol. 29, No . 4, 1976, pp. 34-41.
54
23. Y. Ohta and N. Goto. Empirical Shear Wave Velocity Equations in Terms of Characteristic Soil Indexes. Earthquake Engineering and Structural Dynamics, Vol. 6, 1978.
24. D. W. Sykora and K. H. Stokoe . Correlations of In-Situ Measurements in Sands of Shear Waves Velocity, Soil Characteristics and Site Conditions. Geotechnical Engineering REP GR 83-33. University of Texas at Austin, 1983.
25. R . Bellotti, N. Ghionna, M. Jamiolkowski, R. Lancellotta, and G. Manfredini. Deformation Characteristics of Cohesionless Soils from In Situ Tests. Proc., In Situ '86, ASCE Specialty Conference , Virginia Tech, Blacksburg, Va., 1986.
26. G. J. Rix. Correlation of Elastic Moduli and Cone Penetration Resistance. M.S. thesis. University of Texas at Austin, 1984.
27 . D. Lo Presti. Behaviour of Ticino Sand during Resonant Column Test. Ph.D. thesis. Technological University of Turin, Turin, Italy, 1987.
28. S. H . H. Lee and K. H. Stokoe . Investigation of Low-Amplitude Shear Wave Velocity in Anisotropic Material. Geotechnical Engineering Report GR86-6. Civil Engineering Department, University of Texas at Austin, 1986.
29. R. J. Jardine, D. M. Potts, A. B. Fourie, and J. B. Burland. Studies of the Influence of Non-Linear Stress-Strain Characteristics in Soil Structure Interaction . Geotechnique , Vol. 36, No. 3, 1986.
30. E. E. De Beer. Influence of the Mean Normal Stress on the Shear Strength of Sand. Proc., 6th International Conference on Soil Mechanics and Foundation Engineering, Montreal, Quebec, Canada, 1965.
TRANSPORTATION RESEARCH RECORD 1235
31. A. S. Vesic and G. W. Clough. Behaviou1 of Granular Materials under High Stresses. Journal of the Soil Mechanics and Foundutiuns Divi~iurt, ASCE, Vol. 94, No. SMJ, 1968.
32. A. S. Vesic. Expansion of Cavities in Infinite Soil Mass. Journal of the Soil Mechanics and Foundations Division, ASCE, Vol. 98 , No. SM3 , 1972.
33. M. M. Baligh. Cavity Expansion in Sand with Curved Envelopes. Journal of the Geotechnical Engineering Division, ASCE, Vol. 102, No . GTll, 1976.
34. J. K. Mitchell and J. Keaveany. Determining Sand Strength by Cone Penetrometer, Proc., In-Situ '86 , ASCE Specialty Conference, Virginia Tech, Blacksburg, Virginia, 1986.
35. H. T. Durgunoglu and J. K. Mitchell. Static Penetration Resistance of Soils: Part I, Analysis. Proc., Conference on In Situ Measurement of Soil Properties, Raleigh, N.C ., Vol. 1, ASCE, New York, 1975.
36. M. D . Bolton. The Strength and Dilatancy of Sands. Geo1echnique Vol. 36, No. 1, 1986.
37. P. W. Rowe. The Stress-Dilatancy Relation for Static Equilibrium of an Assembly of Particles in Contact. Proceedings of the Royal Society, 1962.
38. M. D. Bolton . The Strength and Dilatancy of Sands. CUED/DSoils/TR 152. University of Cambridge, Cambridge, England , 1984.
Publication of this paper sponsored by Committee on Soil and Rock Properties.