evaluation of soil parameters from piezocone...
TRANSCRIPT

24 TRANSPORTATION RESEARCH RECORD 1235
Evaluation of Soil Parameters from Piezocone Tests
KAARE SENNESET, ROLF SANDVEN, AND NILMAR }ANBU
The interpretation and evaluation of soil parameters determined by cone penetration tests (CPTs) have been a part of our research program for the last 15 to 20 years. A theoretical framework has been established, and CPT results have been compared and calibrated to laboratory data for a wide variety of soils. The pore pressure measurements that enable us to find effective shear strength parameters, as well as settlement parameters (such as the coefficient of consolidation) have been especially useful. In general, piezocone penetration test data have proved to be very useful and valuable additions to sampling and laboratory investigations. In some soils, we believe that the in situ method provides us with better data because sampling and laboratory handling may give us disturbed samples and erroneous results. In this paper, our interpretation and evaluation of piezocone data are demonstrated for a medium-stiff, overconsolidated clay.
Cone penetration tests (CPTs) with measurement of cone resistance (qc) and sleeve friction ifs) during penetration have been used in Norway since the early 1950s. In the early 1970s, the first attempts were made to measure the pore pressures developed around conically shaped piezometers (1). These tests clearly showed that large pore pressures could be developed during penetration of fine-grained clays and silts .
The introduction of the piezocone (2 ,3) in the mid-1970s provided new possibilities for the interpretation of soil parameters and the identification of soil type. In particular, the simultaneous measurement of cone resistance (qc) and pore pressure (uT) in a piezocone penetration test (CPTU) permits the interpretation of test results in terms of effective stresses.
At the Norwegian Institute of Technology (NTH), research on the interpretation of piezocone test results has concentrated on the development of rational interpretation methods based on well-known theoretical principles. The methods have been applied to test records from various soil types, and systematic correlations have been made between laboratory reference parameters and interpreted values from CPTU data.
In this paper, the interpretation methods are demonstrated for Glava clay from the Trondheim region. This is a mediumstiff, overconsolidated clay of medium to low sensitivity. The following parameters have been interpreted and evaluated:
Soil strength parameters:
• Undrained shear strength (su), and • Effective shear strength parameters [attraction (a) and
friction (tan <l>')] ;
Geotechnical Division , The Norwegian Institute of Technology, N-7034 Trondheim, Norway.
Deformation parameters:
• Compression moduli (M; and Mn), • Stress history, preconsolidation pressure (a~), and • Coefficient of consolidation (c,).
A classification chart that may aid in the classification of soil type on the basis of CPTU recordings is also presented .
CPTU MEASUREMENTS AND CORRECTIONS
In a piezocone penetration test, the following recordings are usually made:
• Cone resistance (qc), • Total pore pressure (uT) at reference location (Figure 1),
and • Sleeve friction (f,).
The terminology and symbols used in a CPTU are summarized in Figure 2. When the cone is subjected to water pressure on all sides, a shift in zero values will usually be recorded both for friction and cone resistance readings ( 4) . The reason for this effect can be seen in Figure 1: the water pressures act on the end areas of the conical part and the friction sleeve, respectively, due to the jointed design of the cone. For most types of cones in practical use, these end areas are not equal in size, and an unbalanced force will occur during penetration. Therefore the recorded cone resistance qc will be smaller than the true value, and the sleeve friction will be larger. To account for these effects, certain corrections should be applied to the original recordings ( 4,5). Equation 1 shows the correction to be applied to cone resistance:
(1)
where
qT = corrected total cone resistance, a = net area ratio (A,.!Aq < 1) (Figure 1), and
uT = total pore pressure at reference level (Figure 1).
Equation 2 shows the correction to be applied to sleeve friction:
fT =ls - (1 - ksb) 'C' UT (2)
where
f T = corrected sleeve friction,

Sennese/ el al.
N
.;::. ...., Q.
"' -0
c:: 0
...., "' '...., "' c:: <U
0..
Us
---As I
_ j
111-- Ast
-- --
Reference filter
Friction sleeve
Asb
location uT - . Aq _ _ .,......,..""'i--1..!..J'-'-/
Cone
d
FIGURE 1 Correction of measured cone resistance for pore pressure effects.
Cone resistance, qc Pore pressure, ur
FIGURE 2 CPTU measurements and notations.
b = sleeve end area ratio (A,,IA,b < 1) (Figure 1), c = sleeve area ratio (A ,b!A, < 1) (Figure 1),
uT = total pore pressure at reference filter location, and k, = u,!uT = 0.6 to 0.8 in soft clays.
These correction may be important in oft clay and ilt , where large pore pres ures are generated during penetration. In coarse soils, the correction are practically negligible becau e almost drain d conditions prevail in the surrounding oil. To interpret the cone penetrati.on process in ten11s of effective stresses, the pore pressures must be measured somewhere on or in the vicinity of the conical part. Two different locations have frequently been used for the pore pressure element:
25
• On the conical part, either at the tip or at mid-height of the cone,
• On the cylindrical part, immediately behind the cone neck. (This location has been recommended in a prop al lo the International Society for Soil Mechanics and Foundation Engineering (6). It is referred to in this paper as the reference filter location.)
No specific filter location provides optimal pore pressure measurements for all practical application . Unfortunately the relative magnitude of the penetration pore pres ure depends on where on the cone it is measured. Generally, the large t pore pressure i · generated in the compre sion zone beneath the cone, wherea ignificantly lower pore pressure may be developed along the cylindrical part. Several re ·earchers (7 B) have indicated that pore pressure behind the c ne may be empirically related to pore pressure mea ured at the conical part.
The following expression may be used to adjust the pore pres ·ure measured on the cone to make it correspond to the reference value (9):
where
u0 = hydrostatic or initial in situ pore pressure, uc = measured total pore pressure, and k = adjustment factor.
(3)
The adj ustment factor k i primarily a function or oil type, soi l properties, and the exact filter I cation on the cone. Experience from penecration tests in various oil cype u ing cones with different filter locations i ·ummarized in Table I .
In some heavily overcon olidated clays and in very dense sands, negative pore pressures may exist at the reference I vel although positive pore pressures are measured on the cone . In such materials, negative values of k should be selected.
SITE AND LABORATORY INVESTIGATIONSGLAVA CLAY
Interpretation of CPTU records from the medium-stiff, overconsolidated marine Glava clay has been selected for this paper. The clay is homogeneous, but some silt lenses are pre ent in the upper parts of the profile. The clay is dry cru t·ed down to about 1.5 m. Result from index te ts and pecial t ·t in the laboratory are pre ented in Figure 3. Th ground-
TABLE 1 EMPIRICAL VALUES OF k FOR ADJUSTMENT OF PORE PRESSURES
Soil Type
Normally consolidated clay Slightly overconsolidated, sensitive
clays Heavily overcon olidated clays Loose, compressible silts Dilatant, dense silts Loose, silty sands
Filter Location
Cone Face, Mid-Height
0.6-0.8
0.5-0.7 0-0.3 0.5-0.6 0-0.2 0.2-0.4
Cone Tip
0.7-0.9
0.6-0.8 0.1-0.3 0.5-0.7 0.1-0.3 0.5-0.6

Soil
type
- G~JT
SILTY CLAY WITH
LENSES
OCCASIONAL GRAINS OF SAND AND GRAVEL
Water content %
20 30 40 50
' ~~ ~ .. ,. •• r;
I • • .... ,.., ..... • 1-~ie
• 1 - t
,t-MI '- '- • • .--- --.n
i ~Dli
la . ,. • '--'--.
ii ii
' I I
' I ,, •
I I
FIGURE 3 Soil profile for Glava clay.
Undrained shear strength kN/m 2
10 20 30 40 50
a kN/m2 I tancp' I I ModokJs runber l Preconsolidation m pressure kN/m2
20 40 I 0.4 0.5 0.6 0.7
1
10 15 20 25 200 400 600 I I I I I f f
v \ -T v 'l
• t \ , v .. ,.., v I , •• l 17 ... \
" • ~
J
, Jl \ , 'V c;
~ \ T 7
• ~" T v -\-T 7 "\ .. 'l \ • "
'Q
:"' I r
• ~ I 'rj,
~
I
I ! \
I \ I
I
• 1; 0 .. " '
,,,.
' v , v v "'\
) I
> \
\
-- ,_,___

Senneset et al.
water table is located at a depth of 1.0 m, and the initial pore pressure di tribution (u0 ) i hydrostatic.
The laboratory te ting program was performed on undisturbed clay samples obtained with the G onor 0 54 mm pislOn sampler. It included conventional index tests, CIU lriaxial compression ce t , and continuous-loading oed meter te t . The aim of this test program wa to establi h reference strength and deformation parameters (Or comparison with in situ parameters interpreted from the CPTU records.
The ite investigation · included three cone penetration test with pore pressure mea ·urement . A LO-cm2/60-degree piezocone with the fi lter at the reference !ocati n immediately behind the cone was u eel for all tests . Typical record of cotrected cone re istance qr and reference pore pre sure u7
are h6wn in Figure 4. Tbe mo. t important a pect of piezocone te ting i the sat
uration of the pore pres ure transducer . y tem. In ufficient aturation may cause a delayed re pons.e to rapid change in
the pore pressure. The following procedure producecl good re ult · in Glav::t clay:
l. atura tion of filters before field work by (a) applying vacuum on ubmerged filters and (b) flush ing with de-aired water· and
2. Preparatirn1 for field u e by (a) applying high vacuum on the dismantled cone at the site for appr ximately 1 h ur {b) performing final cone a ·sembly with the cone and filter submerged in de-aired water, and (c) sealing the filter with a rubber membrane before lowering the penetrometer down to the water level in a predrilled hole.
SOIL STRENGTH
The cone penetratioo pr cess involves many aspects of soil behavior that may complicate the development of a realistic analytical interpretation model. For example,
• Stresses and pore pressures around the cone vary in both vertical and radial dire.ctions;
• ingularities, high stress gradients, and high pore pressure gradients are pre, ent because of the cone geometry;
"' a: w .... w ~
~ :::c .... Q.. w c
qT IN MPa UT IN MPa
00 0.4 0.8 1.2 0 0.40.81.2
~ 4
8
12
16 -
FIGURE 4 CPTU records for Glava clay.
27
• The geometrical shape and extent of plastified zones at failure are unknown; and
• The penetration takes place continuously, and large strains are imposed on the surrounding soil.
Considering these aspects, one may easily realize that a closedform analytical solution to the cone penetration problem may be difficult to conceive. Analytical models from CPTU data for penetration of soil hence include simplifying assumptions and approximations tbat should be considered when evaluating interpreted parameters.
Undrained Shear Strength
The undrained shear strength (su) may be estimated from the cone data by using a theoretical relationship of the following form (JO):
qT - CT s,, = -N-
c
where
qT = total corrected cone resistance, Nc = bearing capacity factor, and
(4)
CT = in situ sires [either vertical overburden pres ure (CT,0),
horizon tal pressure (CThO = K0CT,~1) , or octahedral pressure (CT act = 1/3 (CT vO + 2CT ho))].
Various theoretical approaches have been introduced to determine tbe bearing capacity factor N, ; these include bearing capadty theory (11,12), cavity expansion methods (13 ,14) and numerical approaches using linear or nonlinear soil models (15,16). However, a generally accepted theor tical model for determination of s,. ha not yet been developed. Hence the interpretation of s,. i u ually estimated from empirical relationships (17) such a
(5)
where NkT denotes a cone factor, including shape and depth factors.
The cone factor NkT is usually determined from a reference value for s.,,, either from a field vane test or a laboratory triaxial compression test. Value for NkT seem to range from 10 to 15 for nonnally con olidated clays, and from about 15 to 19 for overconsolidated clays. Empirical values of NkT are u ually higher than tbe values of Nc obtained by theoretical models .
The large catter in values of N1n- often limits the abilicy to produce a successfu l interpretation of s,. from CPTU data. Local correlation at the ite are hence u ually recommended which , in fact , i not a very consi tent procedure. Many rea-ons for the reported scatter may b relevant to mention; for
example ,
• The undrained shear strength is not a unique measure of the soil strength;
• The obtained value depends on the type of test performed;

28 TRANSPORTATION RESEARCH RECORD 1235
• The obtained value of Su is strain rate dependent; and • The reference s" for many empirical methods has been
different.
The latter point may be discu. sed in further detail. It is well known that the maximum shear stress obtained in a clay sample subjected to triaxial compression depends on the consolidation stress level. Usually the sample are consolidated to the pre ent in situ stress level, where the at-rest coefficient .K-O is anticipated or approximatecl from empirical relation-hips. Overconsolidated soi ls were previously consolidated a1
higher tres es than those acting on the deposit today. T hese stre conditions may al o be simulated in the con olidation phase for a triaxial test sample .
;f ~ .. f-~ i 100
Ill
I 50
J 0
GLAVA CLAY • Tmax from trlaxial tests = Su
<Jvo'
0 100 200 300 400 In Figw·e 5, a principal graph for the peak shear stress as a function of the consolidation stress cr~c is shown for Glava clay. The band reveals quite interesting tendencies:
Consoldatlon stress, a3c.· in lab.
• A large scatter is seen in the maximum shear stress ( T,,,"x) for amples consolidated to the present in itu overburden pressure.
FIGURE 5 Principal graph of peak shear stress (7.,.,.) versus consolidation stress u;, for Glava clay.
T
.... • amples consolidated to or pa t the ovcrcon olidation
pressure indicate that there xists an upper limit of the maximum obtainable shear tres · in the clay. Thi limit will correspond to the undrained shear strength s11 •
-.CRUSHING
For Glava clay, values of N11r based on T,,..._, values from a:<l"consolidated test samples range from about 12 to 18. If the average peak shear stress from cr'-c n lidated amples is utilized , the cone ponding range become about 7 to 10. These empirically based values are in better agreement with reported theoretical value of the bearing capacity factor Ne.
a FIGURE 6 Definition of strength parameters in the MohrCoulomb criterion.
Further research will be carried out in other type of clay to evaluate whether this approach has general applicability. If so, it may help narrowing the scatter in Nkr values and may perhaps explain the often-reported discrepancies between theoretical and empirical values.
Effective Shear Strength
Coulomb failure criterion in Figure 6. Over a given range of working stresses, the strength envelope may best be approximated by the expression
T1 = (cr' + a)tan <!>' (6) The effective shear strength parameters, friction (tan<!>') and attraction (a), over a stress range t:.cr' are defined by the Mohr- where r1 denotes shear strength, and cr' denotes effective normal
TABLE 2 TYPICAL VALUES OF ATTRACTION (a) AND FRICTION (tan <!>') (18)
Shear Strength Parameters
a (kPa) tan<!>' <!>' Nm Bq
Clay Soft 5-10 0.35-0.45 19-24 1-3 0.8-1.0 Medium 10-20 0.40-0.55 19-29 3-5 0.6-0 .8 Stiff 20-50 0.50-0.60 27-31 5-8 0.3-0.6
Silt Soft 0-5 0.50-0.60 27-31 Medium 5-15 0.55-0.65 29-33 5-30 0-0.4 Stiff 15-30 0.60-0.70 31-35
Sand Loose 0 0.55-0.65 29-33 Medium 10-20 0.60-0.75 31-37 30-100 < 0.1 Dense 20-50 0.70-0.90 35-42
Hard, stiff soil, OC, cemented >50 0.8-1.0 38-45 100 < 0

Senneset et al.
stress on the failure plane. The term attraction (a) is interpreted from the design stress range as the negative intercept of the normal stress axis (a'). The classical term cohesion (c) is related to the attraction by the expression:
c = a · tan<!>' (7)
Typical ranges of the shear strength parameters for some common soil types are given (78) in Table 2. The table may be useful for evaluating the parameter values interpreted from CPTU data.
It is important to note that a large silt content may increase the parameter value for clays but may reduce the parameter value in and for otherwi e irnilar conditi.o ns. Mo reover tl1e pre ence of active clay mineral such as smecti te and montmorillonite will decrease friction below the values given in Table 2.
Theoretical Framework
The framework for effective stress interpretation has been the conventional bearing capacity approach ba ed on the theory of plasticity. In the case of cone penetration in well-draining . oi ls, which allow no excess po.re pressure buildup in the soil , the formula for plane strain bearing capacity may be written (19) as
(8)
where
a~0 = effective overburden pressure (at reference location),
Nq = theoretical bearing capacity factor, and a = attraction.
In fine-grained soils, excess pore pressures will be generated around the cone and will decrease the ultimate bearing capacity. This is accounted for in the expression below (19):
(9)
where
q 11 = qT - avo = net cone resistance, !:i,.uT = excess pore pressure at reference location, and N" = theoretical bearing capacity factor.
When the excess pore pressure is measured in the test, one can insert (19)
(10)
f where Bq denotes pore pressure ratio (!:i,.uT!q 11 )] into Equation 9 and obtain
q11 = N,,,(a~0 + a) (11)
where N,,, = (Nq - 1)/(1 + N,,Bq).
For the drained case, Bq = 0, and Equation 11 becomes similar to Equation 8.
29
The expression for the bearing capacity factor Nq may be writt n in the following way (18):
Nq = N1 exp[('rr - 2[3)tan <!>'] (12)
where N1 equals tan2 (45 + !<!>'), and f3 is the angle of plastification.
Figure 7 show values of N,, as a function of <I>' and 13, including an "empirical graph ' for 13 based on various in itu trength tests in and and si lts. The band is extrapolated to cover clay . A definition of the angle of pla tification (13) in the idealized geometrical failure pattern is also included in Figure 7.
A theoretical olution of the bearing capacity factor N,, as a function of oil frictio n (tan <I>') and base roughness (r) ha recently been developed ar NTH (20). fn the typical range of friction values in clays and silt where the term N,,611,. i significant, i.e. , when tan <f>' is in !be range 0.3 to 0.7, the theoretical solution may be reasonably well approximated (19) by
N,, - 6 tan <!>' (1 + tan <f>') (13)
The plane strain bearing capacity solution is hence primarily a function of the oil friction (tan <!>') and the angle of plastificacion ([3).
Soil classification
An impression of soil type may be gained from recorded values in a PTU. If one u es the dimensionles parameters N,,, = q,,l(a:'° + a) and B,
1 = /:i,.u7.fq,,. the po · ·ible type of
oi l may be identified by using Table 2 (18).
er z ... j :I c >--·c; I!. B
·E ca I
100
10 -
0.5 Friction tan </>'
SAND
1.0
FIGURE 7 The bearing capacity factor N ••
f3 = -30°
f3 = +15°

30
The modified classification chart shown in Figure 8, which is hased on values of q.,. and B,, ma ' be used for the ame purpose (18) . One should note that lli.e values of 8,1 should be devel ped from the reference pore pr ssures m a ured immediate ly behind the cone, and llrnt the rrected cone resistance q·rshould be utilized in the clas ification . T he chart in Figure 8 may also be u ed when negative pore pressures are recorded at the reference location . The information on soil type and penetration conditions obtained from the cla · sification may be valuable for the interpretation of strength parameters described later in this section.
Interpretation Method-Friction
The interpretation procedure is based on the following CPTU data:
• Corrected cone resistance (qT), and • Excess pore pressure at reference location (AuT)·
Moreover, the following initial stress conditions in the penetrated soil must be known:
• Total overburden pressure (av0), • [nitial pore pre ure di tril,)uti n (u0), and • Effective overburden pressure (a:.i = avo - Uo)·
The following dimensionless parameters can then be found directly from the cvru recordings: (a) the cone resista nce number (Nm):
q NEGATIVE POSITIVE [M~]·~ss ... ! ... ~~SS
:: ~., PRESSURES
12
10
8
6
4
2
(14)
B - Ur Uo q- qT-Uvo
• GLAVA CLAY
0 ~
-0.6 -0.4 -0.2 0 0.2 0.4 0.6 0.8 1.0 1.2 Bq
FIGURE 8 Chart for classification of soil type on the basis of l:J'TU recordings.
TRANSPORTATION RESEARCH RECORD 1235
and (b) the pore pressure ratio (Bq) :
B = uT - u0 = AuT q a~0 + a qn
(15)
The choice was made to derive values of B4
from the pore pr . sures mea ured on th reference filter l.ocation. The attraction values in Equation 1.4 may b~ evaluated theoretically or chosen on the basis of information on soil type and soil conditions.
The friction (tan <!>') is then found from an interpretation chart, as shown in Figure 9. Because the interpreted value depend- on the angle of plastification several chart have to be developed in order to cover a range of po sible yalue of j3 . Jn the example shown in Fi ure ca tan <!>' = 0.66 is determined from N,,, = 12 and B,1 = 0.2. The interpretation procedure i however. well suited for computer-assisted interpretation and presentation of results, and a computer program has been developed for the purpose (21).
Angle of Plastification
The angle ofplastification (13) expresses an idealized geometry of the generated failure zones around the advancing cone. This idealization requires that cone penetration be simulated as a quasi tatic process. The value of 13 is hence difficult to assess, both experimentally and theoretically . However, it is reasonable to believe that 13 depends on soil properties such as compressibility and stre s hi tory plasticity and ensitivity. Th easiest way to estimat typical values of 13 in various soils i to perform correlation between laboratory-determined tan<!>' and interpreted values from PTU. Result from such studies in various soil types performed at NTH over the recent year are summarized in Table 3. fnformation n soil type and soil conditions may be gained from the previously shown classification chart and table.
Attraction
Attraction (a) may be estimated directly from the CPTU records, both for drained and undrained penetration (1,18). The suggested method are applicable wh n relatively homogeneou oil depo it or layer are penetrated. ln cases where sucb esti
mates cannot be obtained, it i suggested tbat typical values from triaxial tests on similar soils be used (9) (Table 2).
In CPTU interpretations, one may often obtain larger v;ilues than are usually found by triaxial testing. This may be due to sample disturbance of suction in the pores. However,
TABLE 3 TENTATIVE VALUES OF THE ANGLE OF PLASTIFICATION ~ IN VARIOUS SOIL TYPES (9)
Soil Type
Dense sands, overconsolidated silts, high plastic clays, low-compressible overconsolidated clays
Medium sands and ills, sensitive clays, highcompressible clays
Loose silts, clayey silts
Tentative Values of ~ (degrees)
-20 to -10
-5 to +5 + 10 to +20

(a)
1000
e 100
z r£
! s t) 10
~ ~ 8
/
// ;V~
/J ~ -~ ~ ~ _,.
/3=00
/ I
/
/
/ / / /
/ / / / /
/ / / /,v , / / ~ // . ,
I , , ,,. I / / ,, , ~
/ v / / / / ...--V / I// / / J /
V / v _,. / ,r/ _,.. v
~ v/ v,,., / / v,,_,, ~
l-/: v v/ / / v ~ v /
0 . 2 0.4 0 . 6 0.8 1. 0
FRICTION tan <p'
0 . 0
O" m
0. 1 Q ti:
0. 2 a: w
0.3 ~ 0.4
0 . 6 f3 0 .8 IE 1.0 w 1. 5 ~ 2 .0 a.
(b)
/3=-15° 1000
E z r£ w 100
I ~ ~ f3 a: 10
~ 0
0 0 . 4 0.6 0.8
FRICTION tan <p'
0.0
0 . 1
0 .2
0 .3
0.4
0.6
0 .8 1.0
1. 5
2.0
1.0
O" m Q ti: a: w ! rn ti) w If w a: 0 a.
(c)
E z r£ w
! ~ z ~ ii) w a: w ~ 0
10 f3 =+15°
00~~~3 I I I
.. I -/
7 -r-
7
/ -y )7
: / / v I__,..?"
10 / / /1~,,_,.v' _,. c....- ,,
~:' /./ ,,, . - !../ _.,,,. ~ // I __.
/ / __,.. [_,...-' ~
/ I//"/ ,,.,, ·~ I _,.....--' __,.....--17 / //r/ _) / I,../ .
;j~ ~t/1~ ~L.--~~i~/1 ,,,.-~ --
1 [Y/~ / ~
0 . 0
O" m
0 .1 Q ti
0 .2 a: w
0 ,3 ~ 0 .4
f3 o.6 IE 0.8
1.0 ~ 0
, .5 a. 2 .0
0.2 0.4 0.6 0.8 1.0
FRICTION tan <p'
FIGURE 9 (a) Interpretation diagram for fJ = 0 degrees; (b) interpretation diagram for fJ = -15 degrees; (c) interpretation diagram for JJ = + 15 degrees.

32
uncertainties in the determination of attraction have only small effects on interpreted friction at greater penetration depths (z > 1U m).
Results for Glava Clay
In Figure 10, values of tan <J>' interpreted from CPTU are compared to reference values obtained from triaxial compression tests. In the upper 10 m of the profile, 13 = -15 degrees provided the best correspondance to the reference values, whereas 13 - 0 degrees was appropriate below this depth. Attraction values determined from triaxial tests were used in the interpretation. Similar values of 13 have been found for other overconsolidated clays as well (9).
Further research will be carried out in order to gain more confidence in the selection of 13 values in various soils.
SOIL DEFORMATION PARAMETERS
The penetration of a cone imposes large strains in the surrounding soil, and the distribution of stresses and pore pressures are complex and difficult to predict. This is in contradiction to real design problems, where relatively small strains are developed and a reasonable prediction of the effective stresses may be obtained. Hence, predictions of deformation moduli from CPTU data are usually based on empirical or semiempirical relationships.
The introduction of the piezocone made it possible to include pore pressure dissipation tests in situ. Much attention has been devoted to interpreting the results of such tests in order to estimate flow and consolidation characteristics of the soil.
In this section, simple methods of approximating soil deformation and consolidation parameters from CPTU data are presented and demonstrated for Glava clay. It should be stressed
Nm 00 8 16
a=15kPa
12
16
0 0.4 0.8 Bq
FRICTION tan 'I''
0 0.4 0.8
-{3 = ffl
a=15kN/m 2
FIGURE 10 Comparison between in situ and laboratory values of tan «!>' for Clava clay.
TRANSPORTATION RESEARCH RECORD 1235
that the methods are aiming only at a rough estimate of the parameter values. Laboratory tests should be carried out in order to establish design values uf Llit: Jefu1 mation parameters for clays.
Compression Moduli
The compressibility of the soil may conveniently be expressed by the tangent modulus (M) (22), where
M = d<T'lde (16)
The tangent modulus varies with the effective stress CT' in different ways for various soil types. It has been found that all types of variations may be described by the following general expression (22):
( )
I - a
M = m · <Ta · :~
where
m = modulus number, <Ta = reference stress ( = 100 kN/m2
), and a = stress exponent ( -1 s a s 1).
(17)
A definition of the tangent modulus from the stress-strain behavior of the soil is shown in Figure 11. The same figure also shows the principal behavior of the tangent modulus for an overconsolidated clay. For the preconsolidated stress range, a constant modulus is indicated (a = 1), whereas the modulus increases linearly (a = 0) for stresses above the preconsolidation pressure u~. The tangent modulus may be determined from a laboratory oedometer test.
In the CPTU interpretations, the vertical deformation moduli may be expressed as a function of the net cone resistance q,.. For clays, a linear interpretation model is suggested for the estimation of values of M for the preconsolidated stress range (Figure 11). The expression reads (19)
M; = m; · q,,
Iii
,; i ii ·;c ~
:IE vi
i M1 e I Mn
{!. Uc'
Axial stress, a'
Tungent modulus:
M _ da' - dE
Axial stress, a
FIGURE 11 Definition of deformation moduli frQrn CPTIJ.
(18)
Senneset et al.
The in situ modulus number m; ranges from 5 to 15 in most clays (19). In the normally consolidated stress range, one may combine
M = m(O"~ +a)
and
and get
where
m" = in situ modulus number (m/Nm), m = oedometer modulus number, and
Nm = cone resistance number.
(19)
(20)
(21)
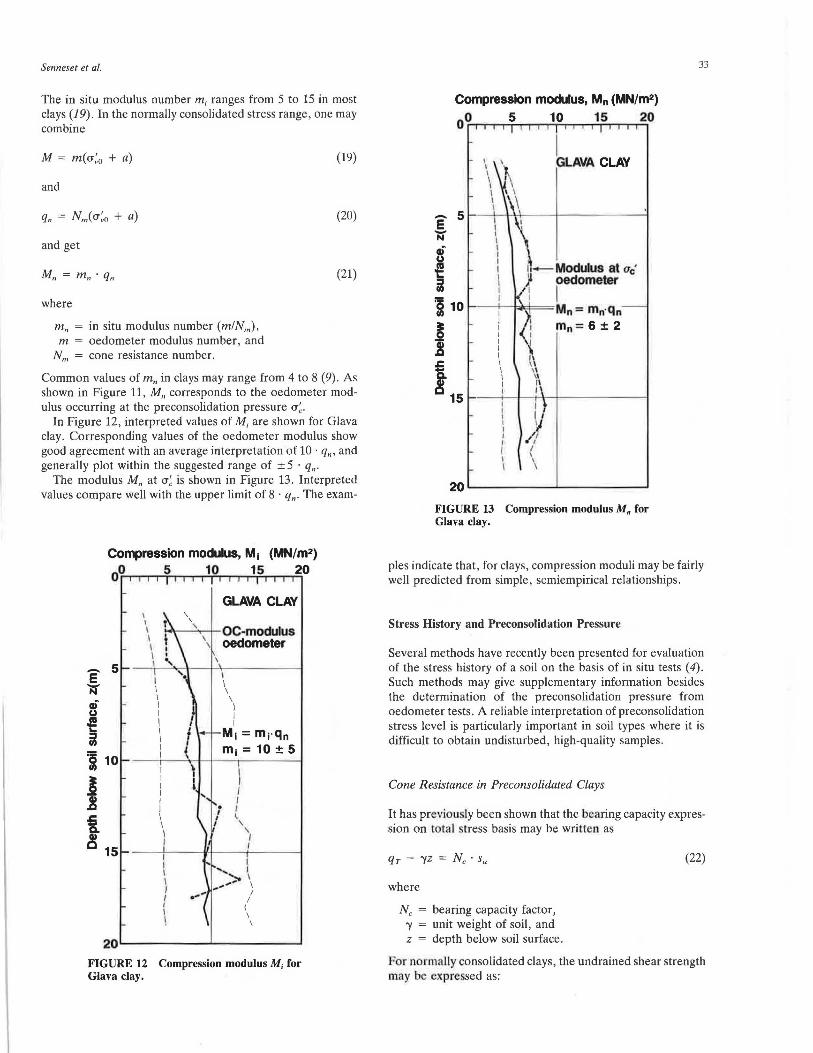
Common values of m" in clays may range from 4 to 8 (9). As shown in Figure 11, M" corresponds to the oedometer modulus occurring at the preconsolidation pressure rr~ .
In Figure 12, interpreted values of M; are shown for Glava clay. Corresponding values of the oedometer modulus show good agreement with an average interpretation of 10 · q,,, and generally plot within the suggested range of ± 5 · q,,.
The modulus M,, at rr~ is shown in Figure 13. Interpreted values compare well with the upper limit of 8 · q,,. The exam-
e 5 -N
f ~ 10
! ! i ~ 15
\ I \ I \ I I
I I I I I I I I I I
I I I I I I I I I I
GLAVA CLAY
OC-modulus \ oedometer \
I I \ \ ) I I
1 M1 = mrqn m1 = 10 ± 5
' I
' I ,
I \
\ \ I I
20 ...... ~~~~~.__~~~~--'
FIGURE 12 Compression modulus M; for Glava clay.
Compression modulus, Mn (MN/m2)
00 5 10 15 20
I I \ I
I GLAVA CLAY
FIGURE 13 Compression modulus M. for Glava clay.
33
pies indicate that, for clays, compression moduli may be fairly well predicted from simple, semiempirical relationships.
Stress History and Preconsolidation Pressure
Several methods have recently been presented for evaluation of the stress history of a soil on the basis of in situ tests (4) . Such methods may give supplementary information besides the determination of the preconsolidation pressure from oedometer tests. A reliable interpretation of preconsolidation stress level is particularly important in soil types where it is difficult to obtain undisturbed, high-quality samples.
Cone Resistance in Preconsolidated Clays
It has previously been shown that the bearing capacity expression on total stress basis may be written as
where
Ne = bearing capacity factor, -y = unit weight of soil , and z = depth below soil surface.
(22)
For nornuLl ly consolidated clays, the undrained shear strength may be expre. sed as:

34
By combining Equations 22 and 23, one obtains:
qT = (Ne • Ctu · 'Y1 f'Y + 1) · 'Y · Z = K · 'Y · Z
where Kc is the cone resistance factor.
(23)
(24)
Typical values of et" range from 0.2 to 0.25, whereas Ne theoretically may vary between 6 and 10 in most bearing capacity approaches. The ratio 'Y' /'Y lies approximately in the range from 0.5 to 0.6. The average value of Kc is hence close to 2.
Consequently, the theoretical cone resistance for a marine, homogeneous, normally consolidated clay may be written:
(25)
where ::; is the average total unit weight of soil. The stress history of a clay deposit may hence be evaluated
by plotting a straight line 2::; · z on the qT - z record. If the qT recordings plot is close to the theoretical line, the clay is most likely normally consolidated. If qT is significantly larger than 2::; · z, the clay may be in an overconsolidated state. Figure 14 shows this evaluation principle applied to CPTU records from overconsolidated Glava clay.
Approximation of Preconsolidation Pressure
When pore pressures are measured in a piezocone test, the in situ preconsolidation pressure a~ may be approximated from the expression published by Sandven et al. (9):
e -N
f
• Uc' : \ I .. \ I . I . , I
5: I
\ \ \ \ \ \ . \ \ t \ 1 ·I ·\ \1 ~ ~ I\ I .
qy , a,! (kN/m2]
1000 2000
GLAVA CLAY ave>: Effective
overburden
ac' : From oedometer
qr : Total cone resistance
2;:;z: Theoretical resistance NC-cla
15 I \
a"vo· \ \2pz
FIGURE 14 Cone resistance qT versus preconsolidation pressure cr~ for Glava clay.
TRANSPORTATION RESEARCH RECORD 1235
q'-r +a cr~ +a= ---
N,,c (26)
where q~ = qT - uT is the effective cone resistance , and Nqc is a bearing capacity coefficient defined by
(27)
The theoretical principles for this solution are similar to those applied for the interpretation of effective soil friction outlined in the section entitled "Soil Strength." In this approach, it is assumed that the effective cone resistance (q~) depends on the preconsolidation stress (a~), the excess pore pressure around the cone (~uT), and the effective shear strength parameters a and tan <!>'. These factors are expressed in the bearing capacity coefficient Nqc' shown in Figure 15. The hatched area in the diagram reflects the variation in the product NB when the Prandtl solution for Nq (13 = 0 degrees) u q
is used. The basis for the diagram is presently the subject of further research; hence the diagram may be modified when more data become available . Interpreted preconsolidation pressures from CPTU data for Glava clay are compared to corresponding values determined from oedometer tests in Figure 16. Some discrepancies are seen between the two values, especially below a depth of 10 m. However, continued research and further correlations in other clay types may improve the agreement between in situ and laboratory parameters.
Coefficient of Consolidation
When performing cone penetration tests in slow-draining soils, excess pore pressures will be generated in the surrounding soil. If the continuous cone penetration is stopped, this excess
FRICTION tan</>' PRECONSOLIDATION PRESSURE
q·+ a a·+a=-T __
c Nqc
a ,. c ·
FIGURE 15 Bearing capacity coefficient N.c for interpretation of preconsolidation pressure cr;.

Senneset et al.
a' [kN/m2]
0 500 1000 0.--.--.--.--.--.--.----..--.--.----..----..----..--~
e I 'iii' I \\ J
LEGEND: GLAVA
~ - '"" ~ 5 I ,,-.. " -1-----+-----1
~ I "- \
~ I / ~ 10 - r -
§ \( \ \ \ \
) '
a~from CPTU
a~ from oedometer tests
151---+-t--·~\-~-----+-------1
Uc'
FIGURE 16 In situ and laboratory values of the preconsolidation pressure cr; for Glava clay.
pore pressure will start to dissipate, and the decay of pore pressure with time can be monitored.
Theoretical Considerations
Cone indentation in soils may be modelled by the expansion of a cylindrical or spherical cavity in an elastic, perfectly plastic medium (13 ,14) . The cavity expansion is characterized by the development of a spherical or cylindrical plastic zone (-rt = Su) near the cone. Outside this zone, the soil is in a state of elastic equilibrium (-rt < su). The extension of the plastified zone depends on the rigidity index of the soil (/, = Glsu, where G is the shear modulus of the soil). Several models based on cavity expansion theory have been developed in
35
order to interpret the coefficient of consolidation (c) from dissipation test results (23). This parameter may be defined as follows:
M·k c =--
'Yw
where
M = deformation modulus, k = soil permeability, and
'Yw = unit weight of water.
(28)
Vertical (cv) and radial (c,) values of the coefficient of consolidation are usually somewhat different in natural soil deposits. At NTH, two different approaches are used to interpret dissipation test data (19). Both approaches are based on cylindrical cavity expansion theory, and should hence yield values for the radial coefficient of consolidation. Using the timefactor approach,
T c = r2. -
' 0 t
where
r0 = probe diameter, T = time factor, and t = time to reach given level of dissipation.
Using the rate-factor approach,
where
Ac = rate factor,
(29)
(30)
6.uT = rate of pore pressure dissipation at given dissipation level, and
6.uT = initial excess pore pressure at t = 0.
A principal graph of test recordings and terminology is given in Figure 17, and values for the rate factor Ac and time factor
500.------------
I rp I-~ 400
~ Ill
~300
~ I 200 ::E
GlAVA CLAY DISSFATION TEST D = 12.Sm
30 60 Time, t(mln)
Uo
FIGURE 17 Principal graph and terminology for interpretation of CPTU dissipation tests.

36
T aie shown in Figures 18 and 19, respectively. Doth factois depend on soil properties (rigidity index I,) and degree of dissipation (UT), where UT (in percent) may be written as
(31)
where
u, = pore pressure at given time t, uT = initial pore pressure at t = 0, and u0 = initial in situ pore pressure before penetration .
The coefficient of consolidation may vary with the effective stress level. It is, however , usually evaluated at a 50-percent degree of dissipation .
1
0.75
_ 2 1tiu1 Ch-,\1Jo ~UT
u :::I ~ .a 0 0.50 i== <( c:
0.25
0 0 1 4 10 20 40 100
RATE FACTOR Ac
FIGURE 18 Diagram for interpretation of rate factor Ac.
1
0 t 0.75
u :::I ~ .a 0 0.50 i== <( c:
0.25
0 0 1 4 10 15
TIME FACTOR T
FIGURE 19 Diagram for interpretation of time factor T.
TRANSPORTATION RESEA RCH RECORD 1235
of dissipation test data. For example (24) ,
• The dissipation curves are very sensitive to the initial distribution of the excess pore pressure in the plastic zone;
• Consolidation may take place in both vertical and horizontal directions;
• Soil behavior near the cone is complex, due to remolding during penetration, soil anisotropy effects, and soil macrostructure and stratification; and
• A rigid and sufficiently saturated pore pressure measuring system is necessary to give high-quality, reliable test results .
However, it seems that one-dimensional models based on cavity expansion theory may provide reasonably reliable predictions of the coefficient of consolidation. Interpreted values may correspond to values in the preconsolidated stress range in a laboratory test sample, at least for dissipation levels below 50 percent. This is because parts of the consolidation process will take place with the soil in an overconsolidated state . If a value of the coefficient of consolidation in the normally consolidated (NC) stress range is wanted , one may hence wait past the 50-percent level of dissipation.
Results
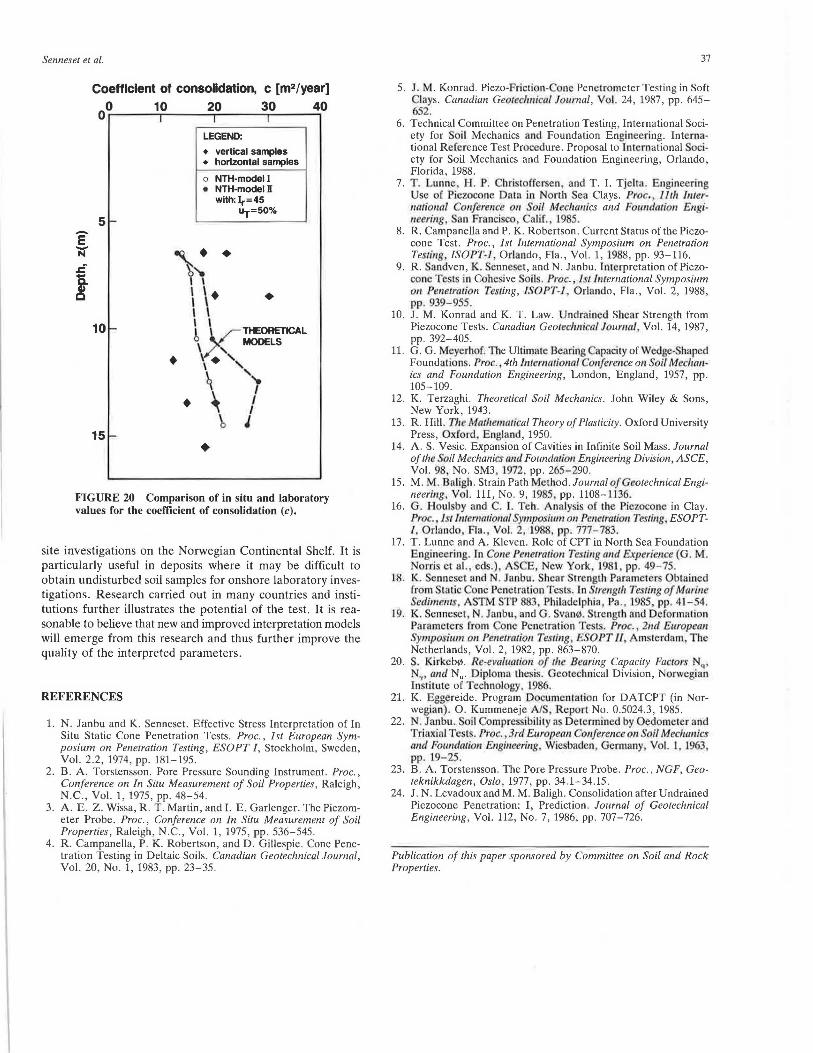
Dissipation tests were carried out at five different levels in Glava clay. A piezocone with the filter located at the cylindrical part was used for the test, and hence it was assumed that the dissipation mainly takes place in the radial direction . Continuous consolidation tests were performed on undisturbed samples from the same level in the profile . These tests were performed on both vertically an<l hurizuulally oriented samples to evaluate the consolidation properties in both directions. In situ and laboratory values of the coefficient of consolidation are compared in Figure 20. In general , values predicted by the interpretation models are of the same order of magnitude as those determined on horizontal samples in the oedometer tests.
In the interpretations , the coefficient of consolidation has been evaluated at 50-percent pore pressure dissipation, and for medium-stiff soil conditions (/, = 45). The laboratory values have been selected as the average from the preconsolidated stress range. In this clay, the radial coefficient of consolidation was slightly greater than the vertical.
CONCLUSIONS
Piezocone tests are a very promising method of obtaining realistic values of strength and deformation parameters in many soil types. The piezocone is also an excellent tool for the determination of soil stratification and the identification of soil type. Iis potential for obtaining estimates of engineering soil parameters , along with its excellent determination of soil layering, has established the piezocone test as one of the outstanding and most promising methods of in situ investigation.
The test is today the dominant in situ method for offshore
Senneset et al.
Coefficient of consolidation, c [m2/year)
00 10 20 30 40
LEGEND:
• vertical samples • horizontal samples
o NTH-model I • NTH-model I
with:1r=45
5 uT=50%
-E -'~
• N
.r!
! I I I \ • • I \ I \
10 I \ i K THEORETICAL \ MODELS
• ', ,. ' q '-..
• ~ I \, I
15 • FIGURE 20 Comparison of in situ and laboratory values for the coefficient of consolidation (c).
site investigations on the Norwegian Continental Shelf. It is particularly useful in deposits where it may be difficult to obtain undisturbed soil samples for onshore laboratory investigations. Research carried out in many countries and institutions further illustrates the potential of the test. It is reasonable to believe that new and improved interpretation models will emerge from this research and thus further improve the quality of the interpreted parameters.
REFERENCES
1. N. Janbu and K. Senneset. Effective Stress Interpretation of In Situ Static Cone Penetration Tests. Proc. , 1st European Symposium on Penetration Testing, ESOPT I, Stockholm, Sweden, Vol. 2.2, 1974, pp. 181-195.
2. B. A. Torstensson. Pore Pressure Sounding Instrument. Proc., Conference on In Situ Measurement of Soil Properties, Raleigh, N.C., Vol. 1, 1975, pp . 48-54.
3. A. E. Z. Wissa, R. T. Martin, and I. E. Garlenger. The Piezometer Probe. Proc. , Conference on In Situ Measurement of Soil Properties, Raleigh , N.C., Vol. 1, 1975, pp. 536-545.
4. R. Campanella, P. K. Robertson, and D. Gillespie. Cone Penetration Testing in Deltaic Soils. Canadian Geotechnical Journal, Vol. 20, No. 1, 1983, pp. 23-35 .
37
5. J . M. Konrad. Piezo-Friction- one Pencirorneter Testing in Soft Clays. Canadian Geotcd111ical Journal, Vol. 24 , 1987, pp . 645-
52. 6. Technical Committee on Penetration Testing, International Soci
ety for Soil Mechanics and Foundation Engineering. International Re(erence Test Procedure. Proposal to International ociety for Soil Mechanics and Foundation Engineering, Orlando, Florida, 1988.
7. T. Lunne, 1-1 . P. hristoffer en , and T. I. Tjelta . Engineering U c of Piczocone Data in North ea Clays. Proc. Jlt/J Jnter-11a/io11a/ Co11fe1·em:e on Soil Meclla11ics and For111tla1io11 Errgi-11eeri11g , an Franci co, Ca li f. 1985.
8. R. Campanella and P. K. Robertson. Current Status of the Piezocone Test. Proc., 1st International Symposium on Penetration Testing ISOPT-1 , Orlando, Fla., Vol. 1, 1988, pp. 93-116.
9. R. Sandven, K. Senncset, and N. Jan bu . Interpretation of Piezocone Test in Cohesive oi l . Proc. , 1st 111ternatiorral Symposium 0 11 Penetration Testing, JSOPT-1 Orlando, Fla., Vol. 2, 1988, pp. 939- 955.
10. J . M. Konrad and K. T. Law. Undrained Shear Strength from Piezocone Tests. Canadian Geoteclmical Journal , Vol. 14, 1987, pp. 392-405.
11. G. G. Meycrhof. The Ultimate Bearing apacity of Wedge· hapcd Foundations. Proc., 4th !11ternario11al Co11fere11ce 011 Soil Mechanics and Foundation Engineering, London, England, 1957, pp . 105-109.
12. K. Terzaghi. Theoretical Soil Mechanics. John Wiley & Sons, New York, 1943.
13. R. Hill. The Mathematical Theory of Plasticity. Oxford University Press, Oxford , England, 1950.
14. A. S. Vesic. Expansion of Cavities in Infinite Soil Mass. Journal of the oil Mecharrics and Foundation Engineering Division, ASCE, Vol. 98 No. SM3 , 1972, pp. 265- 290.
15. M. M. Bnligh. Strain Path Method. Journal of Geotechnical Engineering, Vol. 111, No . 9, 1985 pp. 1108-1136.
16. G. Houlsby and C. I. Teh. Analysi.s of the Piezoconc in Clay. Proc., 1st ln1er11atio11al Symposium 011 Pe11etratio11 Testing , ESOPT-1, Orlando , Fla., Vol. 2, 1988, pp. 777- 7frJ .
17. T. Lunne and A. Kleven. Role of CPT in North Sea Foundation Engineering. In Co11e Penetration Testing and Experience (G . M. Norri et al. , ed ' .), AS E , New York , 1981 pp. 49-75.
18. K. Sem1cset and N. Janbu. Shear Strength Parameters Obtained from Static Cone Penetration Tc t . ln Strength Testing of M11ri11e Sediment . ASTM STP 883, Philadelphia Pa., 1985, pp. 41 - 54.
19. K. Senneset , N. Janbu , and G. Svan0. Strength and Dc(orma1ion Parameters from Cone Pe11e1ration Tests. Proc. , 2nd Europe1111 Symposium 011 Penetration Testing , ESOPT fl , Amsterdam, The Netherlands, Vol. 2, 1982, pp . 863-870.
20. S. Kirkcb0. Re-evaluation of the Bearing Capacity Factors Nq• N~, and N". Diploma thesis. Geotcchnical Division, Norwegian Institute of Technology. 1986.
21. K. Eggereide. Program Documentation for DATCPT (in Norwegian) . 0 . Kummeneje AJS Report No . 0.5024.3, 1985.
22. N. Janbu . Soil omprcs ibility as Determined by Oedometcr and Triaxial T ts. Proc. 3rd European Confer nee 011 Soil Mechanics mu/ Fo1111dation E11gl11eeri11g, Wie baden, Gcm1any, Vol. I, 1963, pp. 19- 25 .
23. B. A. Torstensson. The Pore Pressure Probe. Proc., NGF, Geoteknikkdagerr, Oslo, 1977, pp . 34.1-34.15.
24. J . N. Levadoux and M. M. Baligh. Consolidation after Undrained Piezocone Penetration: I, Prediction . Journal of Geotechnical Engineering, Vol. 112, No. 7, 1986, pp. 707-726.
Publicatiorr of !his paper sponsored by Committee on Soil and Rock Properties.