ijdrt issue march-april-2015_article1
TRANSCRIPT

http://www.ijdrt.com 81
Int. J. Drug Res. Tech. 2015, Vol. 5 (2), 81-102 ISSN 2277 - 1506
International Journal of Drug Research and Technology
Available online at http://www.ijdrt.com
Original Research Paper
ENHANCEMENT OF SOLUBILITY AND DISSOLUTION OF CARVEDILOL BY
SOLID DISPERSION TECHNIQUE USING ROTA-EVAPORATION AND
LYOPHILIZATION METHODS
Shivangi Madhok* and Akankasha Madhok
Department of Pharmaceutics, ASBASJSM College of Pharmacy, Bela-140 111, Ropar, India
ABSTRACT
Despite significant advancements in the science of drug delivery, solubilization of poorly aqueous soluble
drugs still remains a challenging task for formulation. The purpose of the study was to improve the
physicochemical properties of poorly aqueous soluble drug carvedilol (CAR) like solubility, dissolution
properties and stability of poorly soluble drug by forming dispersion with skimmed milk powder as carrier.
CAR was formulated by solid dispersions using rota-evaporation method and lyophilization method in
different ratios 1:1, 1:3, 1:5, and 1:7 of drug and carrier (skimmed milk powder). The formulations were
evaluated for various in vitro parameters (Drug content, Drug release, phase solubility studies, dissolution
efficiency, DSC, SEM, XRD) as well as changes in the physical state during storage under different
humidity conditions. Good uniformity of drug content was observed with all formulations and lies between
96.29 % to 99.13 %. All the solid dispersions showed dissolution improvement compare to pure drug. The
solubility was also increased from 23.28 μg/ml in case of carvedilol pure drug to 224.68 μg/ml and 205.31
μg/ml in case of these solid dispersions. The DE60 was also increased from 36.83% to 56.31% and 54.92 %.
The dispersion with skimmed milk powder (1:7) by Rota evaporation Method and Lyophilization Method
(1:5) showed faster dissolution rate (96.1 % and 94.88 % respectively). The tablets were formulated from
the final and stable solid dispersions. These solid dispersions were selected to prepare tablets using Ac-do-
sol as superdisintegrant and Avicel PH102 as diluents. Tablets were characterized for hardness, friability,
disintegration time, percent drug release studies. Tablet T2 showed highest dissolution rate and best
dissolution efficiency at (DE 60) minutes. The similarity factor was calculated for comparison of the
dissolution profile before and after stability studies. The f2 value was found to be more than 50 (~ 94.00)
thereby indicating a close similarity between both the dissolution profiles.
Keywords: Carvedilol (CAR), Skimmed milk powder (SM), Solid dispersions, Rota-evaporation
Method, Lyophilisation method.
INTRODUCTION
Several techniques are commonly used to
improve dissolution and bioavailability of poorly
water-soluble drugs, such as size reduction, the
use of surfactants and the formation of solid
dispersions. The latter are defined as dispersions
of one or more active ingredients in an inert
carrier in the solid state. Mechanisms involved
include increased wettability, solubilisation of the
drug by the carrier at the diffusion layer and
reduction or absence of aggregation and
agglomeration. Moreover, transformation of the
crystalline drug to the amorphous state upon solid
dispersion formulation increases the dissolution
rate since no lattice structure has to be broken
down for dissolution to take place.1 Carvedilol
(CAR), an antihypertensive agent, is used in the
treatment of hypertension, congestive heart
failure, cardiac arrhythmias and angina pectoris.
It is a nonselective β-adrenergic blocker with
selective α-adrenergic blocking. However, drug
Shivangi Madhok et al. International Journal of Drug Research and Technology 2015, Vol. 5 (2), 81-102
http://www.ijdrt.com 82
bioavailability is very limited (25-30%), since it
is practically insoluble in water and its dissolution
is rate limiting for its absorption from gastro-
intestinal tract.2 Also CAR is poorly flowable and
compressible drug. Carvedilol is practically
insoluble in water and exhibits pH-dependant
solubility. Its solubility is <1 μg/ml above pH 9.0,
23 μg/ml at pH 7, and about 100 μg/mL at pH 5 at
room temperature. However, up to fourfold
improvement of carvedilol bioavailability could
be achieved by increasing the carvedilol
solubility.3 The solubility of carvedilol in aqueous
solutions with pH ranging from 1 to 4 is limited
due to its protonation, resulting in “in situ”
hydrochloride salt formation, which exhibits
lower solubility in media containing chlorine ions
due to the common-ion effect. It’s extremely low
solubility at alkaline pH levels may prevent the
drug from being available for absorption in the
small intestine and colon, thus making it a poor
candidate for an extended-release dosage form.
Carvedilol undergoes significant stereoselective
first-pass metabolism, resulting in low absolute
bioavailability (30% or less). However, some
sources suggest that this low bioavailability is the
result of poor aqueous solubility.4
The objective
of the present study was enhancement of
solubility of poorly soluble carvedilol with
Skimmed milk powder by solid dispersion. The
solid binary systems were prepared by
maintaining constant drug concentration and
increasing carrier concentrations using physical
mixing and solvent evaporation techniques. The
skimmed milk is a colloidal suspension of casein
micelles, globular proteins and lipoprotein
particles. The principal casein fractions are ɑ-s1,
ɑ-s2, β-casein and k-casein. β-casein is
amphiphilic and acts as a detergent molecule with
surfactant property. The milk also contains whey
proteins with principle fractions of β-lactoglo-
bulin, ɑ-lactalbumin, bovine serum albumin and
immunoglo- bulins. These molecules were found
to be surface active with superior solubility than
caseins. The lyophilisation procedure was chosen
because it provides protection against heat
denaturation of protein molecules. The objective
of the present study was enhancement of
solubility of poorly soluble carvedilol with
skimmed milk powder by solid dispersion.5 The
dissolution characteristics of SDs were evaluated
and compared with pure.
MATERIALS AND METHODS Materials
Carvedilol (gift sample from Sun pharmaceutical
industries Ltd, India), skimmed milk powder was
purchased from Uttam’s diary (Punjab, India),
sodium hydroxide pellets, methanol, acetone,
methanol LR, TBA, monobasic potassium
phosphate, n-octanol, avicel pH 102, Ac-Di-Sol,
magnesium stearate, Talc. Solid dispersions were
prepared by Rota-evaporation and Lyophilization
methods in four different ratios. Carvedilol and
skimmed milk powder were weighed according to
different weighed ratios.
Methods
Preparation of solid dispersions by rota-
evaporation method
Various ratios of carvedilol (1:1, 1:3, 1:5 and 1:7)
with skimmed milk were prepared. The selected
amount of drug were taken and dissolved in a
minimum amount of acetone. Different ratios of
polymer were taken in pestle mortar. Drug
solution was added in mortar to form a
suspension. The suspension obtained was
transferred in RBF and evaporated in a rotary
evaporator (Heidolph Heivap Advantage ML/GB,
Germany) at a rotation speed of 50 rpm at 50°C
for about 15 min. Passed the dried solid
dispersions through sieve no. # 60 so as to form
uniform granules. The cooled granules were
stored in sealed bags in desiccators for their
evaluation. The prepared samples were compared
for their solubility and dissolution rate studies.
Composition of various solid dispersions prepared
by rota-evaporation enlisted in table 1.6
Preparation of solid dispersions by
lyophilisation technique
Solid dispersions of carvedilol using skimmed
milk powder were prepared by lyophilisation
method. Carvedilol (100 mg) was dissolved in
TBA (20 ml) and required stoichiometric amount
of skimmed milk powder was dissolved in water
(5 ml), both above mentioned solutions were
Shivangi Madhok et al. International Journal of Drug Research and Technology 2015, Vol. 5 (2), 81-102
http://www.ijdrt.com 83
mixed to obtain a homogenous carrier and drug
co-solvent system. Various complexes of
carvedilol with skimmed milk powder were
prepared in ratios of 1:1, 1:3, 1:5, 1:7 as enlisted
in table 2. The resulting solutions were frozen at -
20°C in a deep freezer for 1 h. The resulting
solution (25 ml) was taken into round bottom
flask (RBF) and frozen for 2 h followed with a
condenser temperature of -78.5°C. When
complete freezing was achieved the RBF’s were
removed from freezing chamber, vacuum was
applied and samples were subjected to
lyophilisation for 4 h with vacuum of 0.02 mbar.
A complete sublimation of solvents occurred and
a dried mass (the hydrophobic drug-SM complex
lyophilized powder) remained in the RBF. Dried
powder was removed from the freeze- drier and
placed in the desiccators until used. Composition
of various solid dispersions prepared by
lyophilisation technique has enlisted in table 2.7,8
Experimental Studies
Characterization of solid dispersions
Determination of Percentage Yield and Drug
Content
Drug content of the carvedilol solid dispersions
was calculated by dissolving solid dispersions
equivalent to 12.5 mg of carvedilol in a suitable
quantity of methanol (20 ml), filtered using 45
µm Whattman filter paper, suitably diluted with
methanol and analyzed by using UV
spectrophotometer against methanol as blank.
Similarly, the percentage yield of each
formulation was determined according to the
recoverable final weight of solid dispersions and
the total original weight of carvedilol and carrier.
% Yield = ………………1
In equation 1 a is the weight of the solid
dispersion, b is the weight of carvedilol taken for
solid dispersion preparation, and c is the weight
of skimmed milk powder taken for solid
dispersion preparation.9
Solubility of solid dispersions
Solid dispersions equivalent to 12.5 mg were
added to 20 ml of phosphate buffer pH 6.8 in
screw capped vials. The vials were capped
properly and shaken at 37 ◦C in a temperature
controlled water bath for 48 h. Resultant samples
were centrifuged and filtered, suitably diluted
with phosphate buffer pH 6.8 and analyzed by
UV spectrophotometer at 285.5 nm.
In vitro dissolution studies
Dissolution studies were conducted by using USP
XXIV paddle method (apparatus 2) official in
USP. The stirring rate was 100 rpm. Phosphate
buffer pH 6.8 was used as dissolution medium
(900 ml) and was maintained at 37±0.5◦C.
7 A 5
ml aliquot of sample was withdrawn at 5, 10, 15,
20, 25, 30, 35, 40, 45, 50, 55, 60 min. The
samples were filtered using Whatman filter paper.
The collected samples were suitably diluted and
analyzed for carvedilol content by UV
spectrophotometric method at 285.5 nm. The
volume withdrawn at each time interval was
replaced with equal volume of fresh dissolution
media. Dissolution studies were performed in
triplicate and mean values were taken. A model
independent approach, dissolution efficiency
(DE) was employed to evaluate the dissolution
rate of carvedilol from solid dispersion. DE is
defined as the area under the dissolution curve up
to the time t, (measured using trapezoidal rule)
expressed as a percentage of the area of the
rectangle described by 100 % dissolution in the
same time. DE60 was calculated from the
dissolution data from equation 2 and used for
comparison.
DE % = …………….. 2
Infrared spectroscopy
The infrared spectra (IR) of the samples was
performed on fourier transformed infrared
spectrophotometer (Perkin Elmer 400 spectrum
USA). The pellets of the drug and KBr were
prepared on KBr press. The spectra were scanned
over wave number range of 4000 to 400 cm-1
at
ambient temperature.
X-Ray Diffraction (XRD)
The X-ray diffraction patterns were recorded
using XPERT-PRO diffractometer with Cu Kα
filter generated at 45kV voltage and 40mA
current over a diffraction angle of 2θ.

Shivangi Madhok et al. International Journal of Drug Research and Technology 2015, Vol. 5 (2), 81-102
http://www.ijdrt.com 84
Differential Scanning Calorimetry (DSC)
A differential scanning calorimeter (4000 Perkin
Elmer, USA) was used to determine the degree of
drug crystallinity in solid dispersions. About 2-4
mg of sample in open aluminium standard pan
was heated at a scanning rate of 20 /min from a
temperature -50 to 220 under nitrogen gas
flow.
Scanning Electron Microscopy (SEM)
The morphology of carvedilol, skimmed milk
powder and solid dispersions were determined
using a scanning electron microscope (SEM)
(Jeol model JSM-6610, JAPAN) operated at an
accelerating voltage of 3 kV. Samples were
prepared by mounting powder on to a brass stub
using graphite glue and coated with gold under
vacuum before use.
Preparation of Tablets
Formulation of blends
The selected solid dispersions of carvedilol CAR
4, CAR 7 and excipients such as superdisintegrant
(Ac-Di-Sol) and Avicel PH 102 as diluents were
co-grounded in a pestle mortar and passed
through sieve no. 60. Finally talc and magnesium
stearate were added and mixed for 5 min.
Characterization of Blend
Bulk density
The bulk density (ρb) of the blend was determined
by pouring the blend into a graduated cylinder.
The bulk volume (Vb) and weight of powder (M)
was determined. The bulk density was calculated
using the (equation 3).
ρb = M/ Vb …………………………...3
Tapped density
The tapped density was determined by tapping the
measuring cylinder containing a known mass of
blend 100 times using density apparatus. Vt i.e.
the minimum volume occupied in the cylinder
and the weight (M) of the blend was determined.
The tapped density (ρt) was calculated by the
given formula (equation 4)
ρt = M/ Vt …………………………… 4
Compressibility index
The simplest way for measurement of flow of the
powder is its compressibility, an indication of the
ease with which a material can be induced to
flow. It is expressed as compressibility index (I)
which can be calculated as follows (equation 5)
I= ρt-ρb/ρt × 100 ………………….. 5
Where, ρt = tapped density
ρb = bulk density
Angle of repose
It was determined by the funnel method in which
the blend was poured through a funnel that can be
raised vertically until a specified cone height (h)
was obtained. Radius (r) and the height of the
heap formed was measured and angle of repose
(θ) was calculated using the formula (equation 6)
tan θ= h/r ; θ= tan-1
(h/r) …………….. 6
Hausner’s ratio
Hausner ratio (Hr) is an indirect index of ease of
powder flow. It is calculated by the following
formula (equation 7)
Hr = ρt/ρb ………………………….. 7
Where, ρt is tapped density and
ρb is bulk density
Low Hausner’s ratio i.e < 1.25 indicates better
flow properties
Preparation of Tablets
The tablets of selected solid dispersion CAR 4
AND CAR 7 weighing 200 mg were prepared by
direct compression method by using 8 mm
concave die punch set with single punch machine.
Each tablet contained solid dispersions equivalent
to 10 mg of carvedilol. The formula for tablet is
as follows in table 3.
Characterization of tablets
After compression of powder the tablets were
evaluated for organoleptic properties such as
colour, odour, taste, thickness, hardness,
friability, content uniformity, disintegration time
and in vitro dissolution studies.
General Appearance
The general appearance of a tablet, its visual
identification and over all elegance is essential for
consumer acceptance. This includes tablet’s size,
shape, colour, presence or absence of an odour,
taste, surface texture, physical flaws etc.

Shivangi Madhok et al. International Journal of Drug Research and Technology 2015, Vol. 5 (2), 81-102
http://www.ijdrt.com 85
Tablet Thickness
Thickness of the tablet is an important
characteristic in reproducing appearance and also
in counting by suing filling equipment. Some
filling equipment utilizes the uniform thickness of
the tablets as a counting mechanism. Ten tablets
were taken and their thickness was recorded using
micrometer (Mityato, Japan).
Weight Variation
In this case twenty tablets were taken and their
weight was determined individually and
collectively on a digital weighing balance. The
average weight of one tablet was determined from
the collective weight. The weight variation of
each tablet was determined. The weight variation
test would be satisfactory method of determining
the drug content uniformity.
Friability
Friability of the tablets was determined using
Roche friabilator. In this the tablets were
subjected to the combined effect of abrasions and
shock in a plastic chamber revolving at 25 rpm
and dropping the tablets at the height of 6 inches
in each revolution. Pre-weighed sample of tablets
are placed in the friabilator and were subjected to
100 revolutions. The friability (% F) was
determined by the formula (equation 8)
% F = (1-W°/W) × 100 ………………. 8
Where, %F is percentage friability
W° is initial weight of the tablets before test
W is the final weight of the tablets after test
Hardness
Hardness of tablet is defined as the force applied
across the diameter of the tablet in order to break
the tablet. The resistance of the tablet to chipping,
abrasion or breakage under conditions of storage,
transportation and handling before usage depends
on its hardness. Hardness of the tablet of each
formulation was determined using Pfizer hardness
tester.
Content Uniformity
Ten tablets were randomly selected, weighed and
powdered in a glass mortar pestle. The weight of
the powder equivalent to 10 mg of carvedilol was
weighed and dissolved in 20 ml of methanol in
volumetric flask. 10 ml of this solution was taken
and volume was made upto 100 ml with methanol
and the solution was filtered. An aliquot of 1.0 ml
of solution were diluted to 10 ml methanol in
separate volumetric flask. The content uniformity
in each formulation was determined
spectrophotometrically at 286 nm.
In Vitro Disintegration Test
In vitro disintegration time was determined using
disintegration test apparatus. In this case, one
tablet was placed in each of six tubes of apparatus
and a disc was added to each tube i.e. 3 inches
long, opens at the top, and held against a 10 mesh
screen at the bottom end of the basket rack
assembly. The basket rack assembly was
positioned in a 1 litre of phosphate buffer pH 6.8.
The time taken for the tablet to disintegrate
completely and pass through the screen was
measured.
In Vitro Dissolution Test
In vitro dissolution studies of tablets were
performed in phosphate buffer pH 6.8 using
rotating paddle method. A tablet was added to
900 ml of phosphate buffer pH 6.8 at 100 rpm at
37 C ± 0.5
C. 5 ml of aliquots were withdrawn at
5, 10, 15, 20, 25, 30, 35, 40, 45, 50, 55, 60 min
and immediately filtered through Whatmann filter
paper no. 41. At each sampling, an equal volume
of fresh medium was added. The concentration of
carvedilol was measured spectrophotometrically
at 285.5 nm. The dissolution efficiency (% DE60)
of the tablets was determined in order to compare
with the marketed tablet.
Stability Studies
Carvedilol tablets were kept in ambered coloured
bottles and the stability studies of CAR tablets
were checked as per ICH guidelines at 40 ± 2◦C
and 75 ± 5% RH up to 3 months. During the
study period the formulations were withdrawn at
predetermined time intervals of 0, 15, 30, 45, 60,
75, and 90 days for change in physical
characterization, drug content and in vitro
dissolution studies. FDA has placed more
emphasis on a dissolution profile comparison in
the area of post- approval changes. Among
several methods investigated for dissolution

Shivangi Madhok et al. International Journal of Drug Research and Technology 2015, Vol. 5 (2), 81-102
http://www.ijdrt.com 86
profile comparison, f2 (similarity factor) is the
simplest. Moore and Flanner proposed a model
independent mathematical approach to compare
the dissolution profile using similarity factor (f2).
The similarity factor (f2) is a logarithmic
reciprocal square root transformation of the sum
of square errors and is a measurement of the
similarity in the percent (%) dissolution between
the curves. Generally similarity factor in the
range of 50-100 is acceptable according to US
FDA and it was determined by the formula
(equation 9).10
f2 = 50 log {[1+ 2]-0.5 *100 …..9
Where, n is the no. of time points, Rt is the
dissolution value of the reference batch
(prechange) at time t and Tt is the dissolution
value of the test batch (postchange) at time t.
RESULTS AND DISCUSSION
Percentage Yield
The % yield was calculated to know about %
yield or efficiency of any method which helps in
selection of appropriate method of production.
The decrease in % yield which is attributed to
difficulty of sieving (table 4 and figure 1).
Drug Content
The drug content of the prepared solid dispersions
was found to be in the range of 96.29-99.13 %
indicating the application of present methods for
the preparation of solid dispersions with high
content uniformity (table 4).
Solubility Studies
Solubility of drug increased with the increase in
the ratio of polymer. But in case of CAR 7 molar
ratio of 1:7 solid dispersion the solubility of drug
decreased due to less drug-polymer entrapment
(table 5 and figure 2).
Dissolution Studies
The in vitro release profile of carvedilol and all
solid dispersions CAR 1, CAR 2, CAR 3, CAR 4,
CAR 5, CAR 6, CAR 7 and CAR 8 are shown in
table 6 and table 7. Figure 3 and figure 4 showed
the comparison of cumulative percent drug
released versus time. In all the cases, cumulative
percent released was much greater than pure
carvedilol. The dissolution rates were enhanced
with increasing concentration of polymer. Higher
dissolution rates were shown by the solid
dispersions of drug with skimmed milk powder as
compared to the pure drug.
Pure carvedilol yielded the slowest percent
release due to its hydrophobic property causing
the powder to float on the surface of the
dissolution media and prevented its surface to
make contact with the medium for initial time
intervals. Hence the enhancement of the
carvedilol dissolution rate by solid dispersion
technique compared with that of the pure drug
could presumably be explained by the following
factors: 1) surfactant properties of the carrier 2)
low viscosity of the carrier 3) a decrease in
crystallinity and size of the drug crystals in the
solid dispersions 4) increased solubility of the
drug.
When the mixture comes in contact with the
media, the polymer particles might have hydrated
rapidly into polymer solution solubilises the
adjacent drug particles and subsequently releases
the drug into the medium.
Dissolution Efficiency
Dissolution efficiency of pure carvedilol, solid
dispersions prepared with skimmed milk powder
by different methods at 60 min were calculated
which is shown in table 8 and comparison of %
DE60 of different formulations is shown in figure
5.
FTIR Studies: FTIR (Fourier Transform
Infrared Spectroscopy)
The IR spectra of SDs were compared with the
standard spectrum of carvedilol. FTIR spectrum
of carvedilol, skimmed milk powder and their
solid dispersions are shown in figure 6, figure 7,
figure 8, figure 9, and figure 10. From the FTIR
study it was found that some of the peaks of the
drugs were shifted broadened, some present with
reduced intensity and some vanished. This was
referred to formation of a complex between the
drug and carrier. Complexation was leading to
formation of an amorphous form of drug with
skimmed milk powder by solid dispersion leading
to improve the dissolution rate of drug.
Solubility profile of Carvedilol solid dispersions

Shivangi Madhok et al. International Journal of Drug Research and Technology 2015, Vol. 5 (2), 81-102
http://www.ijdrt.com 87
X-RD (X-Ray Diffraction) Studies
X-RD pattern of CAR (figure 11) showed several
sharp high intensity peaks at diffraction angle 2θ
of 5.9666, 17.546, 17.7051 and 18.5126, which
suggested CAR as crystalline material. Table 5.7
shows XRD data of CAR and physical mixture.
XRD pattern of skimmed milk powder (figure 12)
showed its amorphous nature. XRD pattern of
physical mixture (figure 13) showed several
characteristic sharp peaks of CAR at diffraction
angles of 2θ of 5.9884, 17.1862, 17.7061 and
18.6132. Significant peaks of both carvedilol and
skimmed milk powder were present in physical
mixture and slight significant shift in the peaks
was observed, which suggested very less to no
chemical interaction between drug and polymer.
A total drug amorphization were observed in the
XRD diffractogram of CAR-SM rota evaporated
solid dispersion in drug/ polymer ratio 1:7 (CAR
4) and lyophilized solid dispersion in drug/
polymer ratio 1:5 (CAR 7) only two broad peaks
at diffraction angle 2θ of 16.54°, 19.34° and
16.54°, 27.67° respectively corresponding to the
diffraction pattern of drug were recorded while
other peaks of carvedilol crystals were completely
disappeared thus suggesting that CAR 4 and CAR
7 inhibited the crystallization of carvedilol
through the formation of complex. XRD of solid
dispersions are shown in fig 14 and figure 15.
SEM (Scanning Electron Microscopy)
SEM images of pure carvedilol, skimmed milk
powder, physical mixture and solid dispersions
are shown in figure 16, figure 17, figure 18,
figure 19, figure 20 and figure 21. The pure
carvedilol shown in figure 16, figure 17 at
different magnifications showed blunt crystals.
The parent carvedilol crystals were in the form of
rod shaped crystals, which is in confirmation with
the earlier report. This rod shaped form of
carvedilol leads to very poor flow and
compression difficulties. The prepared solid
dispersion agglomerates were spherical to larger
extent and remaining was irregular in shape with
smooth surface, which enabled them flow very
easily. In case of solid dispersions figure 18,
figure 19, figure 20 and figure 21. It was difficult
to distinguish the presence of carvedilol crystals
appeared to be incorporated into particles of the
skimmed milk powder.
DSC (Differential Scanning Calorimetry)
The characteristic endothermic peak,
corresponding to drug melting point disappeared
in solid dispersions. This might be due to higher
polymer concentration and uniform distribution of
drug in the crust of polymer, resulting in complete
miscibility of molten drug in polymer. Absence of
peak for the drug indicates that the drug is
distributed homogenously in an amorphous state
within the solid dispersions without any
interaction. No characteristic melting peak of
CAR i.e. 119.17 °C was found in DSC curves of
CAR 4 as shown in figure 25 and CAR 7 as
shown in figure 26 solid dispersions. The peaks in
the solid dispersions (CAR4 and CAR 7)
appeared at 95.42°C, 149.59°C and 95.42°C,
136.36°C respectively. Thus clearly indicated that
drug was in an amorphous state which confirmed
the results obtained from XRD.
Formulation and Characterization of Tablets
The tablets were made of the final and stable
formulation CAR 4 and CAR 7. Total two
formulations were formulated and designated as
T1and T2. The characterization of mixed blend
was performed for the flow property of powder
which includes bulk density, tapped density,
hausner’s ratio, compressibility index, angle of
repose as shown in table 9 for quality control
parameters like hardness, thickness, friability,
disintegration time, in vitro dissolution studies
and drug content are shown in table 10. Drug
content in the selected solid dispersions as shown
in table 11. Dissolution efficiency of all the
tablets were calculated at 60 min and data is
shown in table 12. Flowability of CAR and its
tablet blend was determined. HR and angle of
repose was much improved compared to those of
original powder (untreated carvedilol). In case of
pure CAR powder couldnot pass through the
funnel during the angle of repose experiment. The
poor flow of CAR could be due to the irregular
shape and high fineness of the powder, which
posed hurdles in the uniform flow from the
funnel. It is obvious from CI value that the flow
of untreated CAR is extremely poor due to high

Shivangi Madhok et al. International Journal of Drug Research and Technology 2015, Vol. 5 (2), 81-102
http://www.ijdrt.com 88
cohesivity and adhesivity. Because of poor
flowability and compatibility of untreated CAR
powder. The micrometric properties of CAR can
be improved forming tablet blends using
magnesium stearate (antiadherent) and talc
(glidant, lubricant). All tablet blends showed
lower CI than untreated CAR, which is an
identical improvement in flow behaviour of the
particles could be due to an increase in true
density of CAR powders as shown in table 9. The
difference in the bulk density of CAR samples
may be related to their markedly different crystal
habbits, leading to different contact points and
frictional, cohesive forces between the crystals.
These are in good agreement morphology of CAR
4 and CAR 7 tablet blends. Dissolution was
carried out on the tablets and marketed
preparation. The in vitro release data in table 12
indicated that the maximum drug release was
found in T2. Dissolution profile of carvedilol
from marketed tablet and best formulations (T1
and T2) are shown in figure. 27. In vitro release
studies reveal that there is marked increase in
dissolution efficiency of carvedilol from all the
solid dispersions when compared to marketed
tablet. From the in vitro drug release profile, it
can be seen that formulation CAR 4 containing
SM (1:7 ratio of drug : SM) and CAR 7
containing SM (1:5 ratio of drug : SM) showed
higher dissolution efficiency compared with
marketed tablet i.e., 54.25 % and 58.61%
respectively in 60 min. The results in vitro drug
release of CAR solid dispersion tablets (T1 and
T2) indicated that no dissolution was achieved for
marketed tablet with only 57.66 % dissolved after
60 min. Results in table 13 showed that the
dissolution of marketed tablet was slowest as
compared to solid dispersion tablets (T1 and T2)
which showed significant enhancement in CAR
dissolution because as the soluble carrier
dissolves the insoluble drug gets exposed to
dissolution media in the form of very fine
particles which dissolves quickly. The
disintegrant Ac-Di-Sol shows the faster
disintegration and thus enhances the dissolution
rate of tablets. The evident improvement obtained
with rota evaporated products was a consequence
of the closer contact between the components and
the better dispersion of the drug into the
hydrophilic carrier obtained through rota
evaporated technique.
Stability Studies
The T2 formulation showed no significant
variation in all the parameters under the test
period at different conditions i.e. (40 ± 2 °C and
75 ± 5 % RH). The results are shown in table 14
and in vitro release studies has enlisted in table
14. There was no significant variation in the in
vitro drug release profile over a period of three
months as shown in figure 28. The similarity
factor was calculated for comparison of the
dissolution profile before and after stability
studies. The f2 value was found to be more than
50 (~ 94.00) which indicated a close similarity
between both the dissolution profiles (T2 and S2)
dissolution profile of T2 and S2 tablets were
shown in table 15.
Hence, the results of the stability studies
confirmed that the developed formulation is very
stable.11
CONCLUSION
The objective of the present study was to improve
the solubility and dissolution behaviour of the
poorly water soluble drug Carvedilol by solid
dispersion technique using skimmed milk powder
as carrier. Results from the present study suggest
that the low oral bioavailability of CAR could be
well circumvented by lyophilisation monophase
solution technology and rota evaporation
technique. Complexation with SM significantly
improved the dissolution rate of CAR through a
number of factors such as drug amorphization and
increased drug high degree of porosity. The
present results showed that the solid dispersion
and the solvent evaporation (rota evaporation
method and lyophilisation method) seem to
possess great potential to significantly enhance
the solubility and dissolution rate of poorly
soluble drugs. Results showed that in rota
evaporation technique carvedilol was absorbed
after equilibrium in acetone solution. Thus this
method was suitable to produce dispersions with
best distribution of drug within the carrier in thin
Shivangi Madhok et al. International Journal of Drug Research and Technology 2015, Vol. 5 (2), 81-102
http://www.ijdrt.com 89
layer and as a consequent best possible drug
release. TBA was found to be an excellent freeze-
drying medium. It is miscible with water in any
proportion. It possesses a very high vapour
pressure (41.25 mmHg at 25°C), a high melting
point (24°C) and has a low toxicity. Moreover,
adding TBA to water results in formation of
larger needle- shaped ice crystals with a higher
surface area and porosity than round ice crystals
that can facilitate sublimation. All these factors
contribute TBA as an ideal freeze- drying
medium that could be removed rapidly and
completely by freeze- drying. Among all the
prepared formulations, the rota evaporates i.e.
CAR 4 solid dispersion prepared by SM and
lyophilized dispersion i.e. CAR 7 prepared by SM
showed marked increase in the solubility as well
as dissolution when compared to pure drug and
marketed formulation. Physical characterization
of prepared solid dispersions have also been
performed by DSC, FTIR, XRD and SEM to find
the evidence of interaction and XRD analysis
showed that there was a considerable decrease in
the crystallinity of the drug which increased the
surface area thereby increasing the dissolution
and enhancement in the drug release. Freeze dried
solid dispersions in 1:7 ratios (CAR-SM) and rota
evaporated solid dispersions 1:8 ratios (CAR-SM)
were proven to be advantageous in context of
enhancing carvedilol dissolution characteristics in
basic medium. SEM photograph of solid
dispersions (CAR-SM) clearly revealed a change
in the morphology of the drug particles. The
formation of amorphous aggregates was observed
in CAR 4 and CAR 7 solid dispersions. The
selected solid dispersion with the best ratio from
each method were formulated into tablets using
Avicel PH102 (diluents), Ac-Di-Sol
(superdisintegrant), talc and magnesium stearate
as excipients. In vitro results demonstrated that
rotaevaporated and lyophilized solid dispersion
tablets (T1 and T2) containing carvedilol can
result in rapid dissolution of carvedilol at
intestinal pH.
The developed tablets (T1 and T2) may be an
alternative to conventional oral tablets of
carvedilol which usually suffers from a slow
dissolution and poor solubility and low oral
bioavailability. The physical stability of the final
formulations proved to be unchanged after the
storage upto 3 months at accelerated stability
condition (40 ± 2 C and 75 ± 5 % RH).
AKNOWLEDGEMENT
The author’s wishes to thank Ankur Laboratories
Pvt. Ltd. and Sun Pharma, Mumbai for gift
sample of Carvedilol. The author also offers
special thanks to Loba Chemie Pvt. Ltd. for
providing various chemicals without which the
present work would not have been completed.
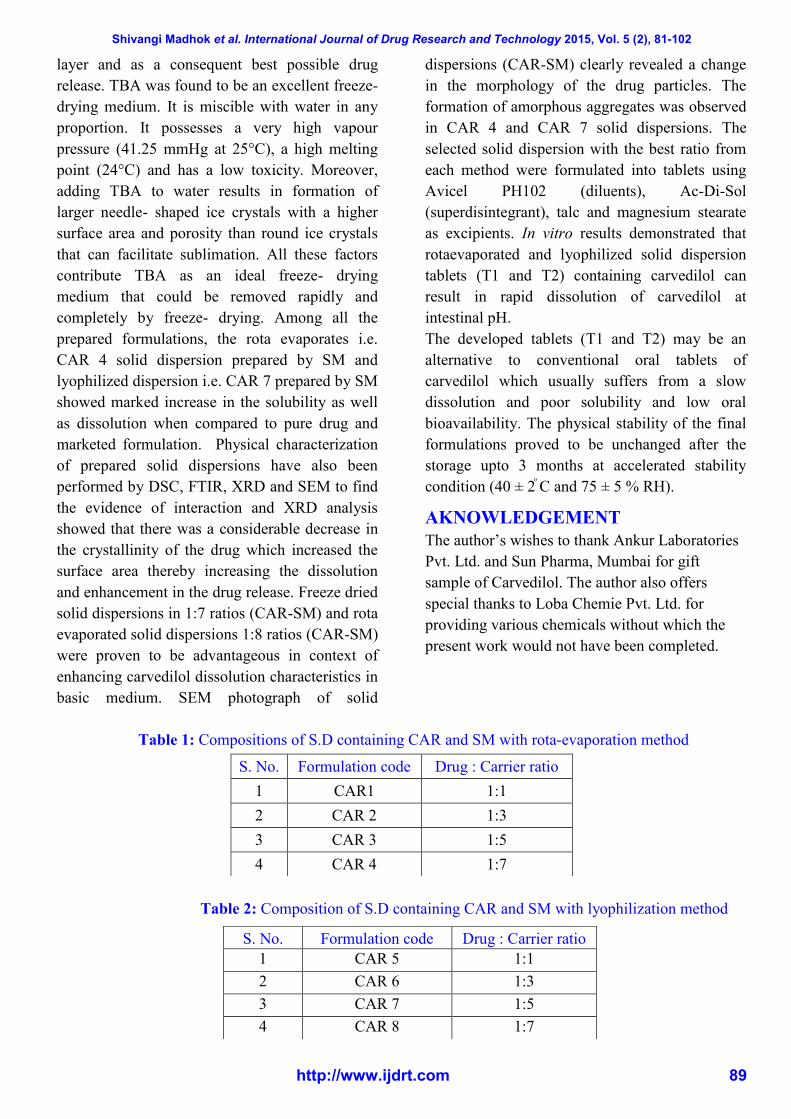
Table 1: Compositions of S.D containing CAR and SM with rota-evaporation method
Table 2: Composition of S.D containing CAR and SM with lyophilization method
S. No. Formulation code Drug : Carrier ratio
1 CAR1 1:1
2 CAR 2 1:3
3 CAR 3 1:5
4 CAR 4 1:7
S. No. Formulation code Drug : Carrier ratio
1 CAR 5 1:1
2 CAR 6 1:3
3 CAR 7 1:5
4 CAR 8 1:7

Shivangi Madhok et al. International Journal of Drug Research and Technology 2015, Vol. 5 (2), 81-102
http://www.ijdrt.com 90
Table 3: Composition of optimized solid dispersion tablets
Ingredients Weight (mg) Weight (mg)
SD 1:5 (T1) 60 -
SD 1:7 (T2) - 80
Ac-Di-Sol 8 8
Avicel pH 102 120 100
Talc 6 6
Magnesium stearate 6 6
Table 4: Percent yield and percent drug content of S.D with rota-evaporation method
and lyophilization method
Formulation code
% Yield % Drug Content
CAR 1 83.2% 97.12±0.385
CAR 2 82.6% 98.18±0.669
CAR 3 79.03% 96.29±0.266
CAR 4 80.38% 99.13±0.259
CAR 5 84.2% 97.12±0.385
CAR 6 83.6% 98.18±0.669
CAR 7 78.03% 96.29±0.266
CAR 8 79.01% 98.15±0.259 All results were calculated as mean ± SD, n=3
Figure 1: Percentage yield of different solid dispersions of carvedilol.
Table 5: Solubility of S.D with rota-evaporation method and lyophilization method
All results were calculated as mean ± SD, n=3
Formulation code Solubility (µg/ml)
CAR 1 43.43±0.010
CAR 2 117.5±0.021
CAR 3 150.62±0.019
CAR 4 224.68±0.017
CAR 5 66.56±0.010
CAR 6 186.75±0.021
CAR 7 205.31±0.019
CAR 8 65.98±0.017

Shivangi Madhok et al. International Journal of Drug Research and Technology 2015, Vol. 5 (2), 81-102
http://www.ijdrt.com 91
Figure 2: Solubility studies of different solid dispersions of carvedilol
Table 6: Dissolution profile of pure CAR AND SM with rota-evaporation method
Cumulative Mean Percent Released ± S.D.
Time (min) Pure Drug CAR 1 CAR 2 CAR 3 CAR 4
5 10.8±0.265 20.85±0.422 20.48±0.23 27.23±0.215 23.18±0.225
10 11.69±0.240 27.62±0.340 22.73±0.225 30.38±0.225 33.39±0.127
15 12.82±0.220 30.83±0.450 25.14±0.225 33.76±0.225 33.99±0.23
20 13.72±0.225 31.74±0.22 31.26±0.230 36.54±0.132 39.76±0.127
25 16.03±0.155 34.36±0.341 33.71±0.225 38.11±0.132 42.66±0.098
30 17.55±0.225 38.41±0.345 37.81±0.132 41.11±0.127 44.16±0.132
35 18.69±0.23 39.39±0.225 41.28±0.178 58.6±0.132 67.36±0.132
40 19.8±0.225 40.81±0.341 42.36±0.121 67.98±0.225 69.95±0.250
45 21.6±0.220 41.41±0.225 44.95±0.23 77.88±0.21 88.40±0.127
50 22.93±0.196 49.45±0.346 60.08±0.210 88.11±0.414 90.48±0.215
55 25.03±0.240 54.40±0.853 72.98±0.121 91.71±0.161 94.45±0.127
60 27.23±0.215 65.85±0.127 73.7±0.167 92.86±0.121 96.1±0.215 All results were calculated as mean ± SD, n=3
Table 7: Dissolution profile of pure CAR and SM with lyophilization method
Cumulative Mean Percent Released ± S.D.
Time (min) Pure Drug CAR 5 CAR 6 CAR 7 CAR 8
5 10.8±0.265 22.73±0.225 20.27±0.2 22.28±0.225 22.73±0.225
10 11.69±0.240 27.91±0.23 22.73±0.225 30.16±0.22 27.91±0.23
15 12.82±0.220 30.18±0.368 25.13±0.341 33.54±0.22 30.01±0.568
20 13.72±0.225 30.61±0.389 31.96±0.225 37.74±0.132 30.9±0.469
25 16.03±0.155 31.74±0.22 37.81±0.225 38.4±0.236 31.96±0.593
30 17.55±0.225 35.48±0.127 40.21±0.127 43.89±0.225 35.56±0.225
35 18.69±0.23 36.76±0.345 42.54±0.225 67.31±0.23 36.76±0.345
40 19.8±0.225 41.26±0.341 45.02±0.23 70.01±0.225 41.26±0.341
45 21.6±0.220 48.62±0.675 49.97±0.225 86.09±0.121 48.62±0.675
50 22.93±0.196 49.82±0.341 65.88±0.127 90.02±0.255 49.96±0.226
55 25.03±0.240 63.56±0.564 67.46±0.132 92.5±0.215 63.56±0.564
60 27.23±0.215 69.56±0.45 76.72±0.127 94.88±0.121 69.56±0.45 All results were calculated as mean ± SD, n=3

Shivangi Madhok et al. International Journal of Drug Research and Technology 2015, Vol. 5 (2), 81-102
http://www.ijdrt.com 92
Figure 3: In vitro dissolution profile of pure CAR and SM with rota-evaporation method
Figure 4: In Vitro dissolution profile of pure CAR and SM with lyophilization method
Table 8: Dissolution efficiency of solid dispersions prepared by different methods
Formulation
code
% DE60
CAR 1
36.83±0.353
CAR 2
39.13±0.191
CAR 3
53.15±0.276
CAR 4
56.31±0.167
CAR 5
37.82±0.356
CAR 6
40.59±0.190
CAR 7
54.92±0.202
CAR 8
39.94±0.409 All results were calculated as mean ± SD, n=3
Figure 5: Comparison of % DE60 of different formulations

Shivangi Madhok et al. International Journal of Drug Research and Technology 2015, Vol. 5 (2), 81-102
http://www.ijdrt.com 93
Figure 6: FTIR spectrum of pure carvedilol
Figure 7: FTIR spectrum of skimmed milk powder
Figure 8: FTIR spectrum of physical mixture
RC SAIF PU, Chandigarh
Spectrum Name: Shivangi Madhok-1.sp Description: D
Date Created: thu dec 20 15:25:38 2012 India Standard Time (GMT+5:30)
4000.0 3600 3200 2800 2400 2000 1800 1600 1400 1200 1000 800 600 450.0
0.0
5
10
15
20
25
30
35
40
45
50
54.0
cm-1
%T
3344
3059
2995
2966
2923
2878
2837
2633
2078
2020
1944
1888
1781
1667
1629
1607
1589
1503
1451
1403
1347
1333
1305
1285
1254
1215
1176
1156
1118
1098
10411021
978
956
915
850
800
783
748722
654
619
568
536
507
465
RC SAIF PU, Chandigarh
Spectrum Name: Shivangi Madhok-2.sp Description: P
Date Created: thu dec 20 15:27:05 2012 India Standard Time (GMT+5:30)
4000.0 3600 3200 2800 2400 2000 1800 1600 1400 1200 1000 800 600 450.0
42.0
44
46
48
50
52
54
56
58
60
62
64
66
68.3
cm-1
%T
3384
2932
2900
1655
1546
1438
1393
1341
1260
1202
1168
1143
1117
1094
1071
1031
1019
988
898
876
780
669
631
606
552
465
RC SAIF PU, Chandigarh
Spectrum Name: Shivangi Madhok-3.sp Description: D/P
Date Created: thu dec 20 15:28:38 2012 India Standard Time (GMT+5:30)
4000.0 3600 3200 2800 2400 2000 1800 1600 1400 1200 1000 800 600 450.0
26.6
28
30
32
34
36
38
40
42
44
46
48
50
52
54
56
58
60
62
63.7
cm-1
%T
3527
3345
2932
2900
1655
1587
1546
1509
14541443
1394
1359
1346
1305
1259
1215
1202
1169
1142
1118
1094
1072
1058
1032
1019
988
915
899
876
849
781
759
747
728
720
670
632605
565
552
467

Shivangi Madhok et al. International Journal of Drug Research and Technology 2015, Vol. 5 (2), 81-102
http://www.ijdrt.com 94
Figure 9: FTIR spectrum of CAR 4
Figure 10: FTIR spectrum of CAR 7
Figure 11: X-RD pattern of Carvedilol
RC SAIF PU, Chandigarh
Spectrum Name: Shivangi Madhok-4.sp Description: SD-1:5 L
Date Created: fri may 31 13:17:55 2013 India Standard Time (GMT+5:30)
4000.0 3600 3200 2800 2400 2000 1800 1600 1400 1200 1000 800 600 450.0
11.0
14
16
18
20
22
24
26
28
30
32
34
36
38
40
42
44
46
48
50
53.0
cm-1
%T
3526
3382
3342
2932
2900 1655
1607
1505
1454
1440
1394
1345
1305
1255
1221
1167
1115
1095
1072
1058
1036
1020
915
899
876
754
722
672
631
605
552
469
RC SAIF PU, Chandigarh
Spectrum Name: Shivangi Madhok-5.sp Description: SD-1:7 R
Date Created: fri may 31 13:25:55 2013 India Standard Time (GMT+5:30)
4000.0 3600 3200 2800 2400 2000 1800 1600 1400 1200 1000 800 600 450.0
2.5
4
6
8
10
12
14
16
18
20
22
24
26
28
30
32
34
36
36.9
cm-1
%T
3526
3382
3344
2976
2933
2900
2067
1656
1607
1585
1538
1506
1454
1440
1393
1359
1344
1305
1257
1221
1202
1168
1142
1116
1095
1072
1058
1035
1019
988
915
899
875
843
779
755
721
671
631
604
566
551
468

Shivangi Madhok et al. International Journal of Drug Research and Technology 2015, Vol. 5 (2), 81-102
http://www.ijdrt.com 95
Figure 12: X-RD pattern of skimmed milk powder
Figure 13: X-RD pattern of physical mixture
Figure 14: X- Ray diffraction of S.D. CAR 4

Shivangi Madhok et al. International Journal of Drug Research and Technology 2015, Vol. 5 (2), 81-102
http://www.ijdrt.com 96
Figure 15: X- Ray diffraction of S.D. of CAR 7
Figure 16: SEM image of CAR at 1,000 X
Figure 17: SEM image of CAR at 1,500 X

Shivangi Madhok et al. International Journal of Drug Research and Technology 2015, Vol. 5 (2), 81-102
http://www.ijdrt.com 97
Figure 18: SEM image of S.D. of CAR 4 with rota evaporation method at 750 X
Figure 19: SEM image of S.D. of CAR 4 WITH rota evaporation method at 3,000 X
Figure 20: SEM image of S.D. of CAR 7 with lyophilization method at 1,300X
Figure 21: SEM image of S.D. of CAR: SM (1:5) with lyophilization method at 1500 X

Shivangi Madhok et al. International Journal of Drug Research and Technology 2015, Vol. 5 (2), 81-102
http://www.ijdrt.com 98
Figure 22: DSC Themogram of carvedilol
Figure 23: DSC Themogram of Skimmed Milk Powder
Figure 24: DSC Themogram of physical mixture
Figure 25: DSC Themogram of CAR 4

Shivangi Madhok et al. International Journal of Drug Research and Technology 2015, Vol. 5 (2), 81-102
http://www.ijdrt.com 99
Table 9: Characterization of blends of selected SD tablets
Formulation
Code
Bulk Density
(g/cm3)
Tapped Density
(g/cm3)
Hausner’s Ratio
(Hr)
Compressibility
Index (%) (CI)
Angle of Repose ( )
T1 0.532 ± 0.62 0.637 ± 0.18 1.079 ± 0.67 12.26 ± 0.53 28.09 ± 0.17
T2 0.567 ± 0.04 0.641 ± 0.03 1.130 ± 0.15 11.54 ± 0.01 27.88 ± 0.01
Data is expressed in mean ± S.D (n=3)
Table 10: Characterization of selected solid dispersion tablets
Formulation
Code
Thickness
(mm)
Hardness
(kg/cm2)
Weight
Variation (mg)
Friability
(%)
Disintegration
Time (minutes)
T1 3.32 ± 0.76 3.4 ± 0.58 193 ± 1.98 0.50 ± 0.19 6 ± 0.01
T2 3.36 ± 0.70 3.3 ± 0.59 191 ± 1.96 0.51 ± 0.12 5 ± 0.01
Data is expressed in mean ± S.D (n=3)
Table 11: Drug content in the selected solid dispersion tablets
Formulation Code Drug Content (mg/tablet) Drug Content (%)
T1 9.72 ± 0.022 97.2
T2 9.85 ± 0.013 98.5
Data is expressed as mean ± S.D (n=3)
Table 12: Dissolution efficiency of selected formulation tablets and marketed tablet
S. No. Formulation code Dissolution efficiency (% DE60)
1 Marketed tablet 28.67
2 T1 54.25
3 T2 58.61
Figure 27: Dissolution profile of carvedilol from marketed tablet and best formulations (T1 AND T2)
Shivangi Madhok et al. International Journal of Drug Research and Technology 2015, Vol. 5 (2), 81-102
http://www.ijdrt.com 100
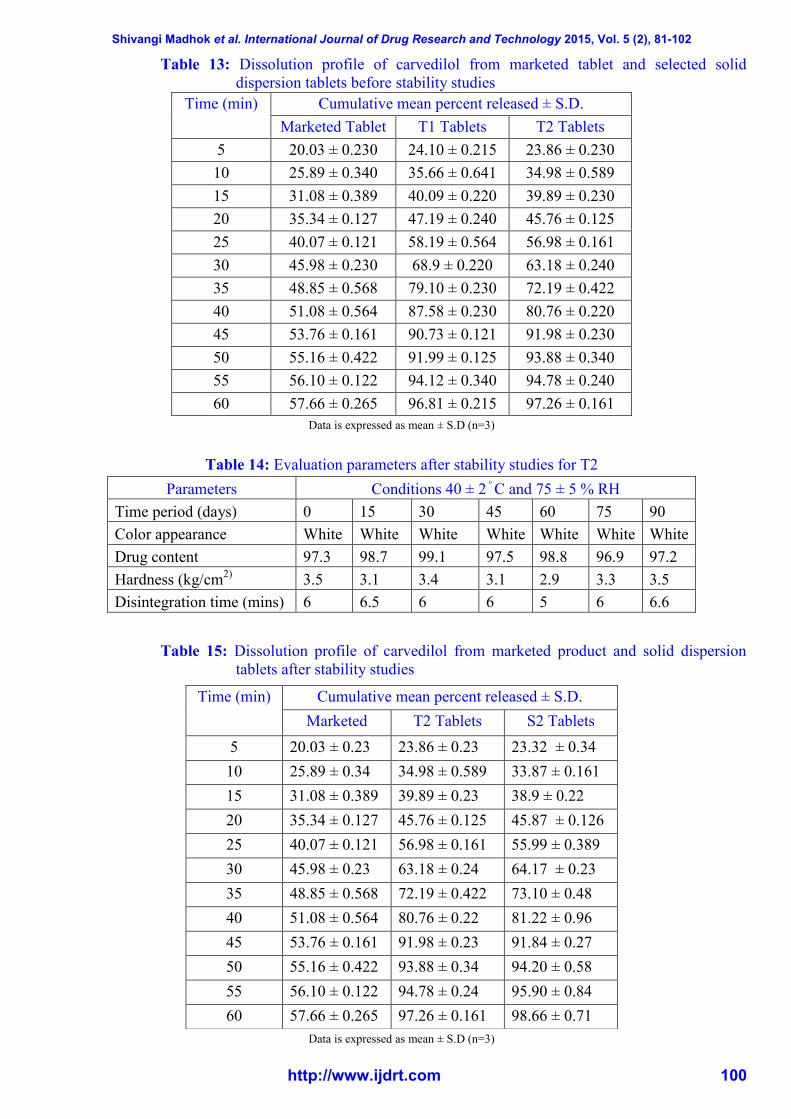
Table 13: Dissolution profile of carvedilol from marketed tablet and selected solid
dispersion tablets before stability studies
Data is expressed as mean ± S.D (n=3)
Table 14: Evaluation parameters after stability studies for T2
Parameters
Conditions 40 ± 2 C and 75 ± 5 % RH
Time period (days) 0 15 30 45 60 75 90
Color appearance White White White White White White White
Drug content 97.3 98.7 99.1 97.5 98.8 96.9 97.2
Hardness (kg/cm2)
3.5 3.1 3.4 3.1 2.9 3.3 3.5
Disintegration time (mins) 6 6.5 6 6 5 6 6.6
Table 15: Dissolution profile of carvedilol from marketed product and solid dispersion
tablets after stability studies
Data is expressed as mean ± S.D (n=3)
Time (min)
Cumulative mean percent released ± S.D.
Marketed Tablet T1 Tablets T2 Tablets
5 20.03 ± 0.230 24.10 ± 0.215 23.86 ± 0.230
10 25.89 ± 0.340 35.66 ± 0.641 34.98 ± 0.589
15 31.08 ± 0.389 40.09 ± 0.220 39.89 ± 0.230
20 35.34 ± 0.127 47.19 ± 0.240 45.76 ± 0.125
25 40.07 ± 0.121 58.19 ± 0.564 56.98 ± 0.161
30 45.98 ± 0.230 68.9 ± 0.220 63.18 ± 0.240
35 48.85 ± 0.568 79.10 ± 0.230 72.19 ± 0.422
40 51.08 ± 0.564 87.58 ± 0.230 80.76 ± 0.220
45 53.76 ± 0.161 90.73 ± 0.121 91.98 ± 0.230
50 55.16 ± 0.422 91.99 ± 0.125 93.88 ± 0.340
55 56.10 ± 0.122 94.12 ± 0.340 94.78 ± 0.240
60 57.66 ± 0.265 96.81 ± 0.215 97.26 ± 0.161
Time (min)
Cumulative mean percent released ± S.D.
Marketed
Tablet
T2 Tablets S2 Tablets
5 20.03 ± 0.23 23.86 ± 0.23 23.32 ± 0.34
10 25.89 ± 0.34 34.98 ± 0.589 33.87 ± 0.161
15 31.08 ± 0.389 39.89 ± 0.23 38.9 ± 0.22
20 35.34 ± 0.127 45.76 ± 0.125 45.87 ± 0.126
25 40.07 ± 0.121 56.98 ± 0.161 55.99 ± 0.389
30 45.98 ± 0.23 63.18 ± 0.24 64.17 ± 0.23
35 48.85 ± 0.568 72.19 ± 0.422 73.10 ± 0.48
40 51.08 ± 0.564 80.76 ± 0.22 81.22 ± 0.96
45 53.76 ± 0.161 91.98 ± 0.23 91.84 ± 0.27
50 55.16 ± 0.422 93.88 ± 0.34 94.20 ± 0.58
55 56.10 ± 0.122 94.78 ± 0.24 95.90 ± 0.84
60 57.66 ± 0.265 97.26 ± 0.161 98.66 ± 0.71

Shivangi Madhok et al. International Journal of Drug Research and Technology 2015, Vol. 5 (2), 81-102
http://www.ijdrt.com 101
Figure 28: Dissolution profile of selected solid dispersion tablets before and after stability studies
REFERENCES
1. Goddeeris, C; Willems, T and Mooter, GV
(2008), “Formulation of fast disintegrating
tablets of ternary solid dispersions consisting
of TPGS 1000 and HPMC 2910 or PVPVA
64 to improve the dissolution of the anti-HIV
drug UC 781”, Eur J Pharm Sci , 34, 293-
302.
2. Tapas, A; Kawtikwar, P and Sakarkar, D
(2012), “An improvement of micromeritic
properties and dissolution behaviours of
carvedilol spherical agglomerates crystallized
in presence of Inutec SP1”, Turk J Pharm Sci
, 9, 101-112.
3. Kukec, S; Dreu, R; Vrbanec, T; Srcic, S and
Vrecer, F (2012), “Characterization of
agglomerated carvedilol by hot-melt
processes in a fluid bed and high shear
granulator”, Int J Pharm, 430, 74-85.
4. Planinsek, O; Kovacic, B and Vrecer, F
(2011), “Carvedilol dissolution improvement
by preparation of solid dispersions with
porous silica”, Int J Pharm, 406, 41-48.
5. Choudhary, A; Rana, AC; Aggarawal, G,
Kumar, V and Zakir, F (2012), “Development
and characterization of atorvastatin solid
dispersion formulation using skimmed milk
for improved oral bioavailability”, APSB, 2,
421-428.
6. Mura, P; Faucci, MT and Bettinetti, GP
(2001), “The influence of
polyvinylpyrrolidone on naproxen
complexation with hydroxypropyl-b-
cyclodextrin”, Eur J Pharm Sci, 13, 187-194.
7. Srinarong, P; Faber, JH; Visser, MR;
Hinrichs, WLJ and Frijlink, HW (2009),
“Strongly enhanced dissolution rate of
fenofibrate solid dispersion tablets by
incorporation of superdisintegrants”, Eur J
Pharm Biopharm, 73, 154-161.
8. Cui, J; Deng, CLY; Wang, Y and Wang, W
(2006), “Freeze-drying of liposomes using
tertiary butyl alcohol/water cosolvent
systems”, Int J Pharm, 312, 131-136.
9. Varsha, B; Pokharkar, LP; Mandpe, MN;
Padamwar, AA; Ambike, KR and Mahadik,
AP (2006), “Development, characterization
and stabilization of amorphous form of a low
Tg drug”, Powder Tech, 167, 20-25.
10. Remington, “The Science and Practice of
Pharmacy”, 21st Ed., 687.
11. The GCC Guidelines for Stability Testing of
Drug Substances and Pharmaceutical
Products (2007), G, 2nd
Ed, 1428.
Correspondence Author: Shivangi Madhok* Department of Pharmaceutics, ASBASJSM College of Pharmacy, Bela-140 111, Ropar, India

Shivangi Madhok et al. International Journal of Drug Research and Technology 2015, Vol. 5 (2), 81-102
http://www.ijdrt.com 102
Cite This Article: Shivangi, Madhok and Akankasha, Madhok (2015), “Enhancement of solubility and
dissolution of carvedilol by solid dispersion technique using rota-evaporation and lyophilization methods”,
International Journal of Drug Research and Technology, Vol. 5 (2), 81-102.