hyspiri vswir science measurement baseline · hyspiri vswir science measurement baseline ... map of...
TRANSCRIPT

HyspIRI
VSWIR Science Measurement Baseline
NASA Earth Science and Applications Decadal Survey
Robert O. Green and HyspIRI Team
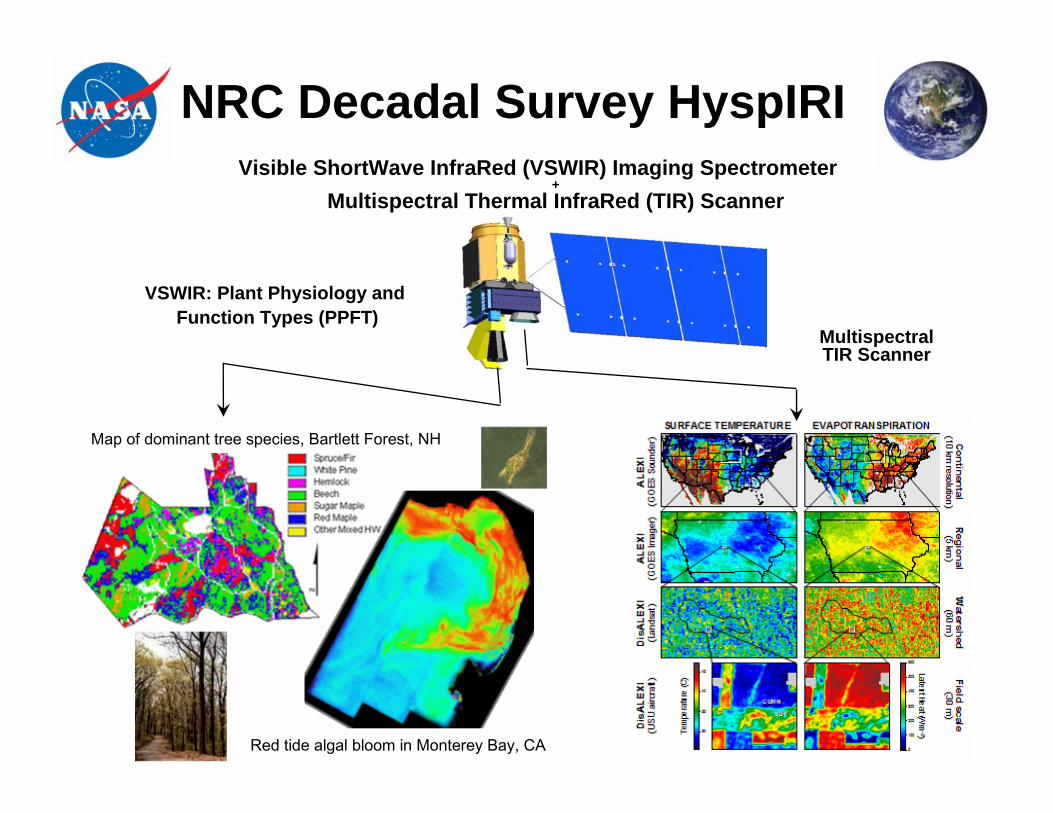
NRC Decadal Survey HyspIRI Visible ShortWave InfraRed (VSWIR) Imaging Spectrometer
+ Multispectral Thermal InfraRed (TIR) Scanner
VSWIR: Plant Physiology andFunction Types (PPFT)
Multispectral TIR Scanner
Red tide algal bloom in Monterey Bay, CA
Map of dominant tree species, Bartlett Forest, NH

HyspIRI Imaging Spectroscopy Science Measurements
Science Questions:• What is the composition, function, and health of
land and water ecosystems? • How are these ecosystems being altered by
human activities and natural causes? • How do these changes affect fundamental
ecosystem processes upon which life on Earth depends?
Red tide algal bloom in Monterey Bay, CA
Map of dominant tree species, Bartlett Forest, NH
Imaging spectrometer: 66kg / 41W
Schedule: 4 year phase A-D, 3 years operations
All components have flown in space
Measurement:• 380 to 2500 nm in 10nm channels• Accurate 60 m sampling• 19 days revisit mapping mission• Global land and shallow water
Aquatic Terrestrial

VSWIR Overarching Science Questions
• VQ1. Pattern and Spatial Distribution of Ecosystems and their Components, (EM,JG)– What is the pattern of ecosystem distribution and how do ecosystems differ in their composition or biodiversity? [DS 195]
• VQ2. Ecosystem Function, Physiology and Seasonal Activity, (EM,JG) – What are the seasonal expressions and cycles for terrestrial and aquatic ecosystems, functional groups and diagnostic
species? How are these being altered by changes in climate, land use, and disturbances? [DS 191, 195, 203]
• VQ3. Biogeochemical Cycles (SO, SU)– How are biogeochemical cycles for carbon, water and nutrients being altered by natural and human-induced
environmental changes?
• VQ4. Changes in Disturbance Activity (RK,GA)– How are disturbance regimes changing and how do these changes affect the ecosystem processes that support life on
Earth?
• VQ5. Ecosystem and Human Health, (PT,GG)– How do changes in ecosystem composition and function affect human health, resource use, and resource management?
• VQ6. Land Surface and Shallow Water Substrate Composition (RG, HD)– What is the land surface soil/rock and shallow water substrate composition?

• Plant and phytoplankton functional types and species have biochemical and biophysical properties that are expressed as reflectance and absorption features spanning the spectral region from 380 to 2500 nm.
• Individual bands do not capture the diversity of biochemical and biophysical signatures of plant functional types or species.
• Changes in the chemical and physical configuration of ecosystems are often expressed as changes in the contiguous spectral signatures that relate directly to plant functional types, vegetation health, and species distribution.
• Other constituents of the Earth system (Minerals, Soils, Snow, etc) have spectral characteristics allow use of this spectroscopic measurement approach for corresponding science questions.
• Important atmospheric correction information and calibration feedback is contained within the spectral measurement.
Basis for Continuous Spectral Measurement
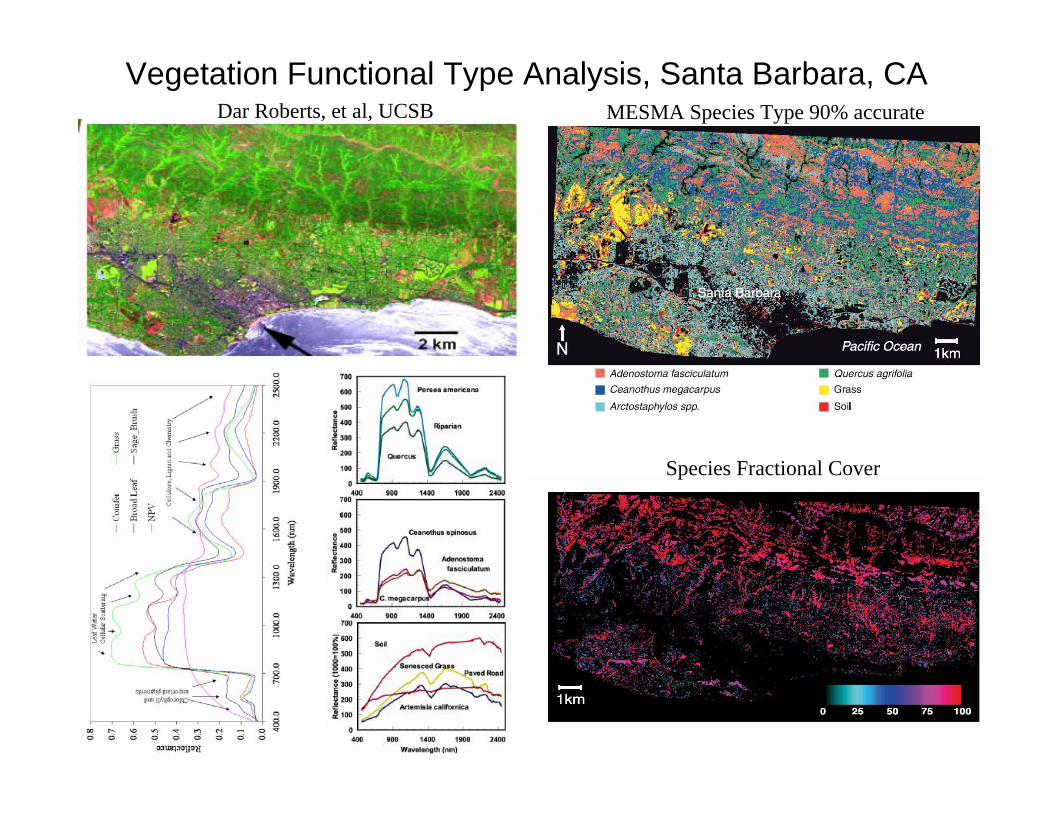
Vegetation Functional Type Analysis, Santa Barbara, CAMESMA Species Type 90% accurate
Species Fractional Cover
Dar Roberts, et al, UCSB

Plot-level canopy N measured on a wide variety of sites
GPS coordinates allow plots to be identified on images
Reflectance spectra extracted for each plot
PLS Regressions relate spectral features to measured %N
VEGETATION
4 0 0 8 0 0 1 2 0 0 1 6 0 0 2 0 0 0 2 4 0 0W a v e l e n g t h ( n m )
Ref
lect
ance
0 0.
2 .4
.6
.8 1
.0
AVIRIS EO-1
Hyperion
Observed %N
R2 = 0.83 R2 = 0. 79
NC FL MA ME NH Aust. CR NY
Biogeochemical Cycles
Canopy Nitrogen from imaging spectroscopy.

Response to Disturbance
0
100
200
300
400
500
600
700
800
0 10 20 30 40 50 60
Stand Age (97)
ΔLi
quid
Wat
er
DS98-S97DS95-S97
Interannual changes in canopy moisture show significant stand age differences up to 30 years (shown as the difference in canopy moisture between spring98 and spring 97 –blue, and spring97 and spring 95 - green). These results indicate that seasonal drought response is age dependent in shrublands, with older stands less impacted by drought. These results require seasonal imaging spectroscopy observations.
Post-fire response to three different fires, two in 1993 and one in 1996. Canopy moisture is the most sensitive measure of change, as shown by overlap between the 1996 and 1993 Calabasas and Topanga fires. High fire return intervals in Southern California are impacting ecosystems, eliminating some shrub species.
Non photosynthetic Vegetation
Green vegetation
Canopy Liquid Water

Ecosystems and Human Well-Being
Airborne imaging spectrometer measurementsRed tide in Monterey Bay, CA
A spectral measurement is required to determine the species type including species that cause potential harmful algal blooms.
Paul Bissett, Florida Environmental Research Institute.

Spectral Measurements of Shallow Water Benthic Composition (E. Hochberg, Nova Southeastern University, FL)
Imaging Spectrometer Measurement
Benthic Compositional Mapping

HyspIRI VSWIR – PPFT Imaging Spectrometer
Measurement Characteristics
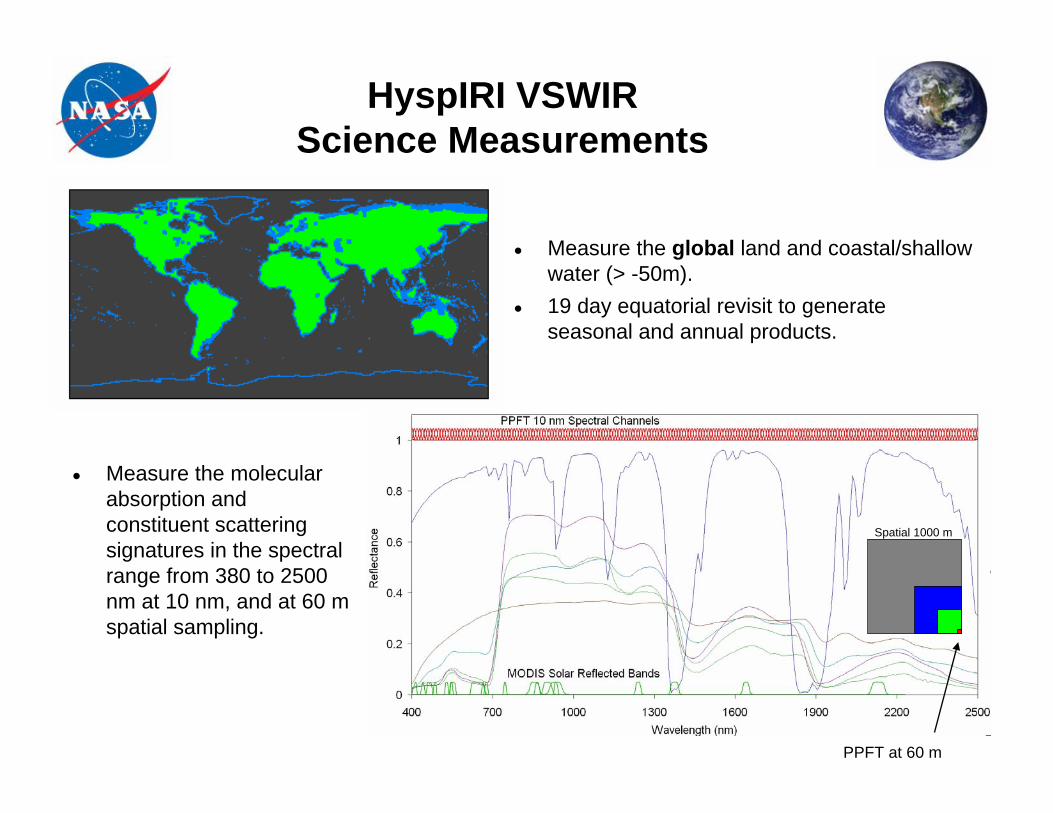
HyspIRI VSWIR Science Measurements
• Measure the global land and coastal/shallow water (> -50m).
• 19 day equatorial revisit to generate seasonal and annual products.
Spatial 1000 m
• Measure the molecular absorption and constituent scattering signatures in the spectral range from 380 to 2500 nm at 10 nm, and at 60 m spatial sampling.
PPFT at 60 m

SpectralRange 380 to 2500 nm in the solar reflected spectrumSampling <= 10 nm {uniform over range}Response <= 1.2 X sampling (FWHM) {uniform over range}Accuracy <0.5 nm
RadiometricRange & Sampling 0 to 1.5 X max benchmark radiance, 14 bits measuredAccuracy >95% absolute radiometric, 98% on-orbit reflectance, 99.5% stabilityPrecision (SNR) See spectral plots at benchmark radiancesLinearity >99% characterized to 0.1 %Polarization <2% sensitivity, characterized to 0.5 %Scattered Light <1:200 characterized to 0.1%
SpatialRange >150 km (12 degrees at 700 km altitude)Cross-Track Samples >2500Sampling <=60 mResponse <=1.2 X sampling (FWHM)
UniformitySpectral Cross-Track >95% cross-track uniformity {<0.5 nm min-max over swath}Spectral-IFOV-Variation >95% spectral IFOV uniformity {<5% variation over spectral range}
HyspIRI VSWIRScience Measurement Characteristics

TemporalOrbit Crossing 11 am sun synchronous descendingGlobal Land Coast Repeat 19 days at equatorRapid Response Revisit 3 days (cross-track pointing)
Sunglint ReductionCross Track Pointing 4 degrees in backscatter direction
OnOrbit CalibrationLunar View 1 per month {radiometric}Solar Cover Views 1 per day {radiometric}Dark signal measurements 1 per orbit and edge detector trackingSurface Cal Experiments 3 per year {spectral & radiometric}
Data CollectionLand Coverage Land surface above sea level excluding ice sheetsWater Coverage Coastal zone -50 m and shallowerSolar Elevation 20 degrees or greaterOpen Ocean/Ice Sheets Averaged to 1km spatial samplingCompression >=3.0 lossless
HyspIRI VSWIR Science Measurements Characteristics

HyspIRI VSWIR Science MeasurementsKey SNR and Uniformity Requirements
Wavelength
Cross Track SampleDepiction-Grids are the detectors-dots are the IFOV centers-Colors are the wavelengths
RequirementSpectral Cross-Track >95% cross-track uniformity {<0.5 nm min-max over swath}
Spectral-IFOV-Variation >95% spectral IFOV uniformity {<5% variation over spectral range}
Benchmark Radiances
Uniformity Requirement
Required SNR

HyspIRI: Building on NASA Hyperion Technology Demonstration
Global Coverage >> 10XSoil C:N RatioWhite Mountain
National Forest, NH
Swath > 10X
SNR > 10XW
avelength
Cross Track Sample
Uniformity > 10X

Heritage: NASA Moon Mineralogy MapperPassed Preship review 3 May 2007- Mouroulis Offner Design (HyspIRI)- Convex e-beam grating (HyspIRI)- 6604a MCT full range detector array, multiplexor & signal chain (HyspIRI)- Uniform slit (HyspIRI)- 0.5 micron adjustment mounts lockable for flight- Aligned to 95% cross-track uniformity (HyspIRI)- Aligned to 95% spectral IFOV uniformity (HyspIRI)- Meets high SNR requirements (HyspIRI)- Passive radiator (HyspIRI)
Mass 8 kg, Power 15 Watts
First spectrum 18 Months from funding start
M3 Spectrometer
Cross-track uniformity > 95%

Heritage: M3 NASA Imaging SpectrometerM3 Installed on ISRO Chandraayan-1 spacecraft, Launched 22 Oct 2008• First light in lunar orbit 19 Nov 2008
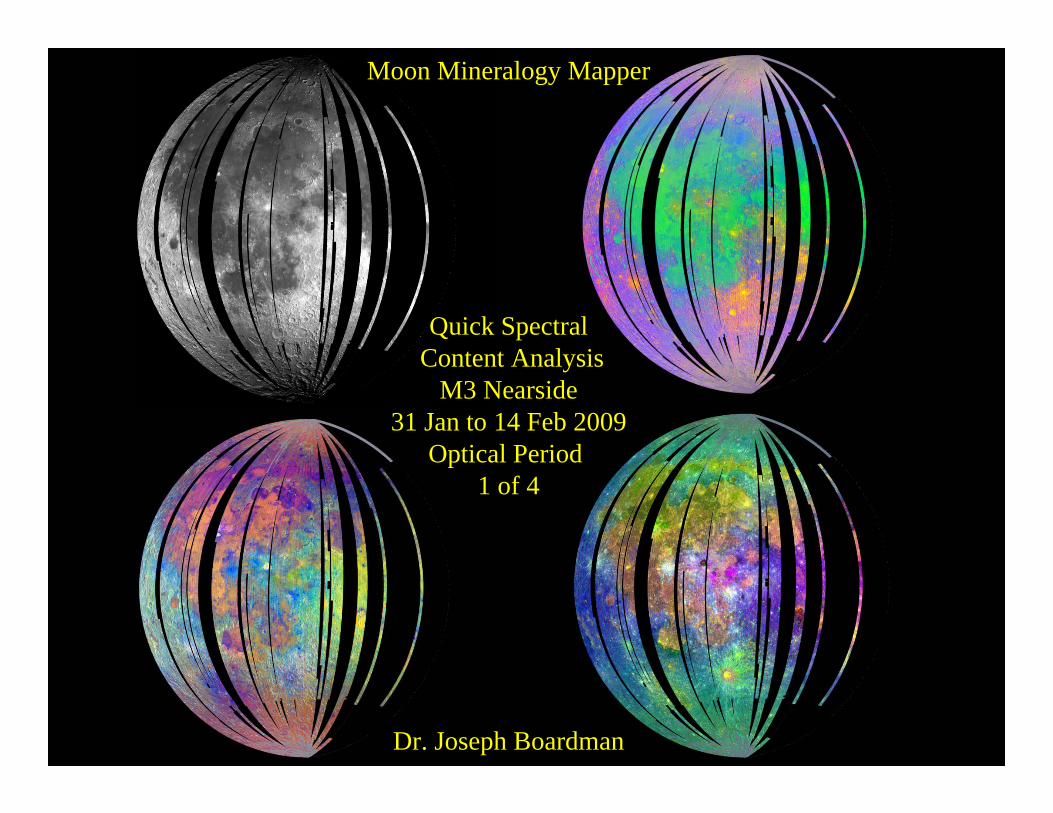
Moon Mineralogy Mapper
Quick SpectralContent Analysis
M3 Nearside31 Jan to 14 Feb 2009
Optical Period 1 of 4
Dr. Joseph Boardman

Image of Earth from the Moon acquired by the NASA Discovery MoonMineralogy Mapper (M3) that is a guest instrument onboard the ISRO Chandrayaan-1 Mission to the Moon. Australia is visible in the lower center of the image. The image is presented as a false color composite with oceans dark blue, clouds white, and vegetation enhanced green. The data were acquired on the 22nd of July 2009.
NASA M3 Image of Earth from the Moon

Summary
We have developed a set of VSWIR science questions that are well aligned with the HyspIRI Mission called for in the NASA Earth Science and Applications Decadal Survey.
We have reviewed and refined these questions that relate to both science and applications objectives and developed traceability to a set of science measurements.
In preparation for a NASA Mission Concept Review (MCR) we have established a high heritage and low risk approach for acquiring the HyspIRI VSWIR science measurements