hyspiri: imaging spectroscopy of plant metabolic and ... 24, 2010 · hyspiri: imaging spectroscopy...
TRANSCRIPT

HyspIRI: Imaging Spectroscopy of Plant Metabolic and Ecological Function
Phil Townsend, Shawn Serbin, Aditya Singh, Dylan Dillaway,Brenden McNeil and Eric Kruger

Photosynthesis:A temperature-mediated photochemical reaction
Climate is key to photo-synthetic potential.
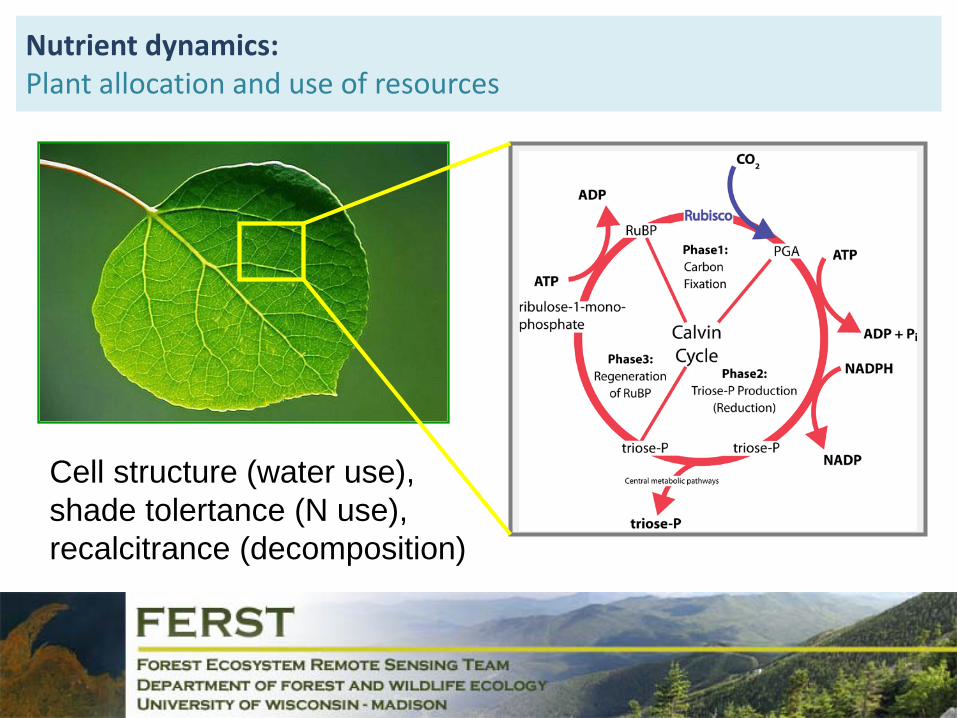
Nutrient dynamics:Plant allocation and use of resources
Cell structure (water use), shade tolertance (N use), recalcitrance (decomposition)
Key concepts for climate change research:
Photosynthesis is driven by light, temperature, water availability, nutrients, etc.
If we can measure specific processes of photosynthesis using imaging spectroscopy and thermal (temperature) measurements, then:
• We can measure changes in photosynthetic rates, and:• Assess changes in carbon assimilation by vegetation and changes in vegetation function associated with ΔT.• Global mission necessary to evaluate changes in photosynthesis that occur over large areas.

Definition: V(c)max – maximum rate of carboxylation
Carboxylation – initial addition of CO2 to RuBP (catalyzed by RuBisCO). Addition of ATP and NADPH triose phosphate

(aqueous space)
http://photoprotection.clinuvel.com/custom/uploads/LUV_fig4_chloroplast_v(1).gif
Photosynthesis – The Chloroplast

Definition: Jmax – electron transport rate
chloroplast stroma
Diagram from wikipedia commons
Electron transport rateJmaxthylakoid lumen
thylakoid membrane
Background:
V(c)max: Measurement of process by which Rubisco catalyzes RuBP with CO2 to produce the carbon compounds that eventually become triose phosphates (G3P, PGAL)
Triose phosphates are the building block for sugars and starches.
Jmax: Transport of electrons through the thylakoid membrane is critical to producing NADPH and ATP, which provide the metabolic energy necessary to produce triose phosphates.
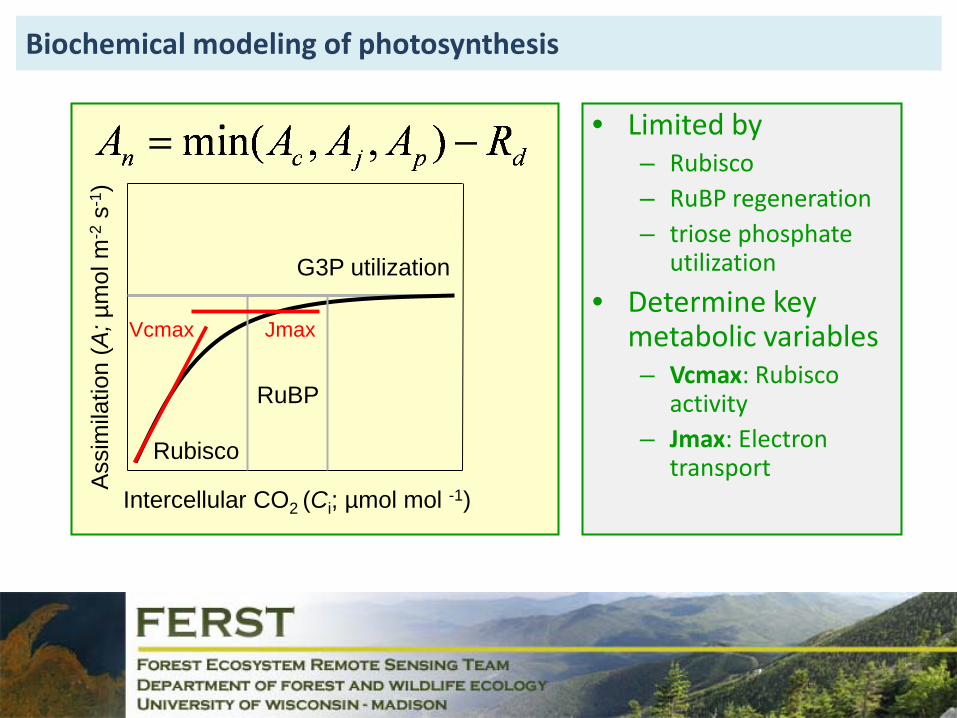
Biochemical modeling of photosynthesis
Rubisco
RuBP
G3P utilization
Intercellular CO2 (Ci; µmol mol -1)
Ass
imila
tion
(A; µ
mol
m-2
s-1 )
• Limited by– Rubisco– RuBP regeneration– triose phosphate
utilization
• Determine key metabolic variables– Vcmax: Rubisco
activity– Jmax: Electron
transport
Vcmax Jmax

• Across the range of a species**
• Photosynthetic capacity varies according to climate
• Changes in climate should be expressed in changes in rates (Vcmax, Jmax)
PRISM Data: http://www.prism.oregonstate.edu/
How will climate change affect composition and metabolism?

• Hyperspectral imagery
• Field collection– Gas exchange– Spectra– Canopy
temperature
• Examine regional trends– Lat/Long variation
PRISM Data: http://www.prism.oregonstate.edu/
How will climate change affect composition and metabolism?

Where does HyspIRI fit in?
HyspIRI spectral and thermal measurements provide the opportunity to directly measure the photochemical processes associated with carbon assimilation (e.g., Amax) and respiration by plants across the ranges of species.
These HyspIRI products provide the potential to identify changes in photosynthetic processes associated with climate change (e.g., temperature) across species.

Detection of leaf metabolic rates using spectroscopy
CO2

Physiological data in glasshouse study
• Three temperature regimes– 13/20 °C, 18/25 °C, 23/30 °C
• Leaf gas exchange– Vcmax, Jmax, Amass, Aarea
• Morphology and nutrition– SLA, Leaf N
• Leaf optical properties (350-2500 nm)

Empirical evidence: Cottonwood and Aspen

Physiological measurements across temperature regimes
Night – Day Temperature
N (mass) LMA
JmaxV(c)max

Predictions using leaf spectra and PLSR (%N example)

Biotron measurements show thermal effects on leaf metabolism
Pooled R2 between spectra-predicted V(c)max/Jmax and leaf N
R2 = 0.003 R2 = 0.33

Time Tleaf (°C)
Vcmax
Morning 23.8 54.8Afternoon 31.4 114.3
Spectra are responsive to temp.-driven variations in metabolism

Examples: AVIRIS imagery from the Upper Midwest
BarabooHills
Ottawa NF /Sylvania
PorcupineMountains
NorthernMinnesota
Boreal forest
Oak / hickory
Northernhardwood
Old growthhemlock / Hwd

Examples: LMA – based on hypothesized relationships
Baraboo Hills Minnesota
LMA
(g m
-2)
LMA
(g m
-2)
Ottawa NF
LMA
(g m
-2)

Examples: V(c)max – based on hypothesized relationships
Minnesota
Vcm
ax(µ
mol
m-2
s-1
)
Baraboo Hills Ottawa NF
Vcm
ax(µ
mol
m-2
s-1
)
Vcm
ax(µ
mol
m-2
s-1
)
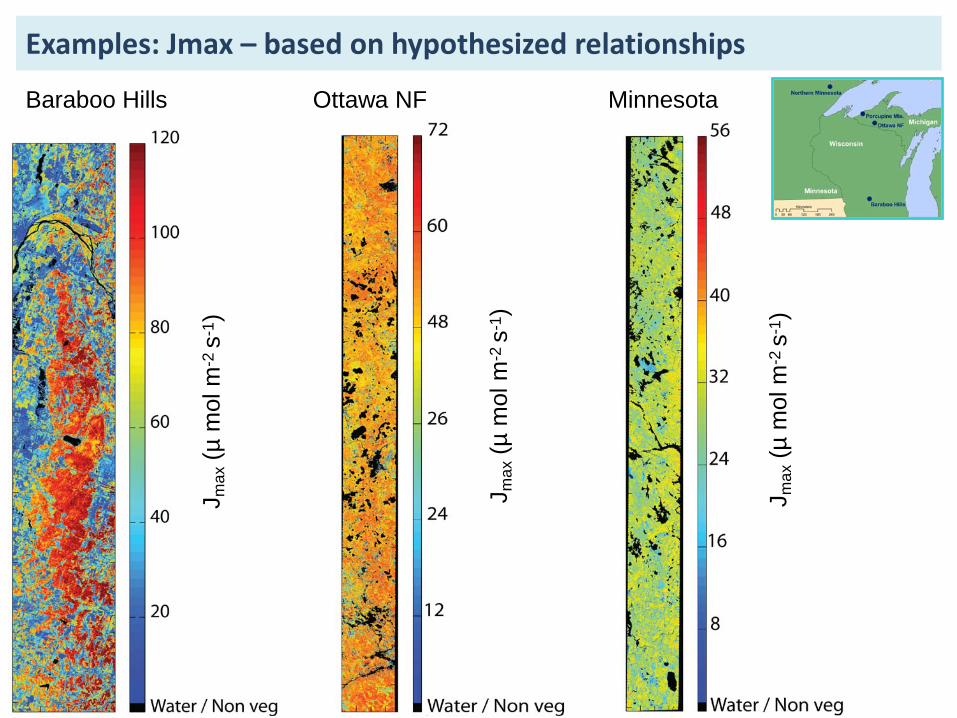
Examples: Jmax – based on hypothesized relationships
J max
(µm
ol m
-2 s
-1)
Minnesota
J max
(µm
ol m
-2 s
-1)
Baraboo Hills
J max
(µm
ol m
-2 s
-1)
Ottawa NF

CO2
PLS
TInput
Parameters
RTM
Spectra
Now working on scaling leaf canopy sensor
Using HyspIRI-like data (AVIRIS + ASTER/MASTER), we are looking at forest acclimation to T and CO2.

Remote sensing of genetic diversity in aspen:Directly associated with vegetation response to climate change

Acknowledgments
• Terrestrial Ecology and Biodiversity Program• Earth & Space Science Fellowship• HyspIRI Preparatory Activities