hyspiri tir science measurement baseline - nasa€¦ · · 2009-08-082009-08-08 · hyspiri tir...
TRANSCRIPT

HyspIRI
TIR Science Measurement Baseline
NASA Earth Science and Applications Decadal Survey
Simon J. Hook and HyspIRI Team

NRC Decadal Survey HyspIRIVisible ShortWave InfraRed (VSWIR) Imaging Spectrometer
+ Multispectral Thermal InfraRed (TIR) Scanner
VSWIR: Plant Physiology andFunction Types (PPFT)
MultispectralTIR Scanner
Red tide algal bloom in Monterey Bay, CA
Map of dominant tree species, Bartlett Forest, NH

3
HyspIRI Thermal Infrared Multispectral(TIR) Science Measurements
Science Questions:TQ1. Volcanoes/Earthquakes (MA,FF)– How can we help predict and mitigate earthquake and volcanic hazards through
detection of transient thermal phenomena?• TQ2. Wildfires (LG,DR)– What is the impact of global biomass burning on the terrestrial biosphere and
atmosphere, and how is this impact changing over time?• TQ3. Water Use and Availability, (MA,RA)– How is consumptive use of global freshwater supplies responding to changes in climate
and demand, and what are the implications for sustainable management of water resources?
• TQ4. Urbanization/Human Health, (DQ,GG)– How does urbanization affect the local, regional and global environment? Can we
characterize this effect to help mitigate its impact on human health and welfare?• TQ5. Earth surface composition and change, (AP,JC)– What is the composition and temperature of the exposed surface of the Earth? How do
these factors change over time and affect land use and habitability?
Measurement:
• 7 bands between 7.5-12 µm and 1 band at 4 µm
• 60 m resolution, 5 days revisit
• Global land and shallow water
Volcanoes
Urbanization
Water Use and Availability
Surface Temperature Evapotranspiration
Andean volcano heats up
0
0.1
0.2
0.3
0.4
0.5
0.6
0.7
0.8
0.9
1
3.00 4.00 5.00 6.00 7.00 8.00 9.00 10.00 11.00 12.00 13.00Wavelength (um)
Rel
ativ
e Sp
ectr
al R
espo
nse
H1 (m21)H2 (m28)H3 (a10)H4 (a11)H5 (a12)H6H7H8 (m32)
Multispectral Scanner
Schedule: 4 year phase A-D, 3 years operations
High Heritage
TIR

TIR Overarching Science Questions
• TQ1. Volcanoes/Earthquakes (MA,FF)– How can we help predict and mitigate earthquake and volcanic hazards through detection
of transient thermal phenomena?• TQ2. Wildfires (LG,DR)
– What is the impact of global biomass burning on the terrestrial biosphere and atmosphere, and how is this impact changing over time?
• TQ3. Water Use and Availability, (MA,RA)– How is consumptive use of global freshwater supplies responding to changes in climate
and demand, and what are the implications for sustainable management of water resources?
• TQ4. Urbanization/Human Health, (DQ,GG)– How does urbanization affect the local, regional and global environment? Can we
characterize this effect to help mitigate its impact on human health and welfare?• TQ5. Earth surface composition and change, (AP,JC)
– What is the composition and temperature of the exposed surface of the Earth? How do these factors change over time and affect land use and habitability?
5
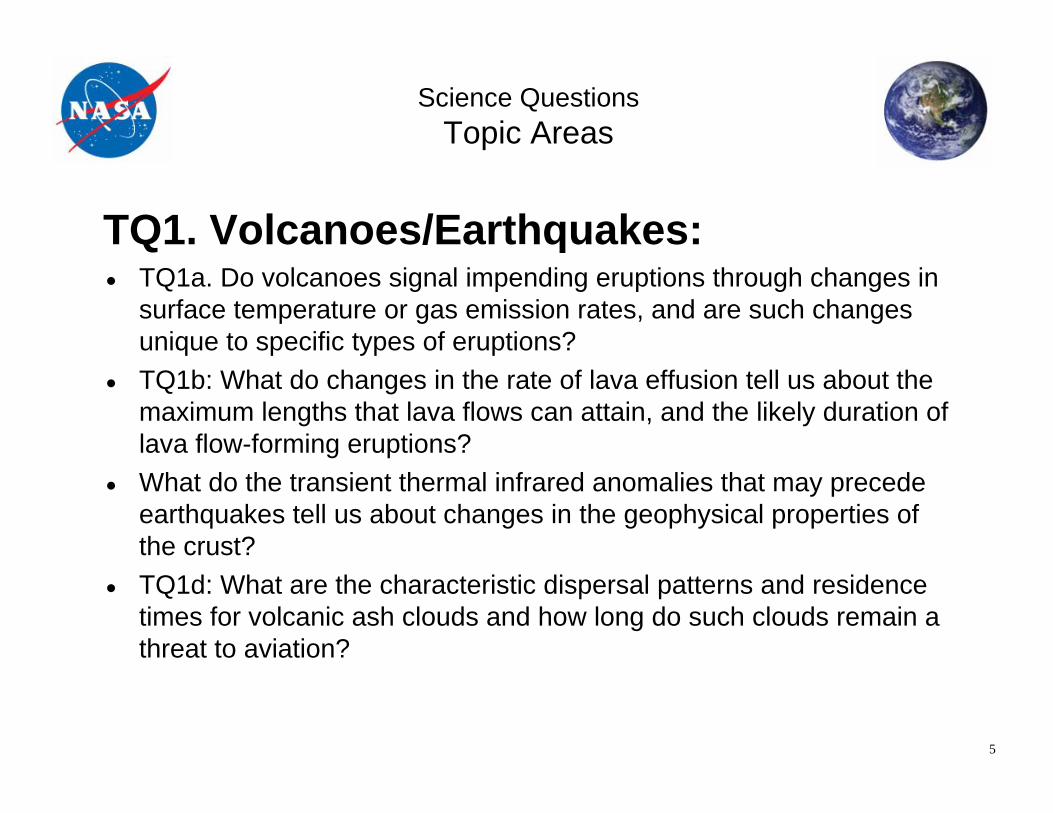
TQ1. Volcanoes/Earthquakes:• TQ1a. Do volcanoes signal impending eruptions through changes in
surface temperature or gas emission rates, and are such changes unique to specific types of eruptions?
• TQ1b: What do changes in the rate of lava effusion tell us about the maximum lengths that lava flows can attain, and the likely duration of lava flow-forming eruptions?
• What do the transient thermal infrared anomalies that may precede earthquakes tell us about changes in the geophysical properties of the crust?
• TQ1d: What are the characteristic dispersal patterns and residence times for volcanic ash clouds and how long do such clouds remain a threat to aviation?
Science Questions Topic Areas

Science Issue:•Volcanoes can exhibit idiosyncratic behaviors leading up to eruptions. For example, SO2 production can increase dramatically, or decrease dramatically. Thermal anomalies manifest themselves in many forms: crater lakes, fumaroles, domes, etc. Systematic monitoring can provide potentially effective information to aid in predicting possible eruptions.
Tools:•Satellite observations from HyspIRI TIR; requires multispectral capability to separate plume constituents; requires bands in 3-5um and 8-12um for temperature determinations in range -20 to 100C• Historical baseline of characteristic thermal and gas emission behavior for each volcano to compare with HyspIRI observations.
Approach:•Schedule systematic day & night TIR observations with HyspIRIover several hundred up to 1000 active volcanoes.• Implement automatic analysis algorithms to flag anomalous thermal or gas emission activity.
Results:• Unique, high spatial resolution TIR data from HyspIRI will improve our understanding of pre-eruption volcanic behavior• This will in turn lead to improvements in our ability to predict volcanic eruptions.
TQ1a. Do volcanoes signal impending eruptions through changes in surface temperature or gas emission rates, and are
such changes unique to specific types of eruptions?
~
~
Kliuchevskoy and Bezymianny volcanoes in Siberia, observed by ASTER. 15 clear-sky nighttime observations in 5 months show changes in thermal behavior of summit domes, development of lava flows and pyroclastic flows, and presence of ash and SO2 plumes. Courtesy of M. Ramsey, U. Pittsburgh.

7
Q2. Wildfires:
• How are global fire regimes (fire location, type, frequency, and intensity) changing in response to changing climate and land use practices? [DS 198]
• Are regions becoming more fire prone? [DS 196]
• What is the role of fire in global biogeochemical cycling, particularly atmospheric composition? [DS 195]
• Are there regional feedbacks between fire and climate change?
Science Questions Topic Areas

8
Wildfires:How are global fire regimes changing?
Central Siberia
30 May 2001
30 m ASTER scene with
MODIS pixels superimposed (black squares)
High resolution thermal instrument can distinguish between the forest and non-forest parts of the flaming front allowing the fire type, intensity, etc., to be determined which indicates fire regime.
White squares show fire pixels detected by MODIS. Insufficient information to detect fire type
MIR band provides radiant flux to estimate rate at which biomass combusted and instantaneous emission estimate
HyspIRI will provide high spatial resolution mid to thermal infrared data for determining the fire regime and allowing flux estimation on a weekly basis

9
Q3. Water Use and Availability:
• How is climate variability impacting the evaporative component of the global water cycle over natural and managed landscapes? (DS 166, 196, 203, 257, 368; WGA)
• How can information about evapotranspiration and its relationship to land-use/land-cover be used to facilitate better management of freshwater resources? [DS 196, 203, 368]
• How can we improve early detection, mitigation, and impact assessment of droughts at local to global scales? [DS 166, 196, 203, 368]
• What is the current global irrigated acreage, how is it changing with time, and are these changes in a sustainable balance with regional water availability? [DS 196, 368]
• Can we increase food production in water-scarce agricultural regions while improving or sustaining environmental access to water? [DS 196, 368]
Science Questions Topic Areas

Science Issue:• Based on principles of surface energy balance, the land-surface temperature signal conveys valuable information about the evaporative component of the hydrologic cycle and its response to varying climatic drivers. If we can accurately monitor this response in relationship to land-use and land-cover conditions, we will improve our ability to forecast water consumption and demand and to develop effective climate adaptation strategies for our water systems.
Tools:• HyspIRI TIR observations of surface brightness temperature at <100m resolution to resolve field-scale land use, preferably with 3+ bands in the 8-12μm region for atmospheric and emissivity corrections. The weekly revisit of HyspIRI will improve accuracy of seasonally integrated ET estimates. • Collocated/contemporaneous maps of vegetation index and landuse.• Insolation data to estimate net radiation.• Regional scale ET maps using coarser resolution TIR imagery from geostationary satellites and MODIS/VIIRS provide spatial context for local assessments.
Approach:• Periodic maps of instantaneous clear-sky ET from a TIR-based surface energy balance algorithm can be interpolated to produce daily ET maps using time-continuous observations of reference ET or available energy from met stations or geostationary satellites.• Record of daily ET at scales resolving major land use patterns can be analyzed in conjunction with gridded climate data.
TQ3a: How is climate variability impacting the evaporative component of the global water cycle over natural and managed
landscapes? (DS 166, 196, 203, 257, 368; WGA)
30
35
40
45
100
200
300
400
500
1 July 2002 – 10:30AM CST
Dis
ALE
XI(L
ands
at)
Dis
ALE
XI(U
SU a
ircra
ft)
Catchm
ent(60m
)Field scale
(30m)
CORNCORN
SOYSOY
SURFACE TEMPERATURE EVAPOTRANSPIRATION
ALE
XI(G
OE
S Im
ager
) Regional(5km
)
ALE
XI(G
OES
Sou
nder
) Continental
(10km)
Tem
pera
ture
(C)
Latent Heat (W
m-2)
Dis
ALE
XI(M
OD
IS)
Watershed
(1km)
Multi-scale ET maps for 1 July 2002 produced using surface temperature data from aircraft (30-m resolution), Landsat-7 ETM+ (60-m), Terra MODIS (1-km), and GOES Imager (5-km) instruments (Anderson and Kustas (2008), Eos, 89, 233-234)
11
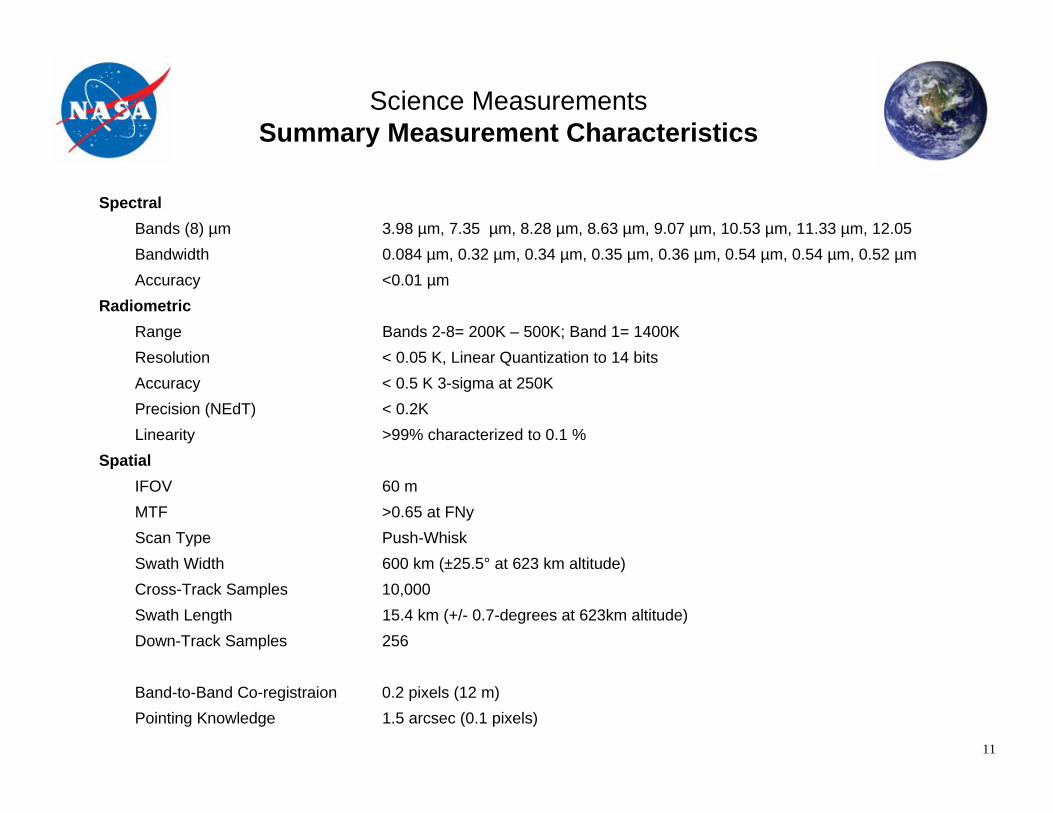
Science MeasurementsSummary Measurement Characteristics
SpectralBands (8) µm 3.98 µm, 7.35 µm, 8.28 µm, 8.63 µm, 9.07 µm, 10.53 µm, 11.33 µm, 12.05 Bandwidth 0.084 µm, 0.32 µm, 0.34 µm, 0.35 µm, 0.36 µm, 0.54 µm, 0.54 µm, 0.52 µmAccuracy <0.01 µm
RadiometricRange Bands 2-8= 200K – 500K; Band 1= 1400KResolution < 0.05 K, Linear Quantization to 14 bitsAccuracy < 0.5 K 3-sigma at 250KPrecision (NEdT) < 0.2KLinearity >99% characterized to 0.1 %
SpatialIFOV 60 mMTF >0.65 at FNyScan Type Push-WhiskSwath Width 600 km (±25.5° at 623 km altitude)Cross-Track Samples 10,000Swath Length 15.4 km (+/- 0.7-degrees at 623km altitude)Down-Track Samples 256
Band-to-Band Co-registraion 0.2 pixels (12 m)Pointing Knowledge 1.5 arcsec (0.1 pixels)

12
TemporalOrbit Crossing 11 am sun synchronous descendingGlobal Land Repeat 5 days at equator
OnOrbit CalibrationLunar View 1 per month {radiometric}Blackbody Views 1 per scan {radiometric}Deep Space Views 1 per scan {radiometric}Surface Cal Experiments 2 (d/n) every 5 days {radiometric}Spectral Surface Cal Experiments 1 per year
Data CollectionTime Coverage Day and NightLand Coverage Land surface above sea levelWater Coverage Coastal zone -50 m and shallowerOpen Ocean Averaged to 1km spatial samplingCompression 2:1 lossless
Science MeasurementsCharacteristics Continued

13
Mission ConceptOperational Scenario
• Following arrival at science orbit, the baseline data acquisition plan is established. Collect data for entire land surface excluding sea ice (Arctic and Antarctic) every 5 days at 60 m spatial resolution in 8 spectral bands
• Data are downlinked and transferred to the science data processing center where calibration and baseline processing algorithms are applied.
• Level 1, 2 products are delivered to the scientific community and general users to pursue the science questions– With appropriate cloud screening, compositing, spatial, and temporal subsetting
Land and coastal acquisition

14
TIR TRL is High
There is no scan line corrector!N/AScan Line Corrector
Subsystem TRL Comments
Scanner 9 Flight Proven on Numerous Designs
Telescope 9 Flight Proven on Galileo SSI, MGS-TES, CZCS, CassiniVIMS, HiRISE
Optical Filters 9 Flight Proven on MODIS, ASTER, Landsat
Focal Plane Assembly 6-7 Similar Detector Materials and ROIC’s Demonstrated on Ground and in Space
Active Cooler 9 Proven on Numerous Flight Programs
Passive Cryocoolers 9 Proven on M3, AIRS. More advanced forms flown on many programs.
Blackbody 9 Proven on MODIS
Mechanical / Thermal Systems 9 Proven on numerous flight missions
Electronic Subsystems 6, 9 Exact form proven in Lab, Similar Designs flown on other Space Programs

15
Mission Concept TIR Overview
• Duration: 4 years development, 3 years science
• Coverage: Global land every 5 days
• Day and Night imaging (1 day and night image at a given location obtained every 5 days)
• Data download using dual-polarization X-band at high-latitude stations
• Spacecraft: LEO RSDO bus (SA-200HP)
• Launch: Taurus-class launch vehicle
Sunshade
ScanMirror
Blackbody(V-Groove)
Space View
ActiveCryo-Cooler
PassiveRadiator

16
Mission Concept TIR Overview
• Duration: 4 years development, 3 years science
• Coverage: Global land every 5 days
• Day and Night imaging (1 day and night image at a given location obtained every 5 days)
• Data download using dual-polarization X-band at high-latitude stations
• Spacecraft: LEO RSDO bus (SA-200HP)
• Launch: Taurus-class launch vehicle
Earth View
ScanMirror
Blackbody(V-Groove)
Space View

Summary
We have developed a set of TIR science questions that are well aligned with the HyspIRI Mission called for in the NASA Earth Science and Application Decadal Survey.
We have reviewed and refined these questions that relate to both science and application objectives and developed traceability to a set of science measurements.
In preparation for a NASA Mission Concept Review (MCR) we have established a high heritage and low risk approach for acquiring the HyspIRI TIR science measurements

Backup

TQ1b: What do changes in the rate of lava effusion tell us about the maximum lengths that lava flows can attain, and the likely duration of
lava flow-forming eruptions?
Science Issue:• After lava composition, the volumetric effusion rate (modulated by surface cooling) determines how far a lava flow can extend from the vent before it solidifies. Effusion rates vary dramatically during eruptions, but can be quantified using infrared satellite data (top left; AVHRR, ATSR and TM data). By acquiring high spatial resolution TIR data, HyspIRI will allow us to determine effusion rates twice every five days during a lava flow forming eruption for any volcano on Earth. These data can be used to drive numerical models that predict the hazards that these flows will pose
Tools:• Satellite observations from HyspIRI TIR; requires band at ~4 μm (saturation temperature of ~1600 K) with moderate-high spatial resolution (<100 m) for determining the area of active lava at any given time during as eruption and estimating the radiant energy flux from the flow surface.• Pre-HyspIRI DEMs (e.g. SRTM) of all volcanoes likely to erupt basaltic lava flows• Time-series of effusion rates determined using higher temporal resolution MODIS data for calibration.
Approach:• Implement automatic analysis algorithms to flag anomalous thermal activity, determine active lava area and thermal flux, and, subsequently, a HyspIRI-derived effusion rate. Using this, a DEM, the vent location as recorded in the HyspIRI data, and a numerical lava flow model, generate simulations of likely lava flow paths for the given effusion rate. Autonomously update the hazard simulation as most recent HyspIRIderived effusion rates become available (lower left).
Results:• A global, near-real-time lava flow hazard assessment tool, driven by HyspIRI TIR data.
Wright et al. (2008). Geophysical Research Letters, 35, L19307.

TQ2a: How are global fire regimes (fire location, type, frequency, and intensity)
changing in response to changing climate and land use practices? [DS 198]
Science issueFire regimes vary considerably on a regional and global scale. Mapping fire location, type, frequency, and intensity at different times can contribute to an understanding of how they are affected by a changing climate and land use patterns.
ToolsRequires long-term regional or global data sets of thermal infrared imagery (low and normal gain channels at 4 and 11 µm). HyspIRI TIR data has a significantly improved capability of mapping flaming and smoldering fires. HyspIRIs greatly expanded spatial and temporal coverage can provide large sample sizes. Requires further pre-fire and post-fire thematic maps of climate variables and land use.
ApproachThe HyspIRI thermal infrared data will provide large samples of detailed fire characteristics that are useful for statistical modeling of fires and their behavior. The database of fire detections can be analyzed in conjunction with thematic data sets of climate and land use.
MODIS active fire detections 2000-2006 for Southern California
2001-2004 mean annual burned area derived from Terra MODIS active fire observations (top) and accompanying one-sigma uncertainties (bottom), expressed as fraction of grid cell that burns each year. From Giglio et al. (2005), Atmos. Chem. Phys. Discuss., 5, 11091-11141
21
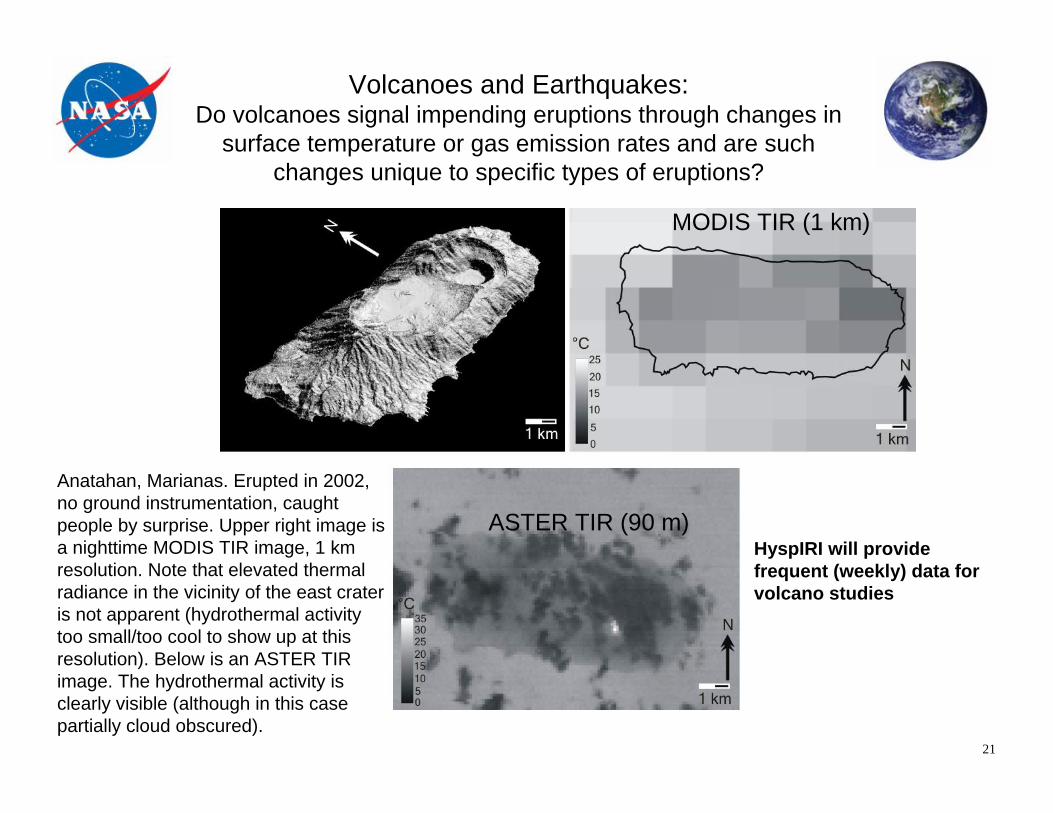
Volcanoes and Earthquakes:Do volcanoes signal impending eruptions through changes in
surface temperature or gas emission rates and are such changes unique to specific types of eruptions?
MODIS TIR (1 km)
ASTER TIR (90 m)
Anatahan, Marianas. Erupted in 2002, no ground instrumentation, caught people by surprise. Upper right image is a nighttime MODIS TIR image, 1 km resolution. Note that elevated thermal radiance in the vicinity of the east crater is not apparent (hydrothermal activity too small/too cool to show up at this resolution). Below is an ASTER TIR image. The hydrothermal activity is clearly visible (although in this case partially cloud obscured).
HyspIRI will provide frequent (weekly) data for volcano studies

TQ1d: What are the characteristic dispersal patterns and residence times for volcanic ash clouds and how long do such
clouds remain a threat to aviation?
~
~
Detection of Eruption Plumes in the Thermal Infrared (TIR)
(a) MODIS true-color composite of data acquired over Mount Etna illustrating the difficulty of distinguishing a plume from surrounding meteorological clouds; (b) False-color composite of MODIS TIR data (Ch. 29, 31, 32 displayed in blue, green, and red, respectively) illustrating the unique spectral signatures of the eruption plume (silicate ash), jet contrails (ice), and windborne sand; (c) Model transmission spectra for silicate ash, sulfate aerosol, ice, and quartz powder (representing sand). The blue, green, and red color barsrepresent MODIS Ch. 29, 31, and 32, respectively; the shaded bars represent the proposed HyspIRI TIR channels. HyspIRI will have three channels in place of MODIS Ch. 29 and three channels in place of MODIS Ch. 31 and 32, enhancing our ability to detect and track eruption plumes and clouds.
Science IssueThe ash plumes generated by explosive volcanic eruptions pose a significant hazard to jet aircraft. Current air traffic protocol is to clear the airspace in the vicinity of the erupting volcano, but the ash plumes may be transported hundreds to thousands of kilometers from their sources. The use of true-color images to discriminate volcanic plumes from meteorological (met) clouds, and other suspended aerosols and particulates, is problematic (Panel (a), at left).Tools•HyspIRI multispectral TIR image data, 5-day revisit cycle (daytime acquisitions) at equator, spatial resolution of 60 m, and spectral channels as shown in Panel (c) (at left).•Profiles of atmospheric temperature and water vapor, measured with radiosondes and spaceborne sounding instruments or model predictions. •Radiative transfer model to predict radiance at the sensor givenatmospheric profiles, length of optical path, and surface temperature, emissivity, and elevation (provided by DEM).Approach•Develop Internet portal to provide interactive plume analysis tools and on-demand modeling.•Statistics-based enhancement of spectral contrast to discriminate eruption plume from met clouds (Panel (b), at left).•Radiative transfer-based analysis tools to confirm presence of eruption plume and materials derived from plumeResultsOn-demand detection and tracking of eruption plumes via Internet portal, with 2 (1 day + 1 night) HyspIRI revisits per 5 day cycle at equator, and more frequent coverage at higher latitudes.