how can geomatics technologies benefit geotechnical studies? papers/olsen 202.00_.pdf · geomatics...
TRANSCRIPT

6th International Conference on Earthquake Geotechnical Engineering 1-4 November 2015 Christchurch, New Zealand
How Can Geomatics Technologies Benefit Geotechnical Studies?
M.J. Olsen1, D.T. Gillins2
ABSTRACT Numerous geomatics technologies have emerged over the past few decades, providing new tools
and methods for engineers and scientists to accurately and efficiently survey the earth, monitor deformations, document case histories, and geo-reference data collected during reconnaissance of an extreme event. Today, detailed spatial data may be collected from GPS receivers, laser scanners, robotic total stations, digital automatic levels, and radar systems. Many of these sensors can be mounted to various platforms, including terrestrial, mobile, and manned or unmanned aerial systems for different capabilities. This paper summarizes modern geomatics technologies and provides a comparison of the pros and cons of the aforementioned sensors within the context of geotechnical case history documentation. Finally, a decision matrix is presented to help the engineer or scientist select the appropriate geomatics technology based on the type and size of the event, intended degree of spatial accuracy, and desired speed of data collection.
Introduction
Reconnaissance after an extreme event, or a forensic investigation after an engineering failure, serves an important role in earthquake engineering research and greatly improves our understanding of many geotechnical engineering topics, including surface fault rupture, ground motions, soil liquefaction, slope instabilities, and the performance of structures and their foundation systems. Well-documented case histories provide important insight into the limitations and capabilities of engineered systems, and lead to future research opportunities, resulting in improved analysis models and design procedures (GEER 2014). Over the past few decades, several geomatics technologies have emerged, which provide new tools and methods for engineers and scientists to accurately and efficiently conduct surveys after extreme events. Additionally, geophysical monitoring technologies improve our ability to continually monitor the earth (e.g., tectonic motion) and record extreme events. Geomatics is a relatively new term, proposed by Paradis (1981) to describe a new discipline that addresses society’s increasing demand for spatial data capture, manipulation, storage, and diffusion. Geomatics combines the disciplines of land surveying, remote sensing, cartography, photogrammetry, and other related forms of earth mapping. Over the past 30-40 years, numerous geomatics-related technologies have emerged, including total stations, global navigation satellite systems (GNSS) such as the United States’ Global Positioning System (GPS), geographic information systems (GIS), advancements in digital imaging, lidar, and synthetic aperture radar (SAR). These technologies allow detailed and/or rapid surveys of the topography, measurements 1Assistant Professor, School of Civil and Construction Engineering, Oregon State University, Corvallis, OR, United States of America, [email protected] 2Assistant Professor, School of Civil and Construction Engineering, Oregon State University, Corvallis, OR, United States of America, [email protected]

of ground displacements, and spatial analysis and identification of surficial damage patterns after an extreme event. The Geotechnical Extreme Events Reconnaissance (GEER, 2014) association focuses on documentation after extreme events and publishes detailed reports of significant events for research and education to advance the state of practice. GEER has made significant efforts to improve the standardization of such efforts and make use of new reconnaissance technologies. For example, the GEER Manual provides information on standardized methods to collect geospatially tagged information, such as digital photographs acquired with a GPS camera, and incorporate them into Google Earth. This paper builds on those and other efforts to provide guidance on selecting an appropriate geomatics technology for documenting ground and structural deformations during reconnaissance or forensic investigations. In general, the appropriate technology depends on the desired spatial accuracy, resolution, cost of data acquisition, and size of a study area. Some geomatics tools are best suited for detailed, highly accurate surveys of small sites where millimeters to centimeters of displacement are critically significant. Such sites may require careful measurements over lengthy periods of time with stable reference points. For large study areas, it is often desirable to view the “big picture” by quickly capturing data from a broad range of sites using lower accuracy tools or methods. This assists in identifying which sites should be studied in further detail. For small sites, high accuracy and detail can typically be achieved with available technology. However, as the size of the study area increases, highly detailed surveys become more costly, and it becomes increasingly desirable to sacrifice some measurement accuracy in order to complete a comprehensive survey. Rapid data collection tools might also be used to map sites with very large ground deformations, where a few decimeters of measurement uncertainty are less significant. These tools are also ideal for collecting perishable data that will soon be lost during earthquake recovery or reconstruction. Given the rapid pace of innovation in geomatics equipment and software technologies, it can be confusing for one to select the appropriate tools for their particular study. One benefit to this evolution is that, in general, tools are becoming easier to use by persons without geomatics training. However, the accuracy and long-term usability of the resulting spatial data may be degraded if one does not rigorously consider fundamental geomatics principals, such as control establishment, error propagation, horizontal and vertical reference systems, distortion due to map projections, and coordinate transformations and adjustments. To assist end-users in selecting an appropriate technology, most geomatics equipment manufacturers report the accuracy of their instruments; however, the manufacturers testing procedures, calibration methods, and accuracy reporting vary widely. Field accuracies are often worse than the manufacturer specifications. Not only can accuracy vary significantly by hardware, the field and processing methods of surveying can have a significant influence on overall project accuracy. Field and processing methods are driven by application, cost, and time. Any systematic errors in these methods will propagate and affect the accuracy of the final results. Additionally, when concerned with accuracy, there are two levels to consider: (1) the local or relative accuracy when measuring between data points; and (2), the network or absolute accuracy
of the data referenced within a spatial reference system. To fully define the accuracy of any spatial data, it is best practice to report both the local and network accuracy. Defining absolute accuracy is especially helpful when storing spatial data in a GIS. Equipment Discussion Appropriate documentation of a case history requires a balance of minimizing measurement uncertainty, maximizing resolution, and maximizing spatial coverage. The figures and tables developed in this section are meant as quick guides for identifying the appropriate technology that best balances those needs for a particular project or investigation. Table 1 summarizes the capabilities and limitations of available geomatics technologies for measuring displacements, monitoring deformations, and mapping damage at a study site. The table also provides estimates of the typical measurement uncertainty of each technology (at one standard deviation or 1-σ), and lists published studies wherein reconnaissance teams or forensic investigators have made use of the technology. Because of the wide variety of surveying styles with GPS and lidar, these tools are summarized in more detail in Tables 2 and 3, respectively. Figure 1 provides an overview of capabilities of geomatics technologies in terms of uncertainty (1-σ) and typical spatial resolutions (e.g., pixel size or spacing between sample points). The number of spatial dimensions are also specified since some technologies do not provide 3D data. Hence, uncertainties cannot be directly related between these technologies. Figure 1 also assumes that rigorous acquisition and processing techniques have been employed to achieve optimal results. In most cases, one can expect higher uncertainty from reconnaissance field work given the challenges such as limited time and resources available to complete the work (Olsen and Kayen 2012). Table 4 builds on the information provided in Figure 1 to provide insights and recommendations on which technologies are most appropriate for reconnaissance or forensic work depending on the intensity of the event (e.g., magnitude of deformations or damage) and spatial extents of the area impacted by the event. In general, higher resolution becomes more important for local site and neighborhood level studies. Low uncertainty is most important for minor intensity events. Efficiency becomes very important for major events over large (state or region) areas. The categorization considers which techniques can meet the accuracy and resolution requirements needed to for meaningful quantitative damage analysis for a case history but still be cost-effective and efficient. Hence, many techniques can still be useful in boxes where they are not explicitly listed. For example, satellite imagery is useful for nearly all investigations; however, it does not provide sufficient resolution and accuracy to document deformations for local sites at high detail. Conversely, each technology can also be applied at larger spatial extent than listed in the table; however, they quickly become less efficient than other techniques. Additionally, error propagation can produce significant uncertainty when applying many techniques over large areas. One important limitation observed in this table is that there are few technologies capable of recording small deformations over large areas.
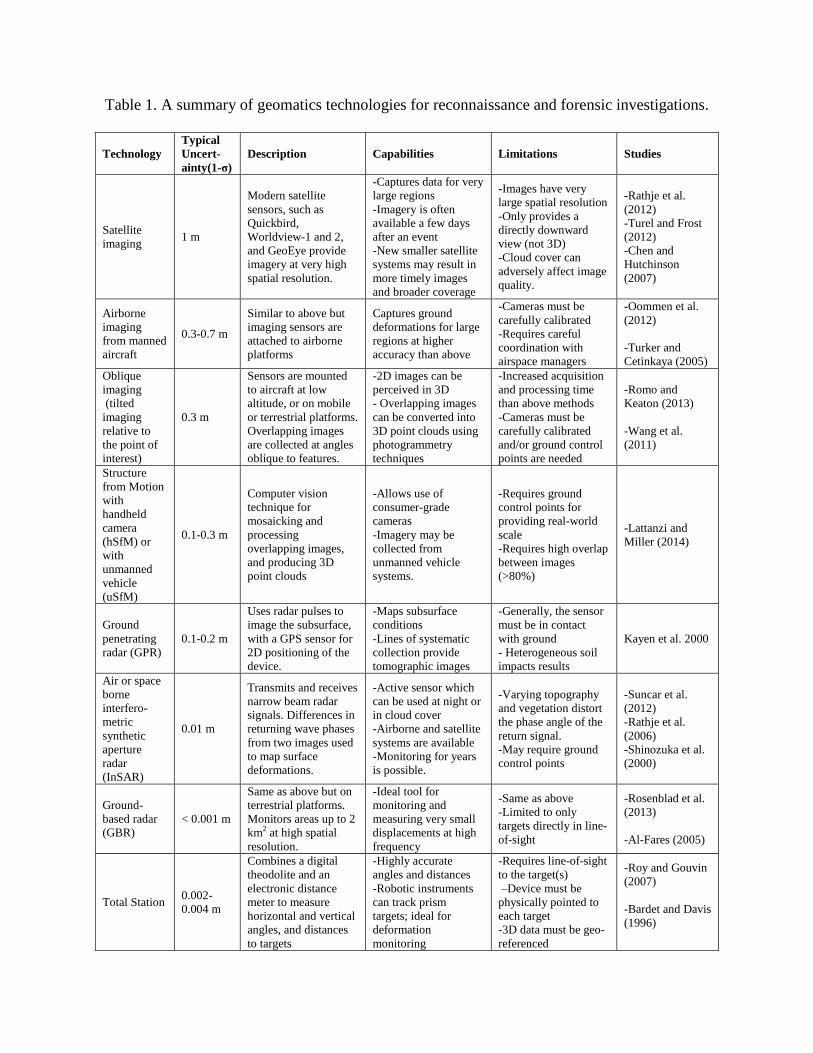
Table 1. A summary of geomatics technologies for reconnaissance and forensic investigations.
Technology Typical Uncert-ainty(1-σ)
Description Capabilities Limitations Studies
Satellite imaging 1 m
Modern satellite sensors, such as Quickbird, Worldview-1 and 2, and GeoEye provide imagery at very high spatial resolution.
-Captures data for very large regions -Imagery is often available a few days after an event -New smaller satellite systems may result in more timely images and broader coverage
-Images have very large spatial resolution -Only provides a directly downward view (not 3D) -Cloud cover can adversely affect image quality.
-Rathje et al. (2012) -Turel and Frost (2012) -Chen and Hutchinson (2007)
Airborne imaging from manned aircraft
0.3-0.7 m
Similar to above but imaging sensors are attached to airborne platforms
Captures ground deformations for large regions at higher accuracy than above
-Cameras must be carefully calibrated -Requires careful coordination with airspace managers
-Oommen et al. (2012) -Turker and Cetinkaya (2005)
Oblique imaging (tilted imaging relative to the point of interest)
0.3 m
Sensors are mounted to aircraft at low altitude, or on mobile or terrestrial platforms. Overlapping images are collected at angles oblique to features.
-2D images can be perceived in 3D - Overlapping images can be converted into 3D point clouds using photogrammetry techniques
-Increased acquisition and processing time than above methods -Cameras must be carefully calibrated and/or ground control points are needed
-Romo and Keaton (2013) -Wang et al. (2011)
Structure from Motion with handheld camera (hSfM) or with unmanned vehicle (uSfM)
0.1-0.3 m
Computer vision technique for mosaicking and processing overlapping images, and producing 3D point clouds
-Allows use of consumer-grade cameras -Imagery may be collected from unmanned vehicle systems.
-Requires ground control points for providing real-world scale -Requires high overlap between images (>80%)
-Lattanzi and Miller (2014)
Ground penetrating radar (GPR)
0.1-0.2 m
Uses radar pulses to image the subsurface, with a GPS sensor for 2D positioning of the device.
-Maps subsurface conditions -Lines of systematic collection provide tomographic images
-Generally, the sensor must be in contact with ground - Heterogeneous soil impacts results
Kayen et al. 2000
Air or space borne interfero-metric synthetic aperture radar (InSAR)
0.01 m
Transmits and receives narrow beam radar signals. Differences in returning wave phases from two images used to map surface deformations.
-Active sensor which can be used at night or in cloud cover -Airborne and satellite systems are available -Monitoring for years is possible.
-Varying topography and vegetation distort the phase angle of the return signal. -May require ground control points
-Suncar et al. (2012) -Rathje et al. (2006) -Shinozuka et al. (2000)
Ground-based radar (GBR)
< 0.001 m
Same as above but on terrestrial platforms. Monitors areas up to 2 km2 at high spatial resolution.
-Ideal tool for monitoring and measuring very small displacements at high frequency
-Same as above -Limited to only targets directly in line-of-sight
-Rosenblad et al. (2013) -Al-Fares (2005)
Total Station 0.002-0.004 m
Combines a digital theodolite and an electronic distance meter to measure horizontal and vertical angles, and distances to targets
-Highly accurate angles and distances -Robotic instruments can track prism targets; ideal for deformation monitoring
-Requires line-of-sight to the target(s) –Device must be physically pointed to each target -3D data must be geo-referenced
-Roy and Gouvin (2007) -Bardet and Davis (1996)

Table 1 (continued). A summary of geomatics technologies for reconnaissance and forensic investigations.
Technology Typical Uncert-ainty(1-σ)
Description Capabilities Limitations Studies
Digital automatic level
0.0005 m
Measures the change in elevation from a known point to an unknown point. Reads a bar code printed on a leveling rod.
-Ideal for measuring small vertical deformations and settlements -Highly accurate changes in elevations
-Only provides elevation differences (1D tool) -Requires line-of-sight with best results if sight distances <50 m
-Beshr (2014)
Table 2. A summary of available types of GNSS (e.g., GPS) survey styles.
Type of GNSS\GPS System
Typical uncertainty (3D, 1-σ)
Description Capabilities Limitations
Consumer-grade without differential corrections
5-10 m These units are available in some phones, cameras, tablets, and handheld devices
-Fast and easy to use -Useful for geotagging data
-Very low accuracy -Only coarse coordinates provided
Consumer-grade with corrections 1-5 m
Same as above but capable of receiving differential corrections from a local or wide area augmentation system
Same as above but with some improved accuracy
-Same as above but with some improved accuracy
Mapping-grade with differential corrections (DGNSS)
< 1 m Handheld GIS units that can be integrated with an external antenna.
-Fast mapping of points, lines, and areas -Easy insertion in GIS
-Low accuracy but much better than above
Precise Point Positioning (PPP-GNSS)
< 0.1 m
A new post-processing technique that uses only one dual frequency antenna to correct for atmospheric signal delays
-Does not require a second receiver over a known point (base receiver)
-Requires 15-30 minute long occupations for best results
Real-time or post-processed kinematic relative positioning (K-GNSS)
0.01-0.03 m
At least one dual frequency receiver/antenna is set up on a tripod over a base reference point, and another rover unit is moved to points of interest. Measurements are made relative to the base unit(s).
-High acquisition rates, usually from 5 seconds to 3 minutes -High accuracy -Establishment of real time networks with fixed base stations improves data quality
-For best results, a base unit(s), should be within 10 miles of the rover -Real-time corrections require communication devices (e.g., radio, wi-fi)
Rapid Static relative positioning (RS-GNSS)
0.01-0.03 m
A dual frequency receiver/antenna is set up on a tripod over points of interest. The data is post-processed against data collected simultaneously with units at other nearby stations in a control network, or against permanent GPS reference stations.
-High accuracy -Less prone to position dilution of precision or multipathing than the above technologies
-Requires 15-30 minute long occupations -Precise satellite orbits must be downloaded 1-3 weeks after a survey -Some projects may require multiple units with simultaneous occupations
Static relative positioning (S-GNSS)
0.005 – 0.01 m
Same as above but requires longer occupations.
-Same as above and considered the most accurate GPS survey technique.
-Same as above but typically requires 0.5 to 5 hour long occupations

Table 3. A summary of available types of lidar survey and platform methods. Type of lidar system
Typical uncertainty (3D, 1-σ)
Description Capabilities Limitations Studies
Airborne (ALS)
0.5 m (V: <0.1 m)
Sensor attached to fixed wing aircraft at 1000 m or more above ground. Co-acquired photographic images are becoming more common.
-Rapid coverage over large areas -Fairly uniform sampling -Can collect other remote sensing data simultaneously
-Large footprint -Poor coverage on vertical faces -Flight logistics
Hudnut et al. 2002, Messinger et al. 2010, Cowgill et al. 2010, Nissen et al. (2014)
UAS (ULS) 0.1-0.3 m
Lightweight sensor mounted to an unmanned aerial system. Flight heights are typically less than 150 m.
- Detailed information for a site - Pre-programmed flight paths - Nadir and oblique scanning possible
-Short flying time limits to relatively small areas. -Few systems available, experimental -Governmental restrictions
Glennie et al. 2013
Handheld/ backpack (hhLS)
0.1-0.3 m Sensor carried in hand or on a backpack frame.
-Flexible system -Indoor\Outdoor -Only one person required
-Slower than most other methods for large areas Glennie et al. 2013
Helicopter (HLS) 0.05-0.2 m
Sensor mounted to a helicopter flying closer to the ground.
-Similar to airborne, but closer to ground
-Flight logistics may be complicated -
Mobile (mTLS) 0.05-0.3 m
Sensor mounted to a vehicle and data are collected kinematic-ally while a vehicle is in motion.
-Fast coverage along highways
-Limited to navigable paths -Obstructions from traffic
Brooks and Glennie (2014), Guo et al. (In Prep), Gong et al. (2013), Chock et al. 2012, Yim et al. 2014
Static (sTLS)
0.005-0.05 m
Instrument is mounted to a tripod. Photographic images are often co-acquired. Typically implemented only for smaller sites.
-Highest resolution -Highest accuracy -Some flexibility -Indoor\outdoor
-Slower than other techniques -Non-uniform sampling
Kayen et al. 2006, Kayen 2010, Kayen et al. 2011, Olsen et al. 2012, Chock et al. 2012, Yim et al. 2014
Although not listed in Table 4, some technologies, such as commercial GPS and cameras, are useful to document an approximate location for observations, and are important to link fragmented observations together in a geospatial context. However, such systems are not accurate enough for directly measuring ground or structural deformations. While objects can be placed in the photograph to estimate scale enabling approximate measurements, image distortion effects can introduce additional uncertainty in those measurements. Hence, such measurements should be treated as approximations and their uncertainty should be considered in downstream analyses or modeling utilizing such measurements. It should also be noted that some techniques such as GNSS are needed to establish control for many of these technologies. For example, Figure 2 shows an example of sTLS data collected for a house damaged by rockfalls during the Canterbury Earthquake Sequence of 2010-2011. For this project, GPS coordinates were obtained through RS GNSS techniques for a few control points. A total station was then used to link the GPS control coordinates to targets contained with the scan data so that the data could be georeferenced.

sTLS, mTLS, hhTLS, HLS = Static, Mobile, Handheld, Helicopter laser scanning UAV-SfM = UAV based Structure from Motion (photogrammetry) hSfM = Handheld Structure from Motion Tot. Sta. = Total Station Air. Img. = Aerial imagery Sat. Img. = Satellite Imagery ALS = Airborne Laser Scanning Obliq. Img. = Oblique Imagery GBR = Ground-based radar Cons, GPS = Consumer grade GPS DGNSS = Mapping grade differential GNSS Dig. Level = Digital level PPP, K, RS, S GNSS = Precise Point Positioning, Kinematic, Rapid Static, and Static GNSS InSAR = Air or space borne Interferometric SAR
Figure 1. Plot highlighting optimal measurement uncertainty (1-σ) and typical spatial
resolution of sample points achievable by technologies. The number of spatial dimensions are indicated by blue (1D), red (2D), and black (3D) text.
Table 4. Decision matrix for geomatics technology selection based on event characteristics.
Spatial Area Impacted by Event
Local Site Neighborhood City State or Region
Def
orm
atio
ns D
ue to
Eve
nt
Maj
or
D >
0.1
m -sTLS
-hhTLS -hSfM -uSfM -GBR -GPR
-mLS -uSfM -Obliq. Img. -Air. Img. -K GNSS -RS GNSS
-ALS -HLS -mLS -Sat. Img. -InSAR -Air Img. -PPP GNSS
-Sat. Img. -InSAR -Geophysical monitoring networks
Mod
erat
e 0.
03 m
< D
< 0
.1 m
-sTLS -hhTLS -uSfM -GBR -GPR -Tot. Station
-mLS -uSfM -Obliq. Img. -InSAR -Air. Img. -K GNSS -RS GNSS
-HLS -Air. Img. -InSAR -K GNSS -RS GNSS
-InSAR -Geophysical monitoring networks
Min
or
D <
0.0
3 m
-sTLS -GPR -GBR -Tot. Station -Dig.Level
-sTLS -Tot. Station -Dig. Level -InSAR -GBR
-InSAR -S GNSS
-InSAR -Geophysical monitoring networks

Figure 2. Sample point cloud from a house damaged by rockfalls in Christchurch, New Zealand
using a total station to link lidar data to GNSS coordinates on control points. When such systems are used and rigorous geomatics collection and processing techniques are employed, data from multiple sources can be integrated geospatially with a high level of accuracy. The data acquired from these techniques can then be readily incorporated into a geographic information systems (GIS) database. Such integration enables rich comparisons of datasets, both spatially and temporally, and enables improved analyses of uncertainties. It also helps link fragmented case histories together into a common framework to produce richer sources of information for future studies.
Conclusions Geomatics technologies have evolved significantly in recent years and are an important component of documenting geotechnical case histories. This paper describes relevant technologies and provides guidance to utilize these technologies effectively in a broad range of reconnaissance or forensic investigations. The level of effort or detail required for a survey is ultimately dependent on the magnitude of the measurements to extract. While adherence to strict geomatics principles can result in the highest quality data, this may not be practical or achievable for specific missions. In such cases, it is important to document what procedures have and which have not been completed for the dataset so future users of the data can be appropriately informed. In particular, the uncertainty of the measurement is important to consider when performing analyses or developing models from such data. Not only is it important to collect information after these events, but detailed baseline information should be routinely collected in hazard-prone locations (Olsen et al. 2012). Such baseline survey information enables detailed evaluation of change after an event or failure.

Geophysical monitoring network such as the Pacific Boundary Observatory (UNAVCO) or high resolution terrain mapping such as the 3D Elevation Plan (USGS) are model examples of this effort to provide surveys of current conditions. Detailed baseline information can eventually lead to improved, proactive in situ analyses (e.g. Olsen 2015) and real time analysis rather than reactive and costly, post-event analyses.
Acknowledgments This material is partially based upon work supported by the National Science Foundation under Grant No. CMMI-1439773 and CMMI-1439883. Matt O’Banion and Patrick Burns (OSU) assisted with the acquisition of the sample scan.
References Al-Fares R. The Utility of Synthetic Aperture Radar (SAR) Interferometry in Monitoring Sinkhole Subsidence: Subsidence of the Devil's Throat Sinkhole Area (Nevada, USA). Sinkholes and the Engineering and Environmental Impacts of Karst 2005; 541-547.
Bardet J, Davis C. Performance of San Fernando Dams during 1994 Northridge Earthquake. J. Geotech. Engrg. 1996; 122(7): 554–564.
Beshr A. Structural Data Analysis for Monitoring the Deformation of Oil Storage Tanks Using Geodetic Techniques. J. Surv. Eng. 2014; 140(1): 44–51.
Brooks B, Glennie C. Mobile laser scanning geodesy: a complement to space-based methods. AGU Fall Meeting Abstracts 2014; G42A-05.
Chen Z, Hutchinson T. Urban Damage Estimation Using Statistical Processing of Satellite Images. J. Comput. Civ. Eng. 2007; 21(3): 187–199.
Chock G, Carden L, Robertson I, Olsen MJ, Yu G. Tohoku tsunami-induced building failure analysis with implications for U.S. tsunami and seismic design codes. Earthquake Spectra 2013; 29(S1): S99-125.
Cowgill E, Bernardin TS, Oskin ME, Bowles C, Yikilmaz MB, Kreylos O, Elliott AJ, Bishop MS, Kellogg LH. Analysis of LIDAR Data during Rapid Scientific Response to the January 12, 2010 Haiti Earthquake. Geological Society of American Abstracts with Programs 2010; 42(5): 154.
GEER. Geotechnical Extreme Events Reconnaissance. 2014. http://www.geerassociation.org/.
Glennie C, Brooks B, Ericksen T, Hauser D, Hudnut K, Foster J, Avery J. Compact Multipurpose Mobile Laser Scanning System-Initial Tests and Results. Remote Sens. 2013; 5(2): 521-538.
Gong J. Mobile LiDAR Data Collection and Analysis for Post-Sandy Disaster Recovery. International Workshop of Computing in Civil Engineering 2013. Los Angeles, CA
Guo M, Zhou Z, Gong J. Fusion of Geo-Tagged Post-Storm Damage Photos with Mobile LiDAR Data for Storm Surge Height Measurement. Journal of Computing in Civil Engineering.
Hudnut KW, Borsa A, Glennie C, Minster JB. High-resolution Topography Along Surface Ruptures of the October 16, 1999 Hector Mine, California, Earthquake (Mw7.1) From Airborne Laser Swath Mapping. Bulletin of the Seismological Society of America 2002; 92: 1570-1576.
Kayen R, Barnhardt W, Ashford S, Rollins K. Non-Destructive Measurement of Soil Liquefaction Density Change by Crosshole Radar Tomography, Treasure Island, California. Computer Simulation of Earthquake Effects 2000; 52-65.
Kayen R, Pack RT, Bay J, Sugimoto S, Tanaka H. Terrestrial-LIDAR Visualization of Surface and Structural Deformations of the 2004 Niigata Ken Chuetsu, Japan, Earthquake. Earthquake Spectra 2006; 22(S1): 147–162.
Kayen R, Stewart JP, Collins B. Recent Advances in Terrestrial LIDAR Applications in Geotechnical Earthquake Engineering. Proc. 5th Int. Conf. on Recent Advances in Geotechnical Earthquake Engineering and Soil Dynamics 2010; San Diego, California.
Kayen R, Tanaka Y, Tanaka H, Sugano T, Estevez IA, Cullenward SS, Yeh W, Thomas D. 2011. LIDAR and Field Investigation of the March 11, 2011 M9.0 Great Tohoku Offshore Earthquake, and April 7, 2011 M7.4 Aftershock. GEER Report No. GEER-025f.
Lattanzi D, Miller G. 3D Scene Reconstruction for Robotic Bridge Inspection. J. Infrastruct. Syst. 2014; 10.1061/(ASCE)IS.1943-555X.0000229, 04014041.
Nissen E, Arrowsmith R, Borsa A, Glennie C, Hinojosa-Corona A, Maruyama T, Oskin ME. New Observations of Coseismic Fault Zone Deformation from Differencing Pre- and Post-Earthquake Lidar Data. AGU Fall Meeting Abstracts 2014; T13C-4681.
Olsen MJ, Cheung KF, Yamazaki Y, Butcher S, Garlock M, Yim S, McGarity S, Robertson I, Burgos L, Young YL. Damage Assessment of the 2010 Chile Earthquake and Tsunami Using Terrestrial Laser Scanning. Earthquake Spectra 2012; 28(S1): S179–S197.
Olsen MJ, Kayen R. Post-Earthquake and Tsunami 3D Laser Scanning Forensic Investigations. In Proc. of Forensic Engineering 2012: Gateway to a Safer Tomorrow, ASCE; 477–486.
Olsen MJ, Chen Z, Hutchinson T, Kuester F. Optical Techniques for Multiscale Damage Assessment. Geomatics, Natural Hazards and Risk 2013; 4(1): 49–70.
Olsen MJ. In Situ Change Analysis and Monitoring through Terrestrial Laser Scanning. J. Comput. Civ. Eng. 2015; 29(2): 04014040.
Oommen T, Rebbapragada U, Cerminaro D. Earthquake Damage Assessment Using Objective Image Segmentation: A Case Study of 2010 Haiti Earthquake. Proc. ASCE GeoCongress 2012; 3069-3078.
Paradis M. De l'arpentage à la géomatique. Le géomètre canadien 1981; 35(3): 262.
Rathje E, Woo K, Crawford M. Spaceborne and Airborne Remote Sensing for Geotechnical Applications. Proc. ASCE GeoCongress 2006; 1-19.
Romo P, Keaton J. Reconnaissance Documentation of Geologic Structure Using Close-Range Terrestrial Photogrammetry. Proc. ASCE Geo-Congress 2013; 1578-1586.
Rosenblad B, Gomez F, Loehr J, Legarsky J, Jenkins W, Held B. Ground-based Interferometric Radar for Monitoring Slopes and Embankments. Proc. ASCE GeoCongress 2013; 323-332.
Shinozuka M, Ghanem R, Houshmand B, Mansouri B. Damage Detection in Urban Areas by SAR Imagery. J. Eng. Mech. 2000; 126(7): 769–777.
Suncar O, Dueri D, Yang D, Buckley S, Rathje E. Monitoring of a Creeping Landslide in California Using Spaceborne Radar Interferometry. Proc. ASCE GeoCongress 2012; 2991-3000.
Turker M, Cetinkaya B. Automatic detection of earthquake-damaged building using DEMs created from pre- and post-earthquake stereo aerial photographs. Int. J. of Remote Sensing 2005; 26(4): 823-832.
Wang S, Xu Y, Zhang H, Guo M, Gamage R, Yang H. Characterization of Rock Spatial Modeling and Quick Identification of Unstable Blocks Based on a Digital Photogrammetry. Advances in Pile Foundations, Geosynthetics, Geoinvestigations, and Foundation Failure Analysis and Repairs 2011; 259-267.
Yim S, Olsen MJ, Cheung KF, Azadbakht M. Tsunami Modeling, Fluid Load Simulation, and Validation Using Geospatial Field Data. J. Struct. Eng. 2014; 140: A4014012.