half year financial report · customers to secure high speed communication for data centers and iot...
TRANSCRIPT

Half Year Financial Report June 30, 2018
2
1. Management report for the six-month period ending June 30, 2018 1.1. Summary presentation of Inside Secure and activity during the first half of the year
Summary presentation of Inside Secure Inside Secure (the “Company” and, together with its subsidiaries, the “Group”) develops and markets embedded security software and IP-based technology components to secure transactions and digital identity and contents. In 2016, Inside Secure divested from its historical semiconductor product design and marketing business, to focus on its security software and intellectual component business. In 2017, the Company acquired all the shares of Meontrust, a Finland-based company and acquired the assets of California-based company SypherMedia International, Inc. (“SMI”) and took over its employees, two companies developing security software solutions and services. Activity during the first half of the year During the first half of 2018, Inside Secure delivered a strong performance both on revenue and profitability while continuing its investments across the product portfolio to fuel future growth. Revenue growth was particularly high, driven by strong business fundamentals over the period, new significant agreements with existing customers in the second quarter, and NFC patent license revenue. Inside Secure continued to significantly grow license revenue, leveraging its customer base and attracting new customers with bundled solutions to embed security at the heart of their products and secure their communications, as illustrated by the partnership with Kalray on intelligent processors and Andes on security processors for IoT in Asia. As expected, Inside Secure continued its research & development efforts across product portfolio to bring more value to customers in high potential verticals such as IoT and automotive by combining embedded security into chips with provisioning capacity of the acquired company SypherMedia to monitor security during the entire life cycle. Also, Inside Secure is developing new solutions to enable studios protecting their premium content revenue.
1.2. Accounting policies, presentation of financial statements The consolidated interim financial statements (see section 2 of this report) have been prepared in accordance with IAS 34, 'Interim financial reporting'. The consolidated interim financial information should be read in conjunction with the annual financial statements for the year ended December 31, 2017, which have been prepared in accordance with IFRS. Main accounting policies are detailed in note 3 of the notes to the interim consolidated financial statements as of June 30, 2018 and critical accounting estimates and judgments are detailed in note 4 of the notes. Presentation currency of the consolidated financial statements
The Group has elected the U.S. dollar as presentation currency of its consolidated financial statements. The U.S. dollar is the functional currency of the Company, and the currency in which most its transactions are denominated. It is the main currency used for the Group’s transactions.
The exchange rates for the euro, the Group’s second most employed currency after the U.S. dollar, for the six-month periods ended June 30, 2017 and 2018 and December 31, 2017, are as follows:
Dollar / Euro June 30, 2017 December 31, 2017 June 30, 2018 Closing 1.1412 1.1993 1.1658 Average 1.1229 1.1293 1.2108
3
Scope of consolidation
The Group’s scope of consolidation as of June 30, 2018 is detailed in note 22 to the interim consolidated financial statements. It did not change during the first six-month period ended June 30, 2018. Implementation of IFRS 15 The revenue and results of the company of the fiscal year 2017 and the half-year 2018 have been prepared in accordance with IFRS 15 "Revenue from Contracts with Customers", which was mandatory from January 1, 2018 and replaced IAS 18. The company had chosen to anticipate the implementation of the standard, in particular to be able to present a 2018 year directly comparable to 2017. The implementation of IFRS 15 has modified some of the company's revenue recognition principles. Under IAS 18, revenues from development agreements were recognized using the percentage-of-completion method, which consists of recognizing revenue as development progresses. The percentage of completion up to completion was based on the actual costs incurred compared to the total estimated cost of the project. Under IFRS 15, income related to a contract must be recognized over time if certain criteria are met, including the fact that the company has an enforceable right to payment of the value of the work carried out to date. If none of the criteria mentioned in the standard is met, revenue is recognized upon completion. This analysis is conducted by the company on a contract by contract basis. Royalties payable in relation with technology licensed to some of the company's customers may be fixed and/or variable. According to the previous company's policy, fixed royalties were recognized on a straight-line basis over the contractual periods. Variable royalties are generally based on sales by customers and are therefore by definition difficult to estimate. These fees were recognized on the basis of confirmations received from customers, generally in the quarter following the delivery of the products. According to IFRS 15, licenses sold by the company correspond to a "right to use" the intellectual property as it exists on the date on which the license is granted, in which case the fixed royalties must be recognized immediately on the date from which the customer can begin to use the license. This leads to recognize revenue earlier than before. In the case of variable royalties, royalties must be recognized as revenue as they become due, on the basis of sales made by the customer, and not on the date of confirmation by the customer. The company therefore now estimates the amount pending receipt of consumption confirmations. The implementation of IFRS 15 generally leads to faster recognition of revenue compared to IAS 18. For instance, in the first half of 2018, consolidated revenue was $22.5 million with IFRS 15 while it would have been $20.9 million using IAS 18. Complementatry non-GAAP financial measures The company uses performance indicators that are not strictly accounting measures and that are defined below. These indicators are not defined under IFRS and do not constitute accounting elements used to measure the Group's financial performance. They should be considered as additional information, which cannot replace any other strictly accounting-based operating or financial performance measure, as presented in the Group's consolidated financial statements and their related notes. The Group uses these indicators because it believes they are useful measures of its recurring operating performance and its operating cash flows. Although they are widely used by companies operating in the same industry around the world, these indicators are not necessarily directly comparable to those of other companies, which may have defined or calculated their indicators differently than the Group, even though they use similar terms. Adjusted gross profit is defined as gross profit before (i) the amortization of intangible assets related to business combinations, (ii) any potential goodwill impairment, (iii) share-based payment expense and (iv) non-recurring costs associated with restructuring and business combinations undertaken by the Company.
4
Adjusted operating income/(loss) is defined as operating income/(loss) before (i) the amortization of intangible assets related to business combinations, (ii) any potential goodwill impairment, (iii) share-based payment expense and (iv) non-recurring costs associated with restructuring and business combinations undertaken by the Company. EBITDA is defined as adjusted operating income before depreciation, amortization and impairment losses not related to business combinations. The reconciliation from adjusted financial measures to consolidated IFRS reporting can be found in appendix to this report.
1.3. Review of the consolidated interim financial statements The condensed consolidated interim financial statements presented herein were examined by the Company’s board of directors. They have been subject to a limited review by auditors, report of whom can be found in section 3 of this report. It should be recalled that the Company's half-year results are not representative of those for the full fiscal year. Q2 2018 and H1 2018 revenue
Q2 2018 Revenue Consolidated revenue (IFRS) In Q2 2018, the company generated $12.4 million in revenue, including $10.6 million from its core business revenue and $1.8 million from the company’s NFC patent licensing program with France Brevets which signed a new license with a major Chinese handset and telecom equipment company. Revenue growth was particularly high at 67% in Q2 2018 as compared to Q2 2017 based on strong business traction, NFC-patent revenue and, new deliveries to three significant existing customers in Silicon IP core technology, driving accelerated revenue recognition under IFRS 15 (see appendix 3 on IFRS 15). Core business revenue Core security software and technology licensing business revenue was $10.6 million in Q2 2018, up 43 percent year-on-year (up 36 percent organically excluding the two businesses acquired in 2017). License revenue grew significantly in Q2 2018 to $3.7 million, up 48 percent vs. Q2 2017, primarily driven by the silicon IP product line. This quarter, the company continued to win new designs, both at existing and new customers, to embed security functions into general purposes chips, notably for IoT, cloud connectivity and connected and autonomous cars. As an example, the company was chosen by fabless semiconductor company Kalray to provide embedded security into their new intelligent processors for data centers and autonomous cars while signing an agreement with Andes to deliver secure IoT solutions to chipmakers in Asia. The Company also leveraged the businesses acquired in 2017 as reflected in the deal with NationalChip on Syphermedia’s secure provisioning for device
(in thousands of US$) Q2-2018 Q2-2017 Q2 2018 vs. Q2 2017 H1-2018 H1-2017 H1 2018
vs. H1 2017
Licenses 3 718 2 518 48% 6 572 4 846 36%Royalties 5 443 3 731 46% 11 441 7 186 59%Maintenance and other 1 409 1 142 23% 2 673 2 326 15%
Total revenue of core business 10 570 7 391 43% 20 686 14 359 44%
Unallocated revenue (*) 1 806 - 1 806 -
Total consolidated revenue 12 376 7 391 67% 22 492 14 359 57%
(*) unallocated amounts correspond to non-recurring revenue, in particular NFC patent licenses
5
lifecycle management in China. It also integrated Meontrust strong authentication platform into its bundled solutions for markets such as entertainment and financial. Revenue from royalties was $5.4 million in Q2 2018, up 46 percent vs. Q2 2017 (up 35 percent organically), notably driven by the contribution of the historical U.S. customer and growth at customers in digital content and in secure communications as the result of licenses signed previously with customers to secure high speed communication for data centers and IoT solutions. Maintenance and other revenues in Q2 2018 increased by 23 percent year-on-year at $1.4 million, in line with the company’s increased business perimeter. H1 2018 Revenue In H1 2018, consolidated revenue was $22.5 million as compared to $14.4 million in H1 2017, driven by strong growth of the core business over the period, new significant agreements with existing customers in the second quarter and NFC patent-related revenue (vs. nil in H1 2017). Core security software and technology licensing business revenue was $20.7 million in H1 2018, up 44 percent year-on-year. Excluding contribution of the two businesses acquired in 2017, revenue was up 36 percent year-on-year as the company continued to leverage its portfolio to gain traction in high potential markets such as data centers, IoT and automotive while benefiting from low royalties revenue from the historical U.S. customer in the defense industry. Adjusted operating income and EBITDA Core business adjusted gross profit >95%, reflecting the software business model In H1 2018, adjusted gross profit of the core business grew from $14.0 in H1 2017 to $20.0 million, in line with revenue growth with a gross margin of the core business stable at 96.4 percent of revenue. Consolidated gross profit increased from $13.7 million in H1 2017 to $21.0 million in H1 2018. Gross margin slightly decreased from 95.6 percent to 93.4 percent of revenue due to the product mix. As a reminder, the NFC patent license program generates a lower gross margin than the company’s core software and technology licensing business, but bears practically no fixed cost. Increase in operating expenses, as anticipated
As expected, the company’s operating expenses increased from $13.7 million in H1 2017 to $18.3 million in H1 2018. This is the result of incremental operating expenses derived from the two acquisitions completed in 2017 ($1.9 million) and the impact of a stronger EUR vs. US in the first-half of the year ($0.9 million). At the same time, the company leveraged its resources to pursue its investments notably in research & development to expand its offer to serve high growth potential markets such as IoT and automotive. Adjusted operating income and EBITDA reflecting operating leverage Due to revenue growth and operating leverage, adjusted operating income of the core business increased significantly from $0.3 million in H1 2017 to $1.7 million in H1 2018 and EBITDA from $0.6 million in H1 2017 to $1.9 million in H1 2018. Thanks to the contribution from the core business and NFC patent licensing, adjusted operating income increased from $0.1 million in H1 2017 to $2.7 million in H1 2018, and EBITDA from $0.6 million to $3.2 million. Consequently, EBITDA margin increased from 4 percent of consolidated revenue in H1 2017 to 14 percent of consolidated revenue in H1 2018.
6
Operating income (IFRS)
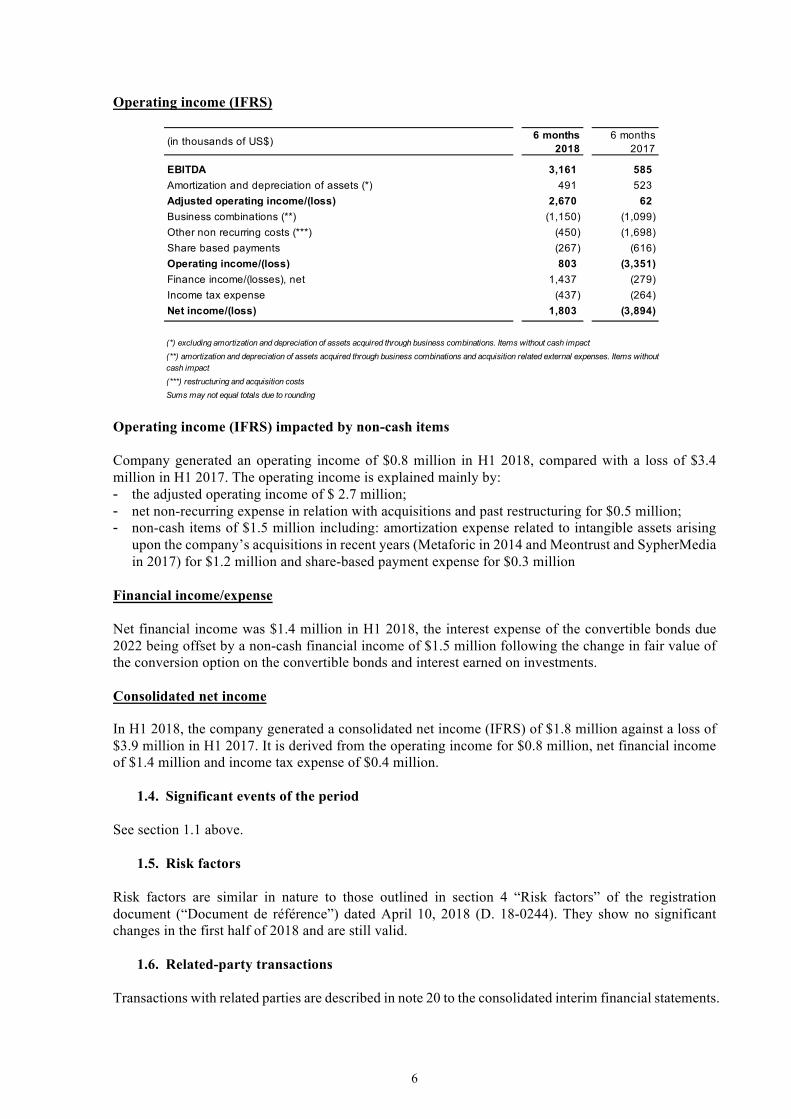
Operating income (IFRS) impacted by non-cash items Company generated an operating income of $0.8 million in H1 2018, compared with a loss of $3.4 million in H1 2017. The operating income is explained mainly by: - the adjusted operating income of $ 2.7 million; - net non-recurring expense in relation with acquisitions and past restructuring for $0.5 million; - non-cash items of $1.5 million including: amortization expense related to intangible assets arising
upon the company’s acquisitions in recent years (Metaforic in 2014 and Meontrust and SypherMedia in 2017) for $1.2 million and share-based payment expense for $0.3 million
Financial income/expense Net financial income was $1.4 million in H1 2018, the interest expense of the convertible bonds due 2022 being offset by a non-cash financial income of $1.5 million following the change in fair value of the conversion option on the convertible bonds and interest earned on investments. Consolidated net income
In H1 2018, the company generated a consolidated net income (IFRS) of $1.8 million against a loss of $3.9 million in H1 2017. It is derived from the operating income for $0.8 million, net financial income of $1.4 million and income tax expense of $0.4 million.
1.4. Significant events of the period See section 1.1 above.
1.5. Risk factors Risk factors are similar in nature to those outlined in section 4 “Risk factors” of the registration document (“Document de référence”) dated April 10, 2018 (D. 18-0244). They show no significant changes in the first half of 2018 and are still valid.
1.6. Related-party transactions Transactions with related parties are described in note 20 to the consolidated interim financial statements.
(in thousands of US$) 6 months 2018
6 months 2017
EBITDA 3,161 585 Amortization and depreciation of assets (*) 491 523 Adjusted operating income/(loss) 2,670 62 Business combinations (**) (1,150) (1,099)Other non recurring costs (***) (450) (1,698)Share based payments (267) (616)Operating income/(loss) 803 (3,351)Finance income/(losses), net 1,437 (279)Income tax expense (437) (264)Net income/(loss) 1,803 (3,894)
(***) restructuring and acquisition costs Sums may not equal totals due to rounding
(*) excluding amortization and depreciation of assets acquired through business combinations. Items without cash impact(**) amortization and depreciation of assets acquired through business combinations and acquisition related external expenses. Items without cash impact
7
1.7. Outlook In the first half of 2018, the company achieved significant growth with a particularly high performance in the second quarter based on strong business traction, new significant agreements with existing customers and NFC license revenue, while royalties derived from a historical U.S. customer in defense was low. In this context, the company reiterates its anticipation of robust top line growth in 2018, more than off-setting the anticipated decline of a U.S customer which generated an exceptionally high level of revenue from royalties in the second had of 2017. Based on current investment run rate, a continuous agile monitoring of research & development resources, and a lower euro vs. dollar than anticipated, the company now anticipates adjusted operating expenses to increase to between $36 million and $37 million in 2018 vs. a range of $38.5 million and $40.0 million communicated previously. The company confirms to generate positive EBITDA in 2018 before getting back to a normative EBITDA margin greater than 20 percent.
1.8. Subsequent events None.
8
2. Condensed interim consolidated financial statements
Interim consolidated income statement
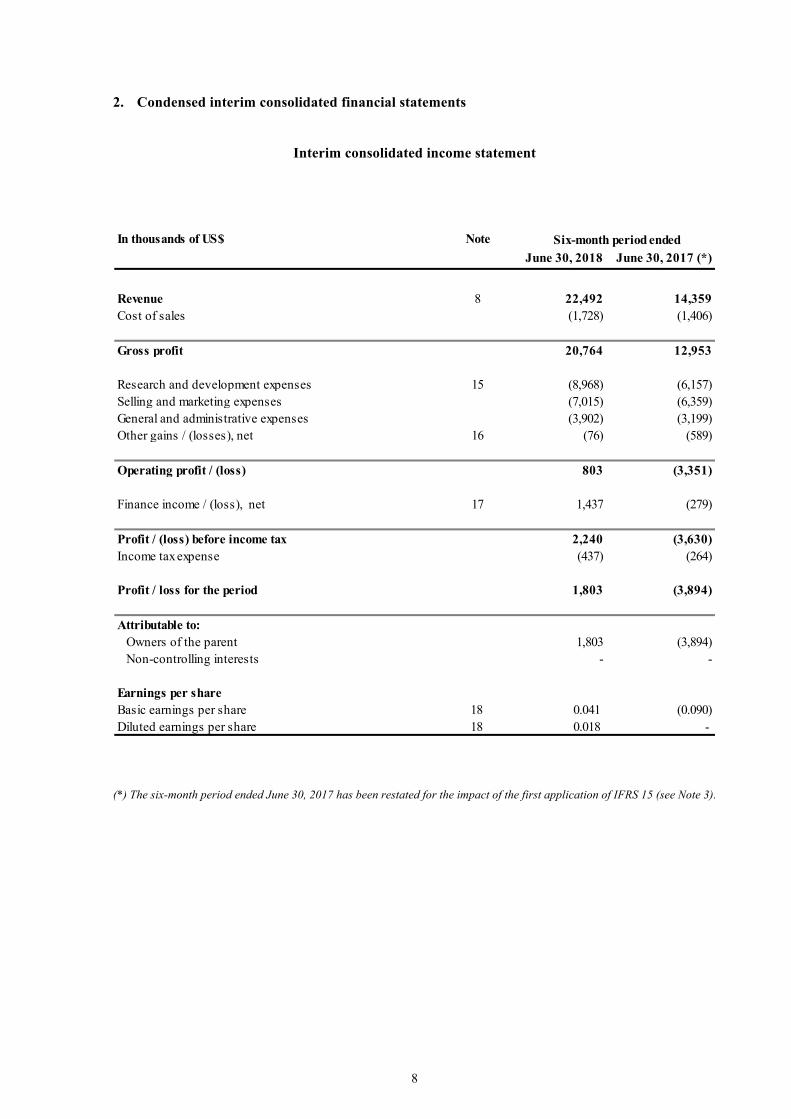
(*) The six-month period ended June 30, 2017 has been restated for the impact of the first application of IFRS 15 (see Note 3).
In thousands of US$ NoteJune 30, 2018 June 30, 2017 (*)
Revenue 8 22,492 14,359 Cost of sales (1,728) (1,406)
Gross profit 20,764 12,953
Research and development expenses 15 (8,968) (6,157)Selling and marketing expenses (7,015) (6,359)General and administrative expenses (3,902) (3,199)Other gains / (losses), net 16 (76) (589)
Operating profit / (loss) 803 (3,351)
Finance income / (loss), net 17 1,437 (279)
Profit / (loss) before income tax 2,240 (3,630)Income tax expense (437) (264)
Profit / loss for the period 1,803 (3,894)
Attributable to:Owners of the parent 1,803 (3,894)Non-controlling interests - -
Earnings per shareBasic earnings per share 18 0.041 (0.090)Diluted earnings per share 18 0.018 -
Six-month period ended

9
Interim consolidated statement of comprehensive income
(*) The six-month period ended June 30, 2017 has been restated for the impact of the first application of IFRS 15 (see Note 3).
In thousands of US$June 30, 2018 June 30, 2017 (*)
Profit / loss for the period 1,803 (3,894)
3 (76)Non-reclassifiable components of other comprehensive income 3 (76)
Financial instrument fair value changes (240) 115 Currency translation differences 259 (654)Reclassifiable components of other comprehensive income 19 (539)
Total comprehensive profit / (loss) for the period 1,825 (4,509)
Attributable to:Owners of the parent 1,825 (4,509)Non-controlling interests - -
Total comprehensive profit / (loss) for the period 1,825 (4,509)
Actuarial gain / (loss) on retirement benefit obligations
Six-month period ended

10
Interim consolidated balance sheet – Assets
In thousands of US$ Note June 30, 2018 December 31, 2017
Goodwill 29,508 29,563 Intangible assets 9 6,960 8,478 Property and equipment 1,289 1,269 Other receivables 11 1,034 1,676
Non-current assets 38,791 40,986
Inventories 65 219 Trade receivables 10 12,635 15,531 Other receivables 11 2,947 3,390 Derivative financial instruments - 215 Cash and cash equivalents 49,075 45,874
Current assets 64,722 65,230
Total assets 103,513 106,216
11
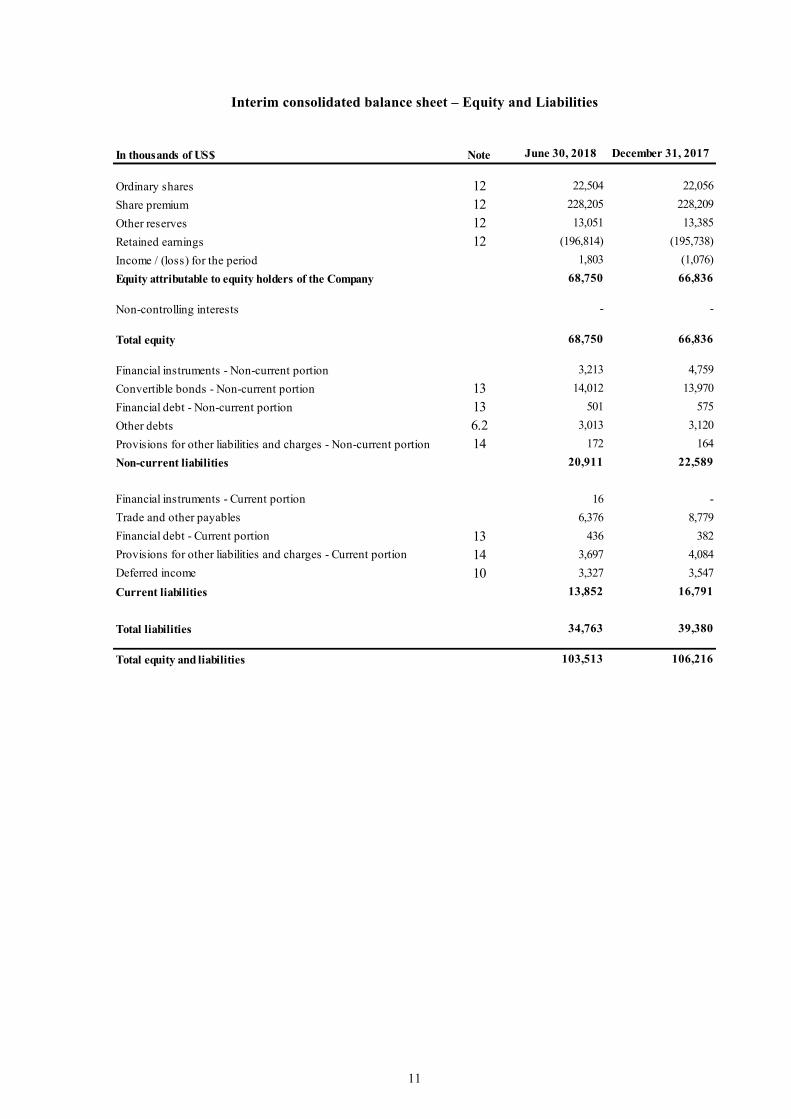
Interim consolidated balance sheet – Equity and Liabilities
In thousands of US$ Note June 30, 2018 December 31, 2017
Ordinary shares 12 22,504 22,056 Share premium 12 228,205 228,209 Other reserves 12 13,051 13,385 Retained earnings 12 (196,814) (195,738)Income / (loss) for the period 1,803 (1,076)Equity attributable to equity holders of the Company 68,750 66,836
Non-controlling interests - -
Total equity 68,750 66,836
Financial instruments - Non-current portion 3,213 4,759 Convertible bonds - Non-current portion 13 14,012 13,970 Financial debt - Non-current portion 13 501 575 Other debts 6.2 3,013 3,120 Provisions for other liabilities and charges - Non-current portion 14 172 164 Non-current liabilities 20,911 22,589
Financial instruments - Current portion 16 - Trade and other payables 6,376 8,779 Financial debt - Current portion 13 436 382 Provisions for other liabilities and charges - Current portion 14 3,697 4,084 Deferred income 10 3,327 3,547 Current liabilities 13,852 16,791
Total liabilities 34,763 39,380
Total equity and liabilities 103,513 106,216
12
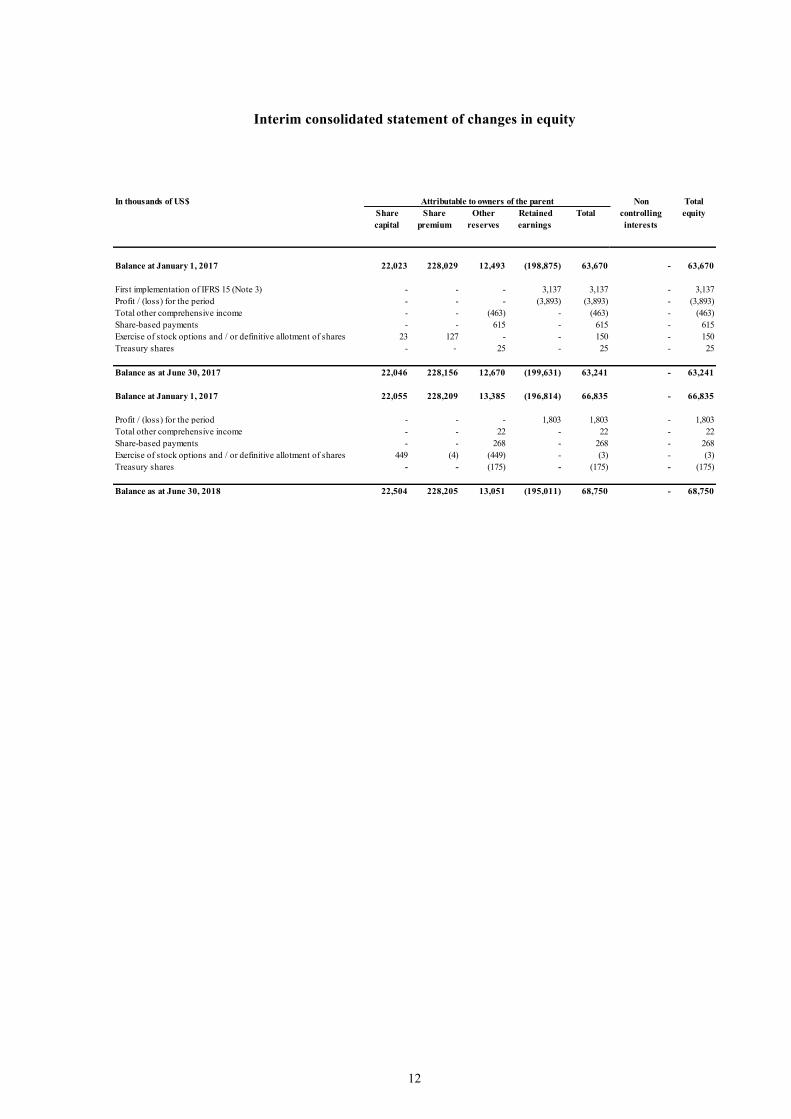
Interim consolidated statement of changes in equity
In thousands of US$Share capital
Share premium
Other reserves
Retained earnings
Total
Balance at January 1, 2017 22,023 228,029 12,493 (198,875) 63,670 - 63,670
First implementation of IFRS 15 (Note 3) - - - 3,137 3,137 - 3,137 Profit / (loss) for the period - - - (3,893) (3,893) - (3,893)Total other comprehensive income - - (463) - (463) - (463)Share-based payments - - 615 - 615 - 615 Exercise of stock options and / or definitive allotment of shares 23 127 - - 150 - 150 Treasury shares - - 25 - 25 - 25
Balance as at June 30, 2017 22,046 228,156 12,670 (199,631) 63,241 - 63,241
Balance at January 1, 2017 22,055 228,209 13,385 (196,814) 66,835 - 66,835
Profit / (loss) for the period - - - 1,803 1,803 - 1,803 Total other comprehensive income - - 22 - 22 - 22 Share-based payments - - 268 - 268 - 268 Exercise of stock options and / or definitive allotment of shares 449 (4) (449) - (3) - (3)Treasury shares - - (175) - (175) - (175)
Balance as at June 30, 2018 22,504 228,205 13,051 (195,011) 68,750 - 68,750
Attributable to owners of the parent Non controlling interests
Total equity
13
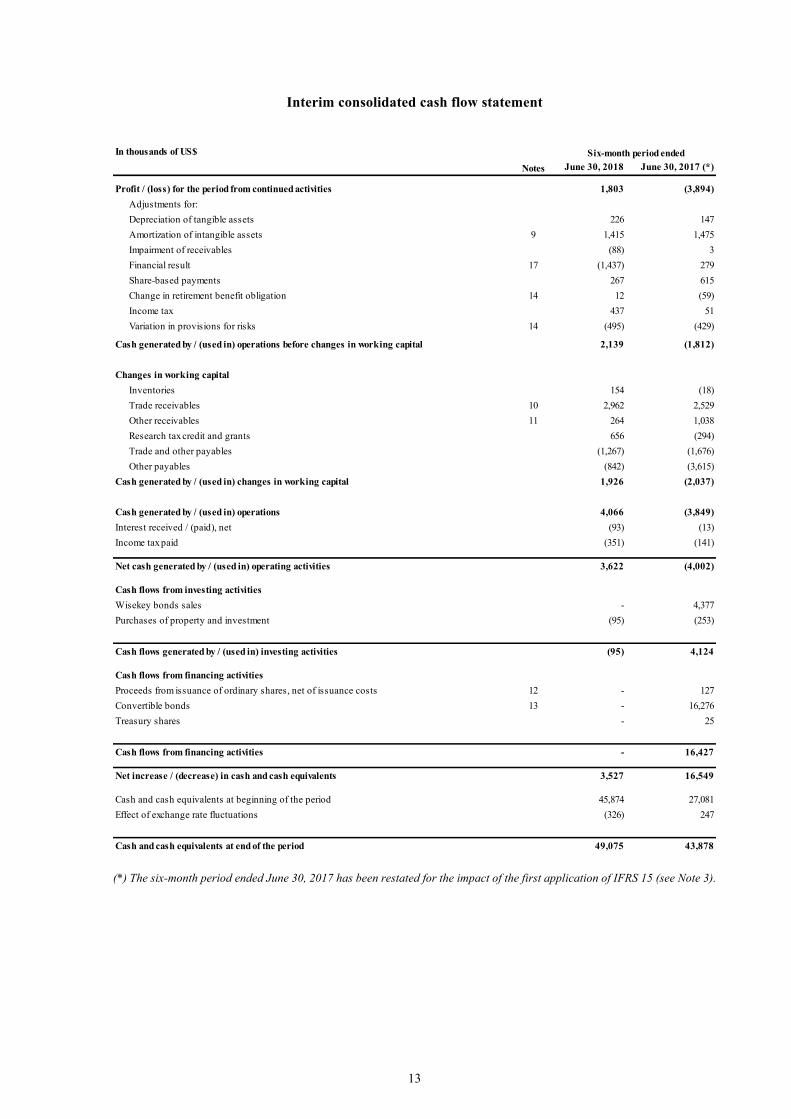
Interim consolidated cash flow statement
(*) The six-month period ended June 30, 2017 has been restated for the impact of the first application of IFRS 15 (see Note 3).
In thousands of US$
Notes June 30, 2018 June 30, 2017 (*)
Profit / (loss) for the period from continued activities 1,803 (3,894)Adjustments for:Depreciation of tangible assets 226 147 Amortization of intangible assets 9 1,415 1,475 Impairment of receivables (88) 3 Financial result 17 (1,437) 279 Share-based payments 267 615 Change in retirement benefit obligation 14 12 (59)Income tax 437 51 Variation in provisions for risks 14 (495) (429)
Cash generated by / (used in) operations before changes in working capital 2,139 (1,812)
Changes in working capitalInventories 154 (18)Trade receivables 10 2,962 2,529 Other receivables 11 264 1,038 Research tax credit and grants 656 (294)Trade and other payables (1,267) (1,676)Other payables (842) (3,615)
Cash generated by / (used in) changes in working capital 1,926 (2,037)
Cash generated by / (used in) operations 4,066 (3,849)Interest received / (paid), net (93) (13)Income tax paid (351) (141)
Net cash generated by / (used in) operating activities 3,622 (4,002)
Cash flows from investing activitiesWisekey bonds sales - 4,377 Purchases of property and investment (95) (253)
Cash flows generated by / (used in) investing activities (95) 4,124
Cash flows from financing activitiesProceeds from issuance of ordinary shares, net of issuance costs 12 - 127 Convertible bonds 13 - 16,276 Treasury shares - 25
Cash flows from financing activities - 16,427
Net increase / (decrease) in cash and cash equivalents 3,527 16,549
Cash and cash equivalents at beginning of the period 45,874 27,081 Effect of exchange rate fluctuations (326) 247
Cash and cash equivalents at end of the period 49,075 43,878
Six-month period ended
14
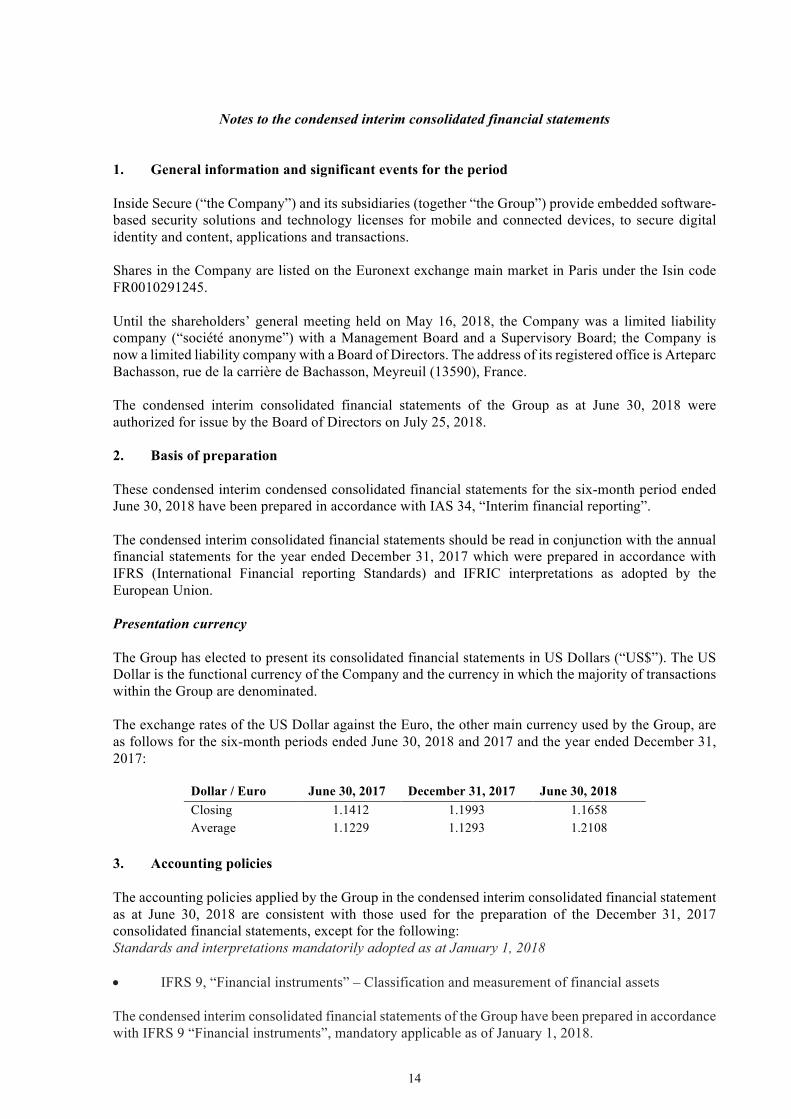
Notes to the condensed interim consolidated financial statements
1. General information and significant events for the period Inside Secure (“the Company”) and its subsidiaries (together “the Group”) provide embedded software-based security solutions and technology licenses for mobile and connected devices, to secure digital identity and content, applications and transactions. Shares in the Company are listed on the Euronext exchange main market in Paris under the Isin code FR0010291245. Until the shareholders’ general meeting held on May 16, 2018, the Company was a limited liability company (“société anonyme”) with a Management Board and a Supervisory Board; the Company is now a limited liability company with a Board of Directors. The address of its registered office is Arteparc Bachasson, rue de la carrière de Bachasson, Meyreuil (13590), France. The condensed interim consolidated financial statements of the Group as at June 30, 2018 were authorized for issue by the Board of Directors on July 25, 2018. 2. Basis of preparation These condensed interim condensed consolidated financial statements for the six-month period ended June 30, 2018 have been prepared in accordance with IAS 34, “Interim financial reporting”. The condensed interim consolidated financial statements should be read in conjunction with the annual financial statements for the year ended December 31, 2017 which were prepared in accordance with IFRS (International Financial reporting Standards) and IFRIC interpretations as adopted by the European Union. Presentation currency The Group has elected to present its consolidated financial statements in US Dollars (“US$”). The US Dollar is the functional currency of the Company and the currency in which the majority of transactions within the Group are denominated. The exchange rates of the US Dollar against the Euro, the other main currency used by the Group, are as follows for the six-month periods ended June 30, 2018 and 2017 and the year ended December 31, 2017:
Dollar / Euro June 30, 2017 December 31, 2017 June 30, 2018 Closing 1.1412 1.1993 1.1658 Average 1.1229 1.1293 1.2108
3. Accounting policies The accounting policies applied by the Group in the condensed interim consolidated financial statement as at June 30, 2018 are consistent with those used for the preparation of the December 31, 2017 consolidated financial statements, except for the following: Standards and interpretations mandatorily adopted as at January 1, 2018 • IFRS 9, “Financial instruments” – Classification and measurement of financial assets The condensed interim consolidated financial statements of the Group have been prepared in accordance with IFRS 9 “Financial instruments”, mandatory applicable as of January 1, 2018.
15
This standard replaces IAS 39 “Financial instruments – Recognition and measurement” as well as all existing interpretations and introduces new provisions regarding classification, measurement and impairment of financial instruments and new principles regarding hedge accounting. The new standard main provisions are as follows:
- A new classification of financial instruments based on the management model and contractual terms of the financial instruments:
o The Group’s financial assets and liabilities excluding trade receivables are not impacted by the changes of IFRS 9 regarding classification and measurement.
- A new impairment model of financial assets, based on expected credit losses replacing the model which was based on incurred losses:
o The impact as at January 1, 2018 of the new impairment method of financial assets on the opening equity balances has been deemed immaterial and as such it has not been accounted for by the Group.
- New principles relating to hedge accounting focusing on an economic analysis of the existing hedges, aiming to align the accounting treatment with the Group’s risk management policy:
o This topic is optional. The Group decided to adopt it as of January 1, 2018. This new hedge accounting method has no impact on opening equity.
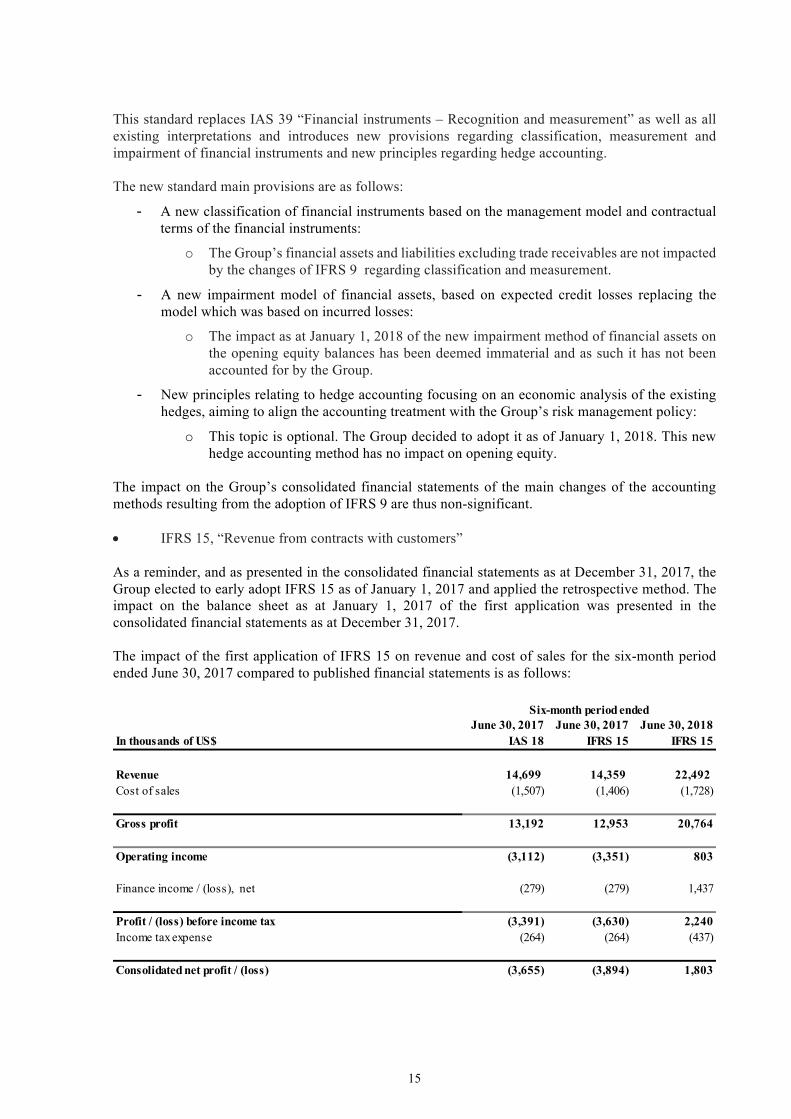
The impact on the Group’s consolidated financial statements of the main changes of the accounting methods resulting from the adoption of IFRS 9 are thus non-significant. • IFRS 15, “Revenue from contracts with customers” As a reminder, and as presented in the consolidated financial statements as at December 31, 2017, the Group elected to early adopt IFRS 15 as of January 1, 2017 and applied the retrospective method. The impact on the balance sheet as at January 1, 2017 of the first application was presented in the consolidated financial statements as at December 31, 2017. The impact of the first application of IFRS 15 on revenue and cost of sales for the six-month period ended June 30, 2017 compared to published financial statements is as follows:
In thousands of US$June 30, 2017
IAS 18June 30, 2017
IFRS 15June 30, 2018
IFRS 15
Revenue 14,699 14,359 22,492 Cost of sales (1,507) (1,406) (1,728)
Gross profit 13,192 12,953 20,764
Operating income (3,112) (3,351) 803
Finance income / (loss), net (279) (279) 1,437
Profit / (loss) before income tax (3,391) (3,630) 2,240 Income tax expense (264) (264) (437)
Consolidated net profit / (loss) (3,655) (3,894) 1,803
Six-month period ended
16
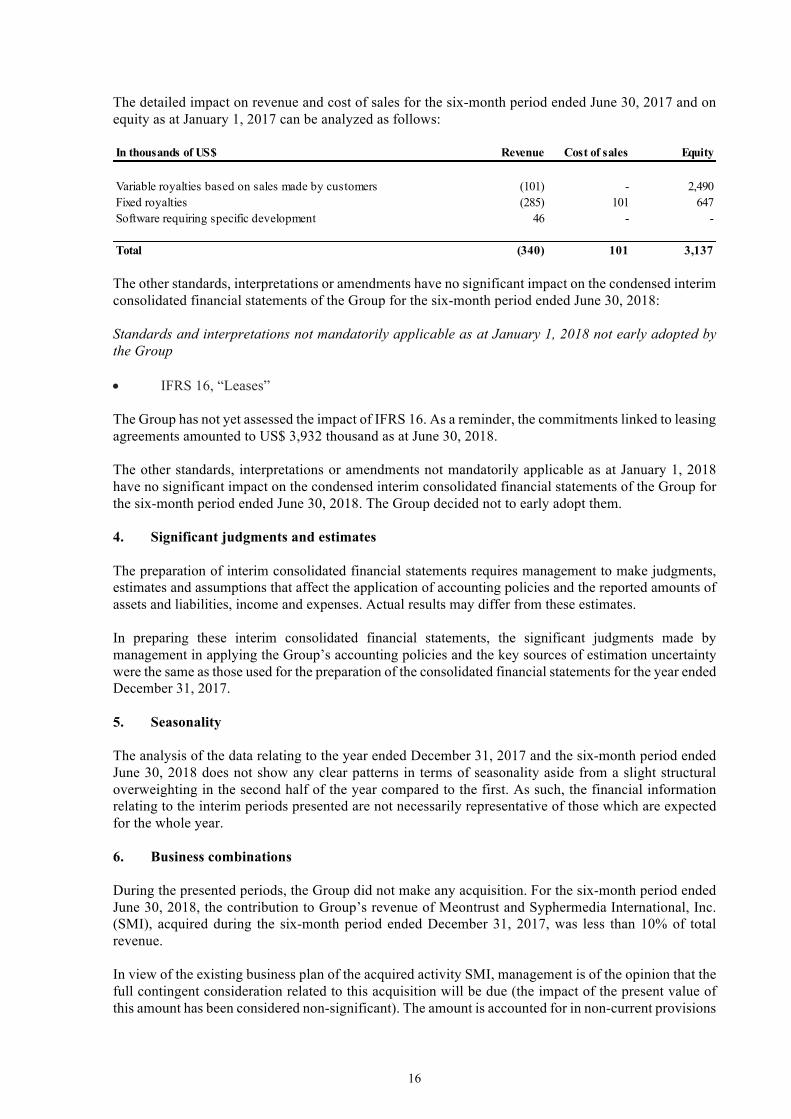
The detailed impact on revenue and cost of sales for the six-month period ended June 30, 2017 and on equity as at January 1, 2017 can be analyzed as follows:
The other standards, interpretations or amendments have no significant impact on the condensed interim consolidated financial statements of the Group for the six-month period ended June 30, 2018: Standards and interpretations not mandatorily applicable as at January 1, 2018 not early adopted by the Group • IFRS 16, “Leases” The Group has not yet assessed the impact of IFRS 16. As a reminder, the commitments linked to leasing agreements amounted to US$ 3,932 thousand as at June 30, 2018. The other standards, interpretations or amendments not mandatorily applicable as at January 1, 2018 have no significant impact on the condensed interim consolidated financial statements of the Group for the six-month period ended June 30, 2018. The Group decided not to early adopt them. 4. Significant judgments and estimates The preparation of interim consolidated financial statements requires management to make judgments, estimates and assumptions that affect the application of accounting policies and the reported amounts of assets and liabilities, income and expenses. Actual results may differ from these estimates. In preparing these interim consolidated financial statements, the significant judgments made by management in applying the Group’s accounting policies and the key sources of estimation uncertainty were the same as those used for the preparation of the consolidated financial statements for the year ended December 31, 2017. 5. Seasonality The analysis of the data relating to the year ended December 31, 2017 and the six-month period ended June 30, 2018 does not show any clear patterns in terms of seasonality aside from a slight structural overweighting in the second half of the year compared to the first. As such, the financial information relating to the interim periods presented are not necessarily representative of those which are expected for the whole year. 6. Business combinations During the presented periods, the Group did not make any acquisition. For the six-month period ended June 30, 2018, the contribution to Group’s revenue of Meontrust and Syphermedia International, Inc. (SMI), acquired during the six-month period ended December 31, 2017, was less than 10% of total revenue. In view of the existing business plan of the acquired activity SMI, management is of the opinion that the full contingent consideration related to this acquisition will be due (the impact of the present value of this amount has been considered non-significant). The amount is accounted for in non-current provisions
In thousands of US$ Revenue Cost of sales Equity
Variable royalties based on sales made by customers (101) - 2,490 Fixed royalties (285) 101 647 Software requiring specific development 46 - -
Total (340) 101 3,137
17
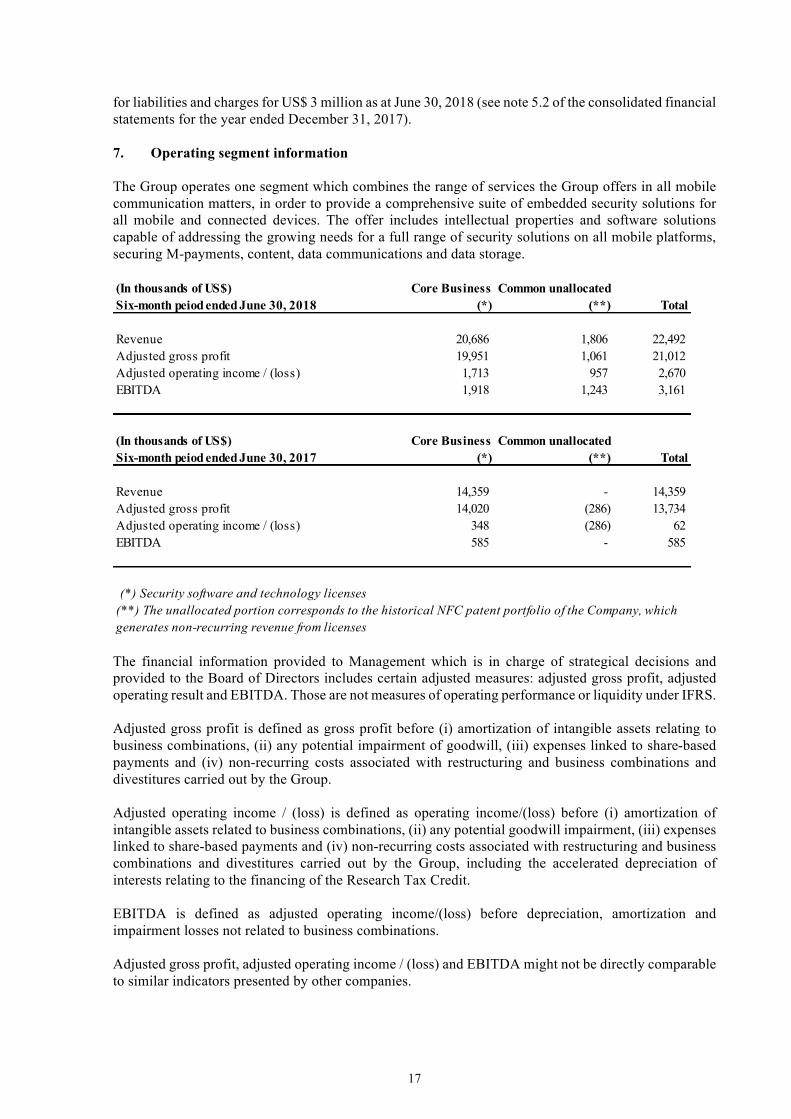
for liabilities and charges for US$ 3 million as at June 30, 2018 (see note 5.2 of the consolidated financial statements for the year ended December 31, 2017). 7. Operating segment information The Group operates one segment which combines the range of services the Group offers in all mobile communication matters, in order to provide a comprehensive suite of embedded security solutions for all mobile and connected devices. The offer includes intellectual properties and software solutions capable of addressing the growing needs for a full range of security solutions on all mobile platforms, securing M-payments, content, data communications and data storage.
The financial information provided to Management which is in charge of strategical decisions and provided to the Board of Directors includes certain adjusted measures: adjusted gross profit, adjusted operating result and EBITDA. Those are not measures of operating performance or liquidity under IFRS. Adjusted gross profit is defined as gross profit before (i) amortization of intangible assets relating to business combinations, (ii) any potential impairment of goodwill, (iii) expenses linked to share-based payments and (iv) non-recurring costs associated with restructuring and business combinations and divestitures carried out by the Group. Adjusted operating income / (loss) is defined as operating income/(loss) before (i) amortization of intangible assets related to business combinations, (ii) any potential goodwill impairment, (iii) expenses linked to share-based payments and (iv) non-recurring costs associated with restructuring and business combinations and divestitures carried out by the Group, including the accelerated depreciation of interests relating to the financing of the Research Tax Credit. EBITDA is defined as adjusted operating income/(loss) before depreciation, amortization and impairment losses not related to business combinations. Adjusted gross profit, adjusted operating income / (loss) and EBITDA might not be directly comparable to similar indicators presented by other companies.
(In thousands of US$)Six-month peiod ended June 30, 2018
Core Business (*)
Common unallocated (**) Total
Revenue 20,686 1,806 22,492 Adjusted gross profit 19,951 1,061 21,012 Adjusted operating income / (loss) 1,713 957 2,670 EBITDA 1,918 1,243 3,161
(In thousands of US$)Six-month peiod ended June 30, 2017
Core Business (*)
Common unallocated (**) Total
Revenue 14,359 - 14,359 Adjusted gross profit 14,020 (286) 13,734 Adjusted operating income / (loss) 348 (286) 62 EBITDA 585 - 585
(*) Security software and technology licenses (**) The unallocated portion corresponds to the historical NFC patent portfolio of the Company, which generates non-recurring revenue from licenses
18
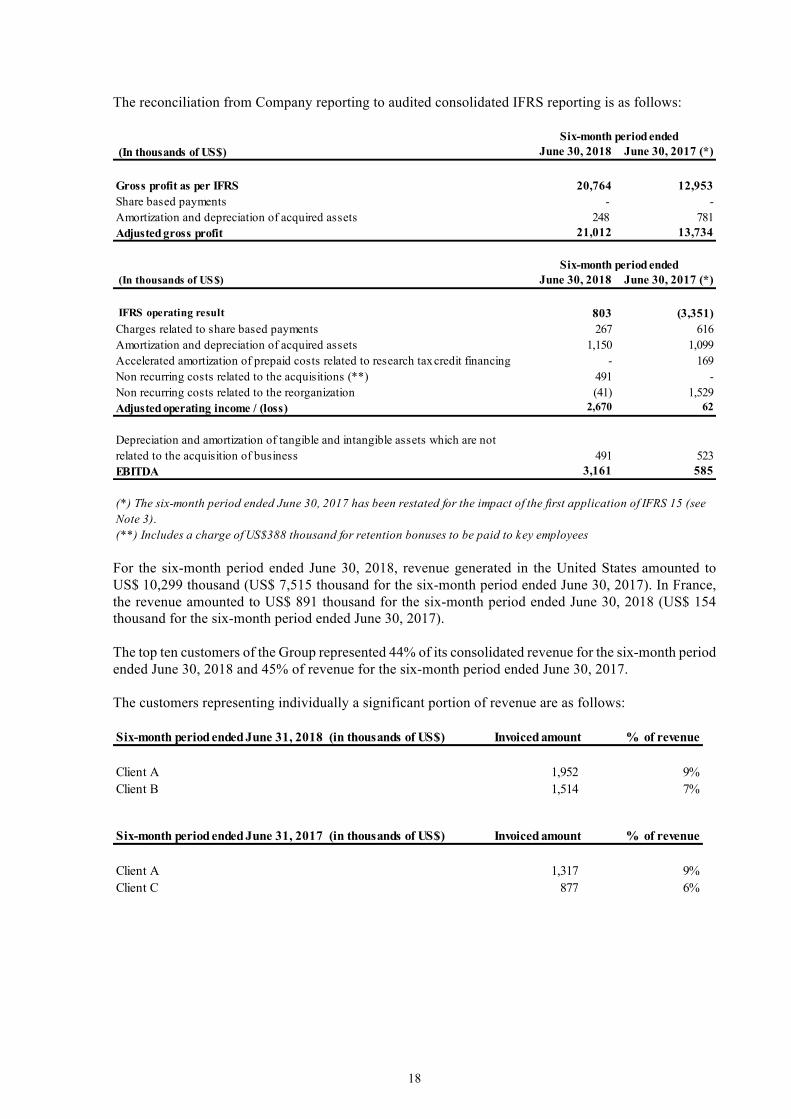
The reconciliation from Company reporting to audited consolidated IFRS reporting is as follows:
For the six-month period ended June 30, 2018, revenue generated in the United States amounted to US$ 10,299 thousand (US$ 7,515 thousand for the six-month period ended June 30, 2017). In France, the revenue amounted to US$ 891 thousand for the six-month period ended June 30, 2018 (US$ 154 thousand for the six-month period ended June 30, 2017). The top ten customers of the Group represented 44% of its consolidated revenue for the six-month period ended June 30, 2018 and 45% of revenue for the six-month period ended June 30, 2017. The customers representing individually a significant portion of revenue are as follows:
(In thousands of US$) June 30, 2018 June 30, 2017 (*)
Gross profit as per IFRS 20,764 12,953 Share based payments - - Amortization and depreciation of acquired assets 248 781 Adjusted gross profit 21,012 13,734
(In thousands of US$) June 30, 2018 June 30, 2017 (*)
IFRS operating result 803 (3,351)Charges related to share based payments 267 616 Amortization and depreciation of acquired assets 1,150 1,099 Accelerated amortization of prepaid costs related to research tax credit financing - 169 Non recurring costs related to the acquisitions (**) 491 - Non recurring costs related to the reorganization (41) 1,529 Adjusted operating income / (loss) 2,670 62
Depreciation and amortization of tangible and intangible assets which are not related to the acquisition of business 491 523 EBITDA 3,161 585
(**) Includes a charge of US$388 thousand for retention bonuses to be paid to key employees
Six-month period ended
Six-month period ended
(*) The six-month period ended June 30, 2017 has been restated for the impact of the first application of IFRS 15 (see Note 3).
Six-month period ended June 31, 2018 (in thousands of US$) Invoiced amount % of revenue
Client A 1,952 9%Client B 1,514 7%
Six-month period ended June 31, 2017 (in thousands of US$) Invoiced amount % of revenue
Client A 1,317 9%Client C 877 6%

19
The revenue by geographical region for the six-month periods ended June 30, 2018 and 2017 is as follows:
8. Revenue Revenue for the six-month periods ended June 30, 2018 and 2017 breaks down as follows:
(*) The six-month period ended June 30, 2017 has been restated for the impact of the first application of IFRS 15 (see Note 3). (**) The unallocated portion corresponds to non-recurring license revenue The unallocated portion corresponds to non-recurring license revenue from the historical NFC patent portfolio of the Company managed by France Brevets.
(In thousands of US$) AsiaEurope, Middle East
Africa, Latin AmericaNorth
America Total 6-month period ended June 30, 2018 5,025 7,168 10,299 22,492 6-month period ended June 30, 2017 - IFRS 15 2,941 3,903 7,515 14,359 6-month period ended June 30, 2017 - IAS 18 3,063 4,024 7,612 14,699
(In thousands of US$) June 30, 2018 June 30, 2017 (*)
Licenses 6,572 4,846 Royalties 11,441 7,186 Maintenance, development agreements, and other 2,673 2,326
Core business revenue 20,686 14,359 Common unallocated revenue (**) 1,806 - Total revenue 22,492 14,359
Six-month period ended
20
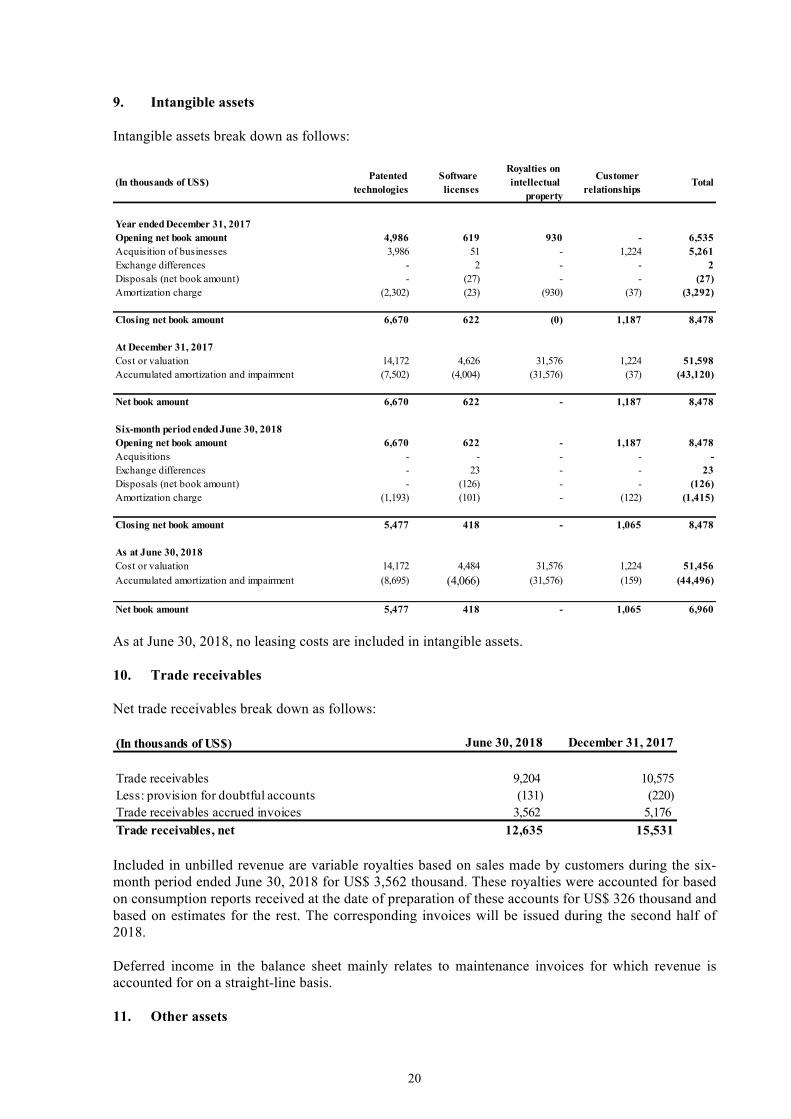
9. Intangible assets Intangible assets break down as follows:
As at June 30, 2018, no leasing costs are included in intangible assets. 10. Trade receivables Net trade receivables break down as follows:
Included in unbilled revenue are variable royalties based on sales made by customers during the six-month period ended June 30, 2018 for US$ 3,562 thousand. These royalties were accounted for based on consumption reports received at the date of preparation of these accounts for US$ 326 thousand and based on estimates for the rest. The corresponding invoices will be issued during the second half of 2018. Deferred income in the balance sheet mainly relates to maintenance invoices for which revenue is accounted for on a straight-line basis. 11. Other assets
(In thousands of US$) Patented technologies
Software licenses
Royalties on intellectual
property
Customer relationships
Total
Year ended December 31, 2017Opening net book amount 4,986 619 930 - 6,535 Acquisition of businesses 3,986 51 - 1,224 5,261 Exchange differences - 2 - - 2 Disposals (net book amount) - (27) - - (27)Amortization charge (2,302) (23) (930) (37) (3,292)
Closing net book amount 6,670 622 (0) 1,187 8,478
At December 31, 2017Cost or valuation 14,172 4,626 31,576 1,224 51,598 Accumulated amortization and impairment (7,502) (4,004) (31,576) (37) (43,120)
Net book amount 6,670 622 - 1,187 8,478
Six-month period ended June 30, 2018Opening net book amount 6,670 622 - 1,187 8,478 Acquisitions - - - - - Exchange differences - 23 - - 23 Disposals (net book amount) - (126) - - (126)Amortization charge (1,193) (101) - (122) (1,415)
Closing net book amount 5,477 418 - 1,065 8,478
As at June 30, 2018Cost or valuation 14,172 4,484 31,576 1,224 51,456 Accumulated amortization and impairment (8,695) (4,066) (31,576) (159) (44,496)
Net book amount 5,477 418 - 1,065 6,960
(In thousands of US$) June 30, 2018 December 31, 2017
Trade receivables 9,204 10,575 Less: provision for doubtful accounts (131) (220)Trade receivables accrued invoices 3,562 5,176 Trade receivables, net 12,635 15,531
21
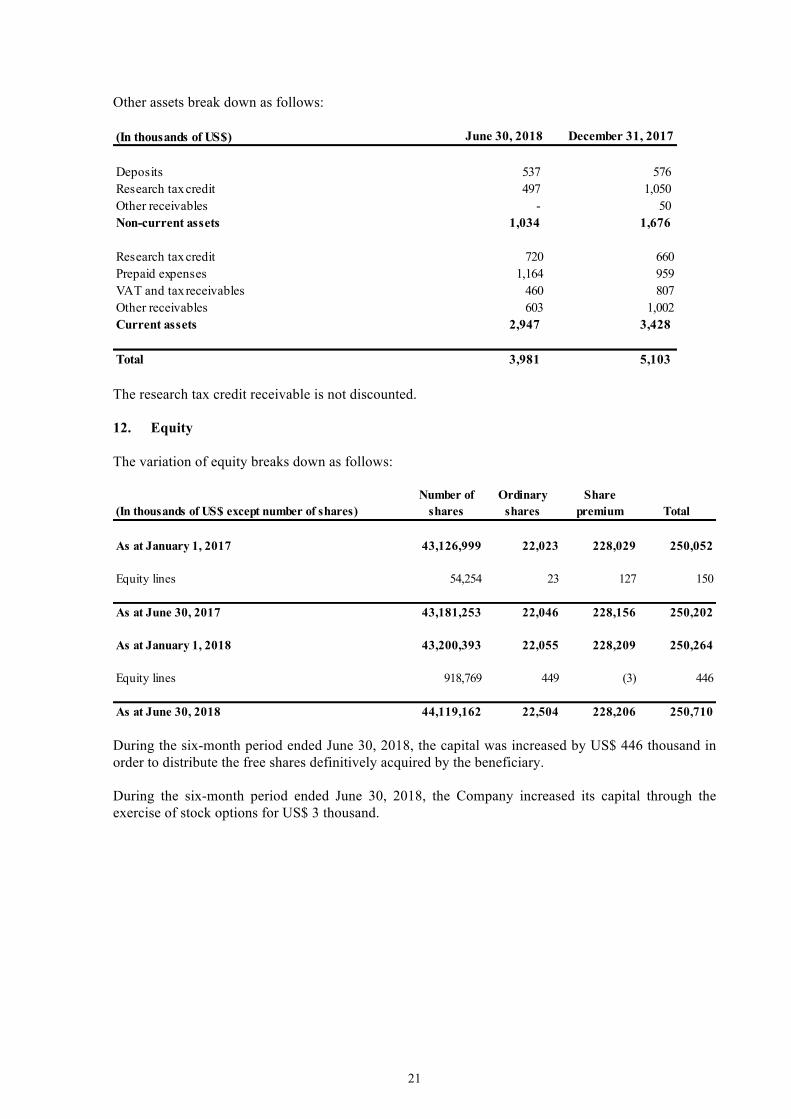
Other assets break down as follows:
The research tax credit receivable is not discounted. 12. Equity The variation of equity breaks down as follows:
During the six-month period ended June 30, 2018, the capital was increased by US$ 446 thousand in order to distribute the free shares definitively acquired by the beneficiary. During the six-month period ended June 30, 2018, the Company increased its capital through the exercise of stock options for US$ 3 thousand.
(In thousands of US$) June 30, 2018 December 31, 2017
Deposits 537 576 Research tax credit 497 1,050 Other receivables - 50 Non-current assets 1,034 1,676
Research tax credit 720 660 Prepaid expenses 1,164 959 VAT and tax receivables 460 807 Other receivables 603 1,002 Current assets 2,947 3,428
Total 3,981 5,103
(In thousands of US$ except number of shares)Number of
shares Ordinary
sharesShare
premium Total
As at January 1, 2017 43,126,999 22,023 228,029 250,052
Equity lines 54,254 23 127 150
As at June 30, 2017 43,181,253 22,046 228,156 250,202
As at January 1, 2018 43,200,393 22,055 228,209 250,264
Equity lines 918,769 449 (3) 446
As at June 30, 2018 44,119,162 22,504 228,206 250,710
22
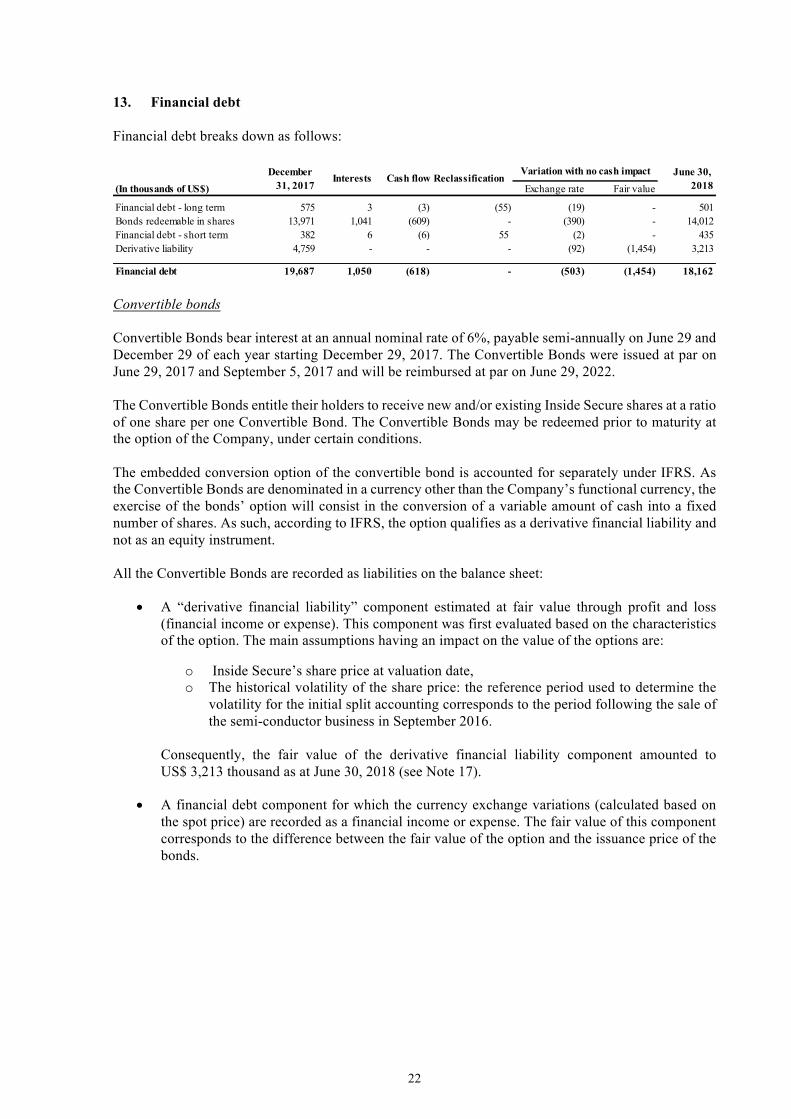
13. Financial debt Financial debt breaks down as follows:
Convertible bonds Convertible Bonds bear interest at an annual nominal rate of 6%, payable semi-annually on June 29 and December 29 of each year starting December 29, 2017. The Convertible Bonds were issued at par on June 29, 2017 and September 5, 2017 and will be reimbursed at par on June 29, 2022. The Convertible Bonds entitle their holders to receive new and/or existing Inside Secure shares at a ratio of one share per one Convertible Bond. The Convertible Bonds may be redeemed prior to maturity at the option of the Company, under certain conditions. The embedded conversion option of the convertible bond is accounted for separately under IFRS. As the Convertible Bonds are denominated in a currency other than the Company’s functional currency, the exercise of the bonds’ option will consist in the conversion of a variable amount of cash into a fixed number of shares. As such, according to IFRS, the option qualifies as a derivative financial liability and not as an equity instrument. All the Convertible Bonds are recorded as liabilities on the balance sheet:
• A “derivative financial liability” component estimated at fair value through profit and loss (financial income or expense). This component was first evaluated based on the characteristics of the option. The main assumptions having an impact on the value of the options are:
o Inside Secure’s share price at valuation date, o The historical volatility of the share price: the reference period used to determine the
volatility for the initial split accounting corresponds to the period following the sale of the semi-conductor business in September 2016.
Consequently, the fair value of the derivative financial liability component amounted to US$ 3,213 thousand as at June 30, 2018 (see Note 17).
• A financial debt component for which the currency exchange variations (calculated based on the spot price) are recorded as a financial income or expense. The fair value of this component corresponds to the difference between the fair value of the option and the issuance price of the bonds.
(In thousands of US$) Exchange rate Fair value
Financial debt - long term 575 3 (3) (55) (19) - 501 Bonds redeemable in shares 13,971 1,041 (609) - (390) - 14,012 Financial debt - short term 382 6 (6) 55 (2) - 435 Derivative liability 4,759 - - - (92) (1,454) 3,213
Financial debt 19,687 1,050 (618) - (503) (1,454) 18,162
December 31, 2017
Cash flow Reclassification June 30, 2018
Variation with no cash impactInterests

23
14. Provisions for other liabilities and charges Provisions for other liabilities and charges break down as follows:
Customer claims The Group is subject to legal proceedings arising in the ordinary course of business. Management does not expect that the ultimate costs necessary to resolve these matters will have a material adverse effect on the Group’s consolidated financial position, result of operations, and cash flows. Employee related litigation and restructuring The provision of US$ 1,612 thousand as at June 30, 2018 corresponds to labor court proceedings ongoing at closing date. 15. Research and development expenses Research and development expenses break down as follows:
The research and development activities are mainly performed internally with teams located in Finland, the Netherlands, Scotland and California (USA).
(In thousands of US$) Onerous contracts
Customer claims
Employee related
litigations and restructuring
Retirement Others provisions and
risks
Total
As at January 1, 2018 266 1,905 1,738 164 296 4,369 Charges / (credited) to the income statement:- Additional provisions - - 47 12 - 59 - Unused amounts reversed - (5) - - - (5)- Used during the year (93) (250) (127) - (4) (474)Exchange differences (5) - (46) (4) (12) (67)
As at June 30, 2018 168 1,650 1,612 172 280 3,882
(In thousands of US$) June 30, 2018 June 30, 2017
Research and development expense 9,229 6,451
Research tax credit (261) (294)
Total 8,968 6,157
Six-month period ended
24
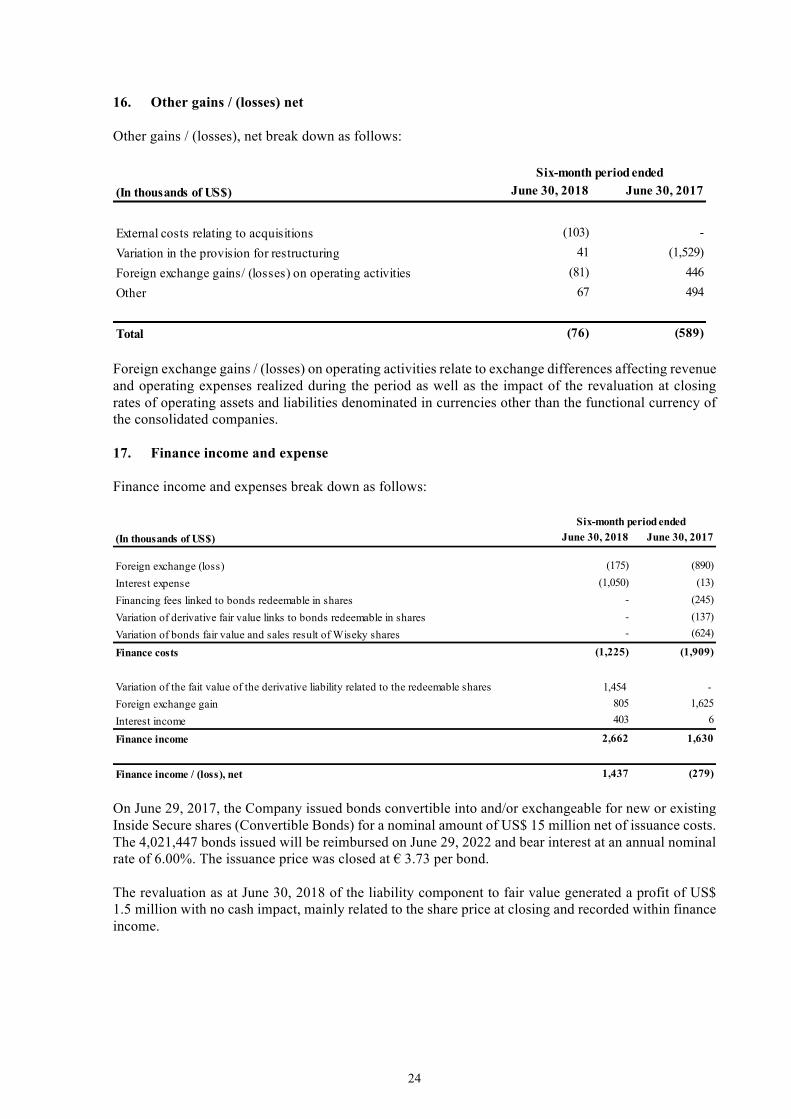
16. Other gains / (losses) net Other gains / (losses), net break down as follows:
Foreign exchange gains / (losses) on operating activities relate to exchange differences affecting revenue and operating expenses realized during the period as well as the impact of the revaluation at closing rates of operating assets and liabilities denominated in currencies other than the functional currency of the consolidated companies. 17. Finance income and expense Finance income and expenses break down as follows:
On June 29, 2017, the Company issued bonds convertible into and/or exchangeable for new or existing Inside Secure shares (Convertible Bonds) for a nominal amount of US$ 15 million net of issuance costs. The 4,021,447 bonds issued will be reimbursed on June 29, 2022 and bear interest at an annual nominal rate of 6.00%. The issuance price was closed at € 3.73 per bond. The revaluation as at June 30, 2018 of the liability component to fair value generated a profit of US$ 1.5 million with no cash impact, mainly related to the share price at closing and recorded within finance income.
(In thousands of US$) June 30, 2018 June 30, 2017
External costs relating to acquisitions (103) - Variation in the provision for restructuring 41 (1,529)Foreign exchange gains/ (losses) on operating activities (81) 446 Other 67 494
Total (76) (589)
Six-month period ended
(In thousands of US$) June 30, 2018 June 30, 2017
Foreign exchange (loss) (175) (890)Interest expense (1,050) (13)Financing fees linked to bonds redeemable in shares - (245)Variation of derivative fair value links to bonds redeemable in shares - (137)Variation of bonds fair value and sales result of Wiseky shares - (624)
Finance costs (1,225) (1,909)
Variation of the fait value of the derivative liability related to the redeemable shares 1,454 - Foreign exchange gain 805 1,625 Interest income 403 6
Finance income 2,662 1,630
Finance income / (loss), net 1,437 (279)
Six-month period ended
25
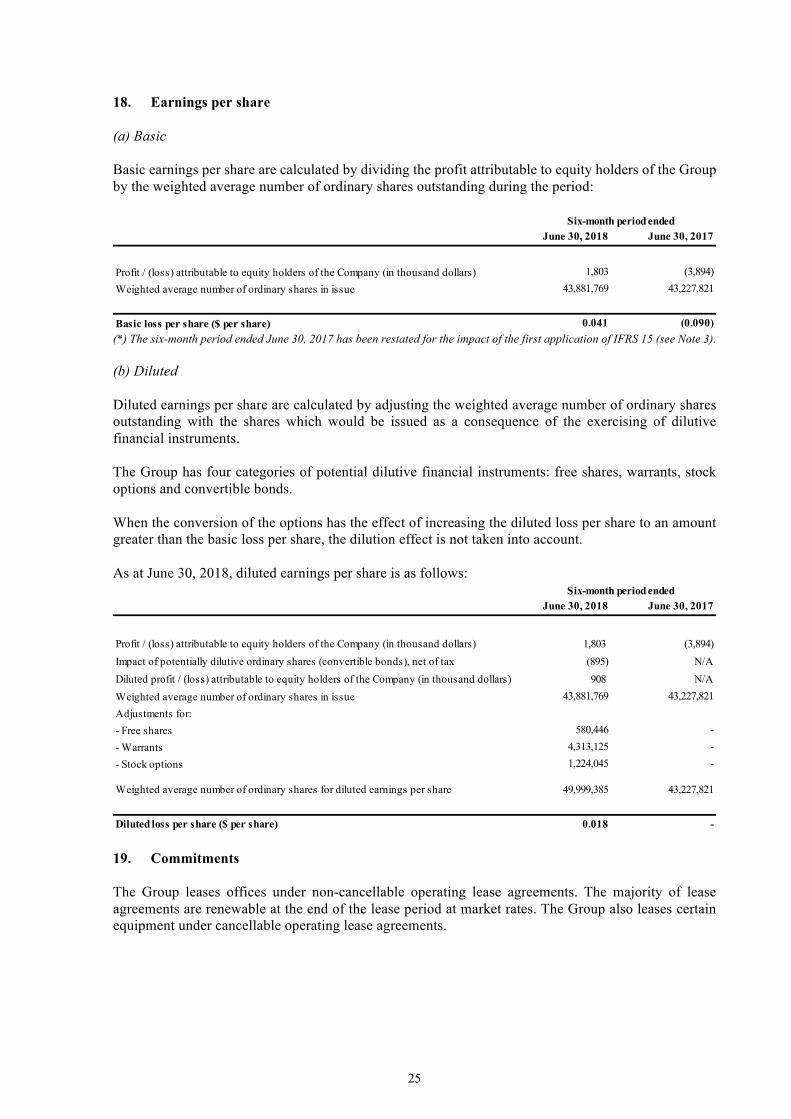
18. Earnings per share (a) Basic Basic earnings per share are calculated by dividing the profit attributable to equity holders of the Group by the weighted average number of ordinary shares outstanding during the period:
(*) The six-month period ended June 30, 2017 has been restated for the impact of the first application of IFRS 15 (see Note 3). (b) Diluted Diluted earnings per share are calculated by adjusting the weighted average number of ordinary shares outstanding with the shares which would be issued as a consequence of the exercising of dilutive financial instruments. The Group has four categories of potential dilutive financial instruments: free shares, warrants, stock options and convertible bonds. When the conversion of the options has the effect of increasing the diluted loss per share to an amount greater than the basic loss per share, the dilution effect is not taken into account. As at June 30, 2018, diluted earnings per share is as follows:
19. Commitments The Group leases offices under non-cancellable operating lease agreements. The majority of lease agreements are renewable at the end of the lease period at market rates. The Group also leases certain equipment under cancellable operating lease agreements.
June 30, 2018 June 30, 2017
Profit / (loss) attributable to equity holders of the Company (in thousand dollars) 1,803 (3,894)Weighted average number of ordinary shares in issue 43,881,769 43,227,821
Basic loss per share ($ per share) 0.041 (0.090)
Six-month period ended
June 30, 2018 June 30, 2017
Profit / (loss) attributable to equity holders of the Company (in thousand dollars) 1,803 (3,894)Impact of potentially dilutive ordinary shares (convertible bonds), net of tax (895) N/ADiluted profit / (loss) attributable to equity holders of the Company (in thousand dollars) 908 N/AWeighted average number of ordinary shares in issue 43,881,769 43,227,821 Adjustments for:- Free shares 580,446 - - Warrants 4,313,125 - - Stock options 1,224,045 -
Weighted average number of ordinary shares for diluted earnings per share 49,999,385 43,227,821
Diluted loss per share ($ per share) 0.018 -
Six-month period ended

26
The future aggregate minimum lease payments under non-cancellable operating leases are as follows:
In August 2012, the Company entered into an operating lease contract for a building which serves as its head office since July 2013. The initial duration of the lease is 6 years. The future lease payments up to the end of the initial period are included in the table above. 20. Related party transactions (a) Transactions with related companies A regulated agreement with Catherine Blanchet Conseil, a company controlled by Catherine Blanchet, an independent member of the Supervisory Board of the Company and, since May 16, 2018, of the Board of Directors of the Company, was authorized by the Supervisory Board on October 19, 2017 and amended on December 19, 2017. The one-year agreement is for services pertaining to financial communication and investor relations. The amount invoiced during the six-month period ended June 30, 2018 was €18,000. (b) Key management compensation Key management is composed of members of the Group and of the Board of Directors. The compensation to key management is as follows:
21. Subsequent events None.
(In thousands of US$) June 30, 2018 December 31, 2017
Gross finance lease liabilities - minimum lease payment -
Less than one year 1,646 1,625
Between one and five years 2,286 2,140
More than 5 years - -
Total 3,932 3,765
(In thousands of US$) June 30, 2018 June 30, 2017
Salaries 885 728 Attendence fees (*) 43 21 Share-based compensation expenses - -Total 928 748 (*) Supervisory Board in 2017
Six-month period ended

27
22. Consolidated entities The consolidated financial statements as at June 30, 2018 include the accounts of the Company and of the following entities:
The consolidation scope remained unchanged for the six-month period ended June 30, 2018.
Country EntityDecember 31, 2017 June 30, 2018
France Inside Secure France 100% 100% 2012 Global CreationUnited States Inside Secure Corporation 100% 100% 2002 Global CreationUnited Kingdom Inside Secure UK (ex Vault-IC UK Ltd) 100% 100% 2010 Global AcquisitionNetherlands Inside Secure B.V 100% 100% 2012 Global AcquisitionNetherlands Inside Secure Amsterdam B.V 100% 100% 2012 Global AcquisitionFinland Inside Secure Oy 100% 100% 2012 Global AcquisitionFinland Meontrust Oy 100% 100% 2017 Global AcquisitionJapan Inside Secure K.K 100% 100% 2013 Global CreationUnited Kingdom Metaforic Ltd 100% 100% 2014 Global Acquisition
Holding percentage First consolidation
Consolidation method
Acquisition / creation
28
3. Statutory Auditors’ review report on the interim consolidated financial information This is a free translation into English of the Statutory Auditors’ review report issued in French and is provided solely for the convenience of English speaking readers. This report should be read in conjunction with, and construed in accordance with, French law and professional auditing standards applicable in France. To the Shareholders, Inside Secure SA Rue de la Carrière de Bachasson 13590 Meyreuil In compliance with the assignment entrusted to us by your general meeting and in accordance with the requirements of article L. 451-1-2 III of the French Monetary and Financial Code (“Code monétaire et financier”), we hereby report to you on: - the review of the accompanying condensed interim consolidated financial statements of Inside Secure
SA, for the six months ended June 30, 2018; - the verification of the information contained in the interim management report. These condensed interim consolidated financial statements are the responsibility of the Board of Directors. Our role is to express a conclusion on these financial statements based on our review.
1. Conclusion on the financial statements We conducted our review in accordance with professional standards applicable in France. A review of interim financial information consists of making inquiries, primarily of persons responsible for financial and accounting matters, and applying analytical and other review procedures. A review is substantially less in scope than an audit conducted in accordance with professional standards applicable in France and consequently does not enable us to obtain assurance that we would become aware of all significant matters that might be identified in an audit. Accordingly, we do not express an audit opinion. Based on our review, nothing has come to our attention that causes us to believe that the accompanying condensed interim consolidated financial statements are not prepared, in all material respects, in accordance with IAS 34 - the standard of IFRSs as adopted by the European Union applicable to interim financial information.
2. Specific verification We have also verified the information given in the interim management report on the condensed interim consolidated financial statements subject to our review. We have no matters to report as to its fair presentation and consistency with the condensed interim consolidated financial statements. Neuilly-sur-Seine and Aix-en-Provence, August 3, 2018
The Statutory Auditors
PricewaterhouseCoopers Audit Jérôme Magnan Didier Cavanié Partner
29
4. CEO attestation I certify, to my knowledge, the condensed consolidated financial statements for the half year are prepared in accordance with applicable accounting standards and present fairly the assets, financial condition and results of the Company and the undertakings included in the consolidation, and that this interim management report includes a fair review of significant events occurring during the first six months of the year, their impact on the interim financial statements, the main transactions between related parties and a description of the main risks and uncertainties for the remaining six months of the year. Meyreuil, France, August 28, 2018 Amedeo D’Angelo Chairman & CEO
30
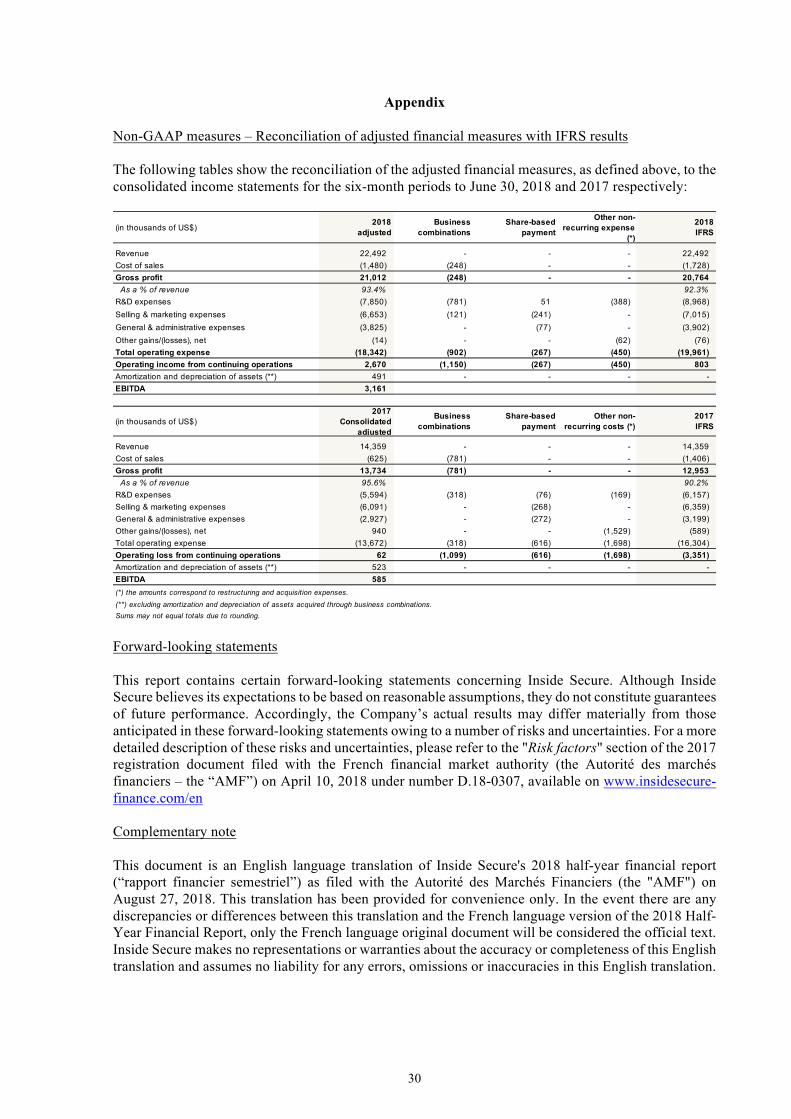
Appendix
Non-GAAP measures – Reconciliation of adjusted financial measures with IFRS results The following tables show the reconciliation of the adjusted financial measures, as defined above, to the consolidated income statements for the six-month periods to June 30, 2018 and 2017 respectively:
Forward-looking statements This report contains certain forward-looking statements concerning Inside Secure. Although Inside Secure believes its expectations to be based on reasonable assumptions, they do not constitute guarantees of future performance. Accordingly, the Company’s actual results may differ materially from those anticipated in these forward-looking statements owing to a number of risks and uncertainties. For a more detailed description of these risks and uncertainties, please refer to the "Risk factors" section of the 2017 registration document filed with the French financial market authority (the Autorité des marchés financiers – the “AMF”) on April 10, 2018 under number D.18-0307, available on www.insidesecure-finance.com/en Complementary note This document is an English language translation of Inside Secure's 2018 half-year financial report (“rapport financier semestriel”) as filed with the Autorité des Marchés Financiers (the "AMF") on August 27, 2018. This translation has been provided for convenience only. In the event there are any discrepancies or differences between this translation and the French language version of the 2018 Half-Year Financial Report, only the French language original document will be considered the official text. Inside Secure makes no representations or warranties about the accuracy or completeness of this English translation and assumes no liability for any errors, omissions or inaccuracies in this English translation.
(in thousands of US$)2018
adjustedBusiness
combinationsShare-based
payment
Other non-recurring expense
(*)
2018 IFRS
Revenue 22,492 - - - 22,492
Cost of sales (1,480) (248) - - (1,728)
Gross profit 21,012 (248) - - 20,764 As a % of revenue 93.4% 92.3%
R&D expenses (7,850) (781) 51 (388) (8,968)
Selling & marketing expenses (6,653) (121) (241) - (7,015)
General & administrative expenses (3,825) - (77) - (3,902)
Other gains/(losses), net (14) - - (62) (76)
Total operating expense (18,342) (902) (267) (450) (19,961)Operating income from continuing operations 2,670 (1,150) (267) (450) 803 Amortization and depreciation of assets (**) 491 - - - -
EBITDA 3,161
(in thousands of US$)2017
Consolidatedadjusted
Business combinations
Share-based payment
Other non-recurring costs (*)
2017 IFRS
Revenue 14,359 - - - 14,359
Cost of sales (625) (781) - - (1,406)
Gross profit 13,734 (781) - - 12,953 As a % of revenue 95.6% 90.2%
R&D expenses (5,594) (318) (76) (169) (6,157)
Selling & marketing expenses (6,091) - (268) - (6,359)
General & administrative expenses (2,927) - (272) - (3,199)
Other gains/(losses), net 940 - - (1,529) (589)
Total operating expense (13,672) (318) (616) (1,698) (16,304)
Operating loss from continuing operations 62 (1,099) (616) (1,698) (3,351)Amortization and depreciation of assets (**) 523 - - - -
EBITDA 585 (*) the amounts correspond to restructuring and acquisition expenses.
(**) excluding amortization and depreciation of assets acquired through business combinations.Sums may not equal totals due to rounding.

31
©Inside Secure 2018, All rights Reserved. Inside Secure®, Inside Secure logo and combinations thereof, and others are registered trademarks or tradenames of

32
Inside Secure or its subsidiaries. Other terms and product names may be trademarks of others.