garments industry end market studypdf.usaid.gov/pdf_docs/pnado891.pdf · garments industry end...
TRANSCRIPT

JANUARY 2008 – STTA TIM ARMSTRONG (AMAP) THIS PUBLICATION WAS PRODUCED FOR REVIEW BY THE UNITED STATES AGENCY FOR INTERNATIONAL DEVELOPMENT. IT WAS PREPARED BY DAI
GARMENTS INDUSTRY END MARKET STUDY INDONESIA APPAREL PRODUCERS

GARMENTS INDUSTRY END MARKET STUDY INDONESIA APPAREL PRODUCERS DISCLAIMER THE AUTHOR’S VIEWS EXPRESSED IN THIS PUBLICATION DO NOT NECESSARILY REFLECT THE VIEWS OF THE UNITED STATES AGENCY FOR INTERNATIONAL DEVELOPMENT OR THE UNITED STATES GOVERNMENT.

END-MARKET STUDY FOR INDONESIAN APPAREL PRODUCERS i
CONTENTS
EXECUTIVE SUMMARY.....................................................................V
I. INTRODUCTION .....................................................................1 SENADA PROJECT AND TARGET ENTERPRISES ........................1 OBJECTIVE OF THE END-MARKET STUDY....................................1
II. THE GLOBAL AND INDONESIAN MARKETS FOR GARMENTS AND APPAREL .................................................3 TRENDS IN THE GLOBAL APPAREL SECTOR ...............................4
III. GLOBAL APPAREL MARKETS...........................................11 KEY EXPORTERS OF GARMENTS AND INDONESIA’S POSITION AMONG THEM ..........................................................................15 INDONESIA’S DOMESTIC APPAREL MARKET .............................17
IV. KEY GLOBAL MARKETS FOR APPAREL..........................19 THE U.S. MARKET...................................................................19 THE EU MARKET.....................................................................20 THE JAPANESE MARKET..........................................................21 THE AUSTRALIAN MARKET ......................................................22 THE CANADIAN MARKET..........................................................22 EMERGING MARKETS...............................................................23
V. APPAREL BUYERS: OPINIONS AND INSIGHTS ...............27 BUYING AGENTS .....................................................................27 BUYER REQUIREMENTS ...........................................................28 BUYERS SURVEY: OPINIONS AND STRATEGIC RECOMMENDATIONS................................................................32
Needed Improvements...............................................32 Countries Identified as Competitors ...........................33
VI. STRATEGIC RECOMMENDATIONS FOR UPGRADING AND SUSTAINABILITY ........................................................35
VII. SUSTAINING COMPETITIVENESS......................................43

ii END-MARKET STUDY FOR INDONESIAN APPAREL PRODUCERS
ANNEX A: SOURCES FOR INDUSTRY AND TREND INFORMATION .................................................................................47
DATABASES AND REGISTERS FOR ORIGIN RULES: ...................47 MARKET ANALYSES: ...............................................................47 INDONESIAN APPAREL INDUSTRY INFORMATION: ......................48 SOURCES OF BUYER INFORMATION:.........................................48
ANNEX B: LIST OF BUYERS INTERVIEWED.................................49
END-MARKET STUDY FOR INDONESIAN APPAREL PRODUCERS iii
TABLES AND FIGURES TABLE
1 BENCHMARKING OF KNITS FOR WOMEN..........................8 2 BASIC WOMEN’S JEANS: COUNTRY PRODUCTION
COMPARISON .................................................................9 3 ITEMS INCLUDED IN THE TRADE DATA ANALYSIS ...........11 4 ITEMS EXCLUDED FROM THE TRADE DATA
ANALYSIS ....................................................................12 5 THREE-YEAR COMPARISON OF TOP 10 IMPORTERS OF
INDONESIAN GARMENTS...............................................15 6 APPAREL EXPORTS: COUNTRY COMPARISON WITH
BANGLADESH...............................................................18 7 TOP 10 APPAREL EXPORTERS TO THE UNITED STATES:
EXPORT VALUES (IN US$) AND ANNUAL GROWTH (%), 2004–2006..................................................................19
8 JAPAN’S GARMENT IMPORTS........................................21 9 IMPORTS OF GARMENTS INTO AUSTRALIA IN US$
MILLIONS .....................................................................22 10 CANADA’S GARMENT IMPORTS .....................................23 11 VARIATIONS IN DELIVERY CHANNELS............................28 12 COUNTRIES IDENTIFIED AS ALTERNATIVE SOURCES
TO INDONESIA ..............................................................34 13 TRAINING NEEDS IDENTIFIED IN THE BUYER’S
SURVEY .......................................................................37 14 SUGGESTED WORKSHOPS AND SEMINARS....................38 15 TOP 10 U.S. IMPORTS BY PRODUCT CATEGORY,
ALONG WITH FOUR HIGH-GROWTH CATEGORIES ..........40 16 TOP 10 U.S. IMPORTS OF INDONESIAN GARMENTS BY
PRODUCT CATEGORY...................................................41

iv END-MARKET STUDY FOR INDONESIAN APPAREL PRODUCERS
FIGURE
1 KEY DISTRIBUTION CHANNELS IN THE GARMENT INDUSTRY.......................................................................4
2 INITIAL APPAREL SAMPLES: DESIGN AND PRODUCTION PROCESS.......................................................................7
3 TOP 10 IMPORTERS OF GLOBAL GARMENTS .................12 4 TOP 10 IMPORTERS OF GLOBAL GARMENTS, AFTER
THE UNITED STATES ....................................................13 5 TOP 10 IMPORTERS OF INDONESIAN GARMENTS ...........14 6 TOP 10 IMPORTERS OF INDONESIAN GARMENTS,
AFTER THE U.S............................................................14 7 TOP 10 GLOBAL EXPORTERS OF GARMENTS AND
APPAREL.....................................................................16 8 TOP 10 GARMENT EXPORTERS, AFTER CHINA...............17 9 INDONESIA TEXTILE AND CLOTHING DOMESTIC
SALES.........................................................................17 10 TOP 10 EUROPEAN IMPORTERS OF GLOBAL
GARMENTS, 2006 ........................................................20 11 TOP 10 EUROPEAN IMPORTERS OF INDONESIAN GARMENTS,
PLUS RUSSIA, 2006.....................................................21 12 TOP 10 EMERGING MARKET IMPORTERS OF GLOBAL
GARMENTS..................................................................24 13 TOP 10 EMERGING-MARKET IMPORTERS OF
INDONESIAN GARMENTS ..............................................25 14 BUYER RANKINGS OF APPAREL SECTORS IN EIGHT
ASIAN COUNTRIES.......................................................32

END-MARKET STUDY FOR INDONESIAN APPAREL PRODUCERS v
EXECUTIVE SUMMARY Launched in 2005, the SENADA project is intended to generate growth, jobs, and income by increasing the competitiveness of Indonesia’s major labor-intensive light manufacturing industries. Recently, the project began working to strengthen export-oriented value chains in the apparel industry. This end-market study contributes to the project’s overall understanding of the global market for garment and apparel products, and offers a strategy and recommendations for improving the competitiveness of the sector.
The worldwide market for garment and apparel imports is estimated to be at least $277 billion, with the U.S. market alone estimated at $73.4 billion in 2006. Developed nations accounted for the vast majority of imports, but consumption in emerging economies is growing rapidly, presenting promising opportunities. China leads all global apparel export competitors with $88.6 billion in exports in 2006, followed by Hong Kong with $26.7 billion, Italy with $18.2 billion, Germany with $13.1 billion, and Turkey with $9.8 billion. Ranking 10th among global apparel producers, Indonesia exported nearly $5.5 billion worth of apparel in 2006.
The United States was by far the largest buyer of Indonesian apparel products, taking 61 percent of Indonesia’s exports of apparel. In the U.S. market, Indonesia ranks third among apparel suppliers, behind China and Mexico and just ahead of Vietnam and India. Indonesia’s next largest market is Western Europe (24 percent) and the Middle East (3 percent). Korea/Japan (3 percent), the Association of Southeast Asian Nations (ASEAN) region (2 percent), Canada (2 percent), and Africa (2 percent) are the next five largest regional buyers of Indonesian apparel, with the Canadian and Korea/Japan markets growing significantly in 2006 (by 13 percent and 28 percent, respectively). This study focuses on the U.S., European Union (EU), Australian, emerging country, and Asian markets.
Trends in fashion affecting the global value chain for apparel are highly relevant to Indonesian producers of apparel. Among them:
• Fashion trends have moved to greater complexity in the last decade, though current orders call for less complicated garments compared to styles sourced last year. Garments can require 50 stitchings or more for complex designs.
• Fashion trends remain seasonal, yet “sub-seasonal” trends are emerging, resulting in shorter delivery windows, more frequent design changes, and faster production times. Speed to market and innovation—not simply price―greatly influence buyers’ sourcing decisions. For example, brands such as Yansi Fugel and Hana K in the United States are willing to pay sources as much as $1 more for a 6-stitching t-shirt (normally quite price-sensitive) just for delivering smaller orders with shorter delivery times.
• Style trends currently call for printed garments (polka dots, florals, geometric), allover embroidery, cutouts, destructive washing, printing techniques, etc. Such embellished garments will be in fashion for at least the next five years. China, Eastern Europe, and Central and South America have established “embellishment factories” to produce garments for this new core product trend.
• Retailers are increasing the size of their orders in terms of cut/make (the labor cost that goes into cutting and making the garment, which does not include fabric).

vi END-MARKET STUDY FOR INDONESIAN APPAREL PRODUCERS
• Conversely, many high-end retailers are making small orders to hit shorter fashion windows for some garments. The demand for flexibility about minimum orders is high in Western markets. Factories in China, Vietnam, and South Korea already take orders from 5,000 units and up by style and by color.
Trends in the global value chain and end markets are also important to Indonesia, including these:
• Consumers expect ever-greater social and environmental accountability from apparel companies, especially regarding labor standards in factories. Suppliers should adopt global certification standards, not develop their own national certifications.
• Apparel imports in a few key developing markets, such as Russia, Mexico, and some EU-accession countries, have grown exponentially, though they are still relatively small in actual volume.
• Internet technology and improvements in global communication are resulting in more frequent and direct communication among buyers, agents, and vendors regarding design, sampling, production, and delivery. Growth in internet sales continues to be exponential.
The largest apparel buyers are focusing their purchases in cheaper labor markets, including China, Vietnam, and Cambodia. However, Indonesia is still regarded as a high-quality producer of basics and high-end fashion, with further potential if it can expand its capacity to meet shorter delivery windows for buyers who strongly emphasize high quality. Because most high-end buyers and large retailers will continue to design their fashion products in-house, the Indonesian apparel industry should focus on adapting designs, not originating design ideas or unique samples. Hence, vendors in Indonesia should work with buyers and buyer agents by responding to requests for samples as quickly and as well as possible. More broadly, recommendations include:
• Factory technology should be upgraded to handle more complex design and stitching requirements, as well as smaller orders for high-quality, high-fashion products. Indonesian vendors should be provided with a range of garment samples that illustrate the latest trends in design and stitching requirements and guidance on the factory upgrading and workforce training required needed to produce them, including how factories might be adapted to handle small orders.
• Indonesian vendors should identify the key buying agents handling the high-growth developing markets in such places as Russia and EU-accession countries in order to accelerate sales growth.
• Improved fabric sourcing and development will give Indonesian vendors access to a broader range of potential buyers and sales options. Fabric may be either imported or locally produced. But better fabric sourcing is not enough: it is equally important for the industry to improve its ability to provide samples that are exactly accurate in terms of fabric color and style, cut, and fit.
• The apparel industry in Indonesia should improve communication and customer service skills as well as general marketing skills at the vendor level. Indonesia should establish and upgrade a shared vendors’ portal on the internet to meet the specific needs of smaller buyers; this should include information on vendor production capacity and availability.
• The Indonesian apparel industry should lobby the government to develop regulations that support exports, such as increased access to long-term loans, business incentives for technology upgrades, and a simpler application for import duty exemption.

END-MARKET STUDY FOR INDONESIAN APPAREL PRODUCERS 1
I. INTRODUCTION
SENADA PROJECT AND TARGET ENTERPRISES SENADA is a four-year project financed by the United States Agency for International Development (USAID). Started in September 2005, SENADA is intended to generate growth, jobs, and income by increasing the competitiveness of Indonesia’s major labor-intensive light manufacturing industries. Its strategy is to increase competitiveness by strengthening industry value chains. The project has been working to strengthen these value chains in a variety of sectors, including garments and apparel.
SENADA’s principal strategies are:
• to develop and promote new industry-based standards to improve product quality and access to markets;
• to improve linkages between raw material suppliers, industrial producers, and potential buyers;
• to identify and analyze regulatory constraints, followed by advocacy to alleviate these constraints;
• to improve functional business skills in such areas as export readiness, enhancing productivity, and marketing, and
• to increase and improve access to critical services such as information and communication technologies (ICT) and finance.
OBJECTIVE OF THE END-MARKET STUDY Funded by USAID’s Accelerated Microenterprise Advancement Program (AMAP) Business Development Services Knowledge and Practice task order, this end-market study has been designed to supplement the work of the SENADA project. Its objective is to provide a strategy and recommendations for the Indonesian garment and apparel industry on how to improve their competitiveness in the global marketplace in both the short and longer terms. This study has drawn on the value chain analysis and activities conducted by SENADA to date and has been carried out in close coordination with SENADA staff working in the garment and apparel value chain.


END-MARKET STUDY FOR INDONESIAN APPAREL PRODUCERS 3
II. THE GLOBAL AND INDONESIAN MARKETS FOR GARMENTS AND APPAREL Distribution channels for the global garment industry consist of various types of retail outlets, including the internet. Although the outlets’ names may vary between different countries and markets, the key retailer types remain the same. These include discount/mass merchant stores, department stores, “lifestyle” specialty stores, direct-to-consumer retailers (such as catalogue and internet sales), and independent retailers. Figure 1 on the next page illustrates the key distribution channels in the garment industry, using the U.S. market as an example.
Interviewees appraised the competitive position of Indonesian apparel vendors in the global market, with special attention to the U.S. market. Their comments and recommendations include the following:
• Indonesian vendors are well regarded for their ability to deliver high-quality basics requiring a relatively low number of stitchings. However, buyers said that Indonesia would need to upgrade its factory technology to handle more complex designs: one buyer mentioned they would only source garments requiring nine stitchings or less from Indonesia, while trends in the higher-end market often require as many as 50.
• Better technology and more care needs to be devoted to meeting design requirements through accurate samples. One buyer mentioned that Indonesian vendors had been unable to match color for a basic white garment, with samples coming back slightly brown.
• The largest discount retailers are always looking for lower prices, with the expectation that prices will drop each year. However, smaller (though still large) branded apparel companies, such as Abercrombie & Fitch and The Limited, compete by placing a greater emphasis on trends, image, and style. These companies are willing to pay a premium for high-quality complicated designs and complex finishings.
• Apparel companies hire buyers with business or fashion skills rather than those with a background in textiles. Their buyers usually work with an agent who is familiar with the vendors in the region and who oversees timely production and sometimes quality control.
• Giving immediate notice of production delays is critical, as apparel companies must get their products in the stores during seasonal fashion windows. Asian vendors, for cultural or other reasons, often fail to do so, and the result can be cancellation or late penalties at the vendor’s expense. Buyers and intermediary agents therefore look for vendors with a strong management team and a good delivery track record.
• Fashion designers and buyers expect that when a supplier quotes costing and timing for a style, they have taken into account the methods of stitching and the particulars of fabric and style that can affect production time. They are therefore unforgiving once a style has been signed off on and costing and timing have been finalized. On the other hand, when supplying or pricing samples with a buyer that the supplier has a good working relationship with, suppliers who are able to suggest changes based on

4 END-MARKET STUDY FOR INDONESIAN APPAREL PRODUCERS
practicality and cost that do not alter the intent, quality, or look of the garment can develop a competitive edge. The decision to make these revisions is ultimately in the hands of the buyer.
• Better fabric sourcing and development will increase buyers’ confidence in sourcing apparel from Indonesia. This should include better linkages with fabric suppliers in Asia, including China and India. It is recommended that SENADA assist the industry by matching this end-market study with a comprehensive assessment of fabric production and sourcing options available to Indonesian exporters.
• Excellent compliance with labor standards is still critical but no longer provides a country with a competitive advantage, since most countries are now on a level playing field in this regard. Only poor compliance and public scandal will take business away. Because one bad occurrence can affect the image of all of the vendors in any given country, it is important to all Indonesian vendors that compliance remain excellent across the entire industry.
• The Indonesian apparel industry should consider establishing a broker’s offices “in the market” in the United States, as well as Europe. Most factories in Central and South America and Mexico have buying offices in such cities as New York, Los Angeles, and Milan. China also has offices in most markets (mostly in California in the United States) which are both privately owned and attached to Government export promotion agencies. Such offices allow better customer service, especially given time zone and language constraints; this is true both at the product development stage and in tracking deliveries and orders. Indonesian companies that are too small to establish offices in end markets should aim to find brokers to assist them. (An example of this type of broker can be found at www.apparelsalesrep.com.)
FIGURE 1: KEY DISTRIBUTION CHANNELS IN THE GARMENT INDUSTRY
Source: Bryn Saxe, DAI, former apparel buyer
Buying Agent
Small and medium exporter- producers
Discount/ mass
merchant
Lifestyle/ specialty
Catalog andInternet
Department stores
Independent retailers
Consumer
Detailing, handwork,
wash supplier
Raw material supplier
Trims supplier (pricetags, labels,
threads)
Domestic printer
(graphics, embroidery)
Factory out of Indonesia will typically import all inputs from China or Hong Kong―labels, price tickets, thread,
fabric. Not only cheaper, also not many domestic
suppliers.
Depending on the price point and market, the buyer will bring in
“blanks” to print and/or embroider domestically. Usually, this coincides with a factory that does not have the
technology or capacity to execute such designs quickly, accurately, and cost-effectively. This type of factory would usually outsource this work
and then sew garment.
A style will finally arrive to the
consumer within 60 to 90 of days
after cut approval.

END-MARKET STUDY FOR INDONESIAN APPAREL PRODUCERS 5
TRENDS IN THE GLOBAL APPAREL SECTOR Over the past decade, the global supply chain in the textile and apparel sector has undergone significant changes. Three key drivers have brought about these changes: the phase-out of the Multi-Fiber Arrangement (MFA) in January 2005; consumer demand for new fashions and shorter seasons; and increasing demand—from consumers, multinational brands, and retailers—for products produced under the right conditions.
Until 2005, apparel manufacturers around the world enjoyed a measure of protection from cost-competitive Asian giants such as China and India thanks to the quotas afforded by the MFA. Since the withdrawal of the MFA began, it has become clear that many countries’ apparel sectors were, to varying degrees, dependent on the quota protections for their survival. The MFA phase-out raised the specter of competition from China and India driving some countries out of the apparel business.
In fact, Chinese ready-made apparel imports increased by over 40 percent when the MFA phase-out began, making up 28 percent of total U.S. apparel imports (U.S. Census Bureau). The U.S. Government subsequently capped Chinese exports to the U.S. market through 2008. As protected access to the U.S. market is poised to expire, the challenge of fierce competition from China looms.
As a result of the end of the MFA, brands have radically condensed their global supply chains. Moreover, over the last decade, the global apparel supply chain has seen changes in consumer demand that have affected the terms of competition. These include shorter fashion seasons, increasing the importance of speed-to-market as a competitiveness factor. Cost remains an important consideration, but many brands and retailers (with the exception of discounters that emphasize price) weigh cost along with a number of other elements, such as quality, innovation, and speed-to-market, in their sourcing decisions.
In addition, recent studies have demonstrated that “brand security” in the form of improved labor standards is now a significant factor in both corporate sourcing decisions and foreign investment funding.1 Risk-averse brands are looking for reliable suppliers that are competitive in the traditional sense and also provide protection to their brands from the tarnishing accusations of sweatshop abuse and corporate social irresponsibility. The result of all these changes is that brands and retailers are increasingly looking to build relationships with a smaller number of reliable and responsible suppliers.
Codes of conduct have been developed by a plethora of multi-stakeholder initiatives, such as the Fair Labor Association (FLA) and Social Accountability International (SAI). In addition, as part of their brand security activities, brands and retailers have developed company codes of conduct and monitoring systems to ensure that suppliers are meeting these standards. However, after nearly a decade of these efforts, companies are finding that they must move beyond simply monitoring suppliers, because it is not sustainable. Verifiable and credible assurances of labor rights protection must be established through public-private partnerships built on the effective pairing of government regulation and industry self-monitoring. The International Labour Organisation (ILO) Better Works project in Cambodia has shown that such an approach can work (http://www.betterfactories.org/). Rather than a experiencing a contraction in exports post-MFA, within a year of the project’s launch Cambodia saw its exports of apparel to the U.S. increase nearly 10 percent—and they have increased ever since. 1 See Enabling CSR in El Salvador: A Survey of U.S. and European Purchasers, Summary Report, January 2004, Political and
Economic Link Consulting, funded by the El Salvadoran Economics Ministry Program on Economic Competitiveness and the World Bank Group Foreign Investment Advisory Service. Also, Cambodia Blazes A New Path to Economic Growth and Job Creation, 2004, Sandra Polaski, Carnegie Paper No. 51, and “Cambodia’s Sales Pitch: Sweatshop-free Products,” USA Today, April 4, 2005.

6 END-MARKET STUDY FOR INDONESIAN APPAREL PRODUCERS
The landscape of players and channels that operate in the global apparel market are showing the following trends:
• Medium to large retailers are increasing the size of their core orders. Buyers are sourcing styles that are less complicated than a year ago, though complexity requirements remain generally high. Garments have been decreased in complexity in order to reduce the need to outsource panels to China and to keep production in one country.
• Distribution channels are getting shorter, but the role of buying agents remains strong as more large retailers in developed markets are opting to source directly, bypassing importers, and other layers of intermediaries are being eliminated. Global production has become commonplace for larger retailers, as increased competitive pressure drives them to reduce costs; many see the trend extending to smaller retailers as well. One should note, however, that from the perspective of developing-country producers, direct sourcing rarely eliminates the role of the buying agent or exporter. There is nearly always a third party responsible for overseeing production. Even very large retailers prefer to work with an intermediary in the region of origin, though in some cases the largest retailers may have their own offices in-country.
• Retail companies are permanently buying “brand licenses” to merchandize garments from recognized brands, such as Jones New York, Kenneth Cole, Cole Haan, Timberland, and others. One of the largest such companies, buying from Asian and Latin American factories for the U.S. market, is the G-III group, which recently acquired Andrew Marc for $42 million. G-III carries out the entire buying cycle—from product design and pattern making to direct sourcing from factories—to reduce costs.
• A trend toward multi-channel businesses is growing as nearly all discounters, department stores, and specialty stores—as well as more and more independent retailers—have retail websites; some have mail-order catalogues as well. Meanwhile, catalogue and internet retailers are opening “brick and mortar” locations as well as operating wholesale divisions, and wholesale importers are launching websites and/or opening retail locations to offset a decrease in sales to large retailers.
• The market is becoming increasingly polarized: low-end and luxury market segments are growing, while middle markets are stagnating or shrinking. At the low end, cheap imports are driving down average retail prices, leading to consumer expectations of better quality at a lower price. In the United States, with the exceptional growth of discount stores, apparel products are becoming increasingly disposable. Improved quality and delivery combined with lower costs through cheaper labor and more efficient production remain the key competitive requirements for producers worldwide.
• Smooth interaction and excellent communication is increasingly important during the product design process. As illustrated in the chart below (Figure 2), designing and producing initial apparel samples has become a very complex process. At the same time, it is a critical link in the global apparel value chain. Apparel production companies that can respond quickly with exactly matched samples, including short response times for production and later alterations, can develop a competitive edge against other suppliers.

END-MARKET STUDY FOR INDONESIAN APPAREL PRODUCERS 7
FIGURE 2: INITIAL APPAREL SAMPLES: DESIGN AND PRODUCTION PROCESS
Source: Bryn Saxe, DAI, Former Apparel Buyer
Technical Designer
Style Designer Merchandiser/
Buyer
Sourcing Department
Merchandiser/Buyer
Agent A in South America costs with partner factories,
sends sample ASAP
Artistic Design
phase― fabric, trims,
details, colors
decided
Pattern, piecing,
shaping of garment decided
(essentially quality control)
Agent B in Southeast Asia costs with
partner factories, sends sample ASAP
Buyer receives pattern, sends to agents whose
factories have approved fabric quality
for costing and sampling. Decides colors and units.
Factory also must be in
good standing, regarding labor laws, for example, paying
employees, etc.
Factory has to receive fabric and wash approval
from sourcing before style is placed.
Agent D in South Asia costs with
partner factories, sends sample ASAP
Agent C in Southeast Asia costs with their
factories, sends sample ASAP
Based on quality of sample, timing and
costing, and experience with factory, buyer will place style (generally,
Asia has better costing, Latin America has better
timing)
Buyer will typically give agent and
factories about 7–10 days to cost, give timing, and send a
good sample.
Agent B with
factory in Indonesia – offices in Seoul
Human Rights/ Legal
Department

8 END-MARKET STUDY FOR INDONESIAN APPAREL PRODUCERS
TABLE 1: BENCHMARKING OF KNITS FOR WOMEN
Segment Price Range Key Product Characteristics Examples of Retailer
Luxury/High end $100 and up • Targets the more mature and style-conscious consumer
• Uses very high quality fabric, trims, labels • Purchasing priorities are design and quality • Often involve high level of detailing, stitching,
piecing • The brand is paramount in buyer decisions • Demands good technical design, fit of the garment
Ella Moss, Vince, Juicy
Middle end $30–$100 • Targets teenagers, college-age consumer as a “lifestyle” brand
• Uses quality fabric, trims, and labels, but sometimes takes shortcuts to reduce costs
• Purchasing priorities are:
– No. 1: price – No. 2: timing – No. 3: quality fabric, trims, labels, and fit
ANF J. Crew Banana Republic
Low end Under $30 • Copy trends and styles of middle-end and high-end retailers a few months later
• Might have a good look, but quality is lower • Goods are mass-produced, with cheaper materials
and lower-quality inputs • Purchasing priorities are:
– No. 1: price – No. 2: design
Target Old Navy Kmart
Source: Survey of Apparel Buyers and Bryn Saxe, DAI, former apparel buyer
As illustrated in Table 1 above, price ranges for knit garments for women can vary widely, based on branding, quality, style, and the market segment targeted. While quality is paramount in marketing decisions, profit margins and price are usually the key factor in sourcing decisions. Table 2 on the next page shows that a critical element in apparel production is fabric cost, regardless of where it comes from. For example, for basic women’s jeans, Cambodia achieves a better cost for using Chinese fabric, with a slightly longer lead time.
Similarly, Indonesia could improve its pricing if it used Chinese fabric. While it would lose the Generalized System of Preferences (GSP) discount of 3 percent (18 cents in the example below), it would still get a lower fabric cost. Unfortunately, delivery would take longer as well.

END-MARKET STUDY FOR INDONESIAN APPAREL PRODUCERS 9
TABLE 2: BASIC WOMEN’S JEANS: COUNTRY PRODUCTION COMPARISON
Cost of Basic Women’s Jeans 13-Ounce 100 Percent Cotton (Rigid) 5-Pocket Women’s Jeans with Studs and Garment Wash
Factory in: Indonesia Lesotho Jordan Qualified Industrial Zone (QIZ)
China Cambodia
Fabric from: Indonesia South Africa China China China Fabric cost per linear meter (at factory gate)
$2.20 $2.40 $2.10 $2.00 $2.11
Fabric yield per garment—linear yards 1.50 1.50 1.50 1.50 1.50 Total fabric cost per garment $3.30 $3.60 $3.15 $3.00 $3.17 Trims from: Indonesia South Africa Israel/China China China Trim cost per garment (thread, rivets, pocketing)
$1.20 $1.30 $1.30 $1.00 $1.04
Cut/make/finish per garment (including wash)
$1.25 $1.40 $1.80 $1.25 $1.20
Average profit per garment 5% 5% 5% 5% 5% Ex-factory cost per garment $6.04 $6.62 $6.56 $5.51 $5.68 Local shipping costs—truck and documents
$0.04 $0.14 $0.06 $0.04 $0.10
Freight on Board (FOB) closest port $6.08 $6.76 $6.62 $5.55 $5.78 Average shipping cost per garment (Northern Europe)
$0.10 $0.25 $0.15 $0.07 $0.10
Tariff where applicable (Indonesia has 20 percent discount for GSP)
11% 0% 0% 14% 0%
Tariff ($) (on FOB) $0.68 $0.00 $0.00 $0.78 $0.00 Quota cost (China safeguard) [ varies] //////////////// //////////////// //////////////// $0.46 //////////////// Landed cost, including VAT $6.86 $7.01 $6.77 $6.40 $5.88 Delivery time (fabric/making up/ delivery), in days
75 90 105 45 85
Sources : Chinaquota.com, buyers survey, various factories 2005–2007


END-MARKET STUDY FOR INDONESIAN APPAREL PRODUCERS 11
III. GLOBAL APPAREL MARKETS Trade data were analyzed for the global market for apparel, regional markets, and countries sourcing apparel from Indonesia. The analysis excluded some items due to low production volume in Indonesia. Items included in the trade data analysis are found in Table 3:
TABLE 3: ITEMS INCLUDED IN THE TRADE DATA ANALYSIS
Product Description Harmonized System (HS) Code
Knitted or Crocheted Men’s/Boys’ Overcoats, Capes, Cloaks, etc. 6101 Women’s/Girls’ Overcoats, Capes, Cloaks, etc. 6102 Men’s/Boys’ Suits, Jackets, Trousers, Shorts, etc. 6103 Women’s/Girls’ Suits, Jackets, Trousers, Shorts, etc. 6104 Men’s/Boys Shirts 6105 Women’s/Girls’ Blouses, Shirts, and Shirt-Blouses 6106 Men’s/Boys’ Underpants, Nightshirts, Pajamas, Bathrobes, etc. 6107 Women’s/Girls’ Slips, Panties, Pajamas, Bathrobes, etc. 6108 T-Shirts, Singlets, and Other Vests 6109 Jerseys, Pullovers, Cardigans, Waistcoats, etc. 6110 Babies’ Garments and Clothing Accessories 6111 Track Suits, Ski Suits, and Swimwear 6112 Garments not elsewhere specified 6114 Pantyhose, Tights, Stockings, Other Hosiery 6115 Gloves, Mittens, and Mitts 6116 Not Knitted or Crocheted Men’s/Boys’ Overcoats, Capes, Wind Jackets, etc. 6201 Women’s/Girls’ Overcoats, Capes, Wind Jackets, etc. 6202 Men’s/Boys’ Suits, Jackets, Trousers, Shorts, etc. 6203 Women’s/Girls’ Suits, Jackets, Trousers, Shorts, etc. 6204 Men’s/Boys’ Shirts 6205 Women’s/Girls’ Blouses, Shirts, and Shirt-Blouses 6206 Men’s/Boys’ Singlets, Briefs, Nightshirts, Pajamas, Bathrobes, etc. 6207 Women’s/Girls’ Singlets, Slips, Briefs, Pajamas, Bathrobes, etc. 6208 Babies’ Garments and Clothing Accessories 6209 Garments of Felt, etc. 6210 Track Suits, Ski Suits, and Swimwear 6211 Brassieres, Girdles, Corsets, Braces, Suspenders, etc. 6212 Shawls, Scarves, Mufflers, Mantillas, Veils, etc. 6214 Gloves, Mittens, and Mitts 6216 Source: Global Trade
Items excluded from the trade data analysis are found in Table 4:

12 END-MARKET STUDY FOR INDONESIAN APPAREL PRODUCERS
TABLE 4: ITEMS EXCLUDED FROM THE TRADE DATA ANALYSIS Product Description HS Code
Garments Coated in Plastic (knitted) 6113 Clothing Accessories (knitted) 6117 Handkerchiefs (not knitted) 6213 Ties, Bowties, and Cravats (not knitted) 6215 Clothing Accessories (not knitted) 6217 Source: Global Trade
The global market for garments and apparel imports was estimated to be $276 billion in 2006. As illustrated in Figure 3 below, the United States was by far the largest importer that year, followed by Germany, Japan, and the United Kingdom. Eight of the top 12 importers are members of the EU, rounded out by Japan and Hong Kong in Asia.
FIGURE 3: TOP 10 IMPORTERS OF GARMENTS GLOBALLY (Billions of US$)
Source: Global Trade Information Systems, Global Trade Atlas.
To better illustrate the breakdown of different apparel imports by HS code and category among the largest global buyers, Figure 4 below shows the breakdown among the 10 largest markets after the United States. Women’s and girls’ suits; knitted t-shirts, singlets, and tank tops; knitted sweaters and pullovers; and men’s and boys’ suits are generally the largest apparel import categories in each country.
Total
Uni
ted
Sta
tes
Ger
man
y
Japa
n
Uni
ted
Kin
gdom
Fran
ce
Hon
g Ko
ng
Italy
Spa
in
Belg
ium
Net
herla
nds
Total
HS (All) Description (All)
Sum of 2006
Reporting Country
80
70
60
50
40
30
20
10
0

END-MARKET STUDY FOR INDONESIAN APPAREL PRODUCERS 13
FIGURE 4: TOP 10 IMPORTERS OF GARMENTS GLOBALLY, AFTER THE UNITED STATES (Billions of US$)
kn: knitted, n-kn: non-knitted, nes: not elsewhere specified Source: Global Trade Information Systems, Global Trade Atlas
Nine of the largest importers of Indonesian apparel products are also among the 12 largest apparel importers globally, as illustrated in Figures 5 and 6 below. This closely mirrors the global market for apparel imports—and is a strong indication that Indonesia is focusing on the right global markets. Singapore is the only one of Indonesia’s largest buyers that is not also among the largest global apparel importers. Indonesia’s strong market presence in Belgium and the Netherlands is reflected in the fact that those countries are Indonesia’s fifth and sixth largest buyers, while ranking only ninth and tenth globally. On the other hand, while Japan is the third largest buyer globally, it is only the tenth largest buyer of Indonesian apparel products, implying that Indonesia could do more to gain more market share in Japan.
G
erm
any
Japa
n
Uni
ted
King
dom
Fran
ce
Hon
g Ko
ng
Italy
Spai
n
Belg
ium
Net
herla
nds
Can
ada
HS (All)
Sum of 2006
Reporting Country
women's or girls' suits (n-kn)women's or girls' suits (kn)women's or girls' slips, pjs (kn)women's or girls' slips (n-kn)women's or girls' shirts (kn)women's or girls' overcoats (n-kn)women's or girls' overcoats (kn)women's or girls' blouses (n-kn)t-shirts, singlets, tank tops (kn)track suits, ski, swimwear (n-kn)track suits, ski, swimwear (kn)sweaters, pullovers (kn)shawls, scarves, mufflers, veils, etc.pantyhose, hosiery (kn)men's or boys' undershirts (n-kn)men's or boys' underpants (kn)men's or boys' suits (n-kn)men's or boys' suits (kn)men's or boys' shirts (n-kn)men's or boys' shirts (kn)men's or boys' overcoats (n-kn)men's or boys' overcoats (kn)gloves, mittens, and mitts (n-kn)gloves, mittens, and mitts (kn)garments of felt, etc. (n-kn)garments (kn) nesbras, girdles, garters, etc.babies' garments (n-kn)babies' garments (kn)
30
25
20
15
5
10
0

14 END-MARKET STUDY FOR INDONESIAN APPAREL PRODUCERS
FIGURE 5: TOP 10 IMPORTERS OF INDONESIAN GARMENTS (Billions of US$)
Source: Global Trade Information Systems, Global Trade Atlas
FIGURE 6: TOP 10 IMPORTERS OF INDONESIAN GARMENTS, AFTER THE U.S. (Millions of US$)
Total
Uni
ted
Sta
tes
Ger
man
y
Uni
ted
King
dom
Sin
gapo
re
Net
herla
nds
Belg
ium
Fran
ce
Japa
n
Can
ada
Italy
Total
HS (All) Description (All)
Sum of 2006
Reporting Country
Source: Global Trade Information Systems, Global Trade Atlas
4 0
3 5
3 0
1.5
0 5
1 0
2 5
2 0
Ger
man
y
Uni
ted
King
dom
Sing
apor
e
Net
herla
nds
Belg
ium
Fran
ce
Japa
n
Can
ada
taly
Spai
n
HS (All)
Sum of 2006
Reporting Country
women's or girls' suits (n-kn)women's or girls' suits (kn)women's or girls' slips, pjs (kn)women's or girls' slips (n-kn)women's or girls' shirts (kn)women's or girls' overcoats (n-kn)women's or girls' overcoats (kn)women's or girls' blouses (n-kn)t-shirts, singlets, tank tops (kn)track suits, ski, swimwear (n-kn)track suits, ski, swimwear (kn)sweaters, pullovers (kn)shawls, scarves, mufflers, veils, etc.pantyhose, hosiery (kn)men's or boys' undershirts (n-kn)men's or boys' underpants (kn)men's or boys' suits (n-kn)men's or boys' suits (kn)men's or boys' shirts (n-kn)men's or boys' shirts (kn)men's or boys' overcoats (n-kn)men's or boys' overcoats (kn)gloves, mittens, and mitts (n-kn)gloves, mittens, and mitts (kn)garments of felt, etc. (n-kn)garments (kn) nesbras, girdles, garters, etc.babies' garments (n-kn)babies' garments (kn)
600
500
400
300
200
100
0 0
0

END-MARKET STUDY FOR INDONESIAN APPAREL PRODUCERS 15
Growth trends among the largest importers of Indonesian apparel products merit further discussion. First, U.S. quota restrictions on apparel sourced from China have accelerated sales growth by Indonesia to the United States. Moreover, the restrictions are likely responsible for growth in some ancillary markets such as Singapore, which has a free trade agreement with the United States. Secondly, while Indonesia’s exports to Italy, the Netherlands, Germany, France, and the United Kingdom dropped between 2004 and 2005, from 2005 to 2006 Indonesian exports to all five countries experienced double-digit growth. This reversal is probably attributable to the appreciation of the euro and the British pound against the U.S. dollar. (Table 5 below is shown in U.S. dollars), as well as to some movement from in-country apparel production to offshore production and importation in these European countries.
TABLE 5: THREE-YEAR COMPARISON OF TOP 10 IMPORTERS OF INDONESIAN GARMENTS
Country Growth 2004–2005 Growth 2005–2006 United States 20.00% 21.65% Germany –3.42% 12.32% United Kingdom –13.25% 19.13% Singapore 35.98% 51.46% Netherlands –18.15% 33.43% Belgium 6.54% 8.27% France –8.40% 20.94% Japan –1.94% 17.49% Canada 17.05% 19.73% Italy –15.66% 19.83%
Source: Global Trade Information Systems, Global Trade Atlas
The revenue figures for exports to the United States, European countries, and Canada are strongly affected by the quota on China. However, exports to the U.S. market for categories where there is no quota are actually in decline, despite the huge growth suggested by these figures. The EU figures include intra-European trade. For example, garment industries exist in Italy, Portugal, Romania, and elsewhere. However, as with U.S. apparel production, industry growth within Europe has dramatically slowed, as the long-term trend is to move much of the production volume elsewhere. Capturing business from this transition should play a key role in Indonesia’s strategy to upgrade its garment and apparel industry. Capturing a greater share of the EU market would also help Indonesia continue to diversify revenue out of the currently weak dollar.
KEY EXPORTERS OF GARMENTS AND INDONESIA’S POSITION AMONG THEM In 2006, Indonesia ranked 10th among garment exporters, with $5.5 billion in apparel exports; in fact, Indonesia’s garment and textile sector was the country’s largest producer of non-oil exports. But China—even facing quota restrictions in some global markets—was by far the largest exporter, with $88.6 billion in exports. The countries closest behind China were Hong Kong with $26.7 billion, Italy with $18.2 billion, Germany with $13.1 billion, and Turkey with $9.8 billion (see Figure 7).

16 END-MARKET STUDY FOR INDONESIAN APPAREL PRODUCERS
FIGURE 7: TOP 10 GLOBAL EXPORTERS OF GARMENTS AND APPAREL (Billions of US$)
Source: Global Trade Information Systems, Global Trade Atlas
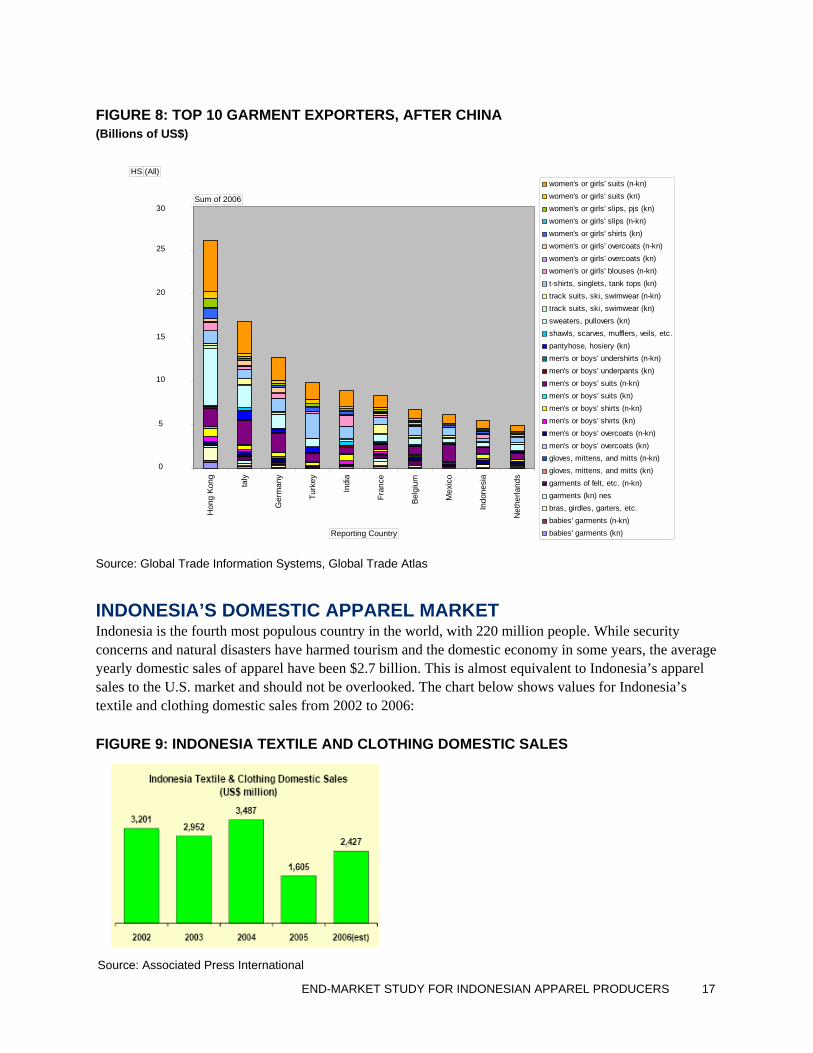
As can be seen from the breakdown of specific garments for apparel-producing countries (not including China) shown in Figure 8 below, Indonesia has maintained its position in a diverse range of garments. This is especially true in high-quality basics and polyesters, which are the most popular wash-and-wear fiber. Growth in the polyester industry in Indonesia is due to the fact that roughly 95 percent of the Indonesian garment sector’s polyester is produced locally. However, the main inputs for polyester are still imported, and they constitute the highest cost of production.
Total
China Hong Kong Italy Germany Turkey India France Belgium Mexico Indonesia
Total
HS (All) Description (All)
Sum of 2006
Reporting Country
100
90
80
70
60
50
40
30
20
10
0
END-MARKET STUDY FOR INDONESIAN APPAREL PRODUCERS 17
FIGURE 8: TOP 10 GARMENT EXPORTERS, AFTER CHINA (Billions of US$)
Source: Global Trade Information Systems, Global Trade Atlas
INDONESIA’S DOMESTIC APPAREL MARKET Indonesia is the fourth most populous country in the world, with 220 million people. While security concerns and natural disasters have harmed tourism and the domestic economy in some years, the average yearly domestic sales of apparel have been $2.7 billion. This is almost equivalent to Indonesia’s apparel sales to the U.S. market and should not be overlooked. The chart below shows values for Indonesia’s textile and clothing domestic sales from 2002 to 2006:
FIGURE 9: INDONESIA TEXTILE AND CLOTHING DOMESTIC SALES
Hon
g Ko
ng taly
Ger
man
y
Turk
ey
Indi
a
Fran
ce
Belg
ium
Mex
ico
Indo
nesi
a
Net
herla
nds
HS (All)
Sum of 2006
Reporting Country
Source: Associated Press International
women's or girls' suits (n-kn)women's or girls' suits (kn)women's or girls' slips, pjs (kn)women's or girls' slips (n-kn)women's or girls' shirts (kn)women's or girls' overcoats (n-kn)women's or girls' overcoats (kn)women's or girls' blouses (n-kn)t-shirts, singlets, tank tops (kn)track suits, ski, swimwear (n-kn)track suits, ski, swimwear (kn)sweaters, pullovers (kn)shawls, scarves, mufflers, veils, etc.pantyhose, hosiery (kn)men's or boys' undershirts (n-kn)men's or boys' underpants (kn)men's or boys' suits (n-kn)men's or boys' suits (kn)men's or boys' shirts (n-kn)men's or boys' shirts (kn)men's or boys' overcoats (n-kn)men's or boys' overcoats (kn)gloves, mittens, and mitts (n-kn)gloves, mittens, and mitts (kn)garments of felt, etc. (n-kn)garments (kn) nesbras, girdles, garters, etc.babies' garments (n-kn)babies' garments (kn)
30
25
20
15
10
5
0

18 END-MARKET STUDY FOR INDONESIAN APPAREL PRODUCERS
The prevalence of illegal imports, and the effective internal dumping of stock at discount prices by the external apparel producers in “factory shops,” can make targeting the domestic market problematic. However, there are efforts by the government to change this situation, and once the quota is lifted from China, a majority of the dumping is likely to cease. With the end of the quota, Chinese exporters will get a better price for their surplus production, second-quality goods, and cancellations, which generally are around 15 percent of all garment output.
If we compare Indonesian apparel exports to those of Bangladesh, a similar picture emerges, as shown in Table 6 below. Exports of items affected by the quota on Chinese goods have dramatically increased, while items without quota have declined—though only slightly, in the case of Indonesia.
TABLE 6: APPAREL EXPORTS: COUNTRY COMPARISON WITH BANGLADESH $ million
Analysis of the impact of China quota Growth Growth
World 2003 2006 (mid) 2007 (mid) 2003–2007 (mid) This year
Total apparel imports—all $61,162 $68,565 $73,806 21% 21% Indonesia
Value of all exports $2,158 $3,240 $3,980 84% 23% Main categories summarized $1,948 $3,028 $3,684 89% 22% Categories under China quota $1,472 $2,368 $3,063 108% 29% Categories outside China quota $497 $ 660 $ 653 31% –1%
Bangladesh Value of all exports $1,848 $2,651 $3,101 68% 17% Main categories summarized $1,913 $2,145 12% Categories under China quota $1,493 $1,737 16% Categories w/o China quota $ 421 $ 344 –18%
Source: Otexa Trade Database

END-MARKET STUDY FOR INDONESIAN APPAREL PRODUCERS 19
IV. KEY GLOBAL MARKETS FOR APPAREL In the section below, data are presented for each of the key global markets for apparel products in which Indonesia already has measurable market share. These markets include the United States, the largest European importing countries, Japan, Australia, and Canada. An analysis of the top 10 emerging-market countries for apparel imports is also presented.
THE U.S. MARKET For the U.S. market, Indonesia has moved up to third place as a source for apparel; historically, Indonesia has been at around seventh place for the past 10 years. As shown in Table 7 below, Indonesia’s growth has been quite staggering in the last year or so—but, disturbingly, only in categories that are under quota from China. Whether this means that (as rumored) transshipment of Chinese products is rampant, including through Indonesia, has not been verified.
TABLE 7: TOP 10 APPAREL EXPORTERS TO THE UNITED STATES: EXPORT VALUES (IN US$) AND ANNUAL GROWTH (%), 2004–2006
Country 2004 2005 Growth 2004–2005 2006 Growth
2005–2006 China 10,304,487,282 16,326,885,473 58.44% 19,389,306,756 15.79% Mexico 6,812,863,600 6,202,098,322 –8.96% 5,421,862,774 –14.39% Indonesia 2,397,150,325 2,876,687,617 20.00% 3,671,453,338 21.65% India 2,271,797,925 3,041,109,753 33.86% 3,232,787,343 5.93% Vietnam 2,488,990,128 2,647,353,898 6.36% 3,137,441,647 15.62% Hong Kong 3,871,260,092 3,517,834,929 –9.13% 2,811,996,704 –25.10% Bangladesh 1,862,908,595 2,254,942,770 21.04% 2,799,891,469 19.46% Honduras 2,742,243,522 2,684,789,209 –2.10% 2,516,972,180 –6.67% Cambodia 1,416,213,497 1,701,589,715 20.15% 2,127,987,970 20.04% Philippines 1,744,139,340 1,806,972,956 3.60% 1,990,429,707 9.22%
Source: Global Trade Information Systems, Global Trade Atlas
If we disaggregate figures to account for this factor, there is about 29 percent growth for categories that are under quota, and a flat line or a 1 percent drop for those that are not. Overall, Indonesia has managed an impressive 20 percent year-on-year growth to the U.S. market through 2006. Both Cambodia and Bangladesh have also maintained double-digit growth rates to the U.S. market, most likely due to their less developed country (LDC) status, which has also made them attractive to illegal transshipment. (Indonesia is not considered an LDC.) It is important to note that in discussions with apparel vendors in Indonesia, vendors perceived the U.S. market to be flat or even declining. A major Indonesian thread company has seen annual growth of 5 percent, which may provide a more realistic proxy indicator for the industry’s growth rate, since virtually all of its sales are to local vendors. All of this is anecdotal, but the fact remains that the growth which has pushed Indonesia into the third position after Mexico and China, despite very strong growth on China’s part, will be extremely difficult to maintain.

20 END-MARKET STUDY FOR INDONESIAN APPAREL PRODUCERS
It is generally accepted that illegal imports, semi-legal imports, deliberately undervalued imports, and raw smuggling are rampant in Indonesia. It can also be noted that in nearly all categories for the 10 months to October, China’s ability to deliver to quota levels has been very high (80 percent) despite a $7 billion jump in exports this year. What SENADA should focus on, then, is growth to non-quota markets where Indonesian apparel products are sold on the basis of their strength and not China’s restraint.
THE EU MARKET European apparel import levels roughly correlate to country population and gross domestic product (see Figure 10). In 2006, Germany had apparel imports of $25.7 billion; the UK, $20.6 billion, and France, $17.8 billion. As with the United States, the largest import categories were women’s or girls’ suits; t-shirts, singlets, and tank tops; sweaters and pullovers; and men’s and boys’ suits.
FIGURE 10: TOP 10 EUROPEAN IMPORTERS OF GLOBAL GARMENTS, 2006 (Billions of US$)
Source: Global Trade
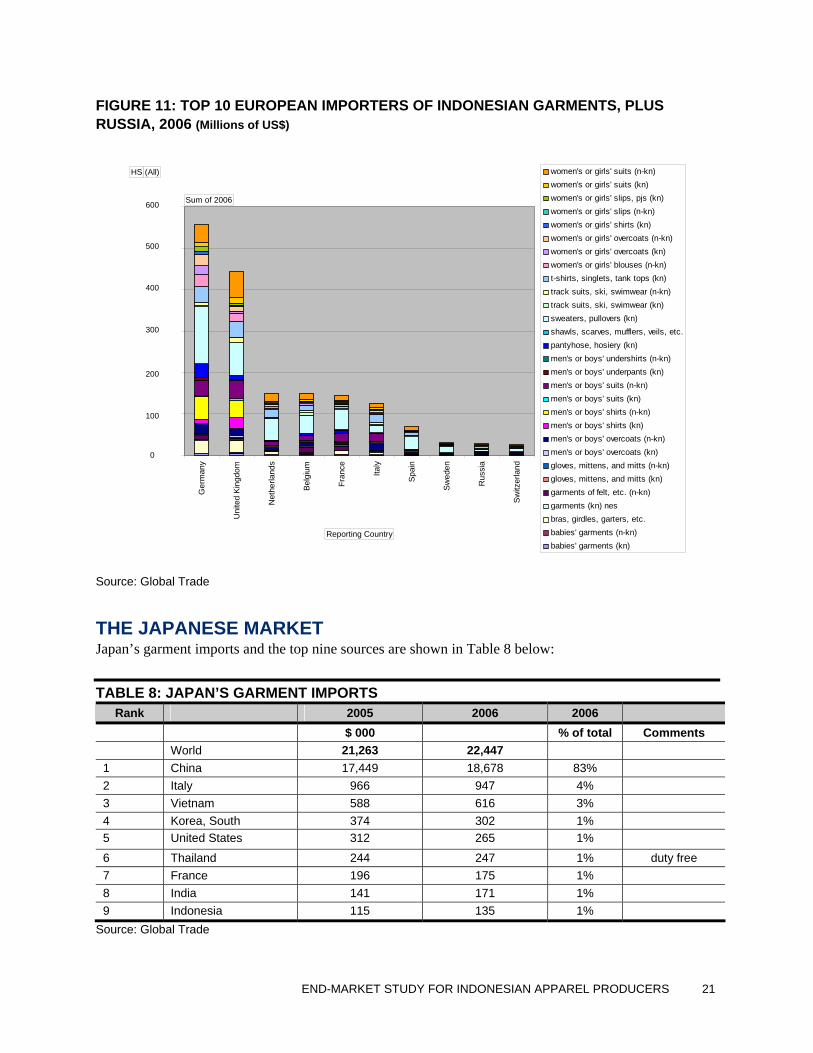
Looking at Indonesia’s main European markets for apparel, the value of Germany and the United Kingdom’s imports from Indonesia in 2006 was much greater than for other European countries, as shown in Figure 11. Germany imported $502.7 million in apparel from Indonesia, and the United Kingdom imported $309.5 million. The Russian market, however, has been growing rapidly, presenting a good opportunity for Indonesia. Comparing figures for the largest European importers to those for Russia reveals that the value of Russian apparel imports already exceeds that of Switzerland and is just behind that of Sweden.
Ger
man
y
Uni
ted
Kin
gdom
Fran
ce taly
Spa
in
Belg
ium
Net
herla
nds
Sw
itzer
land
Den
mar
k
Sw
eden
HS (All)
Sum of 2006
Reporting Country
women's or girls' suits (n-kn)women's or girls' suits (kn)women's or girls' slips, pjs (kn)women's or girls' slips (n-kn)women's or girls' shirts (kn)women's or girls' overcoats (n-kn)women's or girls' overcoats (kn)women's or girls' blouses (n-kn)t-shirts, singlets, tank tops (kn)track suits, ski, swimwear (n-kn)track suits, ski, swimwear (kn)sweaters, pullovers (kn)shawls, scarves, mufflers, veils, etc.pantyhose, hosiery (kn)men's or boys' undershirts (n-kn)men's or boys' underpants (kn)men's or boys' suits (n-kn)men's or boys' suits (kn)men's or boys' shirts (n-kn)men's or boys' shirts (kn)men's or boys' overcoats (n-kn)men's or boys' overcoats (kn)gloves, mittens, and mitts (n-kn)gloves, mittens, and mitts (kn)garments of felt, etc. (n-kn)garments (kn) nesbras, girdles, garters, etc.babies' garments (n-kn)babies' garments (kn)
30
25
20
15
10
5
0
END-MARKET STUDY FOR INDONESIAN APPAREL PRODUCERS 21
FIGURE 11: TOP 10 EUROPEAN IMPORTERS OF INDONESIAN GARMENTS, PLUS RUSSIA, 2006 (Millions of US$)
Source: Global Trade
THE JAPANESE MARKET Japan’s garment imports and the top nine sources are shown in Table 8 below:
TABLE 8: JAPAN’S GARMENT IMPORTS Rank 2005 2006 2006
$ 000 % of total Comments World 21,263 22,447 1 China 17,449 18,678 83% 2 Italy 966 947 4% 3 Vietnam 588 616 3% 4 Korea, South 374 302 1% 5 United States 312 265 1%
6 Thailand 244 247 1% duty free 7 France 196 175 1% 8 India 141 171 1% 9 Indonesia 115 135 1%
Source: Global Trade
Ger
man
y
Uni
ted
Kin
gdom
Net
herla
nds
Belg
ium
Fran
ce
Italy
Spa
in
Sw
eden
Rus
sia
Sw
itzer
land
HS (All)
Sum of 2006
Reporting Country
women's or girls' suits (n-kn)women's or girls' suits (kn)women's or girls' slips, pjs (kn)women's or girls' slips (n-kn)women's or girls' shirts (kn)women's or girls' overcoats (n-kn)women's or girls' overcoats (kn)women's or girls' blouses (n-kn)t-shirts, singlets, tank tops (kn)track suits, ski, swimwear (n-kn)track suits, ski, swimwear (kn)sweaters, pullovers (kn)shawls, scarves, mufflers, veils, etc.pantyhose, hosiery (kn)men's or boys' undershirts (n-kn)men's or boys' underpants (kn)men's or boys' suits (n-kn)men's or boys' suits (kn)men's or boys' shirts (n-kn)men's or boys' shirts (kn)men's or boys' overcoats (n-kn)men's or boys' overcoats (kn)gloves, mittens, and mitts (n-kn)gloves, mittens, and mitts (kn)garments of felt, etc. (n-kn)garments (kn) nesbras, girdles, garters, etc.babies' garments (n-kn)babies' garments (kn)
600
500
400
300
200
100
0

22 END-MARKET STUDY FOR INDONESIAN APPAREL PRODUCERS
The predominance of apparel imports from Europe (Italy/France) and the United States in Japan suggests that garments imported from countries other than China represent very high-end, high-value brands. They may be produced under “private label” orders from China or even Indonesia. Japan has no quota on Chinese apparel and has only a very limited preference system under the GSP, with duty rates going from zero to 12.8 percent (mainly for some animal-derived products). A full waiver is expected for Indonesia under the free trade agreement (FTA) between Japan and Indonesia, though it seems not yet fully implemented.2 Japan has free trade agreements with a number of other countries and also gives full a GSP waiver and full duty-free reduction to LDCs. It is important to note that Japan does not have an FTA with Vietnam, which could offer Indonesia a competitive advantage with the Japanese market.
THE AUSTRALIAN MARKET Despite their relative proximity, Australia appears not to have accorded Indonesia any fiscal benefits—preferential treatment in terms of GSP or tariff rate. Australia does extend duty-free exemptions to LDCs, with Bangladesh and Cambodia being the main LDC beneficiaries. If Indonesia were attempting to compete based solely on price, it would have to do so without any fiscal benefit. This situation gives further support to the already-cited recommendation that Indonesia should emphasize quality and delivery factors in marketing its apparel products and production capacity.
Australia has no quota restraint on China, and Chinese goods already dominate the Australian market, as seen in Table 9 below. Since China is expected to sign an FTA with Australia shortly, the Australian market is likely to become even more competitive for Indonesia.
TABLE 9: IMPORTS OF GARMENTS INTO AUSTRALIA IN US$ MILLIONS 2004 2005 2006
World 2,421 2,837 2,999 Comments 1 China 1,833 2,196 2,392 80%
2 Hong Kong 80 79 80
3 Italy 69 75 64
4 New Zealand 72 73 57
5 Fiji 67 62 57 duty free
6 India 44 56 44
7 Indonesia 31 38 41
8 United States 25 27 27 duty free
9 Thailand 26 25 25 duty free
10 Vietnam 18 23 22
Source: Global Trade Information Systems, Global Trade Atlas
THE CANADIAN MARKET Canada has a well-developed system for preferring LDCs, to which it allows 60 percent of imported (non-originating) content. However, none of this benefits Indonesia, and GSP benefits don’t apply to apparel. It
2 http://www.customs.go.jp/toukei/info/index_e.htm

END-MARKET STUDY FOR INDONESIAN APPAREL PRODUCERS 23
is therefore not surprising to find that four of the top 10 importers into Canada enjoy fiscal benefits, as shown in Table 10 below. Two of the four—Cambodia and Bangladesh—are LDCs, while Mexico and the United States are signatories with Canada to the North American Free Trade Agreement (NAFTA).
TABLE 10: CANADA’S GARMENT IMPORTS 2004 2005 2006
(millions of US$) World total 4,739 5,434 6,206 Status 1 China 1,550 2,447 3,026 Some quota 2 United States 470 447 450 duty free 3 Bangladesh 344 361 428 duty free 4 India 302 325 339 5 Mexico 270 280 296 duty free 6 Italy 155 145 149 7 Indonesia 94 110 132 8 Cambodia 105 106 128 duty free 9 Vietnam 53 87 123 10 Turkey 79 89 96 Source: Global Trade Information Systems, Global Trade Atlas
Since Canada is often seen as a back door into the U.S. market, it is logical to expect that China will make up more than 50 percent of Canada’s garment imports in the near future, once quota restraints are finally phased out.
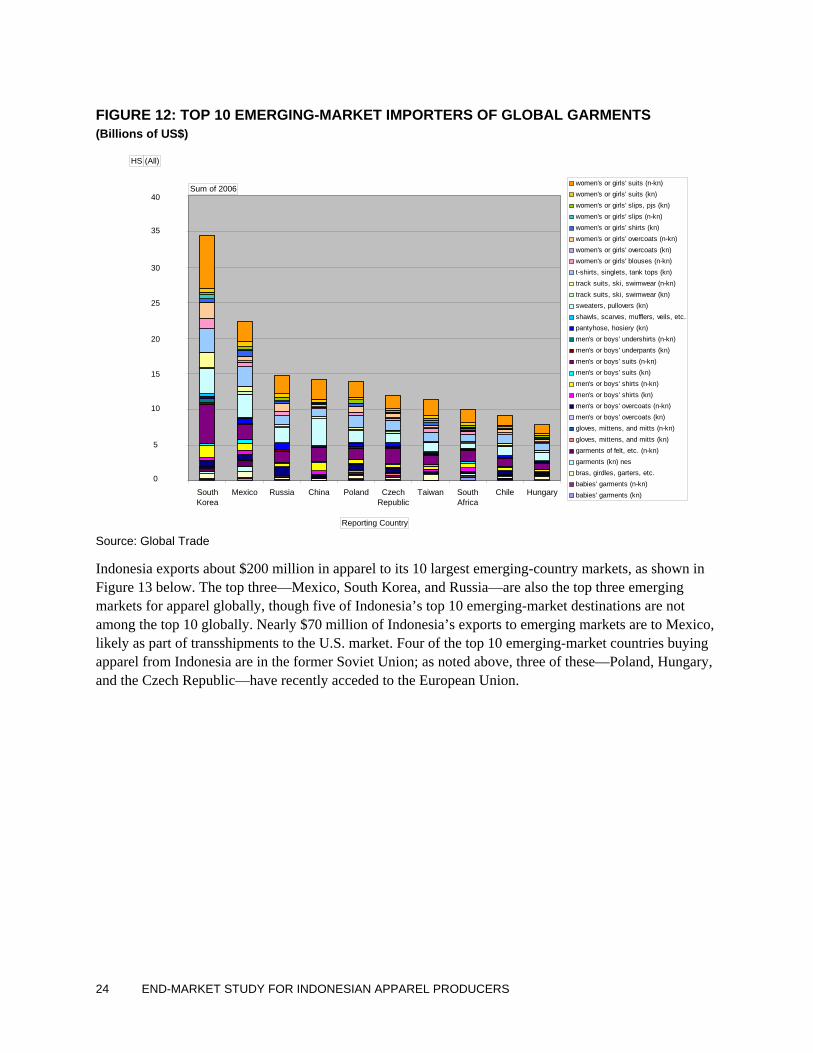
EMERGING MARKETS The top 10 emerging markets for apparel include South Korea, Mexico, Russia, China, Poland, Czech Republic, Taiwan, South Africa, Chile, and Hungary, as shown in the chart below (Figure 12). Significantly, four of these countries are in the former Soviet Union, and three of those are now members of the EU. In total, these 10 countries imported nearly $1.75 billion in apparel in 2006.
24 END-MARKET STUDY FOR INDONESIAN APPAREL PRODUCERS
FIGURE 12: TOP 10 EMERGING-MARKET IMPORTERS OF GLOBAL GARMENTS (Billions of US$)
Source: Global Trade
Indonesia exports about $200 million in apparel to its 10 largest emerging-country markets, as shown in Figure 13 below. The top three—Mexico, South Korea, and Russia—are also the top three emerging markets for apparel globally, though five of Indonesia’s top 10 emerging-market destinations are not among the top 10 globally. Nearly $70 million of Indonesia’s exports to emerging markets are to Mexico, likely as part of transshipments to the U.S. market. Four of the top 10 emerging-market countries buying apparel from Indonesia are in the former Soviet Union; as noted above, three of these—Poland, Hungary, and the Czech Republic—have recently acceded to the European Union.
SouthKorea
Mexico Russia China Poland CzechRepublic
Taiwan SouthAfrica
Chile Hungary
HS (All)
Sum of 2006
Reporting Country
women's or girls' suits (n-kn)women's or girls' suits (kn)women's or girls' slips, pjs (kn)women's or girls' slips (n-kn)women's or girls' shirts (kn)women's or girls' overcoats (n-kn)women's or girls' overcoats (kn)women's or girls' blouses (n-kn)t-shirts, singlets, tank tops (kn)track suits, ski, swimwear (n-kn)track suits, ski, swimwear (kn)sweaters, pullovers (kn)shawls, scarves, mufflers, veils, etc.pantyhose, hosiery (kn)men's or boys' undershirts (n-kn)men's or boys' underpants (kn)men's or boys' suits (n-kn)men's or boys' suits (kn)men's or boys' shirts (n-kn)men's or boys' shirts (kn)men's or boys' overcoats (n-kn)men's or boys' overcoats (kn)gloves, mittens, and mitts (n-kn)gloves, mittens, and mitts (kn)garments of felt, etc. (n-kn)garments (kn) nesbras, girdles, garters, etc.babies' garments (n-kn)babies' garments (kn)
40
35
30
25
20
15
10
5
0

END-MARKET STUDY FOR INDONESIAN APPAREL PRODUCERS 25
FIGURE 13: TOP 10 EMERGING-MARKET IMPORTERS OF INDONESIAN GARMENTS (Millions of US$)
Source: Global Trade Information Systems, Global Trade Atlas
M
exic
o
Rus
sia
Sou
th K
orea
Pol
and
Turk
ey
Mal
aysi
a
Ven
ezue
la
Taiw
an
Sout
h A
frica
Chi
na
t n
HS (All)
Sum of 2006
Reporting Country
women's or girls' suits (n-kn)women's or girls' suits (kn)women's or girls' slips, pjs (kn)women's or girls' slips (n-kn)women's or girls' shirts (kn)women's or girls' overcoats (n-kn)women's or girls' overcoats (kn)women's or girls' blouses (n-kn)t-shirts, singlets, tank tops (kn)track suits, ski, swimwear (n-kn)track suits, ski, swimwear (kn)sweaters, pullovers (kn)shawls, scarves, mufflers, veils, etc.pantyhose, hosiery (kn)men's or boys' undershirts (n-kn)men's or boys' underpants (kn)men's or boys' suits (n-kn)men's or boys' suits (kn)men's or boys' shirts (n-kn)men's or boys' shirts (kn)men's or boys' overcoats (n-kn)men's or boys' overcoats (kn)gloves, mittens, and mitts (n-kn)gloves, mittens, and mitts (kn)garments of felt, etc. (n-kn)garments (kn) nesbras, girdles, garters, etc.babies' garments (n-kn)babies' garments (kn)
80
70
60
50
40
30
20
0
10


END-MARKET STUDY FOR INDONESIAN APPAREL PRODUCERS 27
V. APPAREL BUYERS: OPINIONS AND INSIGHTS Individual buyers and apparel companies operate differently, and therefore the needs they identify differ depending on which value-chain functions the company handles in-house. Generally, the larger the buyer, the more it does for itself. For example, the largest discount retailers often do their own importing at destination, along with direct retailing. They therefore do not need vendors to offer landed prices or to have offices at destination.
However, our study identified some vendor requirements as critical to buying decisions for all buyers. These included fabric knowledge, quick turnaround, on-time delivery, production of exact samples, and good fitting skills. The challenge in this section involves applying an end-market analysis to a sustainability and upgrading strategy for the Indonesian garments and apparel industry, which requires finding common ground between what buyers are asking for and what Indonesian vendors can do—and want to do. The discussion below is divided into three parts, covering buying agents, buyers’ requirements, and highlights from the buyers survey.
BUYING AGENTS Between stitcher and retailer there may be any number of intermediaries and sub-agents. Some take title to the goods for a time; others may not assume ownership, but perform some service. With the ubiquity of the internet and the improvements in communication brought on by advances in information technology, there is a trend for some intermediaries to be pushed out of the chain unless they perform a valuable, specialized service, such as independent verification of quality or compliance.
However, most large and medium-sized buyers will likely continue to use the services of a regionally based buying agent who is familiar with local factories and vendors. For example, Abercrombie & Fitch uses the services of a “mother company” in South Korea that does all of their regional buying, fabric sourcing, and factory selection.
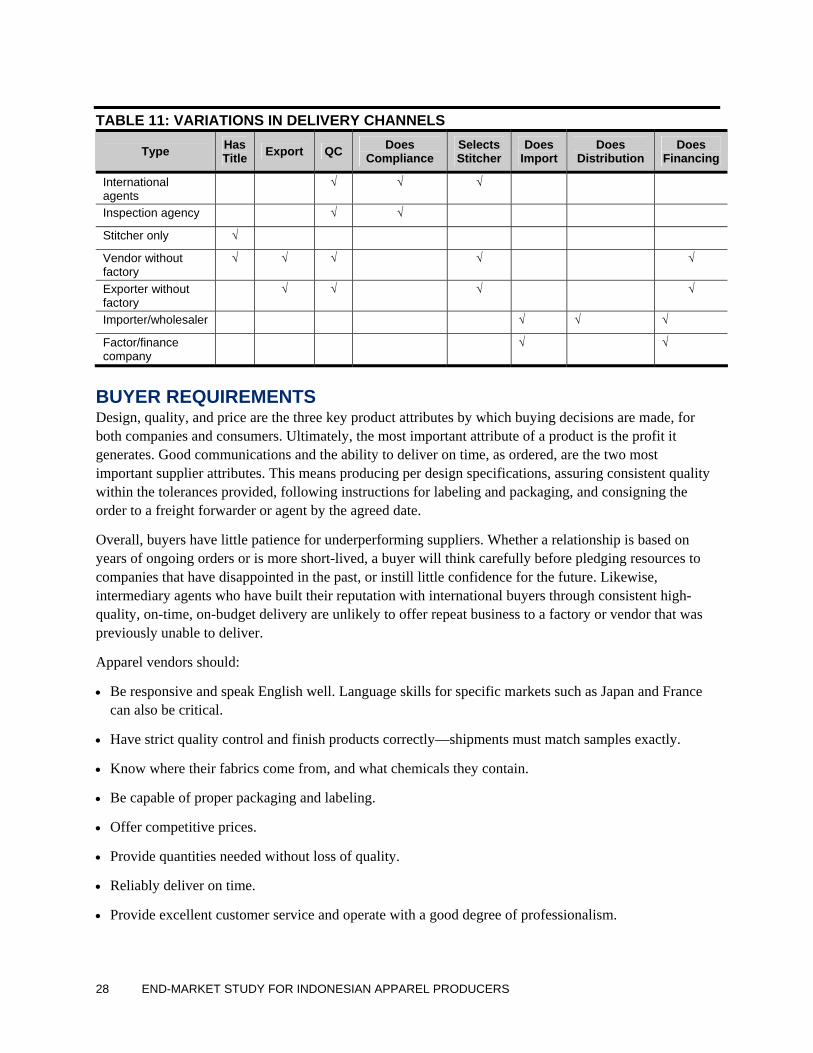
A key factor in the value chain is whether such agents take ownership of the product or simply represent the buyer in a foreign land. Normally there is some transfer of title, since the buyer and the exporter are unlikely to be the same company—and even if they were, they would be separate legal entities. Where a buyer is not doing its own importing and does not have a regional buying office, and where the stitcher is not the same as the exporter (a common situation before, for quota reasons), one or more of the variations in function shown in Table 11 may apply.
28 END-MARKET STUDY FOR INDONESIAN APPAREL PRODUCERS
TABLE 11: VARIATIONS IN DELIVERY CHANNELS
Type Has Title Export QC Does
Compliance Selects Stitcher
Does Import
Does Distribution
Does Financing
International agents
√ √ √
Inspection agency √ √
Stitcher only √
Vendor without factory
√ √ √ √ √
Exporter without factory
√ √ √ √
Importer/wholesaler √ √ √
Factor/finance company
√ √
BUYER REQUIREMENTS Design, quality, and price are the three key product attributes by which buying decisions are made, for both companies and consumers. Ultimately, the most important attribute of a product is the profit it generates. Good communications and the ability to deliver on time, as ordered, are the two most important supplier attributes. This means producing per design specifications, assuring consistent quality within the tolerances provided, following instructions for labeling and packaging, and consigning the order to a freight forwarder or agent by the agreed date.
Overall, buyers have little patience for underperforming suppliers. Whether a relationship is based on years of ongoing orders or is more short-lived, a buyer will think carefully before pledging resources to companies that have disappointed in the past, or instill little confidence for the future. Likewise, intermediary agents who have built their reputation with international buyers through consistent high-quality, on-time, on-budget delivery are unlikely to offer repeat business to a factory or vendor that was previously unable to deliver.
Apparel vendors should:
• Be responsive and speak English well. Language skills for specific markets such as Japan and France can also be critical.
• Have strict quality control and finish products correctly—shipments must match samples exactly.
• Know where their fabrics come from, and what chemicals they contain.
• Be capable of proper packaging and labeling.
• Offer competitive prices.
• Provide quantities needed without loss of quality.
• Reliably deliver on time.
• Provide excellent customer service and operate with a good degree of professionalism.

END-MARKET STUDY FOR INDONESIAN APPAREL PRODUCERS 29
• Have internet access, email, the ability to send and receive large attachments, and skills to take high-quality digital images.
Interviewees for this and previous end-market studies in other value chains have been abundantly clear: no matter how appealing a sample might be, a vendor cannot expect to receive orders unless the product can be delivered on time, as ordered, and with good customer service. In the section below, buyer requirements and opinions on the Indonesian apparel industry are presented in more detail:
Price. Buyers are always looking for lower base prices, and in fact the largest discount retailers expect base prices to decline every year. According to buyers, Indonesia does offer pricing that is very competitive with the quotes that they receive out of Vietnam, the Philippines, China, and Cambodia. Indonesia is also developing a good reputation for competitive pricing of high-quality, high-end garments.
A difficulty for Indonesia is that one of the easiest ways to obtain a price advantage is through fiscal benefits. These serve as a strong attraction for buyers, as witnessed by the growth in the apparel sectors in LDCs. Indonesia currently does not benefit from such preferences. Ironically, with the notable exceptions of Cambodia and Bangladesh, fiscal benefits are generally bestowed on countries that cannot benefit from them or that can use them only if they do two of the following locally—yarn manufacture, fabric production, or stitching. Unfortunately, the benefit is often negated by the cost of local or regional fabric.
For example, to move capacity from a non-preference country to a preference country normally requires at least 10 percent duty savings. In addition, countries that have these benefits tend to be more expensive and more problematic in terms of delivery and information.
This issue has little relevance in terms of the U.S. market: in Asia, only Singapore has an FTA with the United States, and most tariff reductions can be found only in overseas U.S. territories, such as the Marianas. Generally the tariff waivers given by the United States are found elsewhere—in Central America and the Dominican Republic, through CAFTA; in sub-Saharan Africa and Morocco, through AGOA; and the special cases of Jordan, Egypt, and Israel.
For the Europeans, the picture is different, if local or regional inputs are used: in that case, there is a 20 percent rebate on normal duty. Some competitors get a full waiver, allowing them to buy fabric from a wider pool of countries—Bangladesh, for example, can buy from India and still get a full waiver. Such a waiver generally confers a 13 to 14 percent saving. Indonesia, by contrast, can buy fabric only from other ASEAN countries that don’t produce a great deal of fabric. As mentioned previously, the significant advantage here goes to LDCs that have flexibility in their fabric sourcing and a full waiver.
In Asia, LDCs include Cambodia, Bangladesh, Nepal, and Laos, as well as a few others, such as Afghanistan or Timor-Leste, with little history of apparel production. In practical terms, Cambodia and Bangladesh have benefited tremendously from these rules. Nepal could do so as well (and has done so, historically) once its political situation stabilizes.
Quality Control. While the quality of Indonesian apparel is generally good, buyers also complained that it can be inconsistent. Buyers commented that weak quality assurance procedures and limited technical infrastructure were among their main hesitations when placing orders with Indonesian suppliers (see

30 END-MARKET STUDY FOR INDONESIAN APPAREL PRODUCERS
box). One buyer stated that any white garments she ordered from Indonesia always ended up looking “brownish” when she received samples.
Buyers need to be able to see that suppliers have internal systems in place that both control the volume of production and ensure consistent quality during the process. A buyer agent will look for signs that the supplier’s management knows what it is doing—that it understands the garment’s design requirements and that it will match them exactly and consistently during high-volume production, all while meeting the delivery schedule. This is especially critical when a new type of fabric or stitching requirement is online—a situation in which buyers will want extra reassurance that management has instituted proper monitoring procedures.
Technical Capacity. The days are past when it was a matter of course for a Western buyer to have a sample room where garments were made by people with years of experience. Frequently, a buyer is hired by an apparel company based on commercial acumen and drive, or even fashion skills, rather than because the candidate has a textile background. Such buyers often suggest stitching methods using samples which may entail higher cost or lead to slower output or more waste. Therefore, once a strong working relationship is established with a buyer, if the vendor can offer advice on new fabric developments, ways of adapting a design, and other means of reducing costs without changing the look, fit, or style of the garment, it is often greatly appreciated by buyers. Since fabric is the main part of cost, knowing how to manipulate different gauges, qualities, and weights is especially important. The skill here is to have merchandisers who can look at a sample or spec sheet and suggest changes based on practicality and cost without changing the uses or appearance of the garment.
However, while Indonesia has its production strengths, buyers continue to source mainly simple, uncomplicated styles out of Indonesia. Such basic styles require no printing or special techniques such as allover embroidery, given that Indonesia lacks the capacity to handle these higher-value styles. The capacity shortfall involves both limited technical skills among Indonesia’s workforce and technological constraints. Buyers remarked that they felt technical support in Indonesia is limited, and the country’s aging machinery also limits capacity.
Communication Skills. Excellent customer service through strong communication skills is critical to buyer-vendor relations, but this need is easy for a vendor to overlook. In the highly seasonal fashion business, if vendors find they cannot hit the shipping window for some reason, they need to notify the buyer promptly, regardless of consequences. Frequently, for cultural or other reasons, the Asian vendor fails to communicate potentially negative information, and the result can be cancellation of the order, additional airfreight costs, or discounts at the vendor’s expense.
Fabric Specifications and Quality Control
A key quality concern that is not well integrated into Indonesian quality control systems involves fabric specifications. From the end-market perspective, buyers require laboratory certification that fabric meets specifications for:
• Colorfastness when washed
• Colorfastness when dry-cleaned
• Colorfastness to water
• Colorfastness to perspiration
• Colorfastness to light
• Colorfastness to non-chlorine bleach
• Shrinkage resistance when washed
• Shrinkage resistance when dry-cleaned
• Resistance to twisting during washing
• Bursting strength
• Resistance to pilling
Indonesian apparel suppliers need to fully understand and comply with these specifica-tions in order to give to end markets full-package service with reliable and consistent quality control.
END-MARKET STUDY FOR INDONESIAN APPAREL PRODUCERS 31
A vendor who is always upfront with all developments, continually informing buyers and agents of the status of their orders, is very welcome and—according to many of the buyers we surveyed—actually quite rare. Many vendors could benefit from reviewing their internal systems and how they share information with agents and buyers.
Labor Costs. Labor costs in Indonesia present a challenge to Indonesian suppliers, who must compete with suppliers from other countries in the region that have lower labor costs. Moving their factories to locations in Central and East Java, where lower labor costs are lower than in West Java, has increased competitiveness for some vendors in the industry. However, in other cases, factories have been relocated to relatively remote locations. While this may reduce labor costs, the savings come at the expense of on-time delivery, reliable communications, and consistent quality.
Information Technology (IT) Infrastructure. One of the largest retailers with a presence in Indonesia stated that to maintain global competitiveness, Indonesia must become a first adopter and user of IT tools in order to keep close ties with sources of technology such as Singapore, India, and Japan, as well as apparel buyer agent hubs such as Hong Kong and South Korea. The Indonesian government and private sector also needs to improve its reputation in the area of intellectual property rights (IPR) to stay abreast of other regional competitors.
Country Risk. Generally it is true that the poorer the country, the lower the labor cost. However, it is also true that in poor countries the indirect costs are likely to be higher, as is the likelihood of major disturbances such as strikes and political upheavals. There are certainly some countries with very low direct labor costs and a history of garment making—Nepal, for example—but the business environment in these countries makes it next to impossible to guarantee when goods will ship. Indonesia is far from immune to this problem. One female buyer said that she would be nervous if she had to travel to Indonesia alone. Another buyer commented that Indonesia’s reputation for insecure waterways and piracy increases insurance costs, which can be a deterrent to buyers.
Depth of the Industry. Regardless of the unit prices offered by any given vendor, a Western buyer or the buyer’s agent is likely to visit at least four or five vendors in possibly two countries on buying trips that can occur twice or three times a year. If a country does not offer enough factories or existing production capacity to choose from, the buyer won’t go there, as it involves considerable extra effort to spread a garment-buying trip over more than a few countries.
One buyer mentioned that although labor wages in Indonesia are higher than Vietnam and Cambodia, the apparel company he works for has been able to make costing work, since its vendors in Indonesia have several other programs in other countries and are cost leveraging effectively. Clearly, deepening and strengthening the industry’s linkages and business relationships outside the country is important.
Management. Buyers reported that a surprisingly large number of factories don’t have a strong manager who is monitoring—and pushing—for on-time, on spec delivery. Since this is a “pull” industry, this type of direct management is essential, as it forms a large part of the reason that international buyers feel they can rely on regionally based third-party agents to troubleshoot during the production process. With a strong manager in place, buyers and agents can then fill the role of asking production questions, solving delivery delays, and visiting new factories frequently to uncover situations where information has been communicated incorrectly.

32 END-MARKET STUDY FOR INDONESIAN APPAREL PRODUCERS
0
0.5
1
1.5
2
2.5
3
3.5
4Cheaper Price
Better Quality
Faster Delivery
Clearer Merchandising
IndonesiaVietnamChinaThailandBangladeshIndiaPakistanPhilippines
BUYERS SURVEY: OPINIONS AND STRATEGIC RECOMMENDATIONS In discussions with buyers and agents sourcing apparel out of Indonesia, buyers generally expressed satisfaction with Indonesian apparel vendors. Indonesian vendors can be faster and more reliable than sources in places such as Bangladesh, although they are considered slower and more expensive than those in China. One buyer said that Indonesia does “fashion” garments and high-quality basics very well, especially in terms of its flexibility about fabric weights. Fabric weights above 100 grams per square meter are not easy to handle, but the factories in Indonesia do it very well. The workers are also skilled in handling heavyweight fleece, which is not always the case in other countries.
As illustrated in the spider chart below (Figure 14), where buyers were asked what countries ranked better than Indonesia on price, quality, delivery time, and merchandizing, Indonesia generally ranked in the middle on most factors. The country scoring the highest on each of the factors, and thus appearing in the outermost ring on the chart, is Vietnam, which implies that Vietnam is seen as Indonesia’s greatest competition. China scores a close second. Generally, buyers remarked that Indonesia has better sewers and a better work ethic than Cambodia, but still needs to catch up with Vietnam. “Indonesia is definitely our best second option [behind Vietnam] in Southeast Asia, when we have the choice,” said one buyer.
NEEDED IMPROVEMENTS In other areas, buyers commented on Indonesia’s need for improvements. Indonesians’ skills in technical design, fabric development, fabric sourcing, and sampling were seen as weak, as were the availability and price of local fabric. The management teams among Indonesian vendors are seen as loyal and reliable, but sometimes weak in innovation and proactivity. One buyer mentioned Indonesia’s inability to deliver styles that require handwork, stating that Indonesia is “limited when it comes to special washes. We only do basic washes with softeners out of Indonesia.” While one buyer felt Indonesia is good at handling designs requiring heavier fabric weight, such as fleece, another buyer said that Indonesia struggles with designs requiring more extreme washes for such heavy fabrics.
FIGURE 14: BUYER RANKINGS OF APPAREL SECTORS IN EIGHT ASIAN COUNTRIES
Source: Global Trade

END-MARKET STUDY FOR INDONESIAN APPAREL PRODUCERS 33
To attract new buyers and their agents and to improve sampling skills, one midsize buyer suggested that Indonesian vendors go to the stores of prospective new clients, buy some clothes, and duplicate them. Vendors can then show the copied samples to the company to demonstrate exact sampling and matching, as well as to give cost-of-production estimates. Another buyer suggested setting up sample showrooms at or near buying agents’ offices, particularly in Hong Kong and South Korea. Using the price ticket of the garment, Indonesian suppliers can usually determine what their costing needs to be, based on an average industry markup of roughly 72–75 percent.
Buyers also felt that the apparel industry and financial institutions in Indonesia have not been very innovative about developing financing mechanisms for apparel companies and factories. The buyers attributed this factor, in part, to a view held by bankers—and by some actors in the global apparel industry—that Indonesia’s apparel sector is in decline. Indonesia’s strong performance after the end of MFA has begun to change some opinions in this regard, but this has not yet translated into improvements in the sector’s access to finance.
A buyer from a high-end globally branded retailer related that Indonesia is excellent at handling large orders ($80,000–$250,000). However, she said that Indonesia offers little capacity to handle smaller orders ($50,000–$70,000) so she is forced to look elsewhere for a vendor for those. Indonesia’s factories are large, and they focus on taking advantage of economies of scale and competitive labor prices―reasons why large discount retailers continue to source from Indonesia. However, because Indonesia is developing a reputation and a market niche for high-end, higher-quality garments, it is becoming increasingly important for the country to develop the ability to deliver smaller orders with a faster turnaround than competitors, and into tighter fashion windows,. Without technological and production changes, Indonesian vendors will remain unable to deliver small orders allowing them to target other buyers and a wider range of market segments.
Buyers uniformly praised Indonesia’s ability to delivery high-quality basic apparel, but gave conflicting opinions on Indonesia’s ability to handle complex garments. One buyer said that they have not had good experiences in Indonesia with apparel products requiring nine or more stitchings. However, two other buyers praised Indonesia’s ability to handle complex garments, especially those using heavy fabrics. It is likely that the negative evaluation was based on a single bad experience. This underscores the importance of accurate sampling and technical design skills, starting with the first order and remaining absolutely consistent over time.
COUNTRIES IDENTIFIED AS COMPETITORS Buyers were asked which countries they see as Indonesia’s main competitors.3 As shown in Table 12 below, Vietnam and China are mentioned repeatedly in all categories. Bangladesh also had many positive responses, while Cambodia and Malaysia are not really seen as competitive alternatives.
3 Not all buyers filled in the numerical rating portion of the written survey. Instead, they preferred to provide feedback verbally or
anecdotally through email.

34 END-MARKET STUDY FOR INDONESIAN APPAREL PRODUCERS
TABLE 12: COUNTRIES IDENTIFIED AS ALTERNATIVE SOURCES TO INDONESIA Q: Which other countries beside Indonesia do you source from in Southeast Asia?
A: Other countries are better in terms of:
Place among “Yes” answers Cheaper Better
Quality Faster Delivery
Clearer Merchandising Main competitor
Cambodia 3 2 Thailand 2 2 1 1 1 3 Vietnam 6 3 4 3 3 3 China 4 2 3 3 3 5 Philippines 2 2 2 1 1 2 India 3 1 0 2 2 1 Bangladesh 4 2 4 0 2 3 Sri Lanka 1 1 Pakistan 2 1 1 1 1 Malaysia 1 1 Hong Kong 1 0 0 0 1 Turkey 1 1 Taiwan 1 1
Source: Buyers survey

END-MARKET STUDY FOR INDONESIAN APPAREL PRODUCERS 35
VI. STRATEGIC RECOMMENDATIONS FOR UPGRADING AND SUSTAINABILITY In order to overcome their weaknesses in the short term, Indonesian suppliers should attempt to better market their production capacity and technical skills to agents in the Republic of Korea, Taiwan, and Hong Kong, as the majority of garment production for export in Asia is handled through Korean, Taiwanese, and Hong Kong agent companies such as Hansoll Textile, Hansae Co., Mast Industries, and Li & Fung.
Although buying agents add a layer of separation between the factory and end-market apparel retailer, they serve as a trusted emissary who will ensure garment quality, on-time delivery, and satisfactory performance. Such agents are familiar with the demands of the Western fashion industry and know how to keep the customer satisfied while also meeting the needs of the factory. For a factory that lacks the infrastructure and technology, the contacts that these agents have are essential to building up the clientele of the factory and handling the constant and immediate communication required by buyers. In fact, many retail companies would never use a factory directly, since their business requires a great deal of coordination with many diverse teams, merchants, technical designers, color labs, sourcing, etc., which normally necessitates an agent dedicated to a style. Eventually, once a factory has built up a solid reputation with its clientele and a capacity for handling more complicated washes, prints, embroidery, and pattern revisions, it may possibly be able to discard or bypass the agent in order to conduct business directly with the buyer, but the buyers that were interviewed felt this was highly unlikely.
Additionally, buyers usually have a three-year buying plan that includes the projected number of units they expect to source for various products and market segments. These plans are usually communicated to their buying agents and—while strategic details are kept confidential for competitive reasons—most buyers and agents would be open to communicating expected areas and volume of expected growth. If Indonesian vendors can research and liaise with buying agents about available projections, they could fain the upper hand against other countries that are not working to anticipate where growth opportunities will be found. For example, if an Indonesian vendor already has a relationship with an agent for a specific retailer, knowing that that company is opening 10 new retail outlets in two countries in Eastern Europe, as well as knowing the buying agent who will be handling the sourcing and the prevailing apparel style trends where the new retail outlets are opening, could give Indonesian vendors an advantage in capturing new orders for that market.
Upgrade factory technology and technical skills among the workforce in order to handle more complex design and stitching requirements. A continuing theme for buyers who source goods out of Indonesia is the need for Indonesian suppliers to have the machinery and technical expertise to understand
“Their pricing is competitive, but the level of complication that [Indonesia] can handle is very limited.”
—Buyer for large, branded apparel company

36 END-MARKET STUDY FOR INDONESIAN APPAREL PRODUCERS
and execute style patterns well, and to be able to act on fit comments and pattern revisions that are made by the buyer. Indonesian vendors should be provided with a range of garment samples that illustrate the latest trends in design and stitching requirements and guidance on the factory upgrades and workforce training needed to produce them.
By increasing their access to technology and infrastructure, Indonesian suppliers will also be able to produce higher value added garments, building on Indonesia’s noted strength in manmade and blended fabrics. As mentioned previously, many garments sourced out of Indonesia are basics, with little or no embroidery and/or graphics, which in turn decreases the price that a buyer is willing to pay for them (see box). A buyer will look to pay as little as possible for basic garments such as camis or t-shirts, given that they will eventually have to pay to embroider or print them in another country, at a higher cost. By becoming more technologically advanced, Indonesia could overcome its higher labor costs by increasing its efficiency and the number of garments produced. Furthermore, by implementing the technology required to execute more complex washes, destruction techniques, embroidery, and graphic printing, Indonesian suppliers could increase the value of the garments they can produce and the price that they can charge to buyers, given that they would be producing a more complete garment.
Buyers noted that it is important for Indonesian suppliers to be capable of generating the work-in-progress reports that reassure the buyer that there are no major issues with production. This includes the execution of audit reports that confirm the quality of production and that pattern revisions are being followed. Indonesian vendors must improve their technical capacity to give the buyer timely, accurate, and honest feedback on a daily basis in order to allow the buyer and the buying agent to better monitor production remotely.
To catalyze technological upgrades in the Indonesian apparel industry, it is recommended that the SENADA project facilitate a trade visit to China focused on the acquisition of textile machinery, as the country offers an attractive price-to-performance ratio to customers from the region. According to a recent survey conducted by the China Textile Machinery Association among its 893 textile machinery and equipment builders,4 the fastest-growing export product was spinning machines, with knitting machines representing the highest export value. Over 80 percent of the China-made textile machines were produced in Guangdong, Beijing, Shanghai, Chongqing, and Shanxi. Conversely, exports of chemical fiber machines, non-woven fabric machines, and weaving preparation machines are on the decline. Therefore, SENADA should consider Japanese or European sources, such as those in Italy, Switzerland, or Germany, for textile machinery suppliers handling synthetic fibers.
4 http:/textile.2456.com/eng/epub/n_details.asp?epubiid=4&id=2175
Embellishment Factories: Staying Abreast of the Competition
Demand for embellished garments—ones distinguished by hand embroidery, special printing, destructive washing, etc.—is high in the United States, Europe, Japan, and other developed markets. This trend is expected to continue for at least the next five years. China, Eastern Europe, and Central and South America are already starting up specific “embellishment factories” to produce garments for this relatively new product trend. Such embellishment factories are in fact marketing tools used to incorporate ornamental elements into the products and to build buyers’ faith in these countries’ ability to supply such complex products from their factories.
Embellishment is extremely important to buyers, as it is generally helps position a brand label to compete more effectively in trendy, high-fashion markets. Yet most Indonesian factories currently outsource embellishment work. To compete, the industry needs to develop a comprehensive embellishment strategy—from equipment to sewing skills to fabric sourcing—to capture business from this influential market trend.

END-MARKET STUDY FOR INDONESIAN APPAREL PRODUCERS 37
As part of this activity, SENADA should assist the Indonesia companies in producing investment projections and a financial analysis based on the information gained during the trade visit. It is estimated that around US$5 million would be needed for machines to produce solid circular-knit fabrics (200 ton monthly capacity in gauges 14, 18, 20, and 24; 30 and 34 diameter), and any financial analysis should incorporate the entirety of any new production capacity—knitting machines, dyeing process, fabric sourcing, rectilinear frames, laboratory needs, and so on.
Workforce development. As highlighted in Table 13 below, a majority of buyers surveyed felt that immediate training in industrial engineering and textile training and awareness are essential to the apparel industry in Indonesia. Some of the training courses are available locally, but a key concern among buyers was not so much that training is not available as that it is not being used. Factories were mentioned as being resistant to hiring people with industrial engineering training over those who have practical factory experience.
TABLE 13: TRAINING NEEDS IDENTIFIED IN THE BUYERS SURVEY Essential Desirable No need
Immediate training needs Garment stitching training center 2 1 2 Factory supervisor training, practical 2 3 0 Industrial engineering 5 3 0 Shipping and documents review 0 0 0 Merchandiser training, practical 2 2 0 Textile training and awareness 6 3 0 Long-term needs Fashion college—degrees 2 3 0 Textile institute—degree 4 2 0 Compliance laws inspection and training 0 2 3 Other Visits to trade shows 1 2 4 Other Other—please specify Pattern making
Source: Apparel Buyers Survey
If the Indonesian apparel industry is to prosper, apparel buyers generally believe that Indonesia should take a more scientific approach to hiring people with training in functional areas. Most buyers recommended upgrading technical skills, including skills in technical service delivery areas such as technical design support and quality assurance. Without improvements in this area, buyers emphasized that the level of difficulty in a style would definitely deter them from placing orders from Indonesia. The perception is that technical support in country is limited and lags behind that of Vietnam or the Philippines, while the technical side of the apparel industry is getting more advanced by the day. Training and implementation of Gerber technology, Lectra, Investronica, Product Data Management (PDM), and Acceptance Quality Levels N.2 and N.4 are strongly suggested as pattern-making, sampling, and quality assurance skills relevant to international markets. Specific training on how to negotiate in the garment sector would also be effective and useful.
To assist in the sustainable upgrading of the Indonesian apparel industry, it is recommended that SENADA facilitate the following workshops for the industry:
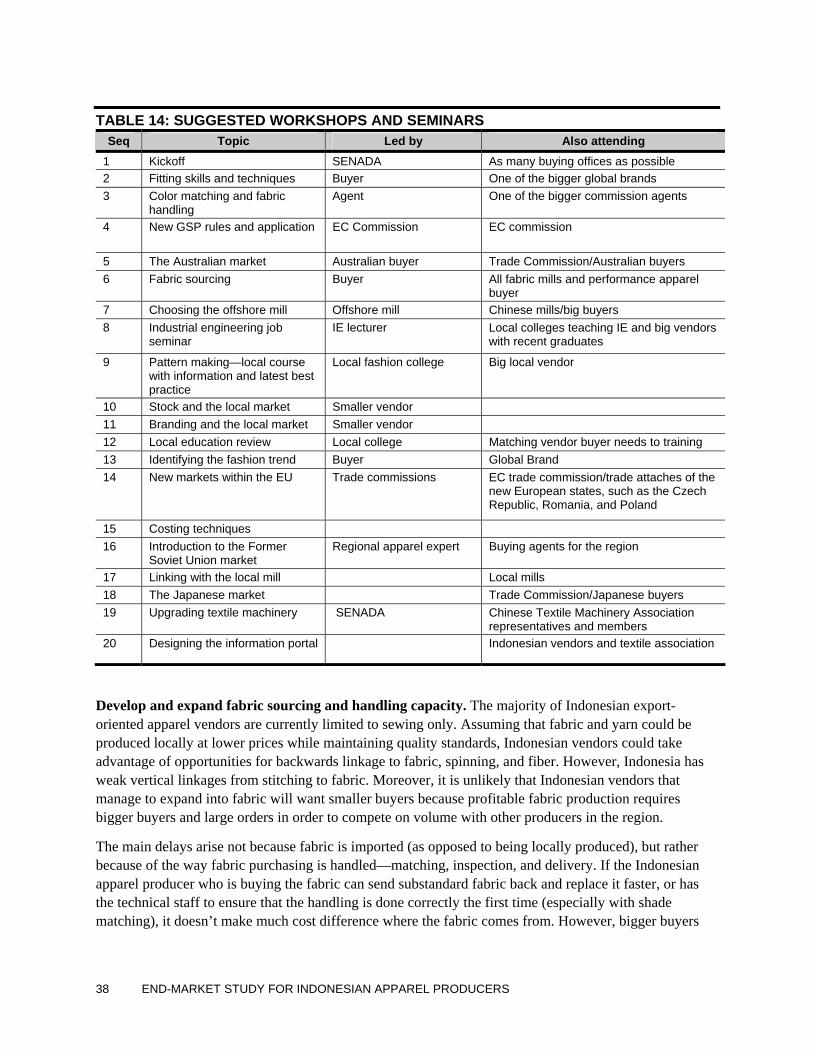
38 END-MARKET STUDY FOR INDONESIAN APPAREL PRODUCERS
TABLE 14: SUGGESTED WORKSHOPS AND SEMINARS Seq Topic Led by Also attending
1 Kickoff SENADA As many buying offices as possible 2 Fitting skills and techniques Buyer One of the bigger global brands 3 Color matching and fabric
handling Agent One of the bigger commission agents
4 New GSP rules and application EC Commission EC commission
5 The Australian market Australian buyer Trade Commission/Australian buyers 6 Fabric sourcing Buyer All fabric mills and performance apparel
buyer 7 Choosing the offshore mill Offshore mill Chinese mills/big buyers 8 Industrial engineering job
seminar IE lecturer Local colleges teaching IE and big vendors
with recent graduates
9 Pattern making—local course with information and latest best practice
Local fashion college Big local vendor
10 Stock and the local market Smaller vendor 11 Branding and the local market Smaller vendor 12 Local education review Local college Matching vendor buyer needs to training 13 Identifying the fashion trend Buyer Global Brand 14 New markets within the EU Trade commissions EC trade commission/trade attaches of the
new European states, such as the Czech Republic, Romania, and Poland
15 Costing techniques 16 Introduction to the Former
Soviet Union market Regional apparel expert Buying agents for the region
17 Linking with the local mill Local mills 18 The Japanese market Trade Commission/Japanese buyers 19 Upgrading textile machinery SENADA Chinese Textile Machinery Association
representatives and members 20 Designing the information portal Indonesian vendors and textile association
Develop and expand fabric sourcing and handling capacity. The majority of Indonesian export-oriented apparel vendors are currently limited to sewing only. Assuming that fabric and yarn could be produced locally at lower prices while maintaining quality standards, Indonesian vendors could take advantage of opportunities for backwards linkage to fabric, spinning, and fiber. However, Indonesia has weak vertical linkages from stitching to fabric. Moreover, it is unlikely that Indonesian vendors that manage to expand into fabric will want smaller buyers because profitable fabric production requires bigger buyers and large orders in order to compete on volume with other producers in the region.
The main delays arise not because fabric is imported (as opposed to being locally produced), but rather because of the way fabric purchasing is handled—matching, inspection, and delivery. If the Indonesian apparel producer who is buying the fabric can send substandard fabric back and replace it faster, or has the technical staff to ensure that the handling is done correctly the first time (especially with shade matching), it doesn’t make much cost difference where the fabric comes from. However, bigger buyers

END-MARKET STUDY FOR INDONESIAN APPAREL PRODUCERS 39
will virtually never delegate this function to the vendor without also delegating responsibility and risk as well, especially if they have nominated the fabric.
In this regard, a possible opportunity for Indonesia lies with buyers who delegate fabric sourcing to the local vendor or factory. Indonesian vendors that can buy fabric locally or regionally depending on price, quality, fabric, and delivery requirements can increase their profitability, customer base, and sustainability. China, Korea, and Bangladesh are all good potential fabric sources, and SENADA should assist Indonesian factories in establishing and building direct links to fabric vendors in those countries. Care should be taken such improvements in the value chain correspond to improvements in management’s ability to provide samples that are exactly accurate in terms of fabric color and style, cut, and fit. Building apparel buyers’ faith in Indonesian vendors’ ability to handle fabric sourcing is a key challenge that must be met in upgrading the industry. SENADA could also supplement this end-market study with a study focused on the other end of production: identifying strategies for improved fabric sourcing and development.
In addition to branded apparel companies with their own retail network, smaller buyers (see box) offer excellent opportunities if Indonesia can expand and improve its fabric sourcing ability. Typically, this type of buyer does not have an office in Asia and is:
• Retailing only in one country in Europe or limited to one region of the United States.
• Retailing only in a smaller market, such as Australia or South Africa.
• Focused on products for a specialized market, such as hunting, fishing, or riding.
• Interested in a long-term relationship with key vendors, since the buyer cannot afford or does not have the time to travel to Asia more than once a year.
This type of buyer also typically:
• Places a high degree of trust and responsibility in the vendor.
• Does not have the market presence to attract the attention or interest of a global buying agent.
• Sells at relatively up-market price points and quality.
• Places orders with longer lead times.
• Is more interested in reliability and quality than chopping and changing based on small price movements.
• Prefers vendors that specialize in apparel in their market segment.
• Uses standard fabric requirements available in the market
• Has a staff of less than 20.
• Appreciates credit facilities offered by factories.
Examples of Smaller Companies to Target:
• Ouray Sportswear, U.S.-based
• Woolworths South Africa, already placing in Indonesia and on a par with M&S UK
• Cabela’s, North Dakota-based hunting brand
• Canterbury of New Zealand, Number 1 rugby brand

40 END-MARKET STUDY FOR INDONESIAN APPAREL PRODUCERS
• Is found somewhere between the top 50 and top 200 importers on a PIERS (Port Import Export Reporting Service) list.
Target rapidly expanding markets in developing countries. As detailed in Section IV above, Indonesian vendors should actively seek ways to establish and expand linkages to emerging markets to further increase sales growth. While still a relatively small percentage of market demand for apparel, sales in developing markets such as Russia and EU-accession countries have been growing exponentially. This topic is included on the list of suggested seminars for SENADA to facilitate.
Target high-growth product types and address losses in Indonesia’s relative market share. Each apparel product category is unique, having peculiarities throughout the merchandizing process. Further, each product category contains many subcategories, and each has different product development needs, buying channels, and technical specifications. Table 15 below shows the top 10 apparel imports into the U.S. market, plus four other high-growth product categories. Significantly, growth rates in the top five categories either decreased or were relatively stagnant from 2004–2005 to 2005–2006. Following that, the next five categories all show sharp increase in growth rates, as do the four other listed products (representing the U.S. market’s 16th, 20th, 23rd, and 24th largest apparel imports in 2005–2006). Clearly, the U.S. apparel market is diversifying, showing a move from non-knitted to knitted fabrics in most categories, as well as strong growth in smaller product categories, including babies’ garments, women’s or girls’ knitted suits, women’s underclothing, and men’s and boys’ knitted overcoats, among others.
TABLE 15: TOP 10 U.S. IMPORTS BY PRODUCT CATEGORY, ALONG WITH FOUR HIGH-GROWTH CATEGORIES
Rank HS Code Description Growth 2004–2005 Growth 2005–2006 1 6110 sweaters, pullovers (kn) 2.12% 3.47% 2 6204 women’s or girls’ suits (n-kn) 8.21% -0.62% 3 6203 men’s or boys’ suits (n-kn) 5.66% 2.19% 4 6109 t-shirts, singlets, tank tops (kn) 8.00% 7.91% 5 6205 men’s or boys’ shirts (n-kn) 5.93% -8.00% 6 6206 women’s or girls’ blouses (n-kn) -0.48% 5.65% 7 6108 women’s or girls’ slips (kn) 0.26% 8.12% 8 6104 women’s or girls’ suits (kn) 4.84% 16.52% 9 6105 men’s or boys’ shirts (kn) 13.89% 20.50% 10 6212 bras, girdles, garters etc. (n-kn) 1.40% 12.25% 16 6106 women’s or girls’ blouses (kn) 2.89% 12.70% 20 6102 women’s or girls’ overcoats (kn) 22.31% 7.13% 23 6101 men’s or boys’ overcoats (kn) 22.78% 23.38% 24 6209 babies’ garments (n-kn) 7.66% 10.32%
kn: knitted; n-kn: non-knitted Source: Global Trade Information Systems, Global Trade Atlas
It is important to note that almost 60 percent of the 14 apparel imports into the U.S. market listed above are in the top three product categories: sweaters, pullovers (knitted); women’s or girls suits (non-knitted); and men’s or boy’s suits (non-knitted). However, these three largest categories are not showing the highest growth rates: knitted sweaters and pullovers showed only minor growth, going from 2.08% in 2004–2005 to 3.35% in 2005–2006. Growth in women’s or girls’ non-knitted suits dropped sharply, from

END-MARKET STUDY FOR INDONESIAN APPAREL PRODUCERS 41
7.59% growth in 2004–2005 to negative growth of -0.63% in 2005–2006. And the growth rate for men’s or boys’ non-knitted suits dropped from 5.36% in 2004–2005 to 2.14% in 2005–2006.
TABLE 16: TOP 10 U.S. IMPORTS OF INDONESIAN GARMENTS BY PRODUCT CATEGORY
Rank HS Code Description Growth 04–2005 Growth 05–2006 1 6204 women’s or girls’ suits (n-kn) 22.97% 12.53% 2 6110 sweaters, pullovers (kn) 12.24% 76.56% 3 6203 men’s or boys’ suits (n-kn) 21.20% 34.25% 4 6206 women’s or girls’ blouses (n-kn) -2.86% 5.47% 5 6205 men’s or boys’ shirts (n-kn) 24.28% 0.82% 6 6212 bras, girdles, garters etc. (n-kn) 19.35% 17.23% 7 6104 women’s or girls’ suits (kn) 100.70% 96.47% 8 6105 men’s or boys’ shirts (kn) 134.06% 61.92% 9 6106 women’s or girls’ blouses (kn) 35.51% 137.00% 10 6108 women’s or girls’ slips (kn) 40.50% 14.17% 15 6109 t-shirts, singlets, tank tops (kn) 163.29% 65.45% 18 6102 women’s or girls’ overcoats (kn) 123.18% 59.04% 19 6101 men’s or boys’ overcoats (kn) 73.39% 69.62% 22 6209 babies’ garments (n-kn) -3.38% 6.09%
Source: Global Trade Information Systems, Global Trade Atlas
Table 16 above shows the top 10 product category imports for apparel products sourced from Indonesia, plus the four additional high-growth categories in the U.S. market. In comparing the total U.S. apparel market import rankings with Indonesia’s export rankings, eight of Indonesia’s top 10 exports to the United States are among the U.S. market’s top 10 imports, with the two other categories being notable exceptions:
• Indonesia is not capturing significant market share relative to the total U.S. apparel market in knitted t-shirts, singlets, and tank tops. This category is the United States’ fourth largest apparel import, but it ranks only 11th among Indonesia’s exports to the United States.
• The knitted women’s or girls’ blouses category is Indonesia’s ninth largest export to the U.S. market, but it ranks only 16th among total U.S. apparel imports, indicating that Indonesia is a lead supplier in this category.
As Indonesian vendors seek to capture greater market share in new product categories showing strong growth rates―for example, babies’ garments in the U.S. market―they will need to carefully research and understand the major issues, trends, and factors important to buyers for each category.
Improve inter-firm cooperation, customer service, and internal and external industry communications. To keep up with the pace of the global marketplace, Indonesian apparel vendors must improve their skills in communications and customer service, as well as their general marketing skills. This should include establishing and expanding a shared vendors’ portal on the internet to communicate with and meet the specific needs of buyers and buying agents. The portal would provide a comprehensive and integrated picture of sourcing options, factory production capacity, technology advances as they happen, new or expanded abilities to handle complex garments, and workforce technical skills, especially in the sample development process.

42 END-MARKET STUDY FOR INDONESIAN APPAREL PRODUCERS
Further, to ensure the sustainability of the sector in the post-MFA environment and after the quotas on China are ended, the Indonesian apparel industry must strengthen the learning mechanisms throughout the sector’s value chain to continuously improve design, quality, efficiency, and other factors critical to sustaining competitiveness. Indonesian vendors must collectively work to get information on factory production capacity and delivery options into the hands of buying agents. As one buyer noted (see box), to compete with neighboring countries, Indonesia needs to get itself on the map with buying agents in order to establish and expand its factory bases among a wider range of buyers.
Inter-firm cooperation should also be used to leverage creative financing mechanisms and other cost savings. Typically, purchasing fabric will tie up working capital for three to four months, and such expenditures can be three to five times greater than a typical apparel producer's monthly cash flow. To share risk and financing costs, Indonesian vendors could cooperate to combine offshore fabric sourcing orders, including sharing information and quality control resources. The shared internet portal could also be used to improve e-sourcing technology affecting the speed of costing. Stockpiling basic yarns or greige fabrics financed jointly could result in faster lead times where local capacity is lacking; such methods could also be used to pre-position blanks. Vendors could also possibly pool resources in training personnel in high-cost/high-return technical design and stitching to reduce costs while improving Indonesia’s image as regards its ability to provide technical services to buyers.
“Indonesia is definitely our number 2 option in Southeast Asia when we have the choice. Unfortunately, we have a limited factory base out of Indonesia, while almost all of our [buying] agents have factories in Vietnam and Cambodia.”
—Buyer for large, globally branded retailer

END-MARKET STUDY FOR INDONESIAN APPAREL PRODUCERS 43
VII. SUSTAINING COMPETITIVENESS In the apparel industry, Indonesia competes against many countries in the region. This end-market study has identified a number of product trends that represent opportunities for Indonesia apparel vendors to capitalize on Indonesia’s recognized strengths, and the recommendations above suggest ways both individual firms and the industry as a whole can become more competitive in the global marketplace. However, markets are dynamic. Trends change, current opportunities fade while new ones emerge, and the competitive landscape will inevitably shift. As markets and competitors evolve, firms and industries must respond in order to remain competitive. It is likely that the continued importance of labor standards will drive suppliers and their factories to increase investments to maintain any competitive advantage.
Continuously learning, adapting, innovating, and improving productivity—all are essential for sustaining competitiveness. The following recommendations seek to address the systemic constraints that undermine the ability of Indonesia’s apparel industry to effectively respond to market changes.
• Strengthen learning mechanisms. At present, new information about design, market opportunities, fashion trends, and customer requirements appears to enter the value chain primarily through buyers, buying agents, and copying rivals. However, to compete for new clients with countries like Vietnam, Bangladesh, and China, the Indonesian apparel industry must continuously develop its technical capacity to integrate information on trends and other market data into its product development and samples. Ultimately, a significant amount of apparel design will still be driven by buyers and international fashion designers, but Indonesia needs to show an ongoing internal capacity to innovate in order to capture the attention of the marketplace. Continuing to develop fabric management and sourcing expertise and technical design skills are essential to maintaining a competitive edge in this market, as is quick and competent customer service. In both cases, it is important for exporting firms to transfer this learning throughout their supply chains, from subcontractors to service providers to input suppliers. Without buy-in and regular upgrades from all actors, the industry as a whole will struggle to achieve and sustain competitiveness.
• Continuously improve fundamentals. An individual enterprise and industry can experience success with investments in upgrades, but sustained competitiveness requires a long-term commitment to improvements not only in design, but also in quality, delivery, pricing, accurate product samples, and customer service. Without a constant focus on these fundamentals, rivals will lure buyers away, as interviewees noted was often the case with Indonesian suppliers they had abandoned. Thus, it is important for the SMEs to make continuous improvements and provide regular training, including to subcontractors and to suppliers of fabric, yarn, thread, and trim (ideally as an embedded service to increase participation and buy-in). Upgrading by actors throughout a supply chain—essential to sustaining competitiveness—will depend largely on the incentives offered, such as increased orders and/or profit margins (or, as a negative incentive, loss of an end market).
A Commitment to Learning Is Vital
The most competitive industries are those that institutionalize learning mechanisms.
—USAID Briefing Paper, “A Value Chain Framework for Economic Growth That Reduces Poverty”

44 END-MARKET STUDY FOR INDONESIAN APPAREL PRODUCERS
• Strive for greater efficiency. While the ability to deliver high-quality complex garments and serve niche markets can reduce competition that is based largely on price, Indonesian companies must nonetheless work to improve efficiency to counter the cost advantages of sourcing product from other countries. Some improvements can occur within an individual firm or supply chain, such as technology upgrades that broaden the types of garments and fabrics that Indonesian suppliers can handle. Others, such as better transport logistics or bulk purchasing of inputs, involve horizontal cooperation between firms. Remaining competitive in the global marketplace requires an enduring commitment to increase overall productivity at all levels of a supply chain, including those that are shared across an industry.
• Increase inter-firm cooperation. Many companies in the sector are facing shared constraints and opportunities that are difficult to act upon individually—the cost of maintaining up-to-date trend information being only one of the constraints. By bringing apparel producers together to determine where collaboration and collective action will benefit everyone, as has apparently already happened on various levels in West Java, the entire industry will be better able to improve and sustain its competitiveness. Group purchasing to secure higher quality and lower cost inputs, lobbying efforts to effect change in regulations and improve access to long-term financing, establishing standards for sustainable production, and collective marketing are a few of the advantages greater cooperation can bring.
• Seek greater balance in vertical relationships. SENADA personnel and several Indonesian apparel suppliers provided helpful information on the relationships between some firms and export agencies (perceived, in this case, as a vertical relationship), as well as between those firms and their subcontractors, that appear to undermine the current and long-term competitiveness of the industry. Some subcontractors are hesitant to share information because of a history of firms using rival subcontractors to source needed inputs. This serves to stifle innovation at the subcontractor level.
Tensions can arise over the amounts and schedules of advance payments for inputs and production, flow of orders, and other issues. A comprehensive assessment of the vertical relationships within the sector would likely reveal a number of imbalances that might be addressed through greater transparency throughout the value chains, more options for agent services, and improved contractual agreements between exporting firms and subcontractors.
• Improve the enabling environment. A supportive enabling environment includes regulations, policies, and procedures that promote exports (such as a simple process for duty exemption and/or reimbursement on imported fabrics or trims) as well as the growth of micro, small, and medium-sized enterprise. Such an environment reinforces an industry’s long-term competitiveness. While it appears that some local governments in Indonesia are responsive to business needs, there are a number of national tax, customs, and financial sector policies that producers of apparel believe are impeding their businesses. In addition, there exist infrastructure deficiencies that significantly increase the cost of shipping from many regions, including delays at the port.
In Yogyakarta, business leaders have compiled a list of regulatory burdens they want changed, and are lobbying to create an inland port to reduce freight costs. Such group action is critical to improving the enabling environment, and should include disseminating information among (and seeking support from) not only apparel vendors, but firms in other affected industries as well. In some cases, it may also be possible to enlist the support of international buyers.

END-MARKET STUDY FOR INDONESIAN APPAREL PRODUCERS 45
• Target multiple markets. Focusing on a single end market significantly increases the impact of a sudden downturn in sales to that market. The industry should pursue opportunities in other markets that import large quantities of apparel, such as increasing its market share in Japan and Europe, as well as emerging economies that indicate potential, such Russia and countries that have recently acceded to the EU, including the Czech Republic, Poland, and Hungary. There may also be opportunities in markets that are underserved by Indonesia’s competitors. In a number of countries, the Indonesian government has established export offices that can provide data, support, and—as in the case of Hungary—exhibition space.
• Promote the industry. A long-term, strategic plan to promote Indonesia’s apparel industry will support other efforts to sustain its competitiveness. Buyers and their agents typically do not spend as much time researching as they do responding to inquiries, samples, and marketing. Ideally, firms can cooperate to exhibit samples and fund a promotional campaign that positions Indonesia in target markets, then continue to update and support that campaign over time. Industry branding, especially regarding labor standards, if adaptable to changes in the marketplace and supported by strong products, companies, and a healthy marketing budget, will be essential to reinventing the image of Indonesian apparel in the global marketplace and to positioning the industry for long-term growth.


END-MARKET STUDY FOR INDONESIAN APPAREL PRODUCERS 47
ANNEX A: SOURCES FOR INDUSTRY AND TREND INFORMATION
DATABASES AND REGISTERS FOR ORIGIN RULES: • Association of Southeast Asian Nations: www.aseansec.org
• Australia: Australian Customs Service: http://www.customs.gov.au/site/page.cfm?u=5337
• Brazil: http://www.braziltradenet.gov.br
• Canada: Canada Border Services Agency: “Introductory Guide to the Market Access Initiative for the Least Developed Country and the Least Developed Country Tariff”: http://www.cbsa-asfc.gc.ca/publications/pub/rc4322-eng.html
• Canada: Foreign Affairs and International Trade Canada: http://www.international.gc.ca
• China: Quota prices information: www.chinaquota.com
• European Union (EU): http://trade.ec.europa.eu
• Indonesia: Statistics Indonesia: http://www.bps.go.id/index.shtml
• Japan: Ministry of Foreign Affairs of Japan: http://www.mofa.go.jp/policy/economy/gsp/min_proc.html
• United Nations Conference on Trade and Development: Generalized Systems of Preferences Handbooks: http://www.unctad.org/Templates/webflyer.asp?docid=7192&intItemID=1426&lang=1
• United States: U.S. Department of Commerce, International Trade Administration, Office of Textiles and Apparel: www.otexa.ita.doc.gov
• United States: U.S. Department of Treasury: www.ustreas.gov
• United States: U.S. International Trade Commission: www.usitc.gov
• World Trade Organization: http://www.wto.org/english/res_e/statis_e/its2005_e/its05_bysector_e.htm
MARKET ANALYSES: • http://garment.fibre2fashion.com
• http://www.textileworldasia.com
• www.apparelsearch.com
• www.bizeurope.com

48 END-MARKET STUDY FOR INDONESIAN APPAREL PRODUCERS
• www.emergingtextiles.com
• www.just-style.com
• www.sweatshopwatch.org
• www.texindex.com
• www.textilesintelligence.com
INDONESIAN APPAREL INDUSTRY INFORMATION: • Argo Manunggal Textile: www.amt.co.id
• Indotextiles: The Indonesia Textiles and Apparel Community Reference: http://indotextiles.com
SOURCES OF BUYER INFORMATION: • American Apparel and Footwear Association: http://www.apparelandfootwear.org
• Austria: http://www.textilindustrie.at
• EU: http://www.euratex.org/
• General garments: www.garment.com
• Hong Kong: www.tdctrade.com
• International Textile and Apparel Association: http://www.itaaonline.org/
• New Zealand: http://www.indexnz.com/Top/Business-and-Economy/Industries/Apparel/1
• PIERS (Port Import Export Reporting Service): www.piers.com
• Singapore: http://www.taff.org.sg
• Sweden: http://www.textileimporters.se/swe/hem.php
• U.S. importers association: http://www.americanimporters.org

END-MARKET STUDY FOR INDONESIAN APPAREL PRODUCERS 49
ANNEX B: LIST OF BUYERS INTERVIEWED The majority of the interviewees that we spoke with required that their names or the names of their companies be kept confidential, given the sensitive nature of their comments and to protect their companies and suppliers. Over 400 buyers were contacted for this study, but either elected not to participate in the survey or did not respond.
The following companies have been interviewed and contributed with opinions and information to this study:
• Abercrombie & Fitch (two divisions)
• Asmarindo
• Dewhirst
• Hanesbrands/Indonesia
• Hanesbrands/United States
• J.Crew
• JCPenney
• Jones Apparel Group, Inc.
• Levi’s
• Li & Fung, Ltd.
• Linmark
• Liz Claiborne
• Nike
• PIERS (Port Import Export Reporting Service)
• Ralph Lauren
• Target
• Vanity Fair
• Wal-Mart