flow measurements in onkalo at olkiluoto probe holes, … · flow measurements in onkalo at...
TRANSCRIPT

P O S I V A O Y
O l k i l u o t o
F I -27160 EURAJOKI , F INLAND
Te l +358-2-8372 31
Fax +358-2-8372 3709
Janne Pekkanen
Juha Vä i säsvaara
January 2010
Work ing Repor t 2010 -02
Flow Measurements in ONKALO at OlkiluotoProbe Holes, ONK-PVA3 and ONK-PVA5
January 2010
Working Reports contain information on work in progress
or pending completion.
The conclusions and viewpoints presented in the report
are those of author(s) and do not necessarily
coincide with those of Posiva.
Janne Pekkanen
Juha Vä i säsvaara
PRG-Tec Oy
Work ing Report 2010 -02
Flow Measurements in ONKALO at OlkiluotoProbe Holes, ONK-PVA3 and ONK-PVA5
FLOW MEASUREMENTS IN ONKALO AT OLKILUOTO, PROBE HOLES, ONK-PVA3 AND ONK-PVA5
ABSTRACT
The Posiva Flow Log, Difference Flow Method (PFL DIFF) uses a flowmeter that
incorporates a flow guide and can be used for relatively quick determinations of
hydraulic conductivity and hydraulic head in fractures/fractured zones in cored
drillholes. This report presents the principles of the methods that were used as well as
the results of the measurements carried out during the excavation of the underground
access tunnel ONKALO at Olkiluoto.
Phase 1 and phase 2 of the probe hole measurements in the access tunnel started when
the tunnel was 15 m long and finished at the tunnel length of 2917 m. The results of
phases 1 and 2 are presented in reports 2006-65 (Phase 1) /Reiman, M., Väisäsvaara, J
& Pöllänen, J. 2006/ and 2008-37 (Phase 2) /Pekkanen, J., 2008/. Probe hole
measurements were continued normally in phase 3. The phase 3 results are presented in
this report. Flow measurements started again on May 5, 2008 when tunnel length was
3009 m and ended on December 16, 2008, tunnel length 3288 m. Probe hole
measurements will continue normally below 3288 m.
In addition to normal probe holes, core-drilled drillholes were also measured in
ONKALO. The drillholes discussed in this report are ONK-PVA3 and ONK-PVA5.
ONK-PVA5 was measured on November 16, 2008 and ONK-PVA3 on January 29,
2009.
The PFL DIFF probe was used to detect flow within single fractures in the drillhole or
probe hole. The method utilizes rubber disks to isolate the flow in a test section from
that in the rest of the probe hole or to measure the flow along the probe hole. Probe
holes from ONK-TR3009 to ONK-TR3121 were measured using a 0.5 m section length
(the distance isolated with the rubber disks) with a 0.1 m point interval. The flow along
the probe hole was measured in ONK-TR3140 and subsequent probe holes.
The device used includes a sensor for single point resistance (SPR). SPR was measured
in connection with flow measurements. The flow measurement and the single point
resistance measurement were used to locate flowing fractures and evaluate their
transmissivity.
Electrical conductivity (EC) and temperature of water were registered during automatic
flow logging. The conductivity values are temperature corrected to 25 C.
Keywords: Groundwater, flow, measurement, bedrock, probe hole, drillhole, electrical
conductivity, Posiva Flow Log, flow logging.
VIRTAUSMITTAUKSET ONKALOSSA OLKILUODON ALUEELLA, TUNNUSTELUREIÄT, ONK-PVA3 JA ONK-PVA5
TIIVISTELMÄ Posiva Flow Log virtauseromittausmenetelmää (PFL DIFF) voidaan käyttää suhteel-
lisen nopeaan vedenjohtavuuksien ja virtauspaineiden määrittämiseen raoista tai rako-
vyöhykkeistä kairanrei’issä. Menetelmässä käytetään virtausanturia, johon mitattavan
syvyysvälin virtaus johdetaan virtausohjaimella. Tässä raportissa esitetään mittauksen
periaatteet ja tulokset mittauksista, jotka tehtiin tunnustelurei’istä ONKALOn
ajotunnelin louhinnan aikana.
Tunnustelureikien mittaukset aloitettiin tunneliurakka 1:n osalta paaluluvulta 15, ja
päätettiin tunneliurakka 2:n osalta paalulukuun 2917. Tunneliurakoiden 1 ja 2 aikana
tehdyt mittaukset on esitetty raporteissa 2006-65 (Tunneliurakka 1) /Reiman, M.,
Väisäsvaara, J & Pöllänen, J. 2006/ ja 2008-37 (Tunneliurakka 2) /Pekkanen, J., 2008/.
Tunnustelureikien mittaukset jatkuivat normaalisti myös tunneliurakka 3:ssa, jonka
mittaukset on esitetty tässä raportissa. Tämän raportin mittaukset alkoivat 5.5.2008
tunnelin pituuden ollessa 3009 m ja päättyivät 16.12.2008 tunnelin pituuden ollessa
3288 m. Tunnustelureikien mittaukset jatkuvat normaalisti 3288 m:stä eteenpäin.
Tunnustelureikien lisäksi ONKALOssa mitattiin myös muita kaira- tai porareikiä. Tässä
raportissa on esitetty mittaukset kairarei’iltä ONK-PVA3 ja ONK-PVA5. ONK-PVA5
mitattiin 16.11.2008 ja ONK-PVA3 29.1.2009
PFL DIFF mittauskalustolla paikallistetaan virtaukset yksittäisistä raoista kaira- tai
tunnustelurei’issä. Menetelmässä hyödynnetään kumikiekkoja joilla rakovirtaus rajataan
muusta reiästä testisektoriin. Vaihtoehtoisesti voidaan mitata reiän suuntaista virtausta.
Tunnustelureiät välillä ONK-TR3009 – ONK-TR3121 mitattiin 0.5 m sektorilla (sekto-
rin pituus joka on erotettu muusta reiästä kumikiekoilla), 0.1 m:n välein. Reiän
suuntaista virtausta mitattiin tunnustelureiästä ONK-TR3140 alkaen.
Mittauskalustossa on myös elektrodi yksipistemaadoitusvastus-mittaukseen (SPR). SPR
mitattiin aina virtausmittausten yhteydessä. Virtausmittausta ja maadoitusvastusmit-
tausta käytettiin vettä johtavien rakojen paikallistamiseen ja näiden transmissiviteetin
määrittämiseen.
Reikäveden sähkönjohtavuutta (EC) ja lämpötilaa mitattiin virtausmittausten yhtey-
dessä. Sähkönjohtavuus arvot korjattiin vastaamaan 25 C:n lämpötilan arvoja.
Avainsanat: Pohjavesi, virtaus, mittaus, peruskallio, tunnustelureikä, kairanreikä,
sähkönjohtavuus, Posiva Flow Log, virtausmittaus.

1
TABLE OF CONTENTS
1 INTRODUCTION ................................................................................................. 5
2 PRINCIPLES OF MEASUREMENT AND INTERPRETATION ............................. 9
2.1 Measurements ............................................................................................ 9
2.2 Interpretation ............................................................................................ 13
3 EQUIPMENT SPECIFICATIONS ....................................................................... 17
4 DESCRIPTION OF THE DATA SET .................................................................. 19
4.1 Field work ................................................................................................. 19
4.2 Results ..................................................................................................... 20
4.2.1 General comments
4.2.2 Transmissivity and hydraulic aperture of fractures during flow
logging
4.2.3 Electrical conductivity and temperature of probe hole water
4.3 Results of the individual probe- and drillholes ........................................... 23
4.3.1 ONK-TR3009, 5.5.2008 – 6.5.2008
4.3.2 ONK-TR3020, 19.5.2008
4.3.3 ONK-TR3040, 20.5.2008 – 21.5.2008
4.3.4 ONK-TR3116, 8.8.2008 – 9.8.2008
4.3.5 ONK-TR3121, 20.8.2008 – 21.8.2008
4.3.6 ONK-TR3140, 4.9.2008 – 5.9.2008
4.3.7 ONK-TR3145, 12.9.2008
4.3.8 ONK-TR3170, 14.10.2008
4.3.9 ONK-PVA5, 16.11.2008
4.3.10 ONK-TR3263, 25.11.2008
4.3.11 ONK-TR3273, 3.12.2008
4.3.12 ONK-TR3288, 16.12.2008
4.3.13 ONK-PVA3, 29.1.2009
5 SUMMARY AND DISCUSSION ......................................................................... 39
REFERENCES ........................................................................................................... 41

2
3
Appendix 1.1 Probe hole ONK-TR3009B, Flow rate and single point resistance
Appendix 1.2 Probe hole ONK-TR3009B, Transmissivity and hydraulic aperture of detected fractures
Appendix 1.3 Probe hole ONK-TR3009B, Tabulated results of detected fractures
Appendix 1.4 Probe hole ONK-TR3009B, Electrical conductivity of probe hole water
Appendix 1.5 Probe hole ONK-TR3009B, Temperature of probe hole water
Appendix 2.1 Probe hole ONK-TR3020A, Flow rate and single point resistance
Appendix 2.2 Probe hole ONK-TR3020A, Electrical conductivity of probe hole water
Appendix 2.3 Probe hole ONK-TR3020A, Temperature of probe hole water
Appendix 3.1 Probe hole ONK-TR3116B, Flow rate and single point resistance
Appendix 3.2 Probe hole ONK-TR3116B, Transmissivity and hydraulic aperture of detected fractures
Appendix 3.3 Probe hole ONK-TR3116B, Electrical conductivity of probe hole water
Appendix 3.4 Probe hole ONK-TR3116B, Temperature of probe hole water
Appendix 3.5 Probe hole ONK-TR3116C, Flow rate and single point resistance
Appendix 3.6 Probe hole ONK-TR3116C, Transmissivity and hydraulic aperture of detected fractures
Appendix 3.7 Probe hole ONK-TR3116C, Electrical conductivity of probe hole water
Appendix 3.8 Probe hole ONK-TR3116C, Temperature of probe hole water
Appendix 3.9 Probe hole ONK-TR3116D, Flow rate and single point resistance
Appendix 3.10 Probe hole ONK-TR3116D, Electrical conductivity of probe hole water
Appendix 3.11 Probe hole ONK-TR3116D, Temperature of probe hole water
Appendix 3.12 Probe holes ONK-TR3116B and ONK-TR3116C, Tabulated results of detected fractures
Appendix 4.1 Probe hole ONK-TR3121A, Flow rate and single point resistance
Appendix 4.2 Probe hole ONK-TR3121A, Electrical conductivity of probe hole water
Appendix 4.3 Probe hole ONK-TR3121A, Temperature of probe hole water
Appendix 4.4 Probe hole ONK-TR3121B, Flow rate and single point resistance
Appendix 4.5 Probe hole ONK-TR3121B, Transmissivity and hydraulic aperture of detected fractures
Appendix 4.6 Probe hole ONK-TR3121B, Electrical conductivity of probe hole water
Appendix 4.7 Probe hole ONK-TR3121B, Temperature of probe hole water
Appendix 4.8 Probe hole ONK-TR3121C, Flow rate and single point resistance
Appendix 4.9 Probe hole ONK-TR3121C, Transmissivity and hydraulic aperture of
detected fractures
Appendix 4.10 Probe hole ONK-TR3121C, Electrical conductivity of probe hole water
Appendix 4.11 Probe hole ONK-TR3121C, Temperature of probe hole water
Appendix 4.12 Probe hole ONK-TR3121D, Flow rate and single point resistance
Appendix 4.13 Probe hole ONK-TR3121D, Transmissivity and hydraulic aperture of detected fractures
Appendix 4.14 Probe hole ONK-TR3121D, Electrical conductivity of probe hole water
Appendix 4.15 Probe hole ONK-TR3121D, Temperature of probe hole water
Appendix 4.16 Probe holes ONK-TR3121B, ONK-TR3121C and ONK-TR3121D, Tabulated results of detected fractures
Appendix 5.1 Probe hole ONK-TR3140A, Flow rate and single point resistance
Appendix 5.2 Probe hole ONK-TR3140A, Transmissivity and hydraulic aperture of
detected fractures
Appendix 5.3 Probe hole ONK-TR3140A, Electrical conductivity of probe hole water
Appendix 5.4 Probe hole ONK-TR3140A, Temperature of probe hole water
Appendix 5.5 Probe hole ONK-TR3140C, Flow rate and single point resistance
4
Appendix 5.6 Probe hole ONK-TR3140C, Electrical conductivity of probe hole water
Appendix 5.7 Probe hole ONK-TR3140C, Temperature of probe hole water
Appendix 5.8 Probe hole ONK-TR3140D, Flow rate and single point resistance
Appendix 5.9 Probe hole ONK-TR3140D, Transmissivity and hydraulic aperture of
detected fractures
Appendix 5.10 Probe hole ONK-TR3140D, Electrical conductivity of probe hole water
Appendix 5.11 Probe hole ONK-TR3140D, Temperature of probe hole water
Appendix 5.12 Probe holes ONK-TR3140A and ONK-TR3140D, Tabulated results of detected fractures
Appendix 6.1 Probe hole ONK-TR3145C, Flow rate and single point resistance
Appendix 6.2 Probe hole ONK-TR3145C, Electrical conductivity of probe hole water
Appendix 6.3 Probe hole ONK-TR3145C, Temperature of probe hole water
Appendices 7.1 – 7.2
Drillhole ONK-PVA5, Flow rate and single point resistance
Appendix 7.3 Drillhole ONK-PVA5, Transmissivity and hydraulic aperture of detected
fractures
Appendix 7.4 Drillhole ONK-PVA5, Tabulated results of detected fractures
Appendix 7.5 Drillhole ONK-PVA5, Electrical conductivity of drillhole water
Appendix 7.6 Drillhole ONK-PVA5, Temperature of drillhole water
Appendix 8.1 Probe hole ONK-TR3263D, Flow rate and single point resistance
Appendix 8.2 Probe hole ONK-TR3263D, Transmissivity and hydraulic aperture of
detected fractures
Appendix 8.3 Probe hole ONK-TR3263D, Tabulated results of detected fractures
Appendix 8.4 Probe hole ONK-TR3263D, Electrical conductivity of probe hole water
Appendix 8.5 Probe hole ONK-TR3263D, Temperature of probe hole water
Appendix 9.1 Probe hole ONK-TR3288A, Flow rate and single point resistance
Appendix 9.2 Probe hole ONK-TR3288A, Transmissivity and hydraulic aperture of
detected fractures
Appendix 9.3 Probe hole ONK-TR3288A, Tabulated results of detected fractures
Appendix 9.4 Probe hole ONK-TR3288A, Electrical conductivity of probe hole water
Appendix 9.5 Probe hole ONK-TR3288A, Temperature of probe hole water
Appendix 10.1 Drillhole ONK-PVA3, Flow rate and single point resistance
Appendix 10.2 Drillhole ONK-PVA3, Transmissivity and hydraulic aperture of detected
fractures
Appendix 10.3 Drillhole ONK-PVA3, Tabulated results of detected fractures
Appendix 10.4 Drillhole ONK-PVA3, Electrical conductivity of drillhole water
Appendix 10.5 Drillhole ONK-PVA3, Temperature of drillhole water
5
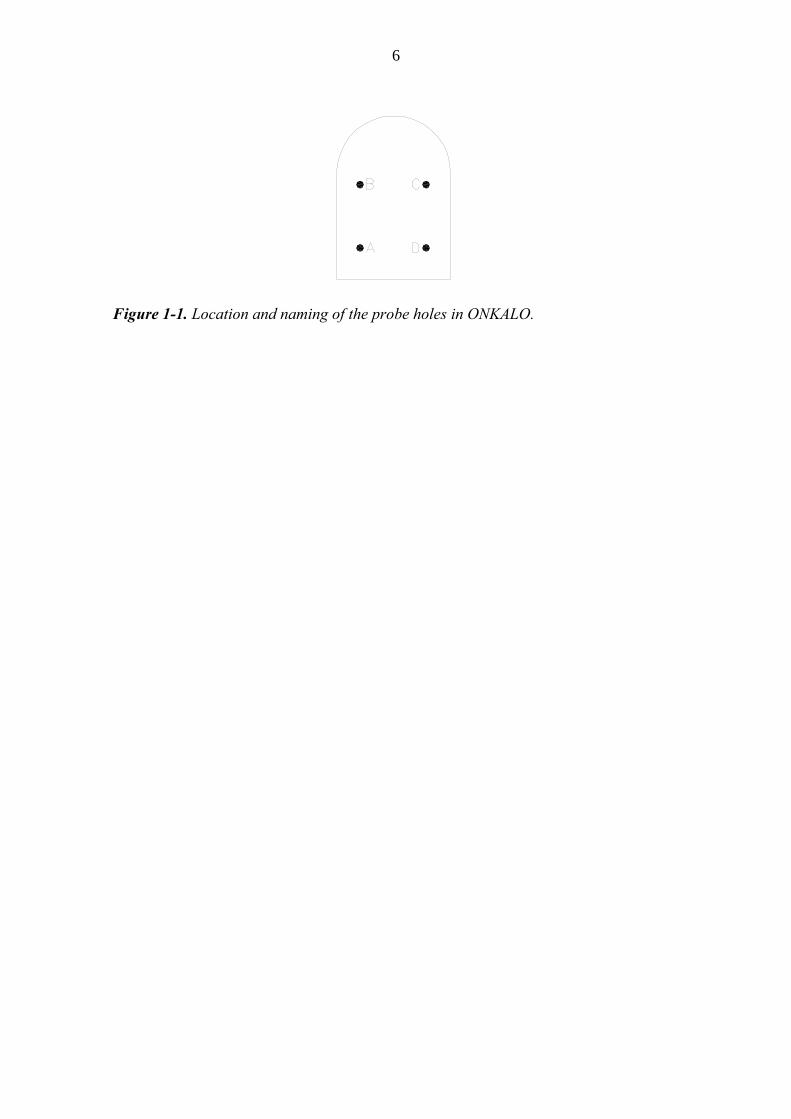
The construction of Posiva’s underground facility, ONKALO, has progressed to a state
where the length of the underground access tunnel is over 3300 m. The location of
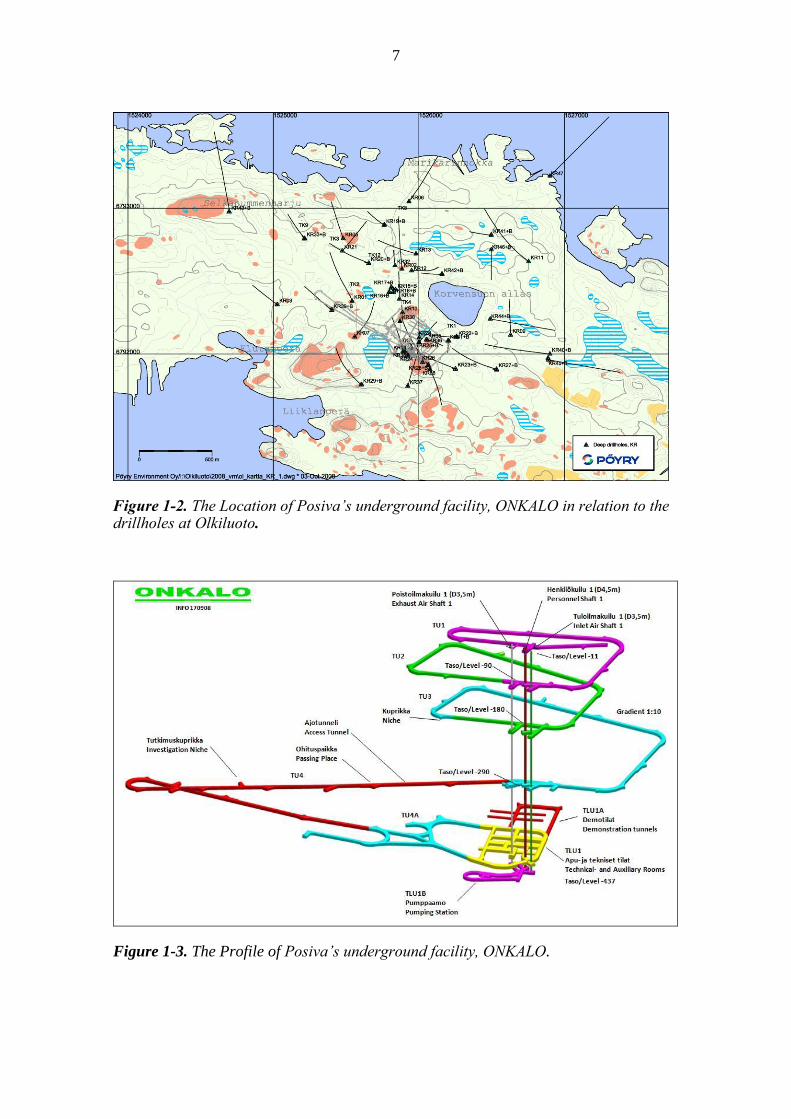
ONKALO at Olkiluoto is presented in Figure 1-2. The profile of ONKALO is presented
in Figure 1-3. During the excavation ca. 20 m – 29 m long probe holes were drilled
before the next blasting rounds were exploded. These probe holes were measured by the
Posiva Flow Log, Difference flow method (PFL DIFF). The PFL DIFF probe has been
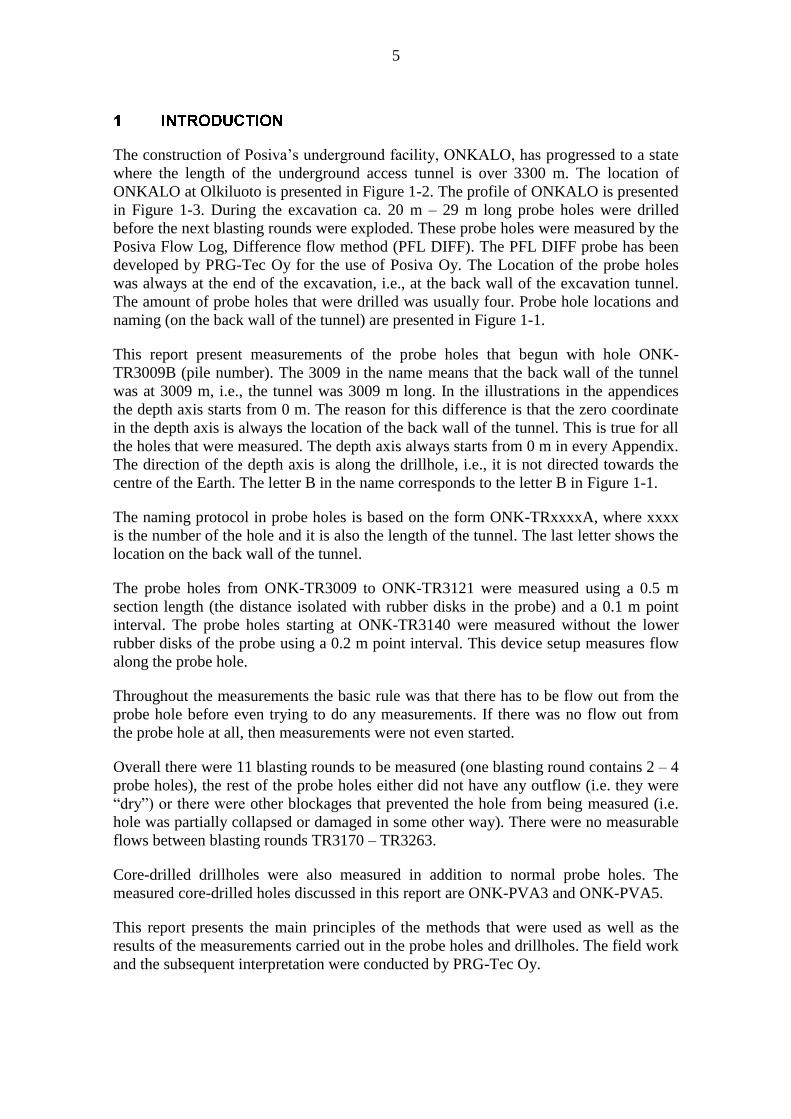
developed by PRG-Tec Oy for the use of Posiva Oy. The Location of the probe holes
was always at the end of the excavation, i.e., at the back wall of the excavation tunnel.
The amount of probe holes that were drilled was usually four. Probe hole locations and
naming (on the back wall of the tunnel) are presented in Figure 1-1.
This report present measurements of the probe holes that begun with hole ONK-
TR3009B (pile number). The 3009 in the name means that the back wall of the tunnel
was at 3009 m, i.e., the tunnel was 3009 m long. In the illustrations in the appendices
the depth axis starts from 0 m. The reason for this difference is that the zero coordinate
in the depth axis is always the location of the back wall of the tunnel. This is true for all
the holes that were measured. The depth axis always starts from 0 m in every Appendix.
The direction of the depth axis is along the drillhole, i.e., it is not directed towards the
centre of the Earth. The letter B in the name corresponds to the letter B in Figure 1-1.
The naming protocol in probe holes is based on the form ONK-TRxxxxA, where xxxx
is the number of the hole and it is also the length of the tunnel. The last letter shows the
location on the back wall of the tunnel.
The probe holes from ONK-TR3009 to ONK-TR3121 were measured using a 0.5 m
section length (the distance isolated with rubber disks in the probe) and a 0.1 m point
interval. The probe holes starting at ONK-TR3140 were measured without the lower
rubber disks of the probe using a 0.2 m point interval. This device setup measures flow
along the probe hole.
Throughout the measurements the basic rule was that there has to be flow out from the
probe hole before even trying to do any measurements. If there was no flow out from
the probe hole at all, then measurements were not even started.
Overall there were 11 blasting rounds to be measured (one blasting round contains 2 – 4
probe holes), the rest of the probe holes either did not have any outflow (i.e. they were
“dry”) or there were other blockages that prevented the hole from being measured (i.e.
hole was partially collapsed or damaged in some other way). There were no measurable
flows between blasting rounds TR3170 – TR3263.
Core-drilled drillholes were also measured in addition to normal probe holes. The
measured core-drilled holes discussed in this report are ONK-PVA3 and ONK-PVA5.
This report presents the main principles of the methods that were used as well as the
results of the measurements carried out in the probe holes and drillholes. The field work
and the subsequent interpretation were conducted by PRG-Tec Oy.
6
Figure 1-1. Location and naming of the probe holes in ONKALO.
7
Figure 1-2. The Location of Posiva’s underground facility, ONKALO in relation to the drillholes at Olkiluoto.
Figure 1-3. The Profile of Posiva’s underground facility, ONKALO.

8
9
2 PRINCIPLES OF MEASUREMENT AND INTERPRETATION
2.1 Measurements
Unlike conventional drillhole flowmeters which measure the total cumulative flow rate
along a drillhole, the PFL DIFF probe measures the flow rate into or out of defined
drillhole sections. The advantage that follows from measuring the flow rate in isolated
sections is improved detection of incremental changes of flow along the drillhole. As
these are generally very small, they can easily be missed when using conventional
flowmeters.
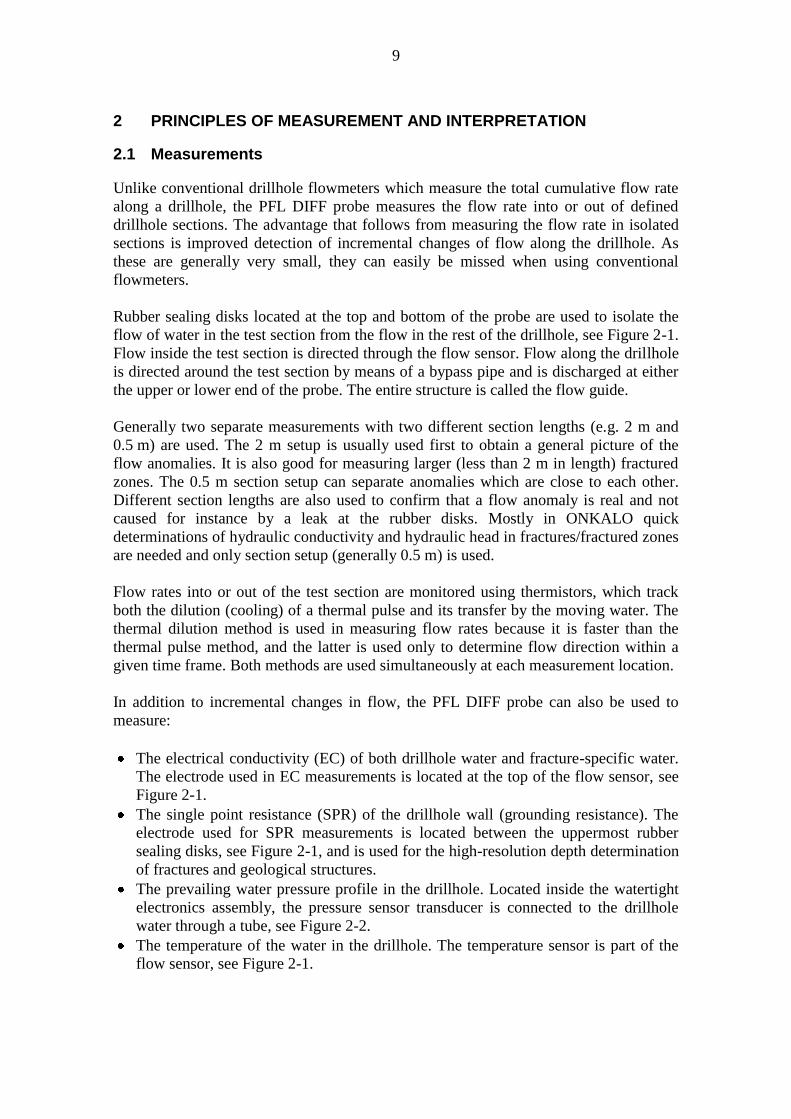
Rubber sealing disks located at the top and bottom of the probe are used to isolate the
flow of water in the test section from the flow in the rest of the drillhole, see Figure 2-1.
Flow inside the test section is directed through the flow sensor. Flow along the drillhole
is directed around the test section by means of a bypass pipe and is discharged at either
the upper or lower end of the probe. The entire structure is called the flow guide.
Generally two separate measurements with two different section lengths (e.g. 2 m and
0.5 m) are used. The 2 m setup is usually used first to obtain a general picture of the
flow anomalies. It is also good for measuring larger (less than 2 m in length) fractured
zones. The 0.5 m section setup can separate anomalies which are close to each other.
Different section lengths are also used to confirm that a flow anomaly is real and not
caused for instance by a leak at the rubber disks. Mostly in ONKALO quick
determinations of hydraulic conductivity and hydraulic head in fractures/fractured zones
are needed and only section setup (generally 0.5 m) is used.
Flow rates into or out of the test section are monitored using thermistors, which track
both the dilution (cooling) of a thermal pulse and its transfer by the moving water. The
thermal dilution method is used in measuring flow rates because it is faster than the
thermal pulse method, and the latter is used only to determine flow direction within a
given time frame. Both methods are used simultaneously at each measurement location.
In addition to incremental changes in flow, the PFL DIFF probe can also be used to
measure:
The electrical conductivity (EC) of both drillhole water and fracture-specific water.
The electrode used in EC measurements is located at the top of the flow sensor, see
Figure 2-1.
The single point resistance (SPR) of the drillhole wall (grounding resistance). The
electrode used for SPR measurements is located between the uppermost rubber
sealing disks, see Figure 2-1, and is used for the high-resolution depth determination
of fractures and geological structures.
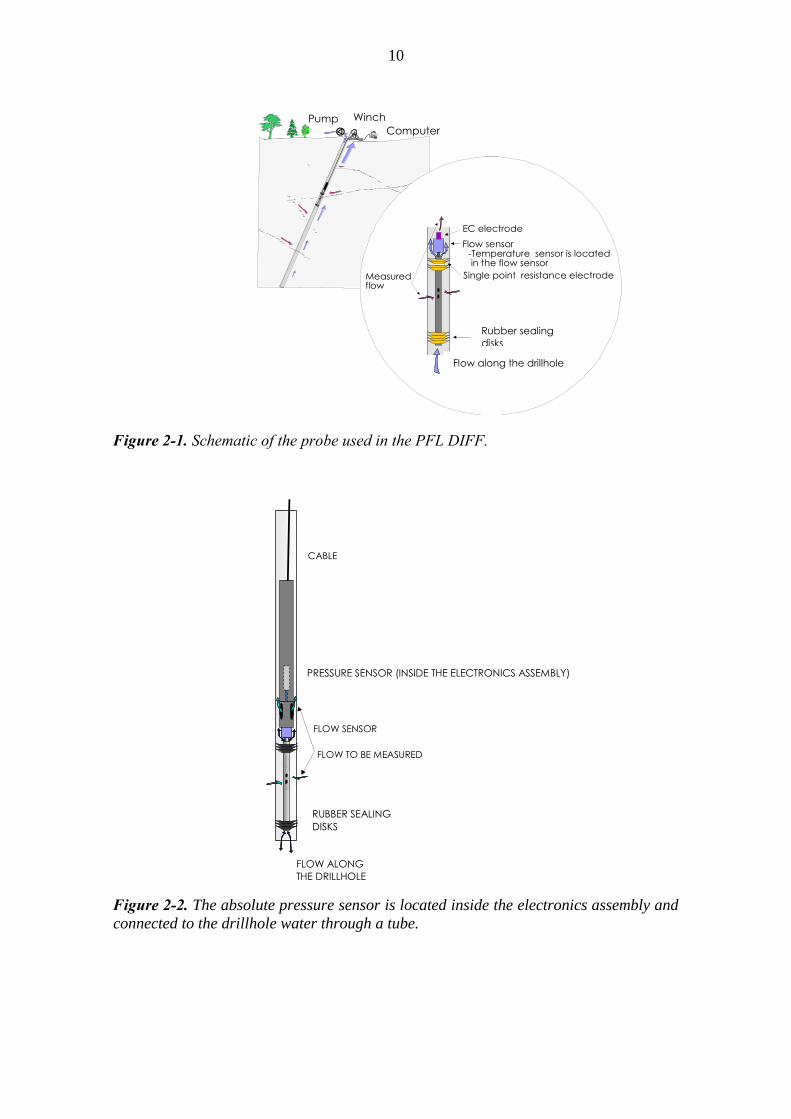
The prevailing water pressure profile in the drillhole. Located inside the watertight
electronics assembly, the pressure sensor transducer is connected to the drillhole
water through a tube, see Figure 2-2.
The temperature of the water in the drillhole. The temperature sensor is part of the
flow sensor, see Figure 2-1.
10
WinchPumpComputer
Flow along the borehole
Rubberdisks
Flow sensor-Temperature sensor is located in the flow sensor
Single point resistance electrode
EC electrode
Measured flow
Figure 2-1. Schematic of the probe used in the PFL DIFF.
FLOW TO BE MEASURED
FLOW ALONG THE BOREHOLE
RUBBERDISKS
FLOW SENSOR
PRESSURE SENSOR (INSIDE THE ELECTRONICSTUBE)
CABLE
Figure 2-2. The absolute pressure sensor is located inside the electronics assembly and
connected to the drillhole water through a tube.
Flow along the drillhole
PRESSURE SENSOR (INSIDE THE ELECTRONICS ASSEMBLY)
FLOW ALONG
THE DRILLHOLE
RUBBER SEALING
DISKS
Rubber sealing
disks
11
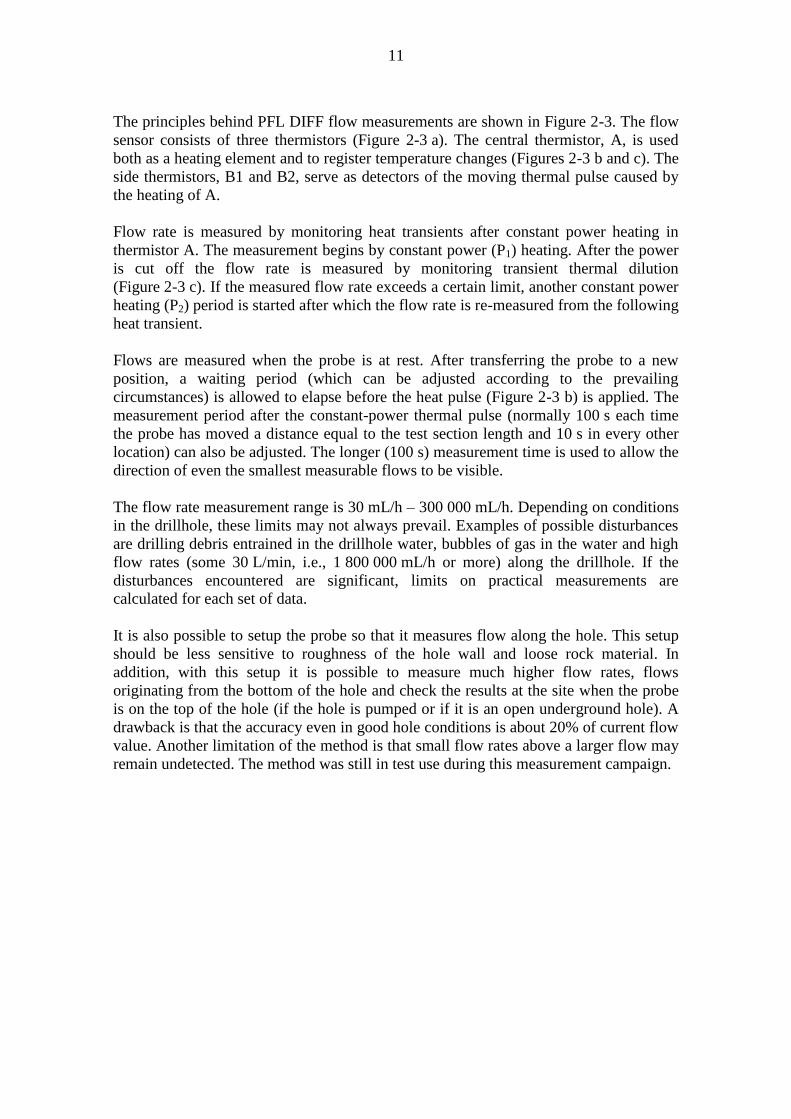
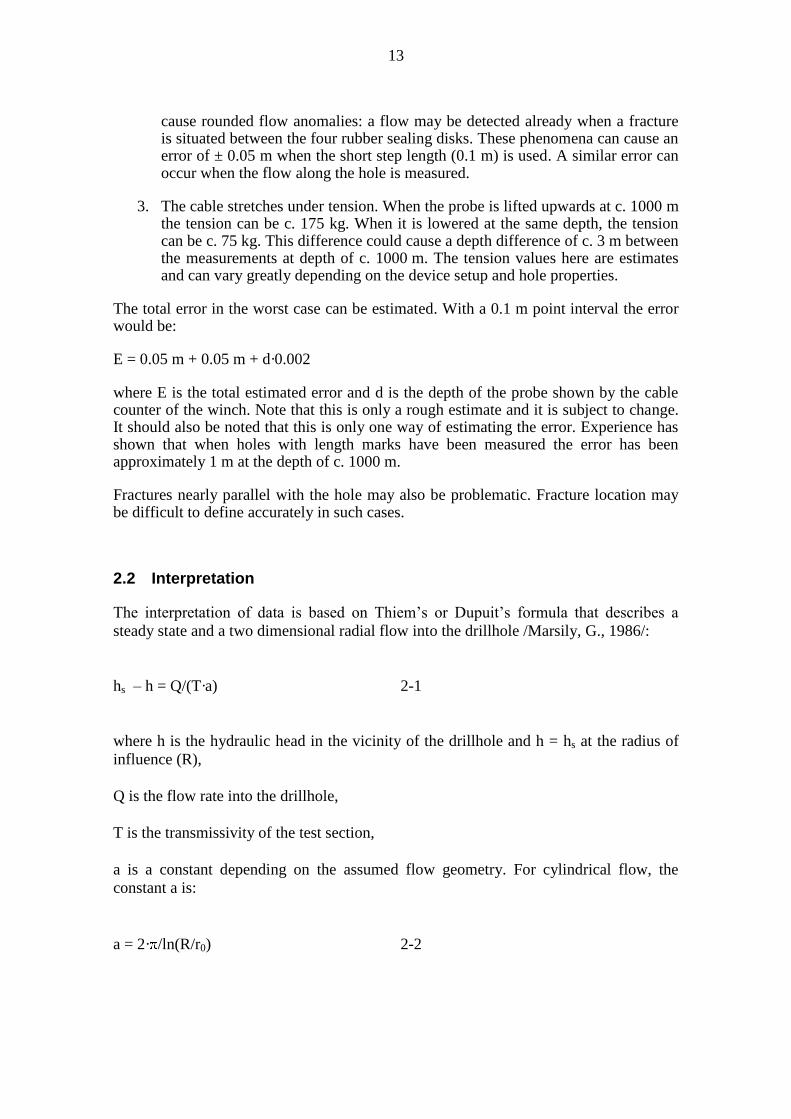
The principles behind PFL DIFF flow measurements are shown in Figure 2-3. The flow
sensor consists of three thermistors (Figure 2-3 a). The central thermistor, A, is used
both as a heating element and to register temperature changes (Figures 2-3 b and c). The
side thermistors, B1 and B2, serve as detectors of the moving thermal pulse caused by
the heating of A.
Flow rate is measured by monitoring heat transients after constant power heating in
thermistor A. The measurement begins by constant power (P1) heating. After the power
is cut off the flow rate is measured by monitoring transient thermal dilution
(Figure 2-3 c). If the measured flow rate exceeds a certain limit, another constant power
heating (P2) period is started after which the flow rate is re-measured from the following
heat transient.
Flows are measured when the probe is at rest. After transferring the probe to a new
position, a waiting period (which can be adjusted according to the prevailing
circumstances) is allowed to elapse before the heat pulse (Figure 2-3 b) is applied. The
measurement period after the constant-power thermal pulse (normally 100 s each time
the probe has moved a distance equal to the test section length and 10 s in every other
location) can also be adjusted. The longer (100 s) measurement time is used to allow the
direction of even the smallest measurable flows to be visible.
The flow rate measurement range is 30 mL/h – 300 000 mL/h. Depending on conditions
in the drillhole, these limits may not always prevail. Examples of possible disturbances
are drilling debris entrained in the drillhole water, bubbles of gas in the water and high
flow rates (some 30 L/min, i.e., 1 800 000 mL/h or more) along the drillhole. If the
disturbances encountered are significant, limits on practical measurements are
calculated for each set of data.
It is also possible to setup the probe so that it measures flow along the hole. This setup
should be less sensitive to roughness of the hole wall and loose rock material. In
addition, with this setup it is possible to measure much higher flow rates, flows
originating from the bottom of the hole and check the results at the site when the probe
is on the top of the hole (if the hole is pumped or if it is an open underground hole). A
drawback is that the accuracy even in good hole conditions is about 20% of current flow
value. Another limitation of the method is that small flow rates above a larger flow may
remain undetected. The method was still in test use during this measurement campaign.

12
-5 0 5 10 15
0
50
100
150
200
Po
we
r (m
W)
AB1 B2
Flow sensor
Constant power in A
-5 0 5 10 15Time (s)
0
10
20
30
40
dT
(C)
Flow rate (mL/h)
1020
3060
6090
13300
27700
57200
135000
297000
Thermal dilution method
Temperature change in A
P1
P2
a)
b)
c)
Figure 2-3. Flow rate measurement.
The device depth reference point in the PFL DIFF is situated at the upper end of the test
section. When assessing the location of anomalies in the measured hole there are always
some errors. They can be caused by the following reasons:
1. If the point interval is x, an error of ± x/2 can potentially occur.
2. The length of the test section is not exact. The specified section length denotes the distance between the nearest upper and lower rubber sealing disks. Effectively, the section length can be larger. At both ends of the test section there are four rubber sealing disks. The distance between them is 5 cm. This will
13
cause rounded flow anomalies: a flow may be detected already when a fracture is situated between the four rubber sealing disks. These phenomena can cause an error of ± 0.05 m when the short step length (0.1 m) is used. A similar error can occur when the flow along the hole is measured.
3. The cable stretches under tension. When the probe is lifted upwards at c. 1000 m the tension can be c. 175 kg. When it is lowered at the same depth, the tension can be c. 75 kg. This difference could cause a depth difference of c. 3 m between the measurements at depth of c. 1000 m. The tension values here are estimates and can vary greatly depending on the device setup and hole properties.
The total error in the worst case can be estimated. With a 0.1 m point interval the error would be:
E = 0.05 m + 0.05 m + d·0.002
where E is the total estimated error and d is the depth of the probe shown by the cable counter of the winch. Note that this is only a rough estimate and it is subject to change. It should also be noted that this is only one way of estimating the error. Experience has shown that when holes with length marks have been measured the error has been approximately 1 m at the depth of c. 1000 m.
Fractures nearly parallel with the hole may also be problematic. Fracture location may be difficult to define accurately in such cases.
2.2 Interpretation
The interpretation of data is based on Thiem’s or Dupuit’s formula that describes a
steady state and a two dimensional radial flow into the drillhole /Marsily, G., 1986/:
hs – h = Q/(T·a) 2-1
where h is the hydraulic head in the vicinity of the drillhole and h = hs at the radius of
influence (R),
Q is the flow rate into the drillhole,
T is the transmissivity of the test section,
a is a constant depending on the assumed flow geometry. For cylindrical flow, the
constant a is:
a = 2· /ln(R/r0) 2-2
14
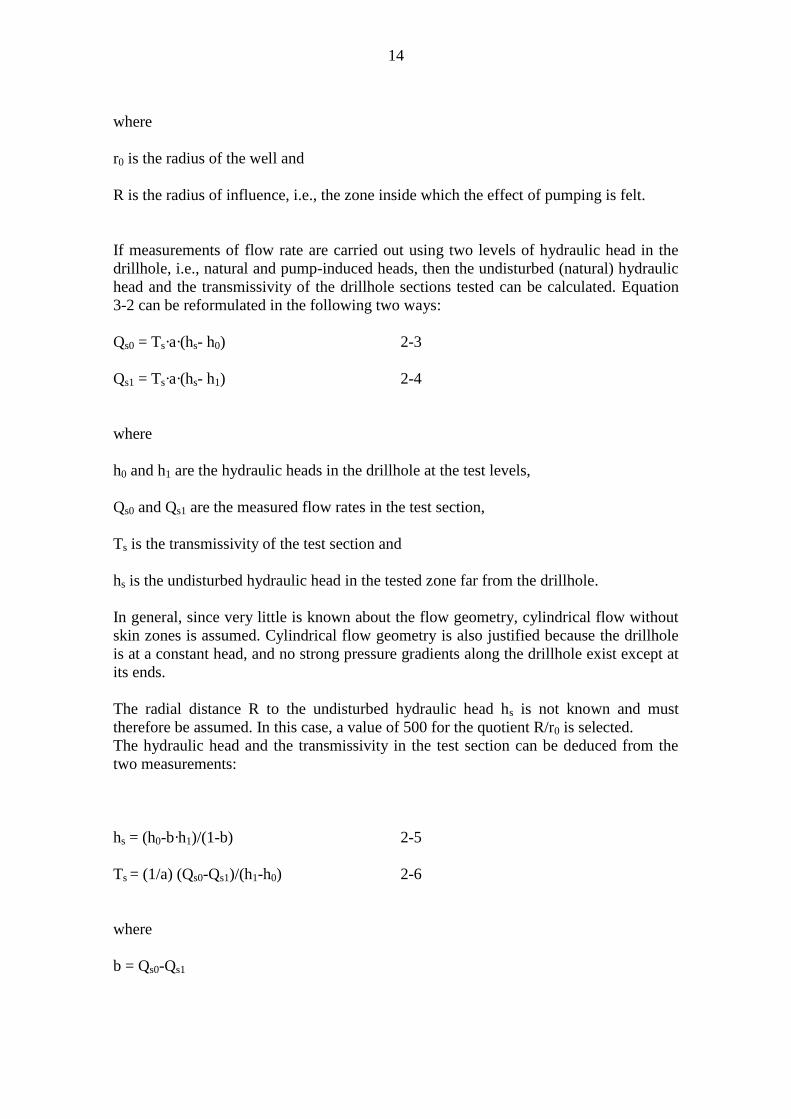
where
r0 is the radius of the well and
R is the radius of influence, i.e., the zone inside which the effect of pumping is felt.
If measurements of flow rate are carried out using two levels of hydraulic head in the
drillhole, i.e., natural and pump-induced heads, then the undisturbed (natural) hydraulic
head and the transmissivity of the drillhole sections tested can be calculated. Equation
3-2 can be reformulated in the following two ways:
Qs0 = Ts·a·(hs- h0) 2-3
Qs1 = Ts·a·(hs- h1) 2-4
where
h0 and h1 are the hydraulic heads in the drillhole at the test levels,
Qs0 and Qs1 are the measured flow rates in the test section,
Ts is the transmissivity of the test section and
hs is the undisturbed hydraulic head in the tested zone far from the drillhole.
In general, since very little is known about the flow geometry, cylindrical flow without
skin zones is assumed. Cylindrical flow geometry is also justified because the drillhole
is at a constant head, and no strong pressure gradients along the drillhole exist except at
its ends.
The radial distance R to the undisturbed hydraulic head hs is not known and must
therefore be assumed. In this case, a value of 500 for the quotient R/r0 is selected.
The hydraulic head and the transmissivity in the test section can be deduced from the
two measurements:
hs = (h0-b·h1)/(1-b) 2-5
Ts = (1/a) (Qs0-Qs1)/(h1-h0) 2-6
where
b = Qs0-Qs1
15
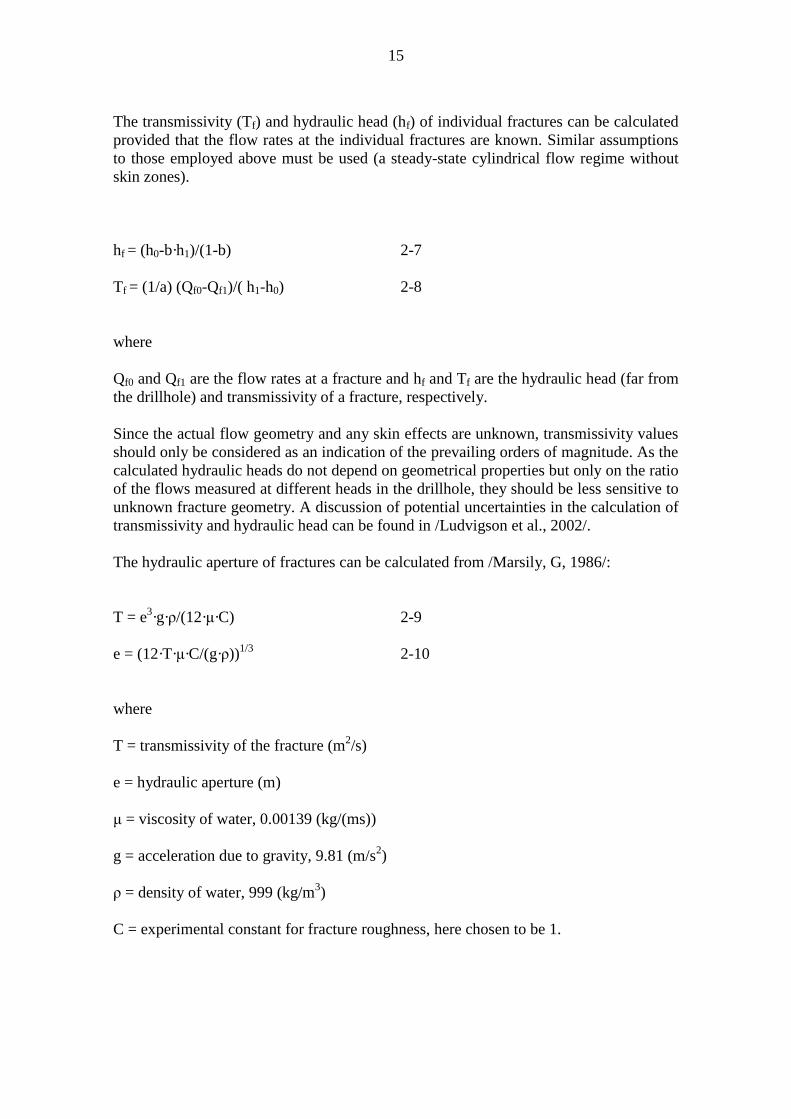
The transmissivity (Tf) and hydraulic head (hf) of individual fractures can be calculated
provided that the flow rates at the individual fractures are known. Similar assumptions
to those employed above must be used (a steady-state cylindrical flow regime without
skin zones).
hf = (h0-b·h1)/(1-b) 2-7
Tf = (1/a) (Qf0-Qf1)/( h1-h0) 2-8
where
Qf0 and Qf1 are the flow rates at a fracture and hf and Tf are the hydraulic head (far from
the drillhole) and transmissivity of a fracture, respectively.
Since the actual flow geometry and any skin effects are unknown, transmissivity values
should only be considered as an indication of the prevailing orders of magnitude. As the
calculated hydraulic heads do not depend on geometrical properties but only on the ratio
of the flows measured at different heads in the drillhole, they should be less sensitive to
unknown fracture geometry. A discussion of potential uncertainties in the calculation of
transmissivity and hydraulic head can be found in /Ludvigson et al., 2002/.
The hydraulic aperture of fractures can be calculated from /Marsily, G, 1986/:
T = e3·g·ρ/(12·μ·C) 2-9
e = (12·T·μ·C/(g·ρ))1/3
2-10
where
T = transmissivity of the fracture (m2/s)
e = hydraulic aperture (m)
μ = viscosity of water, 0.00139 (kg/(ms))
g = acceleration due to gravity, 9.81 (m/s2)
ρ = density of water, 999 (kg/m3)
C = experimental constant for fracture roughness, here chosen to be 1.

16
17
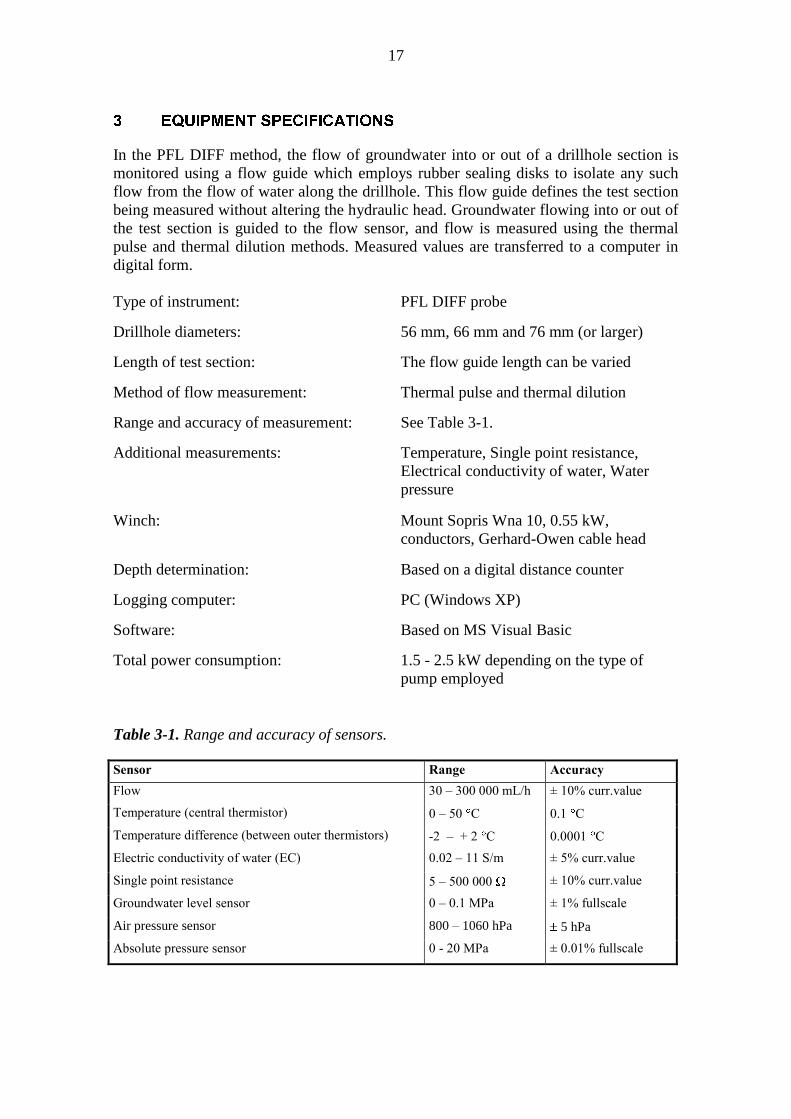
In the PFL DIFF method, the flow of groundwater into or out of a drillhole section is
monitored using a flow guide which employs rubber sealing disks to isolate any such
flow from the flow of water along the drillhole. This flow guide defines the test section
being measured without altering the hydraulic head. Groundwater flowing into or out of
the test section is guided to the flow sensor, and flow is measured using the thermal
pulse and thermal dilution methods. Measured values are transferred to a computer in
digital form.
Type of instrument: PFL DIFF probe
Drillhole diameters: 56 mm, 66 mm and 76 mm (or larger)
Length of test section: The flow guide length can be varied
Method of flow measurement: Thermal pulse and thermal dilution
Range and accuracy of measurement: See Table 3-1.
Additional measurements: Temperature, Single point resistance,
Electrical conductivity of water, Water
pressure
Winch: Mount Sopris Wna 10, 0.55 kW,
conductors, Gerhard-Owen cable head
Depth determination: Based on a digital distance counter
Logging computer: PC (Windows XP)
Software: Based on MS Visual Basic
Total power consumption: 1.5 - 2.5 kW depending on the type of
pump employed
Table 3-1. Range and accuracy of sensors.
Sensor Range Accuracy
Flow 30 – 300 000 mL/h ± 10% curr.value
Temperature (central thermistor) 0 – 50 C 0.1 C
Temperature difference (between outer thermistors) -2 – + 2 C 0.0001 C
Electric conductivity of water (EC) 0.02 – 11 S/m ± 5% curr.value
Single point resistance 5 – 500 000 ± 10% curr.value
Groundwater level sensor 0 – 0.1 MPa ± 1% fullscale
Air pressure sensor 800 – 1060 hPa 5 hPa
Absolute pressure sensor 0 - 20 MPa ± 0.01% fullscale

18
19
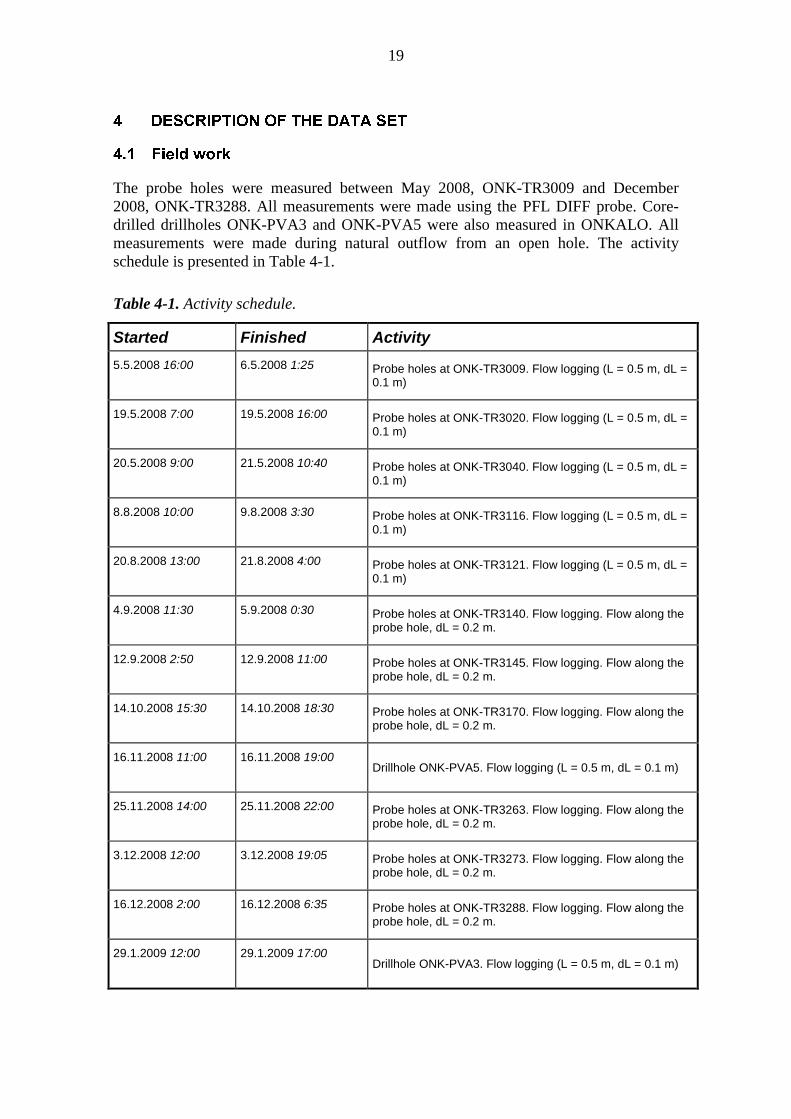
The probe holes were measured between May 2008, ONK-TR3009 and December
2008, ONK-TR3288. All measurements were made using the PFL DIFF probe. Core-
drilled drillholes ONK-PVA3 and ONK-PVA5 were also measured in ONKALO. All
measurements were made during natural outflow from an open hole. The activity
schedule is presented in Table 4-1.
Table 4-1. Activity schedule.
Started Finished Activity
5.5.2008 16:00 6.5.2008 1:25 Probe holes at ONK-TR3009. Flow logging (L = 0.5 m, dL = 0.1 m)
19.5.2008 7:00 19.5.2008 16:00 Probe holes at ONK-TR3020. Flow logging (L = 0.5 m, dL = 0.1 m)
20.5.2008 9:00 21.5.2008 10:40 Probe holes at ONK-TR3040. Flow logging (L = 0.5 m, dL = 0.1 m)
8.8.2008 10:00 9.8.2008 3:30 Probe holes at ONK-TR3116. Flow logging (L = 0.5 m, dL = 0.1 m)
20.8.2008 13:00 21.8.2008 4:00 Probe holes at ONK-TR3121. Flow logging (L = 0.5 m, dL = 0.1 m)
4.9.2008 11:30 5.9.2008 0:30 Probe holes at ONK-TR3140. Flow logging. Flow along the probe hole, dL = 0.2 m.
12.9.2008 2:50 12.9.2008 11:00 Probe holes at ONK-TR3145. Flow logging. Flow along the probe hole, dL = 0.2 m.
14.10.2008 15:30 14.10.2008 18:30 Probe holes at ONK-TR3170. Flow logging. Flow along the probe hole, dL = 0.2 m.
16.11.2008 11:00 16.11.2008 19:00 Drillhole ONK-PVA5. Flow logging (L = 0.5 m, dL = 0.1 m)
25.11.2008 14:00 25.11.2008 22:00 Probe holes at ONK-TR3263. Flow logging. Flow along the probe hole, dL = 0.2 m.
3.12.2008 12:00 3.12.2008 19:05 Probe holes at ONK-TR3273. Flow logging. Flow along the probe hole, dL = 0.2 m.
16.12.2008 2:00 16.12.2008 6:35 Probe holes at ONK-TR3288. Flow logging. Flow along the probe hole, dL = 0.2 m.
29.1.2009 12:00 29.1.2009 17:00 Drillhole ONK-PVA3. Flow logging (L = 0.5 m, dL = 0.1 m)
20
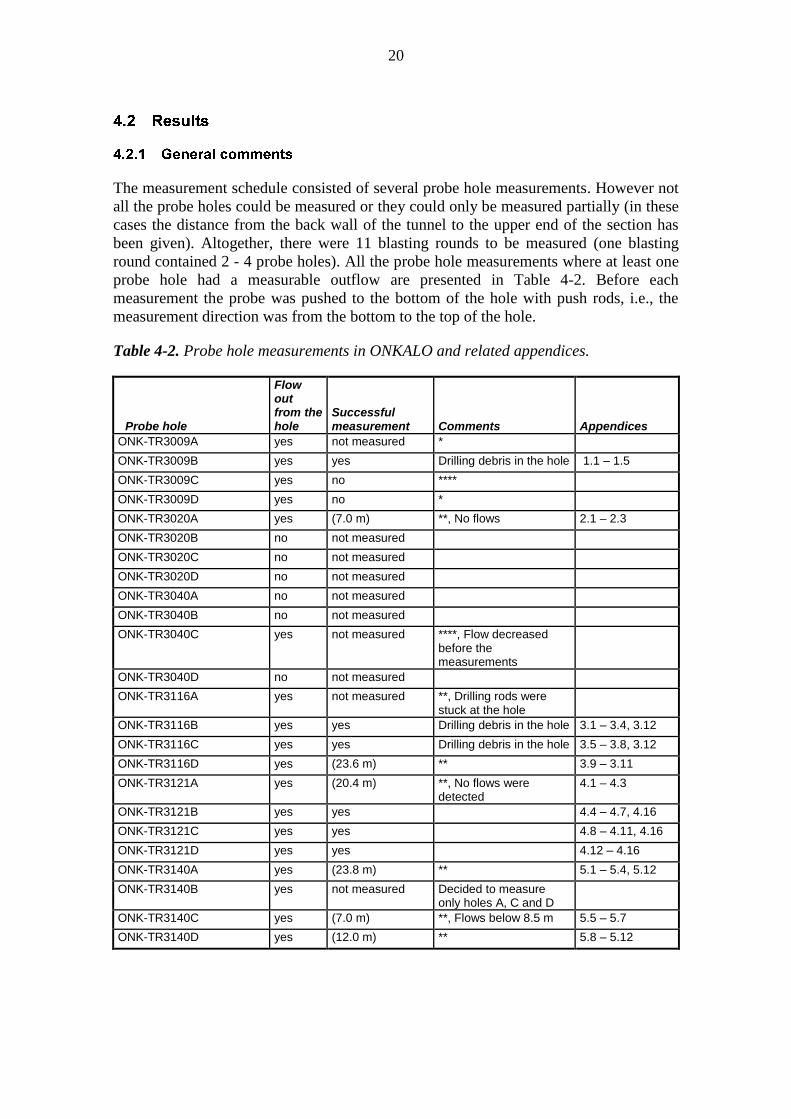
The measurement schedule consisted of several probe hole measurements. However not
all the probe holes could be measured or they could only be measured partially (in these
cases the distance from the back wall of the tunnel to the upper end of the section has
been given). Altogether, there were 11 blasting rounds to be measured (one blasting
round contained 2 - 4 probe holes). All the probe hole measurements where at least one
probe hole had a measurable outflow are presented in Table 4-2. Before each
measurement the probe was pushed to the bottom of the hole with push rods, i.e., the
measurement direction was from the bottom to the top of the hole.
Table 4-2. Probe hole measurements in ONKALO and related appendices.
Probe hole
Flow out from the hole
Successful measurement Comments Appendices
ONK-TR3009A yes not measured *
ONK-TR3009B yes yes Drilling debris in the hole 1.1 – 1.5
ONK-TR3009C yes no ****
ONK-TR3009D yes no *
ONK-TR3020A yes (7.0 m) **, No flows 2.1 – 2.3
ONK-TR3020B no not measured
ONK-TR3020C no not measured
ONK-TR3020D no not measured
ONK-TR3040A no not measured
ONK-TR3040B no not measured
ONK-TR3040C yes not measured ****, Flow decreased before the measurements
ONK-TR3040D no not measured
ONK-TR3116A yes not measured **, Drilling rods were stuck at the hole
ONK-TR3116B yes yes Drilling debris in the hole 3.1 – 3.4, 3.12
ONK-TR3116C yes yes Drilling debris in the hole 3.5 – 3.8, 3.12
ONK-TR3116D yes (23.6 m) ** 3.9 – 3.11
ONK-TR3121A yes (20.4 m) **, No flows were detected
4.1 – 4.3
ONK-TR3121B yes yes 4.4 – 4.7, 4.16
ONK-TR3121C yes yes 4.8 – 4.11, 4.16
ONK-TR3121D yes yes 4.12 – 4.16
ONK-TR3140A yes (23.8 m) ** 5.1 – 5.4, 5.12
ONK-TR3140B yes not measured Decided to measure only holes A, C and D
ONK-TR3140C yes (7.0 m) **, Flows below 8.5 m 5.5 – 5.7
ONK-TR3140D yes (12.0 m) ** 5.8 – 5.12
21
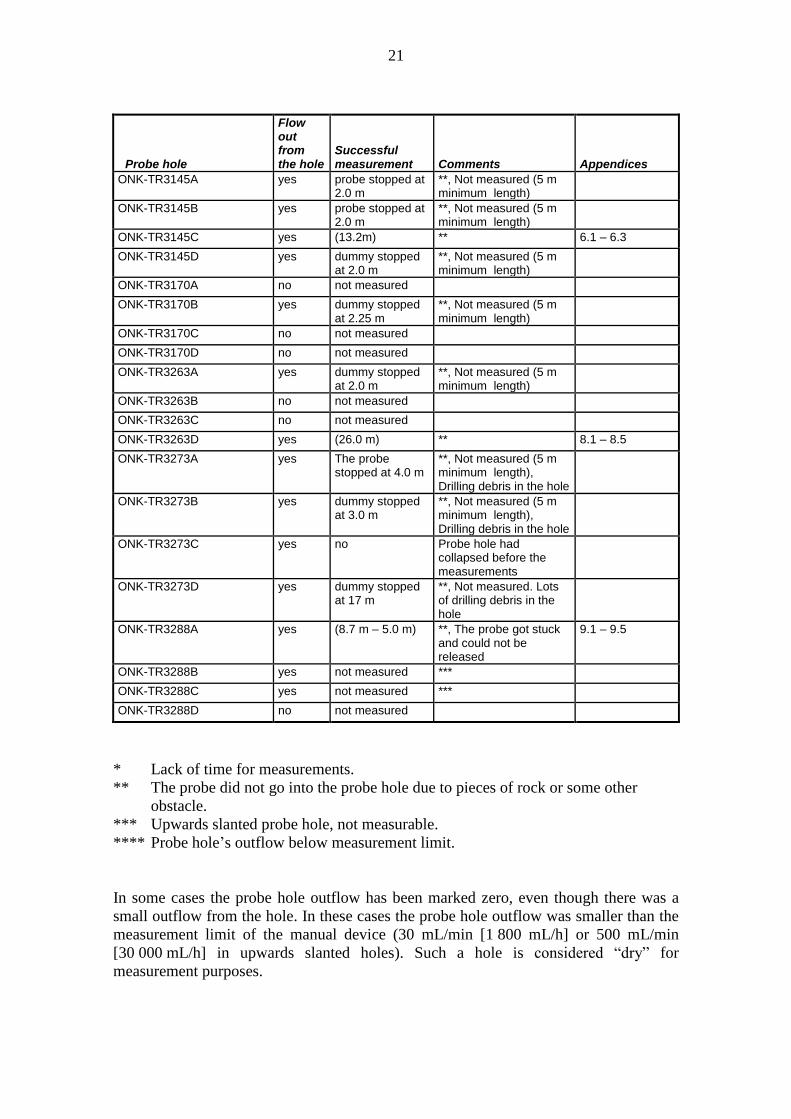
Probe hole
Flow out from the hole
Successful measurement Comments Appendices
ONK-TR3145A yes probe stopped at 2.0 m
**, Not measured (5 m minimum length)
ONK-TR3145B yes probe stopped at 2.0 m
**, Not measured (5 m minimum length)
ONK-TR3145C yes (13.2m) ** 6.1 – 6.3
ONK-TR3145D yes dummy stopped at 2.0 m
**, Not measured (5 m minimum length)
ONK-TR3170A no not measured
ONK-TR3170B yes dummy stopped at 2.25 m
**, Not measured (5 m minimum length)
ONK-TR3170C no not measured
ONK-TR3170D no not measured
ONK-TR3263A yes dummy stopped at 2.0 m
**, Not measured (5 m minimum length)
ONK-TR3263B no not measured
ONK-TR3263C no not measured
ONK-TR3263D yes (26.0 m) ** 8.1 – 8.5
ONK-TR3273A yes The probe stopped at 4.0 m
**, Not measured (5 m minimum length), Drilling debris in the hole
ONK-TR3273B yes dummy stopped at 3.0 m
**, Not measured (5 m minimum length), Drilling debris in the hole
ONK-TR3273C yes no Probe hole had collapsed before the measurements
ONK-TR3273D yes dummy stopped at 17 m
**, Not measured. Lots of drilling debris in the hole
ONK-TR3288A yes (8.7 m – 5.0 m) **, The probe got stuck and could not be released
9.1 – 9.5
ONK-TR3288B yes not measured ***
ONK-TR3288C yes not measured ***
ONK-TR3288D no not measured
* Lack of time for measurements.
** The probe did not go into the probe hole due to pieces of rock or some other
obstacle.
*** Upwards slanted probe hole, not measurable.
**** Probe hole’s outflow below measurement limit.
In some cases the probe hole outflow has been marked zero, even though there was a
small outflow from the hole. In these cases the probe hole outflow was smaller than the
measurement limit of the manual device (30 mL/min [1 800 mL/h] or 500 mL/min
[30 000 mL/h] in upwards slanted holes). Such a hole is considered “dry” for
measurement purposes.
22
The probe holes measured with the PFL DIFF probe produced flow rate and single point
resistance data. They are illustrated side by side (with a common depth axis) in the
appendices. Single point resistance is usually low on a fracture where a flow is detected.
There are also many other resistance anomalies originating from other fractures and
geological features. As the electrode of the SPR tool is located within the upper rubber
sealing disks of the probe, the locations of resistance anomalies associated with leaky
fractures coincide with the lower end of the flow anomalies. EC (electrical conductivity)
and the temperature of the probe hole water were also measured with the PFL DIFF
probe, see Appendices 1.4, 1.5, 2.2, 2.3, 3.3, 3.4, 3.7, 3.8, 3.10, 3.11, 4.2, 4.3, 4.6, 4.7,
4.10, 4.11, 4.14, 4.15, 5.3, 5.4, 5.6, 5.7, 5.10, 5.11, 6.2, 6.3, 7.5, 7.6, 8.4, 8.5, 9.4, 9.5,
10.4 and 10.5.
The flow loggings were performed with a 0.5 m section length and with 0.1 m length
decrements when flow from the measurement section was measured or with 0.2 m
length decrements when flow along the probe hole was measured, see Appendices 1.1,
2.1, 3.1, 3.5, 3.9, 4.1, 4.4, 4.8, 4.12, 5.1, 5.5, 5.8, 6.1, 7.1, 7.2, 8.1, 9.1 and 10.1. All the
measurements were carried out under such conditions that the probe hole was open. The
PFL DIFF method (overlapping flow logging) gives the length and thickness of
conductive zones with a length resolution of 0.1 m (flow from the measured section) or
0.2 m (flow along the probe hole).
The length of the test section, when flow from the measurement section is measured,
determines the resolution of the detection of a flow anomaly. If the distance between
flow yielding fractures is less than the section length, the anomalies will overlap,
resulting in a stepwise flow data plot. If the flow along the hole is measured, the flow
anomaly detection resolution is equal to the point interval.
In the flow logging measurement result images, the detected fractures are illustrated
between the flow and the single point resistance curves. They are interpreted on the
basis of the flow curves and therefore represent only the fractures that have a detectable
flow. A long line represents the location of a leaky fracture; a short line denotes that the
existence of a leaky fracture is uncertain. A short line is used if the flow anomalies are
overlapping or if they are unclear because of noise.
The results of the fractures that were detected are also presented in a tabulated form for
each probe hole, e.g., see Appendix 1.3.
An attempt was also made to evaluate the magnitude of fracture-specific flow rates in
measurements. After that, their flow rates were evaluated.
When flow from the measurement section is analyzed, it is not a problem to evaluate the
flow rate when the distance between flowing fractures is larger than 0.5 m. On the other
hand, the evaluation may be problematic when the distance between fractures is less
than 0.5 m. In these cases a stepwise increase or decrease in the flow data plot equals
the flow rate of a specific fracture. If the flow for a specific fracture cannot be

23
determined conclusively, the flow rate is marked with “-“ and a zero flow value is used
in transmissivity calculation. The flow direction is always into the hole by default. The
results of the evaluation are presented in tabulated form in association with the plotted
results of each drillhole, under the header “Tabulated results of detected fractures…”,
e.g., Appendix 1.3.
Some fracture-specific results were classified as “uncertain”, e.g. Appendix 3.1, short
line. The criterion “uncertain” was in most cases given if a minor flow rate in relation to
the noise level was detected.
The hydraulic aperture of the fractures was evaluated based on transmissivity, as
described in Chapter 2.
The electrical conductivity (EC) and the temperature of the probe hole water were also
measured during the flow measurements, e.g., see Appendices 1.4, 1.5, 2.2, 2.3, 3.3, 3.4,
3.7, 3.8, 3.10, 3.11, 4.2, 4.3, 4.6, 4.7, 4.10, 4.11, 4.14, 4.15, 5.3, 5.4, 5.6, 5.7, 5.10, 5.11,
6.2, 6.3, 7.5, 7.6, 8.4, 8.5, 9.4, 9.5, 10.4 and 10.5).
The temperature of the probe hole water was measured simultaneously with the
electrical conductivity. The EC-values are temperature corrected to 25 C to make them
comparable with other EC measurements /Heikkonen et. al, 2002/.
The EC and temperature results may not fully represent the actual conditions in the
drillhole. When the flow is measured with the 0.5 m test section, the measurement is
conducted using both the upper and lower rubber sealing disks. In this case the flow
guide carries water with it and good flushing at the EC electrode and at the temperature
sensor cannot be guaranteed.
At blasting round ONK-TR3009 four probe holes were drilled and three probe holes had
a measurable outflow. The three measurable probe holes were ONK-TR3009A, ONK-
TR3009B and ONK-TR3009D. Due to lack of time it was decided that only the biggest
outflow would be measured (probe hole ONK-TR3009B). The probe hole was measured
with a section length of 0.5 m and a measurement was performed every 0.1 m.
Preparations for measurements at 16:00 – 18:30.
Notes for ONK-TR3009B:
- The preparations at the site started at 18:30.
- The outflow from the probe hole before the flow measurements, at 19:30, was
8 400 mL/h.
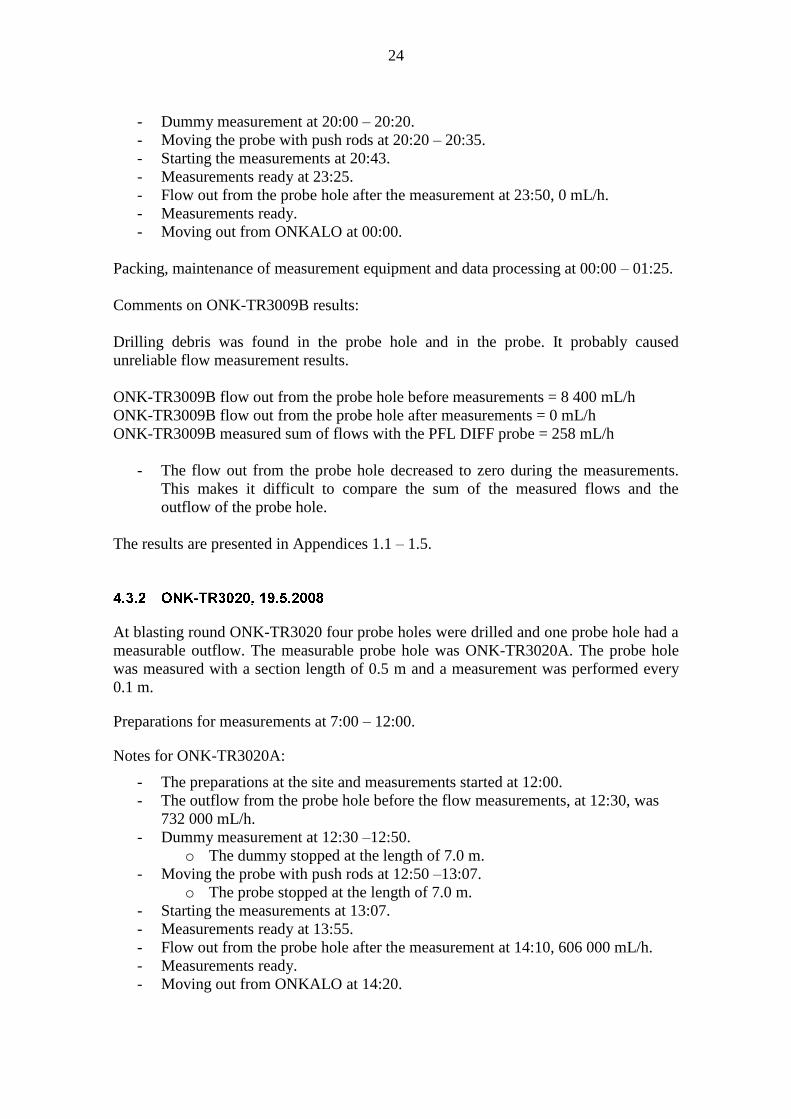
24
- Dummy measurement at 20:00 – 20:20.
- Moving the probe with push rods at 20:20 – 20:35.
- Starting the measurements at 20:43.
- Measurements ready at 23:25.
- Flow out from the probe hole after the measurement at 23:50, 0 mL/h.
- Measurements ready.
- Moving out from ONKALO at 00:00.
Packing, maintenance of measurement equipment and data processing at 00:00 – 01:25.
Comments on ONK-TR3009B results:
Drilling debris was found in the probe hole and in the probe. It probably caused
unreliable flow measurement results.
ONK-TR3009B flow out from the probe hole before measurements = 8 400 mL/h
ONK-TR3009B flow out from the probe hole after measurements = 0 mL/h
ONK-TR3009B measured sum of flows with the PFL DIFF probe = 258 mL/h
- The flow out from the probe hole decreased to zero during the measurements.
This makes it difficult to compare the sum of the measured flows and the
outflow of the probe hole.
The results are presented in Appendices 1.1 – 1.5.
At blasting round ONK-TR3020 four probe holes were drilled and one probe hole had a
measurable outflow. The measurable probe hole was ONK-TR3020A. The probe hole
was measured with a section length of 0.5 m and a measurement was performed every
0.1 m.
Preparations for measurements at 7:00 – 12:00.
Notes for ONK-TR3020A:
- The preparations at the site and measurements started at 12:00.
- The outflow from the probe hole before the flow measurements, at 12:30, was
732 000 mL/h.
- Dummy measurement at 12:30 –12:50.
o The dummy stopped at the length of 7.0 m.
- Moving the probe with push rods at 12:50 –13:07.
o The probe stopped at the length of 7.0 m.
- Starting the measurements at 13:07.
- Measurements ready at 13:55.
- Flow out from the probe hole after the measurement at 14:10, 606 000 mL/h.
- Measurements ready.
- Moving out from ONKALO at 14:20.
25
Packing, maintenance of measurement equipment and data processing at 14:20 – 16:00.
Comments on ONK-TR3020A results:
Flushing of the probe hole had been quite successful. A small amount of drilling debris
was found.
ONK-TR3020A flow out from probe hole before measurements = 732 000 mL/h
ONK-TR3020A flow out from probe hole after measurements = 606 000 mL/h
ONK-TR3020A measured sum of flows with the PFL DIFF probe = 0 mL/h
- The entire probe hole could not be measured and it is possible that there were
flowing fractures deeper within the hole.
- It is also possible that some flowing fractures were not detected due to the high
noise level in the upper end of the probe hole (i.e. flows were hidden by the
noise) or because the rubber disks of the PFL DIFF probe were leaking (i.e.
flows bypassed the flow meter).
The results are presented in Appendices 2.1 – 2.3.
At blasting round ONK-TR3040 four probe holes were drilled and one probe hole had a
measurable outflow. The measurable probe hole was ONK-TR3040C. The probe hole
was measured with a section length of 0.5 m and a measurement was performed every
0.1 m, but the measurements were unsuccessful.
Preparations before measurements at 9:00 – 11:00.
Notes for ONK-TR3040C, 20.5.2008:
- The outflow from the probe hole before the flow measurements was
190 mL/min.
- Dummy measurement at 11:40 – 11:55
o The dummy stopped at the length of 27.0 m.
- Moving the probe with push rods 11:55 – 12:33.
o The probe stopped at the length of 27.0 m.
- Starting the measurements at 12:33.
- Measurements stopped at 14:22. The probe was not working properly.
Comments on ONK-TR3040C results, 20.5.2008:
- The PFL DIFF probe was not working properly and the measurements were not
continued. Solving the problem at 14:22 – 16:00.
- Due to constructions at ONKALO, the next possible measurement opportunity
was on the following morning.
Packing, maintenance of measurement equipments at 16:00 – 16:30.
26
Notes for ONK-TR3040C, 21.5.2008:
- Preparations etc. including waiting time to get into the measurement position at
5:30 – 8:00.
- Measurement trailer in the ONKALO at about 8:00.
- Preparations at the site at 8:00 – 10:00.
- Flow out from the probe hole only 15 mL/min at 10:00.
o Flow rate below measurement limit (30 mL/min), aborting flow logging
measurements.
Moving out from ONKALO at 10:40.
At blasting round ONK-TR3116 four probe holes were drilled and all the probe holes
had a measurable outflow. Probe hole ONK-TR3116A could not be measured, because
drilling rods were stuck in it. The other probe holes were measured with a section length
of 0.5 m and a measurement was performed every 0.1 m.
Preparations for the measurements at 10:00 – 15:00.
Notes for ONK-TR3116D, 8.8.2008:
- The outflow from the probe hole before the flow measurements was
186 000 mL/h.
- Dummy measurement at 15:15 –15:30
o The dummy stopped at the length of 15.0 m.
- Moving the probe with push rods at 15:30 –16:20.
o The probe stopped at the length of 23.6 m.
- Starting the measurements at 16:12.
- Measurements ready at 18:40.
- Flow out from the probe hole after the measurement at 19:40, 333 000 mL/h.
Notes for ONK-TR3116C, 8.8.2008:
- The outflow from the probe hole before the flow measurements was
11 400 mL/h.
- Dummy measurement at 18:55 – 19:00
o The dummy stopped at the length of 5.0 m.
- Moving the probe with push rods at 19:00 – 19:17.
o The probe reached the bottom of the hole (29 m).
- Starting the measurements at19:17.
- Measurements ready at 21:43.
- Flow out from the probe hole after the measurement at 22:50, 16 800 mL/h
Notes for ONK-TR3116B, 8.8.2008 – 9.8.2008:
- The outflow from the probe hole before the flow measurements was
18 000 mL/h.
- Dummy measurement was made during ONK-TR3166C measurements.

27
o The dummy reached the bottom of the hole (29 m)
- Moving the probe with push rods at 22:15 – 22:36.
o The probe reached the bottom of the hole (29 m).
- Starting the measurements at 22:36.
- Measurements ready at 2:06.
- Flow out from the probe hole after the measurement at 2:20, 16 800 mL/h.
Packing, maintenance of measurement equipment and data processing at 2:45 – 3:30.
Comments on ONK-TR3116 results:
ONK-TR3116D flow out from probe hole before measurements = 186 000 mL/h
ONK- TR3116D flow out from probe hole after measurements = 333 000 mL/h
ONK- TR3116D measured sum of flows with PFL DIFF probe = 0 mL/h
- No certain fracture areas were found. The reason that there is a difference in
flow out from the probe hole and the sum of the measured flows could be due to
the high noise level in the probe hole (i.e. flows are hidden by the noise) or the
rubber disks of the PFL DIFF probe could be leaking (i.e. flows bypass the flow
meter). These leaks can be caused by crushed rock material in the probe hole,
rough probe hole wall or if the wall of the probe hole was more curved/ovoid
than expected.
- The main fracture area is probably below 23.5 m (the probe stopped at the depth
of 23.5 m). High flow rates should probably have been detected above the noise
level.
ONK-TR3116C flow out from probe hole before measurements = 11 400 mL/h
ONK- TR3116C flow out from probe hole after measurements = 16 800 mL/h
ONK- TR3116C measured sum of flows with PFL DIFF probe = 7 800 mL/h
- The reason that there is a difference in the flow out from the probe hole and the
sum of the measured flows could be because the rubber disks of the PFL DIFF
probe could have been leaking (i.e. flows bypassed the flow meter). These leaks
can be caused by crushed rock material in the probe hole, rough probe hole wall
or if the wall of the probe hole is more curved/ovoid than expected.
- The main fracture zone is probably between 7 m – 11 m where all of the
measured flows were located.
- Some drilling debris was found in the probe. It probably caused some inaccuracy
in measured flow rates.
ONK-TR3116B flow out from probe hole before measurements = 18 000 mL/h
ONK- TR3116B flow out from probe hole after measurements = 16 800 mL/h
ONK- TR3116B measured sum of flows with the PFL DIFF probe = 7 920 mL/h
- The reason that there is a difference in the flow out from the probe hole and the
sum of the measured flows could be because the rubber disks of the PFL DIFF
probe could have been leaking (i.e. flows bypassed the flow meter). These leaks
can be caused by crushed rock material in the probe hole, rough probe hole wall
or if the wall of the probe hole is more curved/ovoid than expected.
- Some drilling debris was found in the probe. It probably caused some inaccuracy
in measured flow rates.
28
The results are presented in Appendices 3.1 – 3.12.
At blasting round ONK-TR3121 four probe holes were drilled and all the probe holes
had a measurable outflow. The probe holes were measured with a section length of
0.5 m and a measurement was performed every 0.1 m.
Preparations for the measurements at 13:00 – 14:00.
Notes for ONK-TR3121D, 20.8.2008:
- The outflow from the probe hole before the flow measurements was
1.20 · 106 mL/h.
- Dummy measurement at 14:50 – 15:20.
- Moving the probe with push rods at 15:20 – 15:35.
o The probe and dummy reached the bottom of the hole (29 m).
- Starting the measurements at 15:35.
- Measurements ready at 18:34.
- Flow out from the probe hole after the measurement at 18:40, 1.632 · 106 mL/h.
Notes for ONK-TR3121C, 20.8.2008:
- The outflow from the probe hole before the flow measurements was
19 200 mL/h.
- Dummy measurement was made during ONK-TR3121D flow logging.
- Moving the probe with push rods at 18:40 – 18:49.
o The probe and dummy reached the bottom of the hole (29 m).
- Starting the measurements at 18:49.
- Measurements ready at 21:40.
- Flow out from the probe hole after the measurement at 22:50, 13 500 mL/h.
Notes for ONK-TR3121B, 20.8.2008 – 21.8.2008:
- The outflow from the probe hole before the flow measurements was
36 000 mL/h.
- Dummy measurement was made during ONK-TR3121D flow logging.
- Moving the probe with push rods at 22:10 – 22:22.
o The probe reached the bottom of the hole (29 m). The dummy had
stopped at the depth of 12.5 m.
- Starting the measurements at 22:22.
- Measurements ready at 0:48.
- Flow out from the probe hole after the measurement at 0:50, 36 900 mL/h.
Notes for ONK-TR3121A, 21.8.2008:
- The outflow from the probe hole before the flow measurements was
432 000 mL/h.
- Dummy measurement was made during ONK-TR3121D flow logging.
- Moving the probe with push rods at 0:55 –1:06.
29
o The probe and dummy stopped at the length of 20.4 m.
- Starting the measurements at 1:06.
- Measurements ready at 3:12.
- Flow out from the probe hole after the measurement at 3:15, 492 000 mL/h.
Packing, maintenance of measurement equipment and data processing at 3:30 – 4:00.
Comments on ONK-TR3121 results:
ONK-TR3121D flow out from probe hole before measurements = 1.20 · 106 mL/h
ONK-TR3121D flow out from probe hole after measurements = 1.632 · 106 mL/h
ONK-TR3121D measured sum of flows with the PFL DIFF probe = 150 000 mL/h
- No certain fracture zones were found. The reason was most likely that the probe
hole’s high flow rate caused a high noise level in the probe hole (i.e. flows are
hidden by the noise) and the rubber disks of the probe could have been leaking
(i.e. flows bypassed the flow meter). Rubber disk leaks can be caused by crushed
rock material in the probe hole, rough probe hole wall or if the wall of the probe
hole is more curved/ovoid than expected.
- The main fracture zone is probably between 23.0 m – 26.5 m.
ONK-TR3121C flow out from probe hole before measurements = 19 200 mL/h
ONK- TR3121C flow out from probe hole after measurements = 13 500 mL/h
ONK- TR3121C measured sum of flows with the PFL DIFF probe = 9 600 mL/h
- The reason that there is a difference in the flow out from the probe hole and the
sum of the measured flows could be because rubber disks of the PFL DIFF
probe could have been leaking (i.e. flows bypassed the flow meter). These leaks
can be caused by crushed rock material in the probe hole, rough probe hole wall
or if the wall of the probe hole is more curved/ovoid than expected.
- The main fracture zone is at the bottom of the probe hole (26 m – 29 m).
ONK-TR3121B flow out from probe hole before measurements = 36 000 mL/h
ONK- TR3121B flow out from probe hole after measurements = 36 900 mL/h
ONK- TR3121B measured sum of flows with the PFL DIFF probe = 9 540 mL/h
- The reason that there is a difference in the flow out from the probe hole and the
sum of the measured flows could be because rubber disks of the PFL DIFF
probe could have been leaking (i.e. flows bypassed the flow meter). These leaks
can be caused by crushed rock material in the probe hole, rough probe hole wall
or if the wall of the probe hole is more curved/ovoid than expected.
ONK-TR3121A flow out from probe hole before measurements = 432 000 mL/h
ONK- TR3121A flow out from probe hole after measurements = 492 000 mL/h
ONK- TR3121A measured sum of flows with the PFL DIFF probe = 0 mL/h
- No certain fracture areas were found. The reason that there is a difference in the
flow out from the probe hole and the sum of the measured flows could be due to
30
the high noise level in the probe hole (i.e. flows are hidden by the noise) or the
rubber disks of the PFL DIFF probe could have been leaking (i.e. flows
bypassed the flow meter). These leaks can be caused by crushed rock material in
the probe hole, rough probe hole wall or if the wall of the probe hole is more
curved/ovoid than expected.
- The main fracture area is probably below 21.0 m (the probe stopped at the depth
of 21.0 m). High flow rates probably should have been detected above the noise
level.
The results are presented in Appendices 4.1 – 4.16.
At blasting round ONK-TR3140 four probe holes were drilled and all probe holes had a
measurable outflow. It was decided that only probe holes A, C and D would be
measured. The flow along the probe hole was measured in 0.2 m steps.
Preparations for the measurements at 11:30 – 15:30.
Notes for ONK-TR3140A:
- Preparations at the site at 15:30 – 16:30
- The outflow from the probe hole before the flow measurements was about
9·106 mL/h – 9.6·10
6 mL/h.
- Dummy measurement at 16:30 – 16:40.
- Moving the probe with push rods at 16:40 – 16:58.
o The probe and dummy stopped at the length of 23.8 m.
- Starting the measurements at 16:58.
- Measurements ready at 18:36.
- Flow out from the probe hole after the measurement at 19:15 was about
9·106 mL/h – 9.6·10
6 mL/h.
Notes for ONK-TR3140D:
- The outflow from the probe hole before the flow measurements was
1.02·106 mL/h.
- Dummy measurement was made during ONK-TR3140A flow logging.
- Moving the probe with push rods at 19:15 – 19:28.
o The probe and dummy stopped at the length of 12.0 m.
- Starting the measurements at 19:28.
- Measurements ready at 21:12.
- Flow out from the probe hole after the measurement at 22:10, 930 000 mL/h.
Notes for ONK-TR3140C:
- The outflow from the probe hole before the flow measurements was
30 000 mL/h.
- Dummy measurement was made during ONK-TR3140A flow logging.
- Moving the probe with push rods at 21:18 –21:30.
31
o The probe and dummy stopped at the length of 7.0 m.
- Starting the measurements at 21:30.
- Measurements ready at 21:50.
- Flow out from the probe hole after the measurement at 22:10, 30 000 mL/h.
Packing, maintenance of measurement equipment and data processing at 22:30 – 0:30.
Comments on ONK-TR3140 results:
ONK-TR3140A flow out from probe hole before measurements = about 9·106 mL/h –
9.6·106 mL/h
ONK-TR3140A flow out from probe hole after measurements = about 9·106 mL/h –
9.6·106 mL/h
ONK-TR3140A sum of measured flows with the PFL DIFF probe = 8.82·106 mL/h
- Main fracture area is probably between 13 m – 15 m.
ONK-TR3140D flow out from probe hole before measurements = 1.02·106 mL/h
ONK-TR3140D flow out from probe hole after measurements = 930 000 mL/h
ONK-TR3140D sum of measured flows with the PFL DIFF probe = 249 000 mL/h
- The reason that there is a difference in flow out from the probe hole and the sum
of the measured flows could be caused by the new measurement system’s
incomplete calibration (measurement without lower rubber disks). The new
measurement system (flow along the hole) was still in test use.
- Detected fractures at 11.7 m and 2.4 m.
- The probe stopped at the depth of 12.5m. There could be more fractures below
12.5 m.
ONK-TR3140C flow out from probe hole before measurements = 30 000 mL/h
ONK-TR3140C flow out from probe hole after measurements = 30 000 mL/h
ONK-TR3140C sum of measured flows with PFL DIFF probe = 0 mL/h
- The probe stopped at the depth of 8.5m. No fractures were detected. There are
probably fractures below 8.5 m.
The results are presented in Appendices 5.1 – 5.12.
At blasting round ONK-TR3145 four probe holes were drilled and all probe holes had a
measurable outflow. The flow along the probe hole was measured in 0.2 m steps. The
probe holes were 29 m deep.
Preparations for the measurements at 2:50 – 3:50.
Notes for ONK-TR3145B:
- Preparations at the site at 3:50 – 4:30.
- The outflow from the probe hole before the flow measurements was 6 L/min.
- Dummy measurement at 4:30 – 4:50
32
o The dummy stopped at the length of 10 m.
- Moving the probe with push rods at 4:50 – 5:10.
o The probe stopped at the length of 2 m.
- Second dummy measurement after an extra flushing of the probe hole at 7:17 –
7:20
o The dummy stopped at the length of 1 m.
- Measurements at ONK-TR3145 stopped because the minimum measurement
length of a probe hole is 5 m.
Notes for ONK-TR3145A:
- The outflow from the probe hole before the flow measurements was 0.5 L/min.
- Dummy measurement at 5:14 – 5:25
o The dummy stopped at the length of 8 m.
- Moving the probe with push rods at 5:25 – 5:35.
o The probe stopped at the length of 2 m.
- Not measured, minimum measurement length is 5m.
Notes for ONK-TR3145C:
- The outflow from the probe hole before the flow measurements was
60 000 mL/h.
- Dummy measurement at 5:40 – 5:45
o The dummy stopped at the length of 1 m.
- Second dummy measurement after an extra flushing of the probe hole at 7:08 –
7:15
o The dummy stopped at the length of 1 m.
- Moving the probe with push rods at 7:25 – 7:35.
o The probe stopped at the length of 13.2 m.
- Starting the measurements at 7:45.
- Measurements ready at 8:30.
- Flow out from the probe hole after the measurement was 51 600 mL/h.
Notes for ONK-TR3145D:
- The outflow from the probe hole before the flow measurements was 0.5 L/min.
- Dummy measurement at 5:40 – 5:55
o The dummy stopped at the length of 2 m.
- The hole was not measured because the minimum measurement length is 5m.
Packing, maintenance of measurement equipment and data processing at 9:00 – 11:00.
Comments on ONK-TR3145 results:
All probe holes had some drilling debris. It was decided to flush the probe holes again
(SK-Kaivin). Second measurement attempts were made in probe holes B and C.
ONK-TR3145C flow out from probe hole before measurements = 60 000 mL/h
ONK-TR3145C flow out from probe hole after measurements = 51 600 mL/h
ONK-TR3145C sum of measured flows with PFL DIFF probe = 112 200 mL/h
33
- The reason that there is a difference in the flow out from the probe hole and the
sum of the measured flows could be caused by the new measurement system’s
(flow along the probe hole) incomplete calibration. The new measurement
system was still in test use. Therefore, no fractures table is presented in the
results.
- The main fracture zone is probably at the depth of 12.2 m.
Probe holes A, B and D were not measured. The probe did not pass the minimum
measurement length, 5 m.
The results are presented in Appendices 6.1 – 6.3.
At blasting round ONK-TR3170 four probe holes were drilled. ONK-TR3170B had a
measurable outflow. The rest of the probe holes were dry. The flow along the probe
hole was measured in 0.2 m steps. The probe hole’s depth was 29 m.
Preparations for the measurements at 15:30 – 16:15.
Notes for ONK-TR3170B:
- Preparations at the site at 16:15 – 16:45.
- The outflow from the probe hole before the flow measurements was
100 mL/min.
- Dummy measurement at 16:45 – 17:00
o The dummy stopped at the length of 2.25 m.
- Not measured, minimum measurement length is 5m.
Packing, maintenance of measurement equipment and data processing at 17:35 – 18:30.
Comments on ONK-TR3170B results:
ONK-TR3170B flow out from probe hole before measurements
(measured by SK-Kaivin) = 100 mL/min
ONK-TR3170B flow out from probe hole 16:30 = 80 mL/min
ONK-TR3170B flow out from probe hole 17:25 = 80 mL/min
Probe hole B was not measured. The dummy did not pass the minimum measurement
length, 5 m.
ONK-PVA5 measurements were conducted using the PFL DIFF probe. The drillhole was measured with a section length of 0.5 m and a measurement was conducted every 0.1 m. The outflow of the drillhole before the measurements was 9000 mL/h. The depth of the drillhole was 40.1 m.
34
Notes for ONK-PVA5:
- Preparations at the site at 11:00 – 13:00.
- The outflow from the drillhole before the flow measurements, at 12:55, was
9 000 mL/h.
- Moving the probe with push rods at 13:00 – 13:35.
o The probe reached the bottom of the drillhole.
o 39.2 m – 40.1 m could not be measured due the structure of the probe.
- Starting the measurements at 13:35.
- Measurements ready at 17:09.
- Flow out from the probe hole after the measurement at 17:20, 150 mL/min.
Packing, maintenance of measurement equipment and data processing at 17:30 – 19:00.
Comments on ONK-PVA5 results:
ONK-PVA5 flow out from drillhole before measurements = 9 000 mL/h
ONK-PVA5 flow out from drillhole after measurements = 9 000 mL/min
ONK-PVA5 measured sum of flows with the PFL DIFF probe = 7 510 mL/min
- The rubber disks of the probe could have been leaking (i.e. flows bypassed the
flow meter) causing a small difference between the flow out from the drillhole
and the sum of the measured flows.
- The detected main fracture zones are at depth interval 27.7 m – 34.4 m. No
fractures were found below 34.4 m.
The results are presented in Appendices 7.1 – 7.6.
At blasting round ONK-TR3263 four probe holes were drilled. Two probe holes (ONK-
TR3263A and ONK-TR3263D) had a measurable outflow. The rest of the probe holes
were dry. The flow along the probe hole was measured in 0.2 m steps. The probe holes
were 29 m deep.
Preparations for the measurements at 14:00 – 15:00.
Notes for ONK-TR3263A:
- Preparations at the site at 15:00 – 15:20.
- The outflow from the probe hole before the flow measurements was
600 000 mL/h.
- Dummy measurement at 15:20 – 16:00.
o The dummy stopped at the length of 2 m.
- Second dummy after an extra flushing of the probe hole at 18:20 – 18:35.
o The dummy stopped at the length of 2 m.
- The probe hole was not measured because minimum measurement length is 5 m.
35
Notes for ONK-TR3263D:
- The outflow from the probe hole before the flow measurements, at 15:30, was
28 800 mL/h.
- Dummy measurement at 16:00 – 16:15. The dummy reached the bottom of the
hole.
- There was a delay at 16:20 – 17:40.
o Pumping failure at the end of ONKALO, water level increased.
o Blasting at depth level -90 m.
- Moving the probe with push rods at 17:40 – 18:16.
o The probe stopped at the length of 26.0 m.
- Starting the measurements at 18:16.
- The probe got stuck at the length of 16.4 m.
o Releasing the probe at 18:50 – 19:19.
- Continuing the measurements at 19:19.
- Measurements ready at 20:16.
- Flow out from the probe hole after the measurement at 20:20, 27 000 mL/h.
Packing, maintenance of measurement equipment and data processing at 20:20 – 22:00.
Comments on ONK-TR3263D results:
ONK-TR3263D flow out from probe hole before measurements = 28 800 mL/h
ONK-TR3263D flow out from probe hole after measurements = 27 000 mL/h
ONK-TR3263D measured sum of flows with the PFL DIFF probe = 18 000 mL/h
- The reason that there is a difference in the flow out from the probe hole and the
sum of the measured flows could be because rubber disks of the PFL DIFF
probe could have been leaking (i.e. flows bypassed the flow meter). These leaks
can be caused by crushed rock material in the probe hole, rough probe hole wall
or if the wall of the probe hole is more curved/ovoid than expected.
- The detected main fracture zones are at depth intervals 18 m – 19 m and 14 m –
15 m.
The results are presented in Appendices 8.1 – 8.5.
At blasting round ONK-TR3273 four probe holes were drilled. All four probe holes had measurable flows before measurements. Probe hole A was leaking 5 L/min, probe hole B was leaking 300 mL/min, probe hole C was leaking 1.5 L/min and probe hole D was leaking 1.9 L/min. The flow along the probe hole was measured in 0.2 m steps. The probe holes were 29 m deep.
Preparations at 12:00 – 13:10.
Notes for ONK-TR3273A:
- Preparations at the site at 13:10 – 13:40
- The flow out from the probe hole before the measurement was 5 L/min.
36
- Dummy measurement at 13:40 – 14:30.
o The dummy reached the bottom of the hole.
- Moving the probe with push rods at 14:30 –14:55.
o The probe stopped at the length of 4 m.
- The probe hole was not measured because the minimum measurement length is
5 m.
Notes for ONK-TR3273D:
- The flow out from the probe hole before the measurement was 1.9 L/min.
- Dummy measurement at 15:07 –15:43.
o The dummy was first stuck at the length of 3 m.
o Finally the dummy could be pushed up to 17 m.
- Lots of drilling debris came out from the probe hole with the dummy.
- The probe hole could not be measured.
Notes for ONK-TR3273B:
- The flow out from the probe hole before the measurement was 300 mL/min.
- Dummy measurement at 15:48 – 16:01.
o The dummy stopped at the length of 3 m.
- The probe hole was not measured because the minimum measurement length is
5 m.
Notes for ONK-TR3273C:
- The flow out from the probe hole before measurement was 1.5 L/min.
- The dummy measurement was not performed.
o The top of the probe hole had collapsed.
- The probe hole could not be measured.
Moving out from ONKALO at 16:30.
Maintenance of equipment and data processing at 16:30 – 19:05.
Comments on ONK-TR3272 results:
Flushing of the probe holes had been unsuccessful and lots of drilling debris was found.
None of the probe holes could be measured.
At blasting round ONK-TR3288 four probe holes were drilled and three probe holes had
a measurable outflow. Probe hole A was leaking 550 mL/min, probe hole B was leaking
500 mL/min and probe hole C was leaking 2.8 L/min. Probe hole D was dry. The flow
along the probe hole was measured in 0.2 m steps. The probe holes were 29 m deep.
Probe holes B and C were upwards slanted and could not be measured.
37
Preparations at 2:00 – 2:45.
Notes for ONK-TR3288A:
- Preparations at the site at 2:45 – 3:10.
- The flow out from the probe hole before the measurement was 550 mL/min.
- Dummy measurement at 3:10 – 3:28.
o The dummy reached the bottom of the hole.
- Moving the probe with push rods at 4:41 – 5:08.
o The probe stopped at the length of 8.7 m.
- Starting the measurements at 5:08.
- The probe got stuck at the length of at 5 m.
o Trying to release the probe at 5:35 – 6:35.
- Unsuccessful attempts to release the probe. Measurements could not be
continued.
- PFL DIFF probe number 3 was left in the probe hole.
Comments on ONK-TR3288 results:
ONK-TR3288A flow out from probe hole before measurements = 550 mL/min
ONK-TR3288B flow out from probe hole before measurements = 500 mL/min
ONK-TR3288C flow out from probe hole before measurements = 2.8 L/min
The first measured probe hole was ONK-TR3288A. The PFL DIFF probe got stuck in
the probe hole at the length of 5 m. PFL DIFF probe number 3 was left in the probe hole
after unsuccessful release attempts and was blasted up later at the next blasting round. It
was not possible to measure any of the other probe holes due to lack of time.
The results are presented in Appendices 9.1 – 9.5.
ONK-PVA3 measurements were conducted using the PFL DIFF probe. The drillhole was measured with a section length of 0.5 m and a measurement was conducted every 0.1 m. Drillhole outflow was measured by Posiva after the PFL DIFF loggings. The outflow from the hole was 2 880 mL/h, 3.2.2009. Flow logging was performed once earlier in this drillhole, 25.9.2006. The results of the earlier measurements are combined with the new results.
Preparations at 12:00 – 13:00.
Notes for ONK-PVA3:
- Preparations at the site at 13:00 – 13:30.
- Moving the probe with push rods at 13:30 – 13:57.
o The probe stopped at the depth of 22.6 m.
o 22.6 m – 23.2 m could not be measured due the structure of the probe.
- Starting the measurements at 13:57.
- Measurements ready at 15:40.
38
Packing, maintenance of measurement equipment and data processing at 15:40 – 17:00.
Comments on ONK-PVA3 results:
ONK-PVA3 measured sum of flows with the PFL DIFF probe = 1 340 mL/h
ONK-PVA3 flow out from the drillhole after the measurements, 3.2.2009 = 2 880 mL/h
- The rubber disks of the probe could have been leaking (i.e. flows bypassed the
flow meter) causing a small difference in the flow out from the drillhole and the
sum of the measured flows.
ONK-PVA3 was re-measured because outflow from the drillhole had decreased after
first flow logging measurements in 2006. After the new measurements in January 2009
the PFL DIFF probe was covered by small amount of cement, which was probably used
for rock injection. That could be one reason for the decreased drillhole outflow. A
new, uncertain fracture was found at the depth of 20.3 m. The fractures at the depths of
11.6 m, 12.4 m and 17.7 m were not found during these measurements.
The results are presented in Appendices 10.1 – 10.5.
39
In this study the Posiva Flow Log, Difference Flow Method was used in the probe holes
from ONK-TR3009 to ONK-TR3288 in ONKALO, Olkiluoto. The probe holes were
drilled before the tunnel blasting within the tunnel profile. Core-drilled drillholes were
also measured in addition to normal probe holes. The measured core-drilled holes were
ONK-PVA3 and ONK-PVA5.
The first measured probe holes at blasting round TR3009 were logged on May 5, 2008
when the tunnel was 3009 m long. The last reported probe holes, at blasting round
TR3288, were measured on December 16, 2008 when the tunnel was 3288 m long.
Probe holes from ONK-TR3009 to ONK-TR3121 were measured using a 0.5 m section
length (the distance isolated with the rubber disks) with a 0.1 m step. Probe holes
starting at ONK-TR3140 were measured without lower rubber disks. This setup is used
to measure the flow along the probe hole in 0.2 m steps. There were no measurable
flows between blasting rounds TR3170 – TR3263.
The main results for all drillholes and probe holes are the distribution of flowing
fractures and their transmissivity. The hydraulic aperture of fractures was also
evaluated.
The use of the flow meter in the probe holes was experimental and there were
performance problems:
The probe did not go into the probe hole (or did not reach the bottom of the
hole) because the diameter of the probe hole was less than expected, it was more
curved than expected or there was crushed rock, drilling debris or some other
obstacle in the probe hole.
Unreliable results we obtained mainly because of leaks at the rubber disks.
These leaks can be caused by crushed rock material in the probe hole, rough
probe hole wall, air / gas bubbles in the water or if the cross section of the hole
is, for example, ovoid. The probe does not perform well whenever there is loose
material in the probe hole or if the cross section of the drillhole is far from
circular. For these reasons the summed flow measured in the probe holes was
usually less than the yield of the probe holes.
At blasting round TR3288 the PFL DIFF probe got stuck in the probe hole
ONK-TR3288A at the depth of 5 m. PFL DIFF probe number 3 was left in the
probe hole after several unsuccessful release attempts. The probe was destroyed
later at the next blasting round.
Higher flow rates than PFL DIFF can measure.
To obtain better results from probe hole measurements the probe hole flushing must be
well managed. Crushed rock in the probe holes was one of the main reasons when
measurements were unsuccessful.

40
The tested measuring setup for flow along the probe hole seemed to be more suitable for
the probe holes. This setup should be less sensitive to roughness of the hole wall and
loose rock material. In addition, with this setup it is possible to measure much higher
flow rates, flows originating from the bottom of the hole and check the results at the site
when the probe is on the top of the hole (if the hole is pumped or if it is an open
underground hole). A drawback is that the accuracy even in good hole conditions is
about 20% of current flow value. Another limitation of the method is that small flow
rates above a larger flow may remain undetected.
In most cases the probe holes that had an outflow could not be measured or were
measured only partially because of structural problems: The dummy tool or the probe
did not go into the probe hole, there was a lot of drilling debris etc. In cases where
measurements could be performed flowing fracture zones were located or, based on the
results, the location of flowing fracture zones could be approximated.
41
Heikkonen, J., Heikkinen, E. & Mäntynen, M. 2002. Mathematical modelling of
temperature adjustment algorithm for groundwater electrical conductivity on basis of
synthetic water sample analysis. Helsinki, Posiva Oy. Working report 2002-10 (in
Finnish).
Ludvigson, J.-E., Hansson, K. and Rouhiainen, P. 2002. Methodology study of Posiva
difference flow metre in borehole KLX02 at Laxemar. SKB Rapport R-01-52.
Marsily, G. 1986. Quantitative Hydrogeology, Groundwater Hydrology for Engineers.
Academic Press, Inc. ISBN 0-12-208915-4.
Pekkanen, J. 2008. Flow measurements in ONKALO at Olkiluoto. Probe holes and
ONK-PR2 – ONK-PR5, ONK-PP114 and ONK-PVA4. Posiva Oy. Working Report
2008-37.
Reiman, M., Väisäsvaara, J & Pöllänen, J. 2006. Flow measurements in ONKALO at
Olkiluoto. Probe holes and ONK-KR1 – ONK-KR4, ONK-PVA1 and ONK-YPPL18.
Posiva Oy. Working Report 2006-65.

42
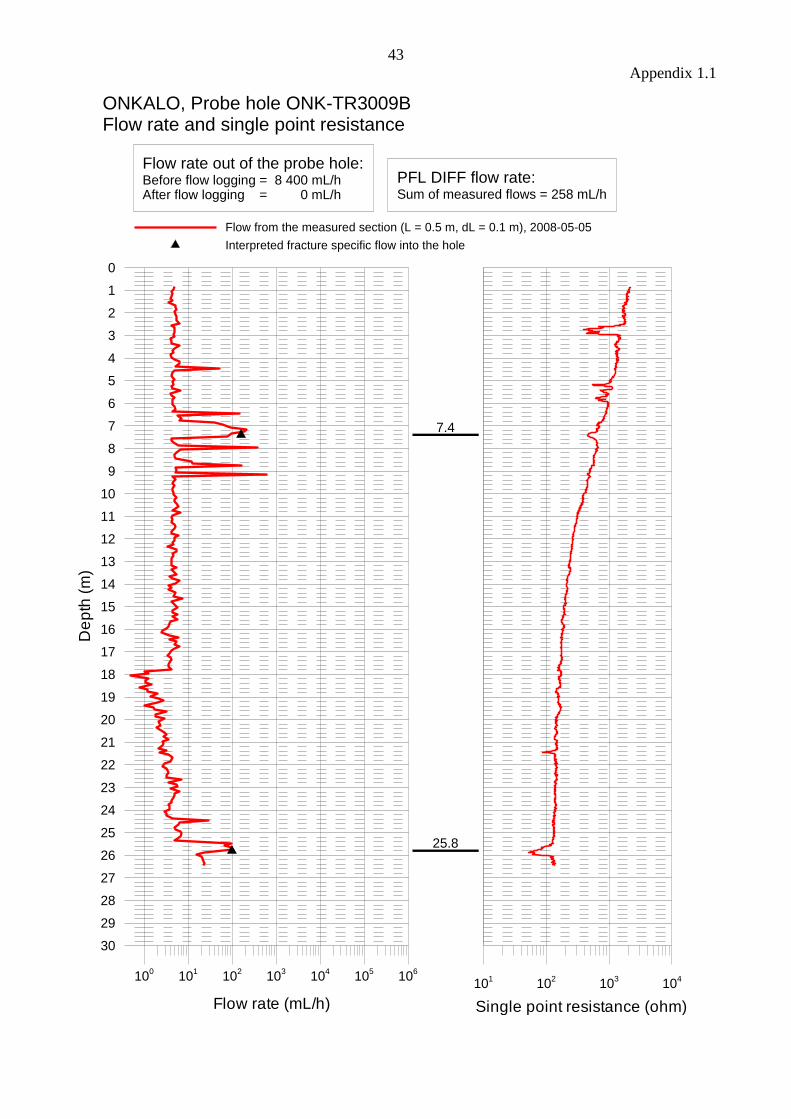
43
Appendix 1.1
100
101
102
103
104
105
106
Flow rate (mL/h)
30
29
28
27
26
25
24
23
22
21
20
19
18
17
16
15
14
13
12
11
10
9
8
7
6
5
4
3
2
1
0
De
pth
(m
)
101
102
103
104
Single point resistance (ohm)
Flow from the measured section (L = 0.5 m, dL = 0.1 m), 2008-05-05
Interpreted fracture specific flow into the hole
7.4
25.8
ONKALO, Probe hole ONK-TR3009BFlow rate and single point resistance
Flow rate out of the probe hole:Before flow logging = 8 400 mL/hAfter flow logging = 0 mL/h
PFL DIFF flow rate:Sum of measured flows = 258 mL/h
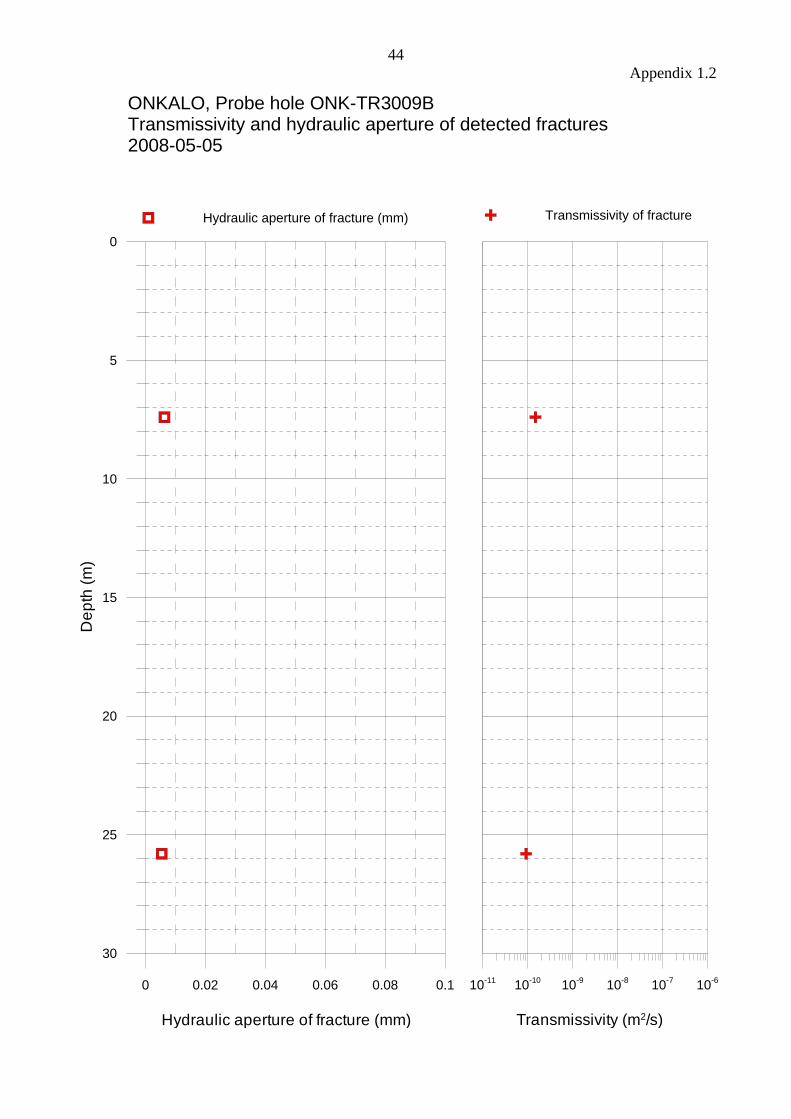
44
Appendix 1.2
0 0.02 0.04 0.06 0.08 0.1
Hydraulic aperture of fracture (mm)
30
25
20
15
10
5
0
De
pth
(m
)
10-11
10-10
10-9
10-8
10-7
10-6
Transmissivity (m2/s)
Hydraulic aperture of fracture (mm)
ONKALO, Probe hole ONK-TR3009BTransmissivity and hydraulic aperture of detected fractures2008-05-05
Transmissivity of fracture
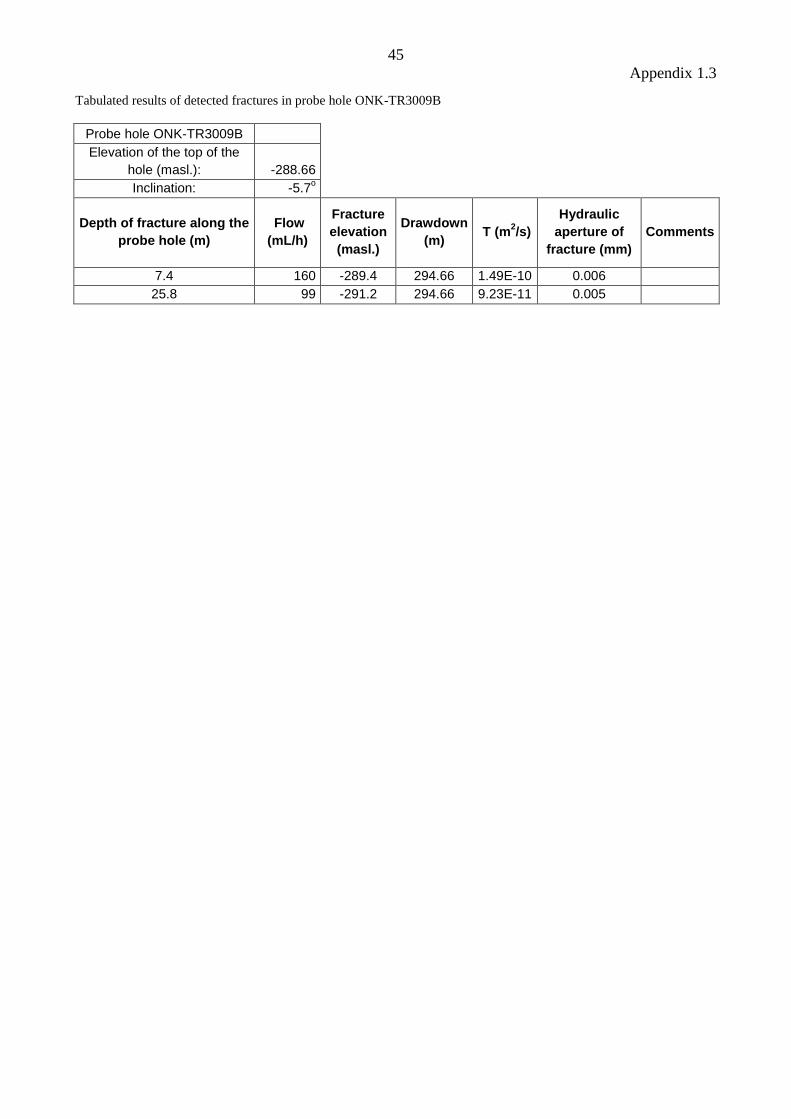
45
Appendix 1.3
Tabulated results of detected fractures in probe hole ONK-TR3009B
Probe hole ONK-TR3009B
Elevation of the top of the
hole (masl.): -288.66
Inclination: -5.7o
Depth of fracture along the
probe hole (m)
Flow
(mL/h)
Fracture
elevation
(masl.)
Drawdown
(m) T (m
2/s)
Hydraulic
aperture of
fracture (mm)
Comments
7.4 160 -289.4 294.66 1.49E-10 0.006
25.8 99 -291.2 294.66 9.23E-11 0.005
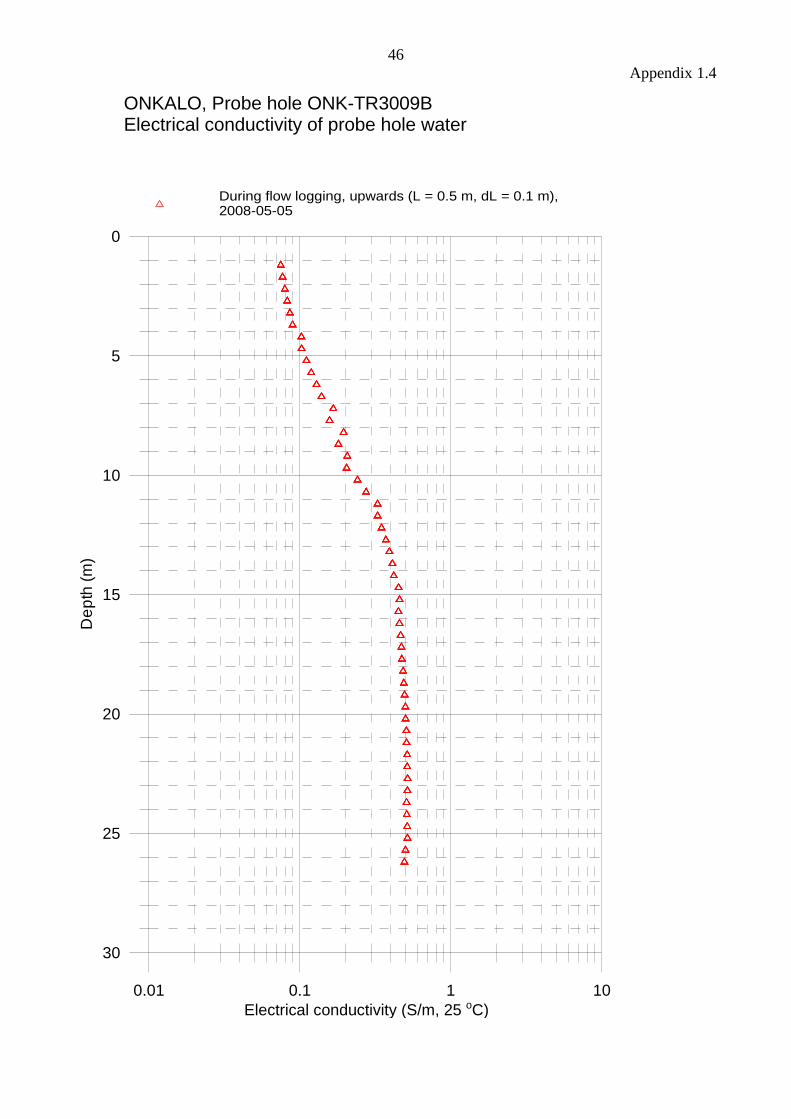
46
Appendix 1.4
0.01 0.1 1 10
Electrical conductivity (S/m, 25 oC)
30
25
20
15
10
5
0
De
pth
(m
)
During flow logging, upwards (L = 0.5 m, dL = 0.1 m), 2008-05-05
ONKALO, Probe hole ONK-TR3009BElectrical conductivity of probe hole water
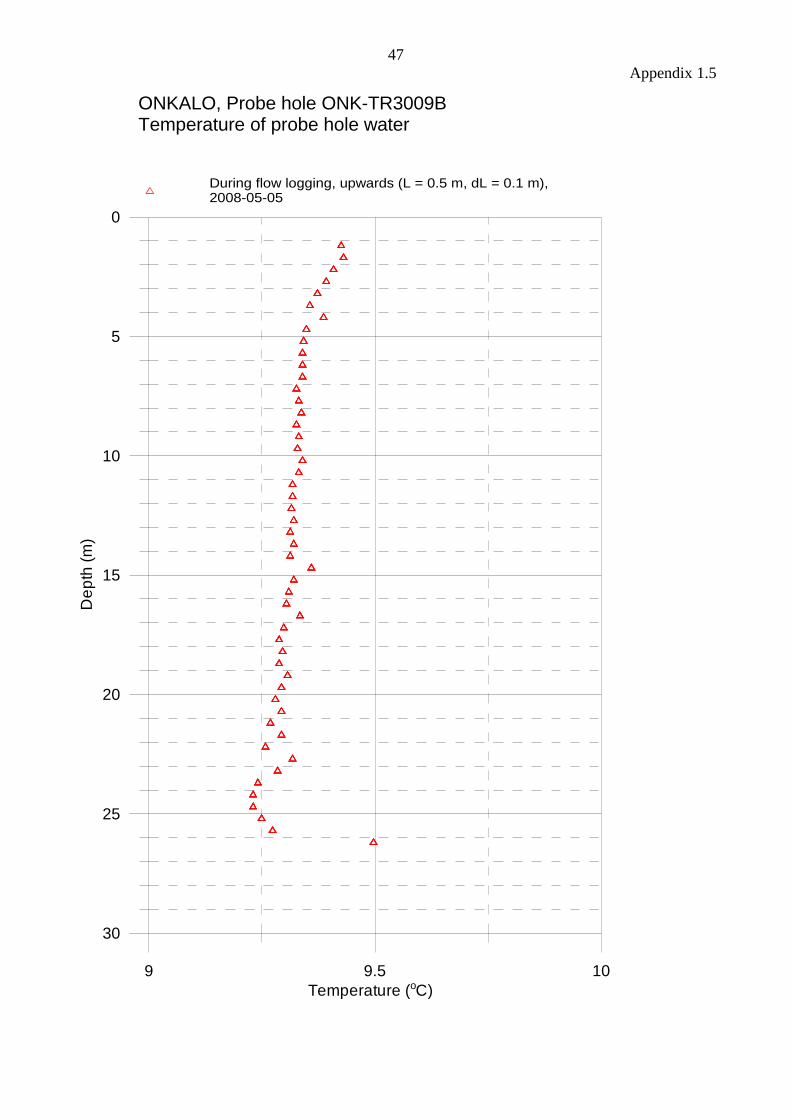
47
Appendix 1.5
9 9.5 10
Temperature (oC)
30
25
20
15
10
5
0
De
pth
(m
)
During flow logging, upwards (L = 0.5 m, dL = 0.1 m), 2008-05-05
ONKALO, Probe hole ONK-TR3009BTemperature of probe hole water

48
Appendix 2.1
100
101
102
103
104
105
106
Flow rate (mL/h)
20
19
18
17
16
15
14
13
12
11
10
9
8
7
6
5
4
3
2
1
0
De
pth
(m
)
101
102
103
104
Single point resistance (ohm)
Flow from the measured section (L = 0.5 m, dL = 0.1 m), 2008-05-19
Interpreted fracture specific flow into the hole
ONKALO, Probe hole ONK-TR3020AFlow rate and single point resistance
Flow rate out of the probe hole:Before flow logging = 732 000 mL/hAfter flow logging = 606 000 mL/h
PFL DIFF flow rate:Sum of measured flows = 0 mL/h(PFL DIFF probe stopped at the depth of 7 m)
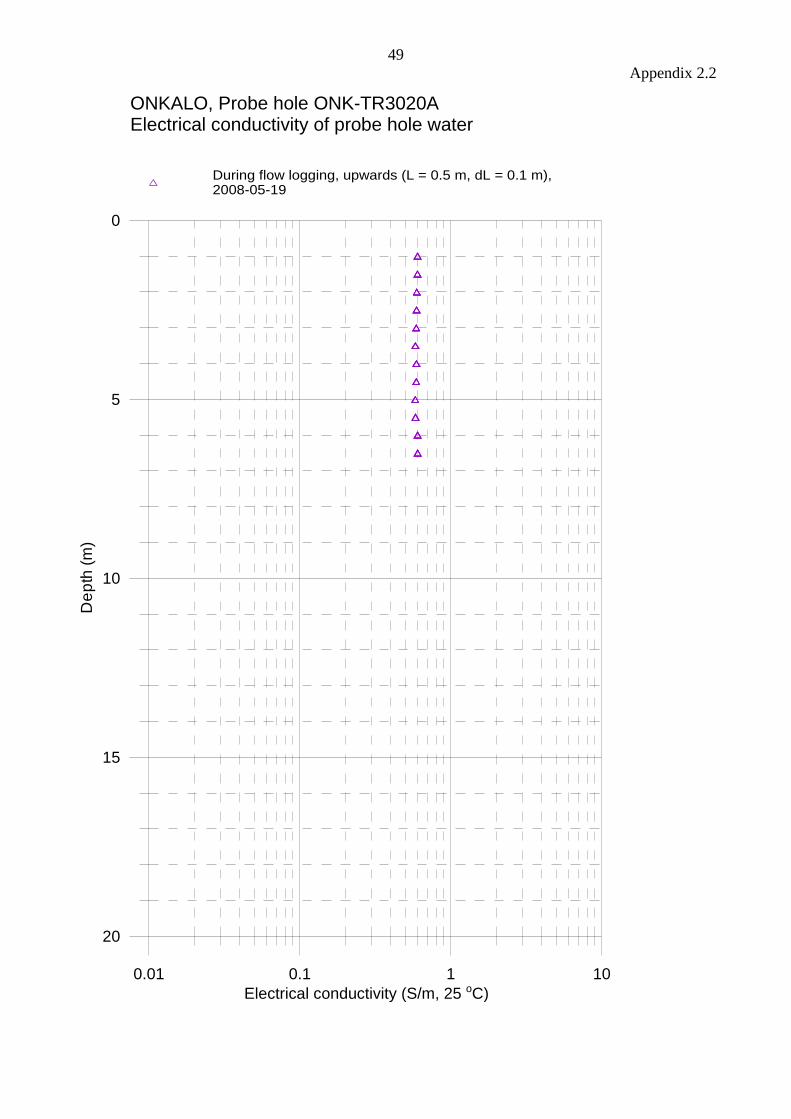
49
Appendix 2.2
0.01 0.1 1 10
Electrical conductivity (S/m, 25 oC)
20
15
10
5
0
De
pth
(m
)
During flow logging, upwards (L = 0.5 m, dL = 0.1 m), 2008-05-19
ONKALO, Probe hole ONK-TR3020AElectrical conductivity of probe hole water
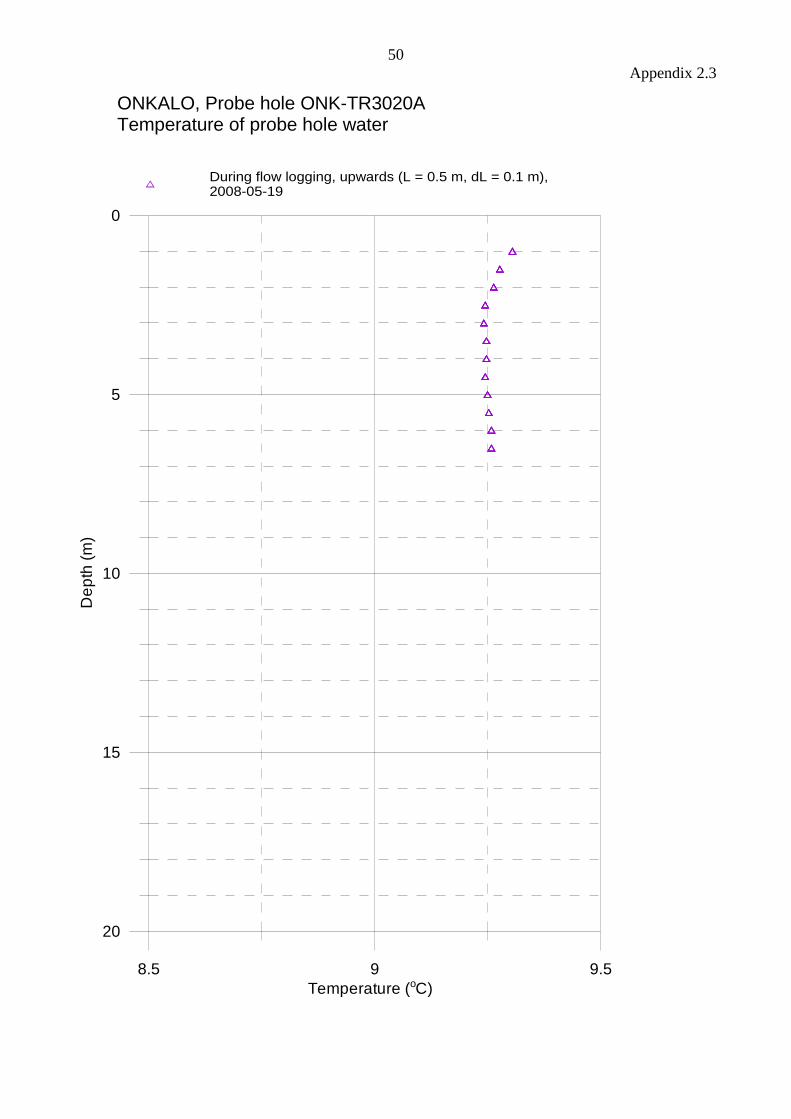
50
Appendix 2.3
8.5 9 9.5
Temperature (oC)
20
15
10
5
0
De
pth
(m
)
During flow logging, upwards (L = 0.5 m, dL = 0.1 m), 2008-05-19
ONKALO, Probe hole ONK-TR3020ATemperature of probe hole water

51
Appendix 3.1
100
101
102
103
104
105
106
Flow rate (mL/h)
30
29
28
27
26
25
24
23
22
21
20
19
18
17
16
15
14
13
12
11
10
9
8
7
6
5
4
3
2
1
0
De
pth
(m
)
101
102
103
104
Single point resistance (ohm)
Flow from the measured section (L = 0.5 m, dL = 0.1 m), 2008-08-08 - 2008-08-09
Interpreted fracture specific flow into the hole
16.7
21.0
26.1
10.4
17.5
19.5
24.5
25.6
10.9
18.0
26.7
ONKALO, Probe hole ONK-TR3116BFlow rate and single point resistance
Flow rate out of the probe hole:Before flow logging = 18 000 mL/hAfter flow logging = 16 800 mL/h
PFL DIFF flow rate:Sum of measured flows = 7 920 mL/h
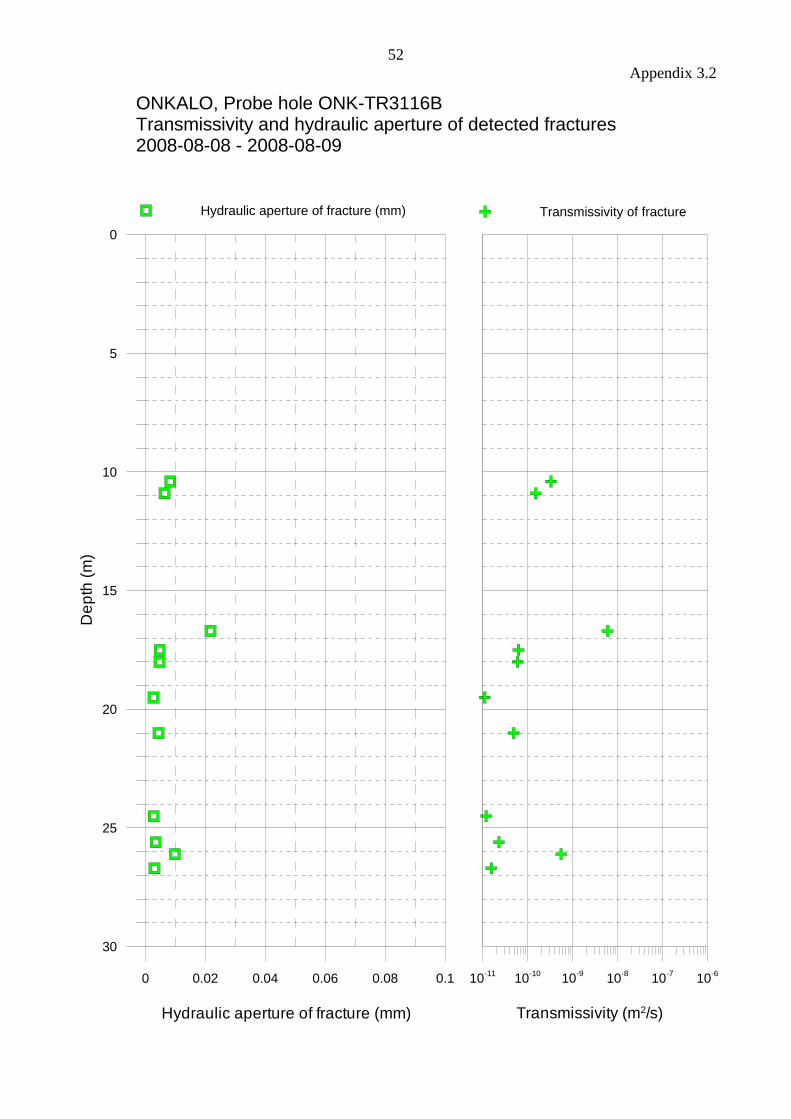
52
Appendix 3.2
0 0.02 0.04 0.06 0.08 0.1
Hydraulic aperture of fracture (mm)
30
25
20
15
10
5
0
De
pth
(m
)
10-11
10-10
10-9
10-8
10-7
10-6
Transmissivity (m2/s)
Hydraulic aperture of fracture (mm)
ONKALO, Probe hole ONK-TR3116BTransmissivity and hydraulic aperture of detected fractures2008-08-08 - 2008-08-09
Transmissivity of fracture
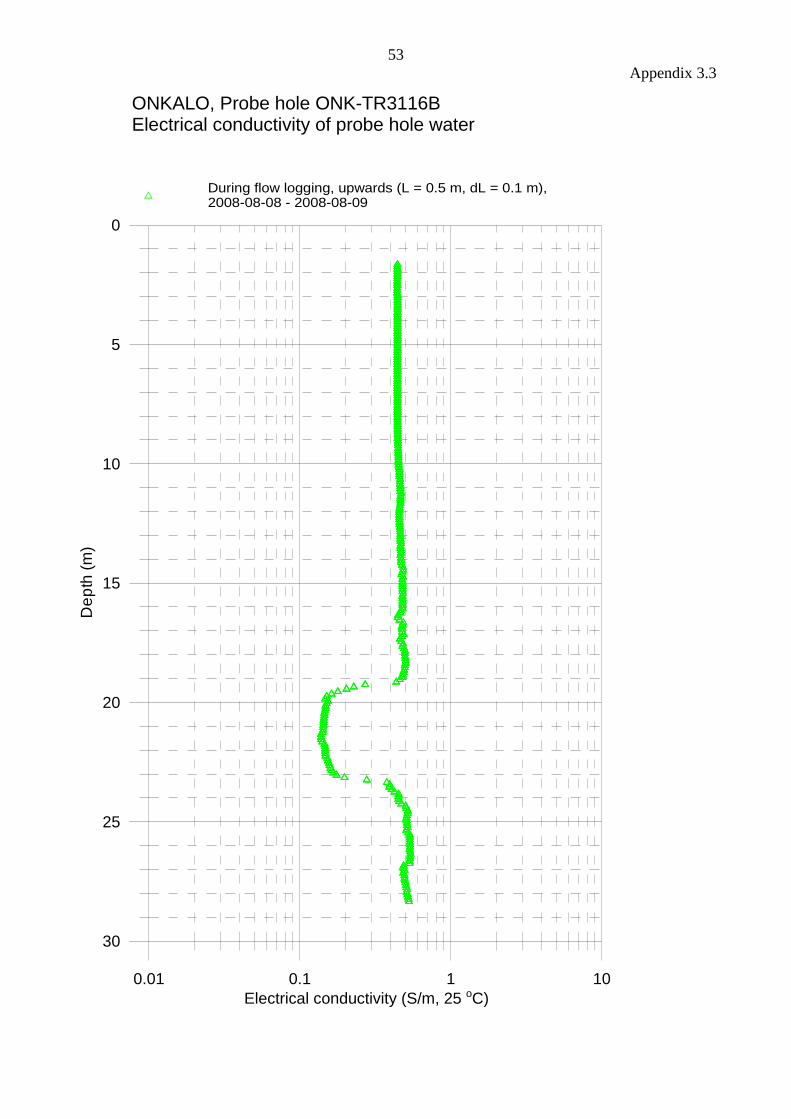
53
Appendix 3.3
0.01 0.1 1 10
Electrical conductivity (S/m, 25 oC)
30
25
20
15
10
5
0
De
pth
(m
)
During flow logging, upwards (L = 0.5 m, dL = 0.1 m), 2008-08-08 - 2008-08-09
ONKALO, Probe hole ONK-TR3116BElectrical conductivity of probe hole water
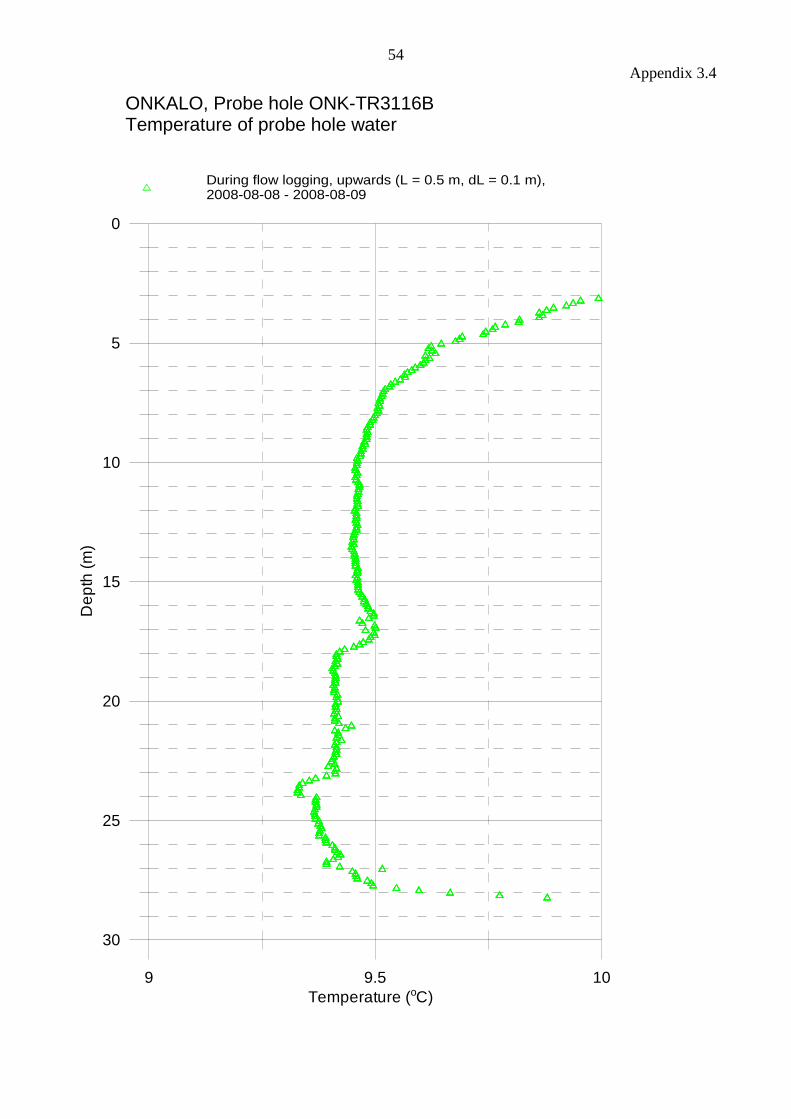
54
Appendix 3.4
9 9.5 10
Temperature (oC)
30
25
20
15
10
5
0
De
pth
(m
)
During flow logging, upwards (L = 0.5 m, dL = 0.1 m), 2008-08-08 - 2008-08-09
ONKALO, Probe hole ONK-TR3116BTemperature of probe hole water
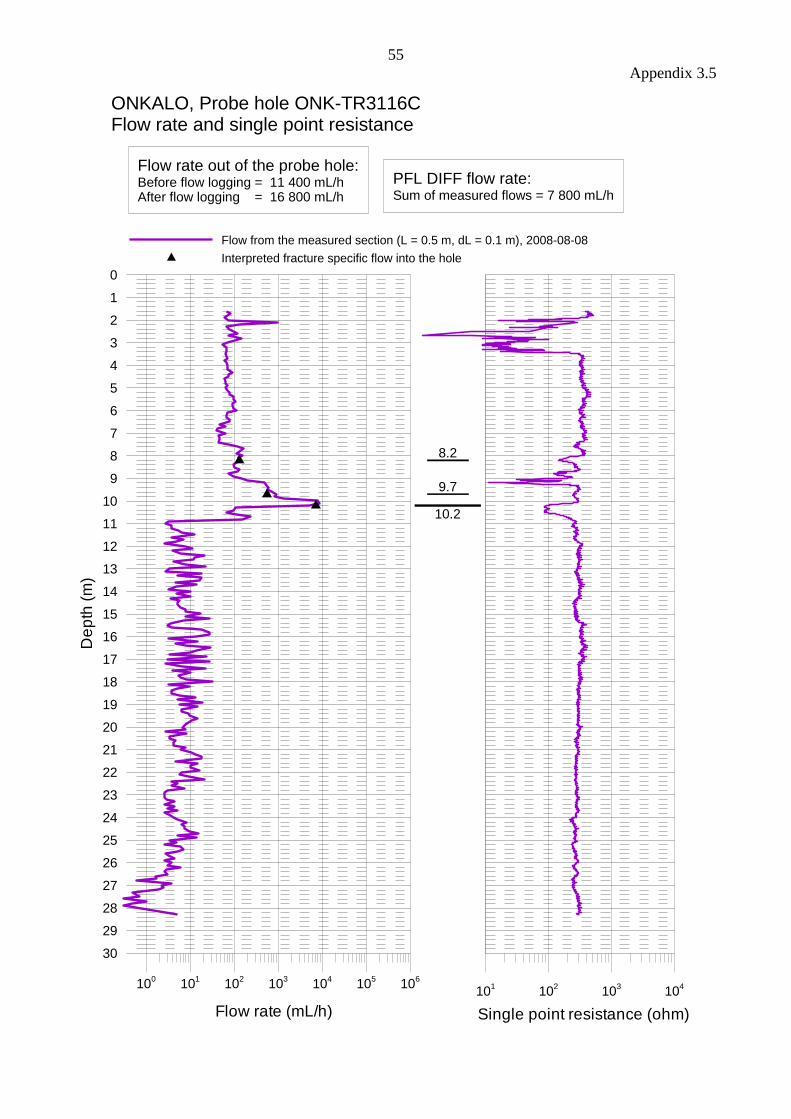
55
Appendix 3.5
100
101
102
103
104
105
106
Flow rate (mL/h)
30
29
28
27
26
25
24
23
22
21
20
19
18
17
16
15
14
13
12
11
10
9
8
7
6
5
4
3
2
1
0
De
pth
(m
)
101
102
103
104
Single point resistance (ohm)
Flow from the measured section (L = 0.5 m, dL = 0.1 m), 2008-08-08
Interpreted fracture specific flow into the hole
10.2
8.2
9.7
ONKALO, Probe hole ONK-TR3116CFlow rate and single point resistance
Flow rate out of the probe hole:Before flow logging = 11 400 mL/hAfter flow logging = 16 800 mL/h
PFL DIFF flow rate:Sum of measured flows = 7 800 mL/h
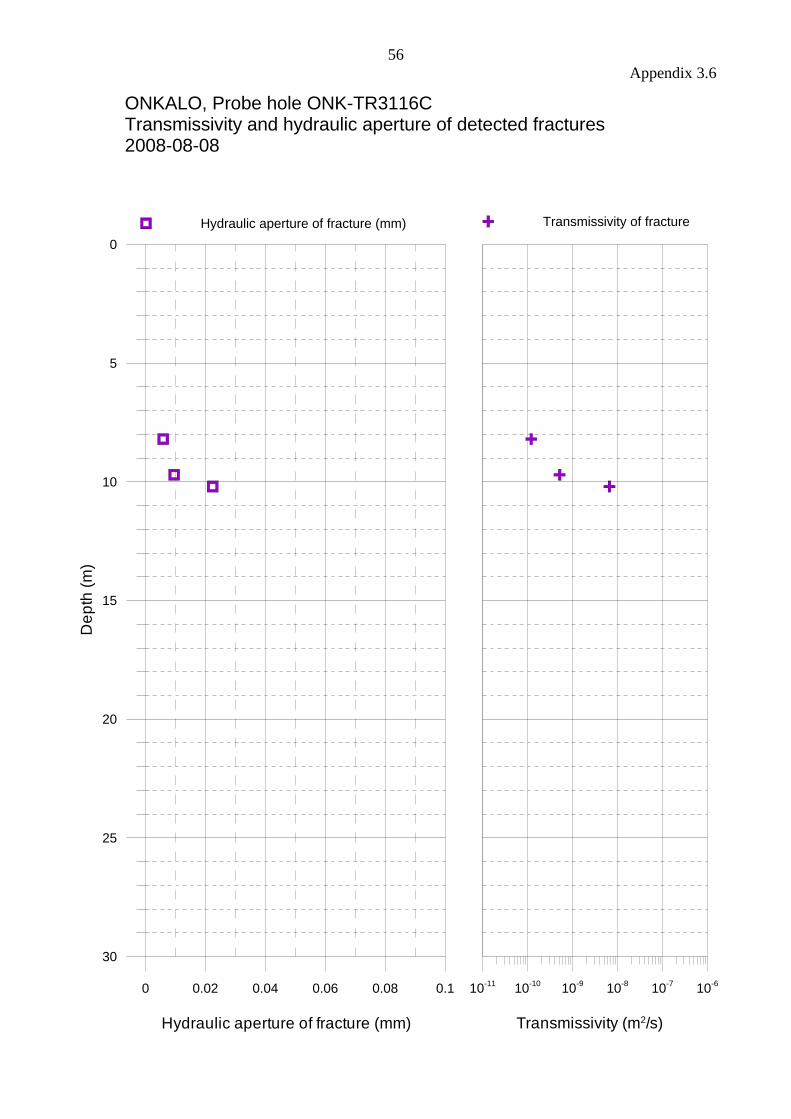
56
Appendix 3.6
0 0.02 0.04 0.06 0.08 0.1
Hydraulic aperture of fracture (mm)
30
25
20
15
10
5
0
De
pth
(m
)
10-11
10-10
10-9
10-8
10-7
10-6
Transmissivity (m2/s)
Hydraulic aperture of fracture (mm)
ONKALO, Probe hole ONK-TR3116CTransmissivity and hydraulic aperture of detected fractures2008-08-08
Transmissivity of fracture
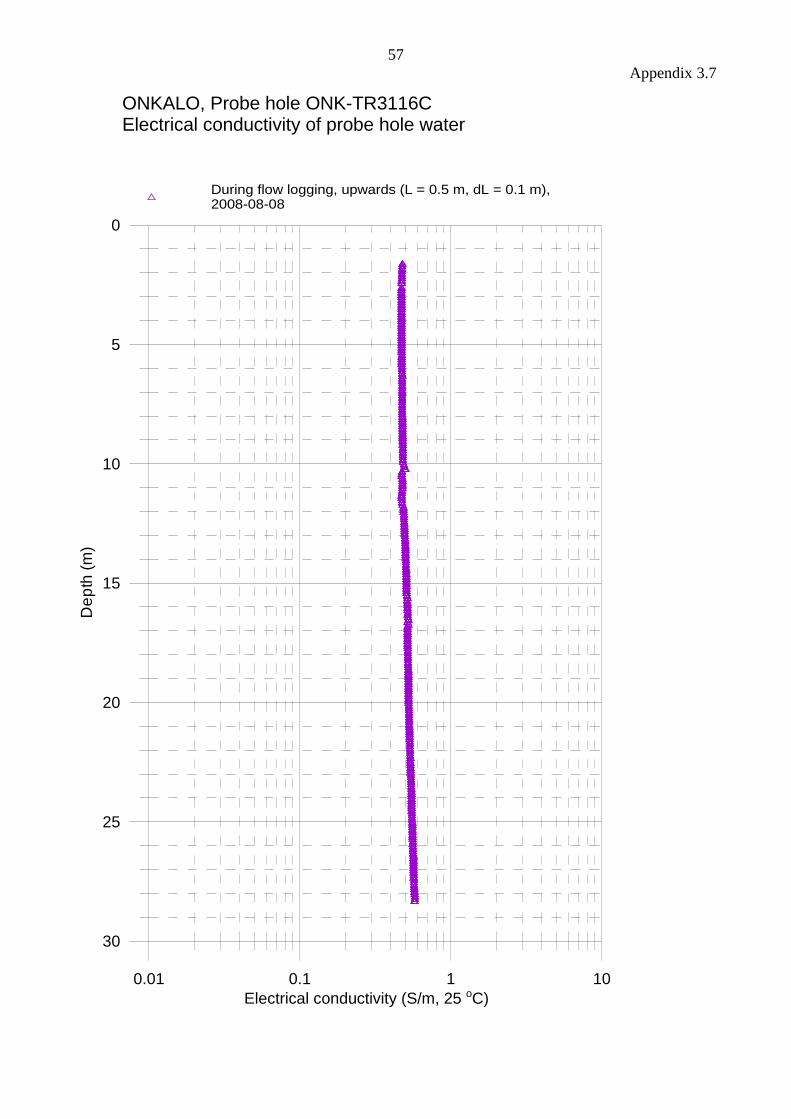
57
Appendix 3.7
0.01 0.1 1 10
Electrical conductivity (S/m, 25 oC)
30
25
20
15
10
5
0
De
pth
(m
)
During flow logging, upwards (L = 0.5 m, dL = 0.1 m), 2008-08-08
ONKALO, Probe hole ONK-TR3116CElectrical conductivity of probe hole water
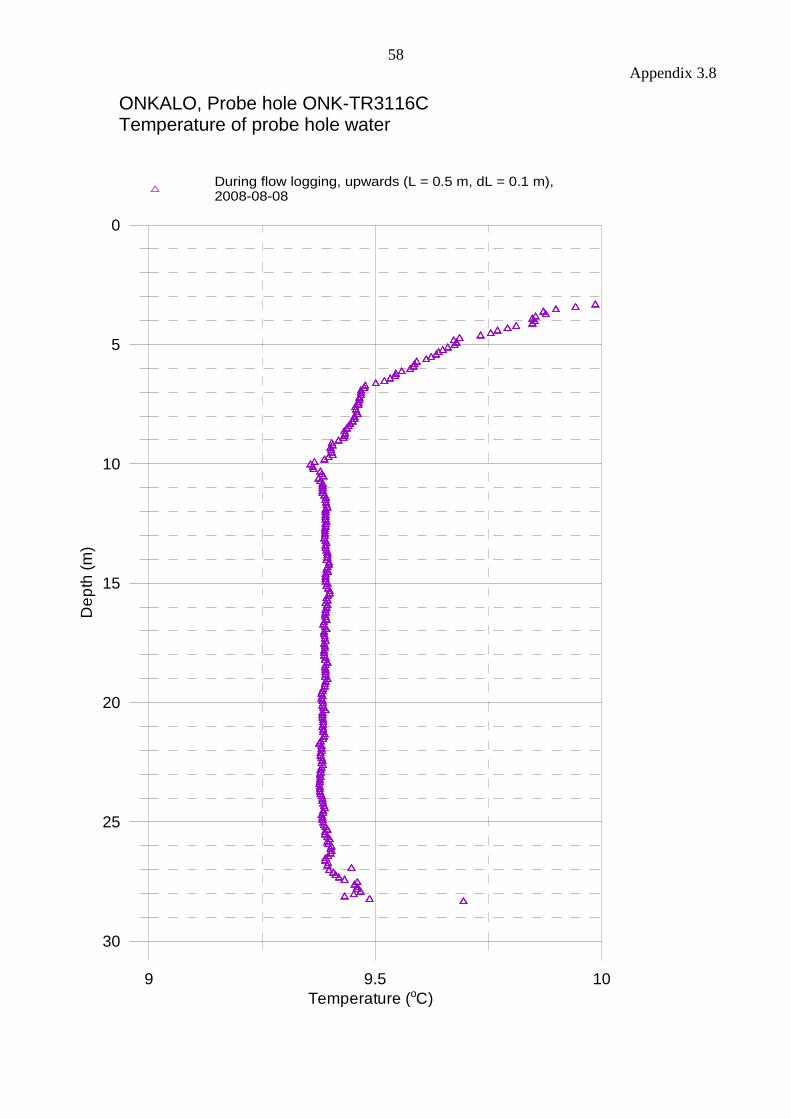
58
Appendix 3.8
9 9.5 10
Temperature (oC)
30
25
20
15
10
5
0
De
pth
(m
)
During flow logging, upwards (L = 0.5 m, dL = 0.1 m), 2008-08-08
ONKALO, Probe hole ONK-TR3116CTemperature of probe hole water
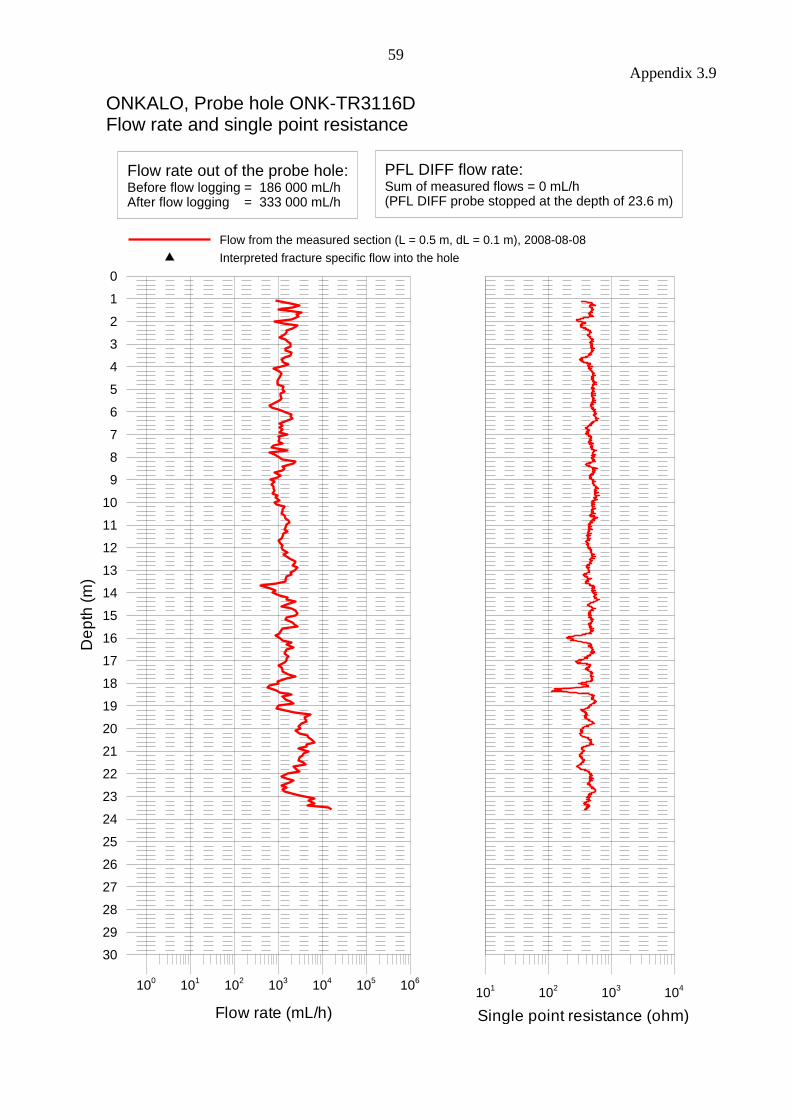
59
Appendix 3.9
100
101
102
103
104
105
106
Flow rate (mL/h)
30
29
28
27
26
25
24
23
22
21
20
19
18
17
16
15
14
13
12
11
10
9
8
7
6
5
4
3
2
1
0
De
pth
(m
)
101
102
103
104
Single point resistance (ohm)
Flow from the measured section (L = 0.5 m, dL = 0.1 m), 2008-08-08
Interpreted fracture specific flow into the hole
ONKALO, Probe hole ONK-TR3116DFlow rate and single point resistance
Flow rate out of the probe hole:Before flow logging = 186 000 mL/hAfter flow logging = 333 000 mL/h
PFL DIFF flow rate:Sum of measured flows = 0 mL/h(PFL DIFF probe stopped at the depth of 23.6 m)
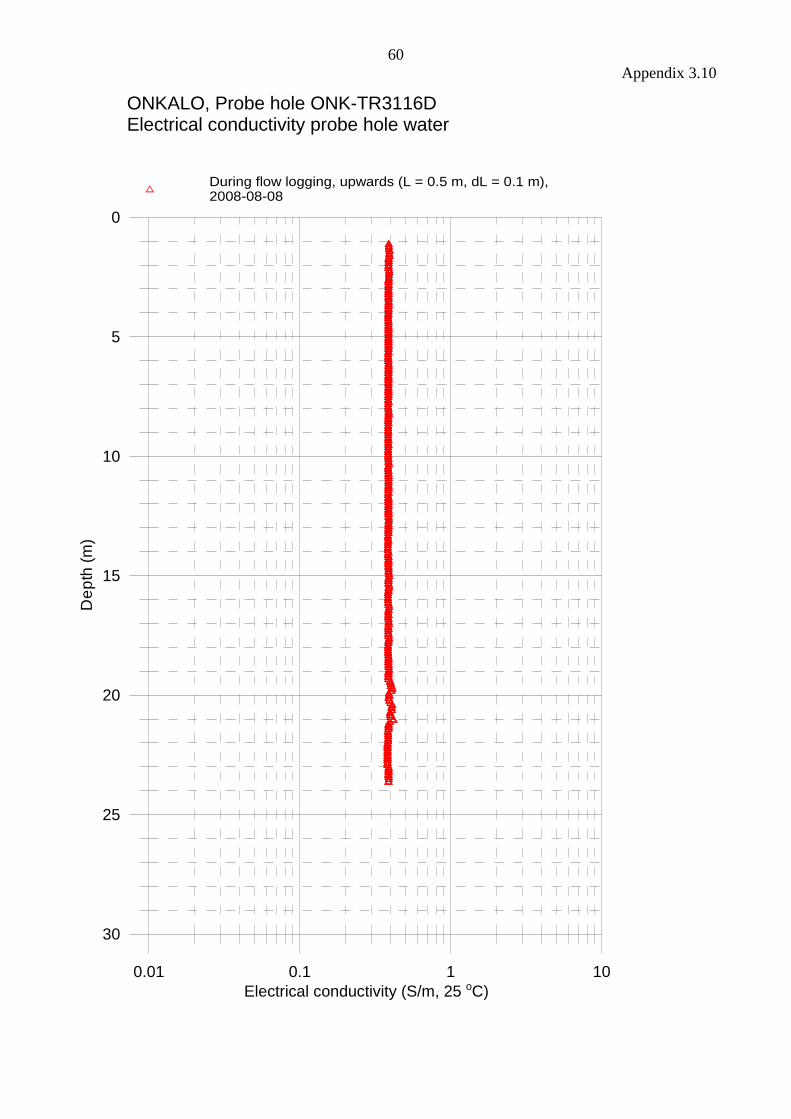
60
Appendix 3.10
0.01 0.1 1 10
Electrical conductivity (S/m, 25 oC)
30
25
20
15
10
5
0
De
pth
(m
)
During flow logging, upwards (L = 0.5 m, dL = 0.1 m), 2008-08-08
ONKALO, Probe hole ONK-TR3116DElectrical conductivity probe hole water
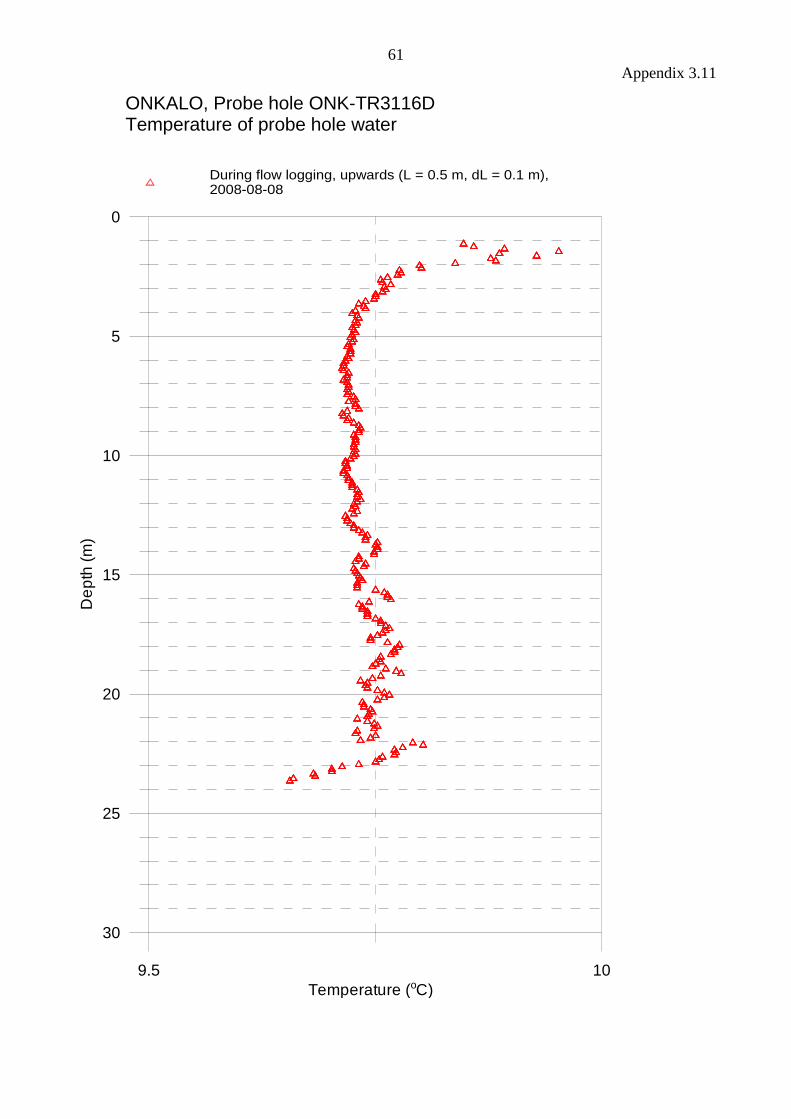
61
Appendix 3.11
9.5 10
Temperature (oC)
30
25
20
15
10
5
0
De
pth
(m
)
During flow logging, upwards (L = 0.5 m, dL = 0.1 m), 2008-08-08
ONKALO, Probe hole ONK-TR3116DTemperature of probe hole water

62
Appendix 3.12
Tabulated results of detected fractures in probe holes ONK-TR3116B and ONK-TR3116C
Probe hole ONK-TR3116B
Elevation of the top of the
hole (masl.): -293.0
Inclination: -5.7o
Depth of fracture along the
probe hole (m)
Flow
(mL/h)
Fracture
elevation
(masl.)
Drawdown
(m) T (m
2/s)
Hydraulic
aperture of
fracture (mm)
Comments
10.4 359 -294.0 299.0 3.30E-10 0.008 *
10.9 164 -294.1 299.0 1.51E-10 0.006 *
16.7 6530 -294.7 299.0 6.00E-09 0.022
17.5 68 -294.7 299.0 6.25E-11 0.005 *
18.0 65 -294.8 299.0 5.97E-11 0.005 *
19.5 12 -294.9 299.0 1.10E-11 0.003 *
21.0 53 -295.1 299.0 4.87E-11 0.004
24.5 13 -295.4 299.0 1.19E-11 0.003 *
25.6 25 -295.5 299.0 2.30E-11 0.003 *
26.1 606 -295.6 299.0 5.57E-10 0.010
26.7 17 -295.7 299.0 1.56E-11 0.003 *
Probe hole ONK-TR3116C
Elevation of the top of the
hole (masl.): -293.0
Inclination: -5.7o
Depth of fracture along the
probe hole (m)
Flow
(mL/h)
Fracture
elevation
(masl.)
Drawdown
(m) T (m
2/s)
Hydraulic
aperture of
fracture (mm)
Comments
8.2 131 -293.8 299.0 1.20E-10 0.006 *
9.7 558 -294.0 299.0 5.13E-10 0.010 *
10.2 7190 -294.0 299.0 6.61E-09 0.022
* Uncertain fracture. The flow rate is less than 30 mL/h or the flow anomalies are overlapping or they are unclear
because of noise.
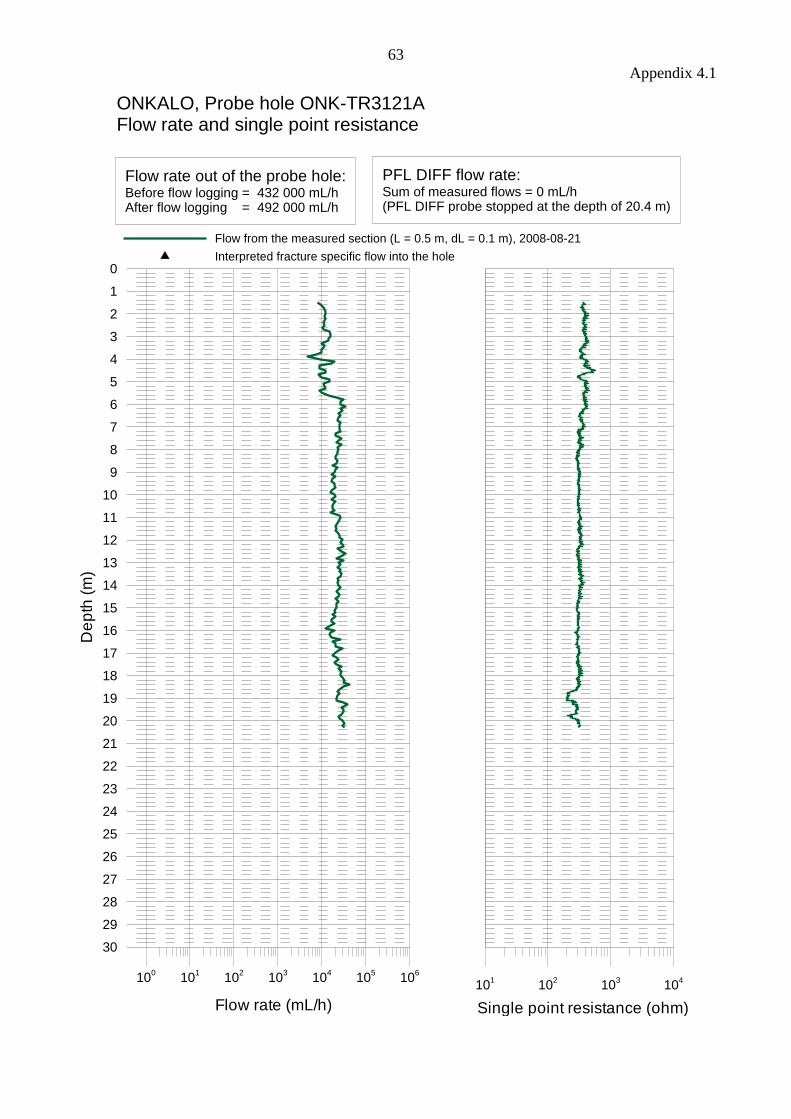
63
Appendix 4.1
100
101
102
103
104
105
106
Flow rate (mL/h)
30
29
28
27
26
25
24
23
22
21
20
19
18
17
16
15
14
13
12
11
10
9
8
7
6
5
4
3
2
1
0
De
pth
(m
)
101
102
103
104
Single point resistance (ohm)
Flow from the measured section (L = 0.5 m, dL = 0.1 m), 2008-08-21
Interpreted fracture specific flow into the hole
ONKALO, Probe hole ONK-TR3121AFlow rate and single point resistance
Flow rate out of the probe hole:Before flow logging = 432 000 mL/hAfter flow logging = 492 000 mL/h
PFL DIFF flow rate:Sum of measured flows = 0 mL/h(PFL DIFF probe stopped at the depth of 20.4 m)
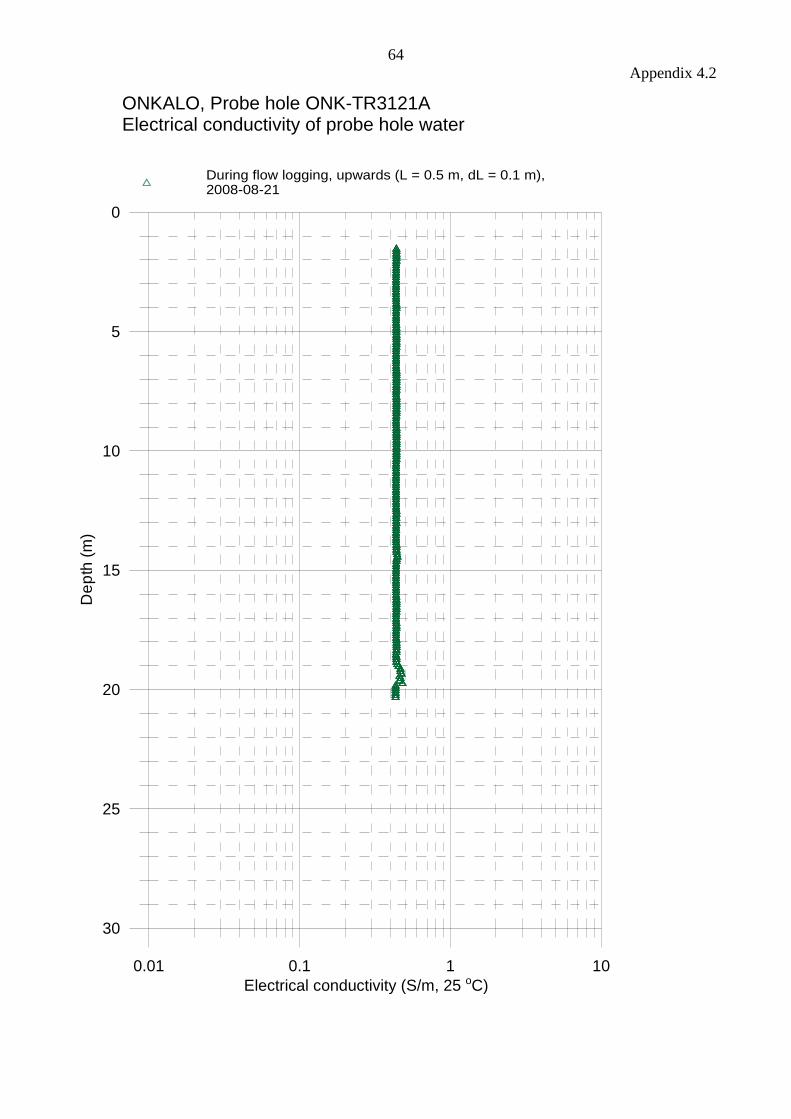
64
Appendix 4.2
0.01 0.1 1 10
Electrical conductivity (S/m, 25 oC)
30
25
20
15
10
5
0
De
pth
(m
)
During flow logging, upwards (L = 0.5 m, dL = 0.1 m),2008-08-21
ONKALO, Probe hole ONK-TR3121AElectrical conductivity of probe hole water
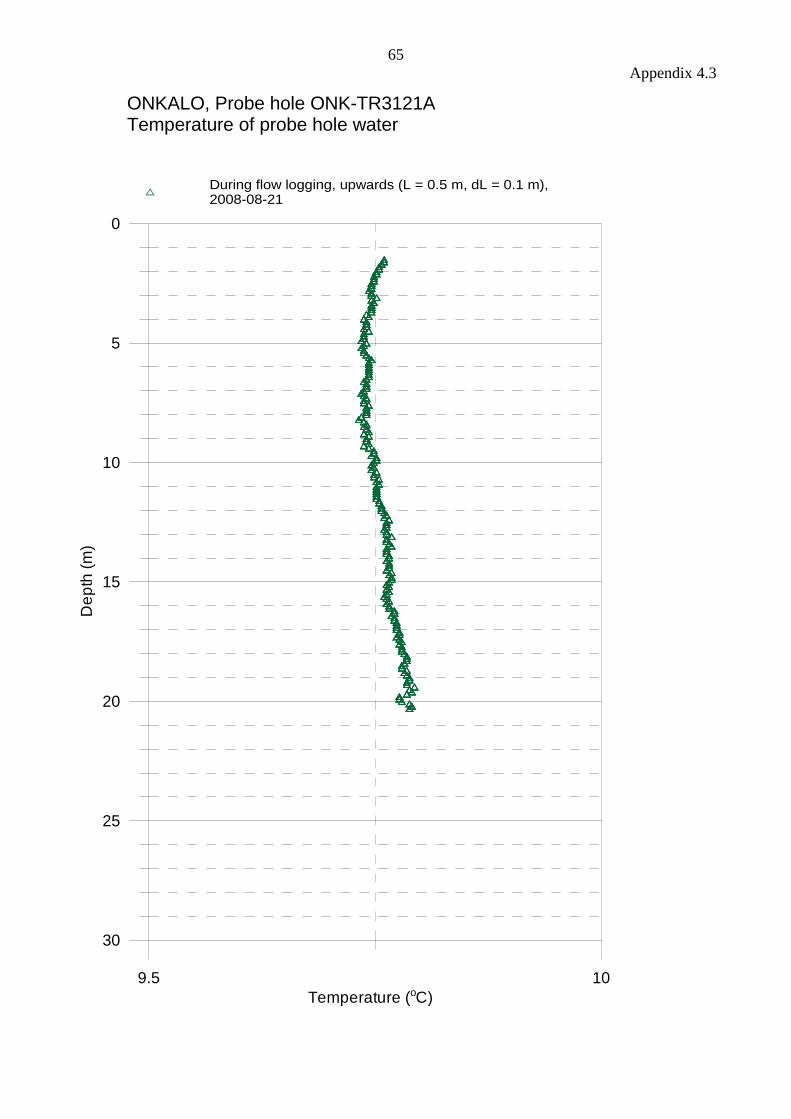
65
Appendix 4.3
9.5 10
Temperature (oC)
30
25
20
15
10
5
0
De
pth
(m
)
During flow logging, upwards (L = 0.5 m, dL = 0.1 m), 2008-08-21
ONKALO, Probe hole ONK-TR3121ATemperature of probe hole water
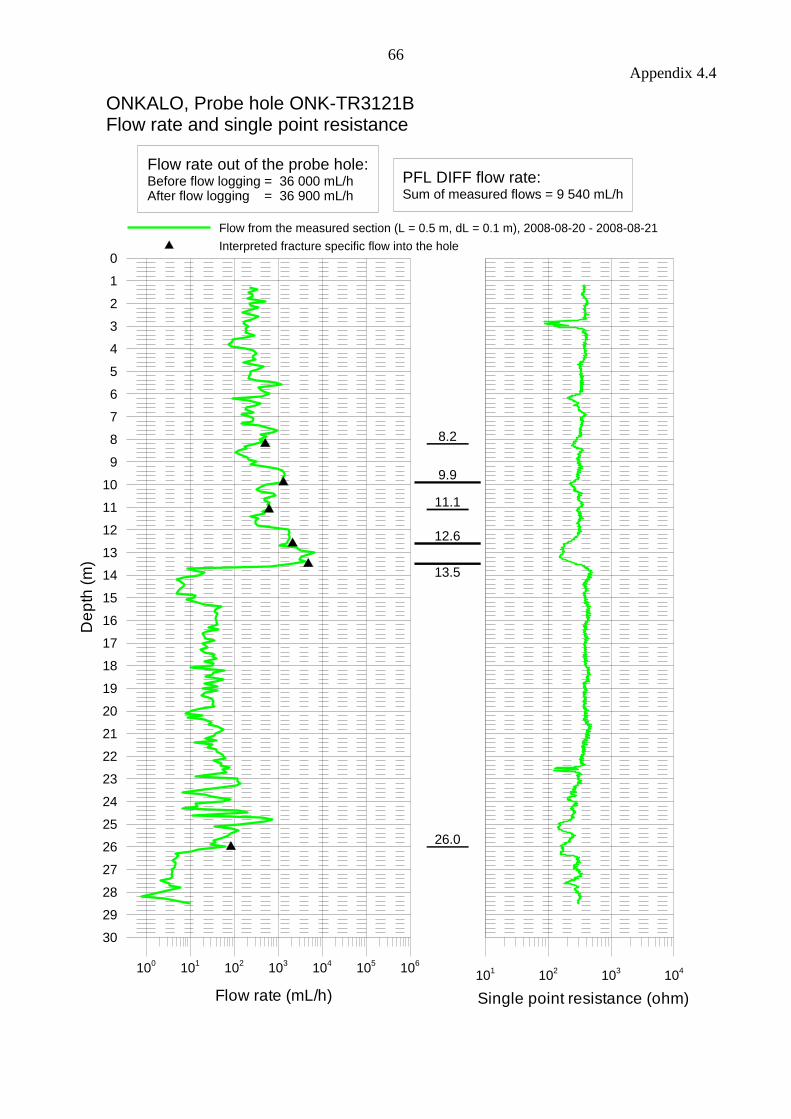
66
Appendix 4.4
100
101
102
103
104
105
106
Flow rate (mL/h)
30
29
28
27
26
25
24
23
22
21
20
19
18
17
16
15
14
13
12
11
10
9
8
7
6
5
4
3
2
1
0
De
pth
(m
)
101
102
103
104
Single point resistance (ohm)
Flow from the measured section (L = 0.5 m, dL = 0.1 m), 2008-08-20 - 2008-08-21
Interpreted fracture specific flow into the hole
9.9
12.6
13.5
8.2
11.1
26.0
ONKALO, Probe hole ONK-TR3121BFlow rate and single point resistance
Flow rate out of the probe hole:Before flow logging = 36 000 mL/hAfter flow logging = 36 900 mL/h
PFL DIFF flow rate:Sum of measured flows = 9 540 mL/h

67
Appendix 4.5
0 0.02 0.04 0.06 0.08 0.1
Hydraulic aperture of fracture (mm)
30
25
20
15
10
5
0
De
pth
(m
)
10-11
10-10
10-9
10-8
10-7
10-6
Transmissivity (m2/s)
Hydraulic aperture of fracture (mm)
ONKALO, Probe hole ONK-TR3121BTransmissivity and hydraulic aperture of detected fractures2008-08-20 - 2008-08-21
Transmissivity of fracture
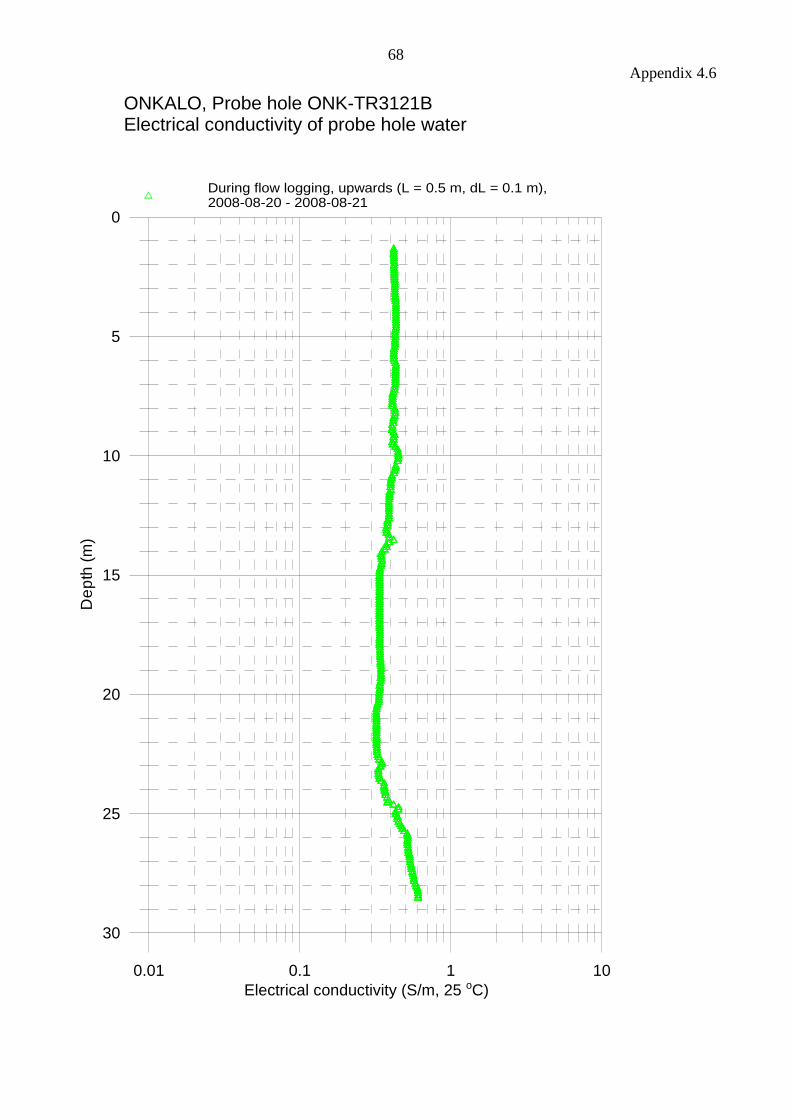
68
Appendix 4.6
0.01 0.1 1 10
Electrical conductivity (S/m, 25 oC)
30
25
20
15
10
5
0
De
pth
(m
)
During flow logging, upwards (L = 0.5 m, dL = 0.1 m),2008-08-20 - 2008-08-21
ONKALO, Probe hole ONK-TR3121BElectrical conductivity of probe hole water
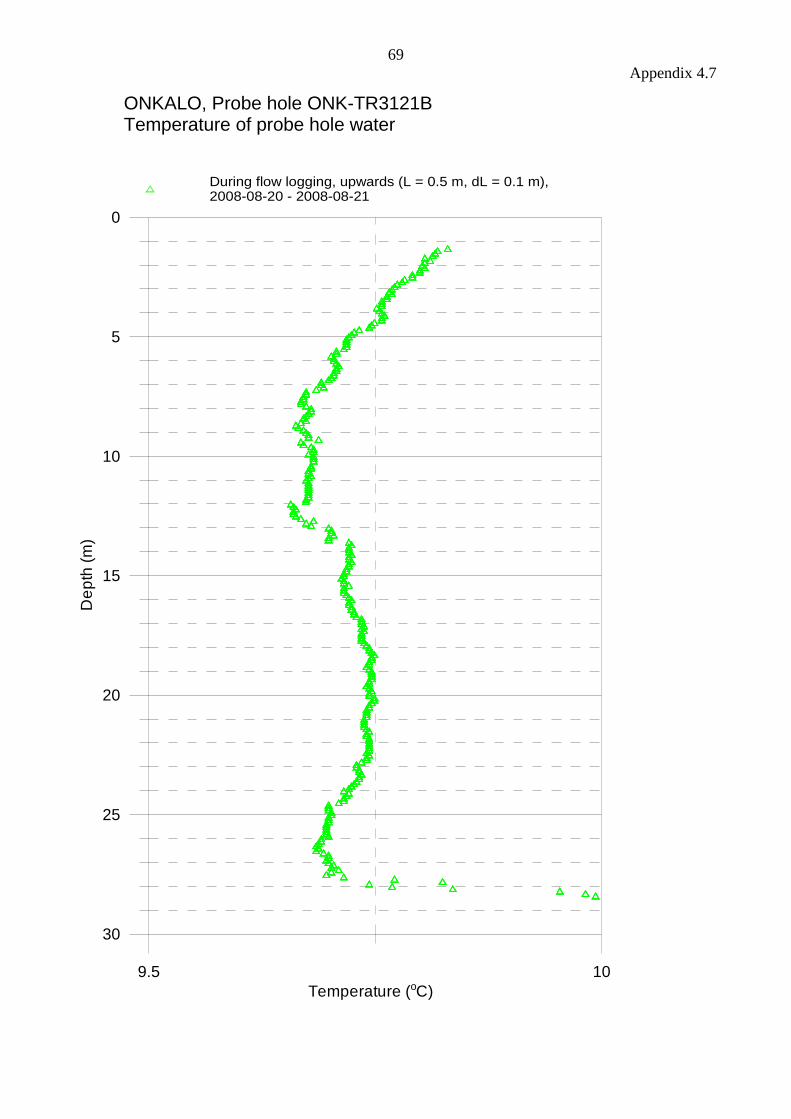
69
Appendix 4.7
9.5 10
Temperature (oC)
30
25
20
15
10
5
0
De
pth
(m
)
During flow logging, upwards (L = 0.5 m, dL = 0.1 m), 2008-08-20 - 2008-08-21
ONKALO, Probe hole ONK-TR3121BTemperature of probe hole water
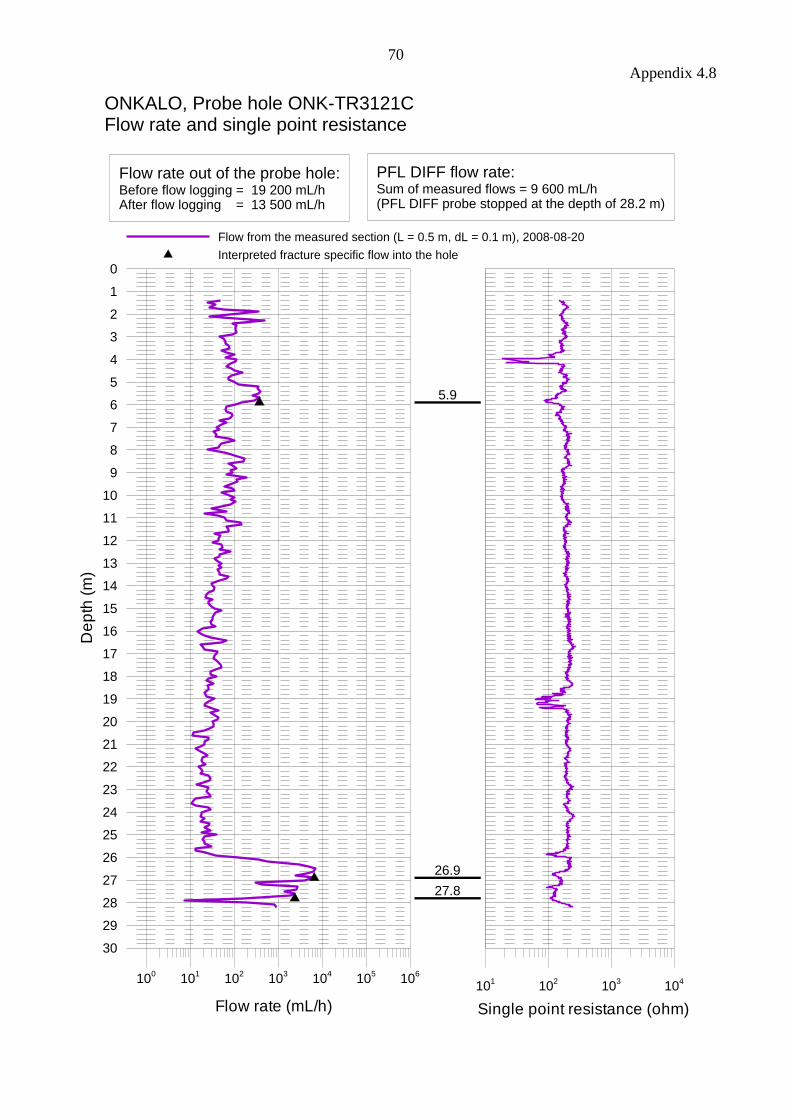
70
Appendix 4.8
100
101
102
103
104
105
106
Flow rate (mL/h)
30
29
28
27
26
25
24
23
22
21
20
19
18
17
16
15
14
13
12
11
10
9
8
7
6
5
4
3
2
1
0
De
pth
(m
)
101
102
103
104
Single point resistance (ohm)
Flow from the measured section (L = 0.5 m, dL = 0.1 m), 2008-08-20
Interpreted fracture specific flow into the hole
5.9
26.9
27.8
ONKALO, Probe hole ONK-TR3121CFlow rate and single point resistance
Flow rate out of the probe hole:Before flow logging = 19 200 mL/hAfter flow logging = 13 500 mL/h
PFL DIFF flow rate:Sum of measured flows = 9 600 mL/h(PFL DIFF probe stopped at the depth of 28.2 m)
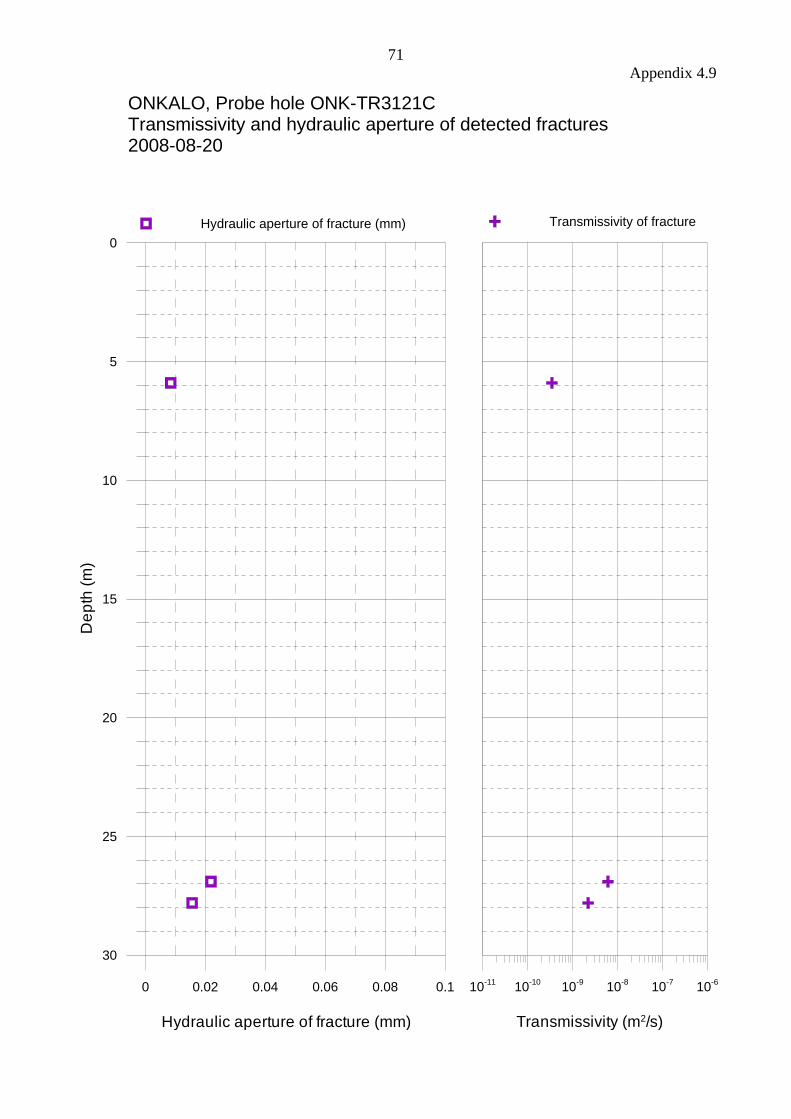
71
Appendix 4.9
0 0.02 0.04 0.06 0.08 0.1
Hydraulic aperture of fracture (mm)
30
25
20
15
10
5
0
De
pth
(m
)
10-11
10-10
10-9
10-8
10-7
10-6
Transmissivity (m2/s)
Hydraulic aperture of fracture (mm)
ONKALO, Probe hole ONK-TR3121CTransmissivity and hydraulic aperture of detected fractures2008-08-20
Transmissivity of fracture

72
Appendix 4.10
0.01 0.1 1 10
Electrical conductivity (S/m, 25 oC)
30
25
20
15
10
5
0
De
pth
(m
)
During flow logging, upwards (L = 0.5 m, dL = 0.1 m), 2008-08-20
ONKALO, Probe hole ONK-TR3121CElectrical conductivity of probe hole water
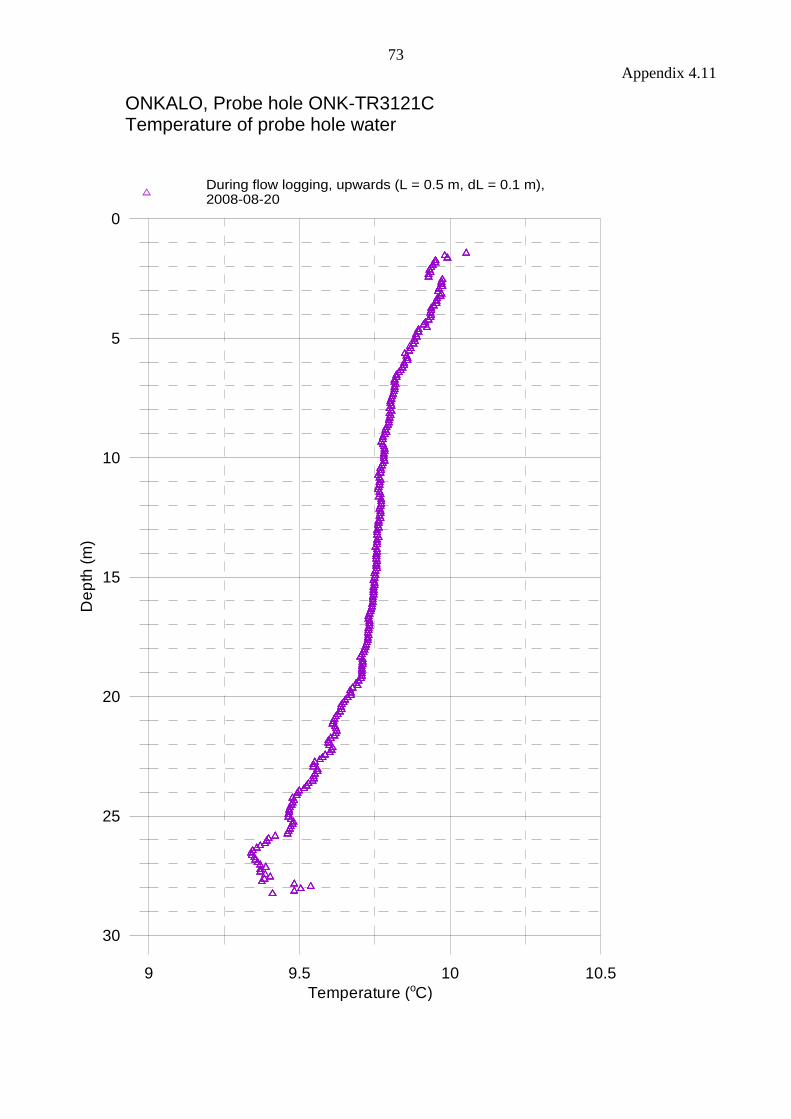
73
Appendix 4.11
9 9.5 10 10.5
Temperature (oC)
30
25
20
15
10
5
0
De
pth
(m
)
During flow logging, upwards (L = 0.5 m, dL = 0.1 m), 2008-08-20
ONKALO, Probe hole ONK-TR3121CTemperature of probe hole water
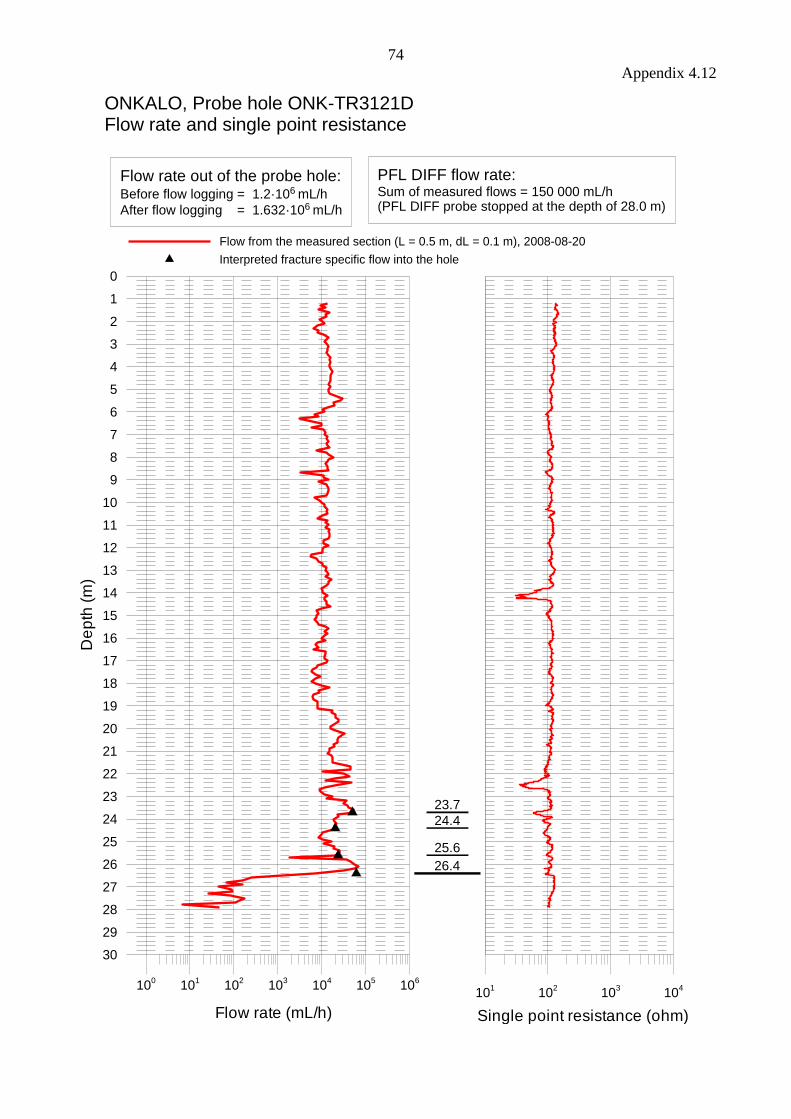
74
Appendix 4.12
100
101
102
103
104
105
106
Flow rate (mL/h)
30
29
28
27
26
25
24
23
22
21
20
19
18
17
16
15
14
13
12
11
10
9
8
7
6
5
4
3
2
1
0
De
pth
(m
)
101
102
103
104
Single point resistance (ohm)
Flow from the measured section (L = 0.5 m, dL = 0.1 m), 2008-08-20
Interpreted fracture specific flow into the hole
26.4
23.7
24.4
25.6
ONKALO, Probe hole ONK-TR3121DFlow rate and single point resistance
Flow rate out of the probe hole:Before flow logging = 1.2·106 mL/h
After flow logging = 1.632·106 mL/h
PFL DIFF flow rate:Sum of measured flows = 150 000 mL/h(PFL DIFF probe stopped at the depth of 28.0 m)
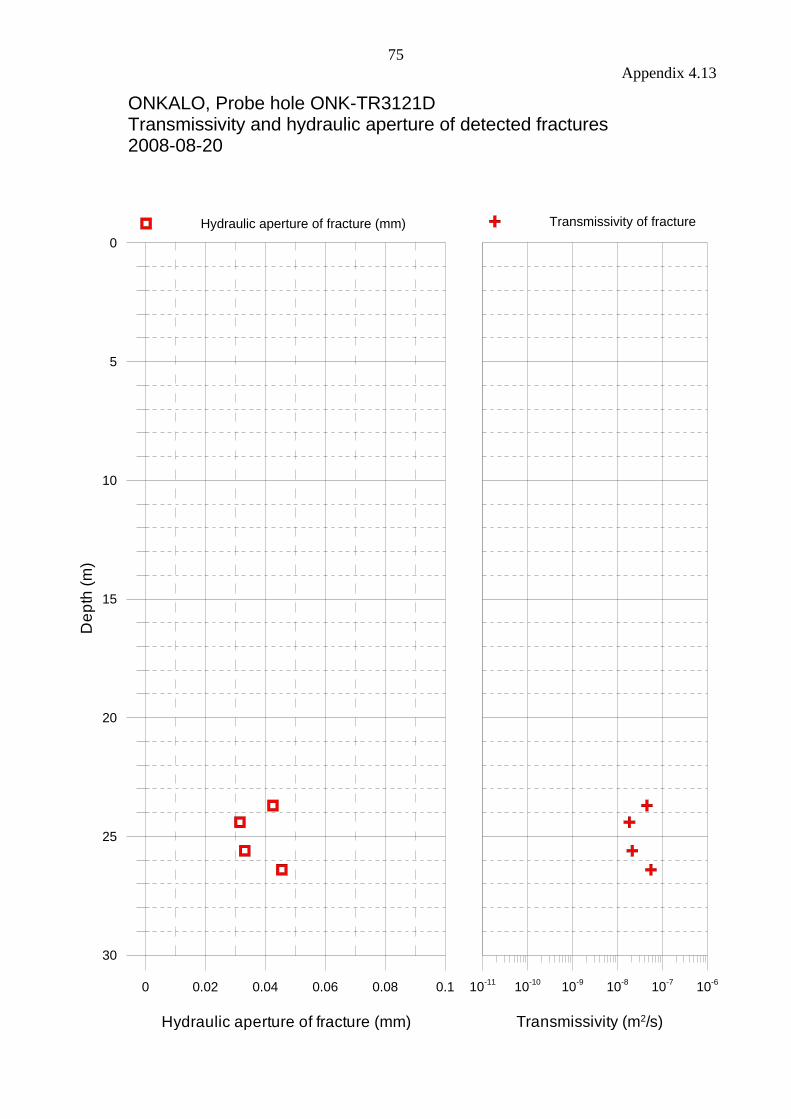
75
Appendix 4.13
0 0.02 0.04 0.06 0.08 0.1
Hydraulic aperture of fracture (mm)
30
25
20
15
10
5
0
De
pth
(m
)
10-11
10-10
10-9
10-8
10-7
10-6
Transmissivity (m2/s)
Hydraulic aperture of fracture (mm)
ONKALO, Probe hole ONK-TR3121DTransmissivity and hydraulic aperture of detected fractures2008-08-20
Transmissivity of fracture
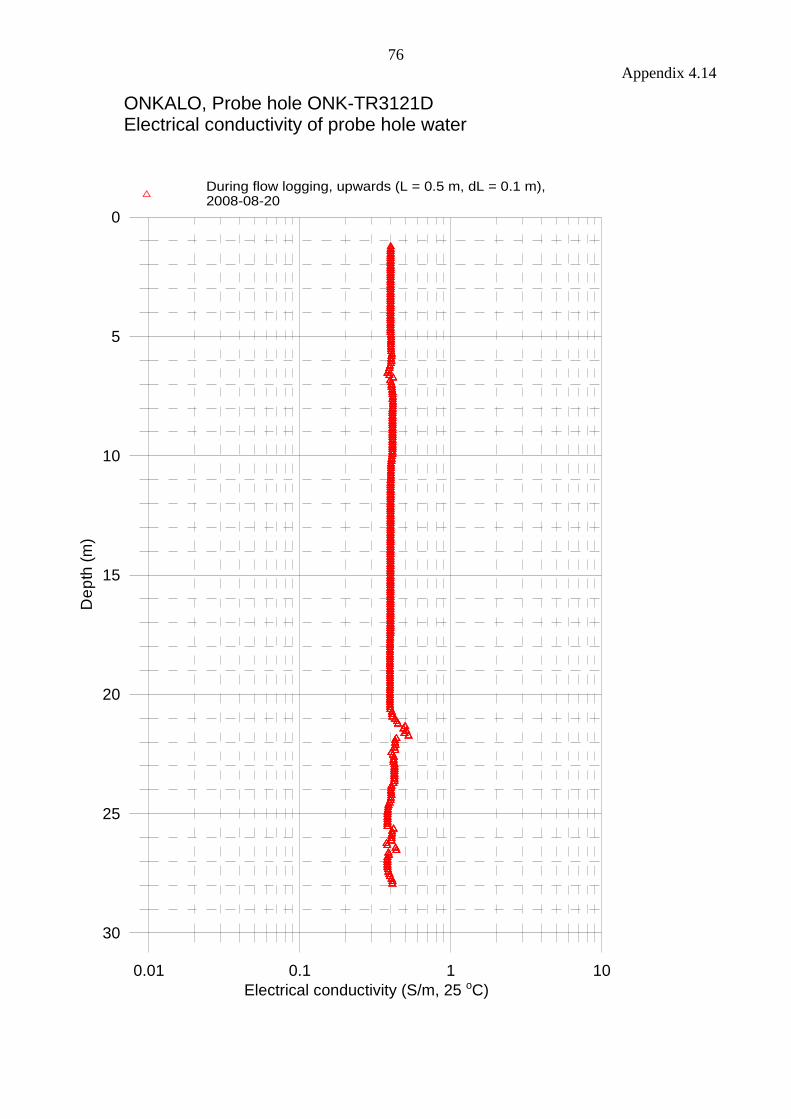
76
Appendix 4.14
0.01 0.1 1 10
Electrical conductivity (S/m, 25 oC)
30
25
20
15
10
5
0
De
pth
(m
)
During flow logging, upwards (L = 0.5 m, dL = 0.1 m), 2008-08-20
ONKALO, Probe hole ONK-TR3121DElectrical conductivity of probe hole water
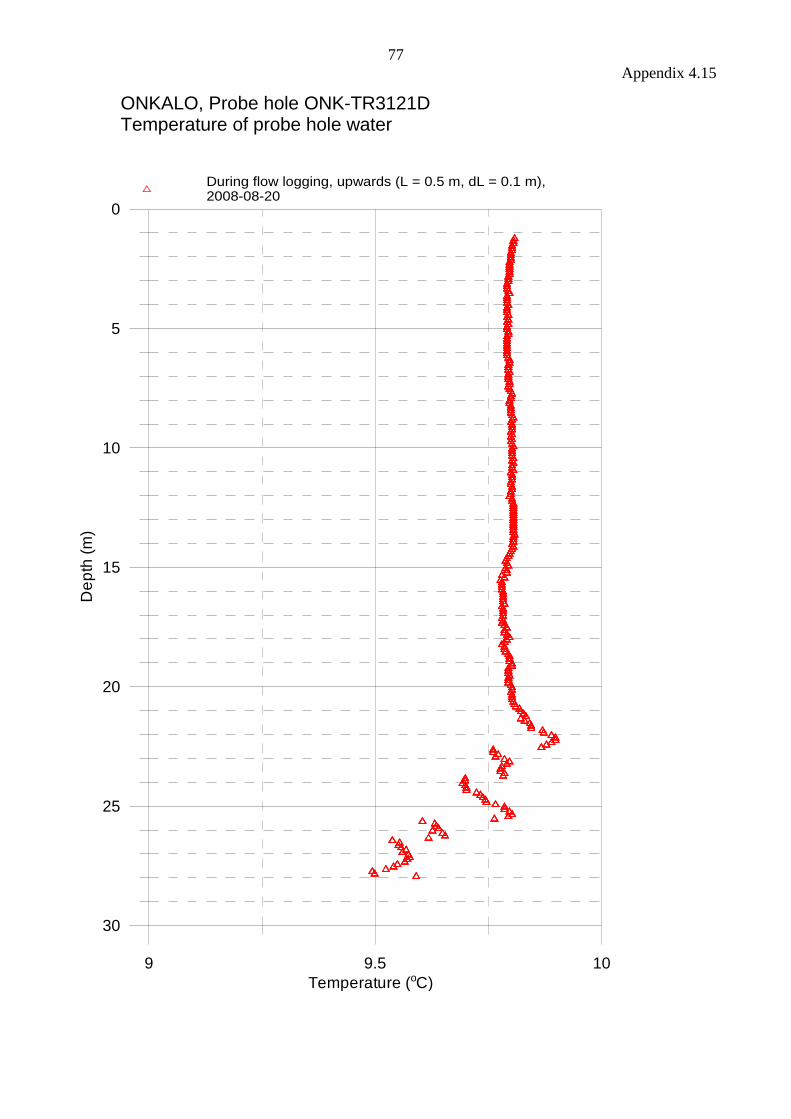
77
Appendix 4.15
9 9.5 10
Temperature (oC)
30
25
20
15
10
5
0
De
pth
(m
)
During flow logging, upwards (L = 0.5 m, dL = 0.1 m), 2008-08-20
ONKALO, Probe hole ONK-TR3121DTemperature of probe hole water

78
Appendix 4.16
Tabulated results of detected fractures in probe holes ONK-TR3121B, ONK-TR3121C and ONK-TR3121D
Probe hole ONK-TR3121B
Elevation of the top of the
hole (masl.): -292.0
Inclination: -5.7o
Depth of fracture along the
probe hole (m)
Flow
(mL/h)
Fracture
elevation
(masl.)
Drawdown
(m) T (m
2/s)
Hydraulic
aperture of
fracture (mm)
Comments
8.2 510 -292.8 298.0 4.70E-10 0.009 *
9.9 1320 -293.0 298.0 1.22E-09 0.013
11.1 624 -293.1 298.0 5.75E-10 0.010 *
12.6 2150 -293.3 298.0 1.98E-09 0.015
13.5 4850 -293.3 298.0 4.47E-09 0.020
26.0 85 -294.6 298.0 7.84E-11 0.005 *
Probe hole ONK-TR3121C
Elevation of the top of the
hole (masl.): -292.0
Inclination: -5.7o
Depth of fracture along the
probe hole (m)
Flow
(mL/h)
Fracture
elevation
(masl.)
Drawdown
(m) T (m
2/s)
Hydraulic
aperture of
fracture (mm)
Comments
5.9 376 -292.6 298.0 3.47E-10 0.008
26.9 6630 -294.7 298.0 6.11E-09 0.022
27.8 2400 -294.8 298.0 2.21E-09 0.016
Probe hole ONK-TR3121D
Elevation of the top of the
hole (masl.): -295.0
Inclination: -19.2o
Depth of fracture along the
probe hole (m)
Flow
(mL/h)
Fracture
elevation
(masl.)
Drawdown
(m) T (m
2/s)
Hydraulic
aperture of
fracture (mm)
Comments
23.7 49400 -302.8 301.0 4.51E-08 0.042 *
24.4 20100 -303.0 301.0 1.83E-08 0.031 *
25.6 23400 -303.4 301.0 2.14E-08 0.033 *
26.4 60500 -303.7 301.0 5.52E-08 0.045
* Uncertain fracture. The flow rate is less than 30 mL/h or the flow anomalies are overlapping or they are unclear
because of noise.

79
Appendix 5.1
100
101
102
103
104
105
106
107
Flow rate (mL/h)
30
29
28
27
26
25
24
23
22
21
20
19
18
17
16
15
14
13
12
11
10
9
8
7
6
5
4
3
2
1
0
De
pth
(m
)
101
102
103
104
Single point resistance (ohm)
Flow along the probe hole (without lower rubber disks, dL = 0.2 m), 2008-09-04
Interpreted fracture specific flow into the hole
13.0
14.2
ONKALO, Probe hole ONK-TR3140AFlow rate and single point resistance
Flow rate out of the probe hole:Before and after flow logging =
about 9·106 mL/h - 9.6·106 mL/h
PFL DIFF flow rate:Sum of measured flows = 8.82·106 mL/h
(PFL DIFF probe stopped at the depth of 23.8 m)
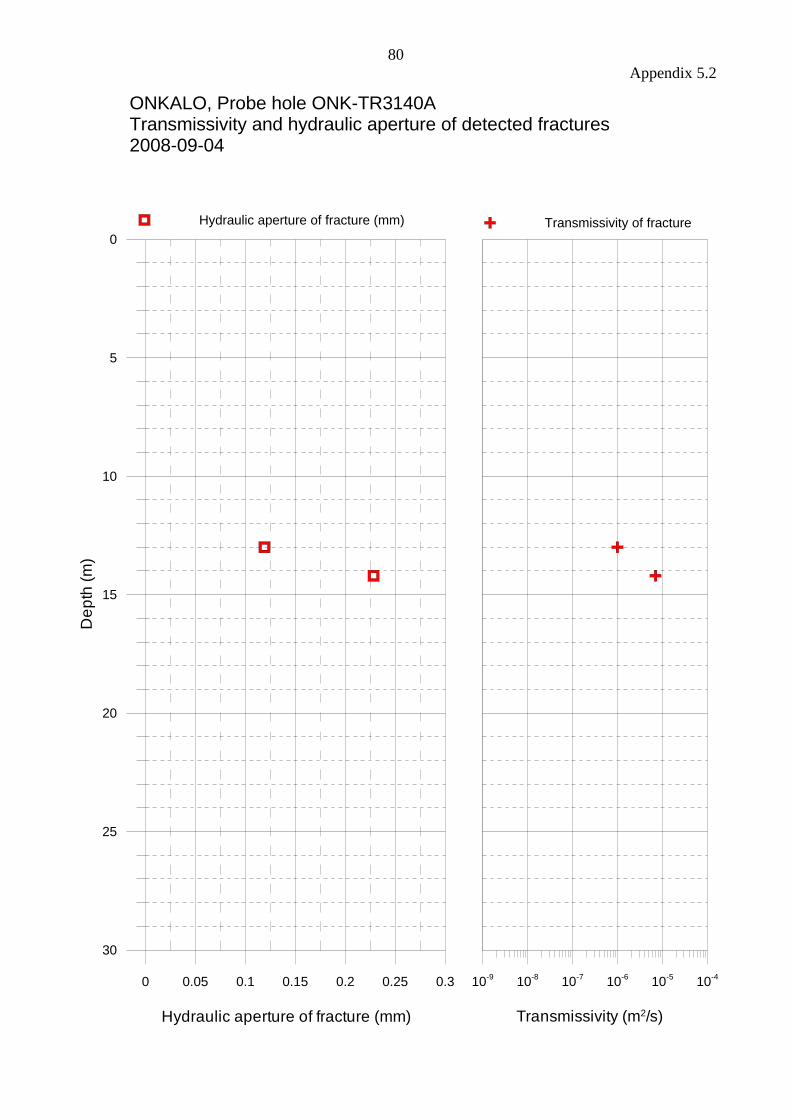
80
Appendix 5.2
0 0.05 0.1 0.15 0.2 0.25 0.3
Hydraulic aperture of fracture (mm)
30
25
20
15
10
5
0
De
pth
(m
)
10-9
10-8
10-7
10-6
10-5
10-4
Transmissivity (m2/s)
Hydraulic aperture of fracture (mm)
ONKALO, Probe hole ONK-TR3140ATransmissivity and hydraulic aperture of detected fractures2008-09-04
Transmissivity of fracture
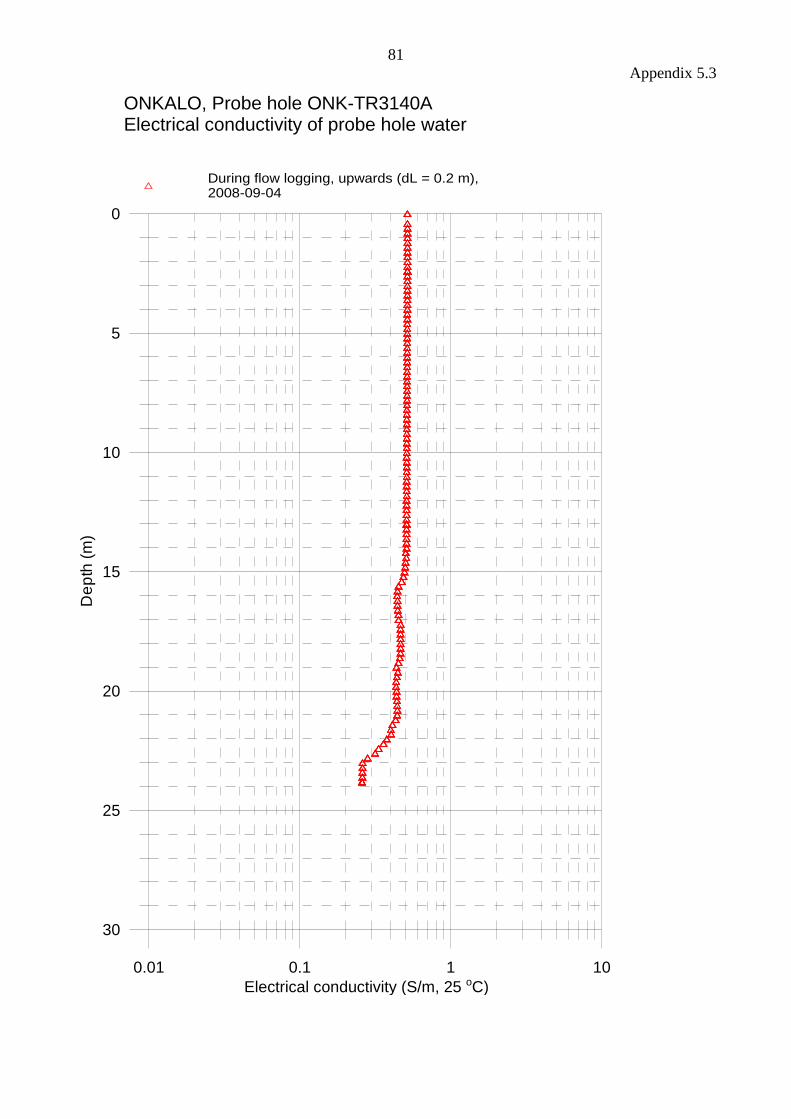
81
Appendix 5.3
0.01 0.1 1 10
Electrical conductivity (S/m, 25 oC)
30
25
20
15
10
5
0
De
pth
(m
)
During flow logging, upwards (dL = 0.2 m),2008-09-04
ONKALO, Probe hole ONK-TR3140AElectrical conductivity of probe hole water
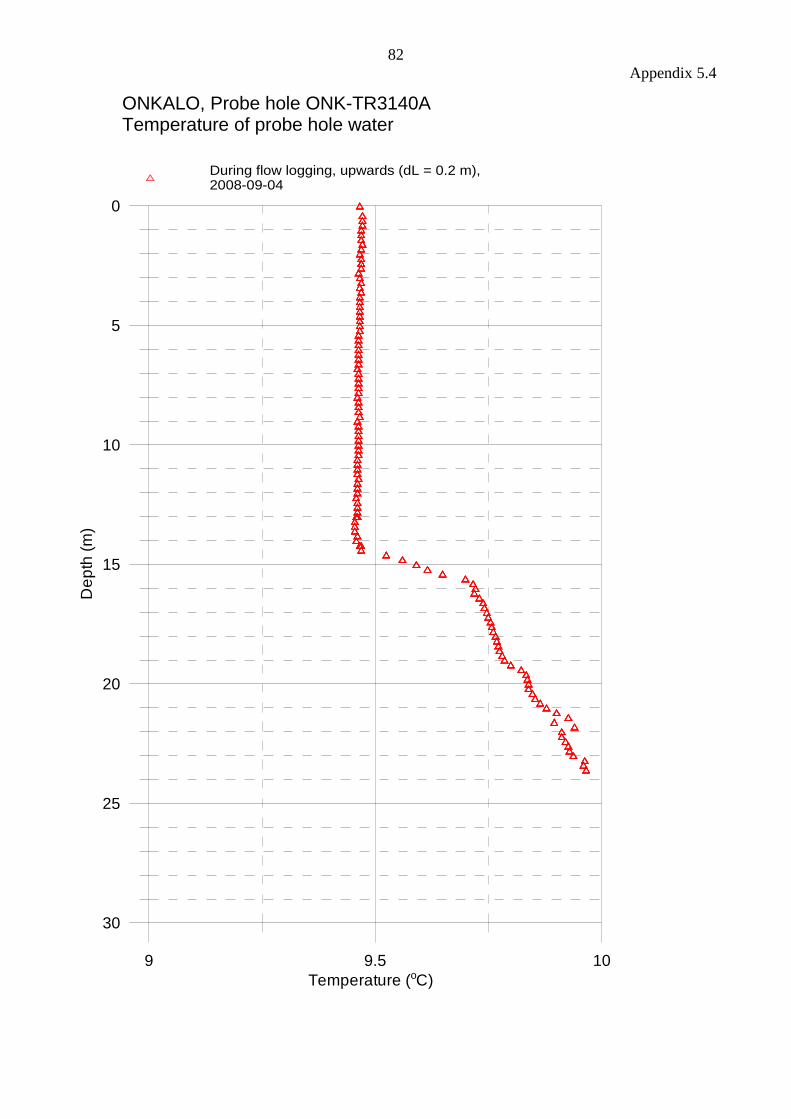
82
Appendix 5.4
9 9.5 10
Temperature (oC)
30
25
20
15
10
5
0
De
pth
(m
)
During flow logging, upwards (dL = 0.2 m), 2008-09-04
ONKALO, Probe hole ONK-TR3140ATemperature of probe hole water
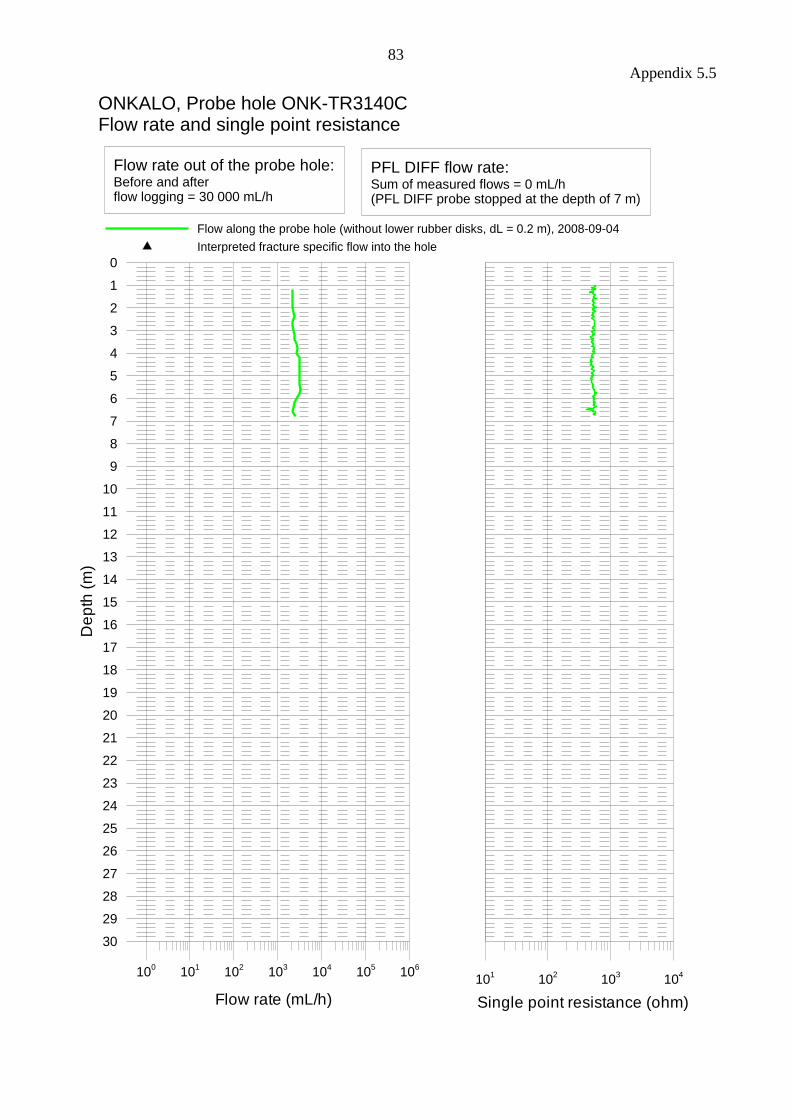
83
Appendix 5.5
100
101
102
103
104
105
106
Flow rate (mL/h)
30
29
28
27
26
25
24
23
22
21
20
19
18
17
16
15
14
13
12
11
10
9
8
7
6
5
4
3
2
1
0
De
pth
(m
)
101
102
103
104
Single point resistance (ohm)
Flow along the probe hole (without lower rubber disks, dL = 0.2 m), 2008-09-04
Interpreted fracture specific flow into the hole
ONKALO, Probe hole ONK-TR3140CFlow rate and single point resistance
Flow rate out of the probe hole:Before and afterflow logging = 30 000 mL/h
PFL DIFF flow rate:Sum of measured flows = 0 mL/h(PFL DIFF probe stopped at the depth of 7 m)
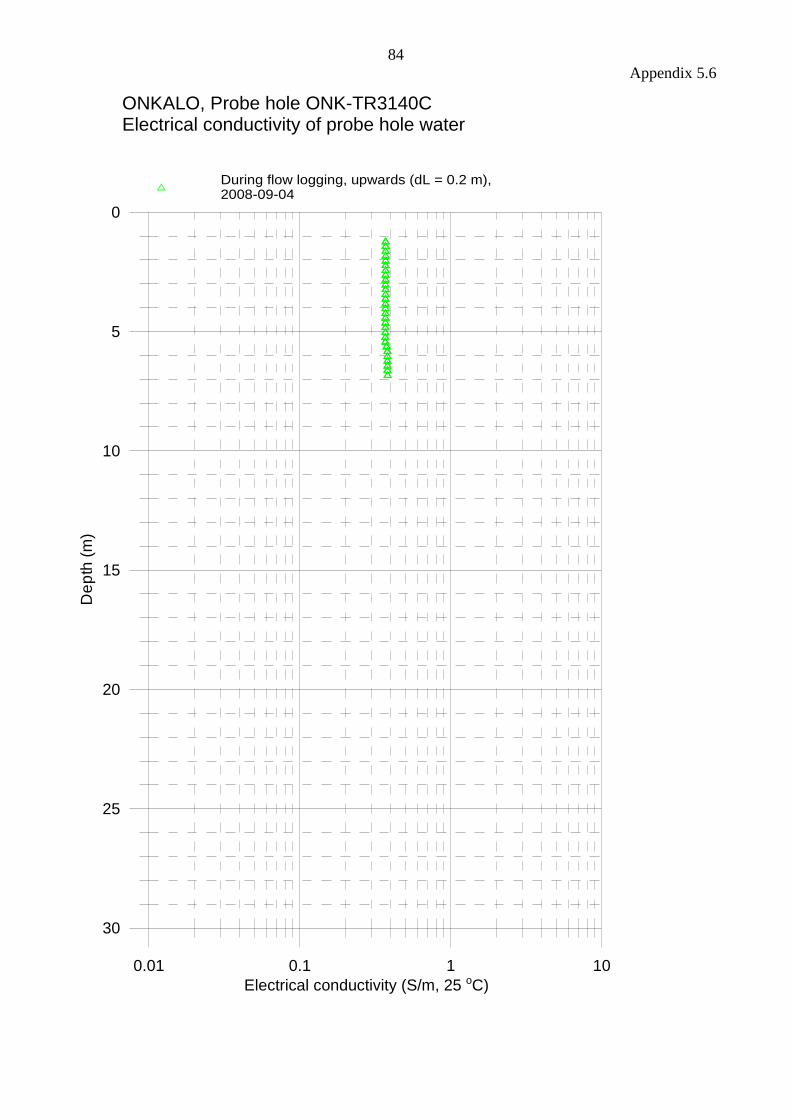
84
Appendix 5.6
0.01 0.1 1 10
Electrical conductivity (S/m, 25 oC)
30
25
20
15
10
5
0
De
pth
(m
)
During flow logging, upwards (dL = 0.2 m),2008-09-04
ONKALO, Probe hole ONK-TR3140CElectrical conductivity of probe hole water
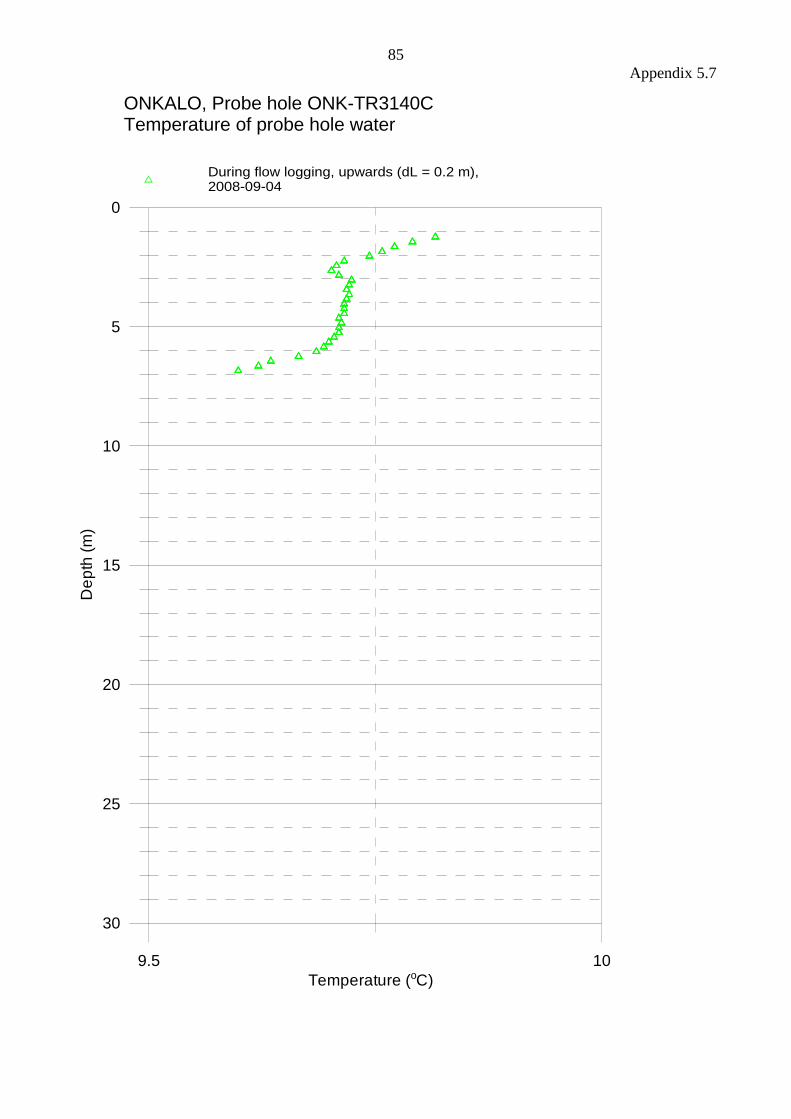
85
Appendix 5.7
9.5 10
Temperature (oC)
30
25
20
15
10
5
0
De
pth
(m
)
During flow logging, upwards (dL = 0.2 m), 2008-09-04
ONKALO, Probe hole ONK-TR3140CTemperature of probe hole water
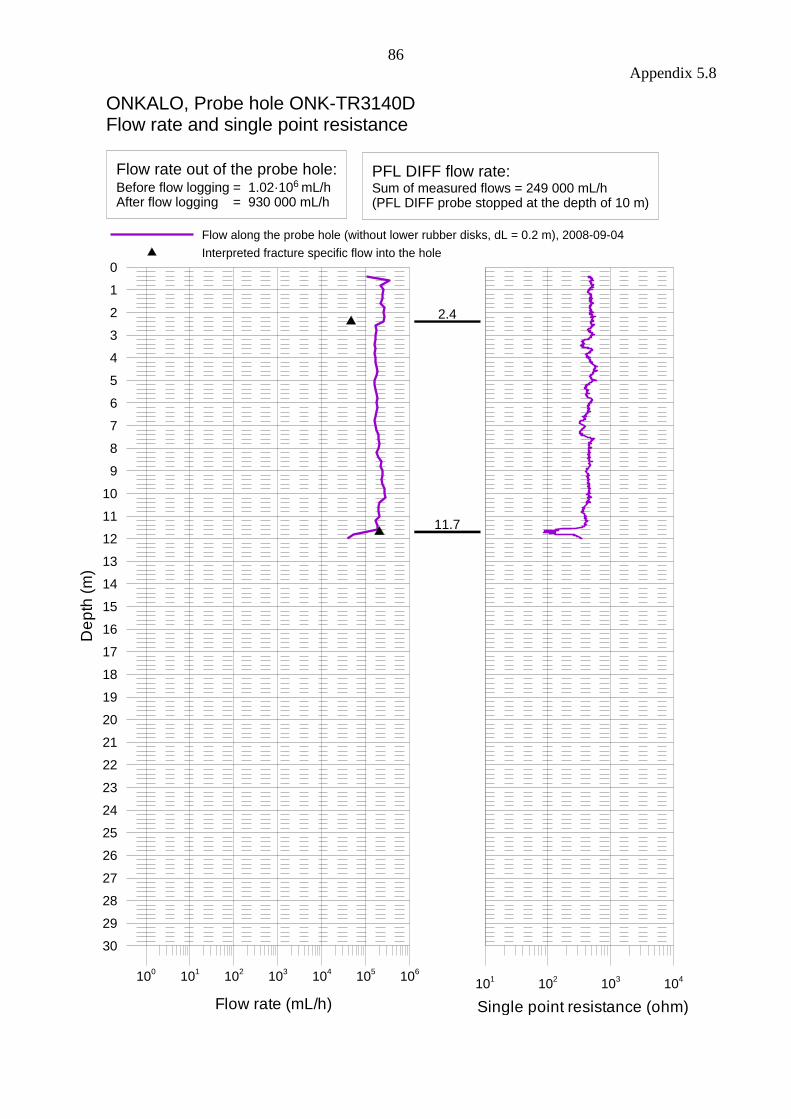
86
Appendix 5.8
100
101
102
103
104
105
106
Flow rate (mL/h)
30
29
28
27
26
25
24
23
22
21
20
19
18
17
16
15
14
13
12
11
10
9
8
7
6
5
4
3
2
1
0
De
pth
(m
)
101
102
103
104
Single point resistance (ohm)
Flow along the probe hole (without lower rubber disks, dL = 0.2 m), 2008-09-04
Interpreted fracture specific flow into the hole
2.4
11.7
ONKALO, Probe hole ONK-TR3140DFlow rate and single point resistance
Flow rate out of the probe hole:Before flow logging = 1.02·106 mL/hAfter flow logging = 930 000 mL/h
PFL DIFF flow rate:Sum of measured flows = 249 000 mL/h(PFL DIFF probe stopped at the depth of 10 m)
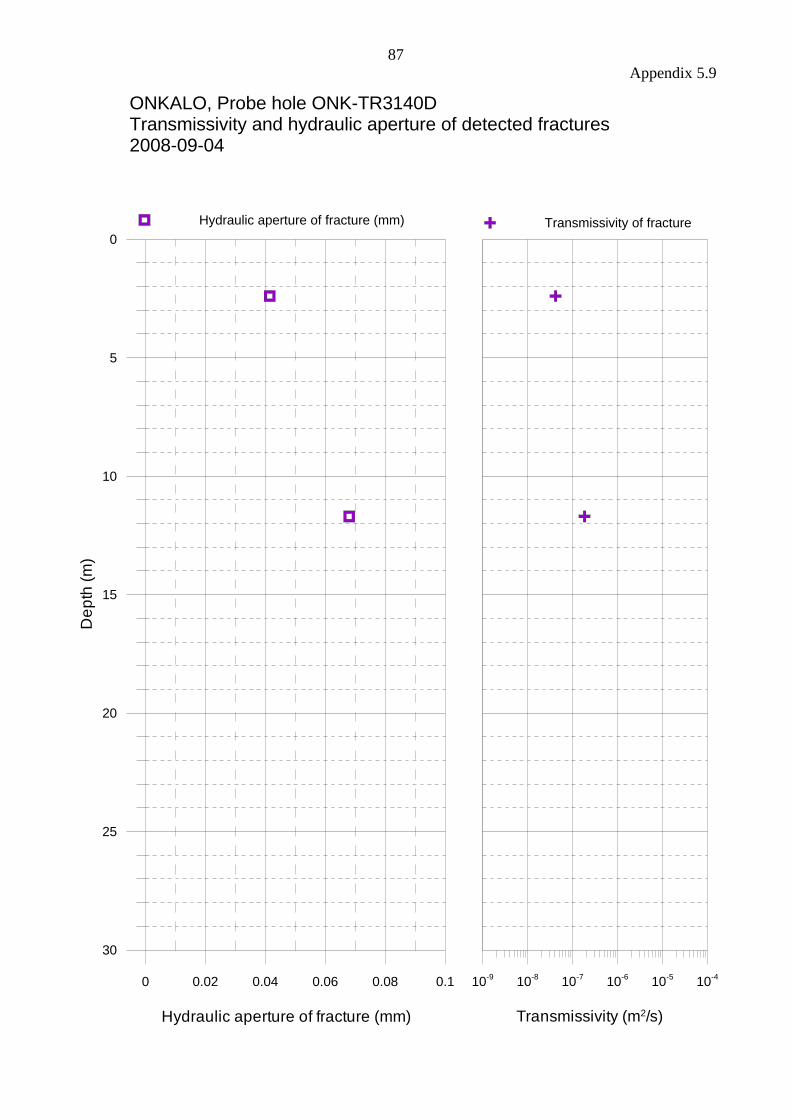
87
Appendix 5.9
0 0.02 0.04 0.06 0.08 0.1
Hydraulic aperture of fracture (mm)
30
25
20
15
10
5
0
De
pth
(m
)
10-9
10-8
10-7
10-6
10-5
10-4
Transmissivity (m2/s)
Hydraulic aperture of fracture (mm)
ONKALO, Probe hole ONK-TR3140DTransmissivity and hydraulic aperture of detected fractures2008-09-04
Transmissivity of fracture
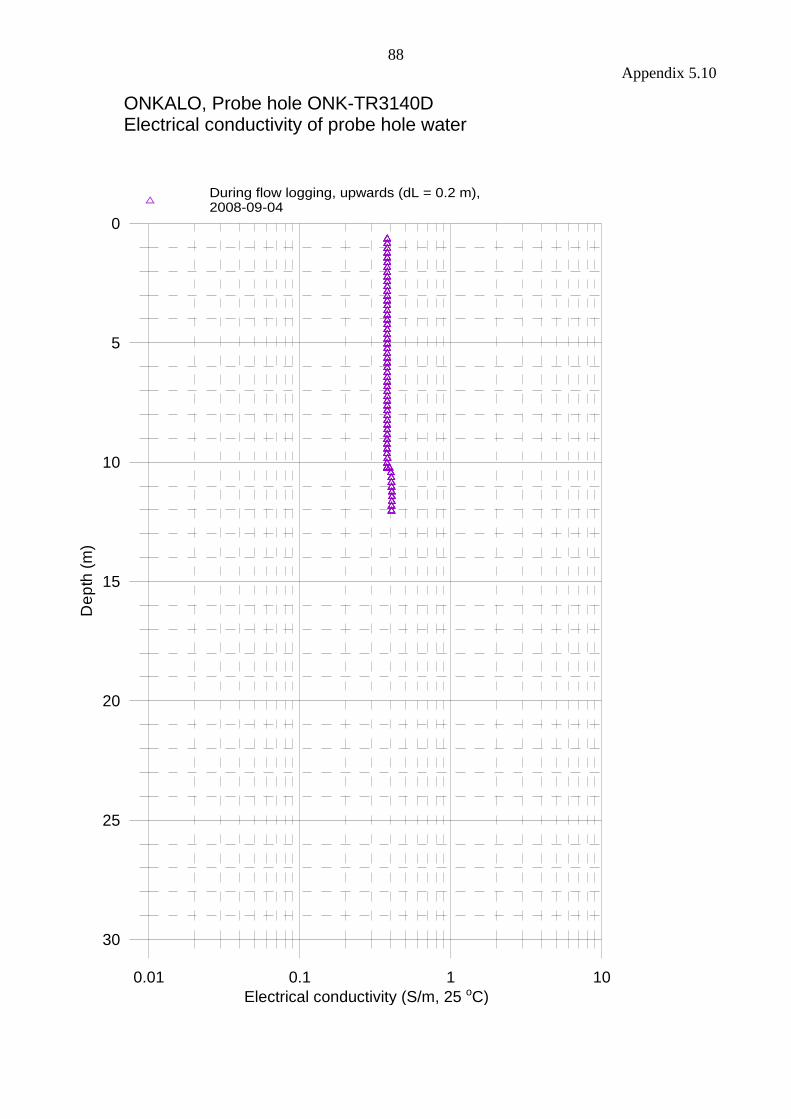
88
Appendix 5.10
0.01 0.1 1 10
Electrical conductivity (S/m, 25 oC)
30
25
20
15
10
5
0
De
pth
(m
)
During flow logging, upwards (dL = 0.2 m),2008-09-04
ONKALO, Probe hole ONK-TR3140DElectrical conductivity of probe hole water
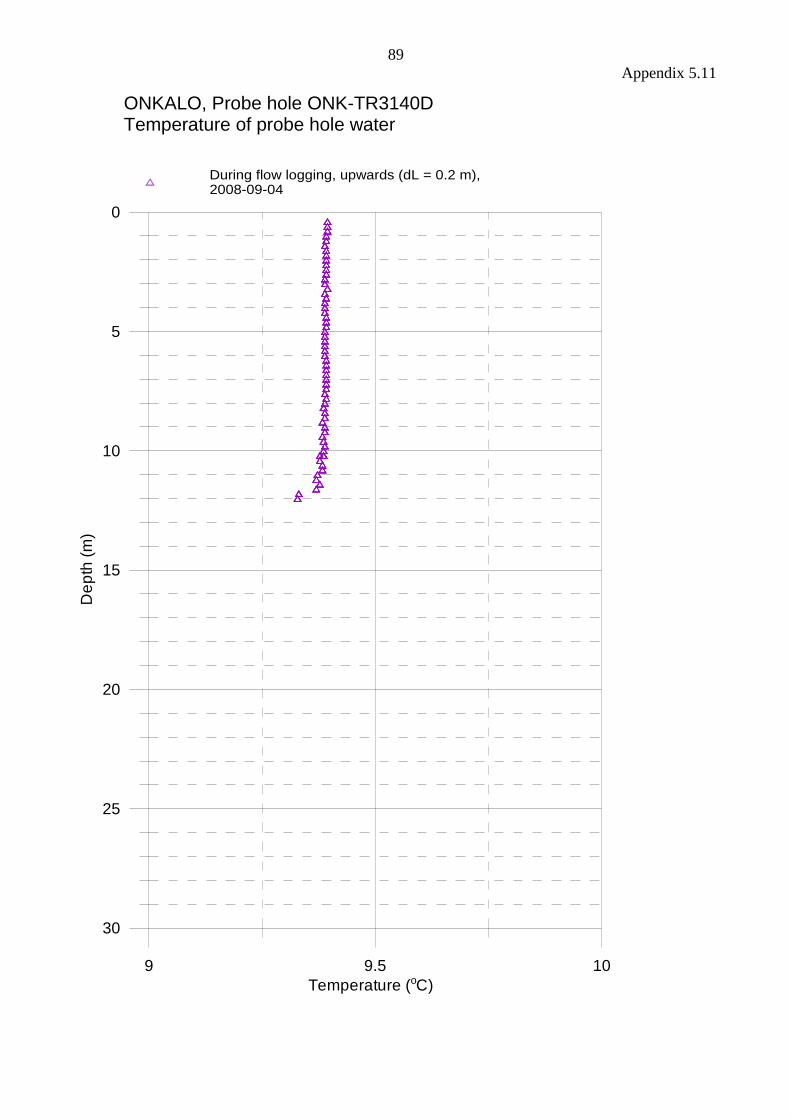
89
Appendix 5.11
9 9.5 10
Temperature (oC)
30
25
20
15
10
5
0
De
pth
(m
)
During flow logging, upwards (dL = 0.2 m), 2008-09-04
ONKALO, Probe hole ONK-TR3140DTemperature of probe hole water

90
Appendix 5.12
Tabulated results of detected fractures in probe holes ONK-TR3140A and ONK-TR3140D
Probe hole ONK-TR3140A
Elevation of the top of the
hole (masl.): -296.5
Inclination: -15.8o
Depth of fracture along the
probe hole (m)
Flow
(mL/h)
Fracture
elevation
(masl.)
Drawdown
(m) T (m
2/s)
Hydraulic
aperture of
fracture (mm)
Comments
13.0 1092000 -300.0 302.5 9.92E-07 0.119 **
14.2 7700440 -300.4 302.5 6.99E-06 0.228 **
Probe hole ONK-TR3140D
Elevation of the top of the
hole (masl.): -296.5
Inclination: -19.2o
Depth of fracture along the
probe hole (m)
Flow
(mL/h)
Fracture
elevation
(masl.)
Drawdown
(m) T (m
2/s)
Hydraulic
aperture of
fracture (mm)
Comments
2.4 46000 -297.3 302.5 4.18E-08 0.041 **
11.7 203000 -300.3 302.5 1.84E-07 0.068 **
** Fixed flow rate values were used in fracture table results. A fixed value is based on PFL DIFF probe flow rate and probe hole outflow.
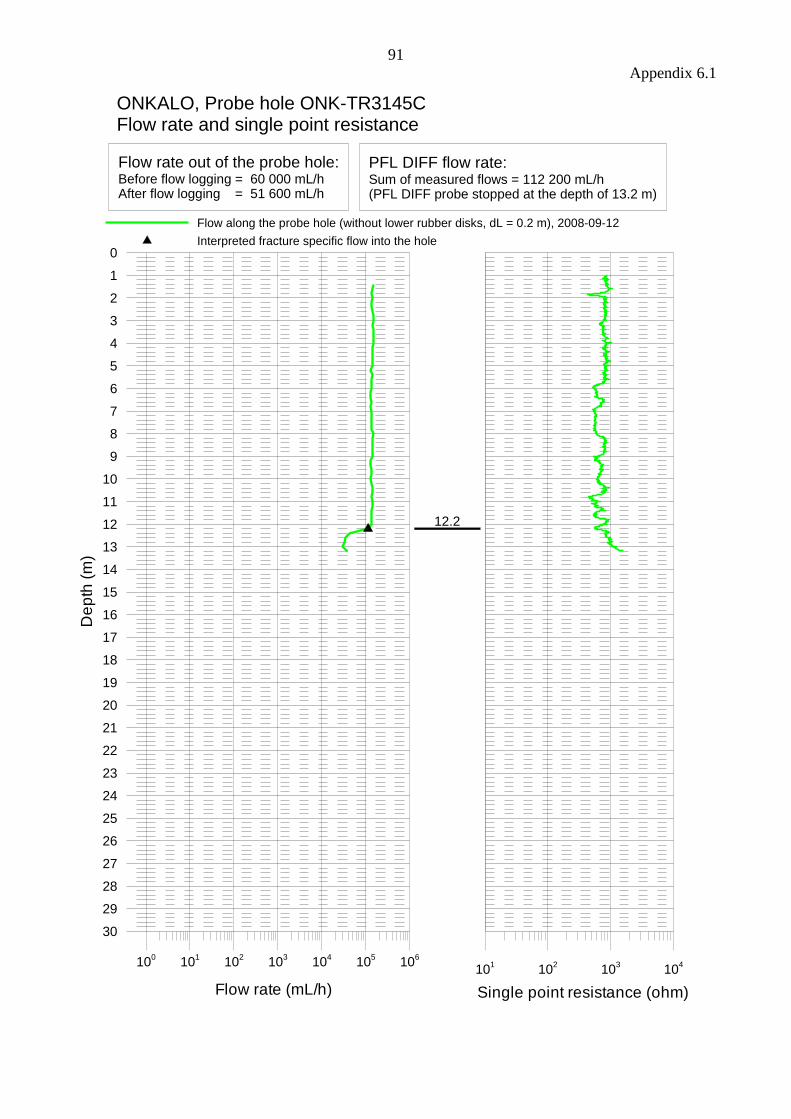
91
Appendix 6.1
100
101
102
103
104
105
106
Flow rate (mL/h)
30
29
28
27
26
25
24
23
22
21
20
19
18
17
16
15
14
13
12
11
10
9
8
7
6
5
4
3
2
1
0
De
pth
(m
)
101
102
103
104
Single point resistance (ohm)
Flow along the probe hole (without lower rubber disks, dL = 0.2 m), 2008-09-12
Interpreted fracture specific flow into the hole
12.2
ONKALO, Probe hole ONK-TR3145CFlow rate and single point resistance
Flow rate out of the probe hole:Before flow logging = 60 000 mL/hAfter flow logging = 51 600 mL/h
PFL DIFF flow rate:Sum of measured flows = 112 200 mL/h(PFL DIFF probe stopped at the depth of 13.2 m)
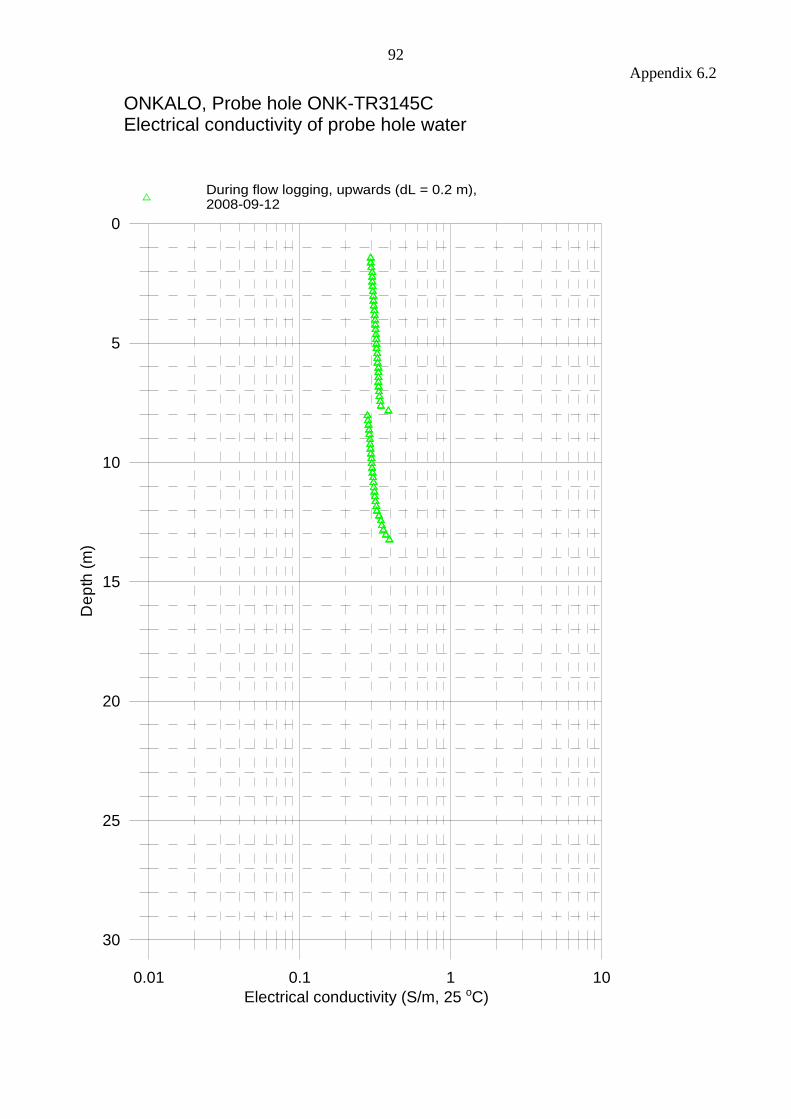
92
Appendix 6.2
0.01 0.1 1 10
Electrical conductivity (S/m, 25 oC)
30
25
20
15
10
5
0
De
pth
(m
)
During flow logging, upwards (dL = 0.2 m),2008-09-12
ONKALO, Probe hole ONK-TR3145CElectrical conductivity of probe hole water
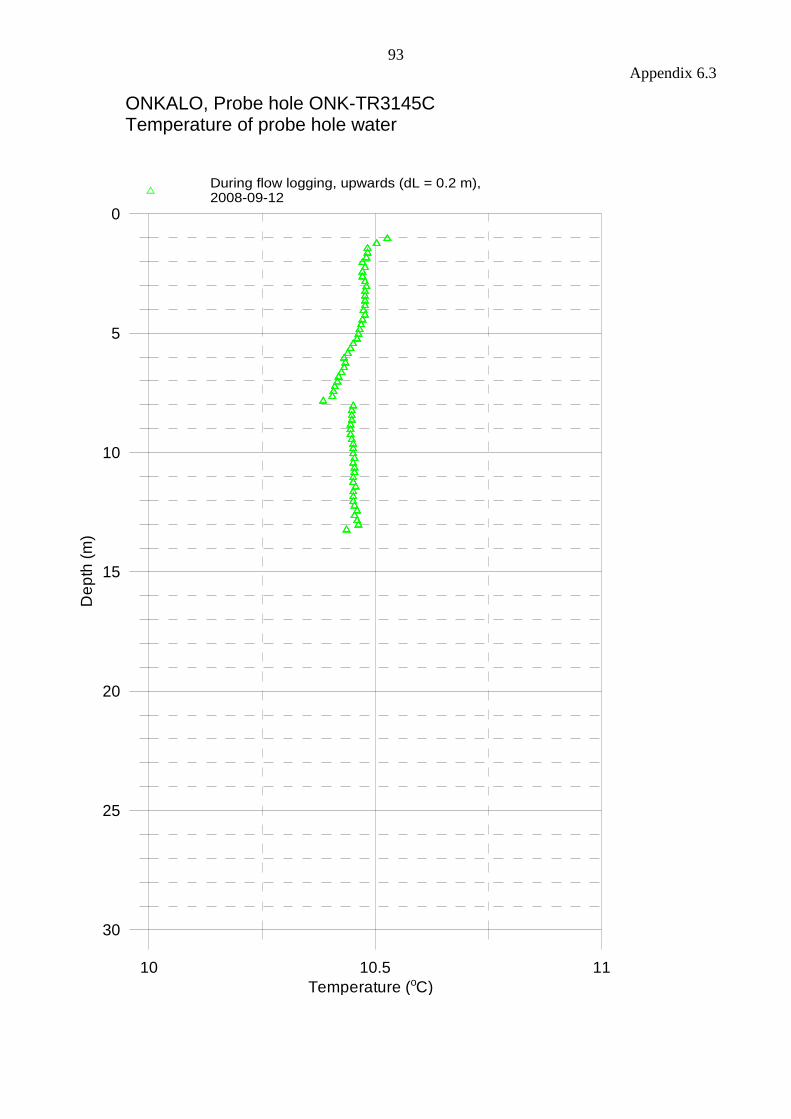
93
Appendix 6.3
10 10.5 11
Temperature (oC)
30
25
20
15
10
5
0
De
pth
(m
)
During flow logging, upwards (dL = 0.2 m), 2008-09-12
ONKALO, Probe hole ONK-TR3145CTemperature of probe hole water

94
Appendix 7.1
100
101
102
103
104
105
106
Flow rate (mL/h)
20
19
18
17
16
15
14
13
12
11
10
9
8
7
6
5
4
3
2
1
0
De
pth
(m
)
101
102
103
104
105
Single point resistance (ohm)
Flow from the measured section (L = 0.5 m, dL = 0.1 m), 2008-11-16
Interpreted fracture specific flow into the hole
6.1
ONKALO, Drillhole ONK-PVA5Flow rate and single point resistance
Flow rate out of the probe hole:Before flow logging = 9 000 mL/hAfter flow logging = 9 000 mL/h
PFL DIFF flow rate:Sum of measured flows = 7 510 mL/h

95
Appendix 7.2
100
101
102
103
104
105
106
Flow rate (mL/h)
40
39
38
37
36
35
34
33
32
31
30
29
28
27
26
25
24
23
22
21
20
De
pth
(m
)
101
102
103
104
105
Single point resistance (ohm)
Flow from the measured section (L = 0.5 m, dL = 0.1 m), 2008-11-16
Interpreted fracture specific flow into the hole
29.4
30.6
34.4
31.1
22.4
27.7
ONKALO, Drillhole ONK-PVA5Flow rate and single point resistance
Flow rate out of the probe hole:Before flow logging = 9 000 mL/hAfter flow logging = 9 000 mL/h
PFL DIFF flow rate:Sum of measured flows = 7 510 mL/h
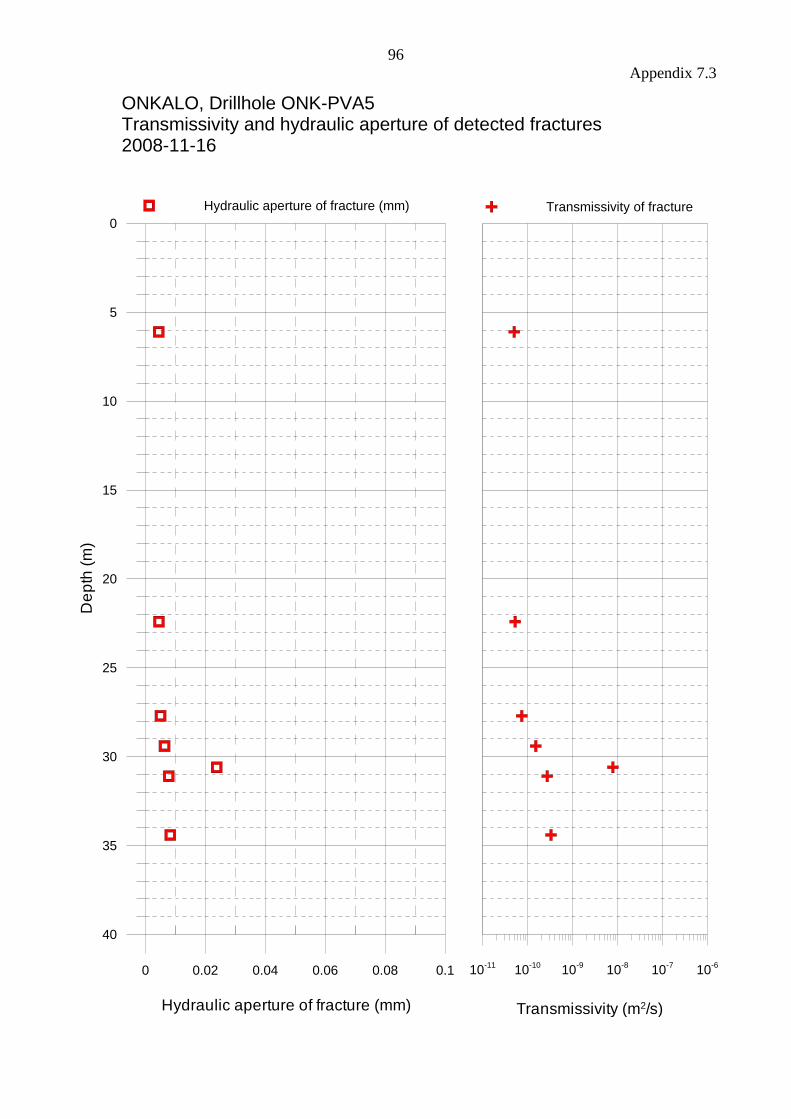
96
Appendix 7.3
0 0.02 0.04 0.06 0.08 0.1
Hydraulic aperture of fracture (mm)
40
35
30
25
20
15
10
5
0
De
pth
(m
)
10-11
10-10
10-9
10-8
10-7
10-6
Transmissivity (m2/s)
Hydraulic aperture of fracture (mm)
ONKALO, Drillhole ONK-PVA5Transmissivity and hydraulic aperture of detected fractures2008-11-16
Transmissivity of fracture

97
Appendix 7.4
Tabulated results of detected fractures in drillhole ONK-PVA5
Drillhole ONK-PVA5
Elevation of the top of the
hole (masl.): -228.6
Inclination: -20.0o
Depth of fracture along the
probe hole (m)
Flow
(mL/h)
Fracture
elevation
(masl.)
Drawdown
(m) T (m
2/s)
Hydraulic
aperture of
fracture (mm)
Comments
6.1 43 -230.7 234.6 5.04E-11 0.004 *
22.4 45 -236.3 234.6 5.27E-11 0.004 *
27.7 63 -238.1 234.6 7.38E-11 0.005 *
29.4 129 -238.7 234.6 1.51E-10 0.006
30.6 6710 -239.1 234.6 7.86E-09 0.024
31.1 233 -239.3 234.6 2.73E-10 0.008
34.4 283 -240.4 234.6 3.31E-10 0.008
* Uncertain fracture. The flow rate is less than 30 mL/h or the flow anomalies are overlapping or they are unclear
because of noise.
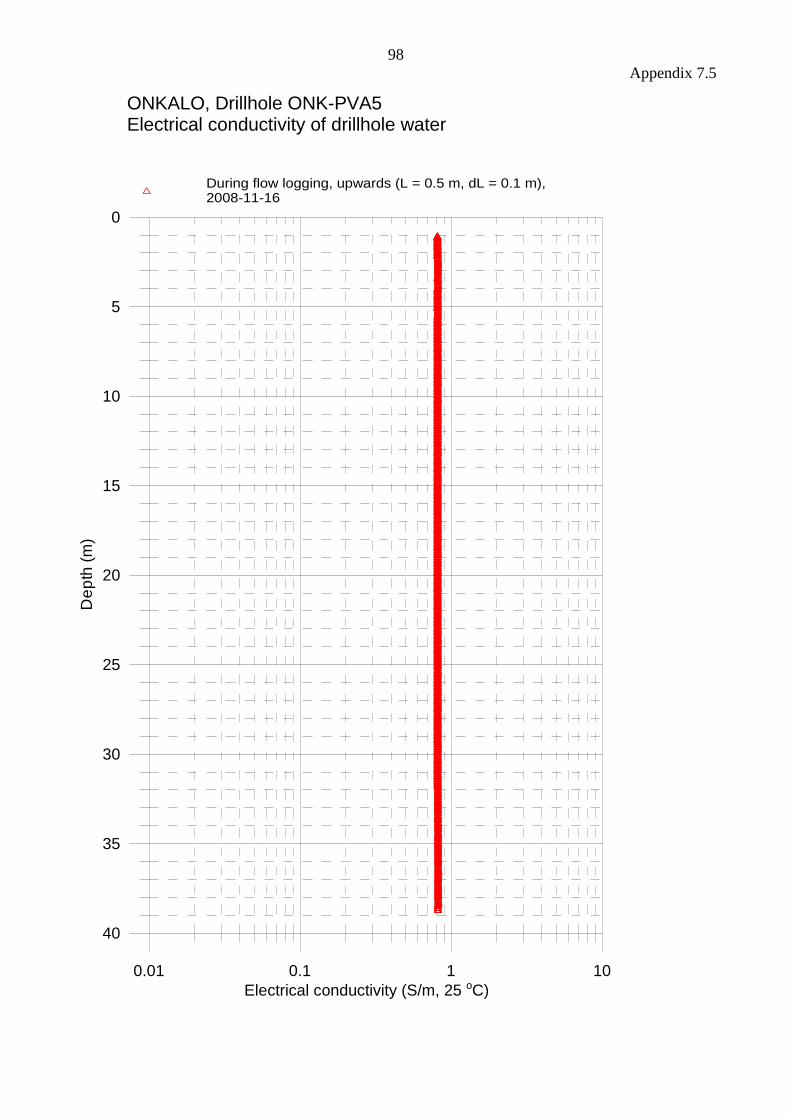
98
Appendix 7.5
0.01 0.1 1 10
Electrical conductivity (S/m, 25 oC)
40
35
30
25
20
15
10
5
0
De
pth
(m
)
During flow logging, upwards (L = 0.5 m, dL = 0.1 m), 2008-11-16
ONKALO, Drillhole ONK-PVA5Electrical conductivity of drillhole water
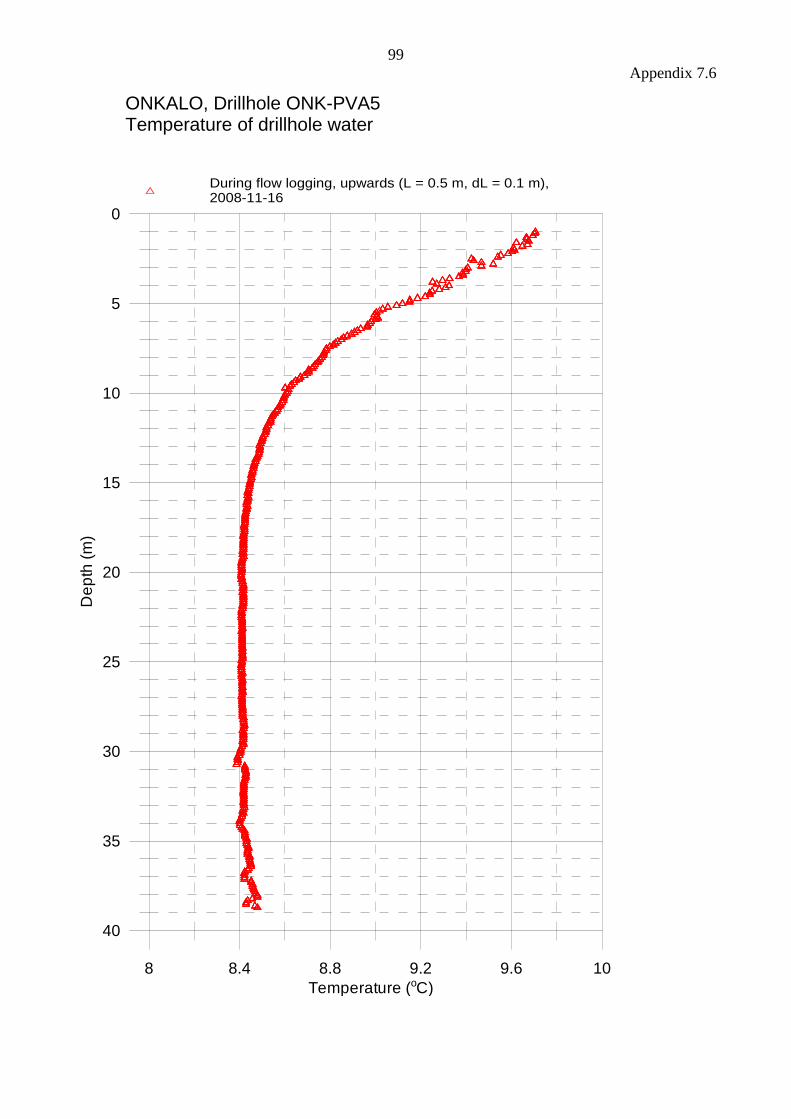
99
Appendix 7.6
8 8.4 8.8 9.2 9.6 10
Temperature (oC)
40
35
30
25
20
15
10
5
0
De
pth
(m
)
During flow logging, upwards (L = 0.5 m, dL = 0.1 m), 2008-11-16
ONKALO, Drillhole ONK-PVA5Temperature of drillhole water

100
Appendix 8.1
100
101
102
103
104
105
106
Flow rate (mL/h)
30
29
28
27
26
25
24
23
22
21
20
19
18
17
16
15
14
13
12
11
10
9
8
7
6
5
4
3
2
1
0
De
pth
(m
)
101
102
103
104
Single point resistance (ohm)
Flow along the probe hole (without lower rubber disks, dL = 0.2 m), 2008-11-25
Interpreted fracture specific flow into the hole
14.4
18.3
14.8
18.9
ONKALO, Probe hole ONK-TR3263DFlow rate and single point resistance
Flow rate out of the probe hole:Before flow logging = 28 800 mL/hAfter flow logging = 27 000 mL/h
PFL DIFF flow rate:Sum of measured flows = 18 000 mL/h(PFL DIFF probe stopped at the depth of 26 m)
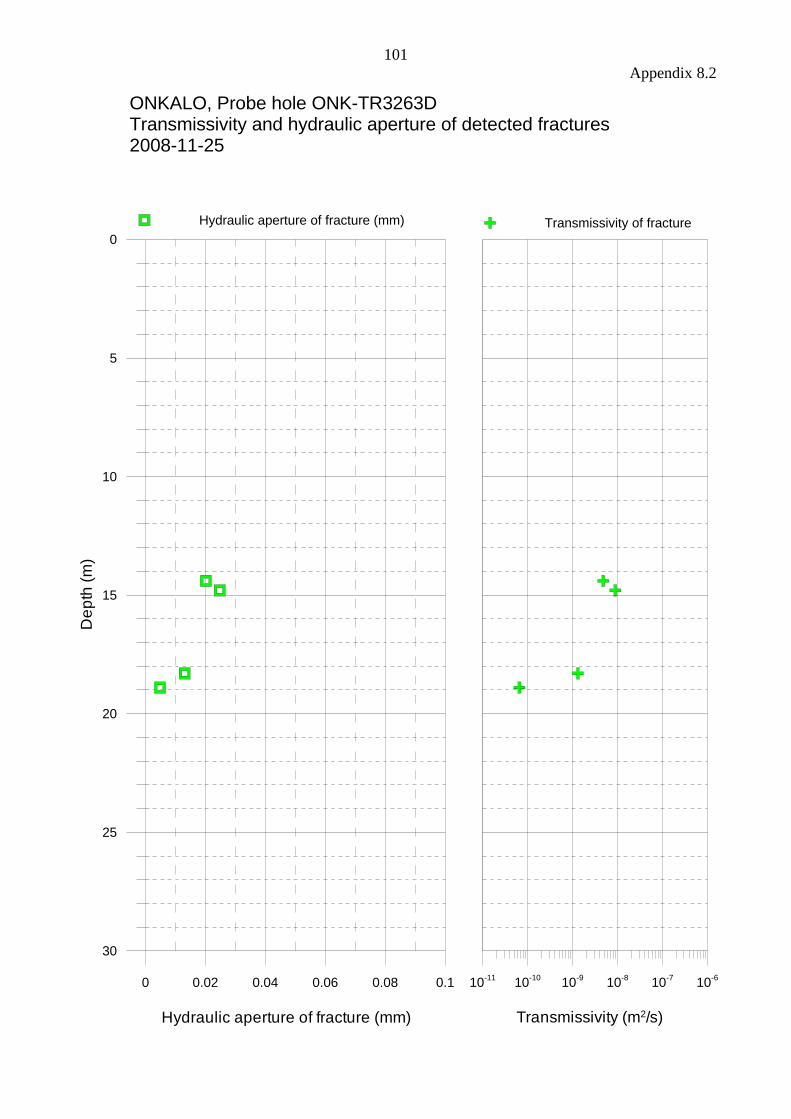
101
Appendix 8.2
0 0.02 0.04 0.06 0.08 0.1
Hydraulic aperture of fracture (mm)
30
25
20
15
10
5
0
De
pth
(m
)
10-11
10-10
10-9
10-8
10-7
10-6
Transmissivity (m2/s)
Hydraulic aperture of fracture (mm)
ONKALO, Probe hole ONK-TR3263DTransmissivity and hydraulic aperture of detected fractures2008-11-25
Transmissivity of fracture
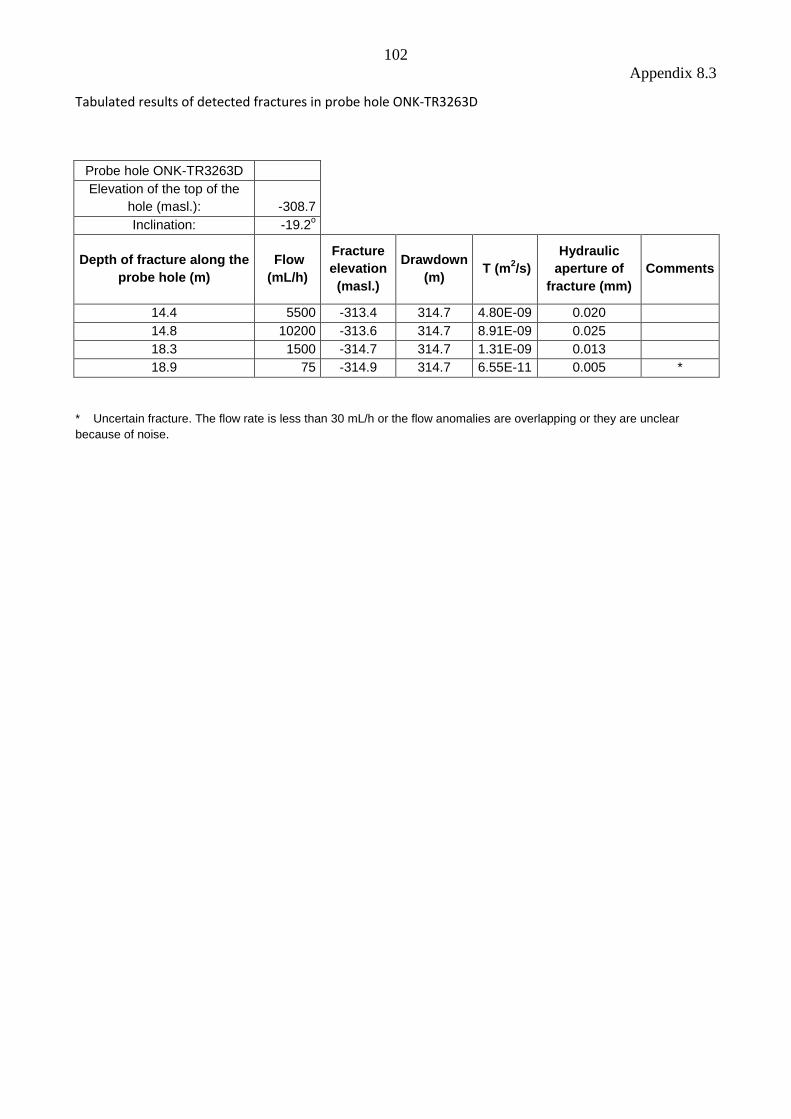
102
Appendix 8.3
Tabulated results of detected fractures in probe hole ONK-TR3263D
Probe hole ONK-TR3263D
Elevation of the top of the
hole (masl.): -308.7
Inclination: -19.2o
Depth of fracture along the
probe hole (m)
Flow
(mL/h)
Fracture
elevation
(masl.)
Drawdown
(m) T (m
2/s)
Hydraulic
aperture of
fracture (mm)
Comments
14.4 5500 -313.4 314.7 4.80E-09 0.020
14.8 10200 -313.6 314.7 8.91E-09 0.025
18.3 1500 -314.7 314.7 1.31E-09 0.013
18.9 75 -314.9 314.7 6.55E-11 0.005 *
* Uncertain fracture. The flow rate is less than 30 mL/h or the flow anomalies are overlapping or they are unclear
because of noise.
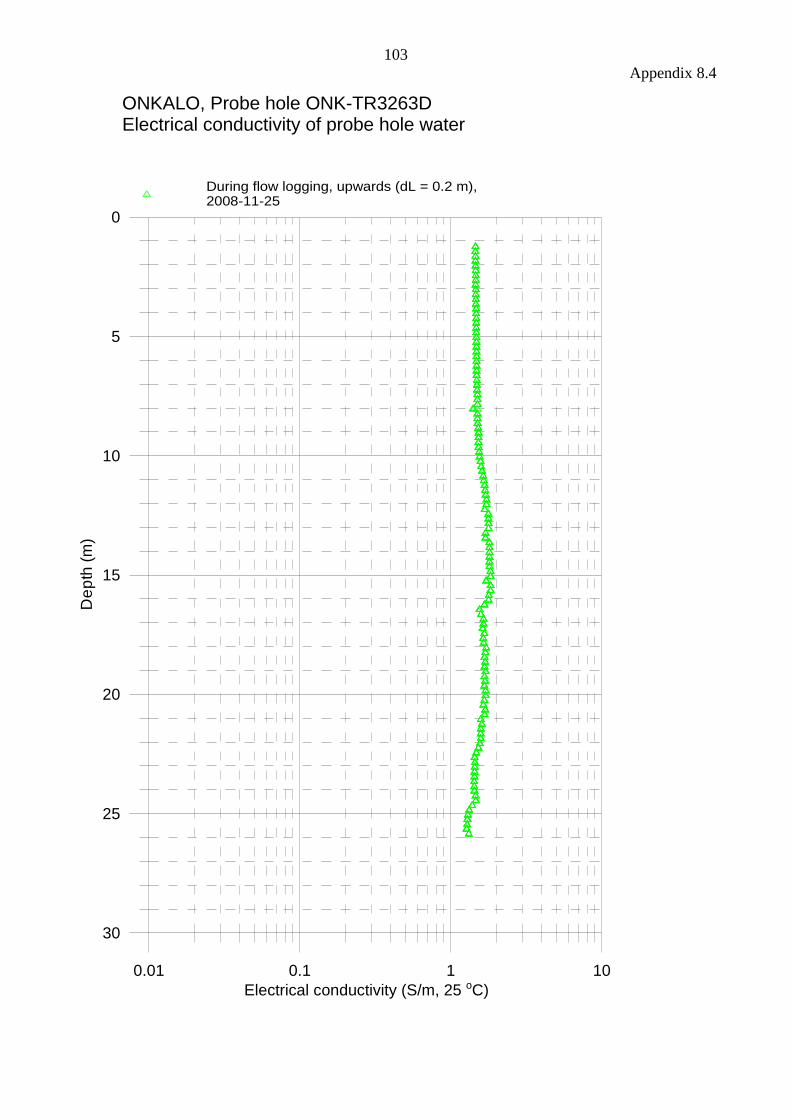
103
Appendix 8.4
0.01 0.1 1 10
Electrical conductivity (S/m, 25 oC)
30
25
20
15
10
5
0
De
pth
(m
)
During flow logging, upwards (dL = 0.2 m),2008-11-25
ONKALO, Probe hole ONK-TR3263DElectrical conductivity of probe hole water
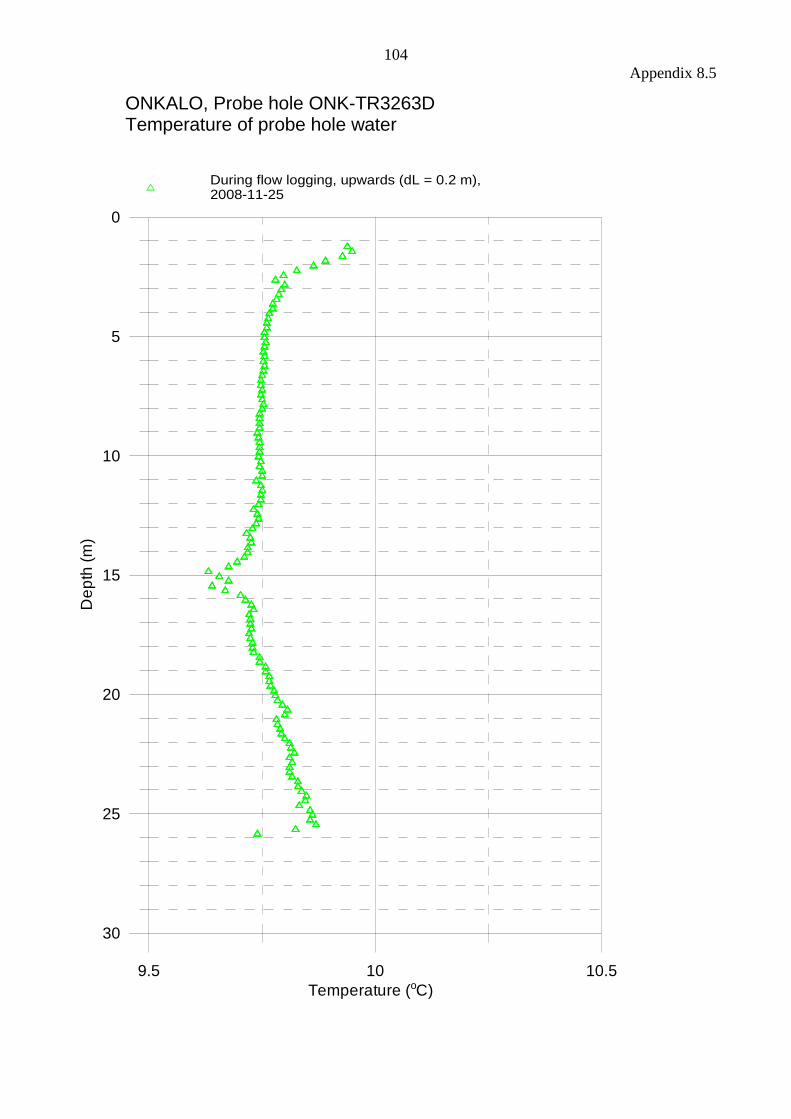
104
Appendix 8.5
9.5 10 10.5
Temperature (oC)
30
25
20
15
10
5
0
De
pth
(m
)
During flow logging, upwards (dL = 0.2 m), 2008-11-25
ONKALO, Probe hole ONK-TR3263DTemperature of probe hole water
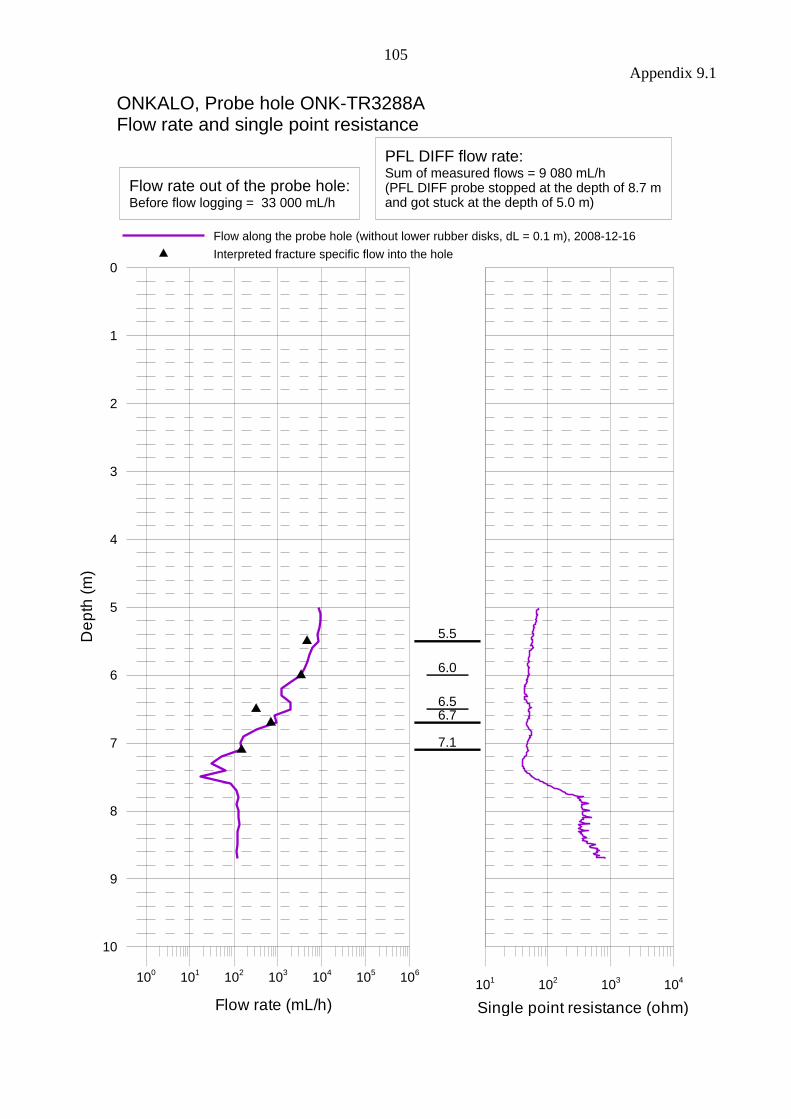
105
Appendix 9.1
100
101
102
103
104
105
106
Flow rate (mL/h)
10
9
8
7
6
5
4
3
2
1
0
De
pth
(m
)
101
102
103
104
Single point resistance (ohm)
Flow along the probe hole (without lower rubber disks, dL = 0.1 m), 2008-12-16
Interpreted fracture specific flow into the hole
5.5
6.7
7.1
6.0
6.5
ONKALO, Probe hole ONK-TR3288AFlow rate and single point resistance
Flow rate out of the probe hole:Before flow logging = 33 000 mL/h
PFL DIFF flow rate:Sum of measured flows = 9 080 mL/h(PFL DIFF probe stopped at the depth of 8.7 mand got stuck at the depth of 5.0 m)

106
Appendix 9.2
0 0.02 0.04 0.06 0.08 0.1
Hydraulic aperture of fracture (mm)
30
25
20
15
10
5
0
De
pth
(m
)
10-11
10-10
10-9
10-8
10-7
10-6
Transmissivity (m2/s)
Hydraulic aperture of fracture (mm)
ONKALO, Probe hole ONK-TR3288ATransmissivity and hydraulic aperture of detected fractures2008-12-16
Transmissivity of fracture
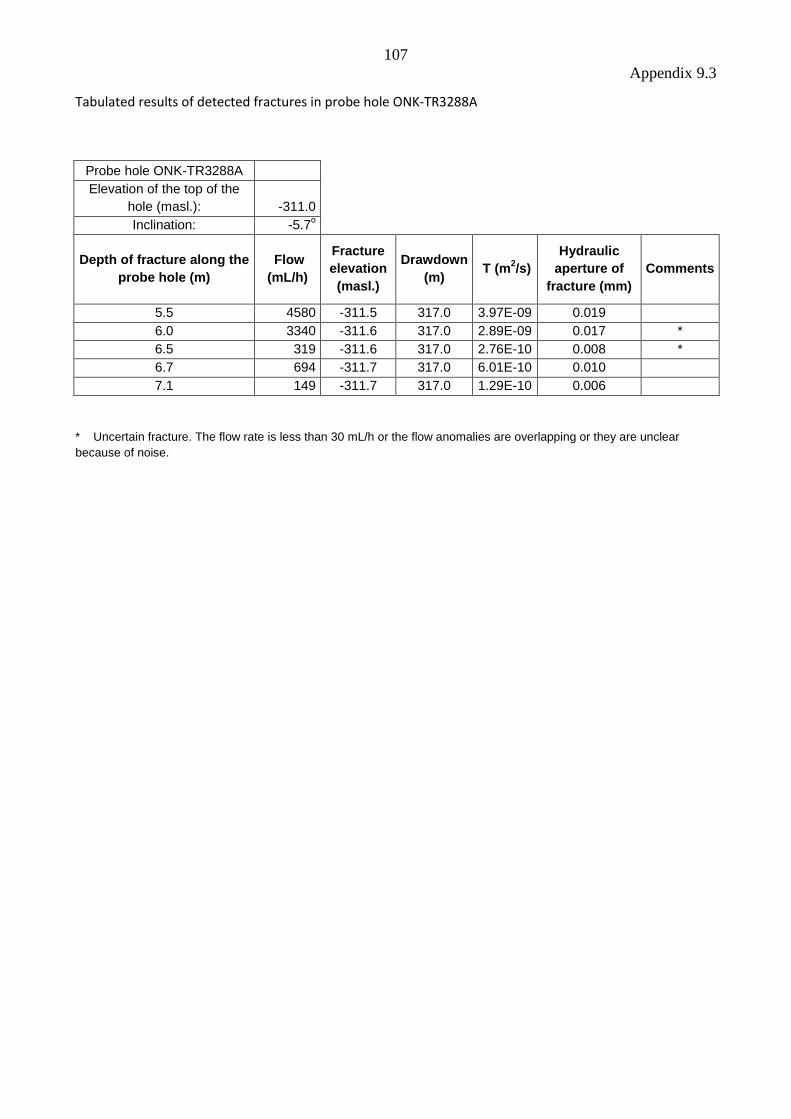
107
Appendix 9.3
Tabulated results of detected fractures in probe hole ONK-TR3288A
Probe hole ONK-TR3288A
Elevation of the top of the
hole (masl.): -311.0
Inclination: -5.7o
Depth of fracture along the
probe hole (m)
Flow
(mL/h)
Fracture
elevation
(masl.)
Drawdown
(m) T (m
2/s)
Hydraulic
aperture of
fracture (mm)
Comments
5.5 4580 -311.5 317.0 3.97E-09 0.019
6.0 3340 -311.6 317.0 2.89E-09 0.017 *
6.5 319 -311.6 317.0 2.76E-10 0.008 *
6.7 694 -311.7 317.0 6.01E-10 0.010
7.1 149 -311.7 317.0 1.29E-10 0.006
* Uncertain fracture. The flow rate is less than 30 mL/h or the flow anomalies are overlapping or they are unclear
because of noise.
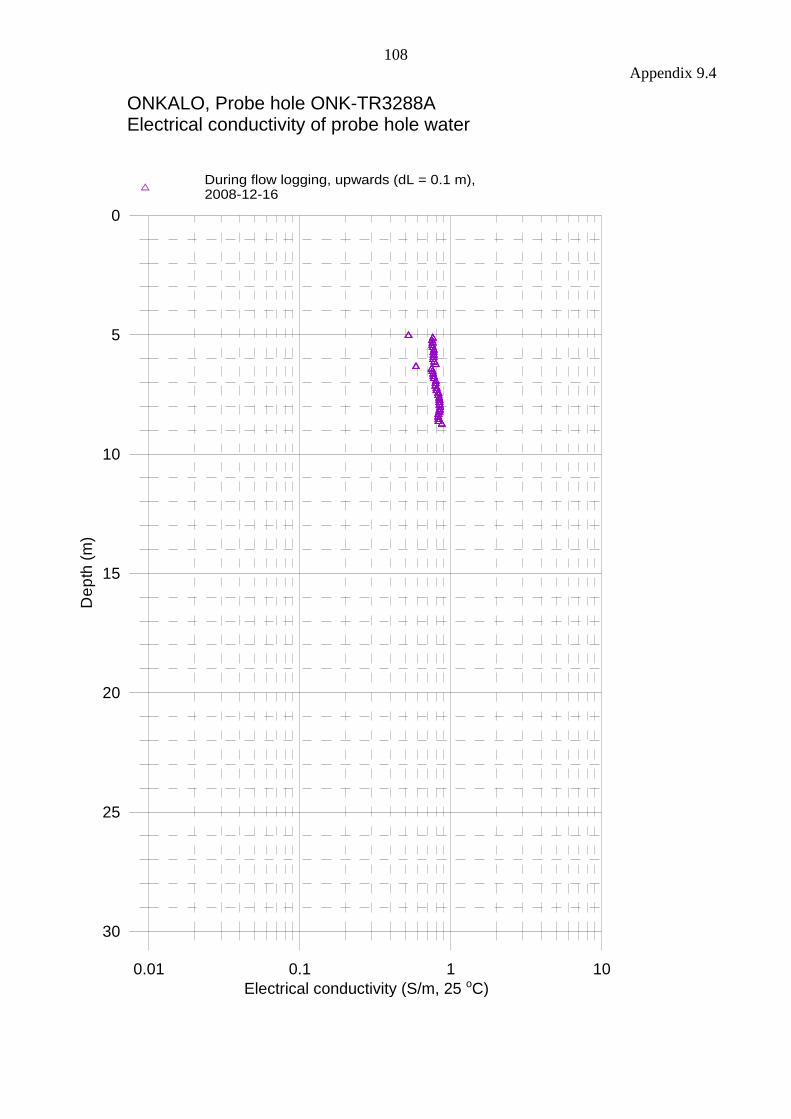
108
Appendix 9.4
0.01 0.1 1 10
Electrical conductivity (S/m, 25 oC)
30
25
20
15
10
5
0
De
pth
(m
)
During flow logging, upwards (dL = 0.1 m),2008-12-16
ONKALO, Probe hole ONK-TR3288AElectrical conductivity of probe hole water
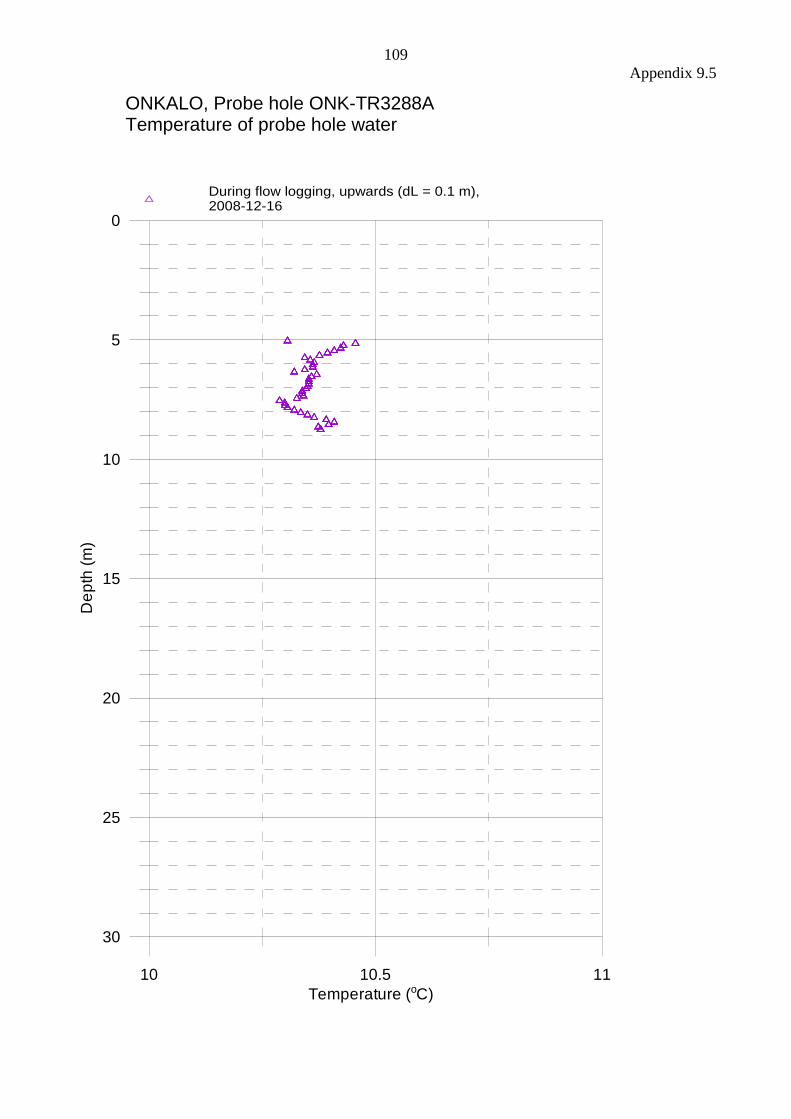
109
Appendix 9.5
10 10.5 11
Temperature (oC)
30
25
20
15
10
5
0
De
pth
(m
)
During flow logging, upwards (dL = 0.1 m), 2008-12-16
ONKALO, Probe hole ONK-TR3288ATemperature of probe hole water
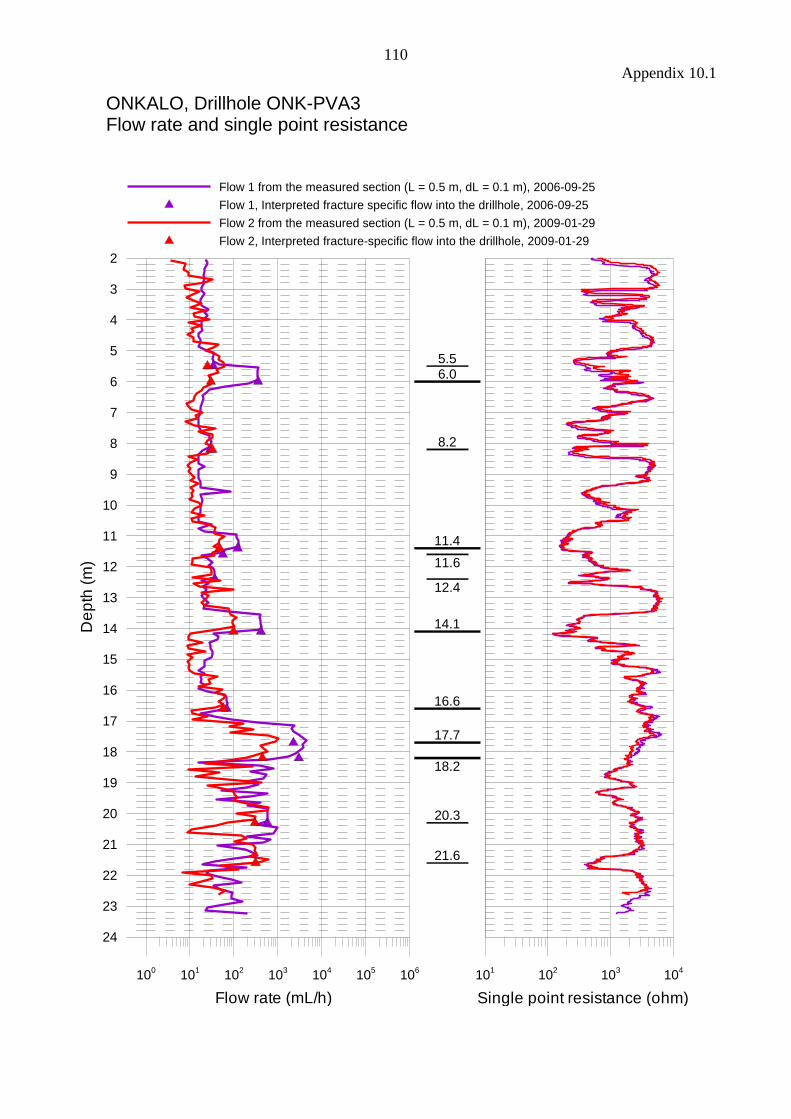
110
Appendix 10.1
100
101
102
103
104
105
106
Flow rate (mL/h)
24
23
22
21
20
19
18
17
16
15
14
13
12
11
10
9
8
7
6
5
4
3
2
De
pth
(m
)
101
102
103
104
Single point resistance (ohm)
Flow 1 from the measured section (L = 0.5 m, dL = 0.1 m), 2006-09-25
Flow 1, Interpreted fracture specific flow into the drillhole, 2006-09-25
Flow 2 from the measured section (L = 0.5 m, dL = 0.1 m), 2009-01-29
Flow 2, Interpreted fracture-specific flow into the drillhole, 2009-01-29
6.0
11.4
14.1
16.6
17.7
18.2
5.5
8.2
20.3
21.6
11.6
12.4
ONKALO, Drillhole ONK-PVA3Flow rate and single point resistance
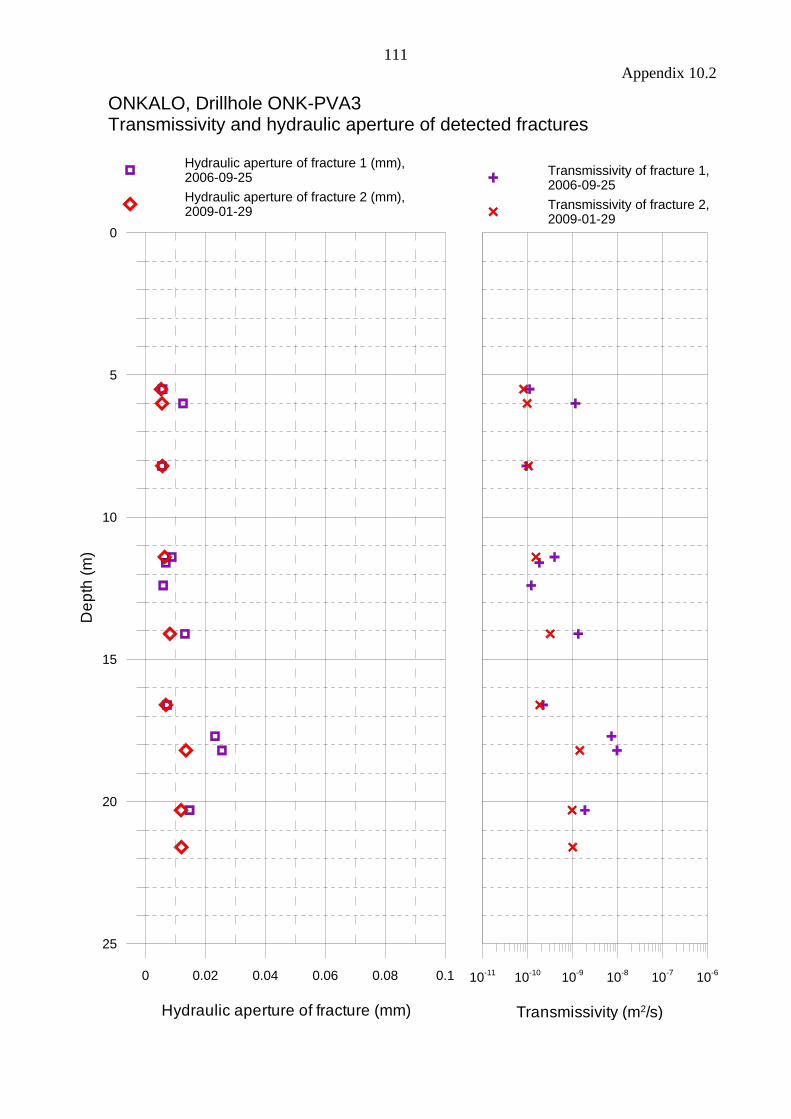
111
Appendix 10.2
0 0.02 0.04 0.06 0.08 0.1
Hydraulic aperture of fracture (mm)
25
20
15
10
5
0
De
pth
(m
)
10-11
10-10
10-9
10-8
10-7
10-6
Transmissivity (m2/s)
Hydraulic aperture of fracture 1 (mm),2006-09-25
Hydraulic aperture of fracture 2 (mm),2009-01-29
ONKALO, Drillhole ONK-PVA3Transmissivity and hydraulic aperture of detected fractures
Transmissivity of fracture 1,2006-09-25
Transmissivity of fracture 2,2009-01-29

112
Appendix 10.3 Tabulated results of detected fractures in drillhole ONK-PVA3
Drillhole: ONK-PVA3
Elevation of the top of the hole
(masl.): -78.535
Inclination: -9.76o
Depth of fracture along the
drillhole (m)
Fracture
elevation
(masl.)
Drawdown
(m)
Flow 1
(mL/h)
T 1
(m2/s)
Hydraulic
aperture of
fracture 1
(mm)
Flow 2
(mL/h)
T 2
(m2/s)
Hydraulic
aperture of
fracture 2
(mm)
Comments
5.5 -79.47 84.535 34 1.11E-10 0.006 25 8.13E-11 0.005 *
6.0 -79.55 84.535 354 1.15E-09 0.013 30 9.75E-11 0.005
8.2 -79.93 84.535 29 9.43E-11 0.005 32 1.04E-10 0.006 *
11.4 -80.47 84.535 122 3.97E-10 0.009 47 1.53E-10 0.006
11.6 -80.50 84.535 56 1.82E-10 0.007 - - - *, **
12.4 -80.64 84.535 37 1.20E-10 0.006 - - - *, **
14.1 -80.93 84.535 410 1.33E-09 0.013 98 3.19E-10 0.008
16.6 -81.35 84.535 68 2.21E-10 0.007 57 1.85E-10 0.007
17.7 -81.54 84.535 2250 7.31E-09 0.023 - - - **
18.2 -81.62 84.535 2990 9.72E-09 0.025 444 1.44E-09 0.013
20.3 -81.98 84.535 576 1.87E-09 0.015 300 9.75E-10 0.012 *
21.6 -82.20 84.535 - - - 310 1.01E-09 0.012 *, ***
* Uncertain fracture. The flow rate is less than 30 mL/h or the flow anomalies are overlapping or they are unclear because of noise.
* * Fracture was not found, Flow 2 (2009-01-25 measurements).
*** New fracture found, Flow 2 (2009-01-25 measurements).
112
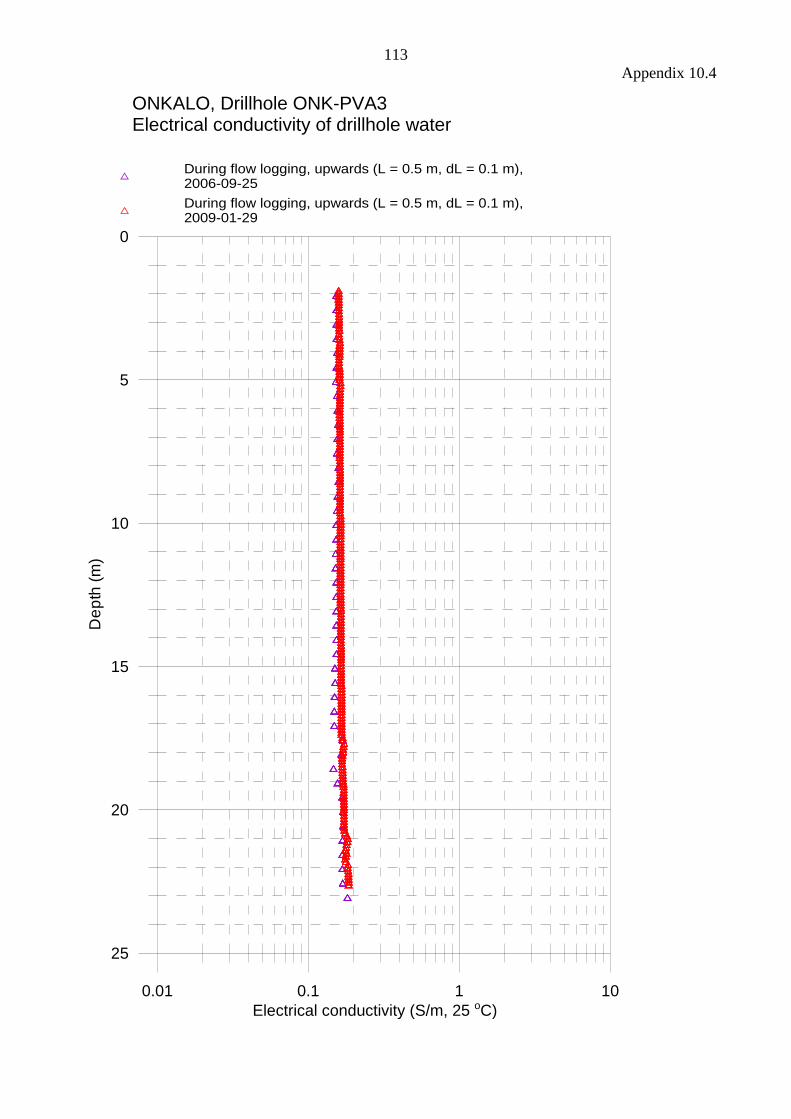
113
Appendix 10.4
0.01 0.1 1 10
Electrical conductivity (S/m, 25 oC)
25
20
15
10
5
0
De
pth
(m
)
During flow logging, upwards (L = 0.5 m, dL = 0.1 m), 2006-09-25
During flow logging, upwards (L = 0.5 m, dL = 0.1 m), 2009-01-29
ONKALO, Drillhole ONK-PVA3Electrical conductivity of drillhole water

114
Appendix 10.5
6 6.5 7 7.5 8 8.5
Temperature (oC)
25
20
15
10
5
0
De
pth
(m
)
During flow logging, upwards (L = 0.5 m, dL = 0.1 m), 2006-09-25
During flow logging, upwards (L = 0.5 m, dL = 0.1 m), 2009-01-29
ONKALO, Drillhole ONK-PVA3Temperature of drillhole water