onkalo rock mechanics model (rmm) version 2 - · pdf fileestimate for the rock stability of...
TRANSCRIPT
July 2014
Working Reports contain information on work in progress
or pending completion.
Tuul ia Häkkinen
Susanna Merjama
Hanna Mönkkönen
WSP Finland
Working Report 2014-33
ONKALO Rock Mechanics Model (RMM)Version 2.3

ABSTRACT
The Rock Mechanics Model of the ONKALO rock volume includes the most important rock mechanics features and parameters at the Olkiluoto site. The main objective of the model is to be a tool to predict rock properties, rock quality and hence provide an estimate for the rock stability of the potential repository at Olkiluoto.
The model includes a database of rock mechanics raw data and a block model in which the rock mechanics parameters are estimated through block volumes based on spatial rock mechanics raw data. In this version 2.3, special emphasis was placed on refining the estimation of the block model. The model was divided into rock mechanics domains which were used as constraints during the block model estimation.
During the modelling process, a display profile and toolbar were developed for the GEOVIA Surpac software to improve visualisation and access to the rock mechanics data for the Olkiluoto area.
Keywords: Olkiluoto, ONKALO, Rock mechanics model, Block model, Rock mass quality, Rock strength, In situ rock stress, Thermal rock properties.

ONKALON KALLIOMEKAANINEN MALLI (RMM) - VERSIO 2.3
TIIVISTELMÄ
ONKALON kalliomekaanisen mallin tarkoituksena on koota yhteen Olkiluodon kallioperän kalliomekaanisesti merkittävimmät ominaisuudet ja parametrit. Mallin tavoitteena on toimia työkaluna, jonka avulla voidaan arvioida kalliolaatua, kallion ominaisuuksia ja siten ennustaa mahdollisen Olkiluodon loppusijoitustilan kallio-mekaanista pysyvyyttä.
Malli koostuu tietokannasta, joka sisältää Olkiluodon kalliomekaanisen lähtöaineiston, sekä lohkomallista, joka sisältää arvion kalliolaadusta pohjautuen käytettyyn lähtö-aineistoon. Tässä versiossa 2.3 on kehitetty edelleen lohkomallin laskentamenetelmiä keskittymällä tunnistamaan kalliolaadultaan samankaltaisia tilavuuksia, joilla laskentaa rajataan.
Mallin kehitykseen kuuluu myös kalliomekaanisen aineiston havainnointimenetelmien kehittäminen. Tähän tarkoitukseen on luotu GEOVIA Surpac ohjelmistoon käyttö-liittymä, jolla voidaan nopeasti visualisoida käyttäjän valitsemia tietokannan ja lohkomallin tietoja.
Avainsanat: Olkiluoto, ONKALO, kalliomekaaninen malli, lohkomalli, kalliolaatu, kallion lujuus, kallion in situ jännitys, kallion termiset ominaisuudet

1
TABLE OF CONTENTS
ABSTRACT
1 INTRODUCTION ................................................................................................... 2
2 RMM BLOCK MODEL, VERSION 2.3 ................................................................... 3
2.1 Block model dimensions .............................................................................. 6
2.2 GSI and RQD, estimation method and domains .......................................... 7
2.3 Peak strength ............................................................................................... 9
2.4 Thermal properties and densities ............................................................... 10
2.5 Display profile ............................................................................................. 11
3 PROGRESS FROM RMM 2.0 TO RMM 2.3 ....................................................... 12
3.1 The steps in development of block model estimation for GSI and RQD .... 13
3.2 Rock stress and rock strength .................................................................... 16
3.3 Thermal properties ..................................................................................... 17
4 FUTURE RMM DEVELOPMENT ........................................................................ 18
REFERENCES ............................................................................................................. 19
APPENDIX 1. SOURCE DATA ..................................................................................... 20
APPENDIX 2. DISPLAY PROFILE FEATURES AND FUNCTIONS ............................ 34

2
1 INTRODUCTION
The Rock Mechanics Model (RMM) is a model of the most important rock mechanics features at the Olkiluoto site. The model includes a rock mechanics database of the raw data collected from drillhole logging, tunnel mapping and laboratory tests, and a three dimensional block model in which rock mechanics parameters in individual blocks are estimated based on the rock mechanics data e.g. GSI and RQD values. The RMM model is created with GEOVIA Surpac software and the block model and the database information can be visualised with a display profile specially designed for the RMM.
RMM 2.3 is an intermediate version between the major RMM versions 2.0 (Mönkkönen et al. 2012a) and 3.0. The purpose of this interim version is to test estimation scenarios where the block model estimation is made in stages for separate rock mechanics domains. Rock mechanics domains are volumes in the rock mass where rock mechanics features are similar, e.g. RQD in fracture zones. The domains in the RMM are defined based on models of the site scale brittle structures and their influence zones. Recognising the domains and using them in block model estimation increases the reliability of the RM block model.
Figure 1-1. Visualisation example of the RMM ONKALO block model version 2.3 also showing drillholes from the Olkiluoto site displayed with RMM display tools.

3
2 RMM BLOCK MODEL, VERSION 2.3
The RMM block model includes the most important rock mechanics features and parameters: GSI (calculated from Q′), RQD, peak strength, rock types, brittle fault zones, thermal properties and Ground Types (GT) (Posiva 2014). The values of individual parameters are stored in block model attributes. The attributes can be filled in by estimating their value from the raw data or by assigning a certain value which is based on, e.g., statistical information or interpretation. The values of GSI, RQD and peak strength were estimated for the block model using the inverse distance method (see Section 2.2); whereas, information on brittle fault zones, influence zones and rock types were assigned to their corresponding blocks according to the current Olkiluoto geological models (Aaltonen et al. 2014). Thermal properties and densities of the main rock types were also assigned to the block model according to same geological models. Ground Type (GT) classes were assigned according to the GSI values. A complete list of attributes and their estimation methods are compiled in Table 2.1.
The raw data used for this RMM 2.3 update are the drillhole data from Posiva’s Offline Potti database which includes Q and Q-prime drillhole logs and tunnel mapping data, as listed in Appendix 1. Geological models are from the Olkiluoto Geological Model 3.0 (Aaltonen et al. 2014) (Appendix 1). Thermal properties are from Kukkonen et al. (2011) and rock type densities from Aaltonen et al. (2009, Table 7). Peak strength values from the field tests (Point Load Test)) and laboratory uniaxial (UCS) tests were received from Posiva. Ground Type classes are from the Site Engineering Report 2012 (Posiva 2014). During the update, the latest drillhole information, thermal measurements and rock strength measurements have been updated in the RMM database.
4
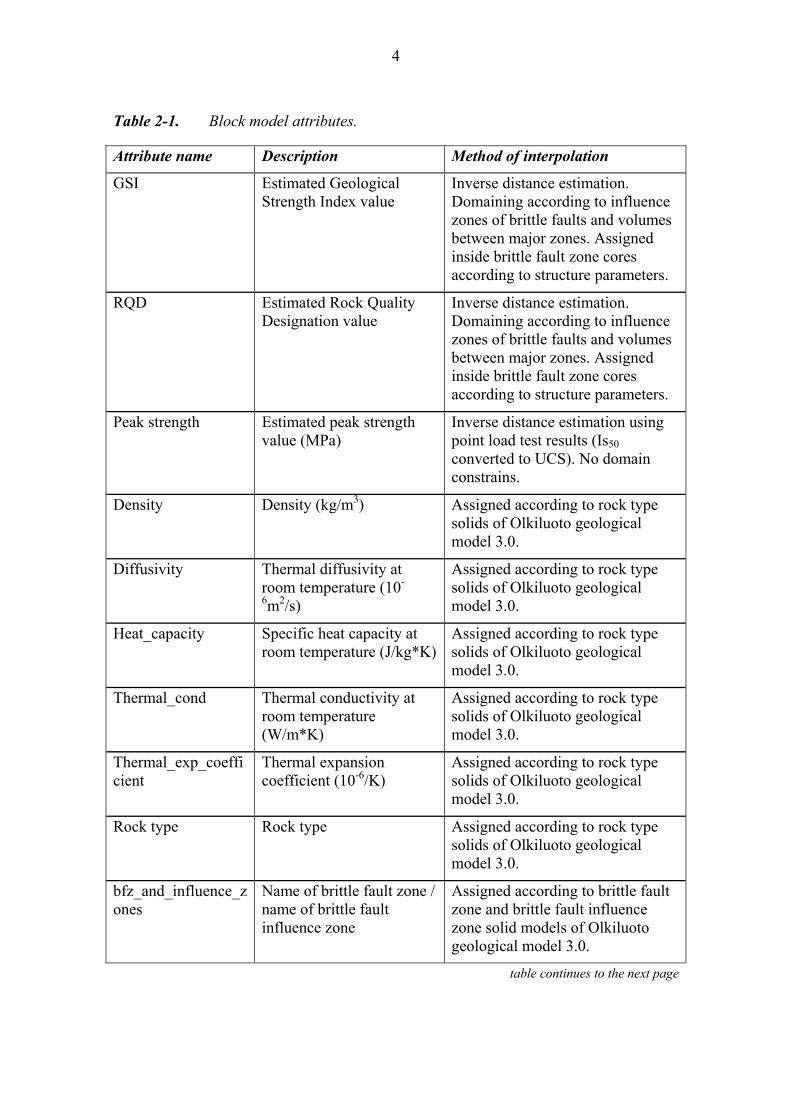
Table 2-1. Block model attributes.
Attribute name Description Method of interpolation
GSI Estimated Geological Strength Index value
Inverse distance estimation. Domaining according to influence zones of brittle faults and volumes between major zones. Assigned inside brittle fault zone cores according to structure parameters.
RQD Estimated Rock Quality Designation value
Inverse distance estimation. Domaining according to influence zones of brittle faults and volumes between major zones. Assigned inside brittle fault zone cores according to structure parameters.
Peak strength Estimated peak strength value (MPa)
Inverse distance estimation using point load test results (Is50 converted to UCS). No domain constrains.
Density Density (kg/m3) Assigned according to rock type solids of Olkiluoto geological model 3.0.
Diffusivity Thermal diffusivity at room temperature (10-
6m2/s)
Assigned according to rock type solids of Olkiluoto geological model 3.0.
Heat_capacity Specific heat capacity at room temperature (J/kg*K)
Assigned according to rock type solids of Olkiluoto geological model 3.0.
Thermal_cond Thermal conductivity at room temperature (W/m*K)
Assigned according to rock type solids of Olkiluoto geological model 3.0.
Thermal_exp_coefficient
Thermal expansion coefficient (10-6/K)
Assigned according to rock type solids of Olkiluoto geological model 3.0.
Rock type Rock type Assigned according to rock type solids of Olkiluoto geological model 3.0.
bfz_and_influence_zones
Name of brittle fault zone / name of brittle fault influence zone
Assigned according to brittle fault zone and brittle fault influence zone solid models of Olkiluoto geological model 3.0.
table continues to the next page

5
Attribute name Description Method of interpolation
GT Ground Type class Assigned according to GSI value.
GSI_RQD_estimation class
GSI and RQD estimation class
Assigned according to estimation round.
GSI_RQD_aniso_dist
GSI and RQD estimation, anisotropic distance to nearest sample
Estimation parameter
GSI_RQD_aver_dist GSI and RQD estimation, average anisotropic distance to all samples
Estimation parameter
GSI_RQD_samples GSI and RQD estimation, number of samples used in estimation
Estimation parameter
peak_strength_ estimation class
peak strength estimation class
Assigned according to estimation round.
peak_strength_ aniso_dist
peak strength estimation, anisotropic distance to nearest sample
Estimation parameter
peak_strength_ aver_dist
peak strength estimation, average anisotropic distance to all samples
Estimation parameter
peak_strength_ samples
peak strength estimation, number of samples used in estimation
Estimation parameter

6
2.1 Block model dimensions
The dimensions of the model have been slightly modified from version RMM 2.0, see Table 3-1. The size of the block model is 1250 x 730 x 520 m: it covers the entire ONKALO area and current design of the disposal panel 1 (Kirkkomäki 2012) (Figure 2-1.). The dimensions of the block model are presented in Table 2-2.
Table 2-2. Block model dimensions.
Figure 2-1. Dimensions of RMM 2.3 include the planned disposal panel 1.
Dimension Value
Y origin (northing) 6 791 550
X origin (easting) 1 525 970
Z origin (elevation) -500
Block model size 1250 x 730 x 520 m
Block size 10 x 10 x 10 m
Sub block size 2.5 x 2.5 x 2.5 m
Rotation 306° around z-axis

7
2.2 GSI and RQD, estimation method and domains
The estimation method for GSI and RQD is inverse distance weighting, a simple estimation method which presumes that samples closer to the estimated point are more likely to be similar with the point than the samples further away. Estimation points are divided evenly so that each block is divided into 27 (3 x 3 x 3) estimation points (discretisation points). The final estimated value of each block is an average of estimated values of discretisation points. The used weighting for close range estimation is the inverse of the distance between the data point and the discretisation point raised to the power of two. However, when the search radius is longer than 70 m the power used is one and the effect of closer samples is decreased.
The estimations for GSI and RQD are made in separate domains, each representing volumes of similar rock qualities. Samples for GSI and RQD estimations are made by extracting 1 m composites from GSI and RQD intervals in the drillhole database separately for each estimation domain. The estimation domains of RMM 2.3 are listed in Table 2-3. The estimation was completed in four rounds except for influence zones where the 5th estimation round was added to fill the rest of the blocks. Finally, the cores of brittle fracture zones were assigned by their interpreted GSI values (Simelius 2014 and Mönkkönen et al. 2012b), see Table 2-4. Estimation rounds, ellipsoid search radii and sample amounts of GSI and RQD interpolation are compiled in Table 2-5.The result of the estimation is evaluated in Chapter 3.
Table 2-3. Estimation domains for GSI and RQD.
Domains outside BFZ influence zones
Above BFZ OL-BFZ019c
Between BFZ influence zones OL-BFZ019c and OL-BFZ020a and above z=-125 m
Between BFZ influence zones OL-BFZ019c and OL-BFZ020a and below z=-125 m
Between BFZ influence zones OL-BFZ020a and OL-BFZ099 and above z=-125 m
Between BFZ influence zones OL-BFZ020a and OL-BFZ099 and below z=-125 m
Below BFZ influence zone OL-BFZ099
Domains inside BFZ influence zones
OL-BFZ020a
OL-BFZ020b
OL-BFZ021
OL-BFZ045
OL-BFZ084
OL-BFZ099
OL-BFZ100
OL-BFZ146

8
Table 2-4. GSI values assigned for cores of brittle fracture zones (Simelius 2014 and Mönkkönen 2012b).
Brittle fracture zone GSI
OL-BFZ016 49
OL-BFZ019a 59
OL-BFZ019c 64
OL-BFZ020a 54
OL-BFZ020b 50
OL-BFZ021 41
OL-BFZ039 60
OL-BFZ043 65
OL-BFZ045 43
OL-BFZ084 47
OL-BFZ099 41
OL-BFZ100 43
OL-BFZ101 45
OL-BFZ106 27
OL-BFZ118 60
OL-BFZ146 49
OL-BFZ219 51
Table 2-5. Estimation rounds for GSI and RQD.
Estimation class round
Inverse distance weighting power
Search ellipsoid radius (m)
Search ellipsoid axis ratios (major/minor) Domains excluding BFZ influence zones
Axis ratios (major/minor) BFZ influence zones
Minimum number of samples
Maximum number of samples
1 2 10 1:1 1:1 3 50
2 2 30 1:1 1:1 15 50
3 2 70 2:1 1:1 30 150
4 1 500 2:1 1:1 50 1000
5 1 1000 1:1 50 1000

9
2.3 Peak strength
The estimation for peak strength was computed in three estimation rounds with inverse distance weighting as the estimation method. Unlike for the GSI and RQD estimations, the long search distances were not used and most of the blocks are not estimated (Figure 2-2). The estimation is made using Is50 point load results converted into UCS values (MPa) with a conversion factor of 17.45 (Posiva 2013). No domain constraints were used for peak strength in this RMM version. Estimation rounds, search radii and sample amounts for peak strength interpolation are compiled in Table 2-6.
Figure 2-2. The result of peak strength estimation. Due to the 70m maximum search radius, the majority of the block model remains non-estimated.
Table 2-6. Estimation rounds for peak strength.
Estimation class round
Search ellipsoid radius (m)
Search ellipsoid axis ratios
Minimum number of samples
Maximum number of samples
1 10 1:1 1 50
2 30 1:1 2 50
3 70 1:1 3 50
10
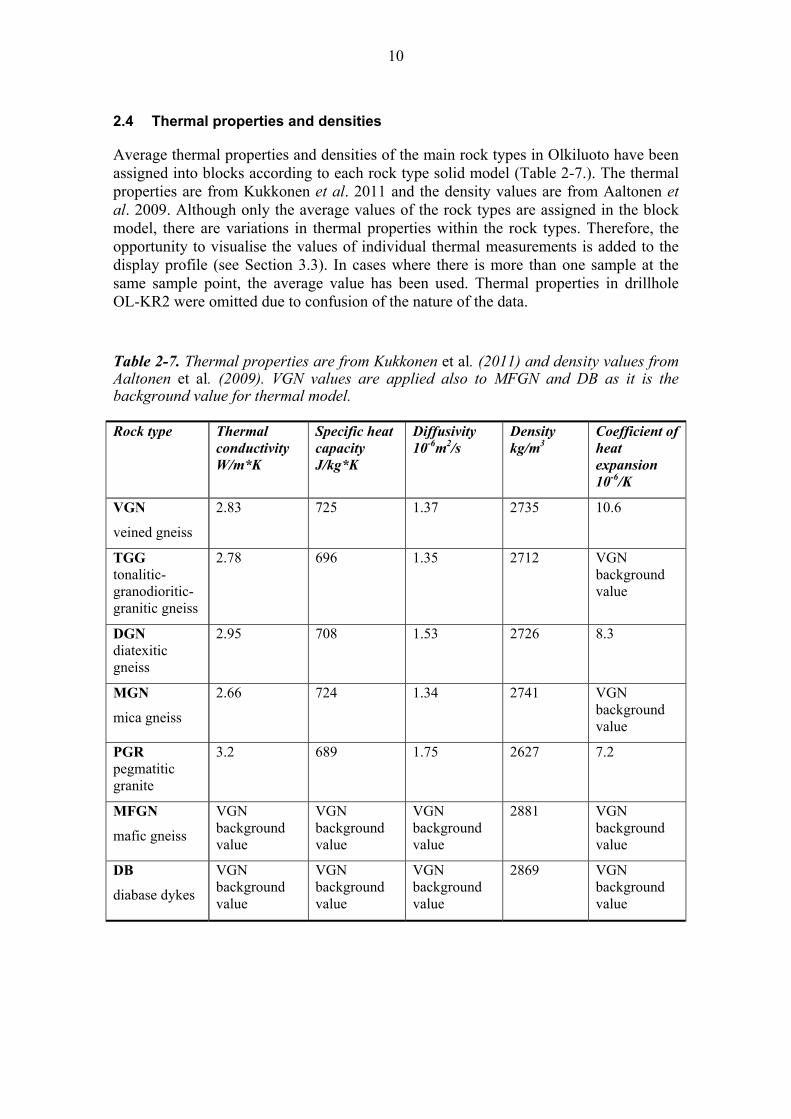
2.4 Thermal properties and densities
Average thermal properties and densities of the main rock types in Olkiluoto have been assigned into blocks according to each rock type solid model (Table 2-7.). The thermal properties are from Kukkonen et al. 2011 and the density values are from Aaltonen et al. 2009. Although only the average values of the rock types are assigned in the block model, there are variations in thermal properties within the rock types. Therefore, the opportunity to visualise the values of individual thermal measurements is added to the display profile (see Section 3.3). In cases where there is more than one sample at the same sample point, the average value has been used. Thermal properties in drillhole OL-KR2 were omitted due to confusion of the nature of the data.
Table 2-7. Thermal properties are from Kukkonen et al. (2011) and density values from Aaltonen et al. (2009). VGN values are applied also to MFGN and DB as it is the background value for thermal model.
Rock type Thermal conductivity W/m*K
Specific heat capacity J/kg*K
Diffusivity 10-6m2/s
Density kg/m3
Coefficient of heat expansion 10-6/K
VGN
veined gneiss
2.83 725 1.37 2735 10.6
TGG tonalitic-granodioritic-granitic gneiss
2.78 696 1.35 2712 VGN background value
DGN diatexitic gneiss
2.95 708 1.53 2726 8.3
MGN
mica gneiss
2.66 724 1.34 2741 VGN background value
PGR pegmatitic granite
3.2 689 1.75 2627 7.2
MFGN
mafic gneiss
VGN background value
VGN background value
VGN background value
2881 VGN background value
DB
diabase dykes
VGN background value
VGN background value
VGN background value
2869 VGN background value

11
2.5 Display profile
A display profile and toolbar were developed to improve visualisation and easy access to the rock mechanics data for the Olkiluoto area. The tools can be used with GEOVIA Surpac software which is the main 3D modelling software for Posiva staff and Posiva consultants.
The display profile consists of a Surpac toolbar with simple buttons to visualise the block model, database and 3D models. For instance, block model and database features can be constrained and coloured with user preferences. The detailed description and a user guide for the RMM display profile are in Appendix 2.
Figure 2-3. Example of a display profile view in Surpac: rock types of drillhole logging and tunnel mapping.

12
3 PROGRESS FROM RMM 2.0 TO RMM 2.3
Throughout the RMM versions, block model estimation has been tested with several different estimation settings to improve reliability of the RM model. Originally, the block modelling method was developed for estimating mineral deposit grades. Implementing block modelling for rock mechanics, however, requires the testing of different estimation scenarios to achieve the result closest to the actual rock mechanics conditions. Since version 2.0 (Mönkkönen et al. 2012a), the aim has been to increase the use of geological constraints in the block model estimation. The progress for the latest RMM versions, 2.0, 2.2 and 2.3 is compiled in Table 3.1. Version 2.2 is not officially published, but it is reported as an internal memorandum for Posiva and WSP Finland Oy.
Table 3-1. Progress from RMM version 2.0 to version 2.3.
RMM version 2.0 2.2 2.3
Rock mechanics domains in block model (GSI and RQD)
Low GSI and RQD values filtered from the input data, fracture zones displayed as 3D planes
No filtering of input data. Fracture zone cores assigned and influence zones used as estimation domains (site scale zones)
Influence zones from a few more structures included. Volumes between major near horizontal facture zones treated as separate domains
Estimation of peak strength
Peak strength assigned by rock type.
Peak strength estimation with UCS and Is50 (converted to UCS) values.
Peak strength estimated with Is50 values converted to UCS
Surpac display profile
Display profile development started.
The first version of display profile to user evaluation. Drillhole visualisation, block model constraining and colouring by attributes.
Features added (e.g. stress measurement data), interface improved.
Estimation rounds for GSI and RQD
5 estimation rounds with different search radii: 1=10m, 2=30m, 3=70m, 4=200m, 5=500m. Inverse distance power 2.
6 estimation rounds with different search radii: 1=10m, 2=30m, 3=70m, 4=200m, 5=500m, 6=1000 (round 6 only for influence zones). Inverse distance power 2.
5 estimation rounds with different search radii: 1=10m, 2=30m, 3=70m, 4=500m, 5=1000m (round 5 only for influence zones). Inverse distance power 2 for rounds 1-3 and 1 for round 4 (and 5).
Dimensions, origins, extents and rotation around Z axis
Y 6791610, 1250m X 1526020, 650m Z -500, 520m
rotation 310°
Y 6791550, 1250m X 1525970, 730m Z -500, 520m
rotation 306°
Y 6791550, 1250m X 1525970, 730m Z -500, 520m
rotation 306°

13
3.1 The steps in development of block model estimation for GSI and RQD
In RMM version 2.0, the goal was to create a model where the block model represents the rock mass outside the brittle fracture zones. This was done because the narrow fracture zones are challenging in terms of being applied to the block model: the block size is usually much larger than the intersections of the fracture zones resulting to overestimation of the structures. Before estimation, the low GSI and RQD values from the brittle fracture zones were filtered from the input data to prevent the spreading of low GSI and RQD values into the block model. The models of the brittle fracture zones were to be visualised with corresponding 3D planes (Mönkkönen et al. 2012a). However, this procedure exaggerated good rock qualities in the RM block model and, even though the fracture zone 3D planes were used in conjunction with the block model, the block model gave an impression of only a homogenous, good quality rock mass. Manual filtering of the data is also an issue considering repeatability and automatic updating of the RMM.
In version 2.2, more effort was put into evaluating rock mechanics domains and to constrain estimations according to defined domains. As already noted in version 2.0, the narrow fracture zones are challenging to implement into the block model of minimum 2.5 m block size and they cannot be used as separate estimation domains. After testing, it was decided to assign the blocks in the cores of significant brittle fracture zones in the RMM area by the interpreted values of each fracture zone. Interpretation of brittle fault zones GSI and RQD values are presented in Simelius 2014 and Mönkkönen et al. 2012b. There are several other modelled brittle fault zones in the RM model area which do not have interpreted rock quality values. These fault zones were left out of the block model but can be visualised as 3D planes. In addition, the influence zones of the most prominent fracture zones were defined as rock mechanics domains and used as constraints in estimation. Influence zones are areas around brittle fracture zones where the fracture frequency is higher due to the proximity of a fault. The influence zones are one of the features which determine the layout of the possible repository (Pere et al. 2012). The zones used in RMM 2.2 are OL-BFZ20a, OL-BFZ20b, OL-BFZ21, OL-BFZ99 and OL-BFZ146. For estimation of influence zones, a 6th estimation round of 1000 m radius was added. This was done because, in some of the structures, the sample points were very far from blocks to be estimated. The resulting blocks will have average values within that influence zone which should be kept in mind when using the block model. A high radius value was accepted because the BFZ influence zone is a clear rock quality domain.
Since version 2.2, the dimensions of the model have been extended to include the area of the current design of disposal panel 1. The model has also been rotated slightly differently to match the extents of future geological detailed scale models. The current orientation is 306° around the z-axis.
Version 2.3 is made in a similar way as version 2.2. The estimation domains were defined further, more influence zones were modelled by Jussi Mattila, Posiva and additional domains were added in-between major sub-vertical brittle fracture zones (Table 2-3.). The estimation search radii were changed as well. In versions 2.0 and 2.2, the search radii for estimation rounds were 10 m, 30 m, 70 m, 200 m and 500 m (in version 2.2 also 1000 m inside the BFZ:s) and the estimation was made with an inverse distance power 2. In version 2.3, the round with a 200 m search radius was left out and

14
rounds of 500 m and 1000 m search radii were estimated with an inverse distance power 1. Hence, in estimation rounds with the longest search radii, the weight of samples closer to the block is diminished and the estimated block values are close to the average of all the samples in the estimation domain. This procedure was implemented because, with distances over 70 m, the estimation of rock quality is vague and values closer to the average of the domain are adequate.
The use of estimation domains changes the distribution of GSI and RQD values to be more defined by domain boundaries. In RMM 2.0, where estimation was not constrained by domains, there is vague lowering of rock quality roughly around fracture zones OL-BFZ20a and OL-BFZ20b (Figure 3-1). In RMM version 2.2, this feature seems to be more defined when the influence zones of the brittle fracture zones are used as constraints for estimation (Figure 3-2). In version 2.3, after adding additional constraints between major fracture zones OL-BFZ019c, OL-BFZ20a and OL-BFZ099, the rock mechanics domains start to appear more clearly. For example, the domain above OL-BFZ19c and the domain between OL-BFZ19c and OL-BFZ 20a are more defined (Figure 3-2).
Figure 3-1. Section B of RMM 2.0. View towards NE. Estimation of GSI values. Low GSI values in BFZs are filtered from the input data. The estimation is done separately above and under Z=-125 m.
B
RMM 2.0

15
Figure 3-2. Section B from RMM 2.2 and 2.3. View towards NE. Brittle fault zones appear as thin red lines of blocks and BFZ influence zones appear as a decreasing of rock quality. The domains above OL-BFZ 19c and between OL-BFZ 19c and OL-BFZ 20a are more defined in version 2.3 than in version 2.2. The estimated GSI values have changed slightly in version 2.3 for longest search distances.
B
RMM 2.2
RMM 2.3
19c
20a
16
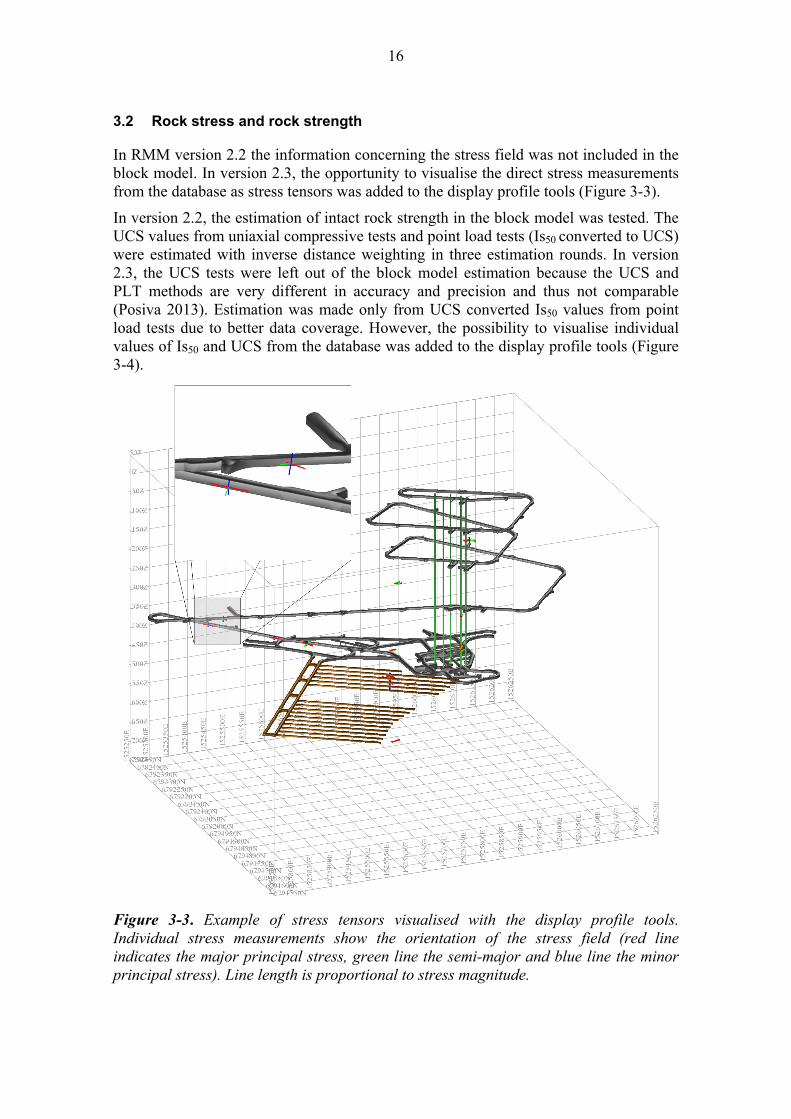
3.2 Rock stress and rock strength
In RMM version 2.2 the information concerning the stress field was not included in the block model. In version 2.3, the opportunity to visualise the direct stress measurements from the database as stress tensors was added to the display profile tools (Figure 3-3).
In version 2.2, the estimation of intact rock strength in the block model was tested. The UCS values from uniaxial compressive tests and point load tests (Is50 converted to UCS) were estimated with inverse distance weighting in three estimation rounds. In version 2.3, the UCS tests were left out of the block model estimation because the UCS and PLT methods are very different in accuracy and precision and thus not comparable (Posiva 2013). Estimation was made only from UCS converted Is50 values from point load tests due to better data coverage. However, the possibility to visualise individual values of Is50 and UCS from the database was added to the display profile tools (Figure 3-4).
Figure 3-3. Example of stress tensors visualised with the display profile tools. Individual stress measurements show the orientation of the stress field (red line indicates the major principal stress, green line the semi-major and blue line the minor principal stress). Line length is proportional to stress magnitude.

17
Figure 3-4. Example of peak strength values visualised with display profile tools. The dots represent the peak strength results from point load tests.
3.3 Thermal properties
Thermal properties and rock densities are assigned in the version 2.2 and 2.3 according to the rock types as in RMM version 2.0. In RMM 2.3, the results from individual samples are displayed from the database as discrete values with display tools (Figure 3-5).
Figure 3-5. Example of density values visualised with display profile tools.

18
4 FUTURE RMM DEVELOPMENT
The next RMM version will be 3.0. The estimated publishing time for the RMM 3.0 report is in 2014. There are no major changes expected to the estimation method and domaining of the block model. However, the display profile will be developed further.
In future, there is a goal to combine different fields of studies which have impact on the rock mechanics conditions in the ONKALO. The main priorities are to connect the RMM directly to the Posiva database and to implement the discrete fracture network (DFN) model into the RMM. The user feedback has generated a large amount of development ideas for the RMM display profile tools which have been arranged to a rough priority order. The display tools will be developed according to user feedback and to match changes made to the RM block model and database.
The following list includes features which are considered to be added or studied for future RMM versions in rough order of priority.
- Further development of automated updating including Potti-database-RMM compatibility.
- Integrating the DFN (discrete fracture network) model into the RMM.
- Further study of rock mechanics domaining, possible geological features affecting rock quality
- Further development of display macros. Updating according to changes made in the database and block model and according to feedback from users.
- Information on fracture orientations.
- Hydrogeological information, K/T-values.
- P-wave velocity.
- Other geophysical data/properties.
- Information from grouting holes, e.g. penetration speed, salinity, electrical conductivity.

19
REFERENCES
Aaltonen, I., Heikkinen, E., Paulamäki, S., Säävuori, H., Vuoriainen, S. & Öhman, I. 2009. Summary of Petrophysical Analysis of Olkiluoto Core Samples 1990-2008. Posiva Oy, Working Report 2009-11.
Aaltonen, I., (ed.), Lahti, M., Engström, J., Mattila, J., Paananen, M., Paulamäki, S., Gehör, S., Kärki, A., Ahokas, T., Torvela, T. & Front, K. 2010. Geological Model of the Olkiluoto Site - Version 2.0. Posiva Oy, Working Report 2010-70.
Aaltonen, I., Engström, J., Front, K., Gehör, S., Kärki, A., Kosunen, P., Mattila, J., Paananen, M. & Paulamäki, S. 2014. Geology of Olkiluoto. Posiva Oy, POSIVA Report 201X-XX (in prep.)
Kirkkomäki, T. 2012. Loppusijoituslaitoksen asemointi ja vaiheittainen rakentaminen 2012. Posiva Oy, Working Report 2012-69.
Kukkonen, I., Kivekäs, L., Vuoriainen, S. & Kääriä, M. 2011. Thermal properties of rocks in Olkiluoto: results of laboratory measurements 1994-2010. Posiva Oy, Working Report 2011-17.
Mönkkönen, H., Hakala, M., Paananen, M. & Laine, E. 2012a. ONKALO Rock Mechanics Model (RMM) Version 2.0. Posiva Oy, Working Report 2012-07.
Mönkkönen, H., Rantanen, T. & Kuula, H. 2012b. Geometrical and Mechanical Properties of the Fractures and Brittle Deformation Zones Based on the ONKALO Tunnel Mapping, 2400-4390 m Tunnel Chainage. Posiva Oy, Working Report 2012-23.
Pere, T., (ed.), Mattila, J., Lindgren, S., Ahokas, H., Vaittinen, T. & Wikström, L. 2012. Layout determining features, their influence zones and respect distances at the Olkiluoto site. Posiva Oy, Working Report 2012-21.
Posiva Oy, 2013. Olkiluoto Site Description 2011. Posiva Oy, POSIVA Report 2011-02.
Posiva Oy, 2014. Site Engineering Report 2012. Posiva Oy, POSIVA Report 2012-23.
Simelius, C. 2014. Geometrical and Mechanical Properties of the Fractures and Brittle Deformation Zones Based on the ONKALO Tunnel Mapping, 4390-4990 m Tunnel Chainage. Posiva Oy, Working Report 2013-32.
GEOVIA Surpac™ of Dassault Systèmes GEOVIA Ltd. http://www.gemcomsoftware.com/products/Surpac

20
APPENDIX 1. SOURCE DATA
Table 1. Models of brittle fault zone used in RMM 2.3.
Brittle fault zone model Updated Source
ol-bfz016_m2011.dtm 2011
Olkiluoto Geological Model 3.0
ol-bfz019a_onkalo2008.dtm 2008
ol-bfz019c_m2012.dtm 2012
ol-bfz020a_m2012.dtm 2012
ol-bfz020b_m2010.dtm 2010
ol-bfz021_m2013.dtm 2013
ol-bfz039_m2010.dtm 2010
ol-bfz043_onkalo2008.dtm 2008
ol-bfz045_m2011.dtm 2011
ol-bfz084_m2011.dtm 2011
ol-bfz099_m2013.dtm 2013
ol-bfz100_m2011.dtm 2011
ol-bfz101_m2013.dtm 2013
ol-bfz106_m2012.dtm 2012
ol-bfz118_onkalo2008.dtm 2008
ol-bfz146_m2012.dtm 2012
ol-bfz219_m2009.dtm 2009

21
Table 2. Models of brittle fault influence zones used in RMM 2.3.
Brittle fault influence zone Source
bfz020a_infzone.dtm Geological model 2.1 and Posiva 2012-21
bfz20b-infzone.dtm Geological model 2.1 and Posiva 2012-21
bfz021_infzone.dtm Geological model 2.1 and Posiva 2012-21
ol-bfz045_damagezone Posiva, Jussi Mattila, unpublished
ol-bfz084_damagezone Posiva, Jussi Mattila, unpublished
bfz100_infzone Posiva, Jussi Mattila, unpublished
bfz099_infzone.dtm Geological model 2.1 and Posiva 2012-21
bfz146_infzone.dtm Geological model 2.1 and Posiva 2012-21

22
Table 3. Lithological models used in RMM 2.3.
Lithological model Source
Diabase dikes:
db1_m2007.dtm…db7_m2007.dtm
Olkiluoto Geological Model
3.0
Diatexitic gneisses: dgn1_m2012.dtm Olkiluoto Geological Model
3.0
Mafic gneisses: Olkiluoto Geological Model
3.0 mfgn1_m2011.dtm mfgn2_m2009.dtm
mfgn3_m2009.dtm mfgn4_m2009.dtm
mfgn5_m2012.dtm mfgn6_m2012.dtm
Mica gneisses:
Olkiluoto Geological Model
3.0
mgn1_m2011.dtm mgn2_m2009.dtm mgn3_m2007.dtm mgn4_m2011.dtm mgn5_m2007.dtm mgn6_m2007.dtm mgn7_m2009.dtm mgn8_m2007.dtm mgn12_m2007.dtm mgn13_m2007.dtm mgn14_m2012.dtm mgn16_m2007.dtm mgn17_m2012.dtm mgn18_m2007.dtm mgn19_m2012.dtm
mgn20_2012.dtm mgn21_m2011.dtm mgn22_m2012.dtm mgn24_m2012.dtm mgn25_m2011.dtm mgn26_m2011.dtm mgn27_m2012.dtm mgn28_m2012.dtm mgn29_m2012.dtm mgn30_m2012.dtm mgn31_m2012.dtm mgn32_m2011.dtm mgn33_m2008.dtm mgn34_m2008.dtm mgn36_m2011.dtm
mgn37_m2012.dtm mgn38_m2011.dtm mgn39_m2011.dtm mgn40_m2012.dtm mgn41_m2011.dtm mgn42_m2011.dtm mgn43_m2012.dtm mgn44_m2011.dtm mgn45_m2012.dtm mgn46_m2012.dtm mgn47_m2012.dtm mgn48_m2012.dtm mgn49_m2012.dtm mgn50_m2012.dtm
table continues to the next page

23
Lithological model Source
Pegmatitic granite:
pgr1_m2010.dtm pgr2_1_m2012.dtm pgr2_2_m2012.dtm pgr5_m2007.dtm pgr6_m2012.dtm pgr8_1_m2012.dtm pgr8_2_m2012.dtm pgr9_1_m2012.dtm pgr9_2_m2012.dtm pgr11_m2012.dtm pgr12_m2007.dtm pgr13_m2007.dtm pgr14_m2010.dtm pgr15_m2007.dtm pgr16_m2012.dtm pgr17_m2007.dtm pgr18_m2007.dtm pgr19_1_m2013.dtm pgr19_2_m2012.dtm pgr20_m2011.dtm pgr21_m2012.dtm pgr23_m2012.dtm pgr24_m2012.dtm pgr25_m2010.dtm pgr26_m2010.dtm pgr27_1_m2011.dtm pgr27_2_m2012.dtm pgr28_m2012.dtm pgr29_m2012.dtm pgr30_m2012.dtm pgr31_m2012.dtm pgr36_m2007.dtm pgr37_m2012.dtm pgr38_m2012.dtm pgr39_m2012.dtm pgr40_m2012.dtm pgr41_1_m2012.dtm pgr41_2_m2012.dtm pgr42_m2011.dtm pgr43_m2011.dtm pgr44_m2011.dtm pgr45_m2012.dtm pgr46_m2011.dtm
pgr47_m2012.dtm pgr48_m2012.dtm pgr49_m2012.dtm pgr50_m2012.dtm pgr51_m2012.dtm pgr52_m2012.dtm pgr53_m2012.dtm pgr54_m2012.dtm pgr55_m2012.dtm pgr56_m2012.dtm pgr57_m2012.dtm pgr58_m2012.dtm pgr59_m2007.dtm pgr60_m2012.dtm pgr61_m2012.dtm pgr62_m2012.dtm pgr63_2012.dtm pgr64_m2007.dtm pgr65_1_m2012.dtm pgr65_2_m2012.dtm pgr65_3_m2012.dtm pgr66_m2012.dtm pgr67_m2012.dtm pgr68_m2008.dtm pgr69_m2011.dtm pgr70_m2012.dtm pgr71_m2012.dtm pgr72_m2012.dtm pgr73_m2012.dtm pgr74_m2012.dtm pgr75_m2012.dtm pgr76_m2011.dtm pgr77_m2012.dtm pgr78_m2012.dtm pgr80_m2012.dtm pgr81_m2012.dtm pgr83_m2012.dtm pgr84_m2012.dtm pgr85_m2012.dtm pgr86_m2012.dtm pgr87_m2012.dtm pgr89_m2012.dtm pgr90_m2012.dtm
pgr91_m2012.dtm pgr92_m2012.dtm pgr93_m2012.dtm pgr94_m2012.dtm pgr95_m2012.dtm pgr96_m2012.dtm pgr97_m2012.dtm pgr98_m2012.dtm pgr99_m2012.dtm pgr100_m2012.dtm pgr101_m2011.dtm pgr102_m2011.dtm pgr103_m2012.dtm pgr104_m2012.dtm pgr105_m2012.dtm pgr106_m2012.dtm pgr107_m2012.dtm pgr108_m2012.dtm pgr109_m2012.dtm pgr110_m2012.dtm pgr111_m2012.dtm pgr112_m2012.dtm pgr113_m2012.dtm pgr115_m2012.dtm pgr116_m2012.dtm pgr117_m2012.dtm pgr118_m2012.dtm pgr119_m2012.dtm pgr120_m2012.dtm pgr121_m2012.dtm pgr122_m2012.dtm pgr123_m2012.dtm pgr124_m2012.dtm pgr125_m2012.dtm pgr126_m2012.dtm pgr127_m2012.dtm pgr128_m2012.dtm pgr129_m2012.dtm pgr130_m2012.dtm pgr131_m2012.dtm pgr132_m2012.dtm pgr133_m2012.dtm pgr134_m2012.dtm
Olkiluoto Geological Model
3.0
table continues to the next page

24
Lithological model Source
Tonalitic-granodioritic-granitic gneisses:
Olkiluoto Geological Model
3.0
tgg1_m2009.dtm tgg2_1_m2010.dtm tgg2_2_m2011.dtm tgg3_m2007.dtm tgg4_m2009.dtm tgg5_m2007.dtm tgg7_1_m2012.dtm tgg8_m2010.dtm tgg9_m2012.dtm tgg10_m2012.dtm tgg11_m2012.dtm tgg13_m2011.dtm tgg14_m2012.dtm tgg15_m2009.dtm tgg16_m2009.dtm tgg17_1_m2012.dtm tgg17_2_m2012.dtm tgg18_m2008.dtm tgg19_m2008.dtm tgg20_m2012.dtm tgg21_m2012.dtm
tgg22_m2012.dtm tgg23_m2011.dtm tgg24_m2013.dtm tgg25_m2012.dtm tgg26_m2009.dtm tgg27_m2009.dtm tgg28_m2013.dtm tgg29_m2012.dtm tgg30_m2007.dtm tgg31_m2012.dtm tgg32_m2011.dtm tgg34_m2012.dtm tgg35_m2012.dtm tgg37_m2008.dtm tgg38_m2010.dtm tgg39_m2008.dtm tgg40_m2009.dtm tgg41_m2012.dtm tgg42_m2008.dtm tgg43_m2008.dtm tgg44_m2012.dtm
tgg45_m2012.dtm tgg46_m2012.dtm tgg47_m2012.dtm tgg48_m2011.dtm tgg49_m2012.dtm tgg50_m2012.dtm tgg51_m2009.dtm tgg52_m2012.dtm tgg53_m2010.dtm tgg54_m2010.dtm tgg55_m2010.dtm tgg55_m2012.dtm tgg56_m2011.dtm tgg57_m2012.dtm tgg58_m2012.dtm tgg59_m2012.dtm tgg60_m2012.dtm tgg61_m2012.dtm tgg62_m2012.dtm tgg63_m2012.dtm

25
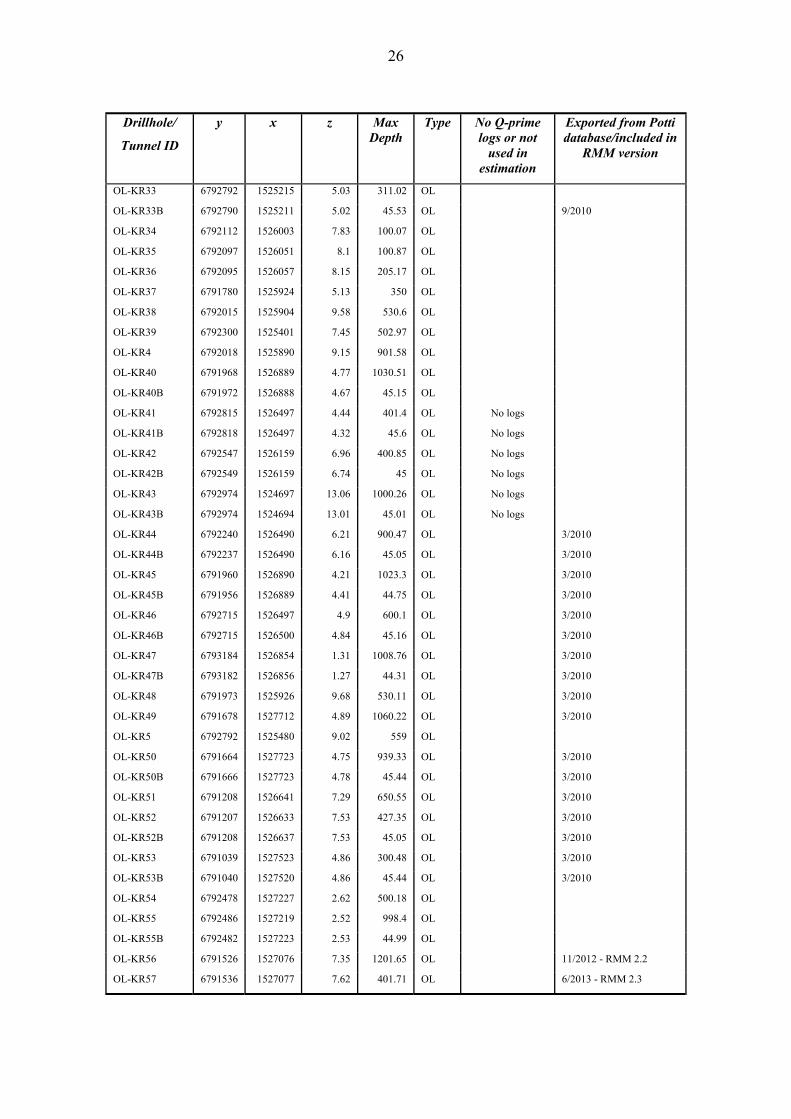
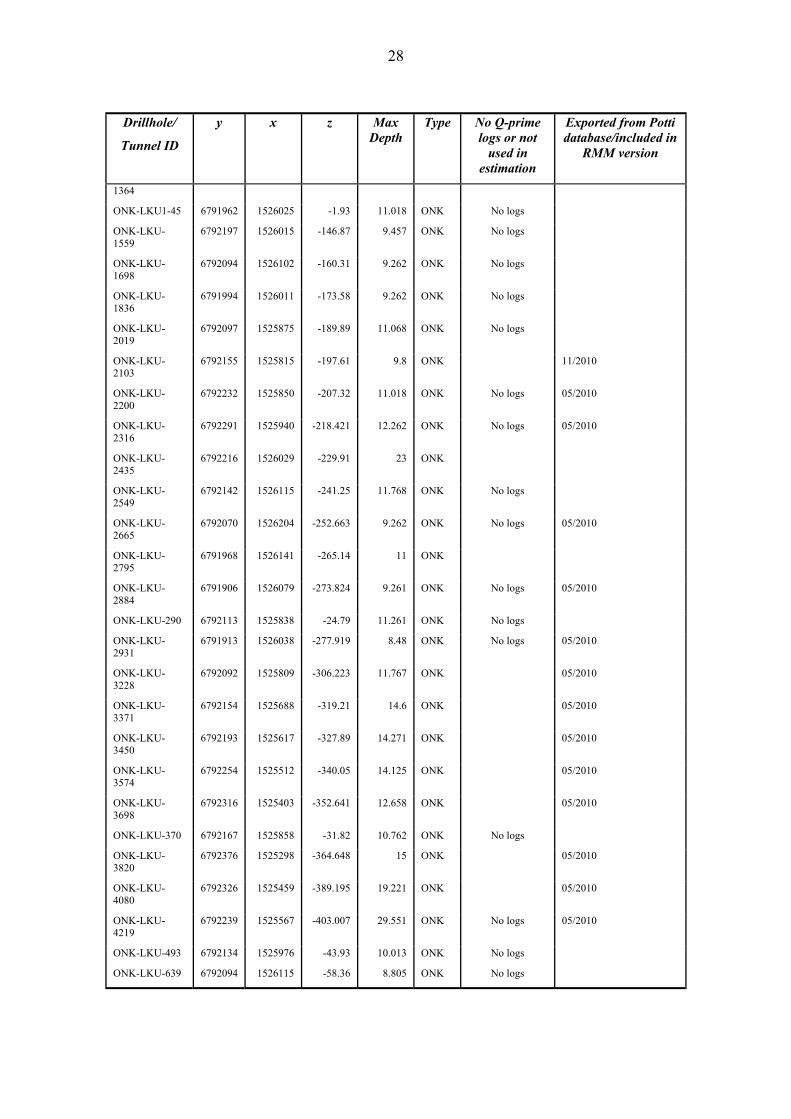
Table 4. Drillhole data used in RMM 2.3. Information used was collar, survey and Q-prime logs. Latest data exported from Potti Offline-database 3.6.2013.
Drillhole/
Tunnel ID
y x z Max Depth
Type No Q-prime logs or not
used in estimation
Exported from Potti database/included in
RMM version
OL-KR1 6792362 1525541 9.91 1001.05 OL
OL-KR10 6792284 1525887 9.39 614.4 OL
OL-KR11 6792634 1526754 4.18 1002.11 OL
OL-KR12 6792572 1525950 8.8 795.34 OL
OL-KR13 6792688 1525980 5.8 500.21 OL
OL-KR14 6792377 1525865 8.27 514.1 OL
OL-KR15 6792440 1525840 8.42 518.85 OL
OL-KR15B 6792442 1525838 8.35 45.14 OL
OL-KR16 6792423 1525797 8.73 170.2 OL
OL-KR16B 6792422 1525794 8.85 45.2 OL
OL-KR17 6792453 1525810 8.43 157.15 OL
OL-KR17B 6792456 1525809 8.44 45.3 OL
OL-KR18 6792433 1525827 8.63 125.49 OL
OL-KR18B 6792422 1525824 9.03 45.53 OL
OL-KR19 6792883 1525760 6.34 544.34 OL
OL-KR19B 6792887 1525763 6.18 45.05 OL
OL-KR2 6792583 1525883 8.62 1051.89 OL
OL-KR20 6792624 1525655 7.43 494.72 OL
OL-KR20B 6792620 1525654 7.25 45.1 OL
OL-KR21 6792707 1525473 7.79 301.08 OL
OL-KR22 6792115 1526259 7.4 500.47 OL
OL-KR22B 6792119 1526259 7.34 45.55 OL
OL-KR23 6791899 1526251 7.85 460.25 OL
OL-KR23B 6791895 1526250 7.88 45.12 OL
OL-KR24 6791992 1525924 9.74 551.11 OL
OL-KR25 6792080 1526000 8.02 604.87 OL
OL-KR25B 6792078 1526002 8.11 44.93 OL
OL-KR26 6791943 1526025 15.14 103 OL
OL-KR27 6791895 1526535 7.25 550.84 OL
OL-KR27B 6791890 1526534 7.08 45.21 OL
OL-KR28 6791921 1526063 14.43 656.33 OL
OL-KR28B 6791925 1526064 14.45 45.3 OL
OL-KR29 6791789 1525602 7.32 870.18 OL
OL-KR3 6792339 1525027 6.95 502.02 OL
OL-KR30 6792225 1525870 8.71 98.28 OL
OL-KR31 6792090 1526200 7.36 340.15 OL
OL-KR31B 6792089 1526206 7.21 45.18 OL 9/2010
OL-KR32 6792606 1525836 6.82 191.81 OL
26
Drillhole/
Tunnel ID
y x z Max Depth
Type No Q-prime logs or not
used in estimation
Exported from Potti database/included in
RMM version
OL-KR33 6792792 1525215 5.03 311.02 OL
OL-KR33B 6792790 1525211 5.02 45.53 OL 9/2010
OL-KR34 6792112 1526003 7.83 100.07 OL
OL-KR35 6792097 1526051 8.1 100.87 OL
OL-KR36 6792095 1526057 8.15 205.17 OL
OL-KR37 6791780 1525924 5.13 350 OL
OL-KR38 6792015 1525904 9.58 530.6 OL
OL-KR39 6792300 1525401 7.45 502.97 OL
OL-KR4 6792018 1525890 9.15 901.58 OL
OL-KR40 6791968 1526889 4.77 1030.51 OL
OL-KR40B 6791972 1526888 4.67 45.15 OL
OL-KR41 6792815 1526497 4.44 401.4 OL No logs
OL-KR41B 6792818 1526497 4.32 45.6 OL No logs
OL-KR42 6792547 1526159 6.96 400.85 OL No logs
OL-KR42B 6792549 1526159 6.74 45 OL No logs
OL-KR43 6792974 1524697 13.06 1000.26 OL No logs
OL-KR43B 6792974 1524694 13.01 45.01 OL No logs
OL-KR44 6792240 1526490 6.21 900.47 OL 3/2010
OL-KR44B 6792237 1526490 6.16 45.05 OL 3/2010
OL-KR45 6791960 1526890 4.21 1023.3 OL 3/2010
OL-KR45B 6791956 1526889 4.41 44.75 OL 3/2010
OL-KR46 6792715 1526497 4.9 600.1 OL 3/2010
OL-KR46B 6792715 1526500 4.84 45.16 OL 3/2010
OL-KR47 6793184 1526854 1.31 1008.76 OL 3/2010
OL-KR47B 6793182 1526856 1.27 44.31 OL 3/2010
OL-KR48 6791973 1525926 9.68 530.11 OL 3/2010
OL-KR49 6791678 1527712 4.89 1060.22 OL 3/2010
OL-KR5 6792792 1525480 9.02 559 OL
OL-KR50 6791664 1527723 4.75 939.33 OL 3/2010
OL-KR50B 6791666 1527723 4.78 45.44 OL 3/2010
OL-KR51 6791208 1526641 7.29 650.55 OL 3/2010
OL-KR52 6791207 1526633 7.53 427.35 OL 3/2010
OL-KR52B 6791208 1526637 7.53 45.05 OL 3/2010
OL-KR53 6791039 1527523 4.86 300.48 OL 3/2010
OL-KR53B 6791040 1527520 4.86 45.44 OL 3/2010
OL-KR54 6792478 1527227 2.62 500.18 OL
OL-KR55 6792486 1527219 2.52 998.4 OL
OL-KR55B 6792482 1527223 2.53 44.99 OL
OL-KR56 6791526 1527076 7.35 1201.65 OL 11/2012 - RMM 2.2
OL-KR57 6791536 1527077 7.62 401.71 OL 6/2013 - RMM 2.3

27
Drillhole/
Tunnel ID
y x z Max Depth
Type No Q-prime logs or not
used in estimation
Exported from Potti database/included in
RMM version
OL-KR57B 6791530 1527078 7.52 45.05 OL 6/2013 - RMM 2.3
OL-KR6 6793046 1525931 2.28 600.77 OL
OL-KR7 6792118 1525559 9.54 811.05 OL
OL-KR8 6791895 1526075 12.24 600.59 OL
OL-KR9 6792130 1526630 5.76 601.25 OL
OL-PP70 6791962 1528080 4.2 20.05 OL-PP 11/2012 - RMM 2.2
OL-PP71 6791688 1527504 5.67 21.02 OL-PP 11/2012 - RMM 2.2
ONK-KPE1-145 6792010 1525939 -11.14 29.315 ONK No logs
ONK-KPE1-1892
6792007 1525963 -178.032 55.4 ONK
ONK-KPE1-3032
6791985 1525969 -287.885 56.7 ONK
ONK-KPE1-4665-51
6791983 1525924 -437.67 77.5 ONK 11/2012 - RMM 2.2
ONK-KPE1-4970-9-23
6791994 1525912 -455.45 17.3 ONK 11/2012 - RMM 2.2
ONK-KPE1-910 6791982 1525970 -83.85 54.645 ONK
ONK-KPE2-174 6792032 1525919 -13.25 23.602 ONK No logs
ONK-KPE2-1940
6792041 1525929 -182.14 44 ONK
ONK-KPE2-3080
6792020 1525934 -291.817 43.81323 ONK
ONK-KPE2-3081
6792020 1525934 -291.17 39 ONK 2/2012 - RMM 2.1
ONK-KPE2-4970
6792019 1525923 -455.82 17 ONK 11/2012 - RMM 2.2
ONK-KPE2-981 6792031 1525918 -90.94 29.663 ONK
ONK-KPE3-1892
6792007 1525963 -178.032 57.4 ONK
ONK-KPE3-3032
6791989 1525947 -286.609 33.54871 ONK
ONK-KPE3-4665-47
6791982 1525919 -437.72 18.4 ONK 2/2012 - RMM 2.1
ONK-KPE3-4970-9-42
6791975 1525910 -455.08 23 ONK 11/2012 - RMM 2.2
ONK-KPE3-910 6791987 1525947 -82.193 32.62438 ONK
ONK-KPE4-4970-9-23
6791994 1525912 -455.45 9 ONK 11/2012 - RMM 2.2
ONK-KR13 6792240 1525585 -401.14 120.45 OL 2/2012 - RMM 2.1
ONK-KR14 6792250 1525593 -400.86 75.27 OL 2/2012 - RMM 2.1
ONK-KR15 6792331 1525468 -387.85 79.96 OL 2/2012 - RMM 2.1
ONK-LKU-1127
6792134 1525817 -105.42 11.068 ONK No logs
ONK-LKU-1228
6792212 1525773 -114.67 9.262 ONK No logs
ONK-LKU- 6792307 1525869 -128.06 9.261 ONK No logs
28
Drillhole/
Tunnel ID
y x z Max Depth
Type No Q-prime logs or not
used in estimation
Exported from Potti database/included in
RMM version
1364
ONK-LKU1-45 6791962 1526025 -1.93 11.018 ONK No logs
ONK-LKU-1559
6792197 1526015 -146.87 9.457 ONK No logs
ONK-LKU-1698
6792094 1526102 -160.31 9.262 ONK No logs
ONK-LKU-1836
6791994 1526011 -173.58 9.262 ONK No logs
ONK-LKU-2019
6792097 1525875 -189.89 11.068 ONK No logs
ONK-LKU-2103
6792155 1525815 -197.61 9.8 ONK 11/2010
ONK-LKU-2200
6792232 1525850 -207.32 11.018 ONK No logs 05/2010
ONK-LKU-2316
6792291 1525940 -218.421 12.262 ONK No logs 05/2010
ONK-LKU-2435
6792216 1526029 -229.91 23 ONK
ONK-LKU-2549
6792142 1526115 -241.25 11.768 ONK No logs
ONK-LKU-2665
6792070 1526204 -252.663 9.262 ONK No logs 05/2010
ONK-LKU-2795
6791968 1526141 -265.14 11 ONK
ONK-LKU-2884
6791906 1526079 -273.824 9.261 ONK No logs 05/2010
ONK-LKU-290 6792113 1525838 -24.79 11.261 ONK No logs
ONK-LKU-2931
6791913 1526038 -277.919 8.48 ONK No logs 05/2010
ONK-LKU-3228
6792092 1525809 -306.223 11.767 ONK 05/2010
ONK-LKU-3371
6792154 1525688 -319.21 14.6 ONK 05/2010
ONK-LKU-3450
6792193 1525617 -327.89 14.271 ONK 05/2010
ONK-LKU-3574
6792254 1525512 -340.05 14.125 ONK 05/2010
ONK-LKU-3698
6792316 1525403 -352.641 12.658 ONK 05/2010
ONK-LKU-370 6792167 1525858 -31.82 10.762 ONK No logs
ONK-LKU-3820
6792376 1525298 -364.648 15 ONK 05/2010
ONK-LKU-4080
6792326 1525459 -389.195 19.221 ONK 05/2010
ONK-LKU-4219
6792239 1525567 -403.007 29.551 ONK No logs 05/2010
ONK-LKU-493 6792134 1525976 -43.93 10.013 ONK No logs
ONK-LKU-639 6792094 1526115 -58.36 8.805 ONK No logs

29
Drillhole/
Tunnel ID
y x z Max Depth
Type No Q-prime logs or not
used in estimation
Exported from Potti database/included in
RMM version
ONK-LKU-771 6791995 1526075 -70.64 11.267 ONK No logs
ONK-LKU-866 6791950 1526000 -79.59 10.262 ONK No logs
ONK-MKU-145 6792010 1525939 -11.14 12.762 ONK No logs
ONK-MKU-1892
6792007 1525963 -178.03 13.761 ONK
ONK-MKU-3038
6791989 1525965 -288.177 13 ONK
ONK-MKU-4402
6792148 1525728 -420.45 15 ONK 2/2012 - RMM 2.1
ONK-MKU-4665-93
6792010 1525953 -437.26 15.05 ONK 11/2012 - RMM 2.2
ONK-MKU-4941
6792004 1525948 -455.53 7 ONK 11/2012 - RMM 2.2
ONK-MKU-916 6791986 1525965 -84.49 12.982 ONK No logs
ONK-PH1 6791931 1526086 8.168 160.08 ONK-PH
Not used
ONK-PH10 6792200 1525605 -325.904 180 ONK-PH
Not used 3/2010
ONK-PH11 6792419 1525338 -370.58 131.21 ONK-PH
Not used 3/2010
ONK-PH12 6792315 1525471 -387.78 123.96 ONK-PH
Not used
ONK-PH13 6792248 1525556 -398.49 140.08 ONK-PH
Not used
ONK-PH14 6792191 1525652 -409.38 150.8 ONK-PH
Not used
ONK-PH15 6792102 1525793 -423.89 116.1 ONK-PH
Not used
ONK-PH16 6792153 1525752 -417.31 85.3 ONK-PH
Not used
ONK-PH17 6792161 1525762 -417.87 84.99 ONK-PH
Used
46.7 m - 84.99 m
ONK-PH18 6792066 1525971 -432.78 125.05 ONK-PH
Not used 11/2012 - RMM 2.2
ONK-PH19 6792096 1525970 -431.26 122.98 ONK-PH
Not used 11/2012 - RMM 2.2
ONK-PH2 6792004 1525947 -6.879 122.31 ONK-PH
Not used
ONK-PH20 6792214 1525700 -416.67 40.47 ONK-PH
Used
23.16 m - 40.47 m
11/2012 - RMM 2.2
ONK-PH22 6792172 1525782 -420.1 88.21 ONK-PH
11/2012 - RMM 2.2
ONK-PH23 6792156 1525797 -421.69 77.13 ONK-PH
11/2012 - RMM 2.2
ONK-PH26 6792170 1525769 -420.02 23.04 ONK-PH
6/2013 - RMM 2.3
ONK-PH27 6792180 1525776 -420.22 20.12 ONK-PH
6/2013 - RMM 2.3

30
Drillhole/
Tunnel ID
y x z Max Depth
Type No Q-prime logs or not
used in estimation
Exported from Potti database/included in
RMM version
ONK-PH3 6792047 1526127 -59.976 144.91 ONK-PH
Not used
ONK-PH4 6791957 1525995 -77.356 96.01 ONK-PH
Not used
ONK-PH5 6792039 1525912 -88.229 202.64 ONK-PH
Not used
ONK-PH6 6792305 1525905 -128.205 155.04 ONK-PH
Not used
ONK-PH7 6792000 1525972 -174.05 100.31 ONK-PH
Not used
ONK-PH8 6792039 1525907 -291.828 150.22 ONK-PH
Not used
ONK-PH9 6792109 1525777 -306.54 150.27 ONK-PH
Not used 3/2010
ONK-PP165 6792263 1525966 -134.3 5.2 ONK-PP
6/2013 - RMM 2.3
ONK-PP166 6792263 1525966 -137.59 10.05 ONK-PP
6/2013 - RMM 2.3
ONK-PP167 6792262 1525967 -137.7 5.22 ONK-PP
6/2013 - RMM 2.3
ONK-PP198 6792016 1525903 -290.13 141.2 ONK-PP
No logs
ONK-PP199 6792294 1525467 -342.819 50.09 ONK-PP
11/2010
ONK-PP200 6792293 1525469 -342.791 50.79 ONK-PP
11/2010
ONK-PP202 6792303 1525466 -342.835 8.06 ONK-PP
11/2010
ONK-PP203 6792302 1525467 -342.862 5.25 ONK-PP
11/2010
ONK-PP204 6792302 1525464 -342.57 7.73 ONK-PP
11/2010
ONK-PP205 6792302 1525464 -344.003 5.37 ONK-PP
11/2010
ONK-PP206 6792341 1525355 -356.02 16.05 ONK-PP
11/2010
ONK-PP207 6792323 1525465 -343.47 5.38 ONK-PP
11/2010
ONK-PP208 6792323 1525465 -343.5 5.37 ONK-PP
11/2010
ONK-PP209 6792323 1525466 -343.59 5.38 ONK-PP
11/2010
ONK-PP227 6792337 1525355 -357.75 15.09 ONK-PP
11/2010
ONK-PP240 6792341 1525346 -355.38 4.9 ONK-PP
11/2010
ONK-PP253 6792321 1525464 -344.66 6.35 ONK-PP
11/2010
ONK-PP254 6792321 1525463 -344.66 6.35 ONK-PP
11/2010

31
Drillhole/
Tunnel ID
y x z Max Depth
Type No Q-prime logs or not
used in estimation
Exported from Potti database/included in
RMM version
ONK-PP255 6792322 1525464 -344.66 2.31 ONK-PP
11/2010
ONK-PP256 6792320 1525465 -344.66 4.34 ONK-PP
11/2010
ONK-PP257 6792320 1525463 -344.66 1.37 ONK-PP
11/2010
ONK-PP258 6792322 1525463 -344.65 5.36 ONK-PP
11/2010
ONK-PP259 6792337 1525464 -344.42 7.48 ONK-PP
11/2010
ONK-PP260 6792337 1525464 -344.42 7.45 ONK-PP
11/2010
ONK-PP261 6792338 1525464 -344.42 7.5 ONK-PP
11/2010
ONK-PP262 6792338 1525341 -357 25.02 ONK-PP
11/2010
ONK-PP263 6792244 1525583 -400.95 14.91 ONK-PP
11/2010
ONK-PP264 6792261 1525969 -138.061 4.23 ONK-PP
11/2010
ONK-PP265 6792260 1525969 -138.057 4.19 ONK-PP
11/2010
ONK-PP266 6792260 1525965 -138.051 4.24 ONK-PP
11/2010
ONK-PP267 6792259 1525965 -138.045 4.27 ONK-PP
11/2010
ONK-PP268 6792323 1525463 -344.75 7.46 ONK-PP
2/2012 - RMM 2.1
ONK-PP269 6792320 1525464 -344.75 7.53 ONK-PP
2/2012 - RMM 2.1
ONK-PP270 6792320 1525464 -344.75 7.53 ONK-PP
2/2012 - RMM 2.1
ONK-PP271 6792323 1525463 -344.75 7.5 ONK-PP
2/2012 - RMM 2.1
ONK-PP272 6792323 1525464 -344.75 2.5 ONK-PP
2/2012 - RMM 2.1
ONK-PP274 6792336 1525342 -357.48 23.88 ONK-PP
2/2012 - RMM 2.1
ONK-PP315 6792169 1525754 -421.55 7.84 ONK-PP
6/2013 - RMM 2.3
ONK-PP316 6792184 1525742 -421.14 7.81 ONK-PP
6/2013 - RMM 2.3
ONK-PP317 6792192 1525735 -420.93 7.78 ONK-PP
6/2013 - RMM 2.3
ONK-PP318 6792248 1525584 -401.21 19.7 ONK-PP
11/2012 - RMM 2.2
ONK-PP319 6792248 1525585 -400.57 15.48 ONK-PP
11/2012 - RMM 2.2
ONK-PP324 6792242 1525593 -401.314 13.3 ONK-PP
2/2012 - RMM 2.1

32
Drillhole/
Tunnel ID
y x z Max Depth
Type No Q-prime logs or not
used in estimation
Exported from Potti database/included in
RMM version
ONK-PP326 6792242 1525593 -401.285 13.3 ONK-PP
2/2012 - RMM 2.1
ONK-PP327 6792242 1525593 -401.454 13.15 ONK-PP
2/2012 - RMM 2.1
ONK-PP340 6792340 1525464 -344.43 10.05 ONK-PP
11/2012 - RMM 2.2
ONK-PP341 6792338 1525464 -344.42 10.06 ONK-PP
11/2012 - RMM 2.2
ONK-PP342 6792337 1525465 -344.42 7.5 ONK-PP
11/2012 - RMM 2.2
ONK-PP343 6792335 1525463 -344.43 7.5 ONK-PP
11/2012 - RMM 2.2
ONK-PP344 6792336 1525462 -344.43 7.5 ONK-PP
11/2012 - RMM 2.2
ONK-PP345 6792337 1525462 -344.42 10.01 ONK-PP
11/2012 - RMM 2.2
ONK-PP346 6792337 1525460 -344.43 10.04 ONK-PP
11/2012 - RMM 2.2
ONK-PP347 6792338 1525462 -344.42 7.5 ONK-PP
11/2012 - RMM 2.2
ONK-PP379 6792161 1525744 -420.97 7.82 ONK-PP
6/2013 - RMM 2.3
ONK-PP380 6792167 1525738 -420.8 7.85 ONK-PP
6/2013 - RMM 2.3
ONK-PP381 6792176 1525731 -420.51 7.8 ONK-PP
6/2013 - RMM 2.3
ONK-PP382 6792183 1525725 -420.33 7.84 ONK-PP
6/2013 - RMM 2.3
ONK-PP383 6792206 1525706 -419.77 7.77 ONK-PP
6/2013 - RMM 2.3
ONK-PP384 6792215 1525698 -419.63 7.81 ONK-PP
6/2013 - RMM 2.3
ONK-PP68 6792016 1525903 -90.1 85 ONK-PP
No logs
ONK-PP90 6791995 1525922 -79.82 86.2 ONK-PP
No logs
ONK-PVA10 6792408 1525280 -366.45 20.1 ONK-PVA
2/2012 - RMM 2.1
ONK-PVA6 6792150 1525684 -318.68 35.15 ONK-PVA
11/2010
ONK-PVA7 6792247 1525506 -338.67 20.2 ONK-PVA
11/2010
ONK-PVA8 6791907 1526030 -276.44 17.74 ONK-PVA
11/2010
ONK-PVA9 6792148 1525707 -417.46 15.95 ONK-PVA
2/2012 - RMM 2.1
ONK-SPR-3019 6791976 1525978 -286.613 24.8 ONK
ONK-TDT-4399-30
6792149 1525755 -421.54 104.63 ONK 11/2012 - RMM 2.2
ONK-TDT- 6792158 1525765 -421.95 51.4 ONK 2/2012 - RMM 2.1

33
Drillhole/
Tunnel ID
y x z Max Depth
Type No Q-prime logs or not
used in estimation
Exported from Potti database/included in
RMM version
4399-44
ONK-TKU-1473
6792256 1525954 -138.33 19.347 ONK No logs
ONK-TKU-3620
6792280 1525467 -344.57 64.33 ONK 11/2010
ONK-TKU-3747
6792343 1525358 -357.18 19.9 ONK 11/2010
ONK-TKU-3970
6792391 1525374 -378.411 14.601 ONK No logs 05/2010
ONK-TKU-4219
6792239 1525567 -402.36 30.5 ONK
ONK-TPH-4665-154
6792066 1525975 -436.64 127.5 ONK 11/2012 - RMM 2.2
ONK-TT-4366 6792166 1525697 -417.72 22 ONK 2/2012 - RMM 2.1
ONK-TT-4399 6792150 1525726 -420.32 90 ONK 11/2012 - RMM 2.2
ONK-TT-4642 6791976 1525850 -438.03 90 ONK 11/2012 - RMM 2.2
ONK-TT-4665 6791976 1525873 -438.18 192 ONK PL 80 - 190 6/2013 - RMM 2.3
2/2012 - RMM 2.1
ONK-TT-4696 6791946 1525873 -438.446 80.3 ONK 11/2012 - RMM 2.2
ONK-TT-4793 6791921 1525944 -445.97 25.08 ONK 11/2012 - RMM 2.2
ONK-TYT-4399-21
6792146 1525746 -421.15 51.3 ONK 2/2012 - RMM 2.1
ONK-TYT-4512 6792074 1525797 -429.15 36 ONK 2/2012 - RMM 2.1
ONK-TYT-4665-124
6792037 1525968 -436.95 72.58 ONK 11/2012 - RMM 2.2
ONK-TYT-4665-22
6791977 1525896 -437.96 81.45 ONK 11/2012 - RMM 2.2
ONK-TYT-4665-22-24
6792001 1525896 -436.99 22.8 ONK 2/2012 - RMM 2.1
ONK-VT1 6791942 1526065 2.545 4987 ONK PL 4686 - 4987 6/2013 - RMM 2.3

34
APPENDIX 2. DISPLAY PROFILE FEATURES AND FUNCTIONS
1. Open help.
2. Open document of references.
3. Reset graphics, removes everything from graphics space.
4. Zoom to data extents.
5. Select point of rotation for viewing.
6. Inquire point properties.
7. Select and view attributes for one block.
8. Choose block model to open.
9. Close the block model.
10. Display blocks. After opening the block model it has to be displayed with this function. The block model will appear by finally pressing “Zoom all” (no 4).
11. Display block faces.
12. Hide block faces.
13. Choose attribute to colour blocks by.
14. Block constraint selection. GSI and RQD limits separated with a line eg. 60-80. (no spaces, or >, <, ≥, ≤ etc.) The GSI value is estimated from the Q´ value with the following equation
44)'ln(9 QGSI
The selected constraints types (i.e. topography, solids, rock type etc.) are united with AND operator which means that if more than one attribute is selected, they will appear together and all selected constraints rules need to be fulfilled in block to be seen. For example selecting Solids: ONKALO, Rocktype: PGR and VGN, and RQD field as 75-95 will show blocks which are inside ONKALO solid and are either pegmatitic granite or veined gneiss and have a RQD value between 75-95.
15. Remove all block constraints. This includes the sliced block model level.
16. BFZ dtm files selection. There are also BFZ influence zone dtm-files to select from as well as BFZ dtm files that are cut around ONKALO solid model.
17. Close all opened BFZ dtm files from graphics.
18. Inquire BFZ name by clicking one of the BFZ dtm file’s triangles.
19. Select files to open from the list (rock type solids, ONKALO solid, topography etc.)
20. Close all files which were selected from the list in the previous function (no 19).
21. Set the Z-level to slice the block model and determine the thickness of the slice. Level can be written or selected from the dropdown list.
22. BFZ level. Choose the method to slice the BFZ dtm files (and other dtm files as well). This function works only together with the previous function no 21. By selecting “Thin”, there will be outline strings of the dtm files on top of the block model slice. By selecting “Thick”, thickness of the slice can be determined. Nevertheless the slice will not be thinner downwards than the block model slice. The thickness up- and downwards is counted from the top of the block model slice.

35
23. Cut the block model neighbourhood. This tool cuts the graphics view by leaving everything in sight within 100 m around the block model (looking straight downwards).
24. Cutting plane. Tool is used by clicking and dragging the mouse cursor to cut the view.
25. Delete all cutting planes. This function removes also the sliced BFZ level.
26. Open database. Database has to be opened in order to display drillholes and ONKALO mapping.
27. Close database.
28. Display drillholes. The database must be open before drillholes and ONKALO mapping can be displayed. Drillholes are displayed by choosing attribute to display and the set of data (ONKALO mapping, pilot holes and/or KR-holes). Block data and ONKALO mapping can be compared with this tool as well.
29. Hide all drillholes.
30. Display stress tensors.
31. Display data of a stress measurement by clicking a stress tensor line.
32. Sphere query. This tool searches rock strength and rock mass quality data within a sphere around the pickup point. The results will be shown in a pop-up excel file.
33. Turn lights on.
34. Turn lights off.