fracture toughness properties of rocks in olkiluoto: laboratory measurements … · 2012-11-07 ·...
TRANSCRIPT

POSIVA OY
FI-27160 OLKILUOTO, FINLAND
Tel +358-2-8372 31
Fax +358-2-8372 3709
Topias Siren
May 2012
Working Report 2012-25
Fracture Toughness Properties ofRocks in Olkiluoto:
Laboratory Measurements 2008–2009
May 2012
Working Reports contain information on work in progress
or pending completion.
The conclusions and viewpoints presented in the report
are those of author(s) and do not necessarily
coincide with those of Posiva.
Topias Siren
Posiva Oy
Working Report 2012-25
Fracture Toughness Properties ofRocks in Olkiluoto:
Laboratory Measurements 2008–2009

FRACTURE TOUGHNESS PROPERTIES OF ROCKS IN OLKILUOTO: LABORATORY MEASUREMENTS 2008-2009 ABSTRACT
In Olkiluoto an underground rock characterization facility (ONKALO) for the final disposal site of spent nuclear fuel has been under thorough research many years, but further knowledge is needed on fracture toughness parameters. Fracture toughness parameters are important for example in fracture mechanics prediction for Posiva’s Olkiluoto Spalling Experiment (POSE). This working report describes a laboratory campaign that was done between 2008 and 2009. The campaign aimed at determining the fracture mechanics parameters as well as density and ultrasonic velocities for Olkiluoto rocks. The specimens delivered were selected by Posiva; the core showed no damage and the quality of the delivered cores was good with varying sample diameter. Most of the test samples (9 out of 12) are gneissic rock. The Mode I fracture toughness was determined using two different methods to account for two different fracturing directions. The methods are the Chevron Bend (CB) test as proposed in the ISRM Suggested Method and a method based on the Brazilian Disk (BD) experiment. The Mode II fracture toughness was determined using the Punch- Through Shear with Confining Pressure experiment on the remaining pieces from the CB testing. The scatter in the results is very large, even within one piece of core sample. Usually the scatter of results is less than 5 %. The high scatter in the data at hand is believed to be due to the very inhomogeneous nature of the rock material. The magnitude of the determined Mode I fracture toughness compares well with available reported data for medium to coarse grained granitoide rocks. However the scatter of the mode II fracture toughness values is higher than experienced on other rock types, but the variability is reasonable for the inhomogeneous rock type. Distinguishing the fracture toughness values for different anisotropy directions would require more thorough testing with quality samples at different anisotropy directions. However since fracture mechanics predictions require anisotropic fracture toughness parameters, the results are divided into two regions to acquire the upper and lower limits to distinguish two anisotropy directions. These values are used already in modeling of the POSE in situ experiment. Keywords: Olkiluoto, ONKALO, fracture toughness, rock anisotropy, mode I, Chevron Bend, Brazilian Disk, mode II, Punch-through shear with confining pressure, P-wave, S-wave.
OLKILUODON KIVIEN RAKOSITKEYSOMINAISUUDET: LABORATORIOTUTKIMUKSET 2008-2009
TIIVISTELMÄ
Olkiluodossa maanalainen kallioperän tutkimustila (ONKALO) ydinjätteen loppusijoi-tuspaikkaa varten on ollut perusteellisen tutkimuksen kohteena vuosien ajan, mutta täy-dentävää tietoa tarvitaan rakojen sitkeysparametreista. Rakositkeysparametrit ovat tär-keitä esimerkiksi rakomekaanisen ennusteen laatimisessa POSE-kokeeseen (Posiva’s Olkiluoto Spalling Experiment). Tässä työraportissa kuvataan vuosina 2008 ja 2009 tehty laboratoriokampanja, jossa pyrittiin määrittämään Olkiluodon kivien rakomekaaniset parametrit sekä tiheydet ja seismiset nopeudet. Toimitetut näytteet valittiin Posivan toimesta. Kairasydännäytteissä ei havaittu vaurioita, ja toimitettujen, erikokoisten näytteiden laatu oli hyvä. Suurin osa näytteistä (9 / 12 kpl) olivat gneissisiä. Tilan I (mode I) rakositkeys määritettiin käyttämällä kahta erillistä menetelmää, joissa rako kuormitetaan eri suuntiin näytteessä. Menetelmät ovat Chevron Bend (CB) -koe ISRM:n suosituksen mukaisesti sekä Brazilian Disk (BD) -koe. Tilan II (mode II) rakositkeys määritettiin käyttäen Punch-Through Shear with Confining Pressure (läpilyöntileikkaus tukipaineessa) -menetelmää testaten CB-kokeesta jäljelle jääneet näytteet. Tulosten hajonta on erittäin suurta jopa yksittäisen näytteen sisäisesti. Yleensä näytteiden hajonta on alle 5 %. Raportin tulosten erittäin suuren hajonnan uskotaan johtuvan näytteiden kivilajin erittäin epähomogeenisestä luonteesta. Määritetyt tilan I rakositkeys arvot ovat hyvin verrannollisia saatavilla olevien näytteiden arvoihin karkea rakeisessa graniittisessa kivessä. Kuitenkin tilan II rakositkeysarvot ovat korkeampia muihin kivilajeihin verrattuna, mutta hajonta on kohtuullista epähomogeeniselle kivi-lajille. Rakositkeysarvojen määritys eri mittaussuuntiin vaatisi kattavampaa testaamista laaduk-kaista eri suuntiin anisotrooppisista näytteistä. Kuitenkin koska rakomekaanisia ennus-teet vaativat anisotrooppisia rakositkeyslähtötietoja, ovat tulokset jaettu kahteen osaan ylä- ja alarajojen määrittämistä varten eri anisotropiasuunnille. Näin määritettyjä arvoja on käytetty POSE in situ kokeen mallintamisessa. Avainsanat: Olkiluoto, ONKALO, rakositkeys, kiven anisotropia, mode I, Chevron Bend, Brazilian Disk, mode II, Punch-through shear with confining pressure, P-aalto, S-aalto.
1
TABLE OF CONTENTS
ABSTRACT
TIIVISTELMÄ PREFACE ....................................................................................................................... 31 INTRODUCTION .................................................................................................... 5
1.1 Samples ........................................................................................................ 51.2 Fracture propagation modes ......................................................................... 61.3 Fracture toughness values for other rocks .................................................... 7
2 FRACTURE TOUGHNESS TEST METHODS ....................................................... 92.1 Mode I fracture toughness ............................................................................ 9
2.1.1 Chevron Bend method ...................................................................... 92.1.2 Brazilian Disk experiment ............................................................... 10
2.2 Mode II fracture toughness ......................................................................... 102.2.1 Punch-Through Shear with Confining Pressure experiment ........... 10
3 RESULTS ............................................................................................................. 133.1 Mode I fracture toughness .......................................................................... 133.2 Mode II fracture toughness ......................................................................... 153.3 Fracture normal stiffness ............................................................................. 153.4 Density ........................................................................................................ 173.5 P- and S- wave velocities ............................................................................ 18
4 CONCLUSIONS.................................................................................................... 214.1 The effect of anisotropy to fracture toughness ............................................ 23
5 SUMMARY ........................................................................................................... 27REFERENCES ............................................................................................................. 29APPENDICES ............................................................................................................... 31
Appendix I: Photographs of the delivered sample material .................................. 33Appendix II: Photographs after the Chevron Bend test ........................................ 35Appendix III: Photographs after the Brazialian Disk test ....................................... 47Appendix IV: Photographs after the PTS/CP experiment ..................................... 65

2
3
PREFACE
This working report is based on laboratory tests commissioned by Posiva and done by GeoFrames GmbH between 2008 and 2009 on specimens delivered by Posiva. Laboratory tests and initial reporting was done by Tobias Meier and Tobias Backers. Working report was finalized by Topias Siren (Posiva). Erik Johansson (Saanio & Riekkola Oy) reviewed this report thoroughly. Authors want to thank everyone involved in testing procedure and commenting this report.

4

5
1 INTRODUCTION
Currently in Olkiluoto, the construction of the underground rock characterization facility for the final disposal of spent nuclear fuel named ONKALO is underway. The Olkiluoto site has been under thorough research many years, but further knowledge is needed for example to estimate the fracture toughness parameters. Use of fracture mechanics code such as FRACOD, creates need to carry out laboratory tests on fracture toughness parameters. Fracture toughness parameters are important for example in fracture mechanics predictions as done e.g. for Posiva’s Olkiluoto Spalling Experiment (POSE) by Siren (2011).
1.1 Samples
The laboratory campaign was done between 15.04.2008 – 19.06.2009 on specimens delivered by Posiva and yielded at characterizing different anisotropic rock types on behalf of their fracture mechanics parameters as well as density and ultrasonic velocities. The specimens (12 pcs) delivered were selected by Posiva; the core showed no damage and the quality of the delivered cores was good with varying sample diameter. The list of samples is given in Table 1–1 and picture of the samples is presented in Figure 1-1 and in more detail in Appendix I. Table 1–1. Delivered sample material and rock type code.
# Hole ID Sample-ID Sample drillhole depth [m]
Foliation Alpha ( )
Rock type code
1 ONK-PVA5 1.458 14.44-14.72 parallel 5 Veined gneiss
2 ONK-PVA5 1.544 15.31-15.56 parallel 5 Veined gneiss
3 ONK-PVA5 2.533 25.17-25.48 parallel 5 Veined gneiss
4 ONK-PP175 3.230 32.15-32.44 perpendicular 85 Veined gneiss
5 ONK-PP125 5.374 53.60-53.88 perpendicular 80 Veined gneiss
6 ONK-PP125 5.441 54.26-54.55 perpendicular 85 Veined gneiss
7 ONK-PP125 924 9.11-9.36 massive Pegmatitic granite
8 ONK-PH9 5.924 59.09-59.39 massive Pegmatitic granite
9 ONK-PP125 1.725 17.09-17.40 massive Pegmatitic granite
10 ONK-PH10 15.472 154.60-154.84 perpendicular 90 Veined gneiss
11 ONK-PH10 15.548 155.34-155.61 perpendicular 90 Veined gneiss
12 ONK-PH10 17.675 176.60-176.89 perpendicular 75 Veined gneiss

6
Figure 1–1. Above: Delivered samples. Down left: The direction of the foliation to the sample (modified after Hakala et al. 2005). Down right: An example of sample #1 where the direction of foliation was determined to be 5°.
Direction of the foliation varied between samples. Figure 1–1 shows how the direction of foliation is determined. However, the testing angle was not reported, which makes the interpretation of the results more inaccurate and separation of all results to higher and lower domain was decided to be used. Previous work on rock anisotropic behavior in Olkiluoto was done by Hakala et al. (2005). Their results indicate that anisotropy has some effect to peak strength, crack damage strength and tensile strength. Crack initiation strength showed no trend with anisotropy. Hakala et al. (2005) had high dispersion of the results and some anisotropy angles were missing. They suggested that P-wave velocity could be used to obtain the anisotropy direction.
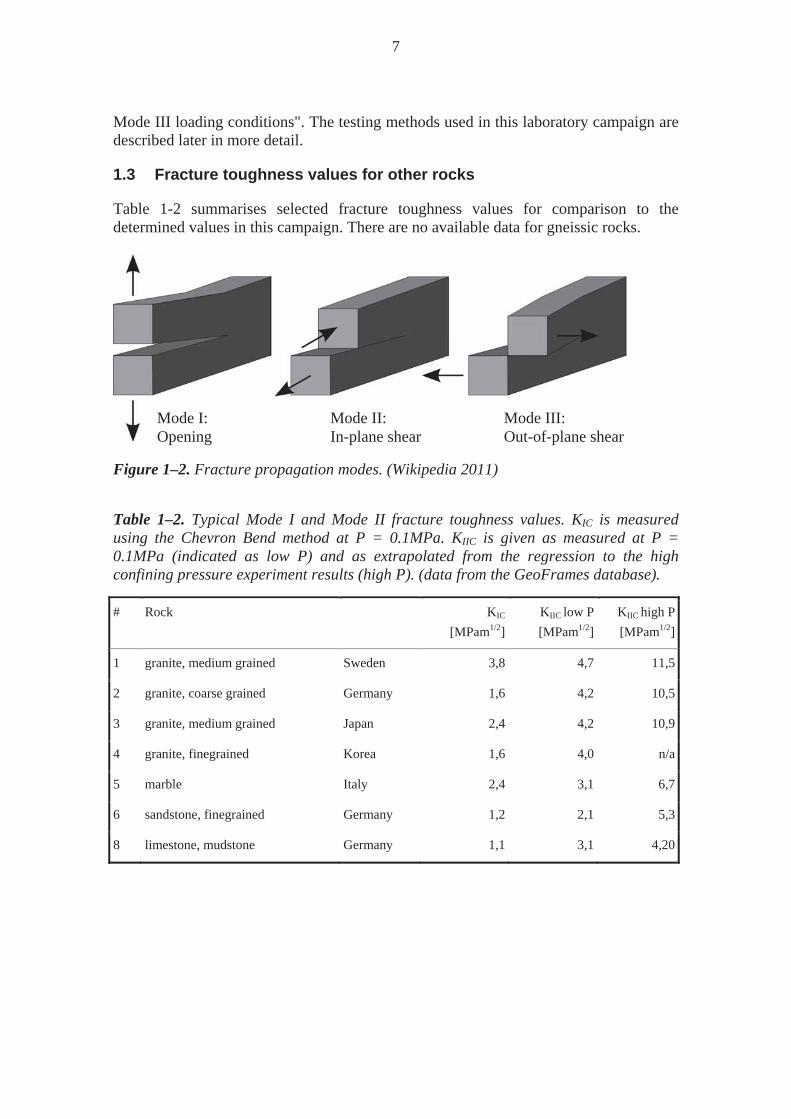
1.2 Fracture propagation modes
In fracture mechanics there are three different modes of fracturing: Mode I opening (tensile), Mode II in- plane shear and Mode III out-of-plane shear. The modes are illustratively presented in Figure 1–2. Critical values for of the fracture propagation for each mode separately, namely the fracture toughness values (for example KIC), can be tested using several different methods. Backers (2004) describes multiple possibilities to test Modes I and II, but states that "there are very few methods available that provide
7
Mode III loading conditions". The testing methods used in this laboratory campaign are described later in more detail.
1.3 Fracture toughness values for other rocks
Table 1-2 summarises selected fracture toughness values for comparison to the determined values in this campaign. There are no available data for gneissic rocks.
Figure 1–2. Fracture propagation modes. (Wikipedia 2011)
Table 1–2. Typical Mode I and Mode II fracture toughness values. KIC is measured using the Chevron Bend method at P = 0.1MPa. KIIC is given as measured at P = 0.1MPa (indicated as low P) and as extrapolated from the regression to the high confining pressure experiment results (high P). (data from the GeoFrames database).
# Rock KIC
[MPam1/2]KIIC low P
[MPam1/2]
KIIC high P[MPam1/2]
1 granite, medium grained Sweden 3,8 4,7 11,5
2 granite, coarse grained Germany 1,6 4,2 10,5
3 granite, medium grained Japan 2,4 4,2 10,9
4 granite, finegrained Korea 1,6 4,0 n/a
5 marble Italy 2,4 3,1 6,7
6 sandstone, finegrained Germany 1,2 2,1 5,3
8 limestone, mudstone Germany 1,1 3,1 4,20
Mode I: Mode II: Mode III: Opening In-plane shear Out-of-plane shear

8
9
2 FRACTURE TOUGHNESS TEST METHODS
The loading conditions and testing methods used in this campaign are described below. The laboratory tests were performed at GeoFrames GmbH laboratory in Potsdam, Germany.
2.1 Mode I fracture toughness
There were two different methods typically used in testing the Mode I fracture toughness, which are described below.
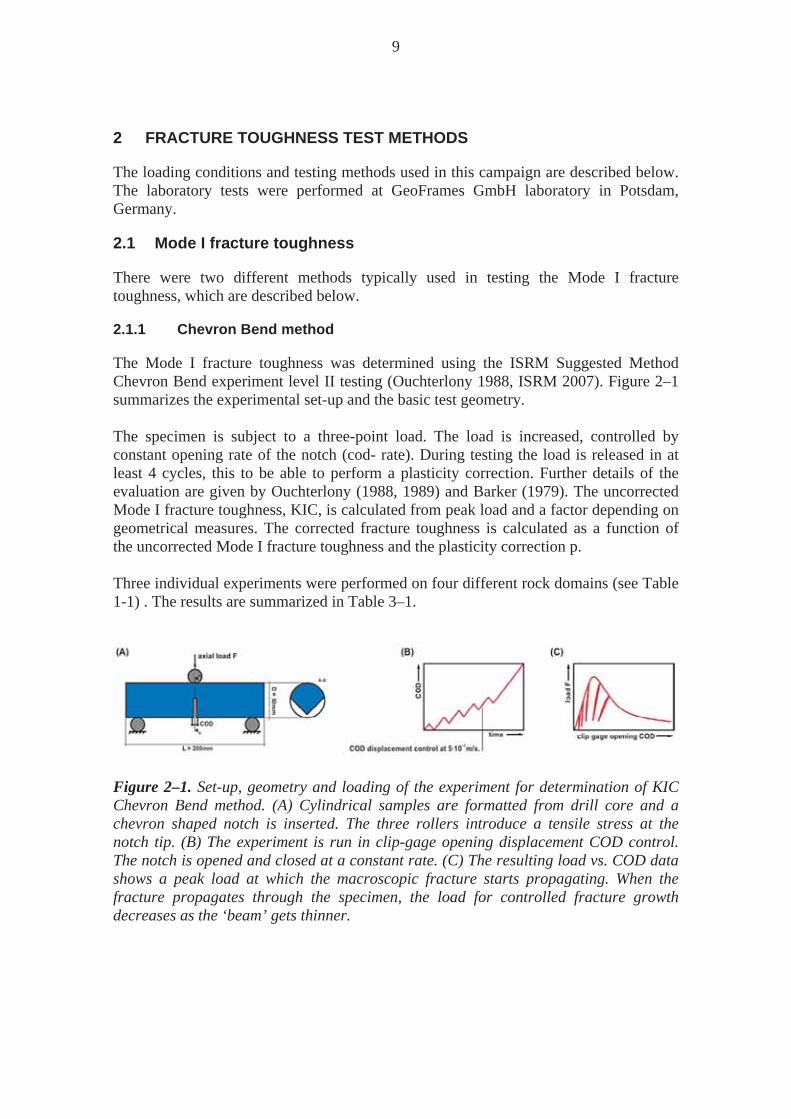
2.1.1 Chevron Bend method
The Mode I fracture toughness was determined using the ISRM Suggested Method Chevron Bend experiment level II testing (Ouchterlony 1988, ISRM 2007). Figure 2–1 summarizes the experimental set-up and the basic test geometry. The specimen is subject to a three-point load. The load is increased, controlled by constant opening rate of the notch (cod- rate). During testing the load is released in at least 4 cycles, this to be able to perform a plasticity correction. Further details of the evaluation are given by Ouchterlony (1988, 1989) and Barker (1979). The uncorrected Mode I fracture toughness, KIC, is calculated from peak load and a factor depending on geometrical measures. The corrected fracture toughness is calculated as a function of the uncorrected Mode I fracture toughness and the plasticity correction p. Three individual experiments were performed on four different rock domains (see Table 1-1) . The results are summarized in Table 3–1.
Figure 2–1. Set-up, geometry and loading of the experiment for determination of KIC Chevron Bend method. (A) Cylindrical samples are formatted from drill core and a chevron shaped notch is inserted. The three rollers introduce a tensile stress at the notch tip. (B) The experiment is run in clip-gage opening displacement COD control. The notch is opened and closed at a constant rate. (C) The resulting load vs. COD data shows a peak load at which the macroscopic fracture starts propagating. When the fracture propagates through the specimen, the load for controlled fracture growth decreases as the ‘beam’ gets thinner.
10
2.1.2 Brazilian Disk experiment
The Mode I fracture toughness was determined using the Brazilian Disk experiment described in detail by Guo et al. (1993). Figure 2–2 summarizes the experimental set-up and the basic test geometry. For further details see Guo et al. 1993. Three individual experiments were performed on each of the Chevron Bend samples, hence 36 experiments in total. The results are summarized in Table 3–2. Note that the specimens were cut from the remaining samples from Chevron Bend testing, hence the fracture propagation direction is perpendicular to the latter. The scatter is different for the different sample materials; e.g. PH10 154.72 showed very high variation of results indicating large local variability. In contrast, e.g. PH10 176.75 showed very little scatter of results.
2.2 Mode II fracture toughness
The Mode II fracture toughness was determined using the Punch-Through Shear with Confining Pressure experiment. Figure 2-3 summarises the experimental set-up and the basic geometry.
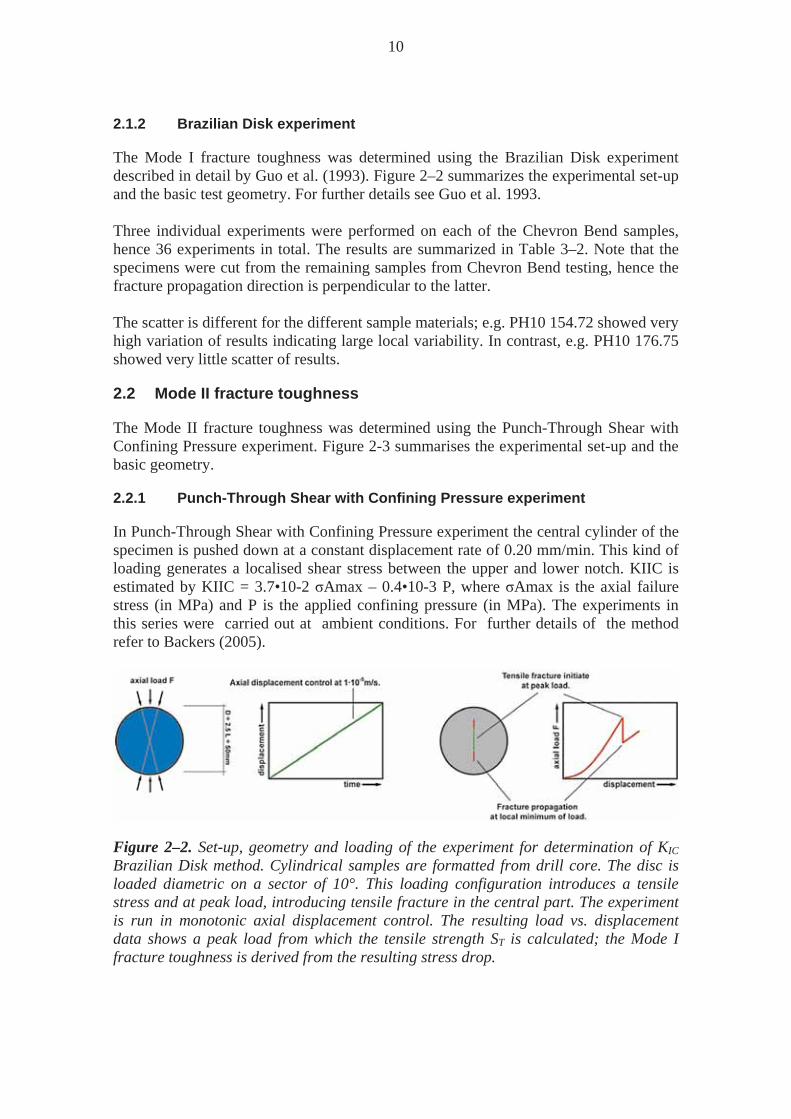
2.2.1 Punch-Through Shear with Confining Pressure experiment
In Punch-Through Shear with Confining Pressure experiment the central cylinder of the specimen is pushed down at a constant displacement rate of 0.20 mm/min. This kind of loading generates a localised shear stress between the upper and lower notch. KIIC is estimated by KIIC = 3.7•10-2 Amax – 0.4•10-3 P, where Amax is the axial failure stress (in MPa) and P is the applied confining pressure (in MPa). The experiments in this series were carried out at ambient conditions. For further details of the method refer to Backers (2005).
Figure 2–2. Set-up, geometry and loading of the experiment for determination of KIC Brazilian Disk method. Cylindrical samples are formatted from drill core. The disc is loaded diametric on a sector of 10°. This loading configuration introduces a tensile stress and at peak load, introducing tensile fracture in the central part. The experiment is run in monotonic axial displacement control. The resulting load vs. displacement data shows a peak load from which the tensile strength ST is calculated; the Mode I fracture toughness is derived from the resulting stress drop.

11
One experiment was performed on each of the Chevron Bend samples, hence 12 experiments in total. The results are summarized in Table 3–3. Note that the specimens were cut from the remaining samples from Chevron Bend testing, hence the fracture propagation direction is perpendicular to the latter.
Figure 2–3. PTS/CP method. (A) Sample geometry and loading configuration. (B) After application of confining pressure P an axial load is applied at constant displacement. (C) The load F vs. axial displacement d plot shows an increase of load and a clear peak. (D) With increasing confining pressure P KIIC shows a non linear behaviour which is represented by a bilinear fit in this schematic representation.

12
13
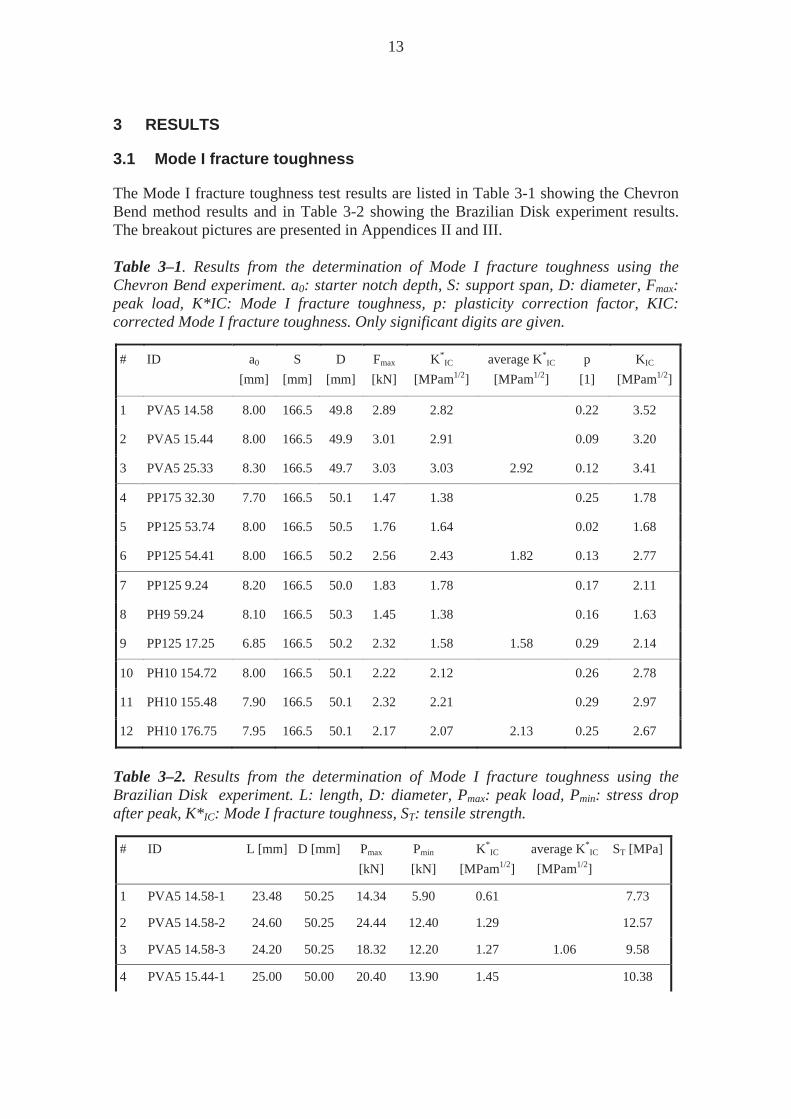
3 RESULTS
3.1 Mode I fracture toughness
The Mode I fracture toughness test results are listed in Table 3-1 showing the Chevron Bend method results and in Table 3-2 showing the Brazilian Disk experiment results. The breakout pictures are presented in Appendices II and III. Table 3–1. Results from the determination of Mode I fracture toughness using the Chevron Bend experiment. a0: starter notch depth, S: support span, D: diameter, Fmax: peak load, K*IC: Mode I fracture toughness, p: plasticity correction factor, KIC: corrected Mode I fracture toughness. Only significant digits are given.
# ID a0 [mm]
S [mm]
D [mm]
Fmax [kN]
K*IC
[MPam1/2] average K*
IC [MPam1/2]
p [1]
KIC
[MPam1/2]
1 PVA5 14.58 8.00 166.5 49.8 2.89 2.82 0.22 3.52
2 PVA5 15.44 8.00 166.5 49.9 3.01 2.91 0.09 3.20
3 PVA5 25.33 8.30 166.5 49.7 3.03 3.03 2.92 0.12 3.41
4 PP175 32.30 7.70 166.5 50.1 1.47 1.38 0.25 1.78
5 PP125 53.74 8.00 166.5 50.5 1.76 1.64 0.02 1.68
6 PP125 54.41 8.00 166.5 50.2 2.56 2.43 1.82 0.13 2.77
7 PP125 9.24 8.20 166.5 50.0 1.83 1.78 0.17 2.11
8 PH9 59.24 8.10 166.5 50.3 1.45 1.38 0.16 1.63
9 PP125 17.25 6.85 166.5 50.2 2.32 1.58 1.58 0.29 2.14
10 PH10 154.72 8.00 166.5 50.1 2.22 2.12 0.26 2.78
11 PH10 155.48 7.90 166.5 50.1 2.32 2.21 0.29 2.97
12 PH10 176.75 7.95 166.5 50.1 2.17 2.07 2.13 0.25 2.67
Table 3–2. Results from the determination of Mode I fracture toughness using the Brazilian Disk experiment. L: length, D: diameter, Pmax: peak load, Pmin: stress drop after peak, K*IC: Mode I fracture toughness, ST: tensile strength.
# ID L [mm] D [mm] Pmax
[kN]
Pmin [kN]
K*IC
[MPam1/2] average K*
IC [MPam1/2]
ST [MPa]
1 PVA5 14.58-1 23.48 50.25 14.34 5.90 0.61 7.73
2 PVA5 14.58-2 24.60 50.25 24.44 12.40 1.29 12.57
3 PVA5 14.58-3 24.20 50.25 18.32 12.20 1.27 1.06 9.58
4 PVA5 15.44-1 25.00 50.00 20.40 13.90 1.45 10.38

14
// Table 3-2 continues
5 PVA5 15.44-2 25.50 50.00 23.70 23.20 2.42 11.82
6 PVA5 15.44-3 27.00 50.00 27.40 18.90 1.97 1.95 12.90
7 PVA5 25.33-1 24.00 50.25 28.00 6.15 0.64 14.77
8 PVA5 25.33-2 24.35 50.25 26.76 5.90 0.61 13.91
9 PVA5 25.33-3 25.38 50.25 26.60 14.84 1.54 0.93 13.27
10 PP175 32.30-1 23.70 50.25 40.00 24.00 2.50 21.36
11 PP175 32.30-2 24.63 50.25 38.00 22.00 2.29 19.53
12 PP175 32.30-3 25.12 50.25 38.00 25.00 2.60 2.46 19.15
13 PP125 53.74-1 24.70 50.25 22.50 15.00 1.56 11.53
14 PP125 53.74-2 24.75 50.25 26.00 18.00 1.87 13.30
15 PP125 53.74-3 23.25 50.25 33.00 8.00 0.83 1.42 17.96
16 PP125 54.41-1 23.50 50.25 40.00 24.00 2.50 21.54
17 PP125 54.41-2 25.85 50.25 33.00 22.00 2.29 16.16
18 PP125 54.41-3 26.55 50.25 25.00 15.00 1.56 2.12 11.92
19 PP125 9.24-1 24.30 49.85 17.50 9.00 0.94 9.19
20 PP125 9.24-2 24.30 49.85 16.50 9.00 0.94 8.66
21 PP125 9.24-3 26.50 49.90 16.77 11.11 1.16 1.01 8.07
22 PH9 59.24-1 24.30 49.60 17.00 15.00 1.56 8.97
23 PH9 59.24-2 25.70 49.60 21.00 12.00 1.25 10.48
24 PH9 59.24-3 23.10 49.60 9.00 8.00 0.83 1.21 5.00
25 PP125 17.25-1 23.80 50.10 15.00 11.00 1.15 8.00
26 PP125 17.25-2 25.60 50.30 16.00 11.00 1.15 7.90
27 PP125 17.25-3 25.50 50.20 14.00 10.50 1.09 1.13 6.96
28 PH10 154.72-1 23.90 50.20 22.50 16.00 1.67 11.93
29 PH10 154.72-2 26.10 50.20 15.00 11.00 1.15 7.28
30 PH10 154.72-3 27.00 50.20 27.13 20.60 2.14 1.65 12.73
31 PH10 155.48-1 24.65 50.15 32.00 19.00 1.98 16.46
32 PH10 155.48-2 24.85 50.20 24.00 12.00 1.25 12.24
33 PH10 155.48-3 26.10 50.20 21.00 10.00 1.04 1.42 10.19
34 PH10 176.75-1 25.20 50.10 22.00 13.00 1.35 11.08
35 PH10 176.75-2 24.10 50.10 21.20 12.40 1.29 11.17
36 PH10 176.75-3 25.60 50.10 24.70 10.10 1.05 1.23 12.25
15
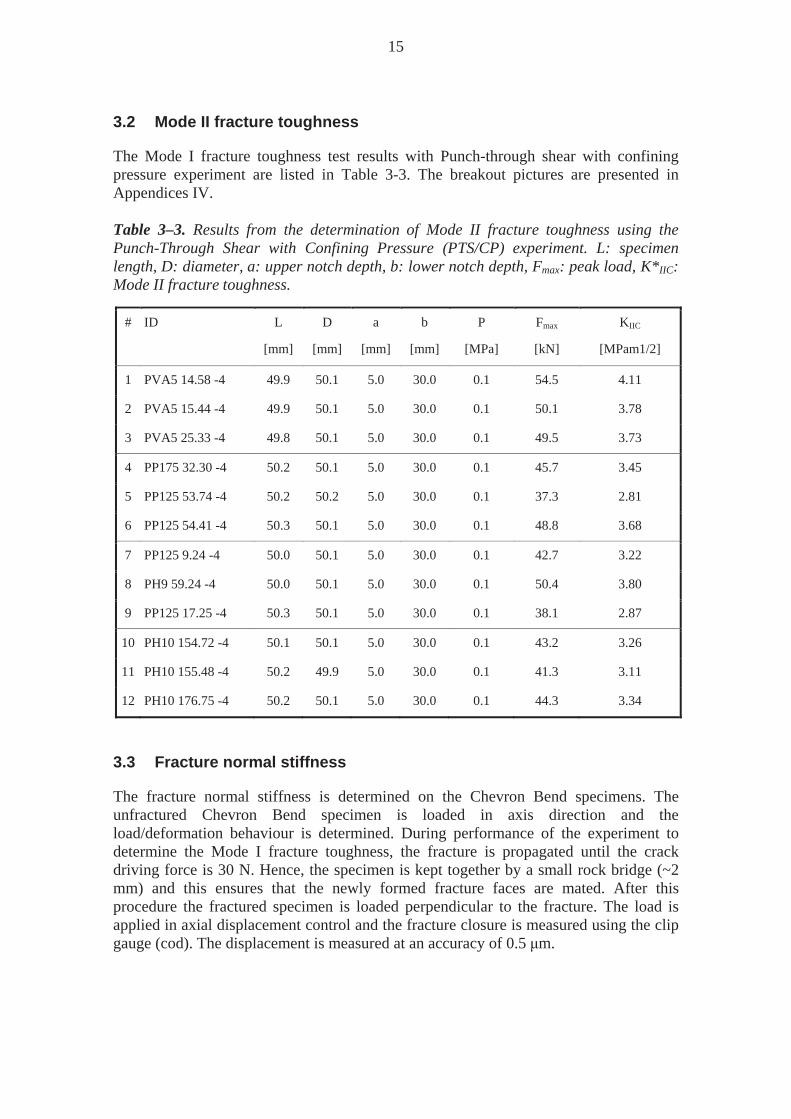
3.2 Mode II fracture toughness
The Mode I fracture toughness test results with Punch-through shear with confining pressure experiment are listed in Table 3-3. The breakout pictures are presented in Appendices IV. Table 3–3. Results from the determination of Mode II fracture toughness using the Punch-Through Shear with Confining Pressure (PTS/CP) experiment. L: specimen length, D: diameter, a: upper notch depth, b: lower notch depth, Fmax: peak load, K*IIC: Mode II fracture toughness.
# ID L
[mm]
D
[mm]
a
[mm]
b
[mm]
P
[MPa]
Fmax
[kN]
KIIC
[MPam1/2]
1 PVA5 14.58 -4 49.9 50.1 5.0 30.0 0.1 54.5 4.11
2 PVA5 15.44 -4 49.9 50.1 5.0 30.0 0.1 50.1 3.78
3 PVA5 25.33 -4 49.8 50.1 5.0 30.0 0.1 49.5 3.73
4 PP175 32.30 -4 50.2 50.1 5.0 30.0 0.1 45.7 3.45
5 PP125 53.74 -4 50.2 50.2 5.0 30.0 0.1 37.3 2.81
6 PP125 54.41 -4 50.3 50.1 5.0 30.0 0.1 48.8 3.68
7 PP125 9.24 -4 50.0 50.1 5.0 30.0 0.1 42.7 3.22
8 PH9 59.24 -4 50.0 50.1 5.0 30.0 0.1 50.4 3.80
9 PP125 17.25 -4 50.3 50.1 5.0 30.0 0.1 38.1 2.87
10 PH10 154.72 -4 50.1 50.1 5.0 30.0 0.1 43.2 3.26
11 PH10 155.48 -4 50.2 49.9 5.0 30.0 0.1 41.3 3.11
12 PH10 176.75 -4 50.2 50.1 5.0 30.0 0.1 44.3 3.34
3.3 Fracture normal stiffness
The fracture normal stiffness is determined on the Chevron Bend specimens. The unfractured Chevron Bend specimen is loaded in axis direction and the load/deformation behaviour is determined. During performance of the experiment to determine the Mode I fracture toughness, the fracture is propagated until the crack driving force is 30 N. Hence, the specimen is kept together by a small rock bridge (~2 mm) and this ensures that the newly formed fracture faces are mated. After this procedure the fractured specimen is loaded perpendicular to the fracture. The load is applied in axial displacement control and the fracture closure is measured using the clip gauge (cod). The displacement is measured at an accuracy of 0.5 m.
16
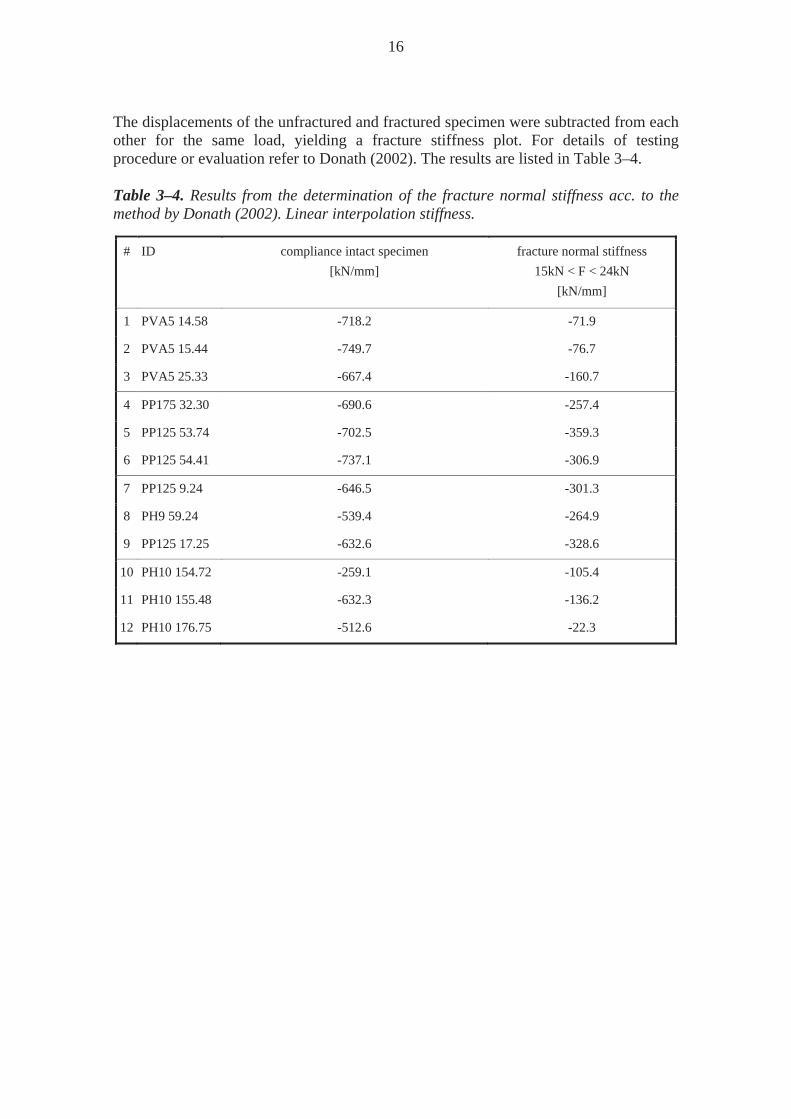
The displacements of the unfractured and fractured specimen were subtracted from each other for the same load, yielding a fracture stiffness plot. For details of testing procedure or evaluation refer to Donath (2002). The results are listed in Table 3–4. Table 3–4. Results from the determination of the fracture normal stiffness acc. to the method by Donath (2002). Linear interpolation stiffness.
# ID compliance intact specimen [kN/mm]
fracture normal stiffness 15kN < F < 24kN
[kN/mm]
1 PVA5 14.58 -718.2 -71.9
2 PVA5 15.44 -749.7 -76.7
3 PVA5 25.33 -667.4 -160.7
4 PP175 32.30 -690.6 -257.4
5 PP125 53.74 -702.5 -359.3
6 PP125 54.41 -737.1 -306.9
7 PP125 9.24 -646.5 -301.3
8 PH9 59.24 -539.4 -264.9
9 PP125 17.25 -632.6 -328.6
10 PH10 154.72 -259.1 -105.4
11 PH10 155.48 -632.3 -136.2
12 PH10 176.75 -512.6 -22.3
17
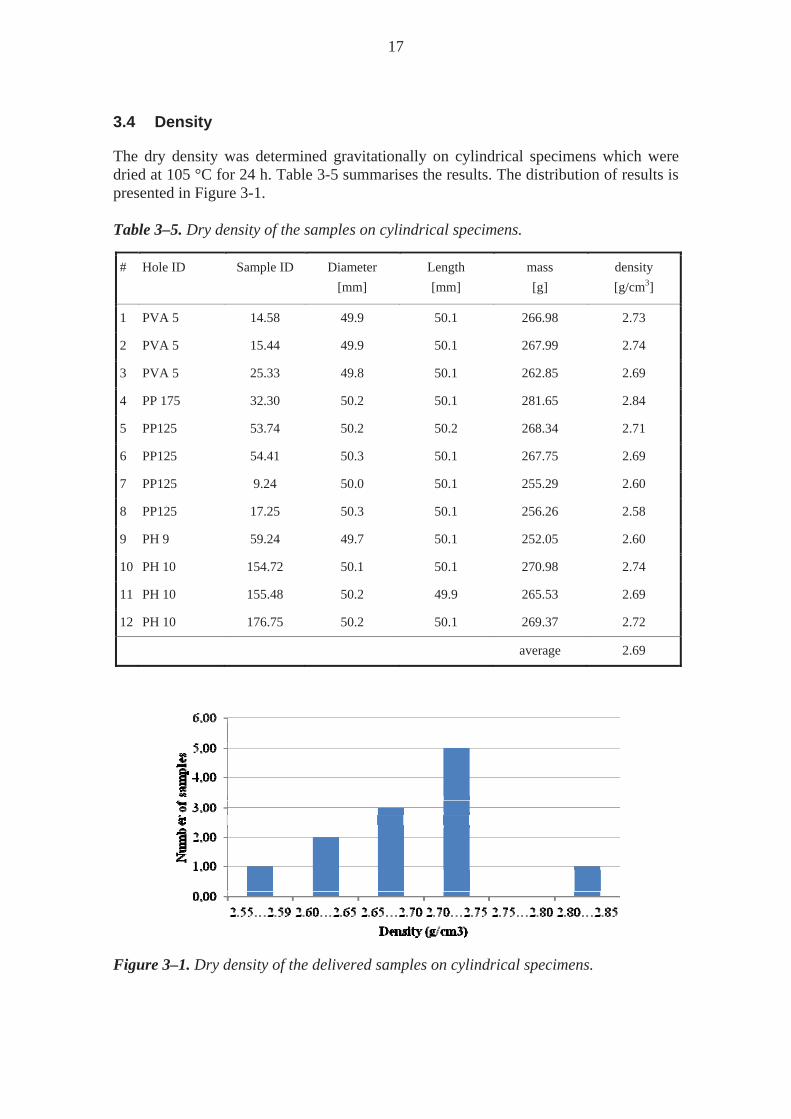
3.4 Density
The dry density was determined gravitationally on cylindrical specimens which were dried at 105 °C for 24 h. Table 3-5 summarises the results. The distribution of results is presented in Figure 3-1. Table 3–5. Dry density of the samples on cylindrical specimens.
# Hole ID Sample ID Diameter [mm]
Length [mm]
mass [g]
density [g/cm3]
1 PVA 5 14.58 49.9 50.1 266.98 2.73
2 PVA 5 15.44 49.9 50.1 267.99 2.74
3 PVA 5 25.33 49.8 50.1 262.85 2.69
4 PP 175 32.30 50.2 50.1 281.65 2.84
5 PP125 53.74 50.2 50.2 268.34 2.71
6 PP125 54.41 50.3 50.1 267.75 2.69
7 PP125 9.24 50.0 50.1 255.29 2.60
8 PP125 17.25 50.3 50.1 256.26 2.58
9 PH 9 59.24 49.7 50.1 252.05 2.60
10 PH 10 154.72 50.1 50.1 270.98 2.74
11 PH 10 155.48 50.2 49.9 265.53 2.69
12 PH 10 176.75 50.2 50.1 269.37 2.72
average 2.69
Figure 3–1. Dry density of the delivered samples on cylindrical specimens.
18
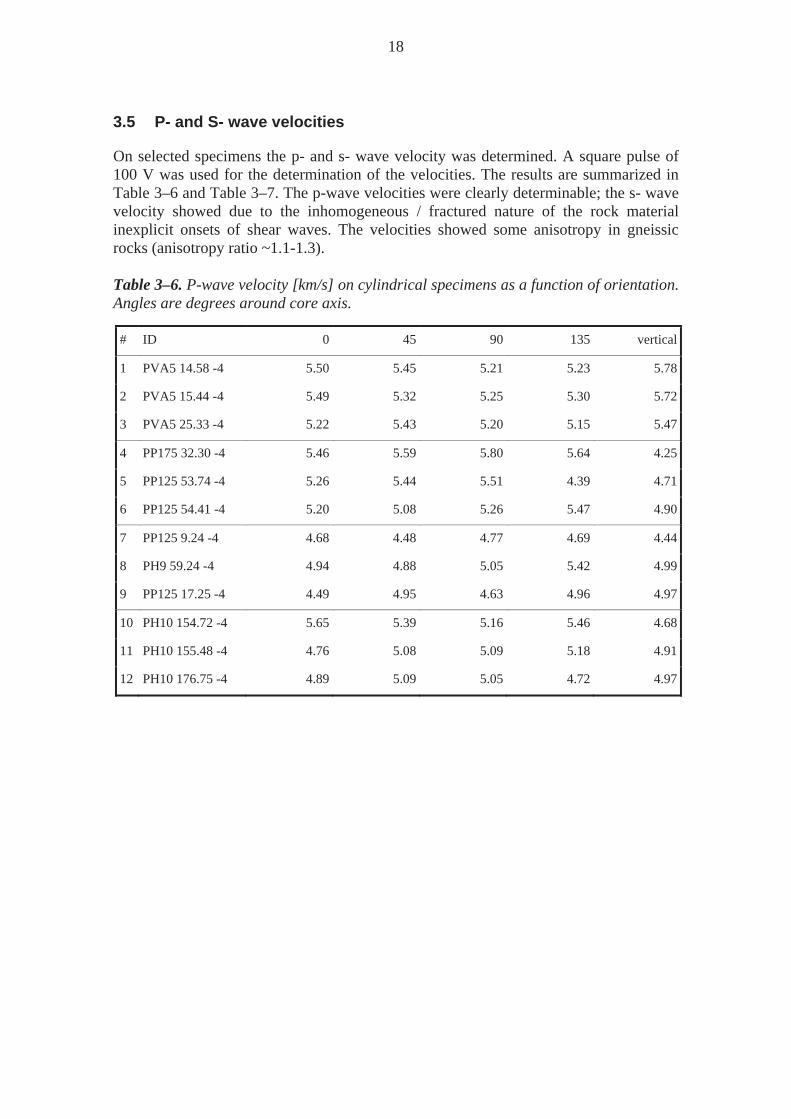
3.5 P- and S- wave velocities
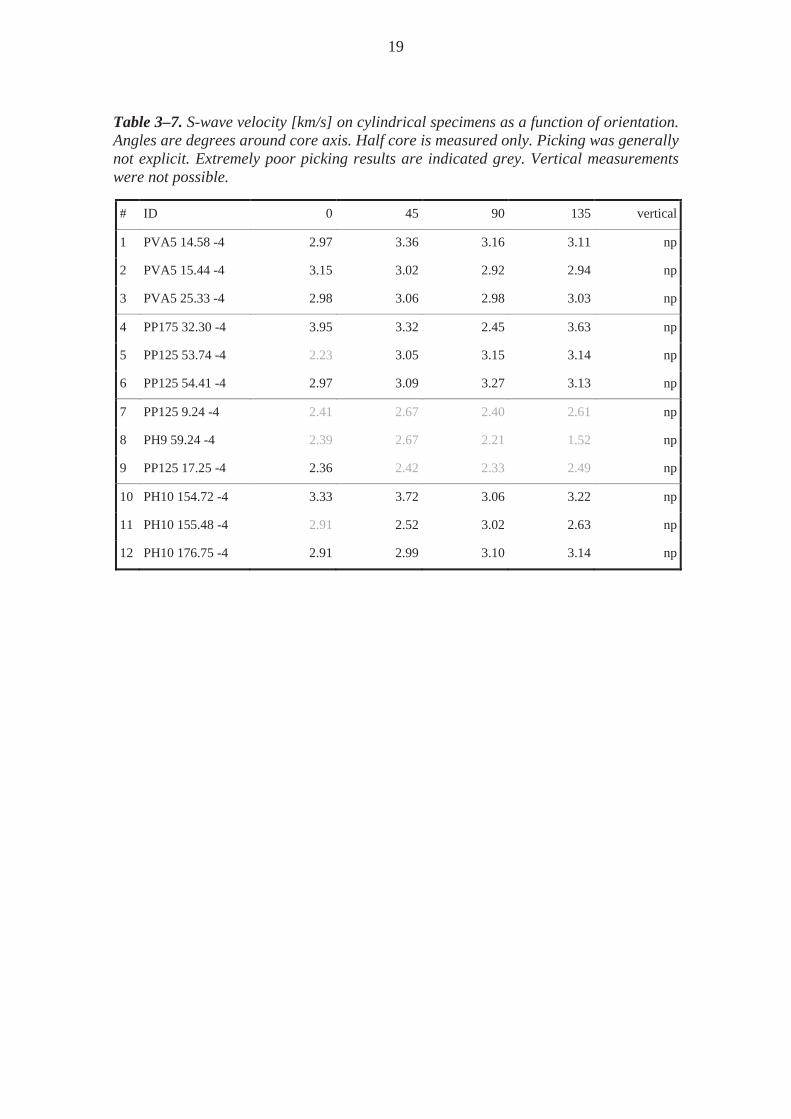
On selected specimens the p- and s- wave velocity was determined. A square pulse of 100 V was used for the determination of the velocities. The results are summarized in Table 3–6 and Table 3–7. The p-wave velocities were clearly determinable; the s- wave velocity showed due to the inhomogeneous / fractured nature of the rock material inexplicit onsets of shear waves. The velocities showed some anisotropy in gneissic rocks (anisotropy ratio ~1.1-1.3). Table 3–6. P-wave velocity [km/s] on cylindrical specimens as a function of orientation. Angles are degrees around core axis.
# ID 0 45 90 135 vertical
1 PVA5 14.58 -4 5.50 5.45 5.21 5.23 5.78
2 PVA5 15.44 -4 5.49 5.32 5.25 5.30 5.72
3 PVA5 25.33 -4 5.22 5.43 5.20 5.15 5.47
4 PP175 32.30 -4 5.46 5.59 5.80 5.64 4.25
5 PP125 53.74 -4 5.26 5.44 5.51 4.39 4.71
6 PP125 54.41 -4 5.20 5.08 5.26 5.47 4.90
7 PP125 9.24 -4 4.68 4.48 4.77 4.69 4.44
8 PH9 59.24 -4 4.94 4.88 5.05 5.42 4.99
9 PP125 17.25 -4 4.49 4.95 4.63 4.96 4.97
10 PH10 154.72 -4 5.65 5.39 5.16 5.46 4.68
11 PH10 155.48 -4 4.76 5.08 5.09 5.18 4.91
12 PH10 176.75 -4 4.89 5.09 5.05 4.72 4.97
19
Table 3–7. S-wave velocity [km/s] on cylindrical specimens as a function of orientation. Angles are degrees around core axis. Half core is measured only. Picking was generally not explicit. Extremely poor picking results are indicated grey. Vertical measurements were not possible.
# ID 0 45 90 135 vertical
1 PVA5 14.58 -4 2.97 3.36 3.16 3.11 np
2 PVA5 15.44 -4 3.15 3.02 2.92 2.94 np
3 PVA5 25.33 -4 2.98 3.06 2.98 3.03 np
4 PP175 32.30 -4 3.95 3.32 2.45 3.63 np
5 PP125 53.74 -4 2.23 3.05 3.15 3.14 np
6 PP125 54.41 -4 2.97 3.09 3.27 3.13 np
7 PP125 9.24 -4 2.41 2.67 2.40 2.61 np
8 PH9 59.24 -4 2.39 2.67 2.21 1.52 np
9 PP125 17.25 -4 2.36 2.42 2.33 2.49 np
10 PH10 154.72 -4 3.33 3.72 3.06 3.22 np
11 PH10 155.48 -4 2.91 2.52 3.02 2.63 np
12 PH10 176.75 -4 2.91 2.99 3.10 3.14 np

20
21
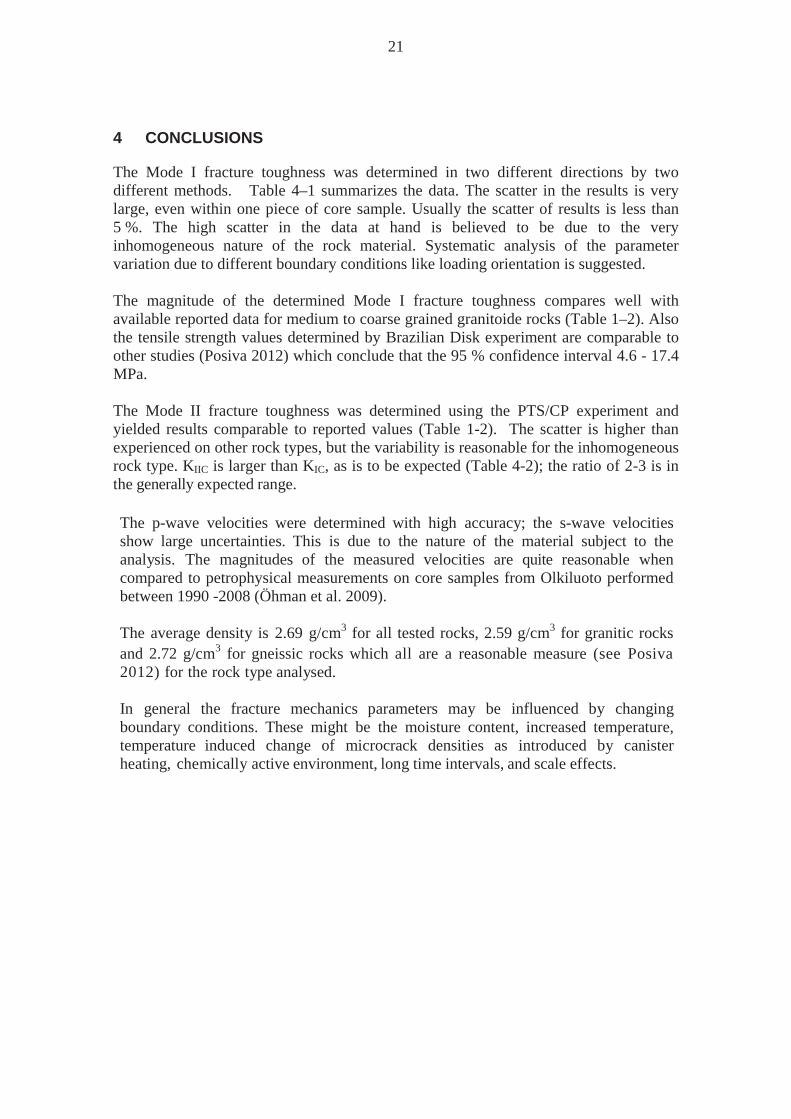
4 CONCLUSIONS
The Mode I fracture toughness was determined in two different directions by two different methods. Table 4–1 summarizes the data. The scatter in the results is very large, even within one piece of core sample. Usually the scatter of results is less than 5 %. The high scatter in the data at hand is believed to be due to the very inhomogeneous nature of the rock material. Systematic analysis of the parameter variation due to different boundary conditions like loading orientation is suggested. The magnitude of the determined Mode I fracture toughness compares well with available reported data for medium to coarse grained granitoide rocks (Table 1–2). Also the tensile strength values determined by Brazilian Disk experiment are comparable to other studies (Posiva 2012) which conclude that the 95 % confidence interval 4.6 - 17.4 MPa. The Mode II fracture toughness was determined using the PTS/CP experiment and yielded results comparable to reported values (Table 1-2). The scatter is higher than experienced on other rock types, but the variability is reasonable for the inhomogeneous rock type. KIIC is larger than KIC, as is to be expected (Table 4-2); the ratio of 2-3 is in the generally expected range. The p-wave velocities were determined with high accuracy; the s-wave velocities show large uncertainties. This is due to the nature of the material subject to the analysis. The magnitudes of the measured velocities are quite reasonable when compared to petrophysical measurements on core samples from Olkiluoto performed between 1990 -2008 (Öhman et al. 2009).
The average density is 2.69 g/cm3 for all tested rocks, 2.59 g/cm3 for granitic rocks and 2.72 g/cm3 for gneissic rocks which all are a reasonable measure (see Posiva 2012) for the rock type analysed.
In general the fracture mechanics parameters may be influenced by changing boundary conditions. These might be the moisture content, increased temperature, temperature induced change of microcrack densities as introduced by canister heating, chemically active environment, long time intervals, and scale effects.
22
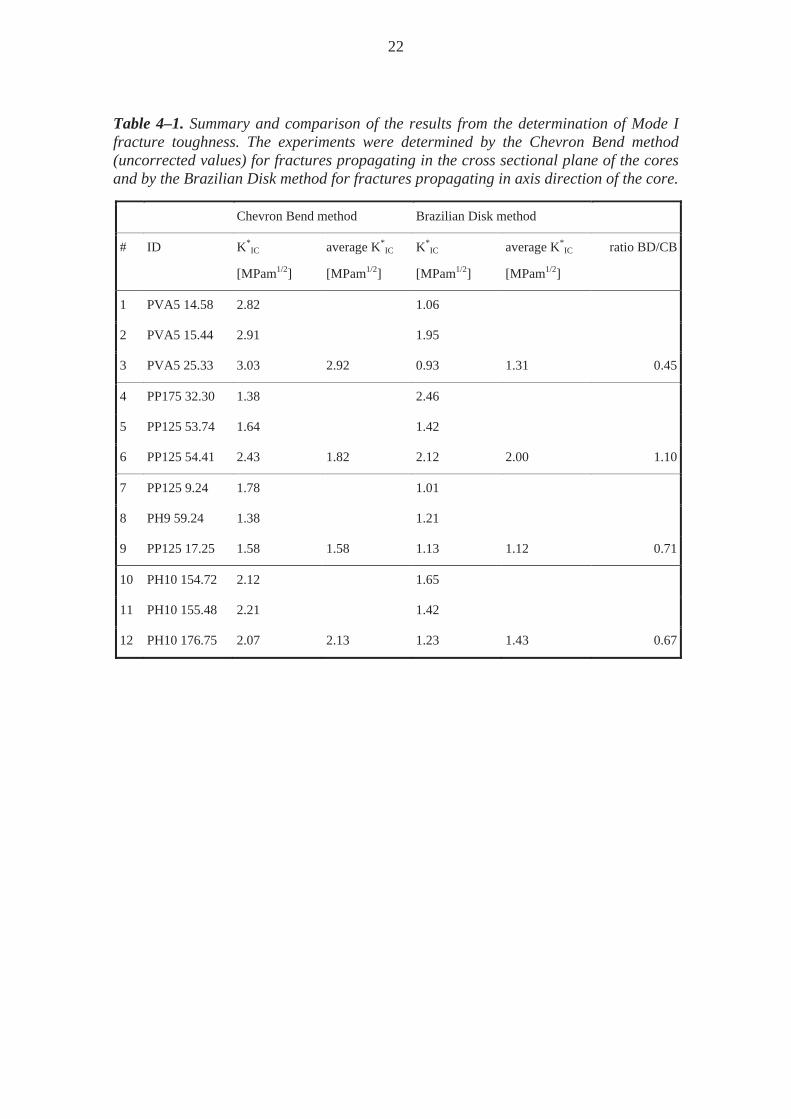
Table 4–1. Summary and comparison of the results from the determination of Mode I fracture toughness. The experiments were determined by the Chevron Bend method (uncorrected values) for fractures propagating in the cross sectional plane of the cores and by the Brazilian Disk method for fractures propagating in axis direction of the core.
Chevron Bend method Brazilian Disk method
# ID K*IC
[MPam1/2]
average K*IC
[MPam1/2]
K*IC
[MPam1/2]
average K*IC
[MPam1/2]
ratio BD/CB
1 PVA5 14.58 2.82 1.06
2 PVA5 15.44 2.91 1.95
3 PVA5 25.33 3.03 2.92 0.93 1.31 0.45
4 PP175 32.30 1.38 2.46
5 PP125 53.74 1.64 1.42
6 PP125 54.41 2.43 1.82 2.12 2.00 1.10
7 PP125 9.24 1.78 1.01
8 PH9 59.24 1.38 1.21
9 PP125 17.25 1.58 1.58 1.13 1.12 0.71
10 PH10 154.72 2.12 1.65
11 PH10 155.48 2.21 1.42
12 PH10 176.75 2.07 2.13 1.23 1.43 0.67

23
Table 4–2. Comparison of the results from the determination of Mode I and Mode II fracture toughness. The results from fracture propagation in direction of the core axis are compared. The ratios between KIIC and KIC are generally in the reported range of 2-3.
Brazilian Disk method PTS/CP method
# ID K*IC
[MPam1/2]
average K*IC
[MPam1/2]
K*IIC
[MPam1/2]
average K*IIC
[MPam1/2]
ratio KIIC/KIC
1 PVA5 14.58 1.06 4.11
2 PVA5 15.44 1.95 3.78
3 PVA5 25.33 0.93 1.31 3.73 3.87 2.95
4 PP175 32.30 2.46 3.45
5 PP125 53.74 1.42 2.81
6 PP125 54.41 2.12 2.00 3.68 3.31 1.66
7 PP125 9.24 1.01 3.22
8 PH9 59.24 1.21 3.80
9 PP125 17.25 1.13 1.12 2.87 3.30 2.95
10 PH10 154.72 1.65 3.26
11 PH10 155.48 1.42 3.11
12 PH10 176.75 1.23 1.43 3.34 3.24 2.26
4.1 The effect of anisotropy to fracture toughness
Most of the test samples (9 out of 12) are gneissic rock and therefore anisotropic. Distinguishing the fracture toughness values for different anisotropy directions, would require more thorough testing with quality samples at different anisotropy directions. However since fracture mechanics predictions (Siren, 2011) require anisotropic fracture toughness parameters, the results are divided into two regions to acquire the upper and lower limits. Values are calculated by using for KIC the Chevron Bend test results and for KIIC the Punch-Through Shear with Confining Pressure (PTS/CP) test results. For pegmatitic granite, the values are calculated as mean of three test values. For different anisotropy directions, the KIC values are determined by using corrected CB results. The results are separated in two regions corresponding to anisotropy directions shown in figure 4–1. For the foliation direction, there are five samples within the range
24
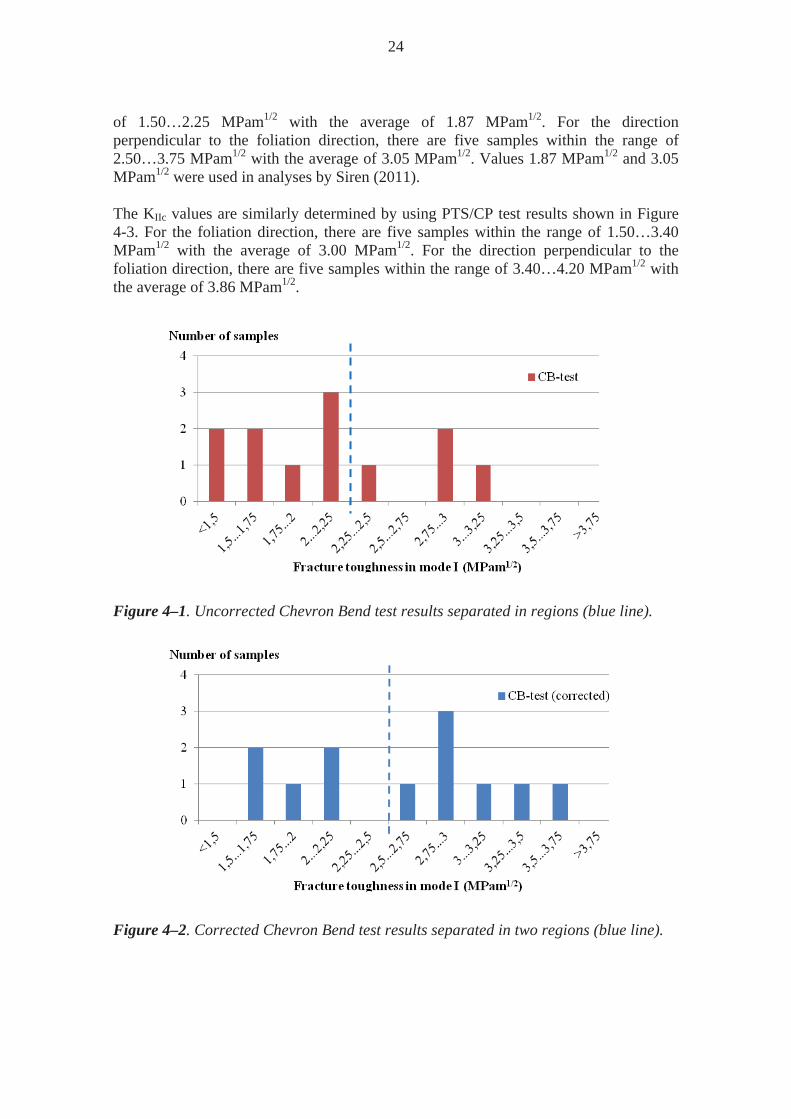
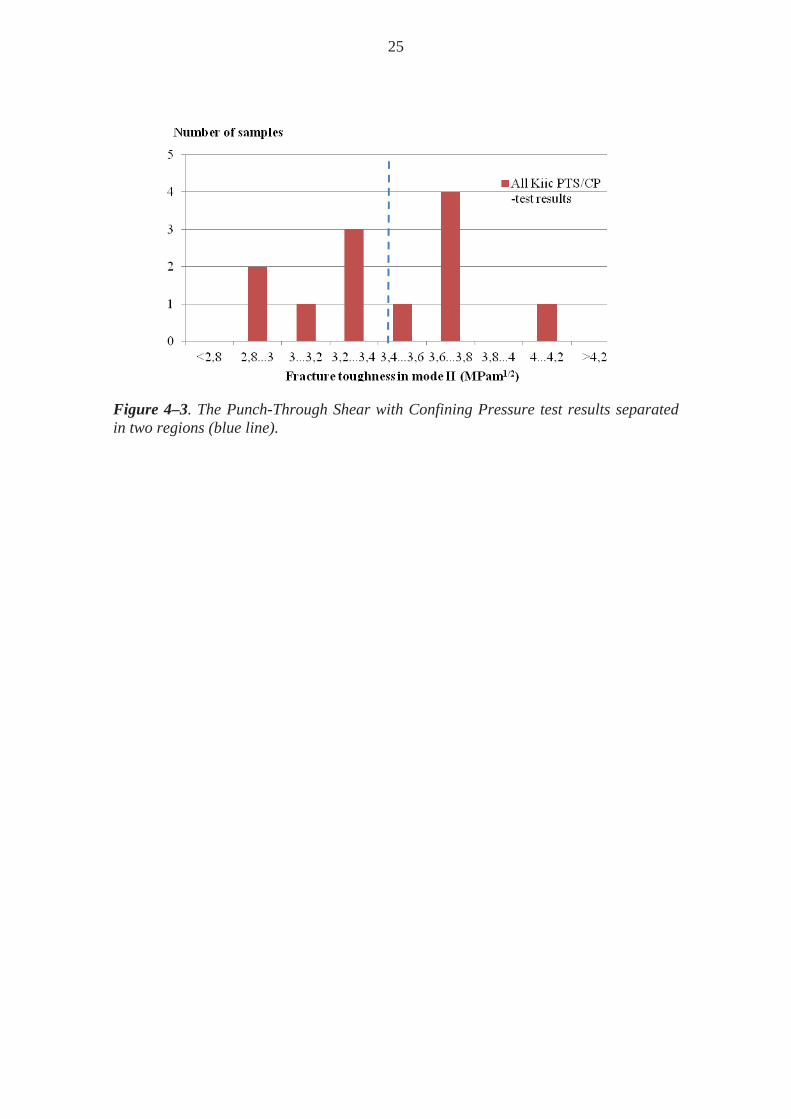
of 1.50…2.25 MPam1/2 with the average of 1.87 MPam1/2. For the direction perpendicular to the foliation direction, there are five samples within the range of 2.50…3.75 MPam1/2 with the average of 3.05 MPam1/2. Values 1.87 MPam1/2 and 3.05 MPam1/2 were used in analyses by Siren (2011). The KIIc values are similarly determined by using PTS/CP test results shown in Figure 4-3. For the foliation direction, there are five samples within the range of 1.50…3.40 MPam1/2 with the average of 3.00 MPam1/2. For the direction perpendicular to the foliation direction, there are five samples within the range of 3.40…4.20 MPam1/2 with the average of 3.86 MPam1/2.
Figure 4–1. Uncorrected Chevron Bend test results separated in regions (blue line).
Figure 4–2. Corrected Chevron Bend test results separated in two regions (blue line).
25
Figure 4–3. The Punch-Through Shear with Confining Pressure test results separated in two regions (blue line).

26

27
5 SUMMARY
A laboratory campaign on specimens delivered by Posiva yielded at characterizing different anisotropic rock types on behalf of their fracture mechanics parameters, tensile strength, density and ultrasonic velocities. The Mode I fracture toughness was determined using two different methods to account for two different fracturing directions. The methods are the Chevron Bend CB test as proposed in the ISRM Suggested Method and a method based on the Brazilian Disk BD experiment. The Mode II fracture toughness was determined on the remaining pieces from the CB testing. The summary of the results is presented in Table 5–1. Table 5–1. Summary of the fracture mechanics parameters, tensile strength, density and ultrasonic velocities for tested laboratory specimens.
parameter unit range of results comment
Mode I fracture toughness
Chevron Bend [MPam1/2] 1.6 - 3.5 fracture propagating
perpendicular to core axis
direction
Mode I fracture toughness
Brazilian Disk [MPam1/2] 0.6 - 2.6 fracture propagating in core
axis direction
Mode II fracture toughness
PTS/CP [MPam1/2] 2.8 - 4.1 fracture propagating in core
axis direction
fracture normal stiffness [kN/mm] 22 - 360
tensile strength Brazilian Disk [MPa] 5 - 21
density [g/cm3] 2.58 - 2.84
p- wave velocity [km/s] 4.2 - 5.8
s- wave velocity [km/s] 2.2 - 3.3

28
29
REFERENCES
Backers, T. 2004. Fracture Toughness Determination and Micromechanics of Rock Under Mode I and Mode II Loading. Scientific Technical Report STR 05/05 GeoForschungsZentrum Potsdam. ISSN 1610-0956. Backers, T. 2005. Fracture Toughness Determination and Micromechanics of Rock Under Mode I and Mode II Loading. Doctoral Thesis. University of Potsdam. Barker, L.M. 1979. Theory for determining KIC from small, non-LEFM specimens, supported by experiments on aluminum. Int. J. Fract.; 15: 515-536. Donath, B. 2002. Stiffness of rock fractures – an experimental investigation. Unpublished Diploma thesis. Technical University of Berlin, Germany. Guo, H., Aziz, N.I. & Schmidt L.C. 1993. Rock fracture toughness determination by the brazilian test. Engineering Geology, Vol. 33:177–188. Hakala, M., Kuula, H. & Hudson, J. 2005. Strength and Strain Anisotropy of Olkiluoto Mica Gneiss. Working Report 2005-61, Olkiluoto, Finland, Posiva Oy. ISRM 2007. Ulusay, R. & Hudson, J.A. (eds.) The complete ISRM suggested methods for rock characterization, testing and monitoring: 1974.2006. Kozan Ofset, Ankara, Turkey. Ouchterlony, F. 1988. Suggested methods for determining the fracture toughness of rock. Int. J. Rock Mech. Min. Sci. & Geomech. Abstr.; 25, 71-96. Ouchterlony, F. 1989. On the background to the formulae and accuracy of rock fracture toughness measurements using ISRM standard core specimens. Int. J. Rock Mech. Min. Sci. & Geomech. Abstr.; 26: 13-23. Posiva 2012. Olkiluoto Site Description 2011. Posiva Oy, Report POSIVA 2011-2. Siren, T. 2011. Fracture Mechanics Prediction for Posiva’s Olkiluoto Spalling Experiment (POSE). Working Report 2011-23, Olkiluoto, Finland, Posiva Oy. Wikipedia. 2011. http://en.wikipedia.org/wiki/File:Fracture_modes_v2.svg, released under Public domain. Öhman, I., Heikkinen, E., Säävuori, H., Vuoriainen, S., Paulamäki, S. & Aaltonen, I. 2009. Summary of petrophysical analysis of Olkiluoto core samples 1990 – 2008. Working Report 2009-11, Olkiluoto, Finland, Posiva Oy..

30

31
APPENDICES
Appendix I: Photographs of the delivered sample material Appendix II: Photographs after the Chevron Bend test Appendix III: Photographs after the Brazialian Disk test Appendix IV: Photographs after the Punch-Through Shear with Confining Pressure

32

33
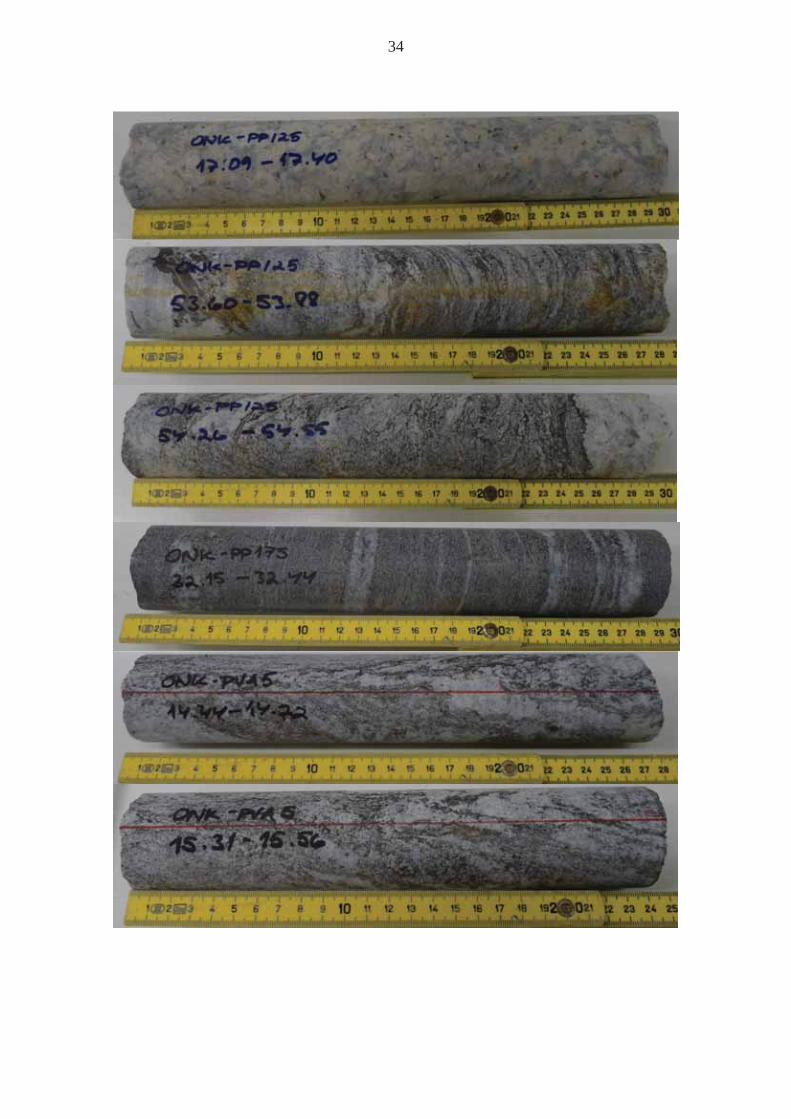
Appendix I: Photographs of the delivered sample material
34

35
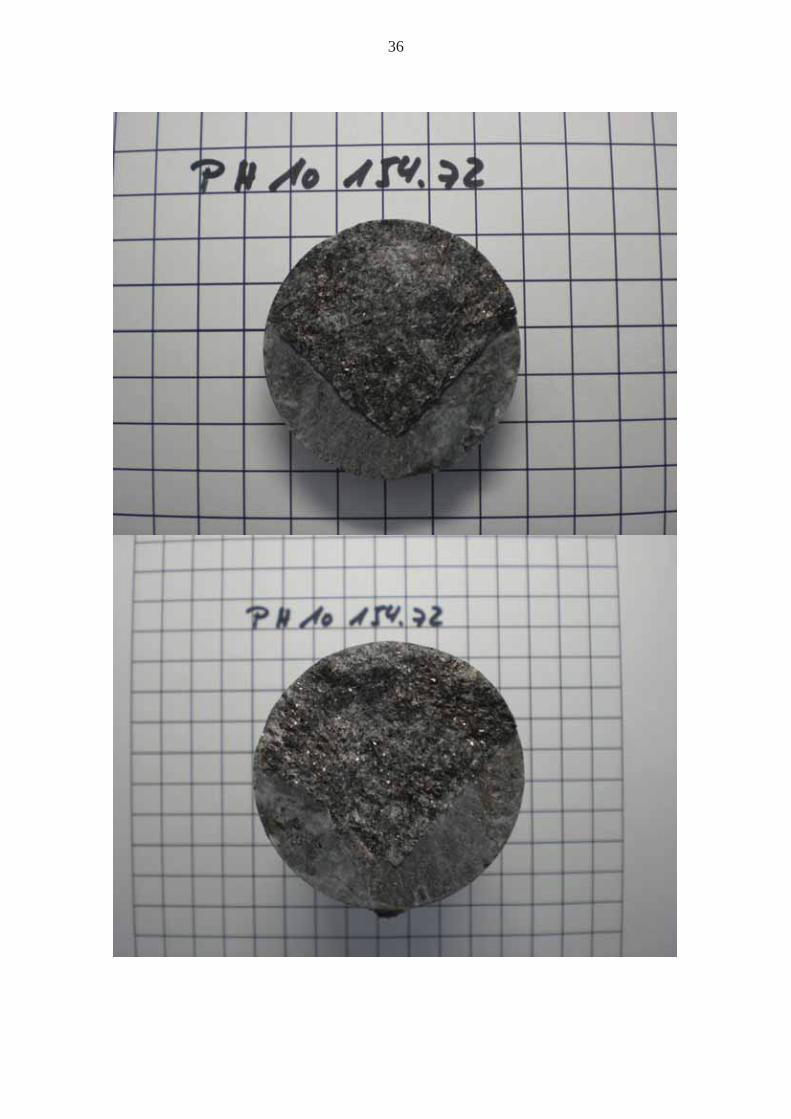
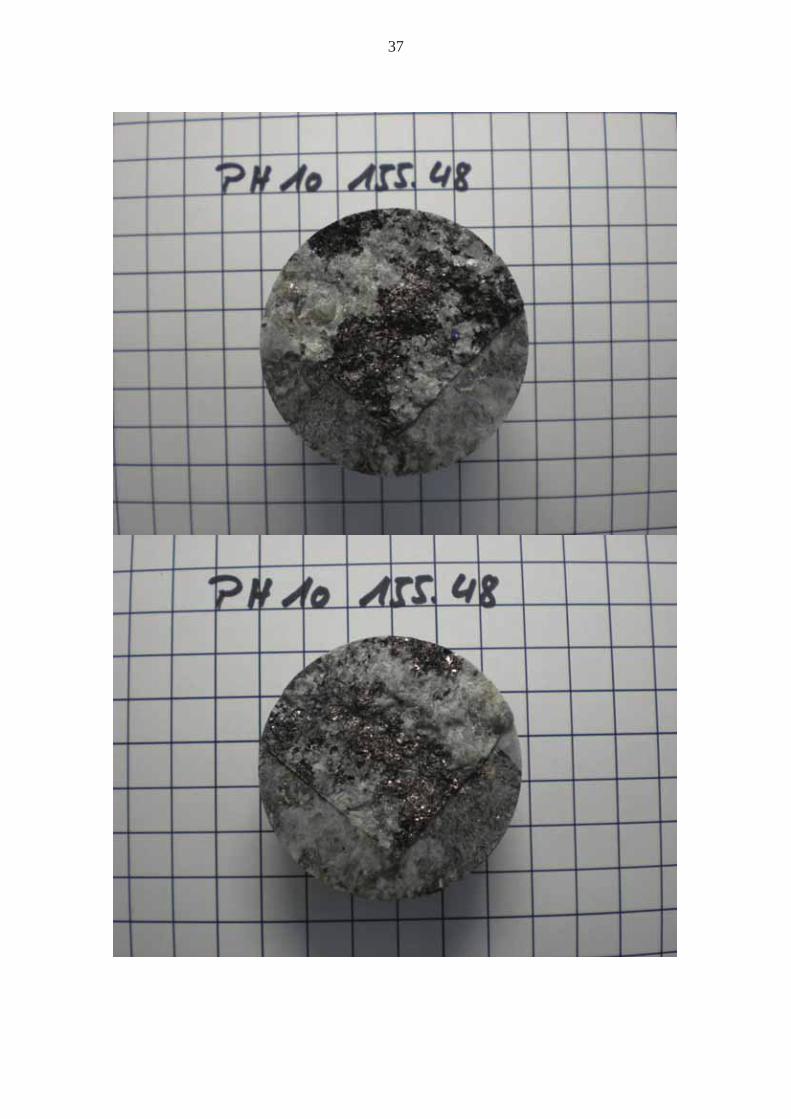
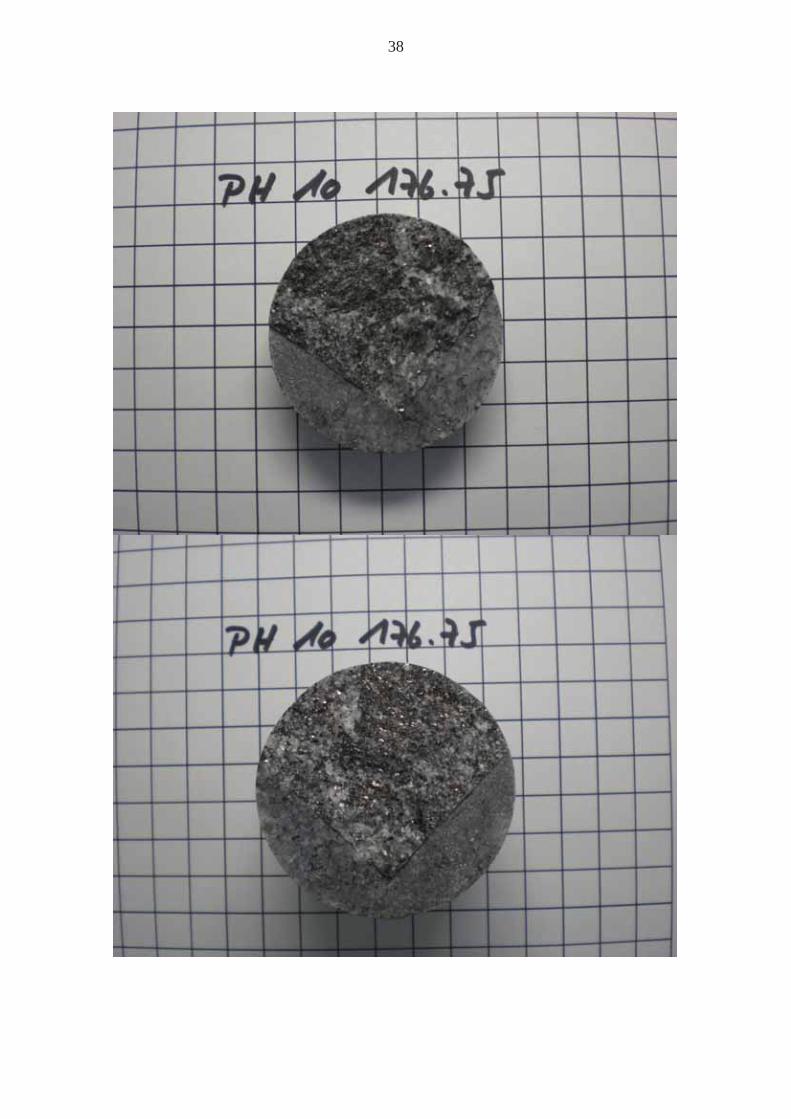
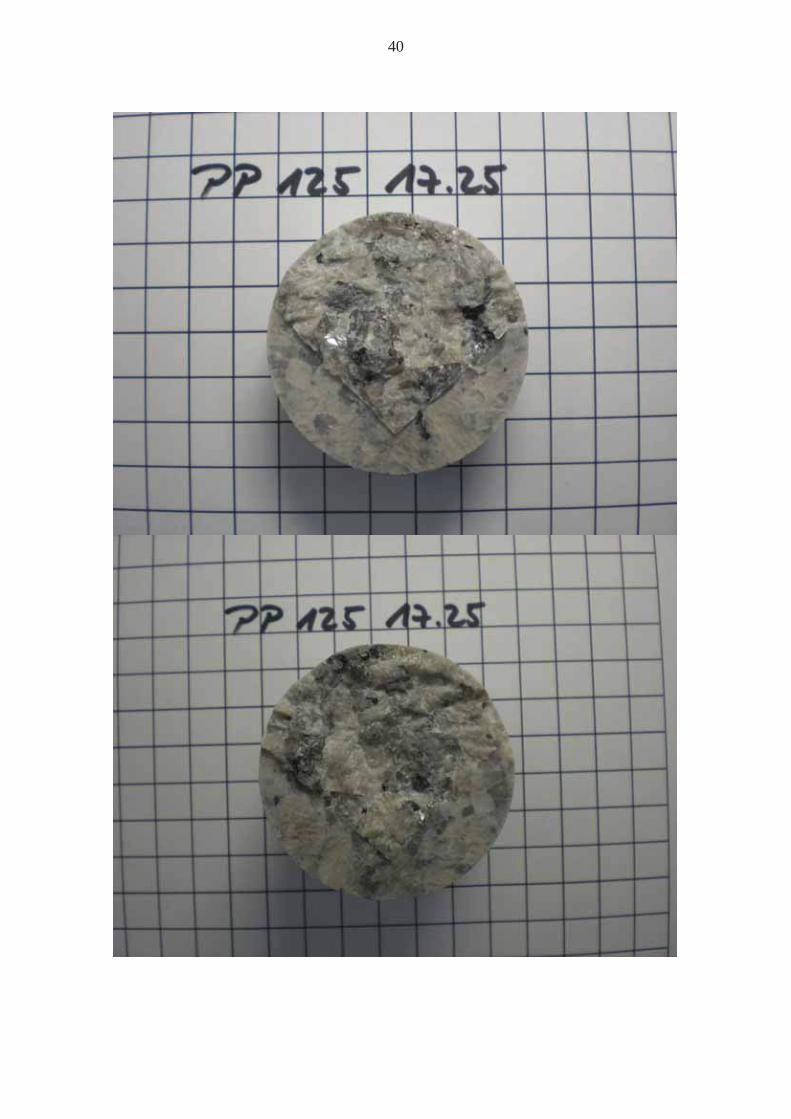
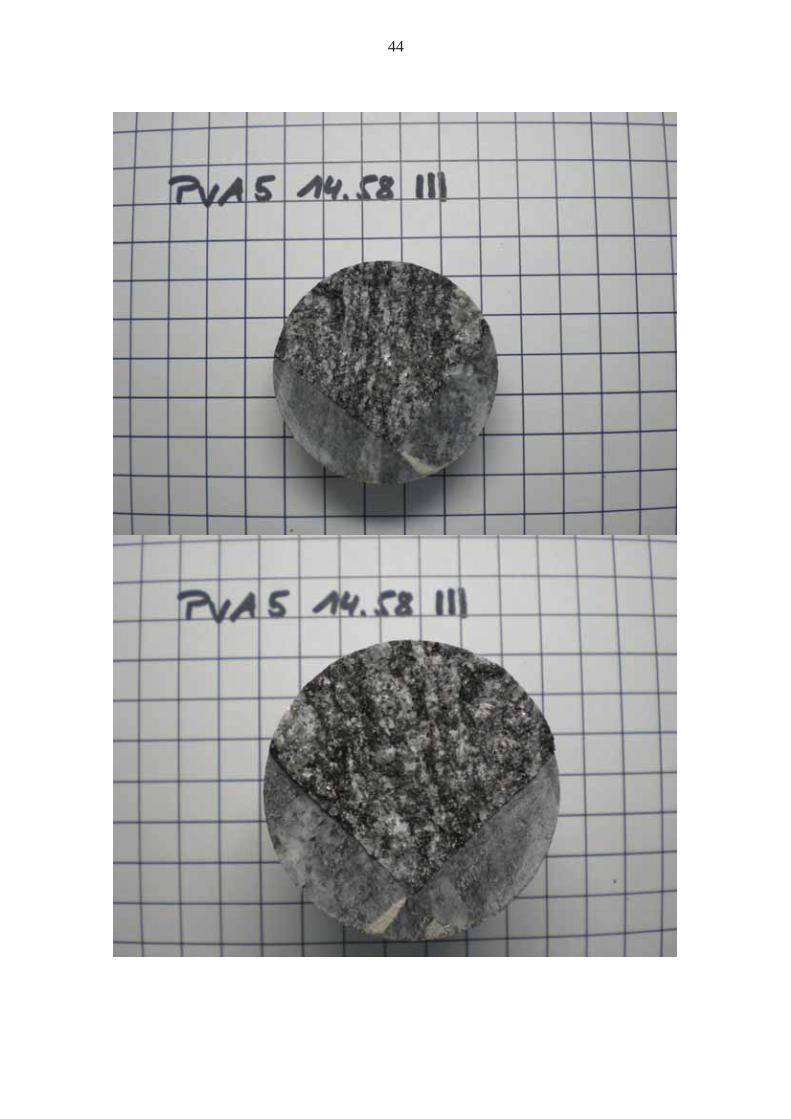
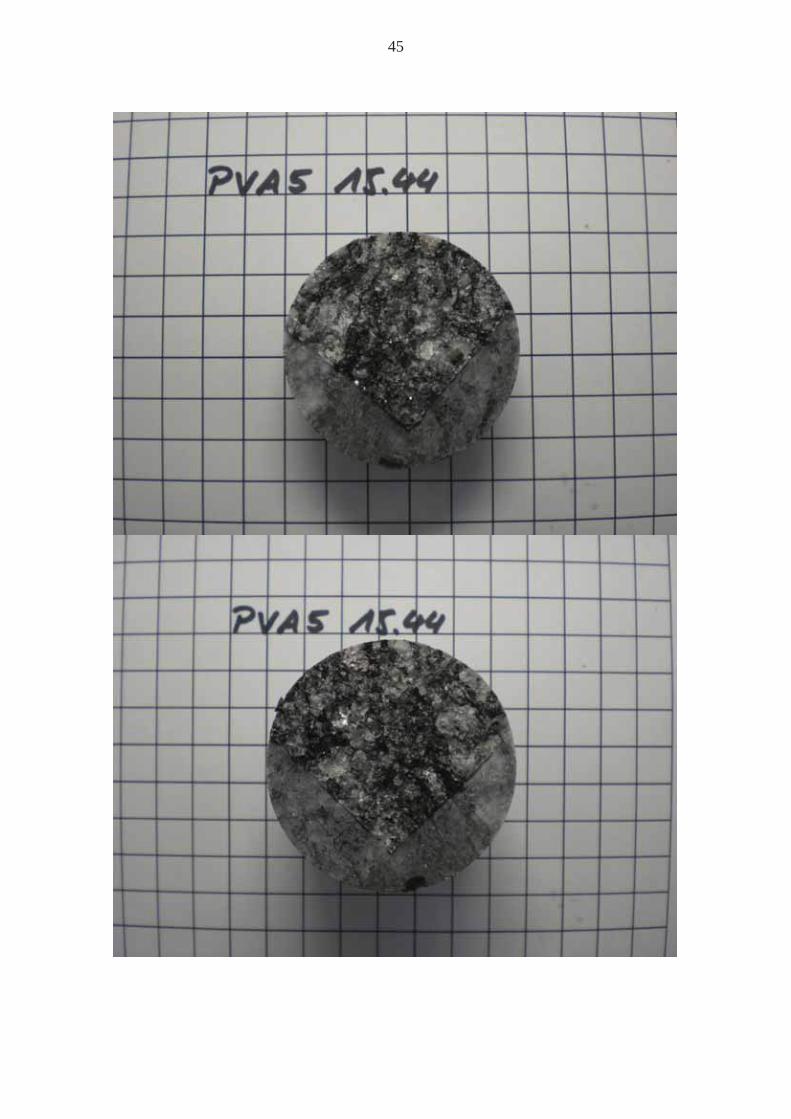
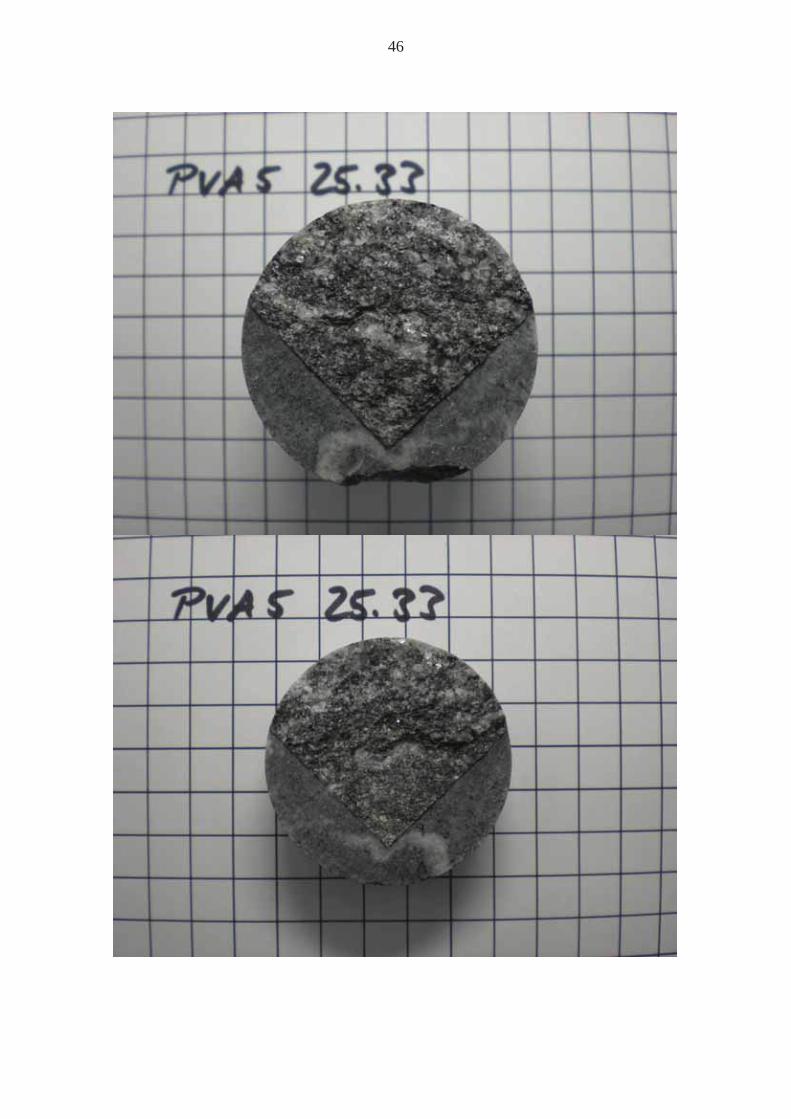
Appendix II: Photographs after the Chevron Bend test
36
37
38

39
40

41

42

43
44
45
46
47
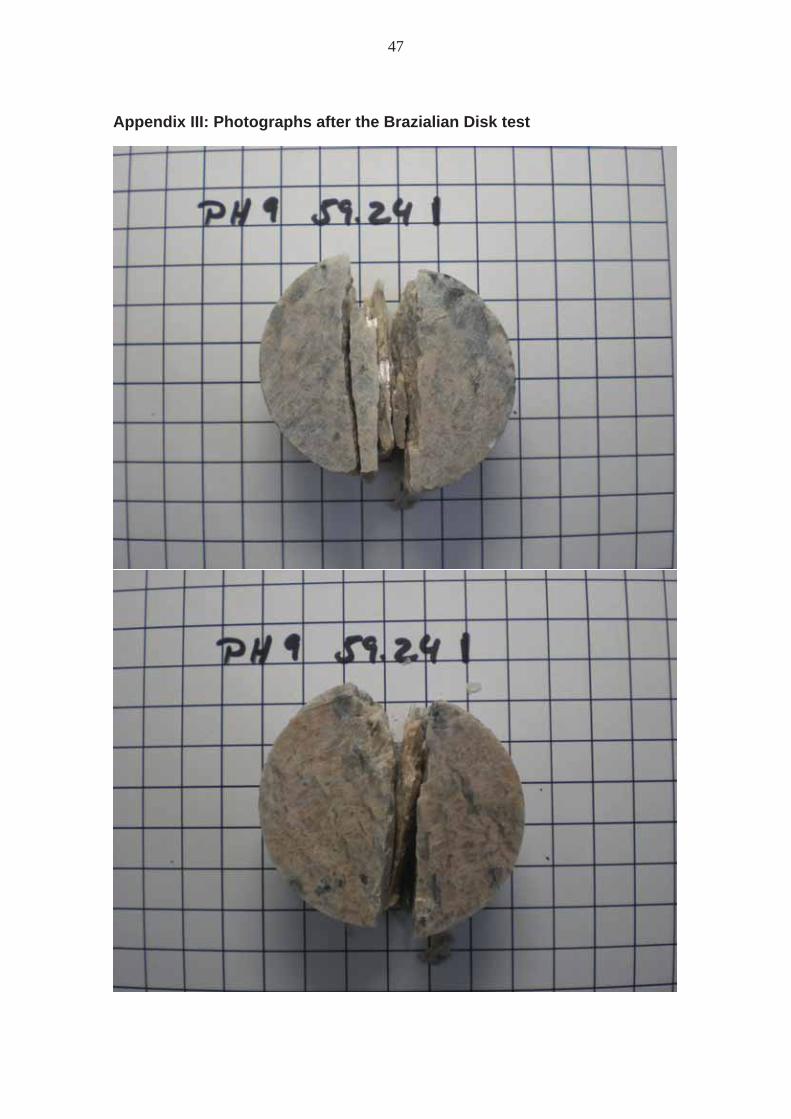
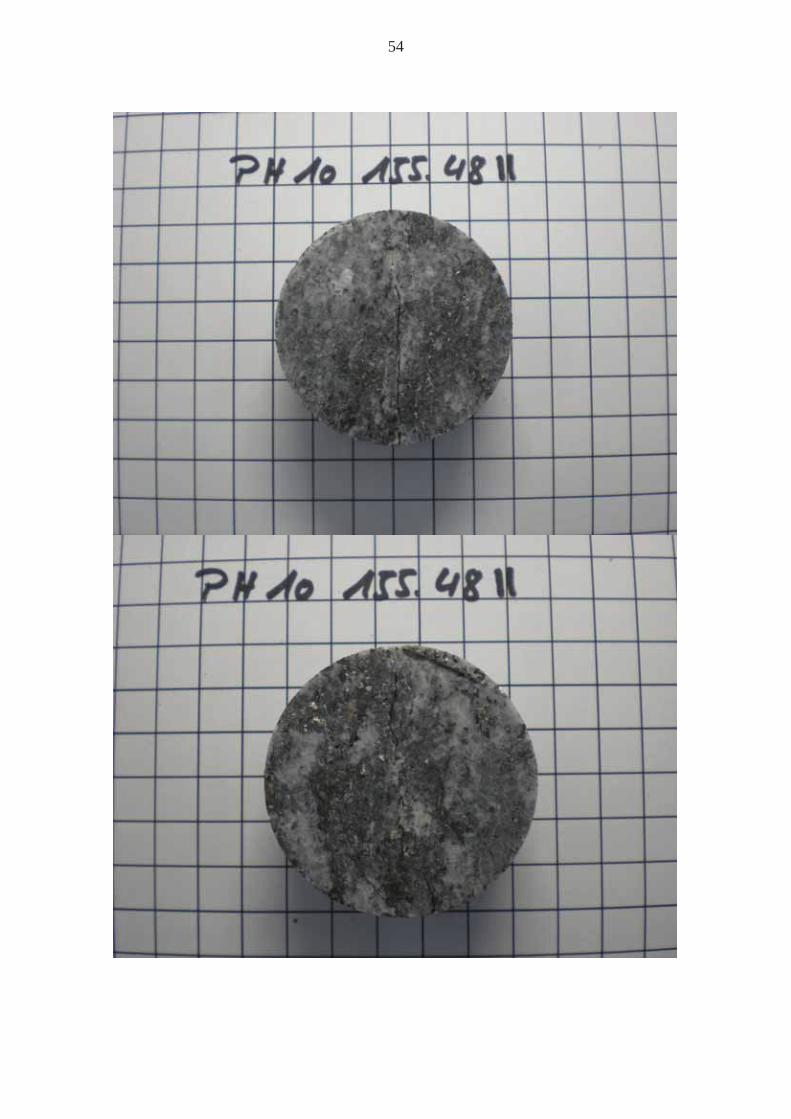
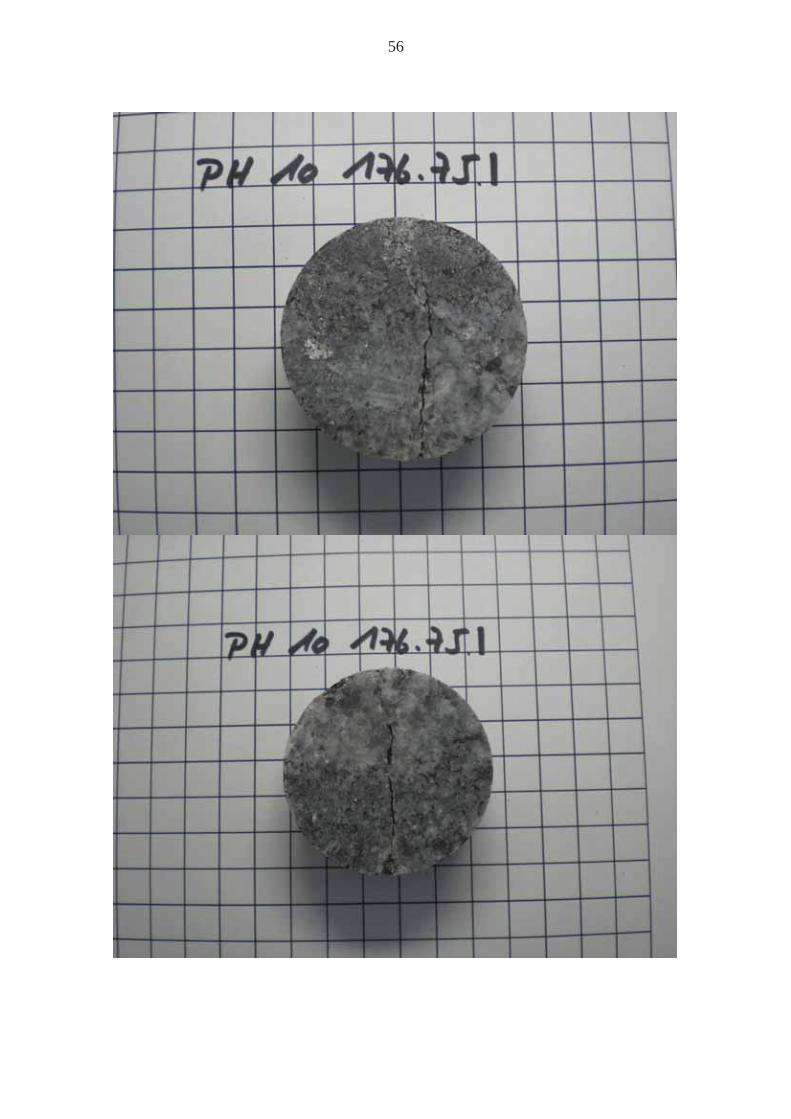
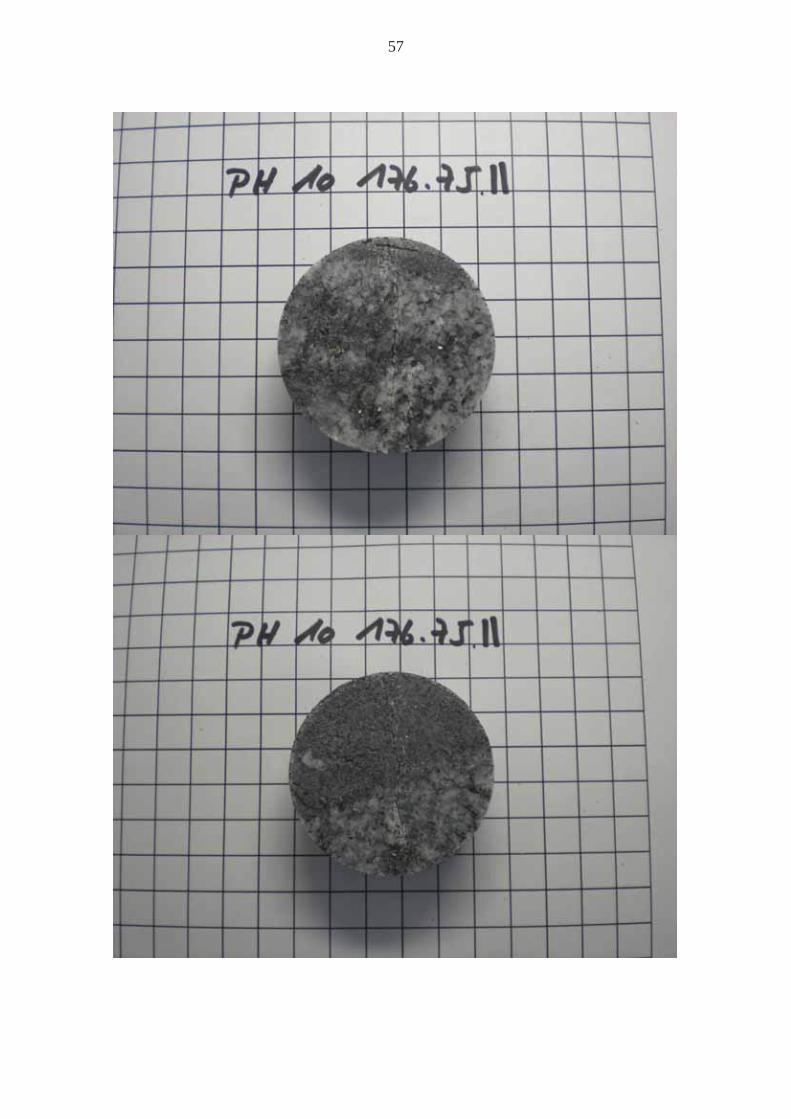
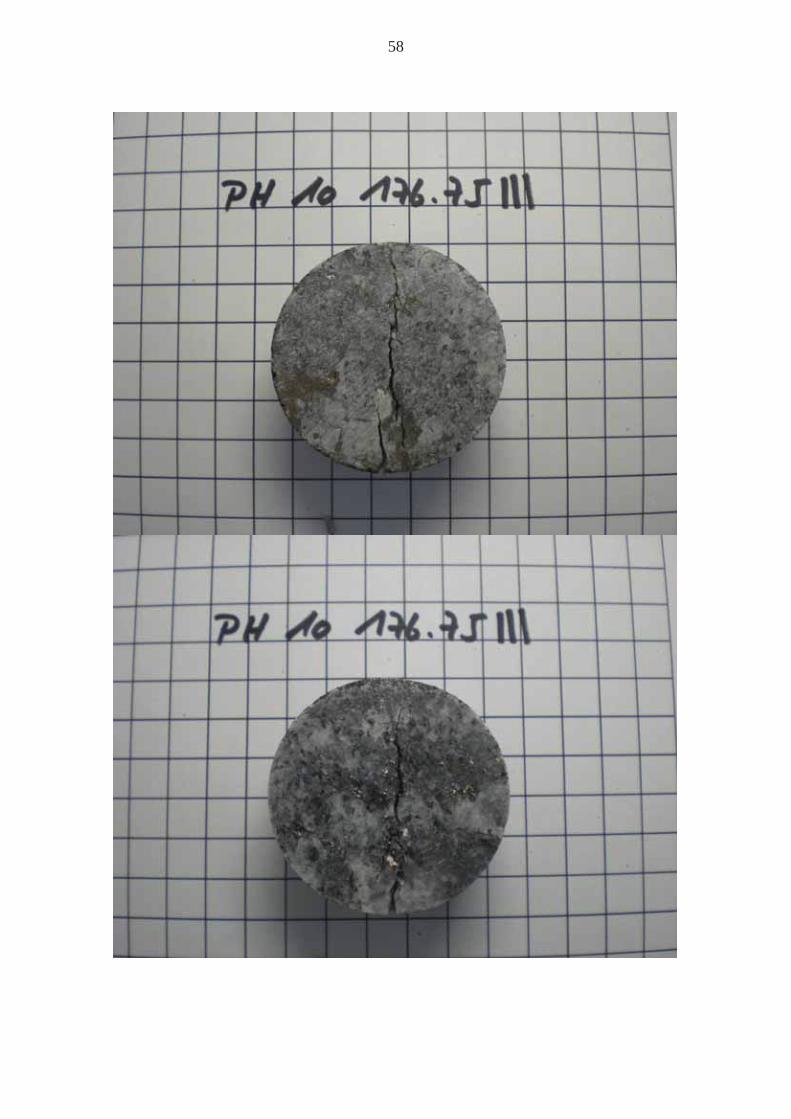
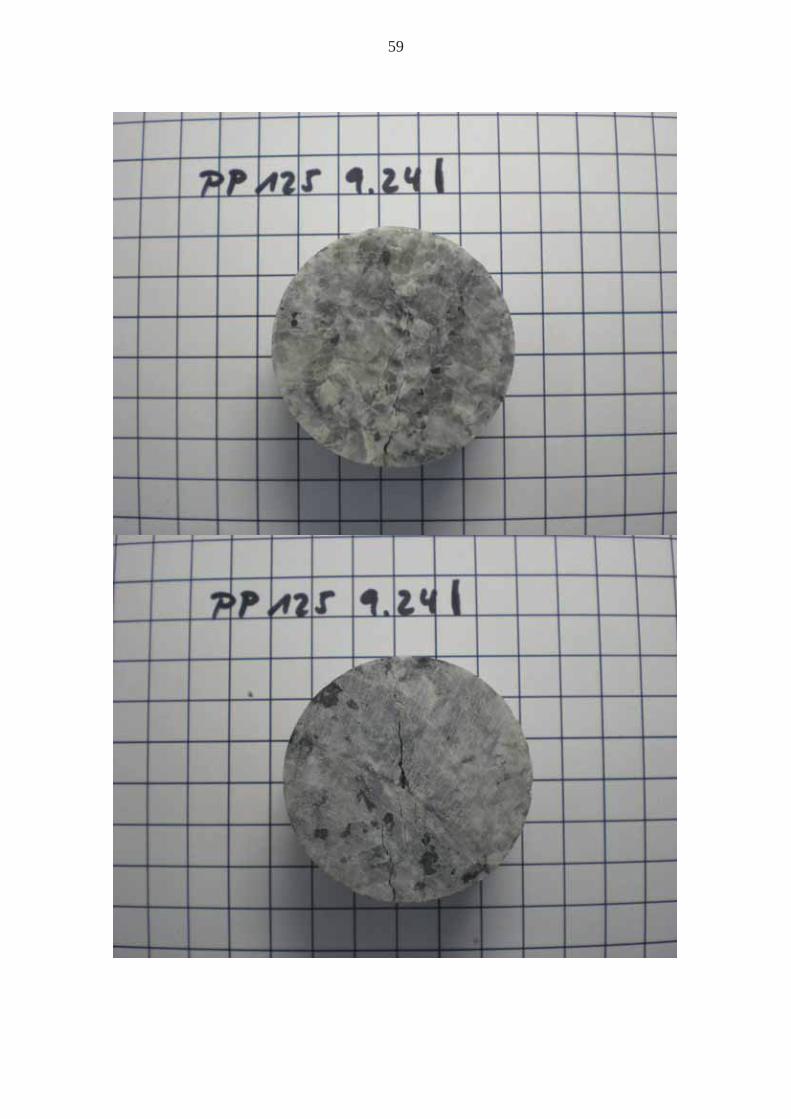
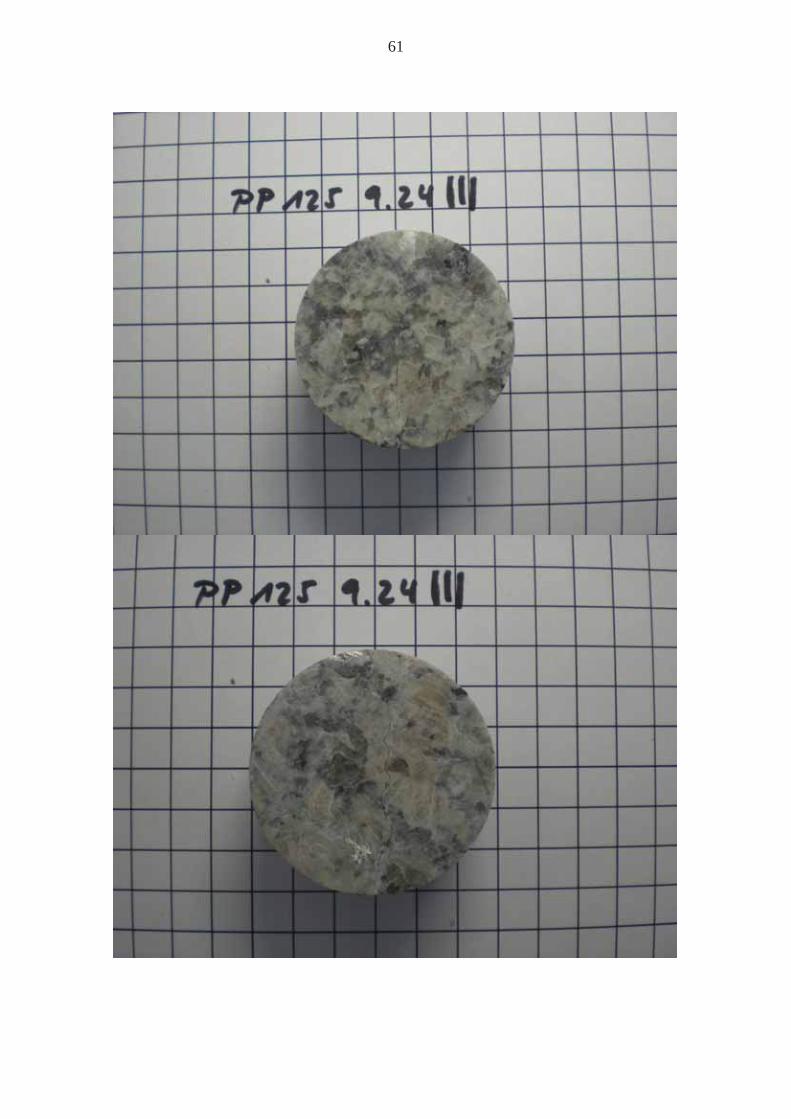
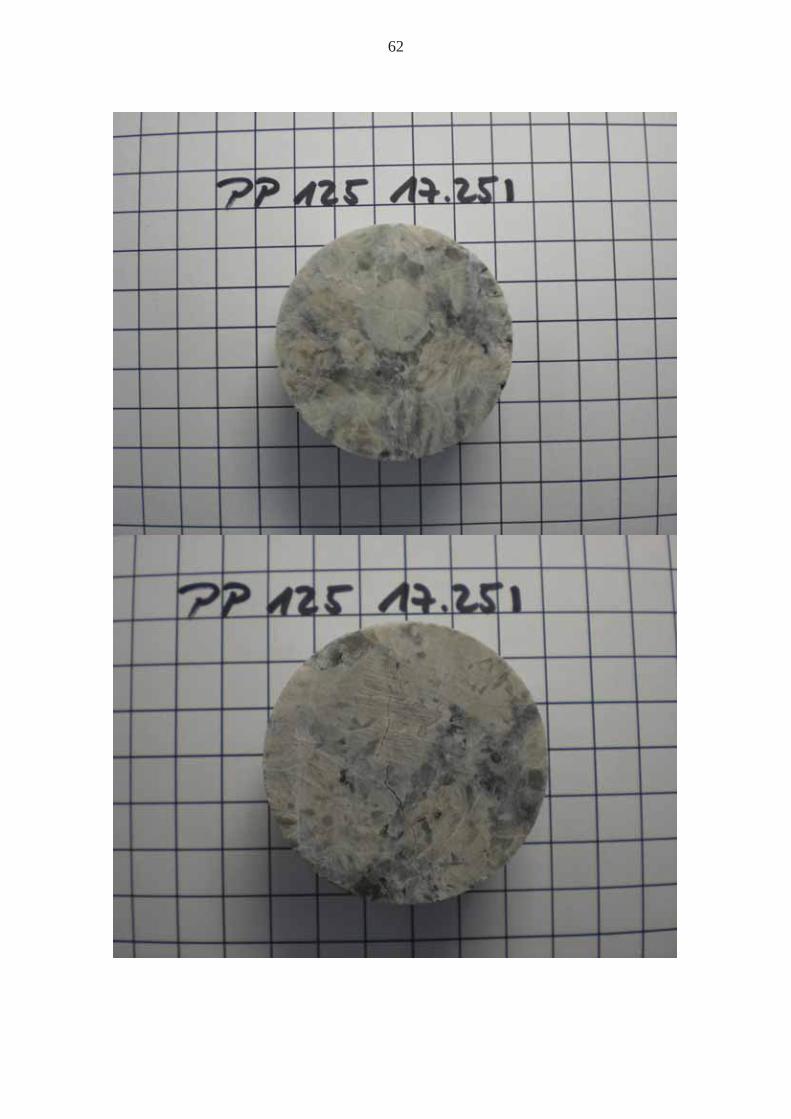
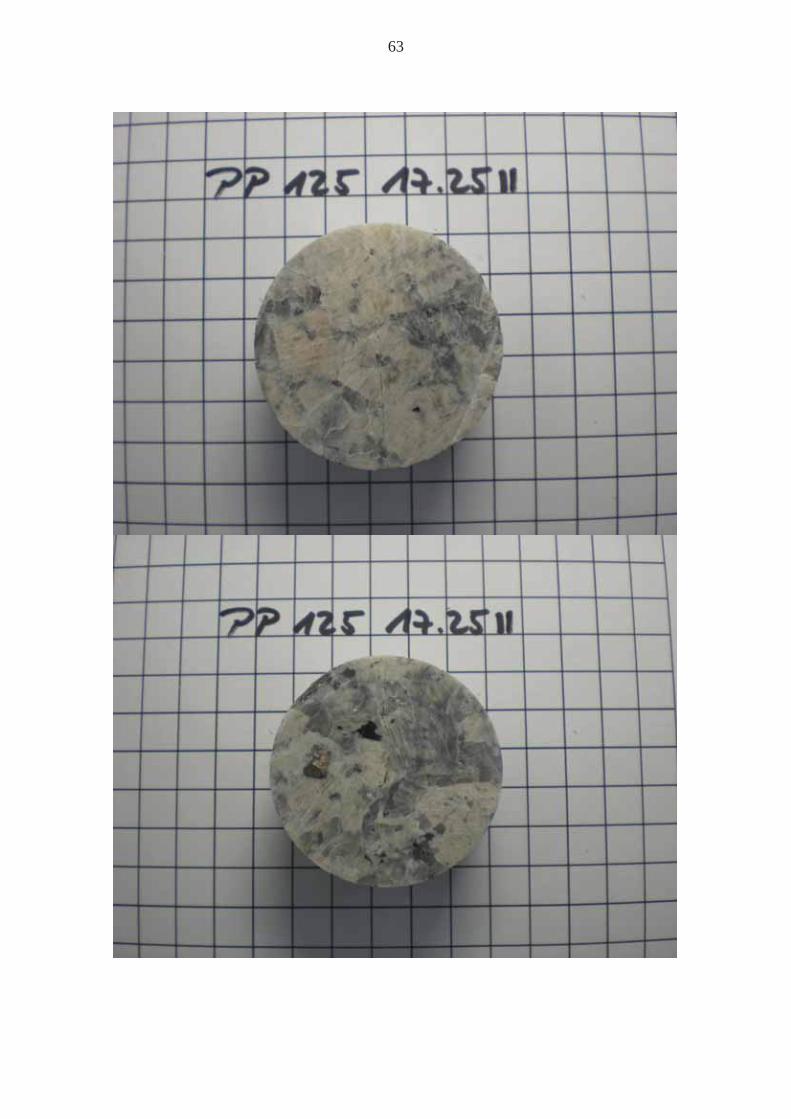
Appendix III: Photographs after the Brazialian Disk test

48

49

50

51

52

53
54

55
56
57
58
59

60
61
62
63

64
65
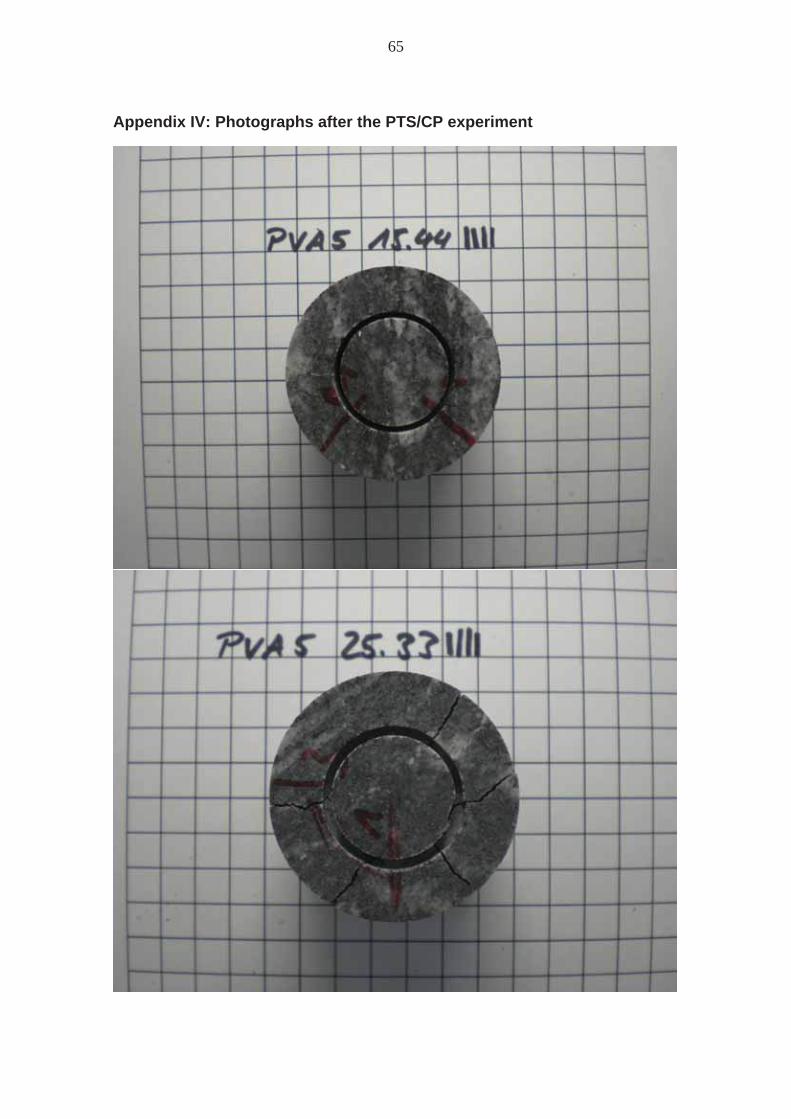
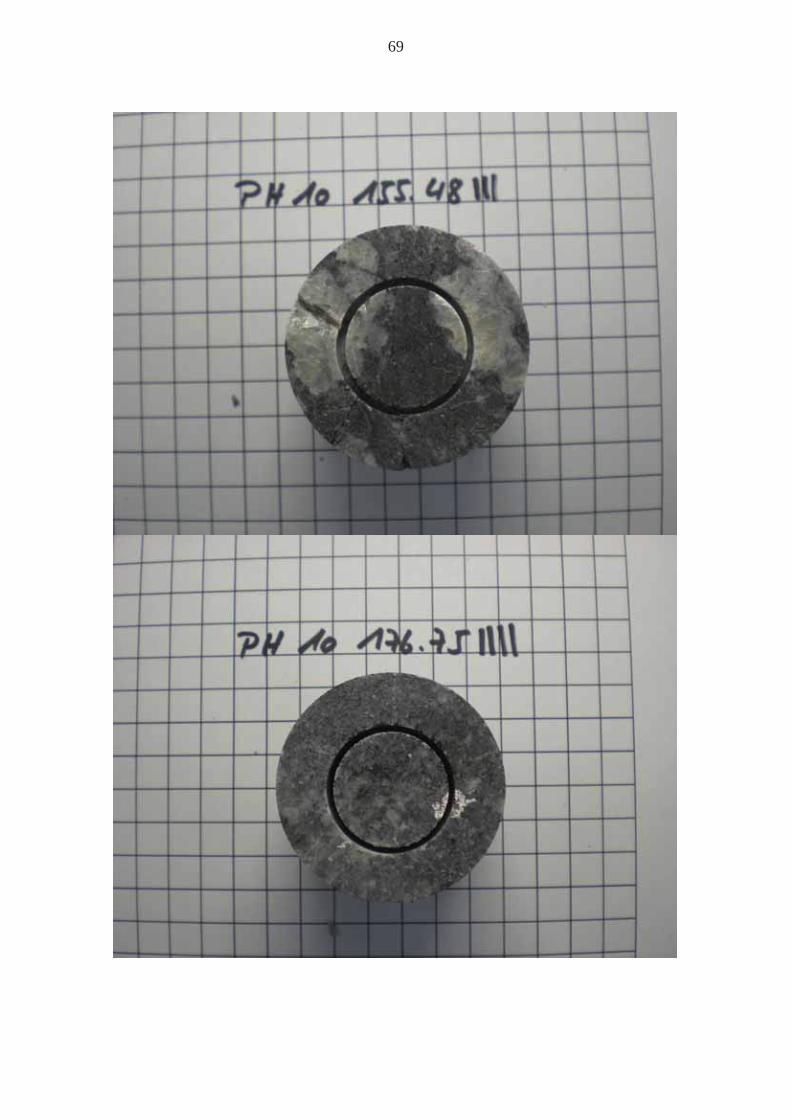
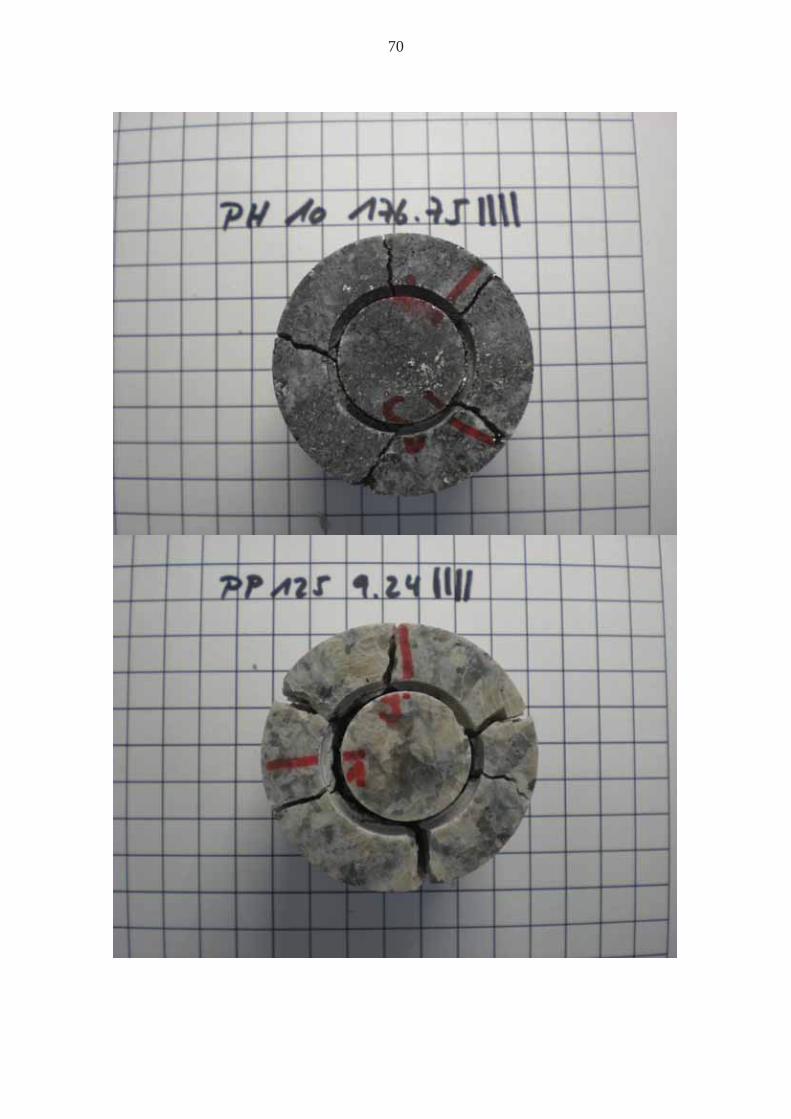
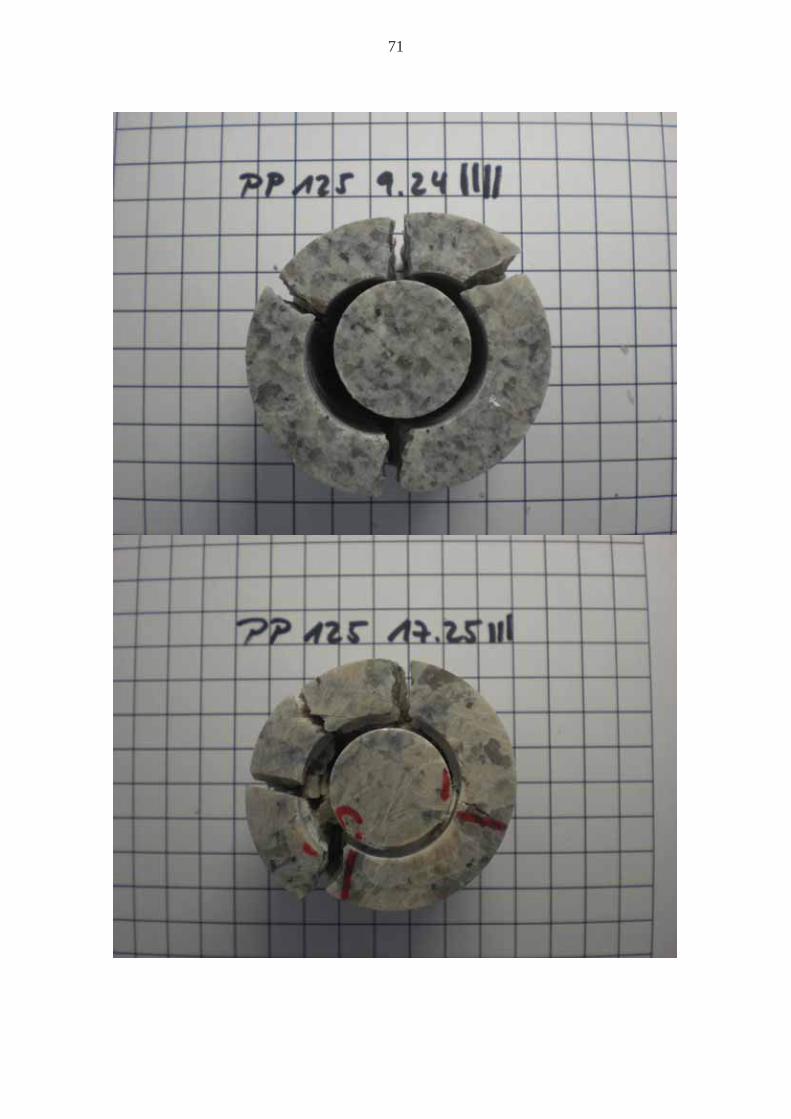
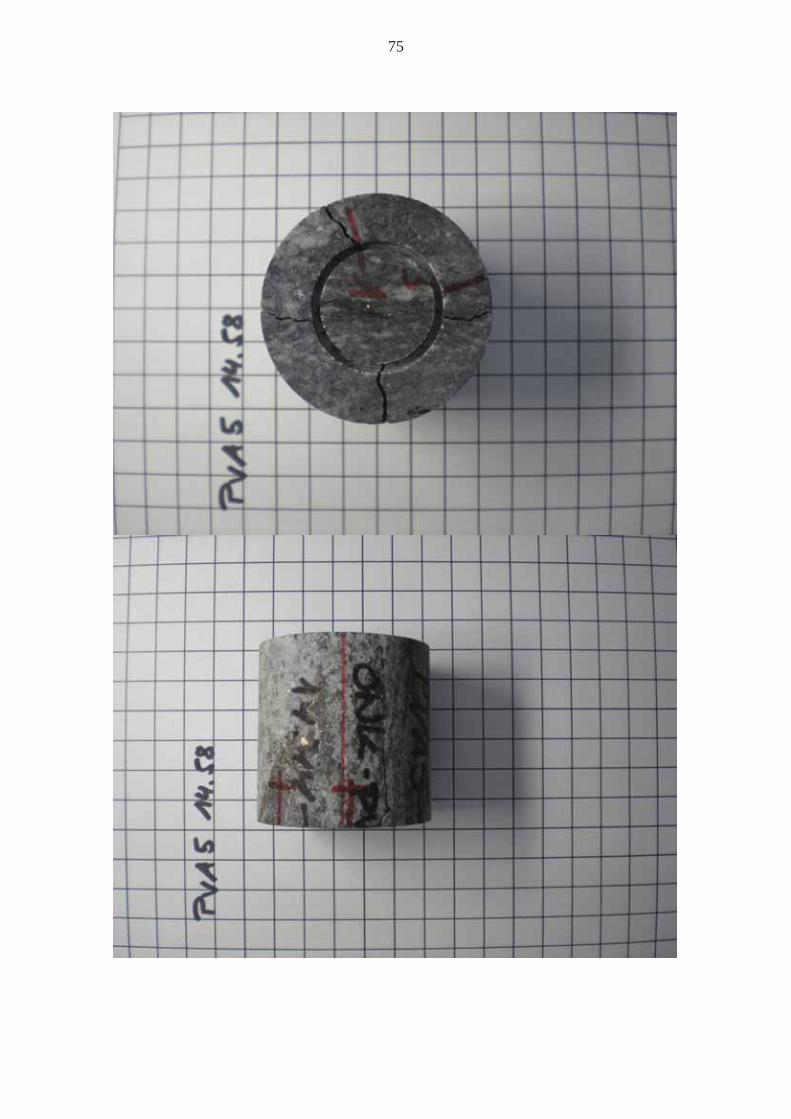
Appendix IV: Photographs after the PTS/CP experiment

66

67

68
69
70
71

72

73

74
75

76