the economic and fiscal impacts of the distilling industry
TRANSCRIPT

The Economic and Fiscal Impacts of the Distilling Industry in Kentucky
Prepared for the Kentucky Distillers’ Association
by Paul Coomes, Ph.D.
Economic Consultant, and Emeritus Professor of Economics
University of Louisville
and
Barry Kornstein Economic Consultant
January 30, 2019
CONTENTS
EXECUTIVE SUMMARY ................................................................................................... 1 THE SIZE OF THE DISTILLING INDUSTRY IN KENTUCKY ................................................... 4 Distilleries by location ......................................................................................... 4 Bourbon production and inventory ..................................................................... 5 Employment and payrolls .................................................................................... 7 Exports of Bourbon and other distilled products ................................................. 7 Distilling’s share of Kentucky and national economic activity .............................. 8 Recent and planned investments by Kentucky distillers ..................................... 10 Grain purchases .. .............................................................................................. 10 ECONOMIC IMPACTS .................................................................................................... 11 Impact of construction activity .......................................................................... 13 Impact of capital equipment investment activity ............................................... 15 TAXATION AND FISCAL IMPACTS OF THE INDUSTRY .................................................... 17 Property taxes ................................................................................................... 18 Tax revenues related to payrolls of distilleries ................................................... 22 State licenses and fees ...................................................................................... 23 Local licenses and fees....................................................................................... 24 Alcohol consumption taxes ................................................................................ 25 Tax impacts over time ....................................................................................... 28 CONCLUSION ................................................................................................................ 30 APPENDICESA. Federal industrial classification codes relevant to the distilling industry ................... 32 B. Licensed distillers in Kentucky ................................................................................... 33 C. Measures of employment and payroll in Kentucky’s distilling industry ...................... 36 D. National growth in distilling establishments over the last decade ............................. 44 E. Exports of Kentucky distilled spirits ........................................................................... 48 F. The Distilling industry’s linkages to other industries .................................................. 51 G. Grain usage by Kentucky distillers ............................................................................. 55 H. Economic multipliers ................................................................................................ 56 I. Wholesale tax rates on alcohol, by state .................................................................... 60
The Distilling Industry in Kentucky 1
ExecutiveSummaryentucky produces and ages most of the Bourbon sold and consumed in the world. Kentucky’s distillers are also involved in distilling other spirits and bottling, packaging and shipping many different kinds of distilled spirits (often distilled elsewhere and
brought to Kentucky facilities for final processing). Nearly all of the products are shipped to customers outside of Kentucky, making distilled spirits a major export industry for the Commonwealth. The sales of distilled spirits support the wages, salaries and benefits of workers in the state’s distilling industry, as well as those employed by suppliers. The dollars circulate further, as employees spend their income in the regional economy, generating jobs and income in other industries.
We estimate that the total annual economic impact of the distilling industry is 20,100 jobs, with annual payroll of $1 billion, producing $8.6 billion of economic output. This is an estimate of what would happen in the state in the unlikely event that the distilling industry completely disappeared, or became severely restrained by outside issues that made it impossible or impractical to operate.
This is the fifth statewide study of the distilling industry that we have conducted for the Kentucky Distillers’ Association (KDA) since 2009. The current study updates and expands on our four previous studies, offering an examination of the growth in the distilling industry, the industry’s impact on other industries in Kentucky, and its contribution to state and local government tax revenues. Among the most important and interesting findings are:
Ø There were 68 licensed distilleries operated by 56 companies in Kentucky as of May 2018, with several more license applications in the pipeline. This is triple the number of distilleries documented in our 2009 study, with most of the growth due to the emergence of craft distilleries. While craft distilleries are distributed throughout the state, heritage distilleries remain concentrated in the “amber triangle” region of central Kentucky, as well as in Owensboro.
Ø In 2017 there were approximately 5,000 people working directly in Kentucky’s distilled spirits industry, with annual wages and salaries of $470 million. Over the last 16 years, there has been a tripling of distilling establishments in Kentucky, with a 55 percent growth in employment, and a 176 percent growth in wages and salaries.
Ø The full economic impact of the distilling industry includes the linked activity of suppliers and new household spending. In our original study, in 2009, we estimated the total economic impact in Kentucky to be 9,848 jobs and $442 million in payroll. For 2018, we estimate that the impact has grown to 20,100 jobs and $1 billion in payroll – more than double that of nine years ago.
K

The Distilling Industry in Kentucky 2
Ø Production activities supported about 15,350 jobs with a payroll of $635.1 million. The contribution to Kentucky’s economic output was about $7.78 billion. Corporate activities supported about 4,770 jobs with a payroll of $369 million. The contribution to Kentucky’s economic output of the management jobs was about $800 million.
Ø The distilling industry in Kentucky has been rapidly adding jobs, while on net the remainder of the state’s manufacturing industry has shed employment. Kentucky remains the dominant state for distilling employment due to its large legacy producers, even as there has been a national boom in small distilling establishments. The number of distilling establishments went up 12-fold in the United States over the 2001 to 2017 period. Kentucky’s share of distilling establishments fell from 24 to 6 percent over this period, while its share of employment fell only from 43 to 33 percent. Moreover, annual pay per job remains high in Kentucky, due to the location of several major headquarter operations in the state. Meanwhile, Kentucky continues to produce 95 percent of the world’s Bourbon.
Ø The federal database on licensed distillers shows 82 Kentucky plants with a distilling/bottling permit at the end of 2018. Kentucky ranks 11th among US states in the number of plants (Kentucky ranks 26th in terms of state population).
Ø Kentucky distillers shipped over $452 million of product abroad in 2017, with whiskey accounting for about 84 percent of the total Kentucky shipments. Other products exported by Kentucky distillers include grape brandy, liqueurs, cordials, vodka, rum, and gin. Export value tripled what it was in 1997, reflecting growth in volume and price.
Ø Distilleries remain the highest taxed of the 532 Kentucky industrial sectors we analyzed, with 28 percent of the value of output going to government taxes – more than amusement parks and arcades (23 percent), tobacco (15 percent), breweries (13 percent), and wine (3 percent). This calculation includes taxes levied by all levels of government, including federal, state, and local.
Ø We estimate that the distilling industry is directly or indirectly responsible for about $235 million in state and local tax payments in Kentucky annually. The total includes local and state property taxes, state alcohol production and consumption taxes, local occupational taxes, and Kentucky state individual income and sales taxes. State government accounts for 82 percent of the total tax revenues, with 18 percent going to local government entities.
Ø School districts and local governments are the biggest recipients of property taxes paid by the industry. For 2018, the Kentucky Department of Revenue estimates that state

The Distilling Industry in Kentucky 3
and local governments will collect $22.6 million in taxes on barrels aging in inventory, and that inventory is assessed at $3 billion.
Ø KDA members reported capital spending of $1.1 billion over the last five years, almost equally split between construction and other items, such as machinery, equipment, and furnishings. Moreover, they plan to spend $1.2 billion over the next five years. Every KDA member, whether a large Heritage producer or a small Craft producer, reported significant investments. This is by far the highest investment spending we have documented over our five studies since 2009.
Ø We estimate that the distilling industry construction and capital improvement projects could support an average of 1,794 additional jobs in Kentucky through 2023. Those jobs would have about $69.7 million in total payroll and generate about $7.1 million in combined state and local income and sales taxes each year. The real estate improvements could mean an additional $1.27 million in property tax revenues each year for local and state governments.
Ø We use a custom regional input-output model for estimating the economic impact of distilling, the most conventional method available for such analyses. These models can predict the impact of changes in one industry on all other industries in a regional economy. The most common summary measure of an industry’s economic impact is called a multiplier. Our custom IMPLAN model predicts that across 293 manufacturing industries with activity in Kentucky, the only one with both more jobs and a higher employment multiplier than distilling is light truck and utility vehicle manufacturing.
Ø The large recent investments suggest we will see even more growth in traditional measures of economic activity. Growing at the rate we have observed over the last decade, Kentucky’s distilling industry could support around 24,000 jobs by 2020, with payroll of $1.2 billion, and tax payments to state and local governments of $270 million.
Note: This analysis is based almost entirely on data available for the period before retaliatory tariffs on whiskey exports were imposed by the European Union, China, Canada, Mexico and Turkey. These markets account for 58 percent of Kentucky whiskey exports. Beginning in late June 2018, the EU levied an import duty of 25 percent on Bourbon from U.S. distillers. The EU, taken as a block, is the largest export market for Kentucky whiskey, accounting for 47 percent of the total volume and 43 percent of the value of exports in 2017. The impact on sales by Kentucky distillers is not yet detectable in public data on the industry. The Distilled Spirits Council reports a decline in global Kentucky whiskey exports in the July to October period of 2018, compared to the same months of 2017, though this follows significant shipments in the first half of 2018 as importers stockpiled ahead of the tariffs.

The Distilling Industry in Kentucky 4
TheSizeoftheDistillingIndustryinKentuckyWe treat the distilling industry here as the collection of firms that earn revenues primarily from distilling and selling spirits. These firms may engage in other revenue-generating activities, such as making brandy, beer, wooden barrels, tourism and hospitality, research, managing and marketing other product lines (including wines and non-spirits products), and selling merchandise in their gift shops. Economic statisticians attempt to classify industrial activity by business establishment, or location. If a distilling company makes barrels in one location, distills Bourbon in another location, ages it in warehouses at another location, and has corporate offices at yet another location, then the company might have activity listed under four different industrial classifications. The detailed industrial classification codes relevant to Kentucky’s distilling industry are provided in Appendix A. We presume the companies would not be located in Kentucky were it not for their distilling operations, and hence for purposes of this study we attempt to count all of their activity as part of the industry.
DistilleriesbylocationA comprehensive list of the current distilling industry operations in Kentucky is provided in Appendix B, including distilling, bottling and office locations. The list is based on distilling licenses issued by Kentucky Department of Alcoholic Beverage Control. One can see there are distilleries in 68 distinct locations across 32 counties. The number of distillery locations grew from 19 in 2009, to 31 in 2013, to 68 in 2018. Most of the new additions to the list are craft
The Distilling Industry in Kentucky 5
distilleries. The major producers in the distilling industry in Kentucky are the Bardstown Bourbon Company, Beam Suntory (Jim Beam and Maker’s Mark), Brown-Forman, Diageo, Four Roses, Heaven Hill, the Louisville Distilling Company, Lux Row, Michter’s, O.Z. Tyler, Sazerac, and Wild Turkey. With the exception of Owensboro, the larger new distillery projects are located near interstate highways 64 and 65 and the Bluegrass Parkway. Smaller craft distilleries have opened all across the state.
The map shows the location of KDA members throughout the state by level of membership (not all distillers are KDA members). KDA has four levels of membership: Heritage, Proof, Craft and Educational.
BourbonproductionandinventoryUnlike most other distilled spirits, Kentucky Bourbon is aged in barrels and stored in warehouses for years before being bottled and shipped to customers. State and local governments tax this property while it ages, and therefore we have public data available on the amount placed in barrels annually, as well as the inventory of barrels by age. Data goes back decades, and we show the recent history in the chart below. One can see the drawdown in barrel inventory through about the year 2000, and then the effects of the recent surge in demand, with subsequent investments in production facilities, new warehouses and barrel inventory. Indeed, annual production last year was double what it was just a decade ago.
About 1.7 million barrels of new Bourbon were produced and added to warehouse inventory last year. There are 8.1 million barrels of spirits aging in Kentucky warehouses as of last year, with nearly 7.5 million of those barrels being Bourbon. The value of all inventory in bonded warehouses (which includes bulk inventory and cases being held for shipment as well as distilled spirits in barrels) was assessed for tax purposes at a record $3 billion in 2018. Inventory subject to county-level property taxes (mostly in barrels) was assessed at $1.75 billion in 2017, when the total bonded warehouse assessment was $2.55 billion1.
Property tax records also reveal the age distribution of Bourbon barrels in Kentucky warehouses. We only have complete data for KDA members, but members traditionally account for over 85 percent of annual production statewide, and thus the vintage profile is fairly representative of the industry. One can see in the chart below how inventories begin to be drawn down, particularly after four years of aging. However, there remains over 240,000 barrels that have been stored in warehouses for more than eight years.
1 The state ad valorem tax is more comprehensive than the local barrel taxes. All goods held for sale, including all
raw & in-process materials, are taxed by the state, whereas local taxes are really just focused on the aging spirits. So, state assessment is higher than sum of local assessments.

The Distilling Industry in Kentucky 6
-
1,000,000
2,000,000
3,000,000
4,000,000
5,000,000
6,000,000
7,000,000
8,000,000
9,000,000
Barrels of Bourbon Produced, and Warehouse Inventory, Kentucky Totals, 1970-2017
Source: Kentucky Distillers' Association, and Kentucky Department of Revenue, as of the end of each year.
Inventory
Production
243,285
66,321
187,765
300,607
549,737
942,990
1,176,216
1,371,965
1,483,969
0
200,000
400,000
600,000
800,000
1,000,000
1,200,000
1,400,000
1,600,000
Over 8 years 2010 2011 2012 2013 2014 2015 2016 2017
Number of Bourbon Barrels in Inventory by Year ProducedKDA Members Only
Source: Kentucky Department of Revenue, as produced for purposes of annual property tax assessments, and provided to the Kentucky Distillers' Association. KDA
members have traditionally accounted for over 85 percent of state production.

The Distilling Industry in Kentucky 7
There are no published official data on the annual value of production, or sales by distillers, of spirits in Kentucky. Annual production volume is obviously different than sales volume for most Kentucky spirits, due to the need to age Bourbon for several years. And the value of products that are bottled or otherwise sold varies continually with changing market prices around the world. Our IMPLAN input-output model of Kentucky, which we use below to estimate economic impacts, predicts that Kentucky distillers produced $6.2 billion of output in 2016. This is one-third of the $19.0 billion IMPLAN predicts for the US distilling industry as a whole, and is the same as Kentucky’s share of national distilling employment.
Employment and payrolls In 2017 there were approximately 5,000 people working directly in Kentucky’s distilled spirits industry, with annual wages and salaries of $470 million. Over the last 16 years, there has been a tripling of distilling establishments in Kentucky, with a 55 percent growth in employment, and a 176 percent growth in wages and salaries. There are actually several different sources of employment and payroll data, and we discuss these at some length in Appendix C. The estimates of jobs and payroll we use for our modeling of economic impacts are derived from required employer filings for state unemployment insurance premiums, which we consider to be the most comprehensive and accurate of available estimates. This is supplemented by information obtained from a survey of distillers and from the Kentucky Directory of Manufacturers.
Exports of Bourbon and other distilled products Kentucky distillers shipped over $452 million of product abroad in 2017, with whiskey accounting for about 85 percent of the total. Other products exported by Kentucky distillers include grape brandy, liqueurs, cordials, vodka, rum, and gin. The value of exports is now triple what it was in 1997, reflecting growth in both volume and price. The leading importers of Kentucky whiskey last year were Spain, Japan, Australia, United Kingdom, Canada, and Germany. The Distilled Spirits Council of the United States (DISCUS) digs deeper into federal export data and breaks out Bourbon from the whiskey category2. They show $363 million in Bourbon exports in 2017, on 18.6 million proof gallons of volume. See Appendix E for more detail on exports.
2 See www.distilledspirits.org/wp-content/uploads/2018/04/Distilled-Spirits-Exports-Volume-December-2017-1.pdf and www.distilledspirits.org/wp-content/uploads/2018/04/Distilled-Spirits-Exports-Value-December-2017-1.pdf .

The Distilling Industry in Kentucky 8
Distilling’s share of Kentucky and national economic activity It is well known that we are in the midst of a national boom in small local distilling operations. These are sometimes called craft distillers, or micro-distillers. We examine the growth over the past decade of distillery establishments nationally in some detail in Appendix D, and reveal the wide geographic spread that has recently occurred. Nationally, distillers employing fewer than 10 employees grew from 78 to 716 establishments. Small distillers were in 58 U.S. counties in 2006, but a decade later they were in 400 counties across the country.
However, there has been little change in the location of large distilling operations. Among the large employers, most are in Kentucky or adjacent states. In Kentucky, Nelson County accounts for two of the three distillers nationally that employ over 500 employees - the other being the Diageo facility (Smirnoff vodka and Morgan rum) in Plainfield, Illinois. Franklin County, Kentucky, accounts for two (Jim Beam, Buffalo Trace) of the five distillers that employ between 250 and 499 employees; the others being Jack Daniels in Moore County, Tennessee, Phillips Distilling in Princeton (Mille Lac County), Minnesota, and another distiller in the Boston area (Middlesex County, Massachusetts).
As we document in Appendix C, Kentucky’s share of distilling establishments fell from 24 to 6 percent over the 2001-17 period, while its share of employment fell only from 43 to 33 percent. And, Kentucky’s share of distilling payroll has actually risen, to 47 percent of the US total, due largely to the presence of high paying professional jobs at headquarters here. So, while the industry has expanded greatly in terms of geographic locations, Kentucky remains the dominant player in terms of overall production, employment, and payroll.
Distilling directly supports around 5,000 jobs, which is a very small fraction (0.2 percent) of all jobs in Kentucky. However, this is a narrow way to view the industry’s economic importance for several reasons. First, one needs to distinguish between jobs that are based on making things we sell to other states and the rest of world, and jobs that are based on producing things sold to Kentucky households. The export-based jobs bring new dollars into the region and make the economy larger, while the population-based jobs essentially absorb dollars already in the region. Distilling products are almost totally exported out-of-state3, and the industry is an economic engine for Kentucky. Industries like grocery stores, most retail, healthcare, education, and personal services exist to serve the regional population, and hence only expand in response to growth in the population and income, which in turn is determined primarily by growth in Kentucky’s exporting industries.
3 Our IMPLAN model of Kentucky predicts that the distilling industry had output valued at $6.2 billion in 2016,
while Kentuckians demand for distilled spirits was only $57 million.

The Distilling Industry in Kentucky 9
Second, employment is only one important indicator of an industry’s relative importance. Other economic variables include the value of output, employee compensation, and tax revenues generated. In all of these dimensions, distilling has a greater economic contribution than a simple job count would suggest.
In the next chart, we highlight the 40 export-based industries in Kentucky that rank highest in employment as a share of the state total. We also show their relative contributions to total
state output. One can see that distilling ranks fourth highest in terms of output contribution, reflecting the high value of the distilling product, as well as the high employee pay, dividend payments and exceptionally high taxes paid. In terms of contribution to state output, the light truck and auto manufacturing industries lead the way, followed by insurance carriers, then distilling. Not shown are the rankings in terms of employee compensation, where distilling ranks 14th statewide.
Another way to look at the economic importance of industries in Kentucky is to examine what their share is of the national counterpart industries. This is summarized in the next chart. For 532 detailed industries, we divided Kentucky’s employment and output by the national totals for each industry. Clearly, distilling stands out by this measure, with 31 percent of national distilling employment, 33 percent of national output, and (not shown) 45 percent of national employee compensation. The only Kentucky industry with higher shares of both national employment and output is the manufacturing of household appliances.
Couriers and messengers
Warehousing and storage
Management of companies and enterprises
All other crop farming
Beef cattle ranching and farming, incl feedlots
Scientific research and development services
Insurance carriers
Management consulting services
Light truck and utility vehicle mfg
Automobile mfg
PrintingGrain farming
Motor vehicle steering, suspension, brake mfg
Other motor vehicle parts mfgCoal mining
Motor vehicle metal stamping
Motor vehicle seating and interior trim mfg
Distilleries
0%
1%
2%
3%
4%
5%
6%
0.0% 0.2% 0.4% 0.6% 0.8% 1.0% 1.2% 1.4%
Shares of Kentucky Output
Share of Kentucky Employment
Exporting Industries with Largest Shares of Kentucky Activity
Forty industries with largest share of statewide activity, estimated using Implan model of Kentucky , 2016
data, with detail for 526 industries. We filtered out industries that exist primarily to serve local households,
such grocery stores and dentists.

The Distilling Industry in Kentucky 10
Recent and planned investments by Kentucky distillers We surveyed all the KDA members, asking them to disclose their spending over the last five years on construction and other capital investments. We also asked them their investment plans for the next five years. Clearly, the industry is in major growth mode, with heavy spending on stills, warehouses, bottling facilities, and visitor centers. Members reported capital spending of $1.1 billion over the last five years, almost equally split between construction and other items, such as machinery, equipment, and furnishings. Moreover, they plan to spend $1.2 billion over the next five years. Every KDA member, whether a large Heritage producer or a small Craft producer, reported significant investments. The Heritage producers, however, accounted for more than 91 percent of total investments, whether recent or planned.
Grain purchases The primary ingredient in Bourbon and other spirits is grain – corn, wheat, rye and barley. We estimate that Kentucky distillers purchased about 16.0 million bushels of corn and 5.6 million bushels of other grains in 2017. Distillers likely purchased about 9 million of those bushels of corn from Kentucky farmers (56 percent), and less than 1 million bushels of other grains. See Appendix G for more detail.
Tobacco farming
Other major household appliance mfg
Distilleries
Light truck and utility vehicle mfgAluminum sheet, plate, and foil
mfg
Other nonmetallic minerals services
Secondary smelting and alloying of aluminum
Motor vehicle steering, suspension, brakes mfg
Coal mining
Alumina refining and primary aluminum production
Rendering and meat byproduct processing
Automobile mfgMotor vehicle seating and
interior trim mfg
Computer storage device mfg
Electric lamp bulb and part mfgMotor vehicle metal stamping
Polystyrene foam product mfg
Flat glass mfg
Cookie and cracker mfg
Air purification and ventilation equipment mfg
0%
5%
10%
15%
20%
25%
30%
35%
40%
0% 5% 10% 15% 20% 25% 30% 35% 40%
Shares of National Output
Share of National Employment
Kentucky Industries with Largest Shares of National Activity
Twenty industries with largest share of national activity, estimated using
Implan models of Kentucky and United States, 2016 data, with detail
for 526 industries. Across all industries, Kentucky accounts for
1.30% of national employment and 1.33% of national output.

The Distilling Industry in Kentucky 11
EconomicImpactoftheDistillingIndustryinKentucky
In this section, we analyze how the production, jobs, and payroll in the distilling industry ripples throughout Kentucky, creating even more economic activity. We use a custom input-output model of the state to represent the linkages between distilling and hundreds of other industries, as well as households, and then to predict the total economic impacts.
The next table shows the distilling industry’s total economic contribution to the Kentucky economy in employment, output and payroll. It also presents the three impacts by the type of effect (direct, indirect and induced) and the total impact. The direct jobs and payroll of distillers and their corporate office activity leads to a total of around 20,100 jobs, with annual payroll of $1 billion, producing $8.6 billion of economic output. This is an estimate of what would happen in the state in the unlikely event that the distilling industry completely disappeared, or became severely restrained by outside issues that made it impossible or impractical to operate.
.

The Distilling Industry in Kentucky 12
Our economic impact analysis is based on there being approximately 5,000 distilling industry jobs across the state - 3,300 production-related jobs and 1,700 corporate management-related jobs4. Our IMPLAN models have been customized to reflect the particular structure of the industry in Kentucky and all the functions of the production process, from distilling to barreling to bottling, shipping and marketing. Appendix F provides a more detailed explanation of the industrial linkages in the model.
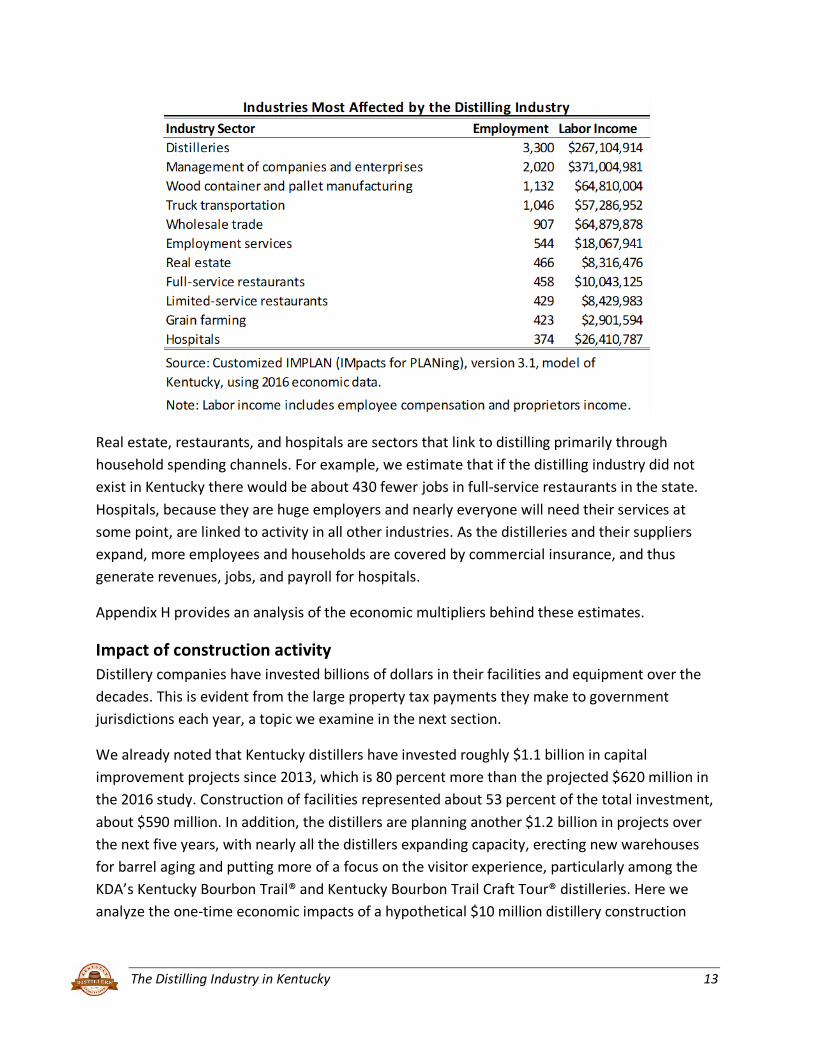
Production activities supported about 15,350 jobs with a payroll of $635.1 million. The contribution to Kentucky’s economic output was about $7.78 billion. Corporate activities supported about 4,770 jobs with a payroll of $369 million. The contribution to Kentucky’s economic output of the management jobs was about $800 million.Aside from the core distilleries and management sector, the industries that are most affected by the distilling industry in Kentucky are wood container and pallet manufacturing, truck transportation, wholesale trade, employment services, real estate, restaurants and bars, and grain farming. According to the Kentucky Directory of Manufacturers, there are at least 1,200 employees working in cooperages, stave manufacturing plants, and used barrel refurbishers (all in the wood container manufacturing industry) throughout the Commonwealth, mostly in the eastern and south-central counties. All are operating at capacity and Independent Stave Company recently announced a new cooperage in Morehead that will begin production in 2019.
4 The direct effect in the production section of the table is less than 3,300 because the activities of the distilling
industry have an effect on itself, essentially spin-off into its own industrial sector. We do not want to double count this own-industry spin-off in our analysis of the contribution of the industry. What the table shows is that if we eliminated all of the corporate management function jobs and about 3,250 production jobs, one result would be the elimination of all of the remaining production jobs (part of the indirect effect).
The Distilling Industry in Kentucky 13
Real estate, restaurants, and hospitals are sectors that link to distilling primarily through household spending channels. For example, we estimate that if the distilling industry did not exist in Kentucky there would be about 430 fewer jobs in full-service restaurants in the state. Hospitals, because they are huge employers and nearly everyone will need their services at some point, are linked to activity in all other industries. As the distilleries and their suppliers expand, more employees and households are covered by commercial insurance, and thus generate revenues, jobs, and payroll for hospitals.
Appendix H provides an analysis of the economic multipliers behind these estimates.
Impact of construction activity Distillery companies have invested billions of dollars in their facilities and equipment over the decades. This is evident from the large property tax payments they make to government jurisdictions each year, a topic we examine in the next section.
We already noted that Kentucky distillers have invested roughly $1.1 billion in capital improvement projects since 2013, which is 80 percent more than the projected $620 million in the 2016 study. Construction of facilities represented about 53 percent of the total investment, about $590 million. In addition, the distillers are planning another $1.2 billion in projects over the next five years, with nearly all the distillers expanding capacity, erecting new warehouses for barrel aging and putting more of a focus on the visitor experience, particularly among the KDA’s Kentucky Bourbon Trail® and Kentucky Bourbon Trail Craft Tour® distilleries. Here we analyze the one-time economic impacts of a hypothetical $10 million distillery construction
The Distilling Industry in Kentucky 14
project. Our estimates can be scaled up or down according to the size of the investment under consideration.
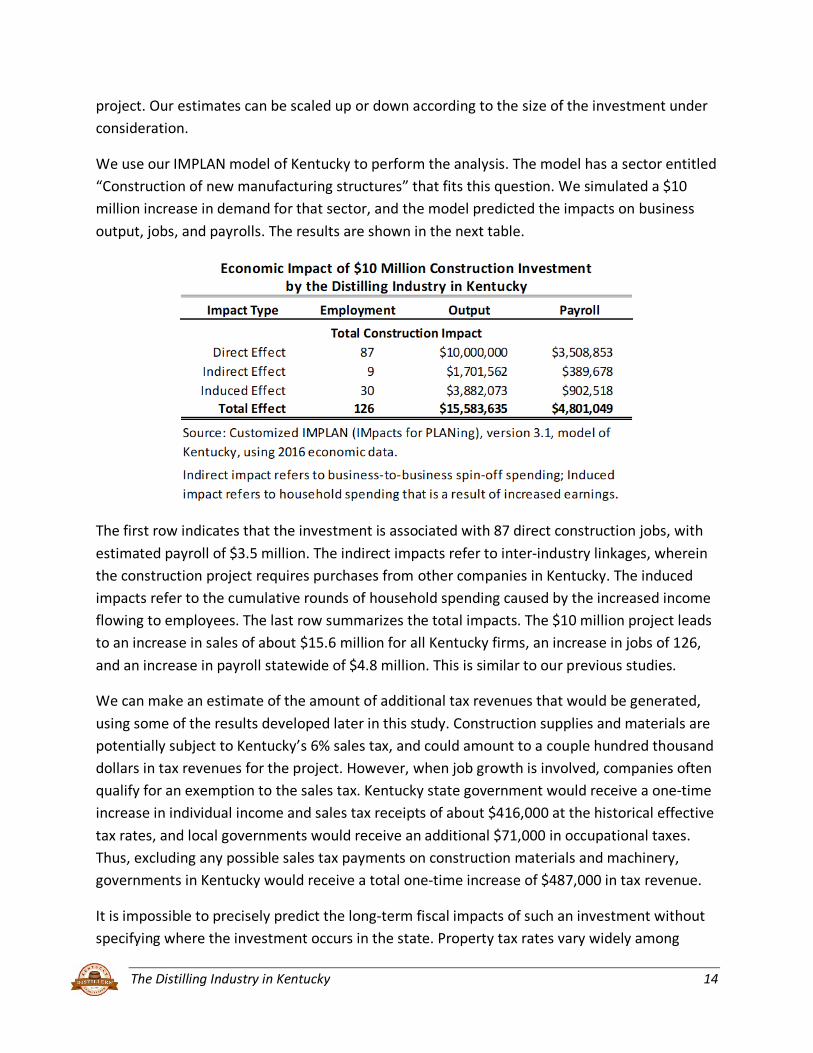
We use our IMPLAN model of Kentucky to perform the analysis. The model has a sector entitled “Construction of new manufacturing structures” that fits this question. We simulated a $10 million increase in demand for that sector, and the model predicted the impacts on business output, jobs, and payrolls. The results are shown in the next table.
The first row indicates that the investment is associated with 87 direct construction jobs, with estimated payroll of $3.5 million. The indirect impacts refer to inter-industry linkages, wherein the construction project requires purchases from other companies in Kentucky. The induced impacts refer to the cumulative rounds of household spending caused by the increased income flowing to employees. The last row summarizes the total impacts. The $10 million project leads to an increase in sales of about $15.6 million for all Kentucky firms, an increase in jobs of 126, and an increase in payroll statewide of $4.8 million. This is similar to our previous studies.
We can make an estimate of the amount of additional tax revenues that would be generated, using some of the results developed later in this study. Construction supplies and materials are potentially subject to Kentucky’s 6% sales tax, and could amount to a couple hundred thousand dollars in tax revenues for the project. However, when job growth is involved, companies often qualify for an exemption to the sales tax. Kentucky state government would receive a one-time increase in individual income and sales tax receipts of about $416,000 at the historical effective tax rates, and local governments would receive an additional $71,000 in occupational taxes. Thus, excluding any possible sales tax payments on construction materials and machinery, governments in Kentucky would receive a total one-time increase of $487,000 in tax revenue.
It is impossible to precisely predict the long-term fiscal impacts of such an investment without specifying where the investment occurs in the state. Property tax rates vary widely among
The Distilling Industry in Kentucky 15
jurisdictions. A rule of thumb is that real estate is subject to property taxation at the rate of 1%, though the rate can be much higher in very urbanized places with intensive public services (schools, fire, police, libraries, streets, garbage pickup, EMS). Assuming that the property was valued at construction cost, this implies that the direct investment leads to annual property tax revenues to local and state governments of $100,000 per year.
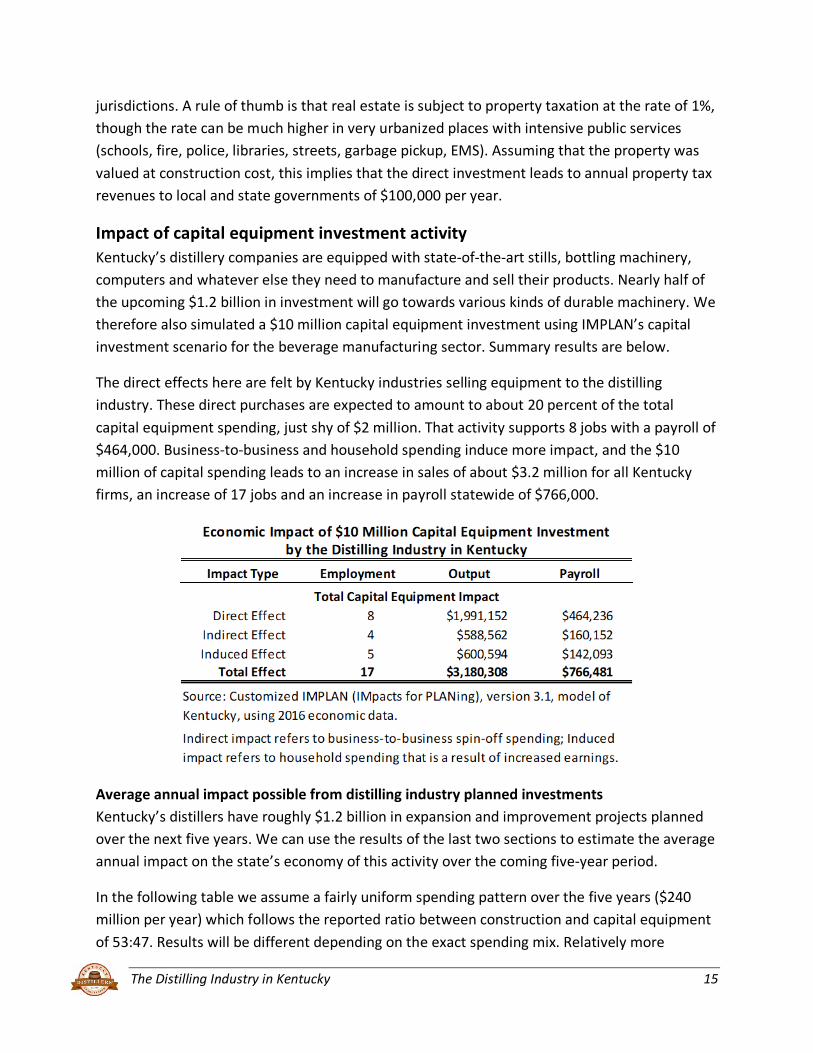
Impact of capital equipment investment activity Kentucky’s distillery companies are equipped with state-of-the-art stills, bottling machinery, computers and whatever else they need to manufacture and sell their products. Nearly half of the upcoming $1.2 billion in investment will go towards various kinds of durable machinery. We therefore also simulated a $10 million capital equipment investment using IMPLAN’s capital investment scenario for the beverage manufacturing sector. Summary results are below.
The direct effects here are felt by Kentucky industries selling equipment to the distilling industry. These direct purchases are expected to amount to about 20 percent of the total capital equipment spending, just shy of $2 million. That activity supports 8 jobs with a payroll of $464,000. Business-to-business and household spending induce more impact, and the $10 million of capital spending leads to an increase in sales of about $3.2 million for all Kentucky firms, an increase of 17 jobs and an increase in payroll statewide of $766,000.
Average annual impact possible from distilling industry planned investments Kentucky’s distillers have roughly $1.2 billion in expansion and improvement projects planned over the next five years. We can use the results of the last two sections to estimate the average annual impact on the state’s economy of this activity over the coming five-year period.
In the following table we assume a fairly uniform spending pattern over the five years ($240 million per year) which follows the reported ratio between construction and capital equipment of 53:47. Results will be different depending on the exact spending mix. Relatively more

The Distilling Industry in Kentucky 16
construction spending will increase the impact, while relatively more capital equipment spending will decrease the overall impact.
We estimate that the distilling industry construction and capital improvement projects could support an average of 1,794 additional jobs in Kentucky through 2023. Those jobs would have about $69.7 million in total payroll and generate about $7.1 million in combined state and local income and sales taxes each year. The real estate improvements could mean an additional $1.27 million in property tax revenues each year for local and state governments.
The Distilling Industry in Kentucky 17
TaxationandFiscalImpactsoftheIndustryThere are many types of taxes that distillers and the consumers of spirits pay, and the taxes go to many different jurisdictions in Kentucky. Indeed, this is the most complicated part of our analysis. Distilleries remain the highest taxed of the 532 Kentucky industrial sectors we analyzed using our IMPLAN input-output model of the state. Twenty-eight percent of the value of distillery output goes to government taxes – more than amusement parks and arcades (23 percent), tobacco (15 percent), breweries (13 percent), and wine (3 percent). This calculation includes taxes levied by all levels of government, including federal, state, and local.
In this section, we look into many details of taxation of distilled spirits in Kentucky, not just of distilleries themselves, but through the distribution chain to wholesalers, retail package stores, and restaurants and bars. Like many states, Kentucky has a three tier system of regulation and taxation of alcohol products. Production is taxed at the distillery/bottling/storage sites. Wholesalers are required to remit separate taxes based on volume and value in the process of supplying retail businesses. Then, restaurants, bars, and package stores collect a separate sales tax based on value.
We have collected data and made estimates for the most important tax items, including local and state property taxes, state alcohol production and consumption taxes, local occupational taxes, and Kentucky state individual income and sales taxes.
A summary of our estimates is provided in the table below. All entries refer to the latest year available for data, primarily calendar or fiscal year 2017. Production-related taxes account for $135 million of the $235 million total. Some of the entries are based on sheriff department records and official government tallies, some on company provided reports, while other entries are estimates based on historical ratios. Clearly, Kentucky state government is the biggest tax recipient, accounting for 82 percent of the total over all levels of government. Public school districts and local governments are the biggest recipients of property taxes paid by the industry.

The Distilling Industry in Kentucky 18
These entries are probably the most important taxes on distilled spirits, but there are many other taxes paid that are harder to quantify. For example, we do not know the amount of taxes paid on insurance premiums, gasoline, and utilities that are paid to state and local governments. So, $235 million should be considered a lower bound on the true unknown amount of taxes paid. In the following sections we discuss each type of tax in the table individually and then compare our results with the previous report.
Property taxes A distillery may pay property taxes on its land and buildings to the local school system, the county government, the city government, a fire district, a library, health or agricultural district, and the state of Kentucky. They also pay tangible property taxes to those jurisdictions on the value of machinery, furniture, vehicles, and the distilled spirits aging in warehouses.
We have attempted to track down the various properties owned by the distillery companies, and to organize public information on their tax bills in 2017. We used a combination of web
Local Public Schools
City, County, Other Local
Governments
Kentucky State
Government TotalProduction-related
Property taxes - real estate and tangible property $3,468,387 $1,723,848 $1,686,529 $6,878,763Property taxes - spirits aging in barrels $12,264,163 $5,592,287 $1,168,384 $19,024,834
Individual income taxes from distillery-related payrolls $47,164,694 $47,164,694General sales taxes from distillery-related payrolls $39,912,341 $39,912,341Occupational taxes from distillery-related payrolls $1,425,587 $14,288,879 $15,714,466
Corporate income taxes paid (partial)* $50,000 $6,000,000 $6,050,000Distilled spirits license fees** $52,000 $262,235 $314,235
Subtotal $17,158,136 $21,707,014 $96,194,183 $135,059,333Consumption-related
Case sales tax $153,781 $153,781Excise tax per gallon $14,237,920 $14,237,920
Wholesale tax $44,064,952 $44,064,952General retail sales tax, restaurants and bars $13,314,640 $13,314,640
Package retail sales tax $22,593,905 $22,593,905Distilled spirits license fees** $3,329,414 $2,168,227 $5,497,641
Subtotal $3,329,414 $96,533,426 $99,862,840
Grand Total $17,158,136 $25,036,428 $192,727,608 $234,922,172
Estimated Annual Kentucky Taxes on the Production and Consumption of Distilled Spirits, 2017
* This represents an estimate based on a five year average of Kentucky corporate income tax payments and local net profits tax payments from some, but not all, the major companies compiled for the previous version of this study. Corporate income tax payments tend to vary widely from year to year, making prediction unreliable.** Production-related license fees are mostly for distillers and rectifiers licenses; consumption-related license fees are largely for retail and package drink licenses.

The Distilling Industry in Kentucky 19
searches, courthouse visits and phone calls to collect data on assessments and taxes paid. We were able to identify a total of about $6.9 million paid to local and state governments. The assessed value of land, buildings, equipment, and inventory (ready to sell) was $1.1 billion, of which $397 million was real estate and $691 million was tangible property. The pie chart shows the distribution of taxes paid by jurisdiction type. Public schools are the biggest recipient of property tax payments, with revenues of about $3.47 million or 50 percent of the total. Kentucky state government is next, with $1,686,000 (24 percent), followed by city and county governments with nearly $1.1 million (16 percent). Local libraries received $277,000 (four percent). The ‘Other’ category includes property tax revenues received by local health departments, agricultural extension offices, soil conservation districts, fire districts, and an air board. That total was nearly $350,000 (5 percent) in 2017.
The distillery industry also pays ad valorem property taxes on all of the Bourbon aging in barrels in bonded warehouses and other distilled spirits inventory. The tax payments are substantial, most of it going to local jurisdictions. The industry paid roughly $19 million in distilled spirits ad valorem taxes to state and local governments in 2017, double that documented in our original study year 2009, and a 40 percent increase over our study of two years ago. And, the Kentucky Department of Revenue has estimated that ad valorem taxes on aging barrels will be $22.6

The Distilling Industry in Kentucky 20
million in 2018. The next pie chart shows the distribution of these payments to the state, city and county governments, public schools, libraries and other local government in 2017. The state of Kentucky received almost $1.2 million in distilled spirits inventory taxes in 20175, just over six percent of the total. Schools received over 64 percent of all these tax payments, with revenues of $12.2 million. City and county governments and library districts collected $3.4 million (18 percent) and $1.1 million (six percent), respectively. Just over $1 million (5.5 percent) went to various other government entities.
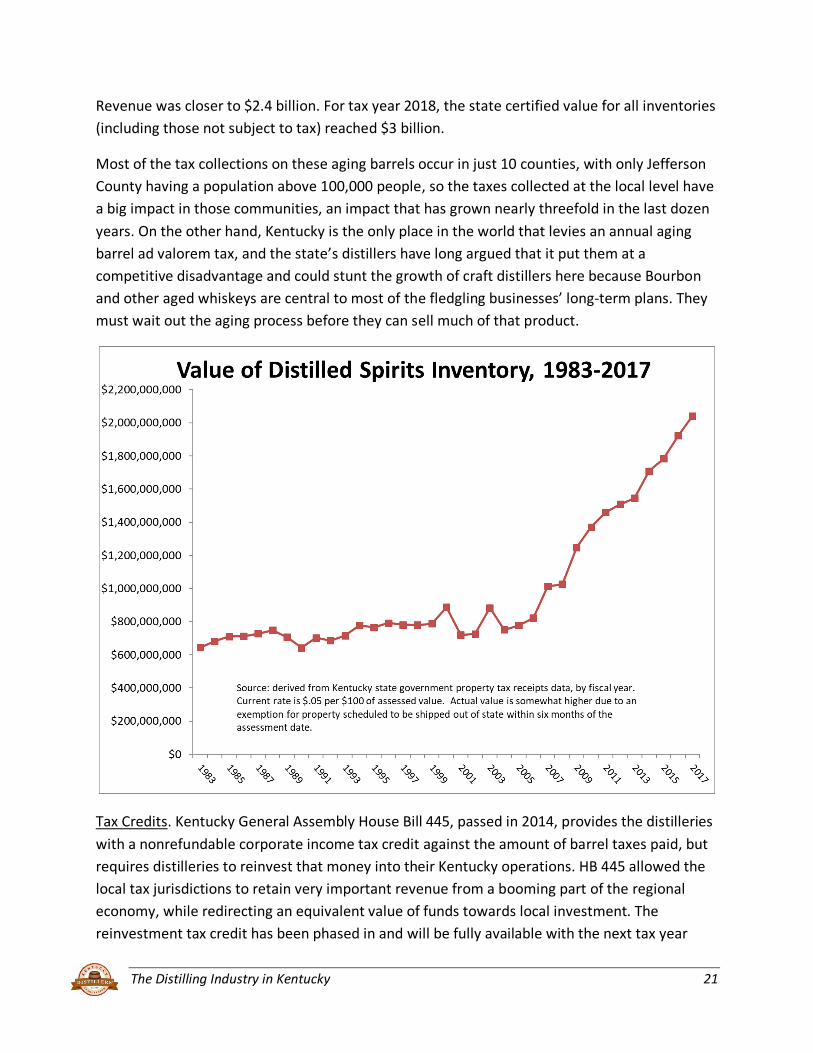
Since the state tangible property tax rate on distilled spirits inventory is a flat $0.05 per $100 of valuation, we can use historical data on General Fund receipts from this tax to see the upward trend in inventory values over the past three decades, displayed in the chart on the next page. The chart reflects payments through the 2016 tax year, with payments falling at the beginning of the 2017 fiscal year. The collections imply an inventory value of just over $2 billion, but the actual value is higher due to an exemption for property scheduled to be shipped out-of-state within six months of the assessment date. The total value certified by the state Department of
5 The state portion of the inventory tax was eliminated in a recent tax reform bill.
The Distilling Industry in Kentucky 21
Revenue was closer to $2.4 billion. For tax year 2018, the state certified value for all inventories (including those not subject to tax) reached $3 billion.
Most of the tax collections on these aging barrels occur in just 10 counties, with only Jefferson County having a population above 100,000 people, so the taxes collected at the local level have a big impact in those communities, an impact that has grown nearly threefold in the last dozen years. On the other hand, Kentucky is the only place in the world that levies an annual aging barrel ad valorem tax, and the state’s distillers have long argued that it put them at a competitive disadvantage and could stunt the growth of craft distillers here because Bourbon and other aged whiskeys are central to most of the fledgling businesses’ long-term plans. They must wait out the aging process before they can sell much of that product.
Tax Credits. Kentucky General Assembly House Bill 445, passed in 2014, provides the distilleries with a nonrefundable corporate income tax credit against the amount of barrel taxes paid, but requires distilleries to reinvest that money into their Kentucky operations. HB 445 allowed the local tax jurisdictions to retain very important revenue from a booming part of the regional economy, while redirecting an equivalent value of funds towards local investment. The reinvestment tax credit has been phased in and will be fully available with the next tax year

The Distilling Industry in Kentucky 22
(payments due in the fall of 2019). The value of the credits will total about $20 million then, which will help with the planned $1.2 billion in near-term capital investment, a figure that has doubled since we surveyed the distillers in 2016. However, corporate income tax liabilities by distillers have not been sufficient to take full advantage of the new tax credit.
As we show, distillers’ barrel tax levels are growing higher than their corporate income tax burden, therefore there is not enough credit available to offset the rising barrel taxes. This issue was compounded in 2018 when the General Assembly reduced the corporate income tax rate to a flat 5 percent from 6 percent, which reduced the potential credit pool for distillers. Distillers have advocated to make the credit refundable or transferrable, which would allow for additional reinvestment into their facilities and create more jobs and tax revenue.
The Kentucky Department of Revenue estimates that distillers paid $23 million in property taxes on aging barrels in 2018. Thus, under the distillers’ proposal there would be a clear incentive to convert the tax credits into investments. Distillers have been roughly splitting investments between construction and capital equipment. We have used our IMPLAN model of Kentucky to predict the economic impact of $11.5 million in construction and $11.5 million in equipment – an assumption that the full tax credit would be used. There would likely be a total of 165 additional jobs, $21.6 million in new sales by Kentucky companies, and $6.4 million in payroll for workers in Kentucky. At least part of the tax revenues forgone by the state treasury would be offset by state income and sales taxes paid due to the expansion of the distilling industry and resulting rise in employee payrolls.
Tax revenues related to payrolls of distilleries We turn to the income and sales tax paid by employees who owe their incomes to distillery operations in Kentucky. The most important categories are the Kentucky individual income tax, the Kentucky general sales tax, and the occupational taxes paid to local governments. In several counties, we suspect that the distillery’s employees are the largest direct payer of occupational taxes among all places of employment, but firm-specific payroll data is not publicly available.
Kentucky income and sales tax receipts related to distillery payrolls can be estimated using effective tax rates. Effective tax rates are calculated by dividing historical tax revenues by payrolls. We use wage and salary data from the US Bureau of Economic Analysis and tax collection data from the Kentucky Department of Revenue to calculate the average effective tax rates over the 2007-16 period. The effective income tax rate is 4.7% and the effective sales tax rate is 3.98%.
Multiplying by the $1 billion in total distillery-related payroll yields $47.1 million in Kentucky individual income tax receipts and $39.9 million in Kentucky sales tax receipts, for a total of $87.1 million to state government annually. This represents an estimate of how much less in tax

The Distilling Industry in Kentucky 23
receipts Kentucky state government would receive from these two most important categories were the distillery industry to go to another state.
Next, we turn to occupational taxes received by local governments. We have taken the local government jurisdictions that levy occupational taxes in counties containing Kentucky distilleries and weighted their rates by the number of distillery jobs in that county. This gives us a weighted average local occupational tax to apply to the direct payroll impact of the IMPLAN model. We have also created a weighted average of all occupational taxes across the state using payroll inside and outside taxing jurisdictions as the weight. We apply this weighted average to the combined indirect and induced payroll impact. We applied the same methods for school district occupational taxes. Most of these jurisdictions also levy a ‘net profits tax’ on companies, typically at the same rate as the tax on payrolls, but we do not have data on corporate profits subject to the tax.
Applying the appropriate distillery-related payroll impact (either direct or combined indirect and induced) to the weighted local tax rates, we estimate that local school districts received about $1.45 million in occupational taxes in 2017, and local city or county governments received $14.3 million.
State licenses and fees The Kentucky Department of Alcoholic Beverage Control administers a number of license fees that apply to any business producing, storing, transporting, distributing, selling, or serving alcoholic beverages within the state. In fiscal year 2017, the state collected $7.1 million in fees for these licenses. There are currently over 17,200 active licenses, and given the current fee structure the state will collected about $7.4 million in their issuance in fiscal year 2018. Not all of those are relevant to the distilling industry, as many are restricted to those who produce, sell, or serve only malt beverages or wine. But around 11,200 either directly or indirectly impact the distilling industry through their treatment of distilled spirits.
On the production side there are distiller’s and rectifier’s Class A and B licenses and a storage license which bring in $262,000 from the state’s distillers.
On the consumption side, we group together many different licenses for retail drink and package sales, transportation, wholesale, distribution, and solicitors or agents. We use national sales ratios of retail sales of beer, wine, and spirits from the Distilled Spirits Council to derive the percentage of these fees attributable to distilled spirits. For 2017, spirits accounted for about 36 percent of alcohol sales, and the ratio between spirits and wine was approximately two-to-one. Applying these ratios to the appropriate licenses, we estimate that distilled spirits currently account for $2.2 million in consumption-related license fees paid to the state to enforce the laws.

The Distilling Industry in Kentucky 24
Local licenses and fees On the production side, distillers pay for local licenses as well as their state license. We estimate that city and county governments collected $52,000 in fees from distillers and bottlers in 2017.
On the consumption side, any business selling alcoholic beverages in Kentucky must pay annual license fees to local governments. This includes restaurants, caterers, hotels, bars, grocery stores, pharmacies, and package stores. The fees vary by type of alcohol sold and by size of city. For example, a restaurant in Louisville offering spirits must pay the City-County government $1,600 each year, compared to $500 in Morehead. Moreover, jurisdictions typically assess different fee amounts for different types of establishments (e.g., airport, racetrack, restaurant, package store), and even by time of day (higher fees if establishment is open after midnight).
We do not know the total amount of fees paid annually to all the jurisdictions. Some alcohol sales are allowed in 66 counties, many of which have multiple cities of different sizes and alcohol laws. Nevertheless, we can make a rough estimate from some published data. In Jefferson County, the Metro government handles all licensing throughout the county, and collects about $2.4 million annually in license fees. The comparable number for the Lexington-Fayette Urban County Government is $0.9 million. These two counties combined account for 24 percent of the state’s population, but they account for 37 percent of the state’s retail sales by package stores, 37 percent of restaurant sales, and 48 percent of hotel sales. So, a reasonable estimate is that statewide alcohol license fees are a bit less than three times the collections in Jefferson and Fayette County, or $9.3 million. Of course, not all of that can be attributed to distilled spirits. Using national ratios of retail sales of beer, wine, and spirits, we believe the spirits portion accounts for about 36 percent of alcohol sales. Thus, we estimate that distilled spirits accounts for $3.3 million in license fees for local governments annually in Kentucky.
The Distilling Industry in Kentucky 25
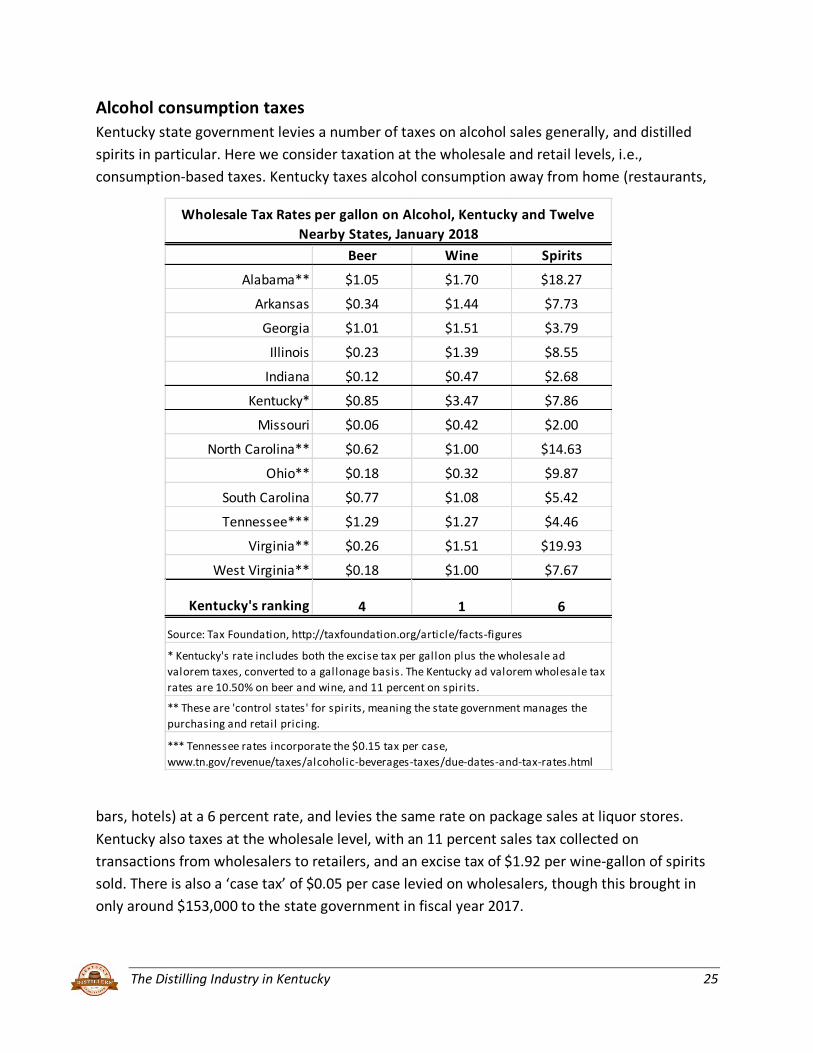
Alcohol consumption taxes Kentucky state government levies a number of taxes on alcohol sales generally, and distilled spirits in particular. Here we consider taxation at the wholesale and retail levels, i.e., consumption-based taxes. Kentucky taxes alcohol consumption away from home (restaurants,
bars, hotels) at a 6 percent rate, and levies the same rate on package sales at liquor stores. Kentucky also taxes at the wholesale level, with an 11 percent sales tax collected on transactions from wholesalers to retailers, and an excise tax of $1.92 per wine-gallon of spirits sold. There is also a ‘case tax’ of $0.05 per case levied on wholesalers, though this brought in only around $153,000 to the state government in fiscal year 2017.
Beer Wine SpiritsAlabama** $1.05 $1.70 $18.27
Arkansas $0.34 $1.44 $7.73
Georgia $1.01 $1.51 $3.79
Illinois $0.23 $1.39 $8.55
Indiana $0.12 $0.47 $2.68
Kentucky* $0.85 $3.47 $7.86
Missouri $0.06 $0.42 $2.00
North Carolina** $0.62 $1.00 $14.63
Ohio** $0.18 $0.32 $9.87
South Carolina $0.77 $1.08 $5.42
Tennessee*** $1.29 $1.27 $4.46
Virginia** $0.26 $1.51 $19.93
West Virginia** $0.18 $1.00 $7.67
Kentucky's ranking 4 1 6
Wholesale Tax Rates per gallon on Alcohol, Kentucky and Twelve Nearby States, January 2018
Source: Tax Foundation, http://taxfoundation.org/article/facts-figures
* Kentucky's rate includes both the excise tax per gallon plus the wholesale ad valorem taxes, converted to a gallonage basis. The Kentucky ad valorem wholesale tax rates are 10.50% on beer and wine, and 11 percent on spirits.
** These are 'control states' for spirits, meaning the state government manages the purchasing and retail pricing.
*** Tennessee rates incorporate the $0.15 tax per case, www.tn.gov/revenue/taxes/alcoholic-beverages-taxes/due-dates-and-tax-rates.html

The Distilling Industry in Kentucky 26
The combined wholesale taxes - $1.92 per gallon plus 11 percent ad valorem tax - on spirits is among the highest among U.S. states. Nearly all the states with higher wholesale taxes are ‘control states’, meaning the distribution and pricing is controlled by state government. Only four ‘market states’ levy higher wholesale taxes than Kentucky – Washington, Alaska, Minnesota, and Illinois. Kentucky’s wholesale tax is almost twice that as Tennessee, the second biggest producer of whiskey. Given Kentucky’s prominence in Bourbon production, there is a contrast with the tax treatment in states that are prominent in wine and beer production. For example, California and New York are the largest wine producing states, and their wholesale taxes are among the four lowest states. Similarly, Missouri, Wisconsin and Colorado have among the five lowest wholesale taxes on beer, and these states are the largest beer producers. See Appendix I for a comparison of Kentucky’s alcohol excise tax rates compared to those in other states.
The chart above shows historical data on the consumption-based tax receipts, some of which are from state government reports and some estimated. Clearly, this has been a growing source of revenue for Kentucky state government. The wholesale tax brought in $44 million in revenue to the Kentucky state General Fund in fiscal year 2017, based on the wholesale value of liquor of about $401 million. The excise tax brought in $14.2 million in revenue in FY17. Rising spirits

The Distilling Industry in Kentucky 27
prices and volume have combined to generate average annual growth rate of 5.5 percent in wholesale tax. Indeed, the state could eliminate the excise tax and see no loss in net tax revenue from spirits consumption within five years, as shown in the table (using the most recent data through FY18). That is, the growth in the value of spirits sales would quickly more than make up for the loss of $14.2 million in excise taxes (on volume). This would put Kentucky at less of a disadvantage to other states. Currently, only Kentucky levies both a wholesale ad valorem tax and an excise tax on spirits.
We use the 2012 Economic Census’ break out of restaurant and bar sales by type in Kentucky to help us estimate retail alcohol consumption taxes. The Census Bureau estimated that ‘Alcoholic beverages served for immediate consumption’ at restaurants, bars, and hotels in Kentucky totaled $414 million in 2012. Of that, distilled spirits accounted for just over 36 percent. Thus, sales of distilled spirits (for immediate consumption) at Kentucky restaurants, bars, and hotels were about $150 million in 2012. We use historical growth in wholesale receipts to estimate these retail sales away from home for other years, and multiply by six percent to estimate state tax revenues. In fiscal year 2017, we estimate that this brought in $13.3 million to the state.
We similarly estimate package retail sales tax receipts using the 2012 Economic Census. ‘Packaged liquor, wine, & beer’ retail sales in Kentucky totaled $900 million in 2012. Details at the federal level show that distilled spirits made up 28.2 percent of those sales. This implies that package spirits sales at retail stores were $254 million that year. Assuming those sales have
Year
Constant 2018 Tax Revenue from Wholesale Ad
Valorem (11%) and Excise Taxes Gallons
Wholesale Price per
Gallon
Spirits Revenue at Wholesale
LevelExcise Rate
Rollback2018 $59,847,698 7,441,685 $55.66 $414,178,755 $1.92
2019 $59,847,698 7,683,465 $56.88 $437,030,078 $1.53
2020 $59,847,698 7,933,100 $58.13 $461,142,168 $1.15
2021 $59,847,698 8,190,846 $59.41 $486,584,585 $0.77
2022 $59,847,698 8,456,966 $60.71 $513,430,727 $0.40
2023 $59,847,698 8,731,732 $62.04 $541,758,040 $0.03
2024 $59,847,698 9,015,426 $63.41 $571,648,246 ($0.34)
2025 $59,847,698 9,308,336 $64.80 $603,187,572 ($0.70)
2026 $59,847,698 9,610,764 $66.22 $636,467,005 ($1.06)
2027 $59,847,698 9,923,017 $67.68 $671,582,551 ($1.41)
2028 $59,847,698 10,245,415 $69.17 $708,635,513 ($1.77)Assumes that volume and average wholesale price will grow each year by its 10-year compound growth rate;volume has been growing by 3.25%, and price by 2.20% annually.
How Long Until Growth in Spirits Volume and Price Offsets Loss of Excise Tax

The Distilling Industry in Kentucky 28
grown at the same rate as the growth in wholesale tax revenues, the 6 percent retail tax brought in $22.6 million in fiscal year 2017. The four consumption tax streams are shown in the above chart, with Kentucky state tax revenues hitting $94 million in 2017.
Tax impacts over time There has been a marked increase in the tax impact of the distilling industry over time. Below we show real, tangible, and distilled spirits property tax assessments for 2009, 2013, and 2017. The value of real and tangible property owned by Kentucky distillers has nearly tripled in the last decade, while the value of the distilled spirits inventory aging in barrels has doubled in that time. The next table compares our current estimates of the taxes generated at all levels of
government that can be attributed to the impact of the distilling industry with the estimates from three previous studies. In total, we estimate that the industry can be said to be generating around $94 million, or 67 percent, more tax revenue throughout the state than it did in 2010.
The changes in the consumption-related taxes are fairly straightforward. Simply put, Kentucky consumers have been just as much a part of the worldwide Bourbon boom as anybody else. Since the tax rates have all remained the same, it is simply a matter of the number of cases and gallons sold in the state, and the value of sales increasing. That the excise tax per gallon has the lowest percentage increase tells us that the average price of the spirits Kentuckians have been drinking is going up, which is consistent with the growth of premium brands.
2009 2013 2017
Real Property Taxes $138,725,818 $232,717,889 $396,806,745 186.0%
Tangible Business Property Taxes $246,361,726 $400,823,294 $691,375,604 180.6%
Distilled Spirits in Bonded Warehouses Tax $893,432,418 $1,332,029,432 $1,752,809,266 96.2%
Total Property Related Tax Assessment $1,278,519,962 $1,965,570,615 $2,840,991,615 122.2%
Property Related Tax Assessments of Kentucky Distillers, 2009, 2013, 2017
Percent Change '09-'17
Sources: County Sheriff tax offices in 33 counties.
Estimated Assessments, Subject to County-level Tax

The Distilling Industry in Kentucky 29
On the production side, the increases in property taxes and license fees reflect the recent wave of investment made by the distillers and growth in the number of distillers. The increases of the income, sales, and occupational taxes are related to the total payroll effect from our input-output model, predicting $1 billion in payroll at Kentucky businesses was being directly or indirectly supported by the distilling industry. This is 25 percent more than the previous study.
Revenues Generated at All Levels of Government 2010 2013 2015 2017 Change Percent
Production-related
Property taxes - real estate and tangible property $2,705,829 $3,600,882 $5,455,338 $6,878,763 $4,172,934 154.2%Property taxes - spirits aging in barrels $11,697,908 $11,940,044 $13,412,692 $19,024,834 $7,326,926 62.6%
Individual income taxes from distillery-related payrolls $25,248,351 $32,792,590 $37,001,568 $47,164,694 $21,916,342 86.8%General sales taxes from distillery-related payrolls $21,938,745 $28,494,070 $31,798,948 $39,912,341 $17,973,596 81.9%Occupational taxes from distillery-related payrolls $6,497,408 $8,424,378 $12,073,846 $15,714,466 $9,217,058 141.9%
Corporate income taxes paid (partial)* $5,917,009 $6,050,000 $6,050,000 $6,050,000 $132,991 2.2%Distilled spirits license fees** $186,790 $237,190 $188,590 $314,235 $127,445 68.2%
Subtotal $74,192,041 $91,539,153 $105,980,981 $135,059,333 $60,867,292 82.0%Consumption-related
Case sales tax $110,086 $122,873 $132,802 $153,781 $43,695 39.7%Excise tax per gallon $10,942,531 $11,962,448 $12,468,749 $14,237,920 $3,295,389 30.1%
Wholesale tax $28,175,617 $31,911,903 $36,471,357 $44,064,952 $15,889,335 56.4%General retail sales tax, restaurants and bars $8,748,501 $9,908,614 $11,324,320 $13,314,640 $4,566,139 52.2%
Package retail sales tax $14,443,509 $16,358,821 $18,696,108 $22,593,905 $8,150,396 56.4%Distilled spirits license fees** $4,301,591 $4,697,707 $4,869,387 $5,497,641 $1,196,050 27.8%
Subtotal $66,721,835 $74,962,366 $83,962,723 $99,862,840 $33,141,004 49.7%
Grand Total $140,913,876 $166,501,519 $189,943,705 $234,922,172 $94,008,296 66.7%
Comparison of Estimated Annual Kentucky Taxes on the Production and Consumption of Distilled Spririts, 2010-2017
* This represents an estimate based on a five year average of Kentucky corporate income tax payments and local net profits tax payments from some, but not all, the major companies compiled for the previous version of this study. Corporate income tax payments tend to vary widely from year to year, making prediction unreliable.
** Production-related license fees are mostly for distillers and rectifiers licenses; consumption-related license fees are largely for retail and package drink licenses.

The Distilling Industry in Kentucky 30
Conclusion The distilling industry in Kentucky continues to expand in response to growing international demand for its signature Bourbon products. We have studied the industry five times since 2009, and have been able to document steady growth in facilities, jobs, payroll, exports, and tax payments. In our first study, we reported 19 distilling establishments owned by 10 companies, located in 8 counties. There are now distilleries in 68 distinct locations, owned by 56 companies, across 32 counties. This reflects the expansions by large legacy distillers, but also the recent explosion in craft distillers. The boom in craft distillers is nationwide, but Kentucky remains the dominant state in terms of production, accounting for one-third of US employment in the distilling industry.
The industry now directly employs around 5,000 workers in Kentucky, with a payroll of $470 million annually. But the full economic impact is much larger, due to the many businesses in Kentucky that supply materials and services to distillers, as well as increased household spending related to distillery payrolls. Examples include farmers who provide grain, companies that provide oak barrels and packaging materials, truckers, bankers, insurers, and marketing firms. We estimate that the total statewide economic impact of the distilling industry in 2017 was 20,100 jobs, with annual payroll of $1 billion. The production and consumption of distilled spirits provides an increasing flow of tax payments to state and local governments. We estimate that the distilling industry is directly or indirectly responsible for about $235 million in state and local tax payments in Kentucky annually. This is almost double the amount we documented in our 2009 study. The total includes local and state property taxes, state alcohol production and consumption taxes, local occupational taxes, and Kentucky state individual income and sales taxes. State government accounts for 82 percent of the total tax revenues, with 18 percent going to local government entities. School districts and local governments are the biggest recipients of property taxes paid by the industry. For 2018, the Kentucky Department of Revenue estimates that state and local governments will collect $22.6 million in taxes on barrels aging in inventory, and that inventory is assessed at $3 billion.
And the industry has accelerated its investments in new plant and equipment. KDA members reported capital spending of $1.1 billion over the last five years, almost equally split between construction and other items, such as machinery, equipment, and furnishings. Moreover, they plan to spend $1.2 billion over the next five years. Every KDA member, whether a large Heritage producer or a small Craft producer, reported significant investments. These large investments suggest we will see even more growth in traditional measures of economic activity, such as jobs, payroll, and tax payments. Growing at the rate we have observed over the last decade, Kentucky’s distilling industry could support almost 24,000 jobs
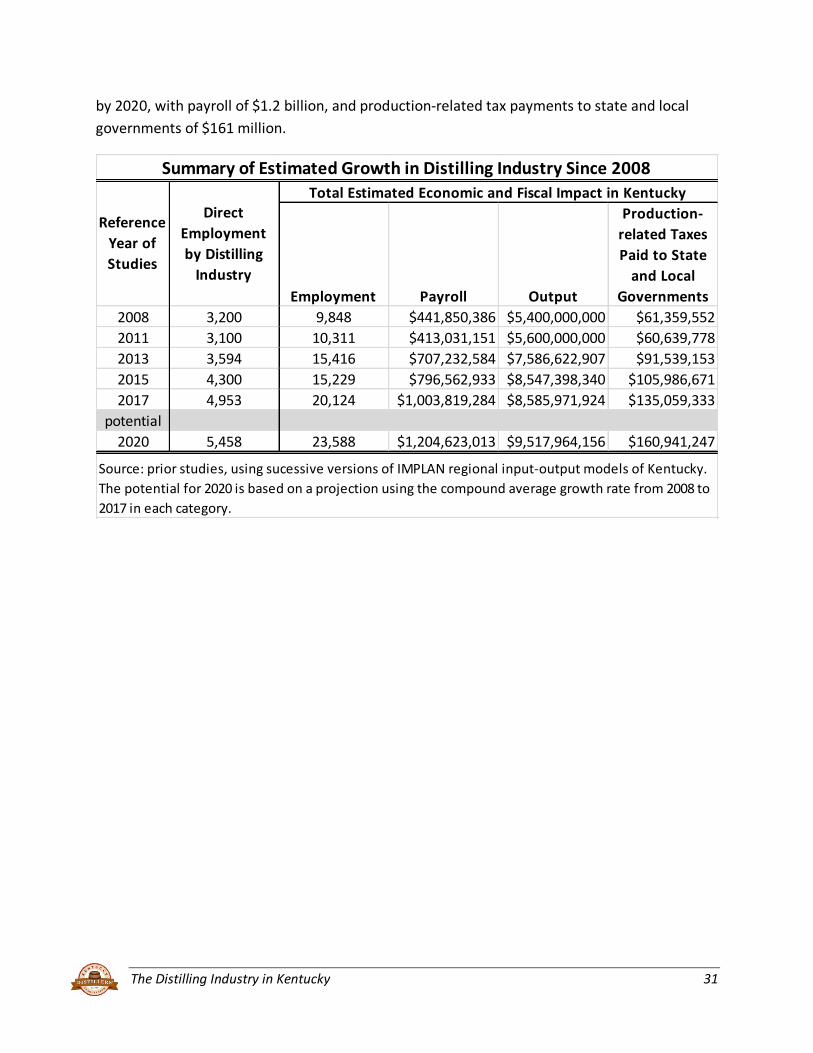
The Distilling Industry in Kentucky 31
by 2020, with payroll of $1.2 billion, and production-related tax payments to state and local governments of $161 million.
Employment Payroll Output
Production-related Taxes Paid to State
and Local Governments
2008 3,200 9,848 $441,850,386 $5,400,000,000 $61,359,5522011 3,100 10,311 $413,031,151 $5,600,000,000 $60,639,7782013 3,594 15,416 $707,232,584 $7,586,622,907 $91,539,1532015 4,300 15,229 $796,562,933 $8,547,398,340 $105,986,6712017 4,953 20,124 $1,003,819,284 $8,585,971,924 $135,059,333
potential2020 5,458 23,588 $1,204,623,013 $9,517,964,156 $160,941,247
Total Estimated Economic and Fiscal Impact in KentuckyDirect
Employment by Distilling
Industry
Reference Year of Studies
Summary of Estimated Growth in Distilling Industry Since 2008
Source: prior studies, using sucessive versions of IMPLAN regional input-output models of Kentucky. The potential for 2020 is based on a projection using the compound average growth rate from 2008 to 2017 in each category.

The Distilling Industry in Kentucky 32
APPENDIX A Federal Industrial Classification Codes Relevant to the Distilling Industry
We treat the industry here as the collection of firms that earn revenues primarily from distilling and selling liquor. These firms may engage in other revenue-generating activities, such as making brandy, beer, wooden barrels, managing and marketing other product lines (including wines and non-liquor products), and selling merchandise in their gift shops. Nevertheless, we presume the companies would not be located in Kentucky were it not for their distilling operations, and hence for purposes of this study attempt to count all their activity as part of the industry.
According to the 2017 Kentucky Directory of Manufacturers, the distilling companies in Kentucky have activities that span eight industrial classifications. These industries are shown in the table, with their official descriptions.
Code Title Description: This industry comprises establishments primarily engaged in…312120 Breweries brewing beer, ale, lager, malt liquors, and nonalcoholic beer.
312130 Wineries one or more of the following: (1) growing grapes and manufacturing wines and brandies; (2) manufacturing wines and brandies from grapes and other fruits grown elsewhere; and (3) blending wines and brandies.
312140 Distilleries one or more of the following: (1) distilling potable liquors (except brandies); (2) distilling and blending liquors; and (3) blending and mixing liquors and other ingredients.
321920 Wood Container and Pallet Manufacturing
manufacturing wood pallets, wood box shook, wood boxes, other wood containers, and wood parts for pallets and containers.
493110 General Warehousing and Storage
operating merchandise warehousing and storage facilities. These establishments generally handle goods in containers, such as boxes, barrels, and/or drums, using equipment, such as forklifts, pallets, and racks. They are not specialized in handling bulk products of any particular type, size, or quantity of goods or products.
493190 Other Warehousing and Storage
operating warehousing and storage facilities (except general merchandise, refrigerated, and farm product warehousing and storage).
551114 Corporate, Subsidiary, and Regional Managing Offices
administering, overseeing, and managing other establishments of the company or enterprise. These establishments normally undertake the strategic or organizational planning and decision-making role of the company or enterprise. Establishments in this industry may hold the securities of the company or enterprise.
561591 Convention and Visitors Bureaus
marketing and promoting communities and facilities to businesses and leisure travelers through a range of activities, such as assisting organizations in locating meeting and convention sites; providing travel information on area attractions, lodging accommodations, restaurants; providing maps; and organizing group tours of local historical, recreational, and cultural attractions.
Various Industry Classifications for Activity by Kentucky DistillersNorth American Industrial Classification System (NAICS)
Source: US Census Bureau, North American Industrial Classification System, 2017, www.census.gov/eos/www/naics/
The codes shown are those listed in entries for distil l ing companies in the 2017 Kentucky Directory of Manufacturers , www.thinkkentucky.com
The Distilling Industry in Kentucky 33
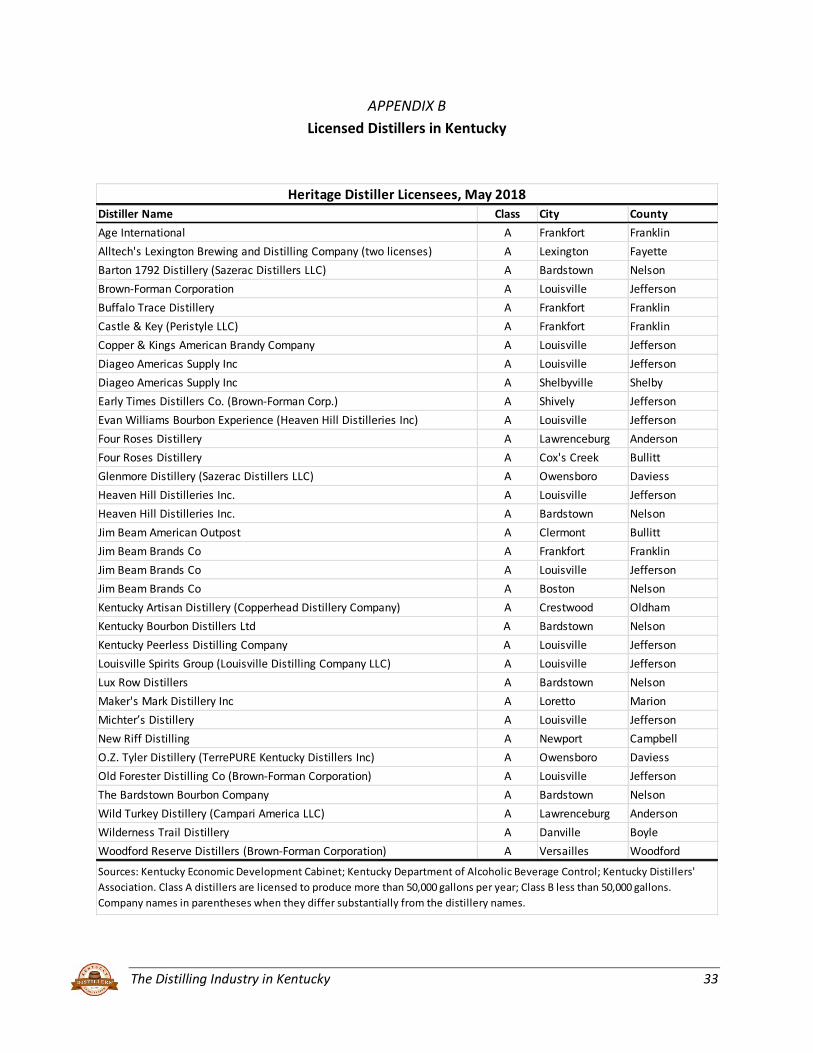
APPENDIX B Licensed Distillers in Kentucky
Distiller Name Class City CountyAge International A Frankfort Franklin
Alltech's Lexington Brewing and Distilling Company (two licenses) A Lexington Fayette
Barton 1792 Distillery (Sazerac Distillers LLC) A Bardstown Nelson
Brown-Forman Corporation A Louisville Jefferson
Buffalo Trace Distillery A Frankfort Franklin
Castle & Key (Peristyle LLC) A Frankfort Franklin
Copper & Kings American Brandy Company A Louisville Jefferson
Diageo Americas Supply Inc A Louisville Jefferson
Diageo Americas Supply Inc A Shelbyville Shelby
Early Times Distillers Co. (Brown-Forman Corp.) A Shively Jefferson
Evan Williams Bourbon Experience (Heaven Hill Distilleries Inc) A Louisville Jefferson
Four Roses Distillery A Lawrenceburg Anderson
Four Roses Distillery A Cox's Creek Bullitt
Glenmore Distillery (Sazerac Distillers LLC) A Owensboro Daviess
Heaven Hill Distilleries Inc. A Louisville Jefferson
Heaven Hill Distilleries Inc. A Bardstown Nelson
Jim Beam American Outpost A Clermont Bullitt
Jim Beam Brands Co A Frankfort Franklin
Jim Beam Brands Co A Louisville Jefferson
Jim Beam Brands Co A Boston Nelson
Kentucky Artisan Distillery (Copperhead Distillery Company) A Crestwood Oldham
Kentucky Bourbon Distillers Ltd A Bardstown Nelson
Kentucky Peerless Distilling Company A Louisville Jefferson
Louisville Spirits Group (Louisville Distilling Company LLC) A Louisville Jefferson
Lux Row Distillers A Bardstown Nelson
Maker's Mark Distillery Inc A Loretto Marion
Michter’s Distillery A Louisville Jefferson
New Riff Distilling A Newport Campbell
O.Z. Tyler Distillery (TerrePURE Kentucky Distillers Inc) A Owensboro Daviess
Old Forester Distilling Co (Brown-Forman Corporation) A Louisville Jefferson
The Bardstown Bourbon Company A Bardstown Nelson
Wild Turkey Distillery (Campari America LLC) A Lawrenceburg Anderson
Wilderness Trail Distillery A Danville Boyle
Woodford Reserve Distillers (Brown-Forman Corporation) A Versailles Woodford
Sources: Kentucky Economic Development Cabinet; Kentucky Department of Alcoholic Beverage Control; Kentucky Distillers' Association. Class A distillers are licensed to produce more than 50,000 gallons per year; Class B less than 50,000 gallons. Company names in parentheses when they differ substantially from the distillery names.
Heritage Distiller Licensees, May 2018
The Distilling Industry in Kentucky 34
Distiller Name Class City CountyBarrel House Distilling Company (Woodshed Beverage LLC) B Lexington FayetteBarrell Craft Spirits Distillery B Louisville JeffersonBluegrass Distillers B Lexington FayetteBoone County Distilling Company B Independence BooneBoundary Oak Distillery B Radcliff HardinBourbon 30 Spirits B Georgetown ScottCasey Jones Distillery B Hopkinsville ChristianChrisman Mills Vineyards B Nicholasville JessamineCoal Pick Distillery (C&K Distillery LLC) B Drakesboro MuhlenbergCorsair Artisan LLC B Bowling Green WarrenCrooked Trail Distilling Co LLC B Princeton CaldwellDueling Grounds Distillery LLC B Franklin SimpsonGlenns Creek Distilling, LLC B Frankfort FranklinGrease Monkey Distillery (Distilled Spirits Epicenter) B Louisville JeffersonHartfield & Company B Paris BourbonJames Pepper Distilling Co B Lexington FayetteJeptha Creed Distillery (Rut N'Strut Distillery LLC) B Shelbyville ShelbyKentucky Mist Moonshine B Whitesburg LetcherLimestone Branch Distillery B Lebanon MarionMB Roland Distillery B Pembroke ChristianNeeley Family Distillery B Sparta GallatinOld Pogue B Maysville MasonOlde Towne Distillery (Heritage Tobacco Group LLC) B Harrodsburg MercerPaducah Distilled Spirits B Paducah McCrackenPauley Hollow Distillery LLC B Forest Hills JeffersonPCS Distilling Company (R Keith Hazelbaker Ventures LLC) B Louisville JeffersonRoute 52 Moonshine, LLC B Irvine EstillSecond Sights Spirits B Ludlow KentonSilent Brigade Distillery B Paducah McCrackenThe Still (Ambrabev LLC) B Danville BoyleTyler Wood White Whiskey B Lewisburg LoganWadelyn Ranch Distilling LLC B Waynesburg LincolnWhiskey Thief Distilling Company B Frankfort FranklinWhiskeycraft (Preservation Distillery LLC) B Bardstown Nelson
Craft Distiller Licensees, May 2018
Sources: Kentucky Economic Development Cabinet; Kentucky Department of Alcoholic Beverage Control; Kentucky Distillers' Association. Class A distillers are licensed to produce more than 50,000 gallons per year; Class B less than 50,000 gallons. Company names in parentheses when they differ substantially from the distillery names.
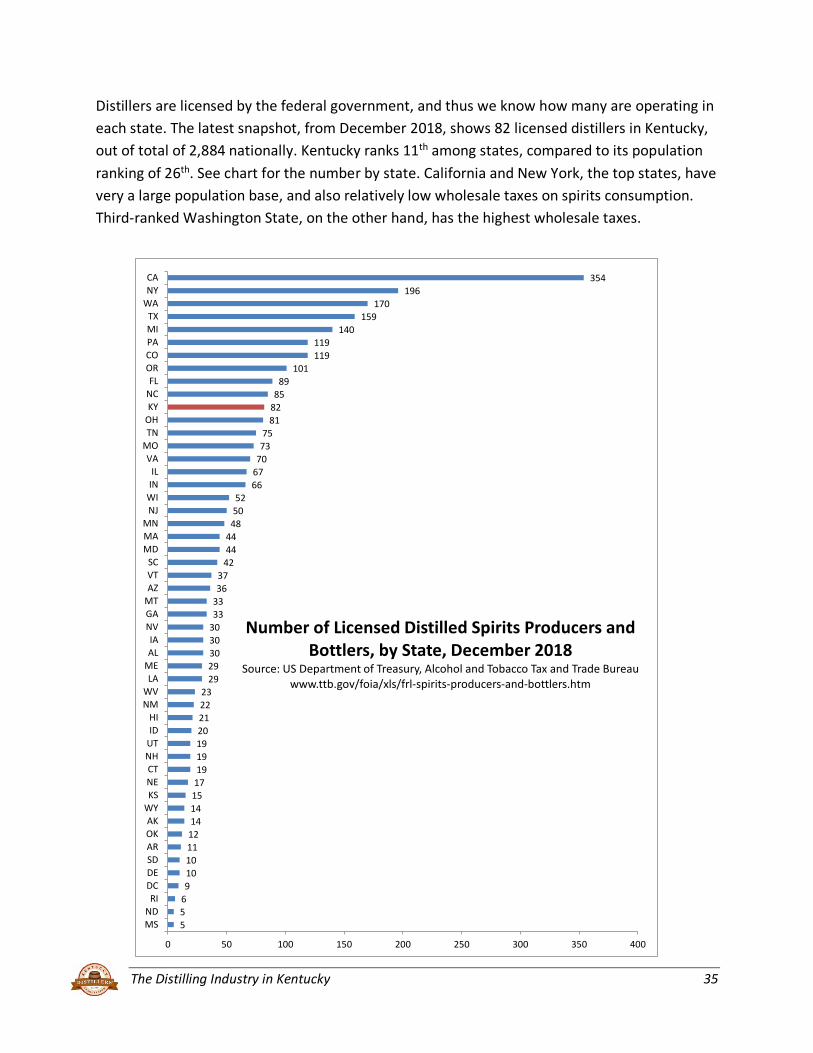
The Distilling Industry in Kentucky 35
Distillers are licensed by the federal government, and thus we know how many are operating in each state. The latest snapshot, from December 2018, shows 82 licensed distillers in Kentucky, out of total of 2,884 nationally. Kentucky ranks 11th among states, compared to its population ranking of 26th. See chart for the number by state. California and New York, the top states, have very a large population base, and also relatively low wholesale taxes on spirits consumption. Third-ranked Washington State, on the other hand, has the highest wholesale taxes.
5569101011121414151719191920212223
292930303033333637
424444
485052
6667707375
818285
89101
119119
140159
170196
354
0 50 100 150 200 250 300 350 400
MSND
RIDCDESDAROKAK
WYKSNECT
NHUTIDHI
NMWV
LAMEALIA
NVGAMTAZVTSC
MDMAMN
NJWIINIL
VAMOTNOHKYNCFL
ORCOPAMITX
WANYCA
Number of Licensed Distilled Spirits Producers and Bottlers, by State, December 2018
Source: US Department of Treasury, Alcohol and Tobacco Tax and Trade Bureauwww.ttb.gov/foia/xls/frl-spirits-producers-and-bottlers.htm

The Distilling Industry in Kentucky 36
APPENDIX C Measures of Employment and Payroll in Kentucky’s Distilling Industry
There are several government sources of data on employment and/or payroll for Kentucky’s distilling industry, and the estimates differ by statistical program due to different definitions, timeframes, geographic detail, and disclosure rules. In this section, we display the various estimates and discuss their differences. First, we mention some general measurement issues to keep in mind when dealing with official economic data. All federal statistical programs use an industrial classification scheme based on the primary source of revenues to the business establishment. Thus, if distilling accounts for the largest source of revenue for a company that also sells wine, food, merchandise in gift shops, etc., all the business’s economic activity is counted under the distilling industry, NAICS 31214. Moreover, most employment and payroll measures for the industry simply lump production and management personnel under one industry estimate. So, a Kentucky distiller with a large international headquarters operation is counted the same as a distilling operation that only produces Bourbon. There are obviously large differences in occupations and average pay between a headquarters and an actual distillery. We delve into this subject below in our discussion of the Economic Census, the one federal program that distinguishes production from supervisory personnel. Finally, the payroll data discussed do not include any fringe benefits. Employee benefits take the form of Social Security and Medicare taxes paid by the employer, contributions to private pensions plans, subsidies of health and life insurance plans, payments into the unemployment insurance systems, and the value of clothing and meals. Employer-provided benefits to employees can range from 20 to 50 percent of actual wages and salaries paid. Quarterly Census of Employment and Wages (QCEW) The QCEW is produced by the US Bureau of Labor Statistics, and covers nearly all nonagricultural wage and salary employment. The government receives the raw data from employer reports as part of each state’s mandatory unemployment insurance program; and thus, the estimates are based on a census, not a survey. Data are published on a monthly basis for employment and a quarterly basis for wages. Data are released with about a six-month lag. Thus, full 2017 data were available in June 2018. Note that QCEW data do not cover business proprietors or otherwise self-employed persons, and hence will not capture some of the business owners involved in craft distilling. BLS publishes QCEW data at the county level, though federal confidentiality laws limit the amount of industry detail that can be released,
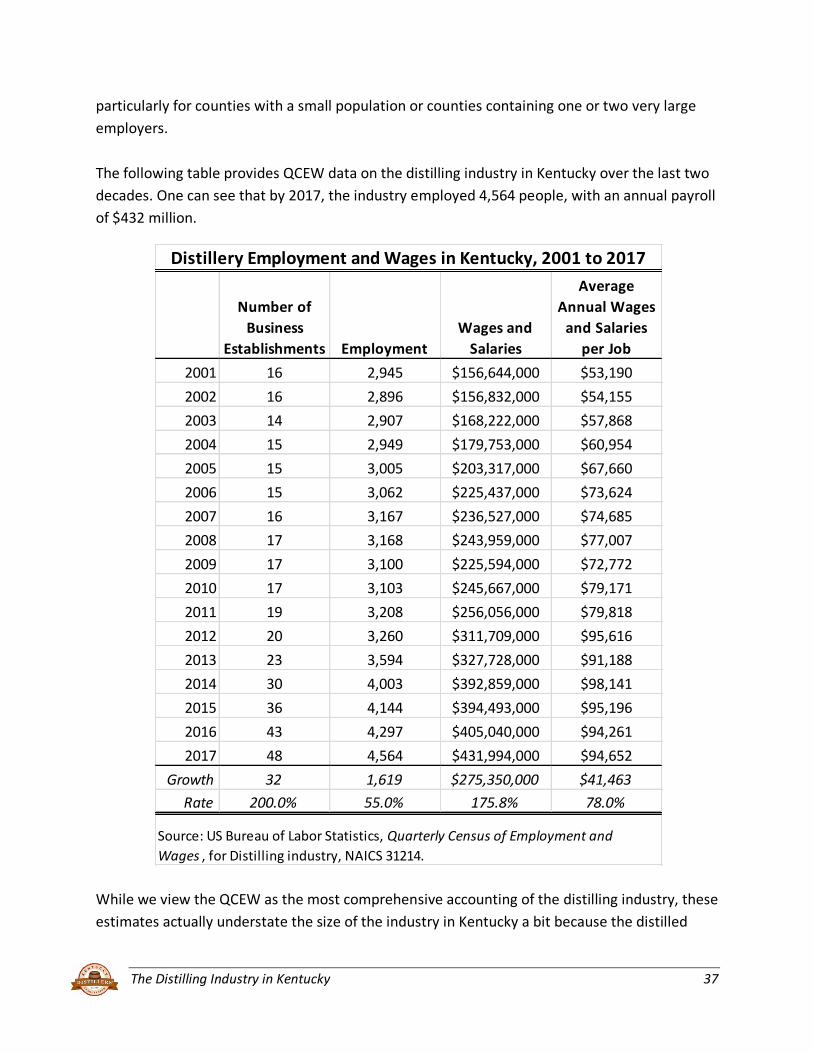
The Distilling Industry in Kentucky 37
particularly for counties with a small population or counties containing one or two very large employers. The following table provides QCEW data on the distilling industry in Kentucky over the last two decades. One can see that by 2017, the industry employed 4,564 people, with an annual payroll of $432 million.
While we view the QCEW as the most comprehensive accounting of the distilling industry, these estimates actually understate the size of the industry in Kentucky a bit because the distilled
Number of Business
Establishments EmploymentWages and
Salaries
Average Annual Wages
and Salaries per Job
2001 16 2,945 $156,644,000 $53,190
2002 16 2,896 $156,832,000 $54,155
2003 14 2,907 $168,222,000 $57,868
2004 15 2,949 $179,753,000 $60,954
2005 15 3,005 $203,317,000 $67,660
2006 15 3,062 $225,437,000 $73,624
2007 16 3,167 $236,527,000 $74,685
2008 17 3,168 $243,959,000 $77,007
2009 17 3,100 $225,594,000 $72,772
2010 17 3,103 $245,667,000 $79,171
2011 19 3,208 $256,056,000 $79,818
2012 20 3,260 $311,709,000 $95,616
2013 23 3,594 $327,728,000 $91,188
2014 30 4,003 $392,859,000 $98,141
2015 36 4,144 $394,493,000 $95,196
2016 43 4,297 $405,040,000 $94,261
2017 48 4,564 $431,994,000 $94,652
Growth 32 1,619 $275,350,000 $41,463Rate 200.0% 55.0% 175.8% 78.0%
Distillery Employment and Wages in Kentucky, 2001 to 2017
Source: US Bureau of Labor Statistics, Quarterly Census of Employment and Wages , for Distilling industry, NAICS 31214.

The Distilling Industry in Kentucky 38
spirits industry here is represented by larger and more vertically integrated companies than is the case elsewhere. Because most economic data are collected on an establishment basis, it is possible for two facilities of the same company involved in different aspects of the production process to be classified into different industries, even if they are on adjacent parcels of land. This is the case for a few bottling and shipping facilities in Kentucky. Because this is an integral part of the business, we fold these facilities into the industry for our economic analysis. Our economic impact analysis assumes employment of roughly 5,000 people with annual wages totaling $470 million. How has distilling performed employment-wise relative to other manufacturing industries in Kentucky? One can see in the next chart that distilling employment has risen rapidly while on net the other manufacturing industries have shed jobs over the last two decades.
We can use the QCEW data to get insight into Kentucky’s share of the national distilling industry. The next chart shows Kentucky’s share of business establishments, jobs, and payroll. These reveal that while Kentucky remains the dominant state for distilling employment due to
60
70
80
90
100
110
120
130
140
150
160
2001 2002 2003 2004 2005 2006 2007 2008 2009 2010 2011 2012 2013 2014 2015 2016 2017
Index of Employment Growth Since 2001, Distilling and Other Manufacturing Industries
Distilling
Other Manufacturing
Source: US Bureau of Labor Statistic, Quarterly Census of Employment and Wages. In 2017, distilling had 4,564 jobs, a growth of 55
percent since 2001. Other manufacturing had 245,616 jobs, a net decline of 15 percent since 2001.
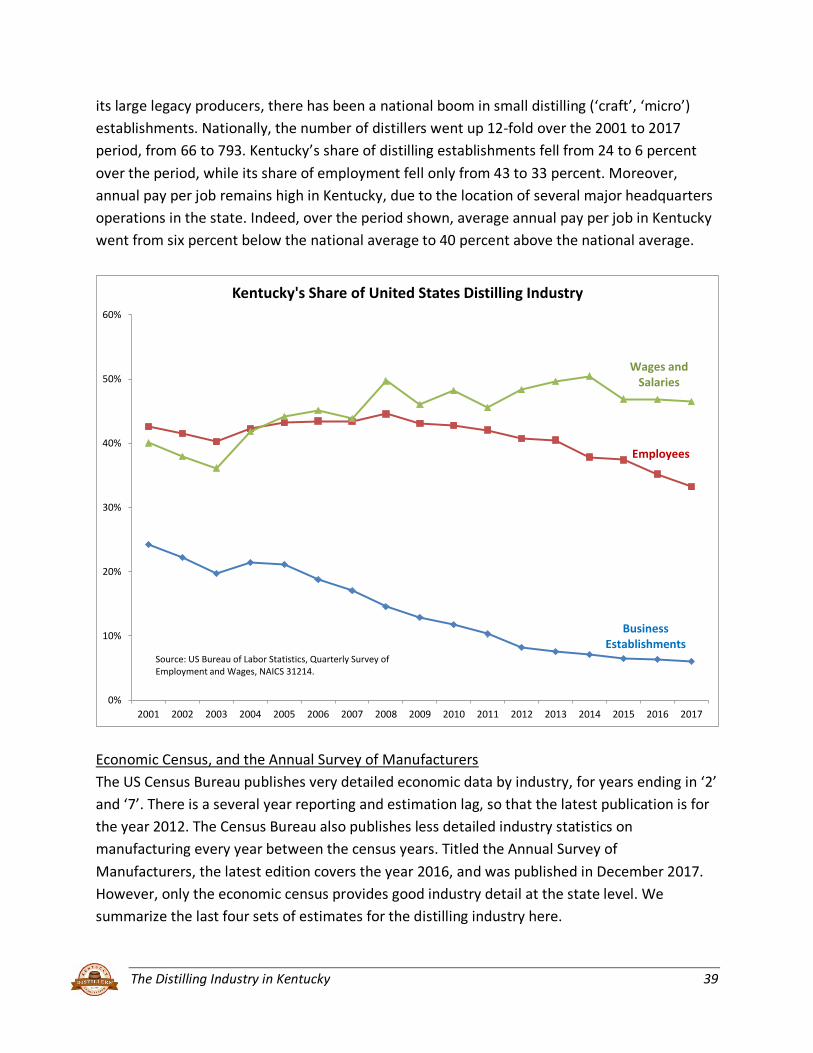
The Distilling Industry in Kentucky 39
its large legacy producers, there has been a national boom in small distilling (‘craft’, ‘micro’) establishments. Nationally, the number of distillers went up 12-fold over the 2001 to 2017 period, from 66 to 793. Kentucky’s share of distilling establishments fell from 24 to 6 percent over the period, while its share of employment fell only from 43 to 33 percent. Moreover, annual pay per job remains high in Kentucky, due to the location of several major headquarters operations in the state. Indeed, over the period shown, average annual pay per job in Kentucky went from six percent below the national average to 40 percent above the national average.
Economic Census, and the Annual Survey of Manufacturers The US Census Bureau publishes very detailed economic data by industry, for years ending in ‘2’ and ‘7’. There is a several year reporting and estimation lag, so that the latest publication is for the year 2012. The Census Bureau also publishes less detailed industry statistics on manufacturing every year between the census years. Titled the Annual Survey of Manufacturers, the latest edition covers the year 2016, and was published in December 2017. However, only the economic census provides good industry detail at the state level. We summarize the last four sets of estimates for the distilling industry here.
0%
10%
20%
30%
40%
50%
60%
2001 2002 2003 2004 2005 2006 2007 2008 2009 2010 2011 2012 2013 2014 2015 2016 2017
Kentucky's Share of United States Distilling Industry
Source: US Bureau of Labor Statistics, Quarterly Survey of Employment and Wages, NAICS 31214.
Business Establishments
Employees
Wages and Salaries

The Distilling Industry in Kentucky 40
These data document the steady economic growth of the industry in Kentucky over those fifteen years. The strongest growth has been in payroll and capital expenditures. Unfortunately, federal confidentiality laws prevent the Bureau from publishing Kentucky’s value of shipments in 2012, but we will see from other sources that sales have continued to grow rapidly over the period. Note that the economic census statistics are lower than those published under the QCEW program for the same years. For example, the 2012 census shows only 2,383 jobs in distilling for Kentucky, while QCEW reports 3,280. Similarly, the payroll estimate is much higher in the QCEW data series than in the economic census or CBP program. We believe this is due to an inconsistency in how the data programs classify corporate headquarters operations. Presumably, the QCEW counts distillery headquarters jobs and payroll as part of the distilling (manufacturing) industry, while the economic census counts headquarters activity under a management industrial category. In our modeling work we will use the larger QCEW figures as a base, since the headquarters are certainly considered part of the distilling industry in Kentucky. In the next table, we summarize Kentucky’s share of the national industry for the same economic variables. One can see that Kentucky has maintained a lead position in the industry,
1997 2002 2007 2012
Number of establishments 16 16 15 19
Establishments w/ 20+ employees 13 14 13 13
Number of employees 2,124 2,061 2,391 2,283
Annual payroll (000) $75,727 $88,915 $111,351 $146,936
Production workers avg per year 1,496 1,416 1,503 1,499
Production workers hours (000) 3,016 2,885 3,064 D
Production workers wages (000) $45,918 $51,595 $60,114 $75,222
Value added (000) $613,814 $579,681 $2,003,008 D
Total cost of materials (000) $432,090 $479,871 $629,667 D
Total value of shipments (000) $1,034,299 $1,070,722 $2,459,131 D
Total capital expenditures (000) $28,331 $30,864 $50,176 $66,647
Number of non-production workers 628 645 888 784
Payroll of non-production workers (000) $29,809 $37,320 $51,237 $71,714
Kentucky's Distillery Industry, Selected Economic Characteristics
Source: US Census Bureau, Economic Census 1997, 2002, 2007, 2012. Distilling industry is NAICS 312140. 'D'
means not disclosed, so as to maintain confidentiality on activity by one or two large firms.

The Distilling Industry in Kentucky 41
with most economic measures holding steady at around one-third of the national totals. The declining share of establishments is due to the explosion of small craft distilleries around the country. We examine the growth in craft distilleries in detail in Appendix C.
County Business Patterns Yet another federal source of data on employment and payroll is the Census Bureau’s County Business Patterns (CBP) program. Like the QCEW program discussed above, CBP covers only wage and salary workers in nonagricultural industries, and thus misses self-employed persons. CBP publishes county-level (as well as state, MSA and zip code-level) data on an annual basis.
1997 2002 2007 2012Number of establishments 26.7% 23.9% 15.6% 7.6%
Establishments w/ 20+ employees 31.0% 33.3% 31.0% 25.5%
Number of employees 32.5% 36.8% 27.0% 32.7%
Annual payroll ($1,000) 30.0% 35.1% 26.9% 34.4%
Production workers avg per year 32.0% 38.3% 30.0% 33.2%
Production workers hours (1,000) 31.0% 38.1% 30.2% D
Production workers wages ($1,000) 29.0% 37.9% 30.1% 32.8%
Value added ($1,000) 27.8% 22.9% 42.9% D
Total cost of materials ($1,000) 25.2% 30.5% 24.3% D
Total value of shipments ($1,000) 26.5% 26.4% 34.7% D
Total capital expenditures ($1,000) 37.3% 28.9% 32.2% 37.0%
Number of non-production workers 33.6% 33.9% 23.1% 31.7%
Payroll of non-production workers 31.7% 31.9% 24.0% 36.3%
Kentucky's Share of US Distillery Industry, Selected Economic Characteristics
Source: US Census Bureau, Economic Census 1997, 2002, 2007, 2012. Distilling industry is NAICS 312140. 'D' means not disclosed, so as to maintain confidentiality on activity by one or two large firms.

The Distilling Industry in Kentucky 42
The estimates for 2016 were released in May 2018. We will examine the national pattern of distilling establishments in Appendix C. Here we show the historical summary data for Kentucky only. The CBP data also reveal the strong growth in distilling establishments and pay. Employment grew by 39 percent over the 2006 to 2016 decade, while average pay rose 46 percent. One can see the boom in small craft distilleries in Kentucky beginning in 2011.
How does the CBP data align with the QCEW data discussed above? Note that the number of distilling establishments is almost the same from the two sources, but the employment counts and payroll estimates are quite different. Recall that for 2016, the QCEW program estimated that Kentucky had 43 distilling establishments, with 4,300 employees and an annual payroll of $405 million (almost double that of CBP). We believe the difference is due to the treatment of some corporate headquarters activity, with the QCEW program including it and CBP excluding it. The large difference in payrolls is consistent with this explanation, since corporate office employees typically have advanced educational credentials and skills, and thus earn much higher salaries than production workers.
EstablishmentsPaid
EmployeesAnnual Payroll
Average Annual Pay per
Job2005 15 2,047 $99,498,000 $48,6072006 16 2,207 $103,967,000 $47,1082007 14 1,681 $81,081,000 $48,2342008 17 2,209 $117,439,000 $53,1642009 16 1,903 $104,575,000 $54,9532010 16 1,945 $98,230,000 $50,5042011 18 1,897 $107,441,000 $56,6372012 20 2,340 $131,328,000 $56,1232013 23 2,272 $150,002,000 $66,0222014 27 2,456 $158,480,000 $64,5282015 37 3,020 $205,248,000 $67,9632016 40 3,057 $210,148,000 $68,743
24 850 $106,181,000 $21,635150.0% 38.5% 102.1% 45.9%
growth 2006-16
Distilling Establishments, Jobs, and Payroll in Kentucky
Source: US Census Bureau, County Business Patterns, for Distilling industry, NAICS 312140.

The Distilling Industry in Kentucky 43
Kentucky Directory of Business and Industry The Kentucky Cabinet for Economic Development publishes an annual directory of business and industry, listing alphabetically, by place, and by industrial classification. For each business establishment, the directory provides an address, officers, contact information, major products, and full-time employment (self-reported by the companies). The latest version, published May 2, 2018, shows 39 business establishments under ‘Distilleries’, NAICS 312140. An employment count was provided for all major distillers, and the sum of employment reported across the industry was 4,908. Most of the craft distillers listed in Appendix A are not included in the directory.
Summary As noted above, our economic impact analysis assumes employment of roughly 5,000 people with annual wages totaling $470 million. The difference between this employment estimate and the number of jobs reported in the QCEW, Economic Census, County Business Patterns, and business and industry directory are due to our consideration of the entire process of production from distilling to barreling to bottling, shipping and marketing compared to the QCEW’s, Economic Census’, and CBP’s missions of documenting the economy by business establishment. In practice, this mean that the QCEW, Economic Census, and CBP assign an establishment (and its employees) to the industry that the majority of the products and/or services produced at the particular site are most directly related to. Sometimes, even if they are in close physical proximity, two facilities under the same corporate structure and part of the same overall production process can be classified under different industries if their functions are different enough. In the case of the distilling industry, this occurs when facilities are primarily engaged in bottling and shipping spirits distilled and aged elsewhere. The QCEW, Economic Census, and CBP classify such establishments into the wholesale distribution and services industry. There are several such facilities in Kentucky, some located quite close to distilling facilities, each bottling the Kentucky-produced spirits of its corporate sibling. The Directory of Business and Industry does include those other facilities. With the additional help of a survey of the state’s distillers, we therefore fold these jobs into the distilling industry for our economic impact analysis. We have adjusted the IMPLAN models to reflect this and all the functions of the production process.
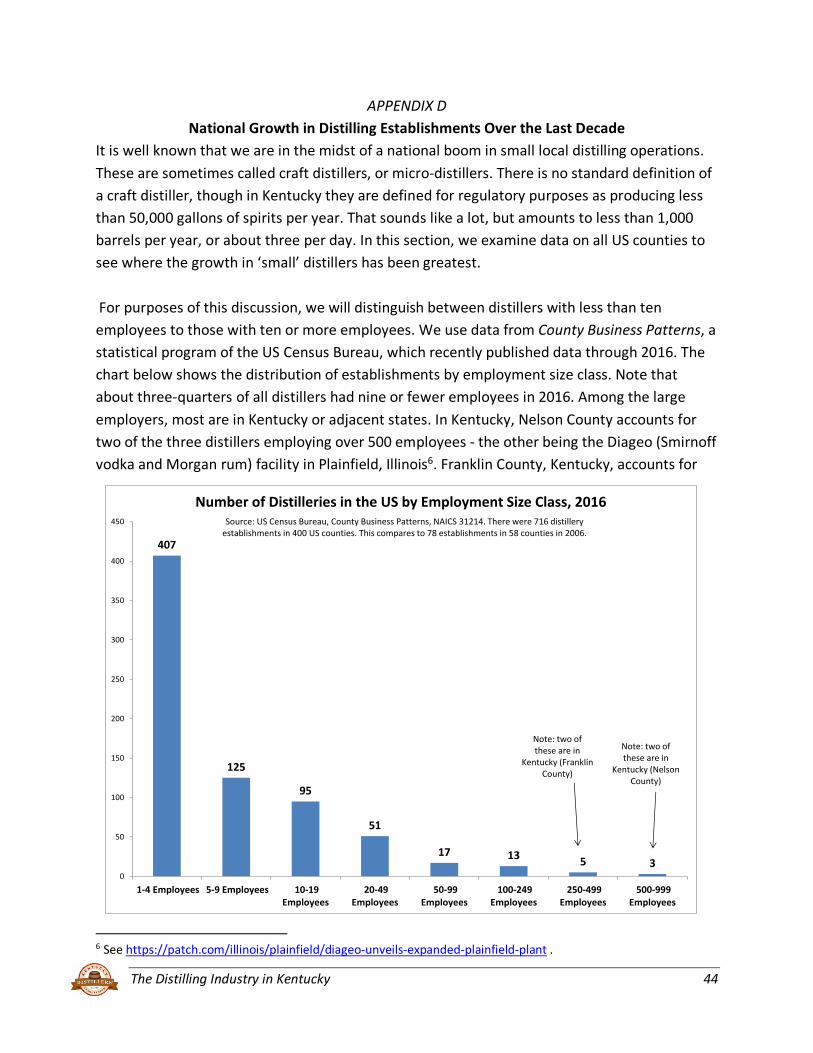
The Distilling Industry in Kentucky 44
APPENDIX D National Growth in Distilling Establishments Over the Last Decade
It is well known that we are in the midst of a national boom in small local distilling operations. These are sometimes called craft distillers, or micro-distillers. There is no standard definition of a craft distiller, though in Kentucky they are defined for regulatory purposes as producing less than 50,000 gallons of spirits per year. That sounds like a lot, but amounts to less than 1,000 barrels per year, or about three per day. In this section, we examine data on all US counties to see where the growth in ‘small’ distillers has been greatest. For purposes of this discussion, we will distinguish between distillers with less than ten employees to those with ten or more employees. We use data from County Business Patterns, a statistical program of the US Census Bureau, which recently published data through 2016. The chart below shows the distribution of establishments by employment size class. Note that about three-quarters of all distillers had nine or fewer employees in 2016. Among the large employers, most are in Kentucky or adjacent states. In Kentucky, Nelson County accounts for two of the three distillers employing over 500 employees - the other being the Diageo (Smirnoff vodka and Morgan rum) facility in Plainfield, Illinois6. Franklin County, Kentucky, accounts for
6 See https://patch.com/illinois/plainfield/diageo-unveils-expanded-plainfield-plant .
407
125
95
51
17 13 5 30
50
100
150
200
250
300
350
400
450
1-4 Employees 5-9 Employees 10-19Employees
20-49Employees
50-99Employees
100-249Employees
250-499Employees
500-999Employees
Number of Distilleries in the US by Employment Size Class, 2016Source: US Census Bureau, County Business Patterns, NAICS 31214. There were 716 distillery
establishments in 400 US counties. This compares to 78 establishments in 58 counties in 2006.
Note: two of these are in
Kentucky (Nelson County)
Note: two of these are in
Kentucky (Franklin County)
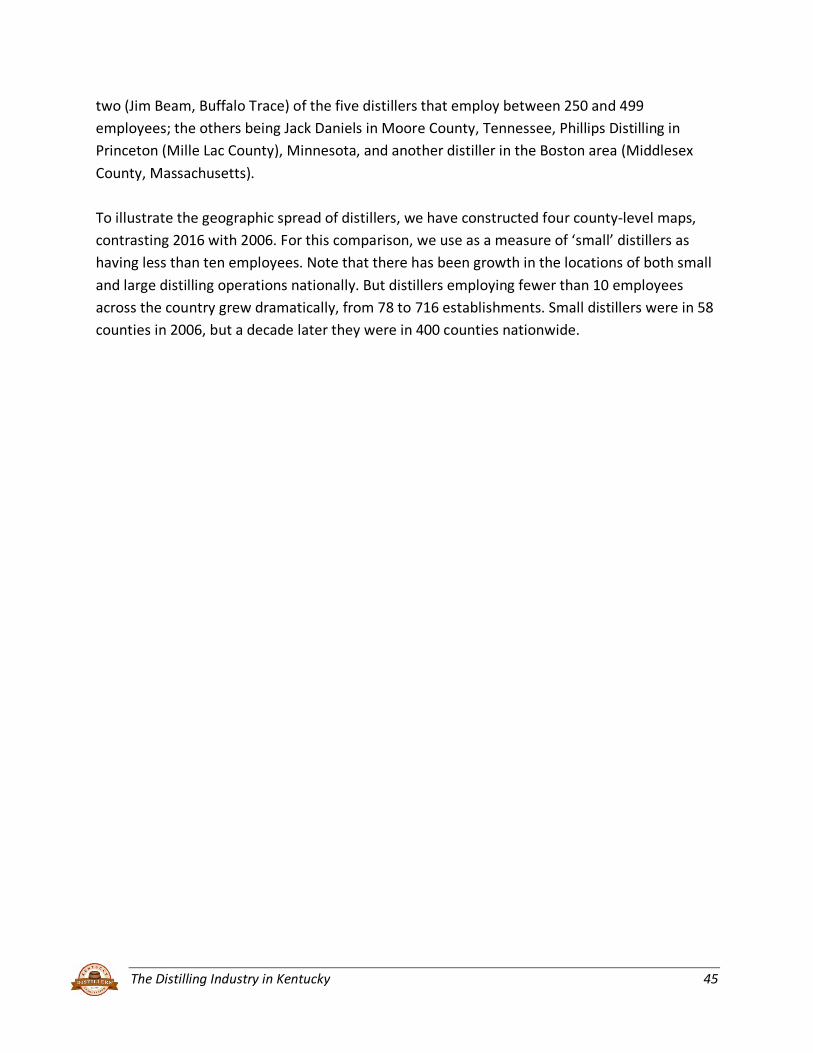
The Distilling Industry in Kentucky 45
two (Jim Beam, Buffalo Trace) of the five distillers that employ between 250 and 499 employees; the others being Jack Daniels in Moore County, Tennessee, Phillips Distilling in Princeton (Mille Lac County), Minnesota, and another distiller in the Boston area (Middlesex County, Massachusetts). To illustrate the geographic spread of distillers, we have constructed four county-level maps, contrasting 2016 with 2006. For this comparison, we use as a measure of ‘small’ distillers as having less than ten employees. Note that there has been growth in the locations of both small and large distilling operations nationally. But distillers employing fewer than 10 employees across the country grew dramatically, from 78 to 716 establishments. Small distillers were in 58 counties in 2006, but a decade later they were in 400 counties nationwide.

The Distilling Industry in Kentucky 46
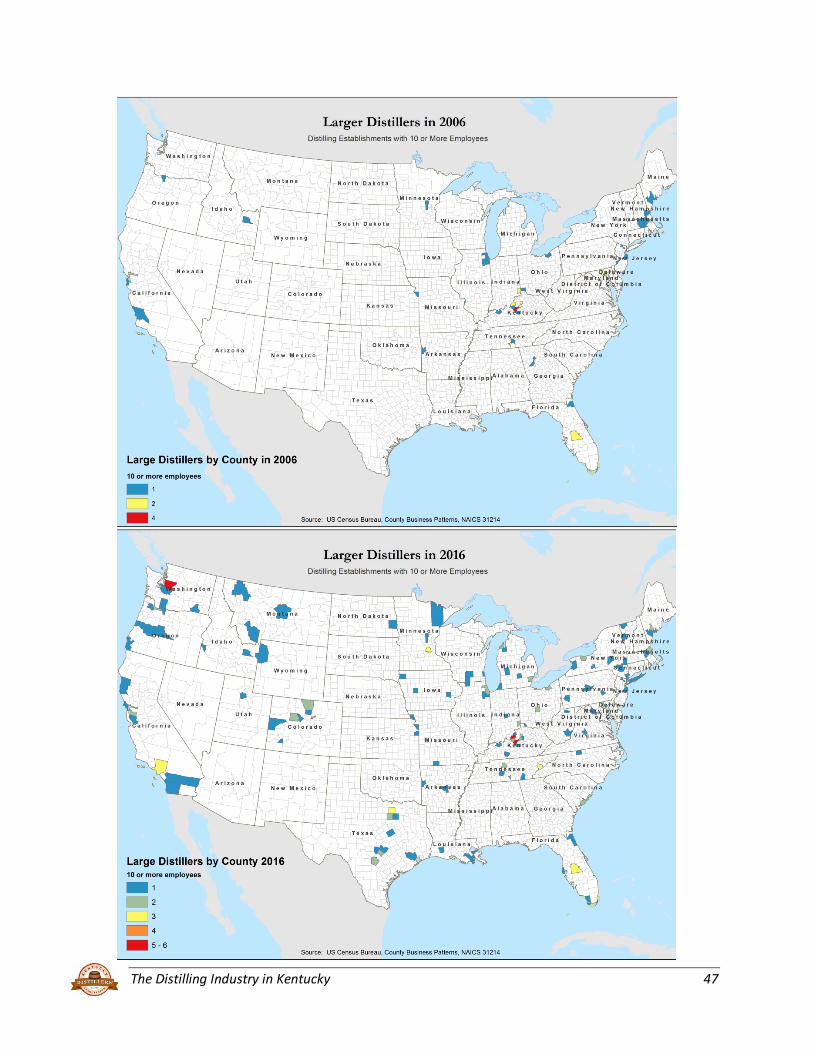
The Distilling Industry in Kentucky 47

The Distilling Industry in Kentucky 48
APPENDIX E Exports of Kentucky Distilled Spirits
Kentucky distillers shipped over $452 million of product abroad in 2017, according to a report from the Kentucky Economic Development Cabinet (see table below). One can see that the industry’s exports are dominated by whiskies, of which Bourbon is the main component.
The strong growth in international demand for Bourbon is evident in the next chart, showing Kentucky whiskey exports over the last two decades. The value of exports is now triple what it was in 1997, reflecting growth in both volume and price. The Distilled Spirits Council of the United States (DISCUS) digs deeper into federal export data and breaks out Bourbon from the whiskey category7. They show $363 million in Bourbon exports in 2017, on 18.6 million proof gallons of volume. Note that much of Bourbon is exported in bulk, rather than bottled, form. This varies widely by country. For example, essentially all exports to Spain are in bulk form, while Japan and Australia receive about two-thirds in bulk form. Canada, on the other hand, receives all its Bourbon in bottled form, and the United Kingdom receives about one-half in bottles.
A final chart shows the value of Kentucky exports of whiskey by country in 2017. The leading importers are Spain, Japan, Australia, United Kingdom, Canada, and Germany. The European Union, taken as a block, is easily the largest export market for Kentucky whiskey, accounting for 47 percent of the total volume and 43 percent of the value of exports.
7 See www.distilledspirits.org/wp-content/uploads/2018/04/Distilled-Spirits-Exports-Volume-December-2017-1.pdf and www.distilledspirits.org/wp-content/uploads/2018/04/Distilled-Spirits-Exports-Value-December-2017-1.pdf .
HS Code Description 2015 2016 2017
- Total All Spirit Beverages $408,803,409 $368,578,454 $452,446,572
220830 Whiskies $310,761,311 $294,711,734 $381,200,228
220820 Grape Brandy $28,182,907 $23,298,598 $24,026,740
220870 Liqueurs And Cordials $35,436,973 $24,881,534 $20,159,018
220890 Cordials, Liqueurs, Kirschwasser, Ratafia, Etc. $17,871,542 $15,562,205 $15,820,577
220860 Vodka $12,231,870 $6,109,700 $7,525,887
220840 Rum And Tafia $3,546,122 $2,972,522 $2,929,544
220850 Gin And Geneva $772,684 $1,042,161 $784,578 Source: Kentucky Economic Development Cabinet, derived from data provided by WISERTrade: State HS Database , http://www.wisertrade.org, via the U.S. Census Bureau, Foreign Trade Division.
Kentucky’s Export of Distilled Spirit Beverages to the World
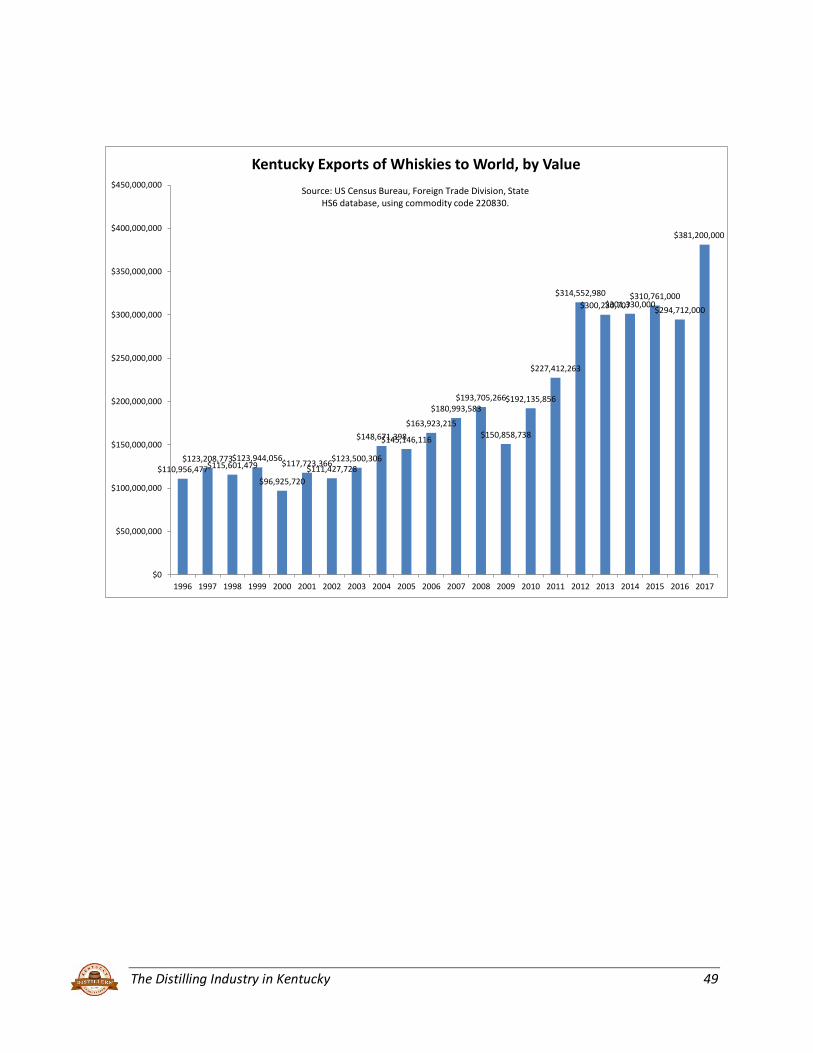
The Distilling Industry in Kentucky 49
$110,956,477$123,208,773
$115,601,479$123,944,056
$96,925,720
$117,723,366$111,427,728$123,500,306
$148,671,398$145,146,116
$163,923,215$180,993,583
$193,705,266
$150,858,738
$192,135,856
$227,412,263
$314,552,980$300,230,707$301,330,000
$310,761,000$294,712,000
$381,200,000
$0
$50,000,000
$100,000,000
$150,000,000
$200,000,000
$250,000,000
$300,000,000
$350,000,000
$400,000,000
$450,000,000
1996 1997 1998 1999 2000 2001 2002 2003 2004 2005 2006 2007 2008 2009 2010 2011 2012 2013 2014 2015 2016 2017
Kentucky Exports of Whiskies to World, by ValueSource: US Census Bureau, Foreign Trade Division, State
HS6 database, using commodity code 220830.
The Distilling Industry in Kentucky 50
$617,500
$623,739
$702,945
$789,883
$793,385
$882,231
$885,142
$1,165,030
$1,190,223
$1,264,857
$1,310,419
$1,645,025
$1,780,813
$1,819,502
$2,432,754
$2,843,646
$2,957,997
$3,077,051
$3,303,219
$5,359,450
$6,217,005
$8,703,882
$10,466,091
$15,403,476
$23,877,447
$25,085,631
$38,196,059
$54,821,304
$63,288,328
$88,888,504
$0 $20,000,000 $40,000,000 $60,000,000 $80,000,000 $100,000,000
Israel
Poland
Paraguay
Argentina
Uruguay
Estonia
Switzerland
Greece
Romania
Belgium
Turkey
South Africa
Brazil
Korea, South
China
Latvia
India
Italy
Chile
Netherlands
Singapore
France
Mexico
New Zealand
Germany
Canada
United Kingdom
Australia
Japan
Spain
Top 30 Countries Receiving Kentucky Exports of Whiskies in 2017
Source: US Census Bureau, Foreign Trade Division, State HS6 database, using
commodity code 220830.

The Distilling Industry in Kentucky 51
APPENDIX F The Distilling Industry’s Linkages to Other Industries
We use a custom input-output model of Kentucky to investigate the linkages between the distilling industry and other industries in the state. Input-output models are the standard method for measuring sales among industries. Our IMPLAN model of Kentucky has details on 532 industries, and can predict how much each industry buys from every other industry in the state, as well as how much must be imported from outside the state to support a given level of production.
For this study we were able to significantly enhance the customization of the IMPLAN production function for the distilling industry compared to previous reports in this series8. We received calendar year 2017 accounting data from one of the state’s major distillers from which we were able to construct a table describing most of the inputs by industry and their geographic sources. In many ways this table corresponded fairly closely with IMPLAN’s distilling industry production function, but there were some significant differences. These included the value of grains purchased (more), the amount of spirits purchased from other suppliers (less), plastic bottles (much less), and the inclusion of additional industries, most often associated with food and beverage manufacturing and packaging mechanical equipment.
Two of the larger differences involved aspects of production at opposite ends of the process – barreling and bottling. The accounting data from the local distiller made it clear that IMPLAN did not adequately address the peculiarity of the Bourbon industry with respect to its close relationship with cooperages. IMPLAN had misclassified these inputs into the miscellaneous wood products industry when they belong in the wood containers and pallets industry, and also greatly underestimated the value of the distilling industry’s purchases from the wood container industry. Without the detailed accounting data, we had not been able to adequately address the issue in previous reports.
With respect to bottling, IMPLAN’s default recipe shows more of this function as being outsourced than is the case in Kentucky where most of the major distillers have their own bottling facilities. This is reflected in the production function value for the wholesale trade distribution industry (where bottling is relegated in the NAICS classification system). Since our impact model folds the bottling facility jobs located in Bullitt, Daviess, and Franklin counties into the distilling industry (while they are separate establishments, they are parts of vertically integrated corporate structures), we adjust that part of the production function downward.
8 A production function is basically a recipe, showing on average how much must be purchased from every other
industry to produce a unit of output in each industry.
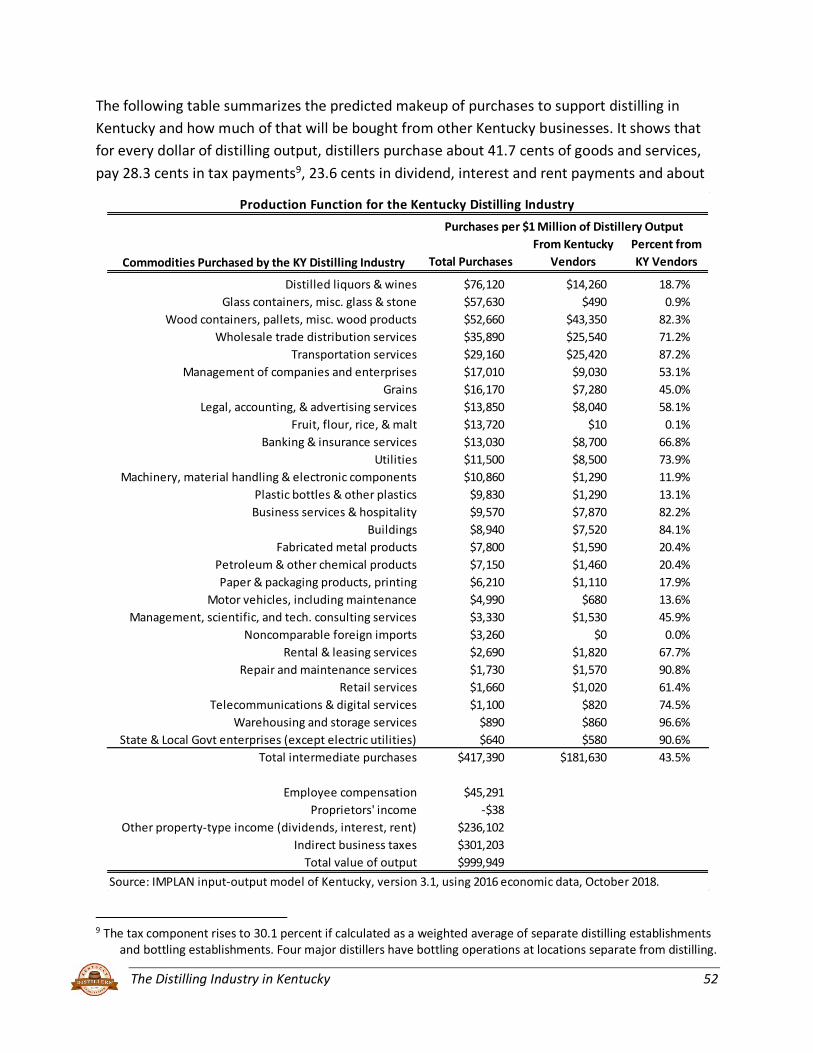
The Distilling Industry in Kentucky 52
The following table summarizes the predicted makeup of purchases to support distilling in Kentucky and how much of that will be bought from other Kentucky businesses. It shows that for every dollar of distilling output, distillers purchase about 41.7 cents of goods and services, pay 28.3 cents in tax payments9, 23.6 cents in dividend, interest and rent payments and about
9 The tax component rises to 30.1 percent if calculated as a weighted average of separate distilling establishments
and bottling establishments. Four major distillers have bottling operations at locations separate from distilling.
Commodities Purchased by the KY Distilling Industry Total PurchasesFrom Kentucky
VendorsPercent from KY Vendors
Distilled liquors & wines $76,120 $14,260 18.7%Glass containers, misc. glass & stone $57,630 $490 0.9%
Wood containers, pallets, misc. wood products $52,660 $43,350 82.3%Wholesale trade distribution services $35,890 $25,540 71.2%
Transportation services $29,160 $25,420 87.2%Management of companies and enterprises $17,010 $9,030 53.1%
Grains $16,170 $7,280 45.0%Legal, accounting, & advertising services $13,850 $8,040 58.1%
Fruit, flour, rice, & malt $13,720 $10 0.1%Banking & insurance services $13,030 $8,700 66.8%
Utilities $11,500 $8,500 73.9%Machinery, material handling & electronic components $10,860 $1,290 11.9%
Plastic bottles & other plastics $9,830 $1,290 13.1%Business services & hospitality $9,570 $7,870 82.2%
Buildings $8,940 $7,520 84.1%Fabricated metal products $7,800 $1,590 20.4%
Petroleum & other chemical products $7,150 $1,460 20.4%Paper & packaging products, printing $6,210 $1,110 17.9%
Motor vehicles, including maintenance $4,990 $680 13.6%Management, scientific, and tech. consulting services $3,330 $1,530 45.9%
Noncomparable foreign imports $3,260 $0 0.0%Rental & leasing services $2,690 $1,820 67.7%
Repair and maintenance services $1,730 $1,570 90.8%Retail services $1,660 $1,020 61.4%
Telecommunications & digital services $1,100 $820 74.5%Warehousing and storage services $890 $860 96.6%
State & Local Govt enterprises (except electric utilities) $640 $580 90.6%Total intermediate purchases $417,390 $181,630 43.5%
Employee compensation $45,291Proprietors' income -$38
Other property-type income (dividends, interest, rent) $236,102Indirect business taxes $301,203
Total value of output $999,949
Production Function for the Kentucky Distilling IndustryPurchases per $1 Million of Distillery Output
Source: IMPLAN input-output model of Kentucky, version 3.1, using 2016 economic data, October 2018.
The Distilling Industry in Kentucky 53
4.5 cents for labor services. Of the goods and services required, the model predicts about 43.5% of their value (18.1 cents per dollar of distilling output) is purchased within Kentucky.
The distilling industry stands out from others in terms of the tax portion of output. In Kentucky, the closest industry sector is amusement parks and arcades at 23.1 cents per dollar of output. Commercial fishing and hunting, wholesale trade, and tobacco manufacturing are the next sizable sectors of the economy in terms of taxes per dollar of output, but they only pay 14.7 to 21.7 cents per dollar of output. The wine industry is taxed at 3.1 cents per dollar of output; breweries are taxed at 13.1 cents per dollar output. For most manufacturing sectors, the portion of each dollar of output that goes to taxes is less than a penny.
These commodities purchased by the distilling industry, as well as the household income created, are the basis for regional economic multipliers. Output in one industry lifts output in supporting industries, which in turn raises output in industries that support them. Generally speaking, the more an industry purchases in the state, the larger the spinoff impacts of that industry’s activity. The more it imports its raw materials and services, the smaller the spinoffs in the state. In this regard, it is important to note that compared to the previous edition of this study in January 2017, the IMPLAN model expects a larger percentage of purchases to be made within Kentucky (43% versus 35%), leading to an expectation of 3.5 cents more being spent within Kentucky for each dollar of distilling industry output.
The predicted net increase in purchases from suppliers within Kentucky is due largely to the new estimate of purchasing from the wood containers and pallets industry discussed above. Barrels, pallets, and other miscellaneous wood products are the third most purchased input category by value, with over 80 percent coming from Kentucky suppliers.
The largest input expense is the purchase of distilled spirits among distillers themselves. There is a significant amount of mixing and bottling of product that is produced offsite, which includes non-Bourbon products as well as Bourbon taken from barrels in a warehouse. Some of these purchases are from out-of-state distillers. There has been a significant expansion of bottling facilities in the state that process product made elsewhere. The boom in the craft part of the industry is also a likely factor. Newer craft distillers either buy distilled spirits, lease capacity, and/or purchase aged barrels from the larger companies in order to build their brands.
It is helpful to think of an input-output table as a set of production recipes, with each industry column showing how much must be purchased from each industry row to produce its annual output. For example, the distilling industry nationally is a large purchaser of glass containers, grain, wood containers and pallets, truck transportation and cardboard. These are identified from national industry surveys.
The Distilling Industry in Kentucky 54
These national tables are ‘regionalized’ by IMPLAN using economic data on the presence and size of industries at the state, metropolitan area, or county level as needed. The resulting regional models take into account the ability of the regional economy to supply inputs to each industry. In the case of distilling, for example, IMPLAN predicts that most of the wood containers and pallets (or rather products from the industry that produces these, which includes cooperages) needed by the industry can be supplied by Kentucky firms, but that none of the glass bottles can be supplied in-state. The glass bottles must be imported, with the result that those purchasing dollars leak out to other states (or countries).
IMPLAN includes the value of fringe benefits (employee provided social security and Medicare taxes, unemployment insurance and workers’ compensation premiums, health insurance, pension contributions, etc.) in its compensation estimate, estimating that fringes add about 25% to direct wages and salaries in this industry.

The Distilling Industry in Kentucky 55
APPENDIX G Grain Usage by Distillers
There is a relatively fixed ratio of grain required to produce, say, a barrel of Bourbon. Hence, we know from production records and our survey of KDA members that Kentucky distillers purchased about 16.0 million bushels of corn and around 5.6 million bushels of other grains such as wheat and rye. Survey respondents reported that 56.1 percent of corn used was purchased from Kentucky farms, and only 12.6 percent of other grains used came from Kentucky. Applying these survey results to total industry production, we estimate that Kentucky distillers purchased 9.0 million bushels of corn, and 0.7 million bushels of other grains, from Kentucky farmers.
The map above, copied from the USDA website, shows corn production by county in Kentucky. The state as a whole produced 217.2 million bushels of corn in 201710. This implies that Kentucky distillers purchased about four percent of the state’s output. One can see the concentrations in western and central Kentucky, near all major distilleries.
10 www.nass.usda.gov/Statistics_by_State/Kentucky/Publications/County_Estimates/coest/2017/Corn17_KY.pdf

The Distilling Industry in Kentucky 56
APPENDIX H Economic Multipliers
The distilling industry’s purchases of intermediate goods and services in Kentucky, as well as its payments to workers and business owners in the state, cause rounds of re-spending across other industries. The inter-industry impacts are often referred to as ‘indirect’ effects, since changes in activity at distilleries will quickly cause changes in activity at suppliers. The household spending impacts are often referred to as ‘induced’ effects, since changes in industrial production ultimately hit the regional economy through employees’ wages and the associated spending on goods and services.
At each round of re-spending, a portion of the dollars leak out due to saving, purchases of imported goods, and tax payments, so that the re-spending ultimately goes to zero. The cumulative impact of the re-spending is measured in economic multipliers, which are the ratio of total economic activity to activity in the distilling industry.
The production function in Appendix F applies to the manufacturing of distilled spirits, but the industry in Kentucky tends to operate almost like two industries in one. On one side are the distilling, warehousing, and bottling activities, and on the other is the corporate, subsidiary, or regional managing office. The latter oversee and manage the former, and provide the strategic and organizational planning for the entire enterprise. Because Brown-Forman and Heaven Hill are headquartered in Kentucky, and Beam Suntory (Jim Beam and Maker’s Mark), Kirin (Four Roses), and Sazerac (Buffalo Trace) have significant corporate subsidiary operations here as well, much of the activity in the broader industry involves functions that belong to the management of companies sector. These two activities (management of companies and distilling) have very different linkages with the rest of the economy. We created a split into two industries for modeling purposes.
In our previous report, we asked the members of the KDA to provide us with employee figures divided according to whether the employee was working on the manufacturing or corporate side of the business. We also have fairly comprehensive employment counts for each distillery, as published in the 2017 Kentucky Directory of Manufacturers. We were able to combine the results from these two surveys with other available data to estimate total distilling industry employment for 2017. After examining the survey numbers along with the figures from the QCEW, CBP, and Kentucky Directory of Manufacturers, we estimate that there are about 5,000 people currently employed in the distilling industry statewide. This includes around 500 employees in bottling facilities in Bullitt, Daviess, and Franklin counties that are not included in the QCEW and CBP industry statistics, which are based on establishment locations. Of the 5,000 jobs, we believe that approximately 1,700 are more properly categorized as working in the management of companies sector (NAICS code 551114). This estimate of 2017 employment
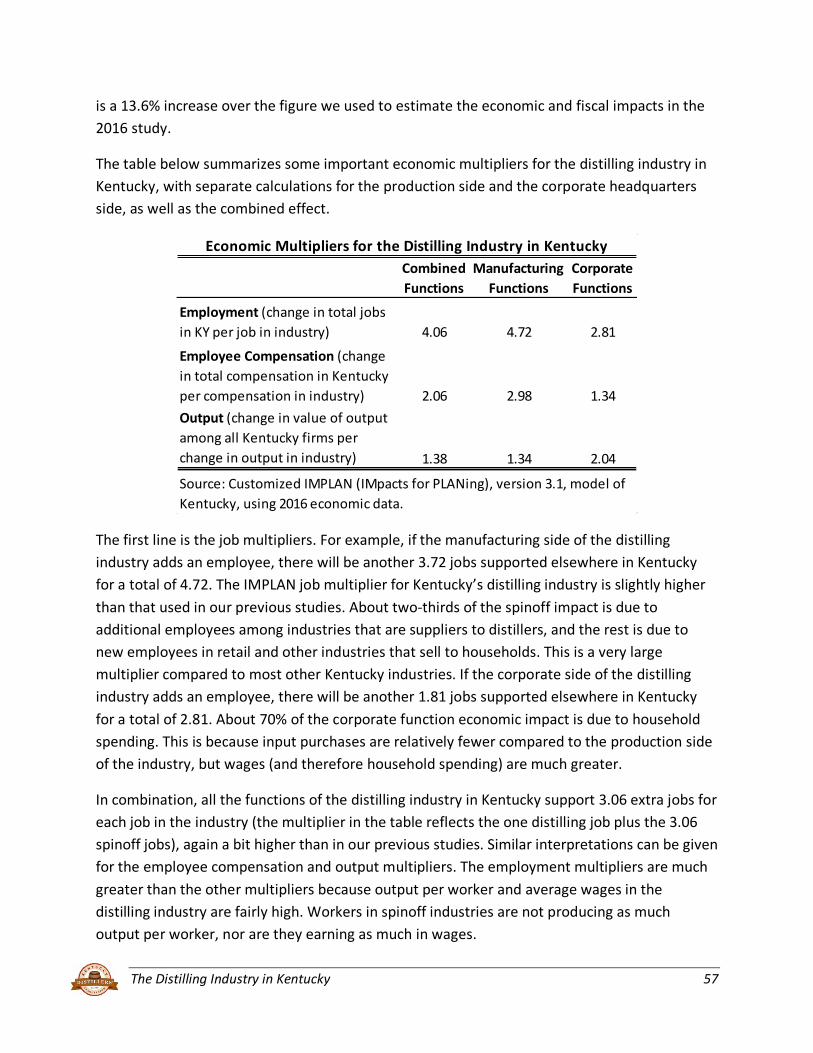
The Distilling Industry in Kentucky 57
is a 13.6% increase over the figure we used to estimate the economic and fiscal impacts in the 2016 study.
The table below summarizes some important economic multipliers for the distilling industry in Kentucky, with separate calculations for the production side and the corporate headquarters side, as well as the combined effect.
The first line is the job multipliers. For example, if the manufacturing side of the distilling industry adds an employee, there will be another 3.72 jobs supported elsewhere in Kentucky for a total of 4.72. The IMPLAN job multiplier for Kentucky’s distilling industry is slightly higher than that used in our previous studies. About two-thirds of the spinoff impact is due to additional employees among industries that are suppliers to distillers, and the rest is due to new employees in retail and other industries that sell to households. This is a very large multiplier compared to most other Kentucky industries. If the corporate side of the distilling industry adds an employee, there will be another 1.81 jobs supported elsewhere in Kentucky for a total of 2.81. About 70% of the corporate function economic impact is due to household spending. This is because input purchases are relatively fewer compared to the production side of the industry, but wages (and therefore household spending) are much greater.
In combination, all the functions of the distilling industry in Kentucky support 3.06 extra jobs for each job in the industry (the multiplier in the table reflects the one distilling job plus the 3.06 spinoff jobs), again a bit higher than in our previous studies. Similar interpretations can be given for the employee compensation and output multipliers. The employment multipliers are much greater than the other multipliers because output per worker and average wages in the distilling industry are fairly high. Workers in spinoff industries are not producing as much output per worker, nor are they earning as much in wages.
Combined Functions
Manufacturing Functions
Corporate Functions
Employment (change in total jobs in KY per job in industry) 4.06 4.72 2.81
Employee Compensation (change in total compensation in Kentucky per compensation in industry) 2.06 2.98 1.34Output (change in value of output among all Kentucky firms per change in output in industry) 1.38 1.34 2.04
Economic Multipliers for the Distilling Industry in Kentucky
Source: Customized IMPLAN (IMpacts for PLANing), version 3.1, model of Kentucky, using 2016 economic data.
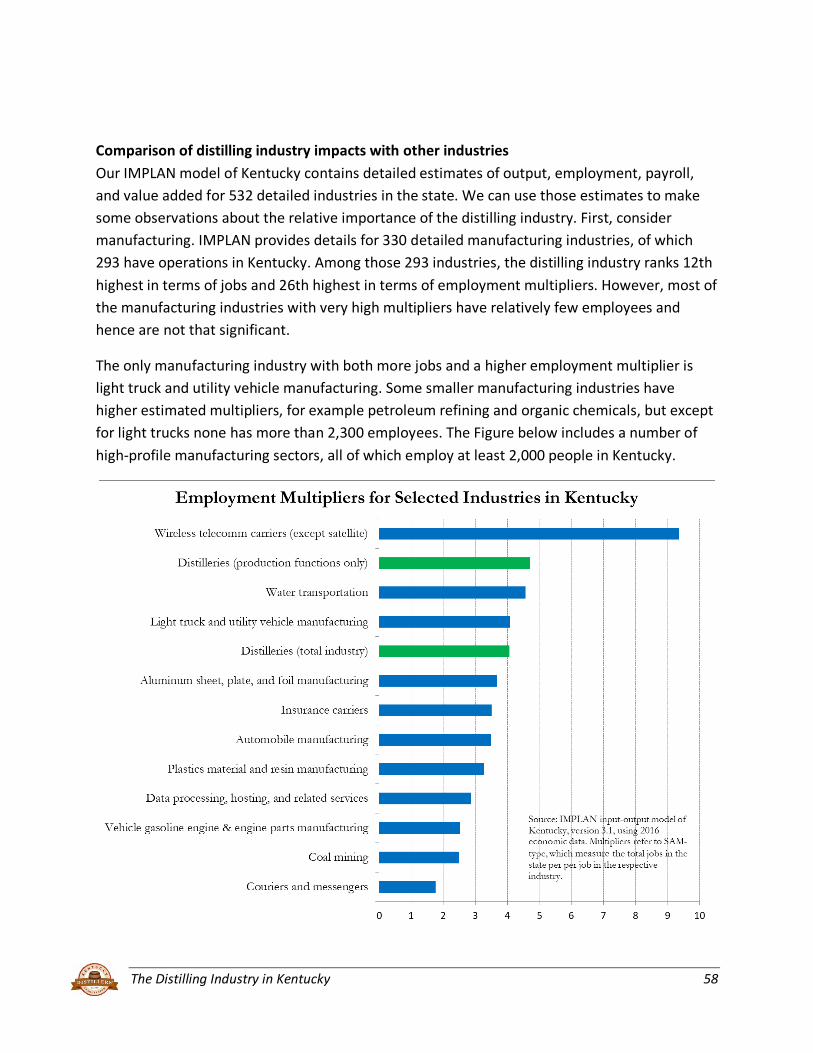
The Distilling Industry in Kentucky 58
Comparison of distilling industry impacts with other industries Our IMPLAN model of Kentucky contains detailed estimates of output, employment, payroll, and value added for 532 detailed industries in the state. We can use those estimates to make some observations about the relative importance of the distilling industry. First, consider manufacturing. IMPLAN provides details for 330 detailed manufacturing industries, of which 293 have operations in Kentucky. Among those 293 industries, the distilling industry ranks 12th highest in terms of jobs and 26th highest in terms of employment multipliers. However, most of the manufacturing industries with very high multipliers have relatively few employees and hence are not that significant.
The only manufacturing industry with both more jobs and a higher employment multiplier is light truck and utility vehicle manufacturing. Some smaller manufacturing industries have higher estimated multipliers, for example petroleum refining and organic chemicals, but except for light trucks none has more than 2,300 employees. The Figure below includes a number of high-profile manufacturing sectors, all of which employ at least 2,000 people in Kentucky.

The Distilling Industry in Kentucky 59
Most of the other detailed industries outside of manufacturing are in retail trade, personal services, health care, education, and other enterprises that primarily serve the local market – and hence are not typically considered as economic development targets. However, there are several non-manufacturing industries that receive considerable public attention and it is interesting to compare their impacts to that of distilling.
Our IMPLAN model estimates that the insurance carriers’ sector, which includes Humana, employs 17,800 people, and has an employment multiplier of 3.51. Coal mining employs just 6,500, and has an employment multiplier of just 2.50. The courier and messenger industry, which includes UPS, Kentucky’s largest private employer, has direct employment of more than 30,500, but its employment multiplier is only 1.77. Kentucky breweries and wineries, which employ many fewer people than these other industries, have industry employment multipliers of 2.64 (beer) and 1.96 (wine).

Economic Impact of Distilling in Kentucky 60
APPENDIX I Wholesale Tax Rates on Alcohol, by State
$-
$5.00
$10.00
$15.00
$20.00
$25.00
$30.00
$35.00W
ash.
(e, f
)O
re. (
b)Va
. (b)
Ala.
(b)
Uta
h (b
)N
.C. (
b)Io
wa
(b)
Alas
ka (a
)M
ich.
(b)
Idah
o (b
)O
hio
(b)
Mon
t. (b
)M
inn.
(d, e
)Ill
. (a)
Miss
. (b)
Ky. (
c)Ar
k. (d
, e)
Vt. (
b)W
.Va.
(b)
Pa. (
b)Fl
a. (a
)N
.Y. (
a)D.
C. (e
)N
.M.
Haw
aii
Mai
ne (b
)O
kla.
N.J.
S.C.
(d)
Conn
. (a)
R.I.
(a)
Md.
(a, e
)S.
D. (a
, e)
N.D
. (a,
e)
Del.
(a)
Tenn
. (d)
Mas
s. (a
)G
a. (a
)N
ebr.
Nev
. (a)
Calif
. (a)
Wis.
La. (
a)Ar
iz.In
d. (a
)Ka
ns.
Tex.
(a)
Colo
.M
o.
Distilled Spirits Wholesale Tax Rates, by Stateper gallon, January 1, 2018 (excludes retail sales taxes)
Source: Tax Foundation, and Distilled Spirits Council of the United States.
Kentucky
Tennessee
Notes(a) Different rates also applicable according to alcohol content, place of production, size of container, or place purchased (on- or off-premise or onboard airlines).(b) Control states, where the government controls all sales. Products can be subject to ad valorem mark-up as well as excise taxes. (c) Includes the wholesale tax rate of 11%, converted to a gallonage excise tax rate.(d) Includes case fees and/or bottle fees which may vary with size of container.(e) Includes sales taxes specific to alcoholic beverages.(f) Includes the retail (17%) and distributor (5/10%) license fees, converted into a gallonage excise tax rate.
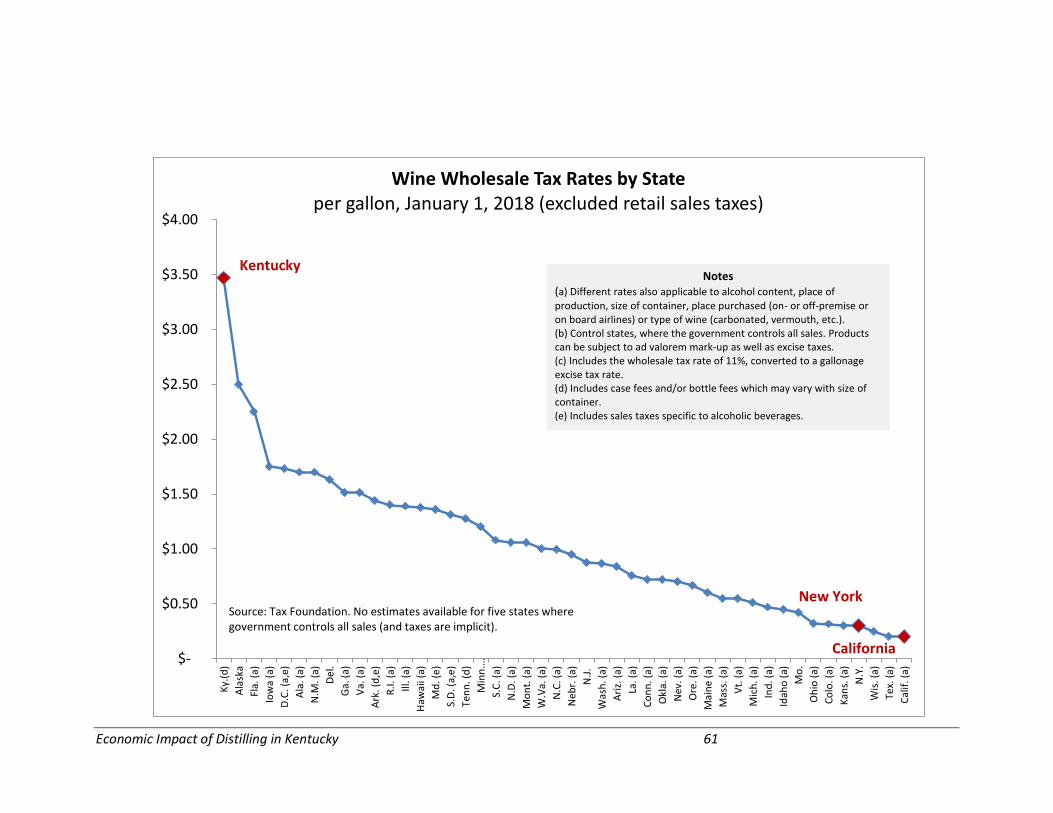
Economic Impact of Distilling in Kentucky 61
$-
$0.50
$1.00
$1.50
$2.00
$2.50
$3.00
$3.50
$4.00K
y.(
d)
Ala
sk
a
Fla
. (a
)
Iow
a (
a)
D.C
. (a
,e)
Ala
. (a
)
N.M
. (a
)
De
l.
Ga
. (a
)
Va
. (a
)
Ark
. (d
,e)
R.I
. (a
)
Ill.
(a
)
Ha
wa
ii (
a)
Md
. (e
)
S.D
. (a
,e)
Te
nn
. (d
)
Min
n.…
S.C
. (a
)
N.D
. (a
)
Mo
nt.
(a
)
W.V
a.
(a)
N.C
. (a
)
Ne
br.
(a
)
N.J
.
Wa
sh
. (a
)
Ari
z.
(a)
La
. (a
)
Co
nn
. (a
)
Ok
la.
(a)
Ne
v.
(a)
Ore
. (a
)
Ma
ine
(a
)
Ma
ss.
(a)
Vt.
(a
)
Mic
h.
(a)
Ind
. (a
)
Ida
ho
(a
)
Mo
.
Oh
io (
a)
Co
lo.
(a)
Ka
ns.
(a)
N.Y
.
Wis
. (a
)
Te
x.
(a)
Ca
lif.
(a
)
Wine Wholesale Tax Rates by Stateper gallon, January 1, 2018 (excluded retail sales taxes)
Source: Tax Foundation. No estimates available for five states where
government controls all sales (and taxes are implicit).
California
New York
KentuckyNotes
(a) Different rates also applicable to alcohol content, place of
production, size of container, place purchased (on- or off-premise or
on board airlines) or type of wine (carbonated, vermouth, etc.).
(b) Control states, where the government controls all sales. Products
can be subject to ad valorem mark-up as well as excise taxes.
(c) Includes the wholesale tax rate of 11%, converted to a gallonage
excise tax rate.
(d) Includes case fees and/or bottle fees which may vary with size of
container.
(e) Includes sales taxes specific to alcoholic beverages.
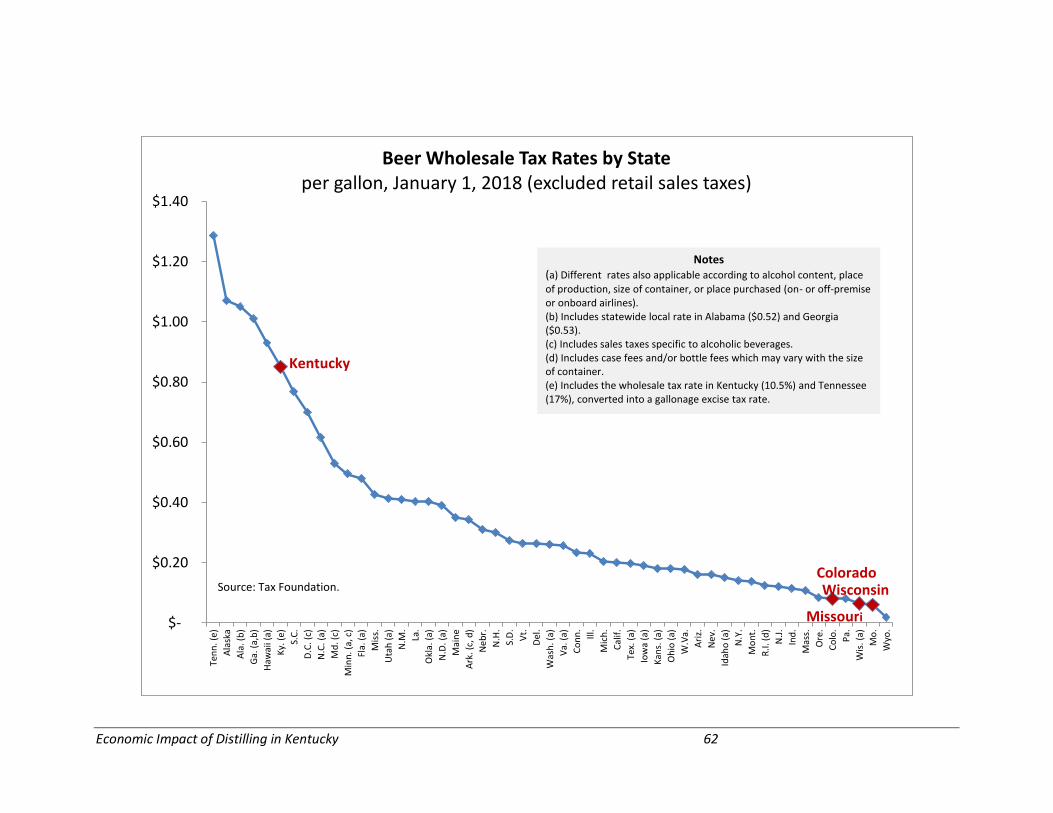
Economic Impact of Distilling in Kentucky 62
$-
$0.20
$0.40
$0.60
$0.80
$1.00
$1.20
$1.40Te
nn. (
e)Al
aska
Ala.
(b)
Ga. (
a,b)
Haw
aii (
a)Ky
. (e)
S.C.
D.C.
(c)
N.C.
(a)
Md.
(c)
Min
n. (a
, c)
Fla.
(a)
Miss
.Ut
ah (a
)N.
M.
La.
Okl
a. (a
)N.
D. (a
)M
aine
Ark.
(c, d
)Ne
br.
N.H.
S.D. Vt
.De
l.W
ash.
(a)
Va. (
a)Co
nn.
Ill.
Mich
.Ca
lif.
Tex.
(a)
Iow
a (a
)Ka
ns. (
a)O
hio
(a)
W.V
a.Ar
iz.Ne
v.Id
aho
(a)
N.Y.
Mon
t.R.
I. (d
)N.
J.In
d.M
ass.
Ore
.Co
lo.
Pa.
Wis.
(a)
Mo.
Wyo
.
Beer Wholesale Tax Rates by Stateper gallon, January 1, 2018 (excluded retail sales taxes)
Source: Tax Foundation.Colorado
Missouri
Wisconsin
Kentucky
Notes(a) Different rates also applicable according to alcohol content, place of production, size of container, or place purchased (on- or off-premise or onboard airlines). (b) Includes statewide local rate in Alabama ($0.52) and Georgia ($0.53).(c) Includes sales taxes specific to alcoholic beverages.(d) Includes case fees and/or bottle fees which may vary with the size of container.(e) Includes the wholesale tax rate in Kentucky (10.5%) and Tennessee (17%), converted into a gallonage excise tax rate.