factors affecting the occurrence of woody plants in understory of sugi
TRANSCRIPT
Factors affecting the occurrence of woody plants in understory of sugi (Cryptomeria japonica D.
Don.) plantations in a warm-temperate region in Japan*
Satoshi Ito1, Satoshi Ishigami1, Yasushi Mitsuda1, G. Peter Buckley2
1Faculty of Agriculture, University of Miyazaki2Faculty of Life Sceinces, Imperial College, UK
Abstract
We compared the occurrence of woody plants present in sugi (Cryptomeria japonica D. Don) plantations and
evergreen broadleaved natural forests in a warm-temperate region in order to characterize the understory vegetation of
sugi plantations. The influence of stand attributes on species occurrence in the plantations was evaluated using logistic
regression analysis. Out of 163 species, 65 plantation-preferring species and 31 natural forest-preferring species were
detected. The plantation-preferring species group contained deciduous species (38 of 65 species) that are characteristic
of coppice woodland, but all the natural forest-preferring species were evergreen plants. This indicates that the
composition of the woody understory in sugi plantations of the region is characterized by the species of open,
disturbed habitats. Stand age and the distance from the nearest natural forests were found to significantly affect the
occurrence of evergreen shrubs and plants with gravity-dispersed seeds, respectively, but the light environment of the
stand had less effect. According to the regression model analyses, long-term strategies such as lengthening the rotation
(logging age) or creating patch mosaics of plantations in the matrix of natural forests appeared to be effective in
conserving woodland species that are characteristic of evergreen, broadleaved forests. On the other hand, increasing
light penetration through thinning practices is a short-term strategy that is less likely to be effective in promoting
these species.
Key Words: understory shrubs, broadleaved evergreen forest, logistic regression analysis, species occurrence,
stand attributes, sugi plantations
Introduction
The concept of sustainable forestry emphasizes the
maintenance of both the ecological and economic values
of managed forests (Hansen et al. 1995; Barbour et al.
1997; Moor & Allen, 1999; Hummel 2003). Recent interest
in the multi-functionality of forest ecosystems has
focused on ecological processes even in plantation forests
(Hunter 1990; Hansen et al. 1991; Silbaugh & Betters 1995;
Kimmins 1997; Moore & Allen 1999). Conservation of
species diversity is one of the principles of sustainable
forestry for maintaining ecological values of forests (Crow
1989; Hunter 1990; Burton et al. 1992). In Japan, the
establishment of extensive areas of even-aged sugi
(Cryptomer ia japon ica D . Don) and h inok i
(Chamaecyparis obtusa Endl.) plantations has resulted
in a simplified forest structure which in turn is responsible
for a general decline in species diversity (Kiyono 1990;
Nakagawa and Ito 1997; Nakagawa et al. 1998; Nagaike
2000; Ito et al. 2003; Ito et al. 2004). Similar changes have
occurred in other countries (e.g., Kimball & Hunter 1990;
Moore & Allen, 1999).
Management of conifer plantations has strong and
variable effects on plant species occurrence and diversity
through the establishment of the plantation itself, the
elimination of plants by weeding and the alteration of the
ecological processes caused by changes in stand
structure, landscape structure and physical environments
(Hill 1979; Peterken & Game 1984; Kirby 1988;
Schoonmaker & McKee 1988; Kiyono 1990; Hasegawa
*Accepted manuscript for Journal of Forest Research.
2.1. 針葉樹人工林における木本植物の出現とその規定要因
7
1991; Simmons & Buckley 1992; Wallace et al. 1992;
Parrotta 1995; Wallace & Good 1995; Nyland 1996;
Hasegawa 1998; Harrington & Edwards 1999; Moore &
Allen 1999, Thomas et al. 1999; Battles et al. 2001;
Euskirchen et al. 2001; Brosofske et al. 2001). Thus, in
order to improve the biodiversity of these conifer
plantations in a given region, the factors limiting species
diversity (itself a reflection of the occurrence of individual
species) must be clarified both at the forest and landscape
levels (Michelsen et al. 1996; Ito et al. 2004). However,
little is known about the responses of individual plant
species to plantation management in Japan.
Classification of the plant species by functional
grouping is an effective way to characterise the forest
species diversity (Franklin 1988; Crow 1989; Solbrig 1994;
Euskirchen et al. 2001), and is a useful aid for understanding
the response of vegetation to forest management based
on the traits of component species (Thomas et al. 1999;
Ito et al. 2004). Since individual plant species differ from
each other in their reproductive strategies, resource
requirements and tolerance of disturbance, detailed
analyses of the responses of each functional group to
forest management have the potential to provide not only
a better a understanding of the factors limiting individual
plant species but also the management implications for
conserving target species or species groups.
Many studies have pointed out that plantation age
is the major factor affecting the understory species
composition and diversity (Peterken 1993; Nyland 1996,
Kiyono 1990; Ito et al. 2003). Thinning, which modifies
the light environment in the short-term, is another major
factor controlling understory vegetation (Kiyono 1990;
Thomas et al. 1999; Son et al. 2004). The spatial
arrangement of plantation stands in relation to potential
colonising sources is reported to be crucial for biodiversity
conservation (Moore & Allen 1999; Sarlov-Herlin & Fly
2000), while topography will often also affect the
understory composition (Ito et al. 2003).
The objective of this study was to clarify the factors
limiting the occurrence of woody plants (trees, shrubs
and climbing plants) in conifer plantations in relation to
forest management practices. We first compared the
occurrence of woody plants in both sugi plantations and
evergreen, broadleaved natural forests in a warm-temperate
region in order to characterize the understory vegetation
of sugi plantations. We then evaluated the influence of
major stand attributes (stand age, light environment,
microtopography and forest edges), on each species
occurring in sugi plantations. This approach enabled us
to model the effects of management on species occurrence
and from this to predict the effects of different
management scenarios on species diversity.
Methods
1 Data collection
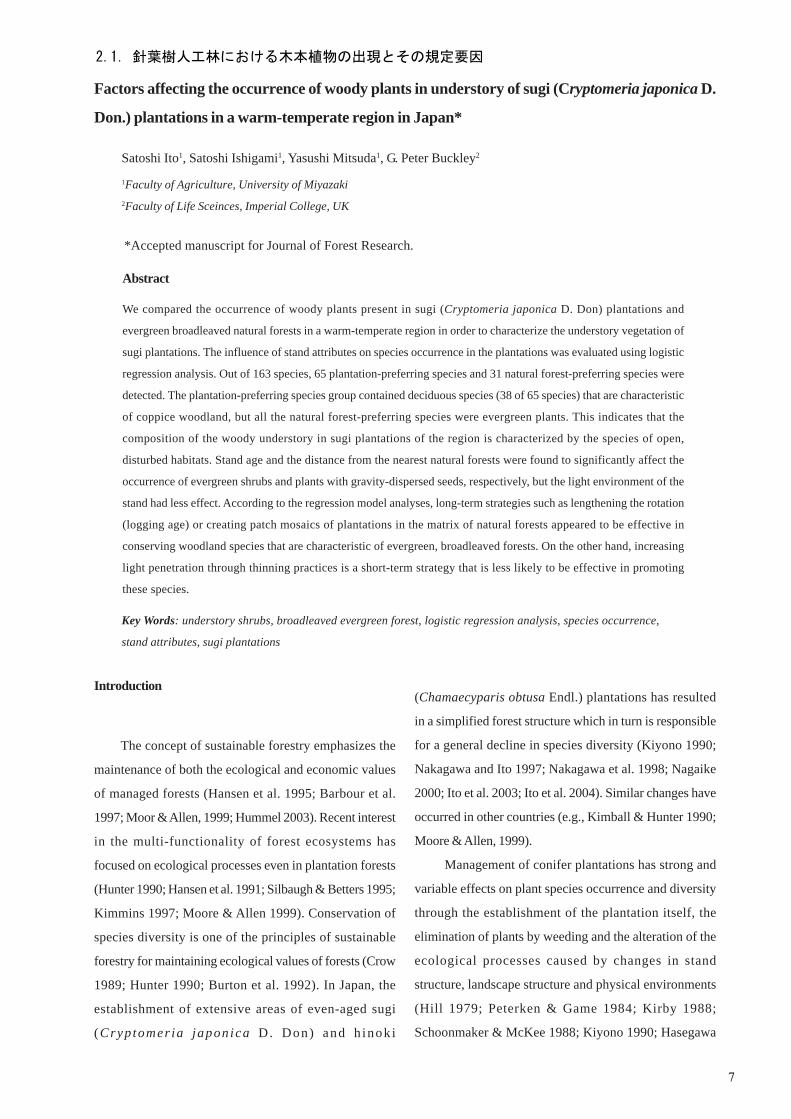
The understory vegetation of sugi plantations and
evergreen, broad-leaved natural forests (Nakagawa et al.
1998, Yamashita et al. 2000) was investigated in Miyazaki
University Forest, located in southeastern Kyushu,
southern Japan (Fig. 1). Sugi plantations in Miyazaki
University Forest have been managed uniformly to a
management schedule, including ground preparation by
hand (not using fire or any herbicide), weeding and shrub-
clearing for 10 years after planting without using any
herbicides, first thinning at c. 25-30 years and a second
thinning taken at c. 60 years.
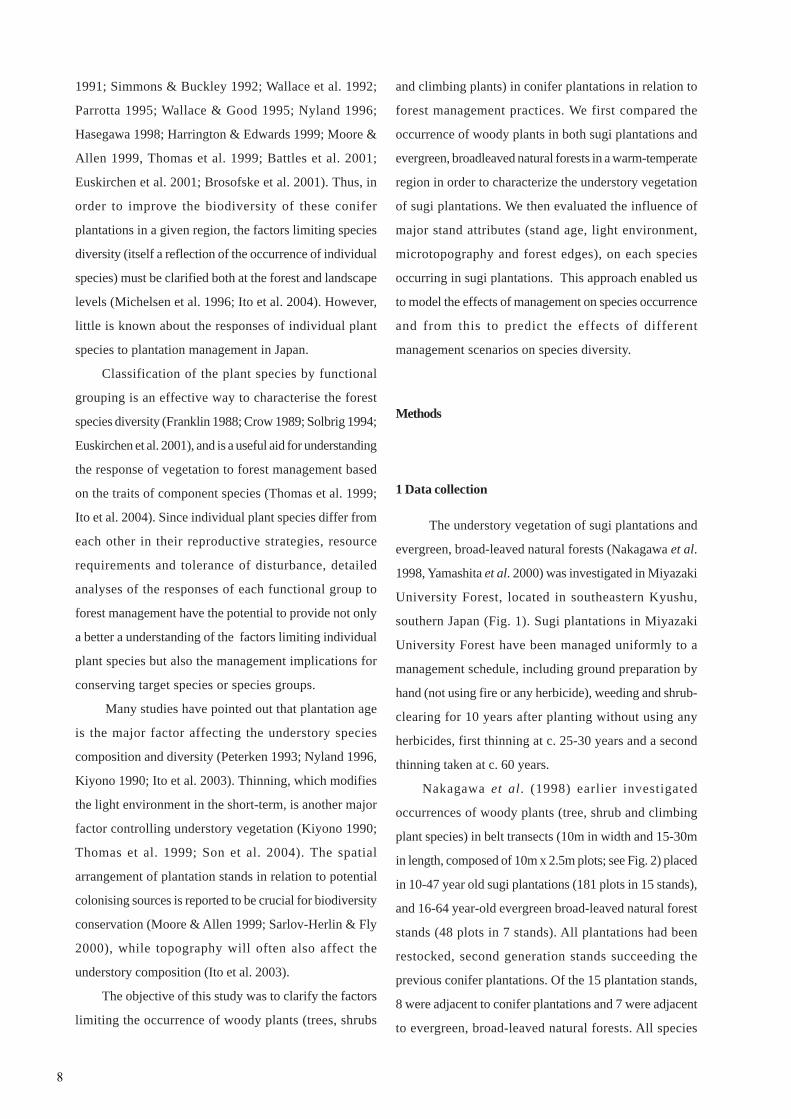
Nakagawa et al. (1998) earlier investigated
occurrences of woody plants (tree, shrub and climbing
plant species) in belt transects (10m in width and 15-30m
in length, composed of 10m x 2.5m plots; see Fig. 2) placed
in 10-47 year old sugi plantations (181 plots in 15 stands),
and 16-64 year-old evergreen broad-leaved natural forest
stands (48 plots in 7 stands). All plantations had been
restocked, second generation stands succeeding the
previous conifer plantations. Of the 15 plantation stands,
8 were adjacent to conifer plantations and 7 were adjacent
to evergreen, broad-leaved natural forests. All species
8
occurring in the understory (height < 4m) for each plot
were listed and attributed to slope position (upper slope,
mid slope or lower slope) and slope shape (concave or
convex). For each plot an index of the light environment,
gap light index (GLI, Canham 1988), was computed by
HEMIPHOT, a PC-based program for image analysis
(Steege, 1993), using hemispherical photographs taken
1.2m above ground surface. GLI was calculated for the
growing season of the region (April to December) using
the following equation:
100×++=
AdirAdifBdirBdifGLI (1)
where Bdif and Bdir are the cumulative values ofdiffusive and direct light below the canopy during thegrowing season, respectively and Adif and Adir are thecorresponding values above the canopy.
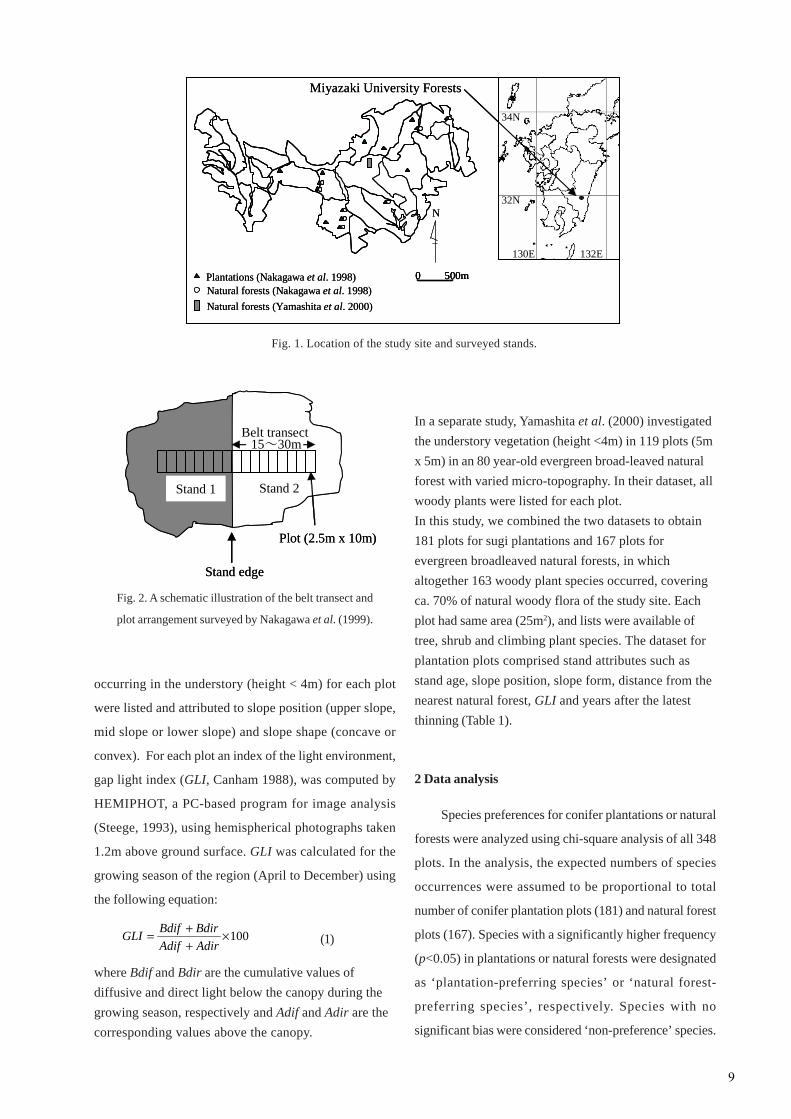
In a separate study, Yamashita et al. (2000) investigatedthe understory vegetation (height <4m) in 119 plots (5mx 5m) in an 80 year-old evergreen broad-leaved naturalforest with varied micro-topography. In their dataset, allwoody plants were listed for each plot.In this study, we combined the two datasets to obtain181 plots for sugi plantations and 167 plots forevergreen broadleaved natural forests, in whichaltogether 163 woody plant species occurred, coveringca. 70% of natural woody flora of the study site. Eachplot had same area (25m2), and lists were available oftree, shrub and climbing plant species. The dataset forplantation plots comprised stand attributes such asstand age, slope position, slope form, distance from thenearest natural forest, GLI and years after the latestthinning (Table 1).
2 Data analysis
Species preferences for conifer plantations or natural
forests were analyzed using chi-square analysis of all 348
plots. In the analysis, the expected numbers of species
occurrences were assumed to be proportional to total
number of conifer plantation plots (181) and natural forest
plots (167). Species with a significantly higher frequency
(p<0.05) in plantations or natural forests were designated
as ‘plantation-preferring species’ or ‘natural forest-
preferring species’, respectively. Species with no
significant bias were considered ‘non-preference’ species.
Miyazaki University Forests
Natural forests (Yamashita et al. 2000)Natural forests (Nakagawa et al. 1998)Plantations (Nakagawa et al. 1998) 0 500m
N
130E 132E
32N
34N
Miyazaki University Forests
Natural forests (Yamashita et al. 2000)Natural forests (Nakagawa et al. 1998)Plantations (Nakagawa et al. 1998) 0 500m0 500m
N
130E 132E
32N
34N
130E 132E
32N
34N
Fig. 1. Location of the study site and surveyed stands.
Stand edge
Stand 1 Stand 2
Plot (2.5m x 10m)
15~30mBelt transect
Stand edge
Stand 1 Stand 2
Plot (2.5m x 10m)
15~30mBelt transect
Fig. 2. A schematic illustration of the belt transect and
plot arrangement surveyed by Nakagawa et al. (1999).
9
The composition of the plantation-preferring species
and the natural forest-preferring species were then
compared with reference to their life forms, characteristic
habitats and seed dispersal types. Using the descriptions
of Ohwi and Kitagawa (1992), the following life forms were
recognised: evergreen trees, evergreen shrubs, evergreen
climbing plants, deciduous trees, deciduous shrubs and
deciduous climbing plants. We also adopted Okuda’s
(1997) classification of characteristic habitats which are
usually occupied by these plant species, as follows:
evergreen broadleaved natural forests, deciduous
broadleaved natural forests, and coppice woodlands.
Habitats of species not listed by Okuda were classified as
‘unknown’. Finally, primary seed dispersal strategies of
each species were determined according to fruit
morphology and size: frugivore- (all sap fruits), gravity-
(large dry fruits), and wind- (small dry fruits) dispersal
(Kominami et al., 1995; Ito et al., 2003; Ito et al. 2004).
For the 99 species that occurred in plantations
adjacent to natural forests (81 plots), their probabilities of
occurrence in plantations with different stand attributes
were analyzed using logistic regression analysis. The
probability of presence (1) or absence (0) was modeled
using stand attributes (stand age, slope position, slope
form, distance from the nearest natural forest, GLI and
years after the latest thinning) as independent variables
in a stepwise, variable selection. The categorical attributes
(slope position and slope form) were computed by using
dummy variables.
3 Simulations
In order to examine the possible effects of
management on plant species diversity in conifer
plantations, we ran numerical simulations based on the
results of the logistic analyses. We assumed a 0.25ha
plantation stand consisting of 100 grids of 5m x 5m. As a
reference stand, we used the following attributes: 1)
stand shape: 50m x 50m, 2) distance from natural forests:
100m, 3) stand age: 40 years old, 4) years after thinning: 10
years, 5) GLI: 15%, and 6) slope shape and position:
random. We then modified some of the attributes as shown
in Table 2 in order to set different management scenarios:
1) lengthened rotation periods (different stand ages from
Plantation Natural forestTotal Number of plots 181 167Stand age (yr) 10-47 16-80Years after the latest thinning (yr) 15-Mar -GLI (%) 2.2-75.1 -Slope position
Upper slope 19 plots 48 plotsMid slope 59 plots 57 plotsLower slope 103 plots 62 plots
Slope formConcave 17 plots 6 plotsFlat 31 plots 9 plotsConvex 133 plots 33 plotsunknown - 119 plots
Ajdacent stand typeNatural forest 81 plots -Conifer plantation 100 plots -
Table 1 A summary of the stand attributes of the plots.
Stand age Light environment Spatial arrangementStand age (yr) 15, 40, 70, 100 a 40 40
Years after the latest thinning (yr) 10 0, 10 10
GLI (%) 15 3, 15, 40 15
Slope position random random random
Slope form random random random
Stand shape 50m x 50m 50m x 50m 50m x 50m, 10m x 250mconifer plantation/
natural forests
Type of scenarios
Ajdacent stand type conifer plantation conifer plantation
Stand attributes
Table 2 Conditions of simulations predicting plant species diversity under different management scenarios.
a Conditions shown in bold characters denote the modified conditions from the standard stand attributes.
10

15 to 100 years old), 2) altered light environment by
thinning (different GLI from 3 to 40%, and years after
thinning from 0 to 10 years), and 3) altered spatial
arrangement (surrounded by conifer plantation,
surrounded by natural forest, and a narrower stand shape
[10m x 250m] surrounded by a natural forest). Using these
different stand conditions, we predicted the absence or
presence of each species in each 5m x 5m grid for 99species
occurred in plantations adjacent to natural forests.
Predictions were made from the probability function
obtained by the logistic analyses for 64 species (see
Results). For the other 35 species for which significant
models were not obtained, their relative frequencies in
the plantation plots (number of plots where the species
occurred / 181plots) was used as the basis of occurrence
probability. The prediction for each scenario was repeated
10,000 times, and Shannon’s species diversity index (H’)
was calculated for each trial by following equation:
∑= ii ppH log' (2)
where pi was the relative dominance of species i, and
was calculated as relative frequency in 100 grids. H’ was
separately calculated for each life form, characteristic
habitat and seed dispersal type to compare their
proportion between tested scenarios.
Results
1 Species Occurrence
Of the 163 species, 150 and 141 species occurred in
plantations and natural forests, respectively, with 128
species common to both. Twenty-two and thirteen species
only occurred in plantations and natural forests,
respectively. Including these 35 species, a total of 96
species were found to prefer a particular stand type: 65
preferring plantation and 31 natural forest. The remaining
67 species had no preference.
12 (18.5) a 13 (41.9) 7 (10.4)11 (16.9) 16 (51.6) 16 (23.9)
4 (6.2) 2 (6.5) 4 (6.0)9 (13.8) 0 (0) 19 (28.4)
16 (24.6) 0 (0) 17 (25.4)13 (20.0) 0 (0) 4 (6.0)
23 (35.4) 24 (77.4) 26 (38.8)4 (6.2) 0 (0) 4 (6.0)
25 (38.5) 0 (0) 27 (40.3)13 (20.0) 7 (22.6) 10 (14.9)
14 (21.5) 7 (22.6) 23 (34.3)46 (70.8) 24 (77.4) 38 (56.7)
5 (7.7) 0 (0) 6 (9.0)
65 31 67
Wind
Total
Seed dispersal typeGravityFrugivore
Evergreen natural forestDeciduous natural forestCoppicesunknown
Deciduous shrubDeciduous climbing
Characteristic habitat
Evergreen treeEvergreen shrubEvergreen climbingDeciduous tree
Plantation-preferring species Natural forest-preferringspecies Non-preference species
Life form
Table 3 Number and proportion of species in the plantation-preferring species, the natural forest preferring species and non-
preference species in relation to life form, characteristic habitat and seed dispersal type.
a Figures in parentheses are the proportion of the number of species to the total of each species groups.
11

The plantation-preferring species contained 38
deciduous species (58% of 65 species) including pioneer
trees and shrubs such as Mallotus japonicus (Thunb.)
Muell. Arg. and Rosa onoei Makino, though several
evergreen Quercus species (Q. glauca Thunb., Q. salicina
Blume and Q. gilva Blume) also appeared in this group
(Table 3). On the other hand, all the natural forest-preferring
species were evergreen trees (Table 3). When comparing
the proportion of characteristic habitats, plantation-
preferring species were characteristic of coppices (25
species, 39%), while the natural forest-preferring species
included no coppice species (Table 3). There was no clear
difference in the proportion of seed dispersal types
between the plantations- and the natural forest-preferring
species (Table 3).
Among the 99 species tested using logistic analyses,
significant models (p<0.05) were obtained for 64 species
(Table 4). Stand age was a significant variable for 42
species. Twenty-four species of the plantation-preferring
species had a tendency to occur in younger stands, while
only one species of the natural forest-preferring species
tended to occur in younger stands. The number of years
after thinning had both positive and negative effects,
mainly increasing the occurrence of the plantation-
preferring species. GLI had positive effects on 11 of the
plantation-preferring species. The distance from the
VariablesStand agepositive (old) 7 (12) a 3 (21) 4 (16) 14 (14)negative (young) 24 (40) 1 (7) 3 (12) 28 (28)
Years after the latestthinning
positive (long) 11 (18) 1 (7) 3 (12) 15 (15)negative(short) 12 (20) 2 (14) 3 (12) 17 (17)
GLIpositive(light) 11 (18) 2 (14) 6 (24) 19 (19)negative(dark) 3 (5) 0 (0) 2 (8) 5 (5)
Distance from thenearest natural forest
positive(far) 7 (12) 0 (0) 1 (4) 8 (8)negative(close) 9 (15) 0 (0) 8 (32) 17 (17)
Slope positionUpper slope 15 (25) 5 (36) 9 (36) 29 (29)Mid slope 10 (17) 0 (0) 6 (24) 16 (16)Lower slope 6 (10) 1 (7) 4 (16) 11 (11)
Slope formConcave 6 (10) 1 (7) 4 (16) 11 (11)Flat 2 (3) 0 (0) 2 (8) 4 (4)Convex 5 (8) 1 (7) 6 (24) 12 (12)
Number of species forwhich significantmodel was obtained
42 (70) 5 (36) 17 (68) 64 (65)
Total number ofspecies examined 60 (100) 14 (100) 25 (100) 99 (100)
Plantation-preferring Natural forest-preferring Non-preference species Total
Table 4 A summary of logistic regression analyses of occurrence probability conducted for 64 species. Figures indicate the
number of species which the variables were significant in the regressions.
a Figures in parentheses are the proportion of the number of species to the total of examined species in each species category.
12
nearest natural forest had a negative influence on 9 of the
plantation-preferring species. However, 7 plantation-
preferring species were influenced positively by the same
variable. There were fewer effects of these two variables
(GLI and the distance) on the occurrence of the natural
forest-preferring species. Slope position showed generally
high influences (56 of 99 species).
2 Simulation results
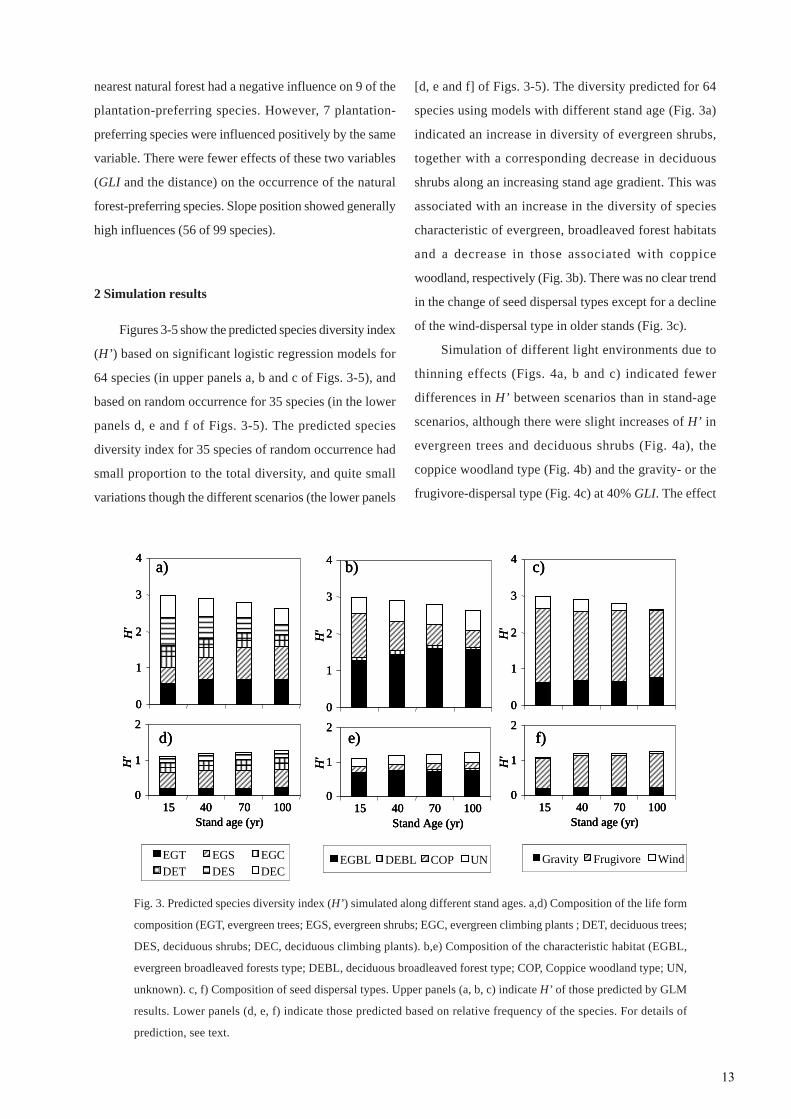
Figures 3-5 show the predicted species diversity index
(H’) based on significant logistic regression models for
64 species (in upper panels a, b and c of Figs. 3-5), and
based on random occurrence for 35 species (in the lower
panels d, e and f of Figs. 3-5). The predicted species
diversity index for 35 species of random occurrence had
small proportion to the total diversity, and quite small
variations though the different scenarios (the lower panels
[d, e and f] of Figs. 3-5). The diversity predicted for 64
species using models with different stand age (Fig. 3a)
indicated an increase in diversity of evergreen shrubs,
together with a corresponding decrease in deciduous
shrubs along an increasing stand age gradient. This was
associated with an increase in the diversity of species
characteristic of evergreen, broadleaved forest habitats
and a decrease in those associated with coppice
woodland, respectively (Fig. 3b). There was no clear trend
in the change of seed dispersal types except for a decline
of the wind-dispersal type in older stands (Fig. 3c).
Simulation of different light environments due to
thinning effects (Figs. 4a, b and c) indicated fewer
differences in H’ between scenarios than in stand-age
scenarios, although there were slight increases of H’ in
evergreen trees and deciduous shrubs (Fig. 4a), the
coppice woodland type (Fig. 4b) and the gravity- or the
frugivore-dispersal type (Fig. 4c) at 40% GLI. The effect
Gravity Frugivore WindEGT EGS EGCDET DES DEC
EGBL DEBL COP UN
0
1
2
3
4
H'
0
1
2
15 40 70 100Stand age (yr)
H'
c)
f)
0
1
2
3
4
H'
0
1
2
15 40 70 100Stand age (yr)
H'
a)
d)
0
1
2
3
4
H'
Stand Age (yr)
0
1
2
15 40 70 100
H'
b)
e)
Gravity Frugivore WindGravity Frugivore WindEGT EGS EGCDET DES DECEGT EGS EGCDET DES DEC
EGBL DEBL COP UNEGBL DEBL COP UN
0
1
2
3
4
H'
0
1
2
15 40 70 100Stand age (yr)
H'
c)
f)
0
1
2
3
4
H'
0
1
2
15 40 70 100Stand age (yr)
H'
c)
f)
0
1
2
3
4
H'
0
1
2
15 40 70 100Stand age (yr)
H'
a)
d)
0
1
2
3
4
H'
0
1
2
15 40 70 100Stand age (yr)
H'
a)
d)
0
1
2
3
4
H'
Stand Age (yr)
0
1
2
15 40 70 100
H'
b)
e)
0
1
2
3
4
H'
Stand Age (yr)
0
1
2
15 40 70 100
H'
b)
e)
Fig. 3. Predicted species diversity index (H’) simulated along different stand ages. a,d) Composition of the life form
composition (EGT, evergreen trees; EGS, evergreen shrubs; EGC, evergreen climbing plants ; DET, deciduous trees;
DES, deciduous shrubs; DEC, deciduous climbing plants). b,e) Composition of the characteristic habitat (EGBL,
evergreen broadleaved forests type; DEBL, deciduous broadleaved forest type; COP, Coppice woodland type; UN,
unknown). c, f) Composition of seed dispersal types. Upper panels (a, b, c) indicate H’ of those predicted by GLM
results. Lower panels (d, e, f) indicate those predicted based on relative frequency of the species. For details of
prediction, see text.
13

of time after the thinning (0 or 10 years) had less effect on
species diversity.
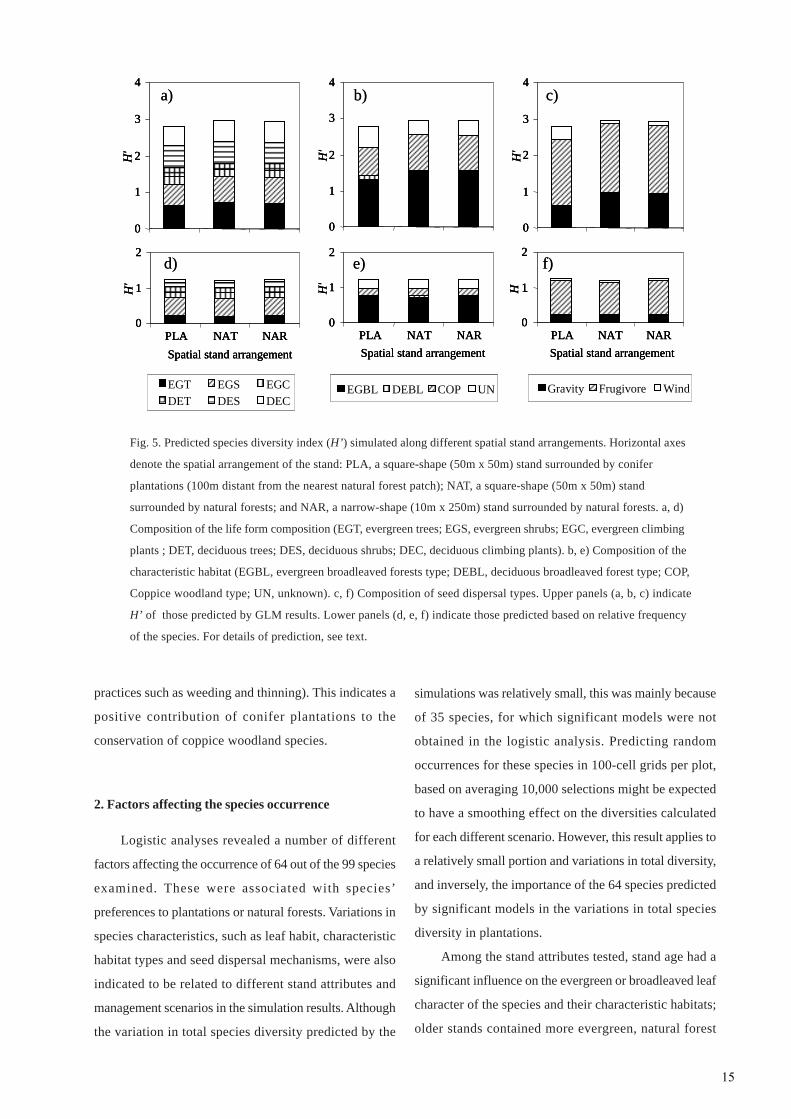
Different spat ia l arrangements of s tands
demonstrated that for those stands surrounded by natural
forests, irrespective of shape, small increases occurred in
the evergreen broadleaved forest type (Fig. 5b) and
gravity-dispersal type (Fig. 5c), but a decrease in the wind-
dispersal type (Fig. 5c).
Discussion
1. Composition of ‘the plantation-preferring species’
Forty per cent of the species found in plantations
(65 of 150 species) tended to prefer plantations to natural
forests. The plantation-preferring species contained a
large proportion of deciduous plants that are
characteristic of deciduous, broadleaved forest or
frequently disturbed coppice forests. Most pioneer species
in the evergreen broadleaved forest region of Japan have
the deciduous leaf habit more usually associated with cool
temperate forests, but are common in the warm-temperate
region on frequently disturbed sites such as riparian
margins (Sakai and Ohsawa, 1994; Ito and Nogami, 2005).
Thus, it is suggested that the understory vegetation of
sugi plantations retains many characteristics of disturbed
open habitats in the region, even under the moderately
closed canopies of the production forests investigated in
this study. This is consistent with previous reports for
plantations in warm-temperate region (Ito et al., 2004) and
other plantations elsewhere (Takeda and Kimura, 1988;
Nagaike, 2002), and reflects the influence of intensive
disturbance (establishment of plantations) and
continuous disturbances (subsequent management
H'
0
1
2
3
4
0
1
2
H'
3 15 40 3 15 40GLI (%)
0 years afterthinning
10 years afterthinning
0
1
2
3
4
H'
0
1
2
H'
3 15 40 3 15 40GLI (%)
0 years afterthinning
10 years afterthinning
0
1
2
3
4
H'
0
1
2
H'
3 15 40 3 15 40GLI (%)
0 years afterthinning
10 years afterthinning
Gravity Frugivore WindEGT EGS EGCDET DES DEC
EGBL DEBL COP UN
c)
f)
a)
d)
b)
e)
H'
0
1
2
3
4
0
1
2
H'
3 15 40 3 15 40GLI (%)
0 years afterthinning
10 years afterthinning
H'
0
1
2
3
4
0
1
2
H'
3 15 40 3 15 40GLI (%)
0 years afterthinning
10 years afterthinning
0
1
2
3
4
H'
0
1
2
H'
3 15 40 3 15 40GLI (%)
0 years afterthinning
10 years afterthinning
0
1
2
3
4
H'
0
1
2
H'
3 15 40 3 15 40GLI (%)
0 years afterthinning
10 years afterthinning
0
1
2
3
4
H'
0
1
2
H'
3 15 40 3 15 40GLI (%)
0 years afterthinning
10 years afterthinning
0
1
2
3
4
H'
0
1
2
H'
3 15 40 3 15 40GLI (%)
0 years afterthinning
10 years afterthinning
Gravity Frugivore WindGravity Frugivore WindEGT EGS EGCDET DES DECEGT EGS EGCDET DES DEC
EGBL DEBL COP UNEGBL DEBL COP UN
c)
f)
a)
d)
b)
e)
Fig. 4. Predicted species diversity index (H’) simulated along different light environments and years after the
latest thinning. a, d) Composition of the life form composition (EGT, evergreen trees; EGS, evergreen shrubs;
EGC, evergreen climbing plants ; DET, deciduous trees; DES, deciduous shrubs; DEC, deciduous climbing
plants). b, e) Composition of the characteristic habitat (EGBL, evergreen broadleaved forests type; DEBL,
deciduous broadleaved forest type; COP, Coppice woodland type; UN, unknown). c, f) Composition of seed
dispersal types. Upper panels (a, b, c) indicate H’ of those predicted by GLM results. Lower panels (d, e, f)
indicate those predicted based on relative frequency of the species. For details of prediction, see text.
14
practices such as weeding and thinning). This indicates a
positive contribution of conifer plantations to the
conservation of coppice woodland species.
2. Factors affecting the species occurrence
Logistic analyses revealed a number of different
factors affecting the occurrence of 64 out of the 99 species
examined. These were associated with species’
preferences to plantations or natural forests. Variations in
species characteristics, such as leaf habit, characteristic
habitat types and seed dispersal mechanisms, were also
indicated to be related to different stand attributes and
management scenarios in the simulation results. Although
the variation in total species diversity predicted by the
simulations was relatively small, this was mainly because
of 35 species, for which significant models were not
obtained in the logistic analysis. Predicting random
occurrences for these species in 100-cell grids per plot,
based on averaging 10,000 selections might be expected
to have a smoothing effect on the diversities calculated
for each different scenario. However, this result applies to
a relatively small portion and variations in total diversity,
and inversely, the importance of the 64 species predicted
by significant models in the variations in total species
diversity in plantations.
Among the stand attributes tested, stand age had a
significant influence on the evergreen or broadleaved leaf
character of the species and their characteristic habitats;
older stands contained more evergreen, natural forest
0
1
2
3
4
H'
0
1
2
PLA NAT NARSpatial stand arrangement
H '
0
1
2
3
4
H'
0
1
2
PLA NAT NARSpatial stand arrangement
H'
0
1
2
3
4
H'
0
1
2
PLA NAT NARSpatial stand arrangement
H'
Gravity Frugivore WindEGT EGS EGCDET DES DEC
EGBL DEBL COP UN
c)
f)
a)
d)
b)
e)
0
1
2
3
4
H'
0
1
2
PLA NAT NARSpatial stand arrangement
H '
0
1
2
3
4
H'
0
1
2
PLA NAT NARSpatial stand arrangement
H '
0
1
2
3
4
H'
0
1
2
PLA NAT NARSpatial stand arrangement
H'
0
1
2
3
4
H'
0
1
2
PLA NAT NARSpatial stand arrangement
H'
0
1
2
3
4
H'
0
1
2
PLA NAT NARSpatial stand arrangement
H'
0
1
2
3
4
H'
0
1
2
PLA NAT NARSpatial stand arrangement
H'
Gravity Frugivore WindGravity Frugivore WindEGT EGS EGCDET DES DECEGT EGS EGCDET DES DEC
EGBL DEBL COP UNEGBL DEBL COP UN
c)
f)
a)
d)
b)
e)
Fig. 5. Predicted species diversity index (H’) simulated along different spatial stand arrangements. Horizontal axes
denote the spatial arrangement of the stand: PLA, a square-shape (50m x 50m) stand surrounded by conifer
plantations (100m distant from the nearest natural forest patch); NAT, a square-shape (50m x 50m) stand
surrounded by natural forests; and NAR, a narrow-shape (10m x 250m) stand surrounded by natural forests. a, d)
Composition of the life form composition (EGT, evergreen trees; EGS, evergreen shrubs; EGC, evergreen climbing
plants ; DET, deciduous trees; DES, deciduous shrubs; DEC, deciduous climbing plants). b, e) Composition of the
characteristic habitat (EGBL, evergreen broadleaved forests type; DEBL, deciduous broadleaved forest type; COP,
Coppice woodland type; UN, unknown). c, f) Composition of seed dispersal types. Upper panels (a, b, c) indicate
H’ of those predicted by GLM results. Lower panels (d, e, f) indicate those predicted based on relative frequency
of the species. For details of prediction, see text.
15
species. Similar results were reported by Kiyono (1990)
for hinoki plantations and Ito et al. (2003) for sugi
plantations. The plantation-preferring species also tended
to occur in younger stands, corresponding to their
requirement for disturbance. The simulation results also
displayed an increase in the diversity of evergreen shrubs
characteristic of evergreen broadleaved forest type with
stand age, indicating their ability to recolonise and
respond to developmental changes in the canopy and
light conditions in the understory.
Light levels were less correlated with the occurrence
of the species examined. This was partly because the
surveyed stands had been generally well thinned, and no
stands completely lacked understory vegetation. Thinning
practice in the region is mostly associated with shrub-
clearing procedure before each thinning episode. The
negative influence of this clearing treatment on understory
vegetation also might reduce the positive effects of the
improvement of light climate by thinning. Although 19
species preferred lighter conditions (higher GLI) in the
affected by human disturbances in plantations
(unpublished data).
In conclusion, our results demonstrate the
effectiveness of different management strategies in
acheiving different conservation targets in conifer
plantations. Long-term strategies such as lengthening the
rotation period (logging age), or the formation of patch
during their young ages by continuous human
disturbances.
Acknowledgements
We wish to thank the staff of the Miyazaki University
Forests for cooperation in the fieldwork. Part of the work
was supported by Grant-in-Aid for Scientific Research
from JSPS (No. 15380110).
Literature Cited
Barbour RJ, Johnston S, Hayes JP, Tucker GF (1997)
Simulated stand characteristics and wood product
yields from Douglas-fir plantations managed for
ecosystem objectives. For Ecol Manage 91: 205-219.
Battles JJ, Shlisky AJ, Barrett AJ, Heald RC, Allen-Diaz
BH (2001) The effects of forest management on plant
species diversity in a Seirran conifer forests. Forest Ecol.
Manage. 146: 211-222.
Brosofske KD, Chen J, Crow TR (2001) Understory
vegetation and site factors: implication for a managed
Wisconsin landscape. Forest Ecol Manage 146: 75-87.
Burton PJ, Balisky AC, Coward LP, Cumming SG, Kneeshaw
DD (1992) The value of managing for biodiversity.
Forest Chron 68: 225-237.
Canham CD (1988) An index for understory light levels in
and around canopy gaps. Ecology 69: 1634-1638.
Crow TR (1989) Biological diversity: Why is it important
to foresters? In Managing North Central Forests for
Non-Timber Values. Proc Soc Amer For 4th Region IV
Tech Conf, 1988, Duluth MN. pp.35-42.
Euskirchen ES, Chen J, Bi R (2001) Effects of edges on
plant communities in a managed landscape in northern
Wisconsin. Forest Ecol Manage 148: 93-108.
Franklin JF (1988) Structural and functional diversity in
temperate forests. pp.27-32, In Biodiversity. Wilson E.
O. (ed). Nat. Acad. Press, Washington, D.C.
Hansen AJ, Spies TA, Swanson FJ, Ohmann JI (1991)
Conserving biodiversity in managed forests. Bioscience
41: 382-392.
Hansen AJ, Garman SL, Weigand JF, Urban DL (1995)
Alternative silvicultural regimes in the Pacific
Northwest: simulations of ecological and economic
effects. Ecol Appl 5:535-554.
Harrington TB, Edwards MB (1999) Understory
vegetation, resource availability, and litterfall responses
to pine thinning and woody vegetation control in
longleaf pine plantations. Can J For Res 29:1055–1064
16
Hill MO (1979) The development of a flora in even-aged
plantations. In The ecology of even-aged forest
plantations. Ford, E. D., Malcolm, R. C. and Atterson, J.
(eds.), Inst. Terrestrial Ecology, Cambridge, pp.175-192.
Hummel SS (2003) Managing structural and compositional
biodiversity with sylviculture. In: Monserud RA,
Haynes RW, Jhonson AC (eds) Compatible forest
management. Kluwer Academic Publishers, Dordrecht,
pp 85-120.
Hunter Jr. ML (1990) Wildlife, forest, and forestry. Principles
of managing forests for biological diversity. Prentice-
Hall, New Jersey. 370pp.
Hasegawa M (1998) Effect of weeding and walvage cutting
on monarch birch (Betula maximowicziana Regal)
growing in japanese cedar (Cryptomeria japonica D.
Don) plantations in snowy regions. Jap J For Soc 80:223-
228. (in Japanese with English summary)
Hasegawa M (1991) The effects of weeding and
improvement cutting on the establishment of
hardwoods in an unsuccessful Cryptomeria japonica
plantation. Jap J For Soc 73:375-379. (in Japanese with
English summary)
Ito S, Nakagawa M, Buckley GP, Nogami K (2003) Species
richness in sugi (Cryptomeria japonica D. Don)
plantations in southeastern Kyushu, Japan. The effects
of stand type and age on understory trees and shrubs.
J For Res 8: 49-57.
Ito S, Nakayama R, Buckley GP (2004) Effects of previous
land-use on plant species diversity in semi-natural and
plantation forests in a warm-temperate region in
southeastern Kyushu, Japan. For Ecol Manage 196: 213-
225.
Ito S, Nogami K (2005) Species composition and
environments of riparian forests consisting of
Lagerstroemia subcostata var. fauriei, an endangered
species on Yakushima Island. Veg Sci (in press) (in
Japanese with English summary).
Kimball AJ, Hunter MLJr (1990) Intensive silviculture. In
Wildlife, forests, and forestry. Principles of managing
forests for biological diversity. Hunter, M. L. Jr. (ed),
Prentice-Hall, New Jersey, pp. 200-234.
Kimmins H (1997) Balancing act : environmental issues in
forestry. 2nd ed. 305pp, University of British Columbia
Press, Vancouver.
Kirby KJ (1988) Changes in the ground flora under
plantations on ancient woodland sites. Forestry 61: 317-
338.
Kiyono Y (1990) Dynamics and control of understories in
Chamaecyparis obtusa plantations. Bull FFPRI 359:1-
122 (in Japanese with English summary).
Kominami R, Manabe T, Tanouchi H, Sato T, Niiyama K
(1995) Fruit type composition of seed ran in Aya
evergreen broad-leaved forest. Bull. Kyushu Br Jap For
Soc 48:111-112 (in Japanese).
Michelsen A, Lisanework N, Friis I, Holst N (1996)
Comparisons of understorey vegetation and soil fertility
in plantations and adjacent natural forests in the
Ethiopian highlands. J Appl Ecol 33: 627-642.
Moore SE, Allen EL (1999) Plantation forestry. In
Maintaining Biodiversity in forest ecosystems. Hunter
MLJr (ed), Cambridge University Press, Cambridge,
pp400-433.
Nagaike T (2000) A review of ecological studies on plant
species diversity in plantation ecosystems. J Jpn For
Soc 82: 407-416. (in Japanese with English summary)
Nagaike T (2002) Differences in plant species diversity
between conifer (Larix kaempferi) plantations and
broad-leaved (Quercus crispula) secondary forests in
central Japan. For Ecol and Manage 168: 111-123.
Nakagawa M, Ito S (1997) Species richness of sugi
(Cryptomeria japonica D.Don) plantation forests.
Effect of stand age and site condisitons in the Miyazaki
University Forests. Bull Kyushu Br Jap For Soc 50: 87-
88 (in Japanese).
Nakagawa M, Ito S, Nogami K (1998) Effects of topography
and spatial arrangement on species composition of
shrub layer in sugi (Cryptomeria japonica D. Don)
plantations. Bull Kyushu Br Jpn For Soc 51:63-64 (in
Japanese).
17
Nyland RD (1996) Silviculture. Concepts and applications.
633pp McGrow-Hill, Singapore.
Ohwi J, Kitagawa M (1992) New flora of Japan. Shibundo
Co. Publishers, Tokyo (in Japanese).
Okuda S (1997) Wild plants of Japan (in Japanese).
Shougakukan, Japan (in Japanese).
Parrotta JA (1995) Influence of overstory composition on
understory colonization by native species in plantations
on a degraded tropical site. J Veg Sci 6: 627-636
Peterken GF (1993) Woodland conservation and
management. 2nd ed. 374pp, Chapman and Hall, London.
Peterken GF, Game M (1984) Historical factors affecting
the number and distribution of vascular plant species
in the woodlands of Central Lincolnshire. J Ecol 72:
155-182.
Sakai A, Ohsawa M (1994) Topographical pattern of the
forest vegetation on a river basin in a warmtemperate
hilly region, central Japan. Ecol Res 9: 269-280.
Sarlov-Herlin IL, Fry GLA (2000) Dispersal of woody plants
in forest edges and hedgerows in a Southern Swedish
agricultural area: the role of site and landscape structure.
Landscape Ecol. 15: 229-242.
Schoonmaker P, McKee A (1988) Species composition and
diversity during secondary succession of coniferous
forests in the western cascade mountains of Oregon.
For Sci 34: 960-979.
Silbaugh JM, Betters FR (1995) Quantitative biodiversity
measures applied to forests management. Environ Rev
3 : 277-285
Simmons EA, Buckley GP (1992) Ground vegetation
underplanted mixtures of trees. In The ecology of mixed-
stands of trees. Cannel MGR, Malcolm DC, Robertson
PA (eds.), Blackwell, Oxford, pp 221-231.
Solbrig OT (1994) Plant traits and adaptive strategies: their
role in ecosystem function., In Biodiversity and
ecosystem function. Schlze ED Mooney HA (eds.),
Springer – Verlag, Berlin. pp 97-116.
Son Y, Lee YY, Jun YC, Kim Z-S (2004) Light availability
and understory vegetation four years after thinning in
a Larix leptolepis plantation of central Korea. J For Res
9:133–139.
Steege H (1993) Patterns in Guyana. PhD thesis, Utrecht
University. Tropenbos Series no 3. Tropenbos,
Waganingen, The Netherlands.
Takeda A, Kimura H (1988) Forest types and the species
diversities of their woody plant in Mie Prefecture. J Jap
For Soc 70: 269-272 (in Japanese with English summary).
Thomas SC, Halpern CB, Falk DA, Liguori DA, Austin KA
(1999) Plant diversity in managed forests: understory
responses to thinning and fertilization. Ecol Appl 9:864–
879
Wallace HL, Good JEG (1995) Effects of afforestation on
upland plant communities and implications for
vegetation management. For Ecol Manage 79 : 29-46
Wallace HL, Good JEG, Williams G (1992) The effect of
afforestation on upland plant communities : An
application of the British National Vegetation
Classification. J Appl Ecol 29 : 180-194
Yamashita T, Matsuda A, Ito S, Nogami K (2000) Population
structure and dynamics of Quercus hondae Makino 2.
Topography and vegetation constraints for seedling
establishment. Proc 43rd Symposium IAVS, Nagano,
Japan, p.135.
18