climatic controls of a keystone understory species
TRANSCRIPT

HAL Id: hal-00930818https://hal.archives-ouvertes.fr/hal-00930818
Submitted on 1 Jan 2011
HAL is a multi-disciplinary open accessarchive for the deposit and dissemination of sci-entific research documents, whether they are pub-lished or not. The documents may come fromteaching and research institutions in France orabroad, or from public or private research centers.
L’archive ouverte pluridisciplinaire HAL, estdestinée au dépôt et à la diffusion de documentsscientifiques de niveau recherche, publiés ou non,émanant des établissements d’enseignement et derecherche français ou étrangers, des laboratoirespublics ou privés.
Climatic controls of a keystone understory species,Sasamorpha borealis, and an impact assessment of
climate change in JapanTsuyama, Nakao, Matsui, Higa, Horikawa, Kominami, Tanaka
To cite this version:Tsuyama, Nakao, Matsui, Higa, Horikawa, et al.. Climatic controls of a keystone understory species,Sasamorpha borealis, and an impact assessment of climate change in Japan. Annals of Forest Science,Springer Nature (since 2011)/EDP Science (until 2010), 2011, 68 (4), pp.689-699. �10.1007/s13595-011-0086-y�. �hal-00930818�
ORIGINAL PAPER
Climatic controls of a keystone understory species,Sasamorpha borealis, and an impact assessmentof climate change in Japan
Ikutaro Tsuyama & Katsuhiro Nakao & Tetsuya Matsui &Motoki Higa & Masahiro Horikawa & Yuji Kominami &Nobuyuki Tanaka
Received: 19 March 2010 /Accepted: 22 November 2010 /Published online: 27 May 2011# INRA and Springer Science+Business Media B.V. 2011
Abstract& Introduction The aims of this study were to identify theclimatic conditions controlling the distribution of Sasamorphaborealis and to assess the impact of climate change on thespecies in Japan.& Materials and methods The relationship between S.borealis distribution and climatic variables in the JapaneseArchipelago was explored using classification tree analysis.
Potential habitat maps under the current and future climateswere generated at about 1-km spatial resolution.& Results The model was highly accurate. Although snowcover has been thought to be the most important factorcontrolling S. borealis distribution, we revealed that thespecies requires high precipitation during the growingseason even in humid Japanese environments. Areas withhigh summer (May–September) precipitation (PRS) wereclassified as potential habitat irrespective of other climaticconditions. In areas with moderate PRS, potential habitatwas limited to cooler and less snow-covered areas and areaswith low PRS were classified as non-habitat. The highfitness of the predicted to the observed distributionssuggested that S. borealis could have survived throughoutthe Japanese Archipelago during the glacial period.& Conclusion In future climates, 29.0–39.1% of thecurrent potential habitat was predicted to change tonon-habitat due to increasing dryness in the growingseason. Areas with high precipitation remained a potentialhabitat for S. borealis.
Keywords Dwarf bamboo . Species distribution model .
Snow cover . Summer precipitation . Empty habitat
1 Introduction
Understanding species–environment relationships has alwaysbeen a central issue in ecology and biogeography, and thedominant role of climate in the distribution of organismshas been recognized (e.g., Woodward 1996). Effectivenatural ecosystems conservation and management requiresthat the climatic controls of current plant distributions beidentified and used to predict future plant distributions
Handling Editor: Gilbert Aussenac
Electronic supplementary material The online version of this article(doi:10.1007/s13595-011-0086-y) contains supplementary material,which is available to authorized users.
I. Tsuyama (*) :K. Nakao :M. Higa :N. TanakaDepartment of Plant Ecology,Forestry and Forest Products Research Institute,Matsunosato 1,Tsukuba, Ibaraki, Japan 3058687e-mail: [email protected]
T. MatsuiHokkaido Research Station,Forestry and Forest Products Research Institute,7 Hitsujigaoka, Toyohira-ku,Sapporo, Hokkaido, Japan 0628516
M. HorikawaToyota Biotechnology and Afforestation Laboratory,Toyota Motor Corporation,1099 Aza Marune, Oaza Kurozasa, Miyosi-cho,Nishikamo-gun, Aichi, Japan 4700201
Y. KominamiKansai Research Center,Forestry and Forest Products Research Institute,68 Nagaikyutaro, Momoyama-cho,Fushimi-ku, Kyoto, Japan 6120855
Annals of Forest Science (2011) 68:689–699DOI 10.1007/s13595-011-0086-y
under a warmer climate (Hannah et al. 2002). Thepotential magnitudes of future changes to plant distribu-tions will be important guides for efficient conservationpolicy development (e.g., choosing optimum species/sitesfor monitoring and preservation).
Globally averaged land-surface air and sea-surfacetemperatures rose by 0.74°C over the past hundred years(between 1906 and 2005) and are projected to rise 1.8–4.0°C by 2090–2099 (IPCC 2007). Global warming ispredicted to cause substantial changes in the structure andfunction of terrestrial ecosystems (Hannah et al. 2002).Several ecological phenomena including range shifts towardthe poles and advancement of spring events around theworld are hypothesized to have been caused by climatechange (Parmesan and Yohe 2003).
Species distribution models (SDMs) have been widelyused to identify the environmental factors that determinespecies’ distributions and predict potential habitat for thespecies. SDMs have recently been recognized as animportant tool for assessing the impact of environmentalchange. In Europe and the USA, numerous SDM studies havecharacterized a species’ habitat based on empirical relation-ships between observed species distributions and environ-mental variables (i.e., niche-based modeling approaches; e.g.,Pearson and Dawson 2003; Thuiller et al. 2005). In addition,some SDM studies have used other new approaches thatcharacterize a species’ habitat based on the response of thespecies to environmental conditions (i.e., process-basedmodeling approaches; e.g., Morin and Thuiller 2009). InEast Asia, however, few studies have applied SDM modelsusing niche-based modeling approaches, to say nothing ofprocess-based modeling approaches.
A keystone species is defined as biomass dominantwithin a functional group (Begon et al. 1996). Becausekeystone species have a disproportionate impact onecosystem function (Begon et al. 1996), these speciesshould be preferentially studied. Changes in keystonespecies habitat or biomass could have substantial impactson natural ecosystems.
Dwarf bamboos (Poaceae: Bambusoideae) are evergreenclonal shrubby plant species. They occur in East andSoutheast Asia and in South America. In montane andsubalpine zones, dwarf bamboos dominate the understoryand interfere with the growth of other plant species(Nakashizuka 1987).
In Japan, dwarf bamboo species prevalence corre-sponds to differences in snow accumulation on the western(Sea of Japan side) and eastern sides (Pacific Ocean side) ofJapan (Suzuki 1978). Dwarf bamboo sections Macrochlamysand Sasa of genus Sasa (Suzuki 1978) are adapted to asnowy climate and occur on the Sea of Japan side. Incontrast, dwarf bamboo taxa adapted to a less snowy climatesuch as genus Sasamorpha and section Crassinodi of
genus Sasa (Suzuki 1978) occur on the Pacific Ocean side.This difference in dwarf bamboo species between the Seaof Japan side and the Pacific Ocean side is one of the moststriking characteristics of Japanese forest vegetation.
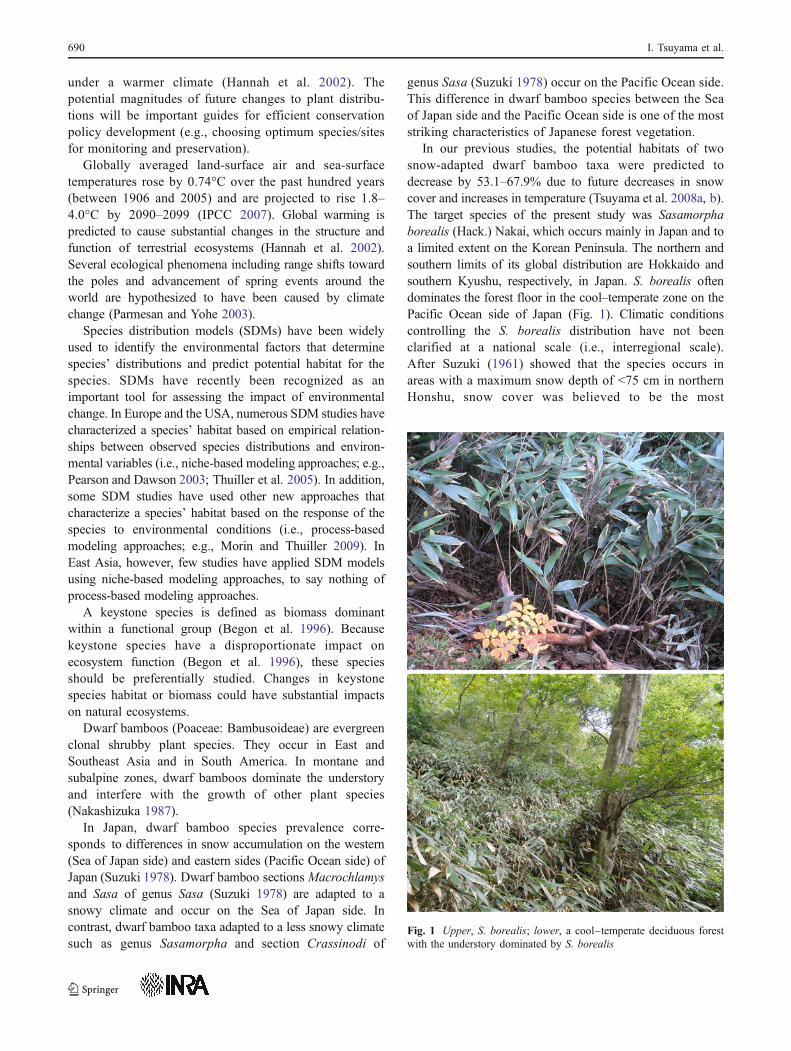
In our previous studies, the potential habitats of twosnow-adapted dwarf bamboo taxa were predicted todecrease by 53.1–67.9% due to future decreases in snowcover and increases in temperature (Tsuyama et al. 2008a, b).The target species of the present study was Sasamorphaborealis (Hack.) Nakai, which occurs mainly in Japan and toa limited extent on the Korean Peninsula. The northern andsouthern limits of its global distribution are Hokkaido andsouthern Kyushu, respectively, in Japan. S. borealis oftendominates the forest floor in the cool–temperate zone on thePacific Ocean side of Japan (Fig. 1). Climatic conditionscontrolling the S. borealis distribution have not beenclarified at a national scale (i.e., interregional scale).After Suzuki (1961) showed that the species occurs inareas with a maximum snow depth of <75 cm in northernHonshu, snow cover was believed to be the most
Fig. 1 Upper, S. borealis; lower, a cool–temperate deciduous forestwith the understory dominated by S. borealis
690 I. Tsuyama et al.

important factor controlling its distribution. Estimatedreductions in snow cover caused by climate change wouldfacilitate the expansion of S. borealis into currentlysnowy areas in Japan. Meanwhile, the lower and southernrange limits of the species would be expected to shiftupward or northward due to expected competition withwarm–temperate plants.
Previous studies have indicated that S. borealis influencesnot only the regeneration of other plants (Yuruki et al. 1977),but also animal fitness. For example, the sika deerdepends on S. borealis for food, especially in winter(Saruki et al. 2004). S. borealis also influences thepopulation density and diversity of birds, which use itsdense shrub cover for shelter (Hino 2006). These reportssuggest that S. borealis is a keystone species of Japanesecool–temperate forests. Furthermore, S. borealis providesecosystem services such as erosion and landslide control(Yuruki et al. 1977). Therefore, determining what controlsthe distribution of S. borealis and projecting the changesof habitat suitability under climate change are importantfor forest ecosystems conservation and management.
Morin and Thuiller (2009) argued that the combined useof both niche- and process-based modeling approaches,which are built on different principles, is crucial to obtainingmore robust and accurate results when assessing the impactof climate change on plant distributions. Niche-based modelscharacterize a species’ habitat based on realized niche, whichmay not represent the physiological limits on a species’distribution (Pearson and Dawson 2003). One of the mainadvantages of niche-based models is their relative simplicity,which allows them to be applied easily to a large number ofspecies. The main criticisms of these models are thatvalidation is difficult and the predictions have a highuncertainty (Morin and Thuiller 2009). On the other hand,process-based models aim to identify the fundamental nichethat represents the limits on a species’ distribution, but isnot realized. Process-based models enable processesinvolved in range shifts or extinction to be highlighted,but their calibration requires a large amount of ecophysiolog-ical knowledge and data, and intraspecies variation makesdefining precise limits to a species’ climatic tolerance difficult(Pearson and Dawson 2003).
In this study, as the ecophysiological data available forthe target species were limited, we only used a niche-basedmodeling approach. However, we extracted ecologicalmeaning from the SDM and discussed the results in relationto the known ecological traits of S. borealis.
The objectives of this study were to determine:
1. The climatic conditions controlling the distribution ofS. borealis
2. The vulnerable and sustainable potential habitats of S.borealis under different climate change scenarios
2 Materials and methods
2.1 Study area and distribution data for S. borealis
The study area included all of Japan except areas that were notmodeled in the future climate change scenarios (Fig. S1). Thespatial resolution was 30″ N×45″ E (ca. 1×1 km), referredto as Third Mesh cells in Japan. In total, 361,379 cells wereused in this analysis.
Distribution data for S. borealis were extracted from thePhytosociological Relevé Database (PRDB; Tanaka 2007)and digitized Suzuki’s distribution data (SDD; Suzuki 1978).PRDB is a database composed of plot (relevé) data collectedthroughout Japan using the phytosociological method. Therelevé data were digitized into PRDB from a variety ofsources including published and unpublished literature, aswell as original data collected in the field (Tanaka 2007).
A relevé datum includes community structure andspecies names and their dominance in each layer of a plot.As of 2008, PRDB had 22,653 relevés digitized. Theserelevé data were obtained from 1948 to 1999 with 95% ofthe relevés obtained between 1968 and 1987. Data wererecorded in third mesh cells when their location could bedetermined within ten connecting cells or a 5 km radius.
We extracted 15,809 presence/absence distribution datapoints for S. borealis from PRDB. To prevent repetition, onlyone record was included per third mesh cell (ca. 1×1 km)×100 m in elevation. When more than one presence recordwas obtained for the spatial unit, only one presence wasrecorded regardless of the existence of an absence record.When no presence record was obtained for a spatial unit, butan absence occurred, then an absence was recorded. Afterthis thinning of the data, 702 presence and 8,430 absencerecords were obtained (Fig. 2). Hereafter, these presence/absence data are referred to as the “training data.”
To validate the accuracy of the model, the predicteddistribution of S. borealis was compared to SDD. SDDbased on a dot map represent the distribution of allJapanese Bambusoideae at a spatial resolution of about10×10 km (Suzuki 1978). Presence dots in the map wereconverted into a dataset structured by second mesh cells,each measuring 5′ in latitude and 7′ 30″ in longitude(ca. 10×10 km). The number of presence second meshcells for S. borealis was 185 (Fig. S2).
2.2 Current climatic data
In addition to climatic factors, plant distribution is alsocontrolled by factors such as soil type and topography(Woodward 1996). Because the aim of this study was toidentify the climatic controls and assess the impact ofclimate change on S. borealis at a national scale, onlyclimatic factors were used to develop the species distribu-
Drivers of S. borealis distribution and climate change 691

tion model. Although anthropogenic effects such asurbanization and cultivation may also be influential, landuse variables were omitted because S. borealis mainlygrows in mountainous regions with relatively little humaninfluence.
Third mesh climatic data from the Japan MeteorologicalAgency (1996) were used to model the current distributionof S. borealis. The dataset is based on meteorologicaltemperature observations collected between 1953 and 1982and precipitation data collected between 1953 and 1976.The climatic data for each relevé were extracted from themesh climatic data by matching the third mesh code.Monthly mean temperature for each relevé was adjustedbased on the elevational difference between relevés and thethird mesh cells by using monthly lapse rates.
The following five climatic factors used in the modelsare important for plant growth and survival. The warmthindex (WI), defined as the annual sum of positive differ-ences between the monthly mean temperature and +5°C(Kira 1991), is a measure of effective heat quantity requisitefor plant growth. WI is one of the most useful variables forexplaining the vegetation patterns of East Asia (Kira 1991).The monthly mean of daily minimum temperature of thecoldest month (TMC) is a measure of extreme cold,which controls the altitudinal or northern range limit ofevergreen broad-leaved forests (Ohsawa 1993). Summer(May–September) precipitation (PRS) is a measure ofgrowing season water supply. Maximum snow water
equivalent (MSW) is a measure of snow accumulation,and winter (November–April) rainfall (WR) is a measureof winter water supply.
MSWandWRwere calculated by aggregating daily changesof snowfall, rainfall, and meltwater (degree–day method),based on the daily climatic dataset supplied from theAutomated Meteorological Data Acquisition System andthe mesh climatic data (see Kominami et al. 2005).
2.3 Climate change scenarios
For the impact assessment of climate change, we applied aRegional ClimateModel with a spatial resolution of 20×20 km(hereafter, RCM20; Japan Meteorological Agency 2004)and the Model for Interdisciplinary Research on Climate(hereafter, MIROC; K-1 Model Developers 2004). TheRCM20 scenario was generated using a Regional SpectralModel exclusively for Japan based on the A2 scenarios fromthe Special Report on Emissions Scenarios (SRES), whichassume increasing population, low economic growth, andtechnological change (Japan Meteorological Agency 2004).The RCM20 scenario for 2081–2100 was spatially interpo-lated into the Second Mesh cells using the inverse-distance-weighted interpolation method (Yokozawa et al. 2003). Itwas then further interpolated spatially into the third meshcells (Tsuyama et al. 2008a).
The MIROC scenario was generated using the Atmo-sphere–Ocean Coupled General Circulation Model based
Fig. 2 Horizontal and verticaldistributions of S. borealis basedon the training data. Solid andopen circles show the presenceand absence, respectively, of S.borealis
692 I. Tsuyama et al.

on SRES scenario A1B, which assumes rapid econom-ic growth, quick spread of new and efficient technol-ogies, and a balanced emphasis on all energy sources(K-1 Model Developers 2004). This scenario for 2081–2100 was spatially interpolated from about 1.125° to the thirdmesh cells using the inverse distance-weighted interpolationmethod (Yokozawa et al. 2003).
The five climatic variables in each third mesh cell werecalculated using the RCM20 and MIROC scenarios in thesame manner as the current climate. Comparing the currentclimate to the RCM20 and MIROC scenarios within thestudy area, the average annual temperature increased from10.5°C to 13.3°C and 14.8°C, respectively, and thefollowing changes (current climate to the RCM20 andMIROC scenarios) were observed in each climatic variable:WI 86.9 to 110.9 and 127.4, TMC −6.0°C to −3.0 and −1.4°C,PRS 1,038 to 1,220 and 1,304 mm; MSW 159.0 to 82.7 and9.0 mm; and WR 491 to 539 and 668 mm (Fig. S3).
2.4 Species distribution model
A classification tree model (Clark and Pregibon 1992) wasused to analyze the importance and threshold of eachclimatic variable in determining the spatial distribution of S.borealis. A classification tree model is a recursive datapartitioning algorithm. The dataset is iteratively split intosubsets based on the typical value of a predictor variable,which minimizes the deviance of subsets. The partitioningprocess is repeated until each subset becomes relativelyhomogeneous. A tree model provides a hierarchical view ofthe relationships between species and environmental vari-ables and allows finding interactions and hierarchicalrelations among environmental variables. The model isone of the few methods that can model interactive effects oftwo or more variables and can represent them in an easilyreadable fashion.
Presence/absence data of S. borealis were used as aresponse variable and the five climatic variables wereused as explanatory variables. The most appropriate treesize in the classification tree model was obtained aftercross-validation to avoid over- or under-fitting of themodel (Clark and Pregibon 1992). Deviance-weightedscores (DWS), defined as the sum of the reduction ofdeviance between parent nodes and children nodes(Matsui et al. 2004), were calculated to evaluate theimportance of each explanatory variable. S-PLUS6.2 J(Mathsoft Inc.) was used for this analysis.
2.5 Validation of the species distribution modeland computation of potential habitat
Model performance was evaluated by two methods. Thearea under the curve (AUC) of the receiver operating
characteristic (ROC; Metz 1978) was calculated based onpredicted presence/absence data and the validation databootstrapped from all of the training data with 100repetitions. In addition, we calculated model sensitivitybased on the predicted presence/absence data and anotherdataset (SDD). Although these methods have beencommonly used for validating SDMs, they tend tooverestimate the model fit because spatial autocorrelationinherently exists between the training and validationdatasets (Morin and Thuiller 2009).
The ROC curve is obtained by plotting sensitivity (i.e.,the true positive rate) versus 1 specificity (i.e., the false-positive rate) with various probability thresholds. Given themany factors that influence the actual distribution of species,maximizing the fit between predicted suitabilities and theobserved distribution is likely to underestimate the extent ofpotential habitat (Pearson et al. 2004). Therefore, to minimizethe false-negative fraction (the proportion of false-negativepredictions vs. the number of actual positive sites), wedefined a threshold value by assigning a cutoff sensitivity asrecommended by Pearson et al. (2004). In this study, weapplied the threshold of occurrence probability defined bysensitivity values of 95%. The threshold was definedbased on model predictions for the entire training dataset.We defined areas with probabilities greater than or equalto the threshold probability as potential habitat and areaswith probabilities smaller than the threshold value asnon-habitat.
Potential habitat was divided into suitable and marginalhabitat. To define the suitable habitat for S. borealis,the optimum probability threshold was identified byspecifying the nearest occurrence probability to the idealpoint (top-left corner) of the ROC curve. Suitable habitatwas defined as areas with occurrence probabilitiesgreater than or equal to the optimal threshold probabilityand most of these areas coincided with the observeddistribution of the species. Marginal habitat, defined asareas with occurrence probabilities lower than theoptimal threshold probability (Tsuyama et al. 2008a),included areas where climatic conditions were not so suitablefor species growth, and therefore, the chance of occurrence ordominance was relatively low (Tsuyama et al. 2008a).
Based on the classification tree model, potentialhabitat under the current and future climate waspredicted. Empty habitat, areas of potential habitatunder current climatic conditions but where the specieswas not present, was also identified. To evaluate theimpact of climate change on the distribution of S.borealis, the areas of suitable and marginal habitat undercurrent and future climatic conditions were compared. Toevaluate the effect of migration ability of the species,potential habitat was predicted assuming full and nomigration ability.
Drivers of S. borealis distribution and climate change 693

3 Results
3.1 Distribution pattern of S. borealis
S. borealis occurs on the Pacific Ocean side of Japan,from Hokkaido to Kyushu, in the training data andSDD (Fig. 2 and Fig. S2). From Tohoku northward, S.borealis occurs at low to middle (ca. 1,000 m) elevations,whereas in the Chubu Mountains, it occurs at low to high(ca. 2,000 m) elevations. From the Kii Peninsula westward(hereafter, western Japan), S. borealis occurs at elevationshigher than 1,000 m.
The ranges of climatic variables for 99% of the presencerecords in the training data were as follows: WI, 42.4–119.1;TMC, −11.4–0.45°C; PRS, 717.5–2,624.3 mm; MSW, 3.0–347.9 mm; and WR, 180.1–858.2 mm.
3.2 Prediction accuracy and threshold probabilityfor habitat category divisions
The tree diagram for S. borealis showed 20 terminal nodesafter optimal pruning based on cross-validation (Fig. 3).The mean value and standard deviation of the AUC were0.91±0.006 based on 100 replications of the ROC analysis.The AUC value was categorized as “excellent” according toSwets (1988). The sensitivity of the predicted potentialhabitat for SDD was 0.85 (158/185 records). Therefore, wejudged the model for S. borealis to be reasonably accurate.
The two threshold occurrence probabilities, defined by asensitivity value of 95% and the ROC analysis, were0.0068 and 0.123, respectively. Therefore, we defined theareas with probabilities larger than or equal to 0.0068 as
potential habitat; areas with probabilities smaller than0.0068 were defined as non-habitat. Potential habitat wasdivided into marginal habitat with 0.0068≤probability<0.123 and suitable habitat with a probability of ≥0.123.
3.3 Climatic factors and thresholds controlling S. borealisdistribution
PRS and WI accounted for larger DWS (37.4% and 32.2%of all DWS, respectively) than other variables (MSW,18.9%; WR, 6.0%; TMC, 5.5%). Climatic conditions ofpotential habitat for S. borealis differed depending on themagnitude of PRS (Fig. 3). Areas with a PRS greater than1,522.5 mm were classified as potential habitat irrespectiveof other climatic variable conditions (Fig. 3, right branchunder the first division of the tree diagram). For areas withPRS less than 1,522.5 mm, potential habitat was limited tothe areas in which MSW of <229.3 mm and WI of <98.3(nodes C, G, H, J, M, N, and P). Areas with PRS less than715.5 mm were classified as non-habitat (node T). Areaswith PRS of <1,522.5 and MSW of ≥229.3 mm (node S),and areas with PRS of <1,522.5 mm, MSW of <229.3 mm,and WI of ≥98.3 (node R) were also classified as non-habitat. Of the records classified as suitable habitat,95.7% (1,962/2,050 records) had the following climaticconditions: PRS of ≥715.5 mm, WI of <87.0–98.3, andMSW of <229.3–263.9 mm.
3.4 Current potential habitat of S. borealis
The distribution of predicted potential habitat was similar tothat based on the training data and SDD. Suitable habitat
Fig. 3 The classification treemodel for S. borealis. Start fromthe top node of the tree. If thedata meet the climatic conditionof the node, go left, otherwisego right. The number of terminalnodes after pruning was 20 fromA to T. The numbers writtenbeneath each node show theoccurrence probability and nunder the climatic conditions ofeach node. The terminal nodesenclosed by the solid lineindicate suitable habitat andthose enclosed by the dashedline show marginal habitat.Other terminal nodes areconsidered non-habitat. Thenumbers in parentheses showthe number of data pointsclassified into the node
694 I. Tsuyama et al.
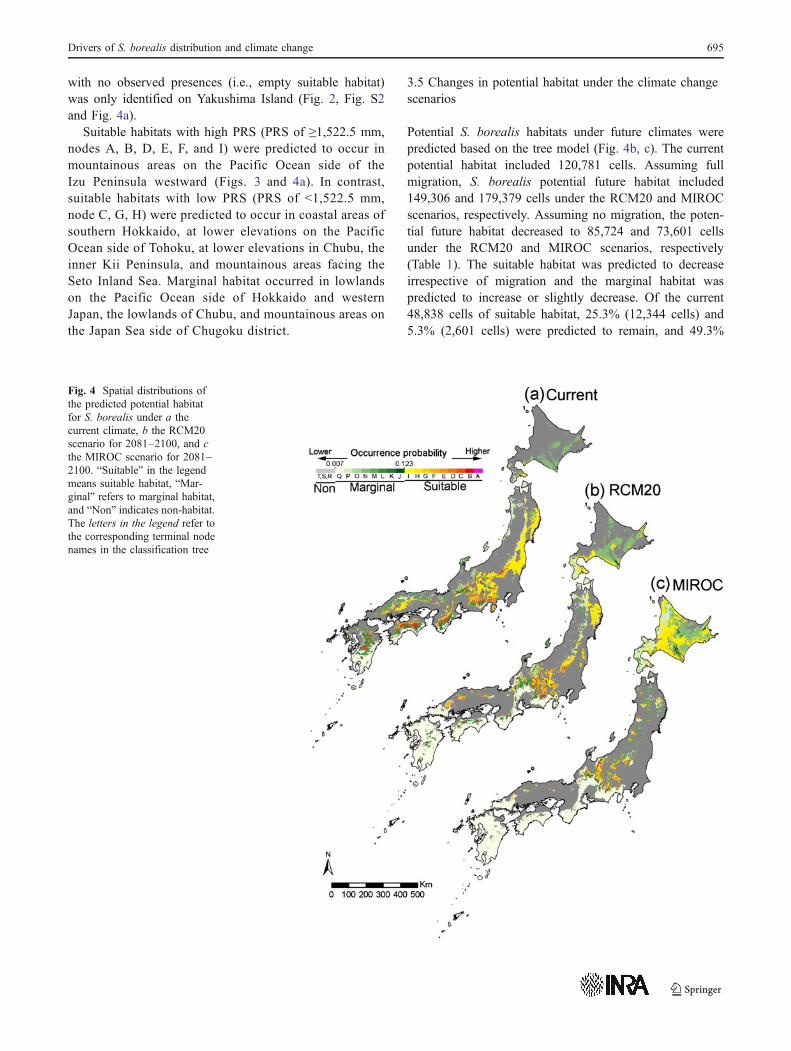
with no observed presences (i.e., empty suitable habitat)was only identified on Yakushima Island (Fig. 2, Fig. S2and Fig. 4a).
Suitable habitats with high PRS (PRS of ≥1,522.5 mm,nodes A, B, D, E, F, and I) were predicted to occur inmountainous areas on the Pacific Ocean side of theIzu Peninsula westward (Figs. 3 and 4a). In contrast,suitable habitats with low PRS (PRS of <1,522.5 mm,node C, G, H) were predicted to occur in coastal areas ofsouthern Hokkaido, at lower elevations on the PacificOcean side of Tohoku, at lower elevations in Chubu, theinner Kii Peninsula, and mountainous areas facing theSeto Inland Sea. Marginal habitat occurred in lowlandson the Pacific Ocean side of Hokkaido and westernJapan, the lowlands of Chubu, and mountainous areas onthe Japan Sea side of Chugoku district.
3.5 Changes in potential habitat under the climate changescenarios
Potential S. borealis habitats under future climates werepredicted based on the tree model (Fig. 4b, c). The currentpotential habitat included 120,781 cells. Assuming fullmigration, S. borealis potential future habitat included149,306 and 179,379 cells under the RCM20 and MIROCscenarios, respectively. Assuming no migration, the poten-tial future habitat decreased to 85,724 and 73,601 cellsunder the RCM20 and MIROC scenarios, respectively(Table 1). The suitable habitat was predicted to decreaseirrespective of migration and the marginal habitat waspredicted to increase or slightly decrease. Of the current48,838 cells of suitable habitat, 25.3% (12,344 cells) and5.3% (2,601 cells) were predicted to remain, and 49.3%
Fig. 4 Spatial distributions ofthe predicted potential habitatfor S. borealis under a thecurrent climate, b the RCM20scenario for 2081–2100, and cthe MIROC scenario for 2081–2100. “Suitable” in the legendmeans suitable habitat, “Mar-ginal” refers to marginal habitat,and “Non” indicates non-habitat.The letters in the legend refer tothe corresponding terminal nodenames in the classification tree
Drivers of S. borealis distribution and climate change 695

(24,099) and 64.3% (31,422) were predicted to change tonon-habitat under the RCM20 and MIROC scenarios,respectively.
The potential habitat predicted to change to non-habitatunder the future climates was located in areas of low PRS,such as the Pacific Ocean side of Tohoku, lower elevationsof Chubu, and mountainous areas facing the Seto InlandSea (Fig. S4). In contrast, the potential habitat predicted tochange to suitable habitat occurred in coastal areas ofsouthern Hokkaido, higher elevations on the Pacific Oceanside of Honshu southward, and higher elevations inChugoku district.
Comparing the latitudinal distribution of suitable habitatunder the current climate with those under the RCM20 andMIROC scenarios, suitable habitat shifted poleward through-out Japan (the median rates under the RCM20 scenario: about35 km/°C, MIROC: about 172 km/°C; Figs. 4 and 5). From
Tohoku southward, the suitable habitat shifted to higherelevations (the median rates under the RCM20 scenario:about 120 m/°C, MIROC: about 165 m/°C).
4 Discussion
We identified the most important climatic variables and thethresholds controlling the distribution of S. borealis usingthe classification tree model, high-resolution (ca. 1 km)climatic data, and a nationwide relevé database. Becausethis species occurs mainly in Japan, with small remotepopulations also located on the Korean Peninsula, a modelbased on Japanese distribution data is appropriate foridentifying the main habitat conditions. The high accuracyof the model suggested that the distribution of S. borealis ata national scale can be explained by climatic variables.
Table 1 The number of third mesh cells of potential habitat, suitable habitat, and marginal habitat for S. borealis under the current climate and the2081–2100 climates, under conditions of no and full migration
Climate scenarios Migration Potential habitat Suitable habitat Marginal habitat
Current – 120,781 (100) 48,838 (100) 71,943 (100)
RCM2O (2081–2100) No 85,724 (71.0) 20,743 (42.5) 64,981 (90.3)
Full 149,306 (123.6) 34,253 (70.1) 115,053 (160.0)
MIROC (2081–2100) No 73,601 (60.9) 10,403 (21.3) 63,198 (87.8)
Full 179,379 (148.5) 44,497 (91.1) 134,882 (187.5)
Percentages of each habitat type to the current extent of the habitat type are shown in parentheses
Fig. 5 Vertical distributions ofpotential habitat for S. borealisunder a the current climate, bthe RCM20 scenario for 2081–2100, and c the MIROC scenar-io for 2081–2100. Black circlesindicate suitable habitat, darkgray circles represent marginalhabitat, and gray circles refer tonon-habitat
696 I. Tsuyama et al.

4.1 Climatic conditions controlling the distributions of S.borealis
Due to Japan’s wet and humid climate, previous studieshave assumed that precipitation was not an important factorinfluencing the distribution of plant species (Ohsawa 1993).Previous studies have also indicated that maximum snowdepth (MSD) was the most important factor controllingS. borealis (Suzuki 1961). In contrast, our study revealedthat PRS was the most important factor controlling S.borealis habitat suitability. MSW contributed to S. borealisdistributions at more local scales (Fig. 3).
Based on regional studies in northeastern Honshu(ca. 500–600-km scale), Suzuki (1961) proposed thatonly MSD determined S. borealis’s range. On a nationalscale, however, MSD was not sufficient to explain thedistribution of S. borealis. Climatic conditions controllingthe regional distribution of a species cannot necessarily beextrapolated to larger scales or other regions becauseregional-scale controlling factors vary with environmentalconditions at larger scales (Pearson and Dawson 2003). Infact, the theory of Suzuki (1961) was applicable to theconditions of PRS of <1,522.5 mm in the classification treediagram for S. borealis (Fig. 3). Assuming that the snowdensity is between 0.3 and 0.4 gcm−3, the second division inthe classification tree, MSW of <229.3 mm, is equivalent toMSD of <57.3–76.4 cm. This value is in close agreementwith the theory of Suzuki (1961) that S. borealis occurs inareas with MSD of <75 cm.
We found that S. borealis requires heavy precipitationduring the growing season (more than 715.5 mm). Theecological traits of S. borealis, including large leaf-area,competitiveness, preference for cool or wet habitats,shallow roots, and low mobility (Yuruki et al. 1977), arefeatures common to taxa predisposed to drought impact(Archaux and Wolters 2006). In low PRS areas, thisspecies only occurs on steep slopes (Suzuki 1961). In highPRS areas, however, the species is found on almost alltopographies (Yuruki et al. 1977). These facts suggest thatS. borealis is not drought tolerant. We suggest that this isthe reason why PRS is the most important climatic factoraffecting the distribution of S. borealis under Japan’shumid climate.
The treemodel showed that aMSWvalue of 229.3mmwasthe threshold for the distribution of S. borealis in areas withPRS of <1,522.5 mm. Mechanical damage caused by snowpressure (e.g., snow settlement, glide, and creep pressure)and/or short growing season are considered to be directlimiting factors. In addition, a WI of 98.3 was thethreshold condition in areas with PRS of <1,522.5 mmand MSW of <229.3 mm. Dryness in the growing seasoncaused by increased WI is expected to be the directlimiting factor.
4.2 Potential habitat and observed distributions of S.borealis
The projected potential habitat for S. borealis was in goodagreement with the actual distribution of the species basedon training data and SDD (Fig. 2, Fig. S2 and Fig. 4).Empty suitable habitat, suitable areas based on currentclimatic conditions but where the species was not present,was only projected to occur in mountainous areas ofYakushima Island. S. borealis may not have been able todisperse to Yakushima Island because of the island’sdistance from the main island.
The empty suitable habitat for S. borealis was conspicu-ously smaller than those of snow-adapted dwarf bamboosin sections Sasa and Macrochlamys. Empty suitablehabitat for Sasa was projected in mountainous areas ofthe Kii Peninsula and southern Chubu, and that forMacrochlamys was projected in mountainous areas ofShikoku and central Chubu, in addition to the areas forSasa (Tsuyama et al. 2008a, b). In view of these results,we hypothesized that S. borealis could survive throughoutJapan during the cooler and drier glacial period. Summerprecipitation during the glacial period is thought to havebeen higher than the tolerance limit of S. borealis.Meanwhile, snow-adapted dwarf bamboos are hypothe-sized to have been more affected by cold and drought inwinter than S. borealis because of their high dependenceon snow-cover protection (e.g., insulation from cold anddrought, and moisture supply).
4.3 Identifying vulnerable and sustainable potential habitatsfor S. borealis
The area of potential habitat was predicted to increaseto 123.6–148.5% of current values under the futureclimate scenarios of 2081–2100 assuming S. borealiscan fully expand to occupy its new potential habitat(namely, full migration; Table 1, Fig. 4). In contrast, thepotential habitat was predicted to decrease to 60.9–71.0% ofits current extent assuming S. borealis does not migrate fromits current potential habitat (namely, no migration). The latterresults are considered to be more realistic because of theslow migration speed of the species (usually 1 m/year).
We identified vulnerable and sustainable habitats for S.borealis under the RCM20 and MIROC scenarios. Areaswith high PRS (PRS of ≥1,522.5 mm) were predicted to beless affected by climate change than areas with low PRS(PRS of <1,522.5 mm). Increases in WI are important inareas with low PRS (Fig. 3). Areas in which potentialhabitat changes to suitable habitat (i.e., sustainable habitatfor S. borealis) include the middle and high elevations onthe Pacific Ocean side of Japan, from Hokkaido to Kyushu(Fig. 4 and Fig. S4).
Drivers of S. borealis distribution and climate change 697
Suitable habitat for S. borealis was predicted to decreaseto 21.3–42.5% of the current area by 2081–2100, assumingno migration. Of the current 48,838 cells of suitable habitat,49.3–64.3% was predicted to change to non-habitat becauseof the increase in WI (Table 1, Fig. 4). These areas arevulnerable habitats for S. borealis and include the PacificOcean side of Tohoku, the lowlands of Chubu, andmountainous areas facing the Seto Inland Sea (Fig. S4).In these vulnerable areas, growth may become difficultdue to the water deficit caused by the increase in WI.Plant species that may potentially serve as alternatives toS. borealis in terms of ecological function include warm–temperate dwarf bamboos (e.g., section Nezasa). However,complete S. borealis replacement is expected to takehundreds or thousands of years because the migrationrates of dwarf bamboos are low. Thus, we suspect that S.borealis will vanish from these vulnerable habitats beforethe replacement is completed. Recent increases in thepopulations of sika deer would aggravate the decline of S.borealis because S. borealis is intolerant to grazing(Saruki et al. 2004). The structure and biodiversity of forestecosystems may be irrevocably altered by substantial changesin S. borealis biomass due to the synergistic effect of climatechange and grazing.
5 Conclusion
We developed an accurate SDM predicting the actualdistribution of S. borealis with little empty habitat. Themodel identified climatic variables and their thresholdvalues that determine the species’ distribution. Althoughsnow cover has been thought to be the most importantfactor controlling S. borealis distribution, the species’habitat is heavily affected by changes in growing seasonprecipitation (PRS), even under the Japanese humidclimate. Areas with high PRS (PRS of ≥1,522.5 mm)were classified as potential habitat irrespective of otherclimatic conditions. In areas with moderate PRS (715.5≤PRS<1,522.5 mm), potential habitat was limited to coolerand less snow-covered areas, and areas with low PRS(PRS of <715.5 mm) were classified as non-habitat. Theseresults were consistent with the ecophysiological traits ofS. borealis.
This model is useful for projecting future potentialhabitats with an uncertainty due to the variation in climatechange scenarios. Future species occurrence has anotheruncertainty because the occurrence will be determined bynot only habitat suitability but also ecological processesincluding migration and extinction of species. Developingmodels that include ecological processes and monitorvulnerable habitats for species are necessary for forestecosystem conservation.
Acknowledgments We thank Dr. Erin Conlisk for her usefulcomments and language help on this manuscript. We also thank theanonymous reviewer and the associate editor Gilbert Aussenac fortheir valuable comments. This study was funded by a program of theGlobal Environmental Research of Japan (S-4 and S-8), the Ministryof the Environment.
References
Archaux F, Wolters V (2006) Impact of summer drought on forestbiodiversity: what do we know? Ann For Sci 63:645–652
Begon M, Harper J, Townsend C (1996) Ecology: individuals,populations and communities, 3rd edn. Blackwell Science,Oxford, 1068 p
Clark L, Pregibon D (1992) Tree-based models. In: Chambers J,Hastie T (eds) Statistical Models in S. Wadsworth & Brooks/Cole,California, pp 377–419
Hannah L, Midgley G, Millar D (2002) Climate change-integratedconservation strategies. Glob Ecol Biogeogr 11:485–495
Hino T (2006) The impact of herbivory by deer on forest birdcommunities in Japan. Acta Zool Sin 52:684–686
IPCC (2007) Climate change 2007: the physical science basis.Contribution of Working Group I to the Fourth AssessmentReport of the Intergovernmental Panel on Climate Change.Cambridge University Press, Cambridge, 996 p
Japan Meteorological Agency (1996) Climatic normals for Japan. JapanMeteorological Business Support Center, Tokyo (In Japanese)
JapanMeteorological Agency (2004)MRI-RCM20. Global Environmentand Marine Department of Japan Meteorological Agency,Tokyo (In Japanese)
K-1 Model Developers (2004) K-1 coupled GCM (MIROC) description.K-1 Tech Rep 1:1–34
Kira T (1991) Forest ecosystems of east and southeast Asia in a globalperspective. Ecol Res 6:185–200
Kominami Y, Tanaka N, Endo Y, Niwano S (2005) Estimation ofsnow distribution under global warming using data from remoteweather stations (AMeDAS). J Agric Meteorol 60:445–450
Matsui T, Yagihashi T, Nakaya T, Tanaka N, Taoda H (2004) Climaticcontrols on distribution of Fagus crenata forests in Japan. J VegSci 15:57–66
Metz C (1978) Basic principles of ROC analysis. Semin Nucl Med8:283–298
Morin X, Thuiller W (2009) Comparing niche- and process-basedmodels to reduce prediction uncertainty in species range shiftsunder climate change. Ecology 90:1301–1313
Nakashizuka T (1987) Regeneration dynamics of beech forests inJapan. Vegetatio 69:169–175
Ohsawa M (1993) Latitudinal pattern of mountain vegetation zonationin southern and eastern Asia. J Veg Sci 4:13–18
Parmesan C, Yohe G (2003) A globally coherent fingerprint ofclimate change impacts across natural systems. Nature 421:37–42
Pearson RG, Dawson TP (2003) Predicting the impacts of climatechange on the distribution of species: are bioclimate envelopemodels useful? Global Ecol Biogeogr 12:361–371
Pearson RG, Dawson TP, Liu C (2004)Modelling species distributions inBritain: a hierarchical integration of climate and land-cover data.Ecography 27:285–298
Saruki S, Inoue S, Shiiba Y, Nagasawa H, Ohosaki S, Kubota K(2004) Distribution and growth situation of Suzutake(Sasamorpha borealis) damaged by grazing of Sika deer(Cervus nippon nippon) in Miyazaki Forest of KyushuUniversity: case study in 2003. Bull Kyushu Univ For 85:47–54(In Japanese with English summary)
698 I. Tsuyama et al.

Suzuki S (1961) Ecology of the Bambusaceous genera Sasa andSasamorpha in the Kanto and Tohoku districts of Japan, with specialreference to their geographical distribution. Ecol Rev 15:131–147
Suzuki S (1978) Index to Japanese Bambusaceae. Gakken, Tokyo, p384 (In Japanese)
Swets J (1988) Measuring the accuracy of diagnostic systems. Science240:1285–1293
Tanaka N (2007) PRDB (Phytosociological Relevé Data Base).Available from: http://www.ffpri.affrc.go.jp/labs/prdb/index.html.Accessed June 2008
Thuiller W, Lavorel S, Araújo M, Sykes M, Prentice I (2005) Climatechange threats to plant diversity in Europe. Proc Natl Acad SciUSA 102:8245–8250
Tsuyama I, Matsui T, Horikawa M, Kominami Y, Tanaka N (2008a)Habitat prediction and impact assessment of climate change on
dwarf bamboo of the section Sasa in Japan. Theory Appl GIS16:99–113 (In Japanese with English summary)
Tsuyama I, Matsui T, Ogawa M, Kominami Y, Tanaka N (2008b)Habitat prediction and impact assessment of climate change onSasa kurilensis in eastern Honshu, Japan. Theory Appl GIS16:11–25 (In Japanese with English summary)
Woodward F (1996) Climate and plant distribution. CambridgeUniversity Press, Cambridge, 188 p
Yokozawa M, Goto S, Hayashi Y, Seino H (2003) Mesh climate changedata for evaluating climate change impacts in Japan under graduallyincreasing atmospheric CO2 concentration. J Agric Meteorol59:117–130
Yuruki T, Aragami K, Inoue S (1977) Ecological studies ofSuzutake (Sasa borealis). Bull Kyushu Univ For 50:83–122(In Japanese with English summary)
Drivers of S. borealis distribution and climate change 699