enhancing the way we quantify and communicate … 2012 rockhold.pdfenhancing the way we quantify and...
TRANSCRIPT
This image cannot currently be displayed.
This image cannot currently be displayed.
Enhancing the way we quantify and communicate benefit to risk in the pre and post approval arena
Frank W. Rockhold, PhD, Senior Vice PresidentMarilyn A. Metcalf, PhD, Director, Benefit Risk EvaluationGlobal Clinical Safety and Pharmacovigilance, GlaxoSmithKline
BASS Meeting, Nov 6, 2012Savannah, GA
Today’s Discussion
Benefit to Risk is a Science and a Tool– Population level BR
– Patient level BR
The BR context matters– No Treatment v. Active Comparator BR
– Intervention v. Prevention BR
– Pre Market v. Post Market BR
Communication: It isn’t a useful BR analysis if no one understands it– NNT
– Relative Risk
– Risk Difference
Governance 2
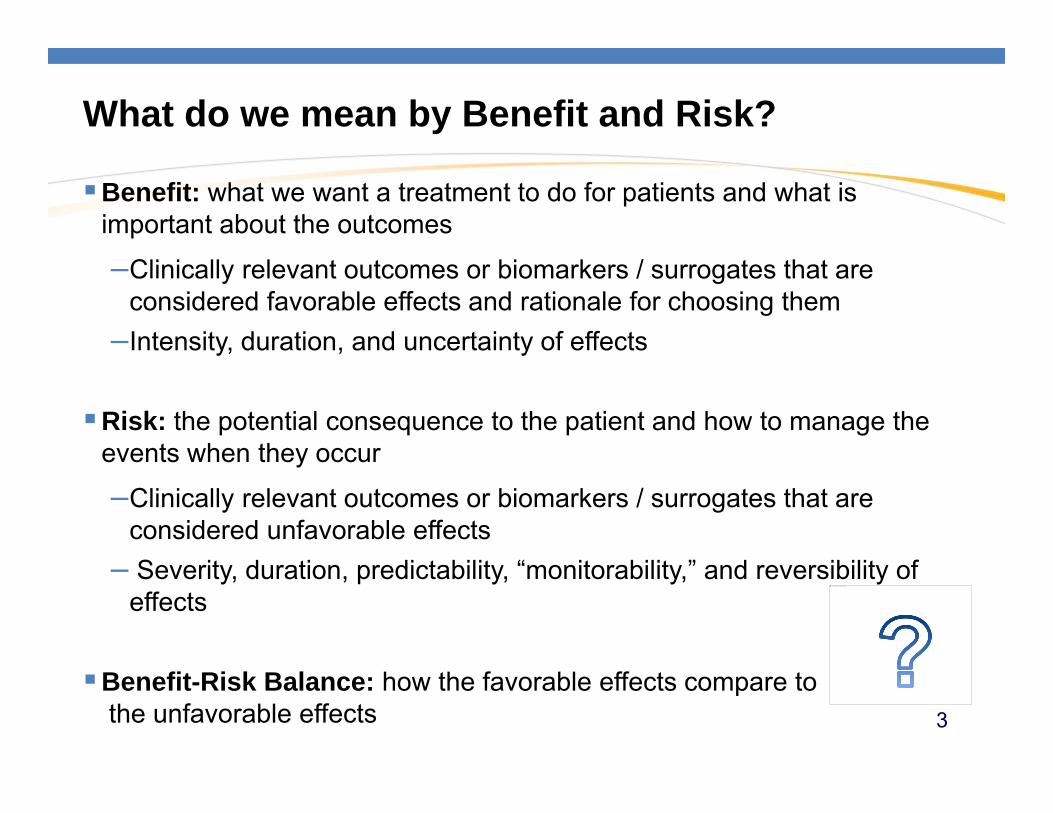
What do we mean by Benefit and Risk?
Benefit: what we want a treatment to do for patients and what is important about the outcomes
–Clinically relevant outcomes or biomarkers / surrogates that are considered favorable effects and rationale for choosing them
–Intensity, duration, and uncertainty of effects
Risk: the potential consequence to the patient and how to manage the events when they occur
–Clinically relevant outcomes or biomarkers / surrogates that are considered unfavorable effects
– Severity, duration, predictability, “monitorability,” and reversibility of effects
Benefit-Risk Balance: how the favorable effects compare to the unfavorable effects
This image cannot currently be displayed.
3
4
is image cannot currently be displayed.
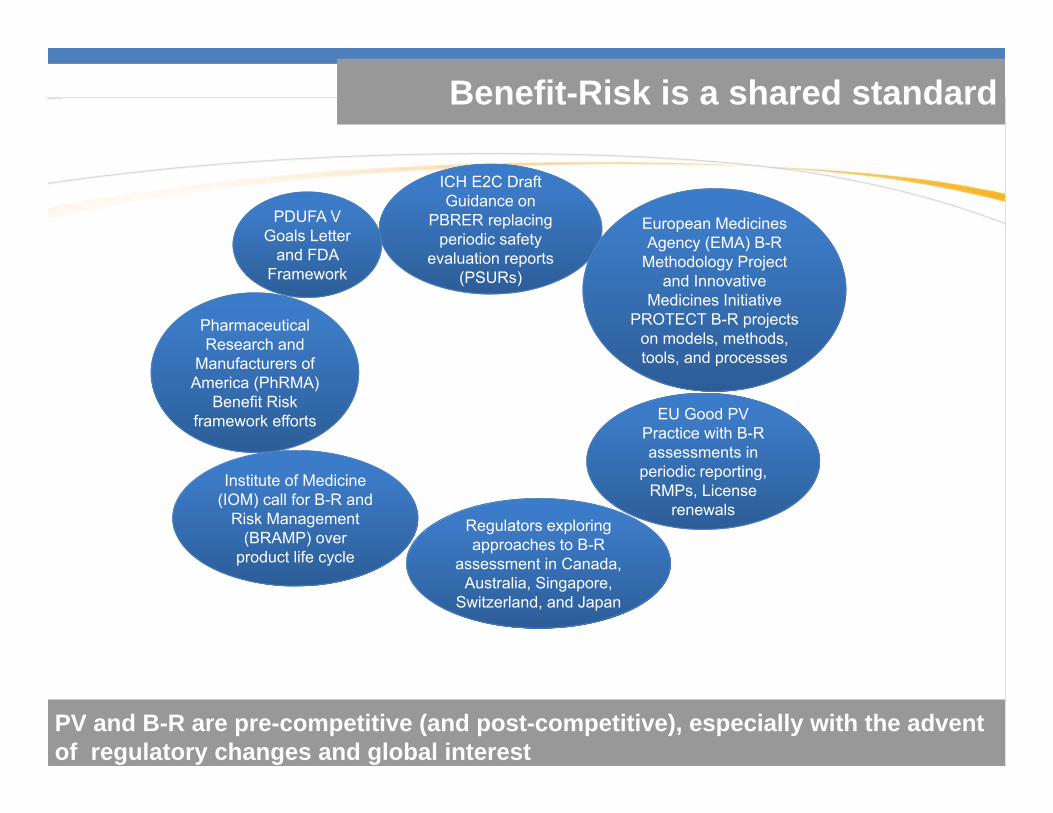
PV and B-R are pre-competitive (and post-competitive), especially with the advent of regulatory changes and global interest
Institute of Medicine (IOM) call for B-R and
Risk Management (BRAMP) over
product life cycle
Pharmaceutical Research and
Manufacturers of America (PhRMA)
Benefit Risk framework efforts
ICH E2C Draft Guidance on
PBRER replacing periodic safety
evaluation reports (PSURs)
Regulators exploring approaches to B-R
assessment in Canada, Australia, Singapore,
Switzerland, and Japan
European Medicines Agency (EMA) B-R
Methodology Project and Innovative
Medicines Initiative PROTECT B-R projects
on models, methods, tools, and processes
EU Good PV Practice with B-R assessments in
periodic reporting, RMPs, License
renewals
PDUFA V Goals Letter
and FDA Framework
Benefit-Risk is a shared standard
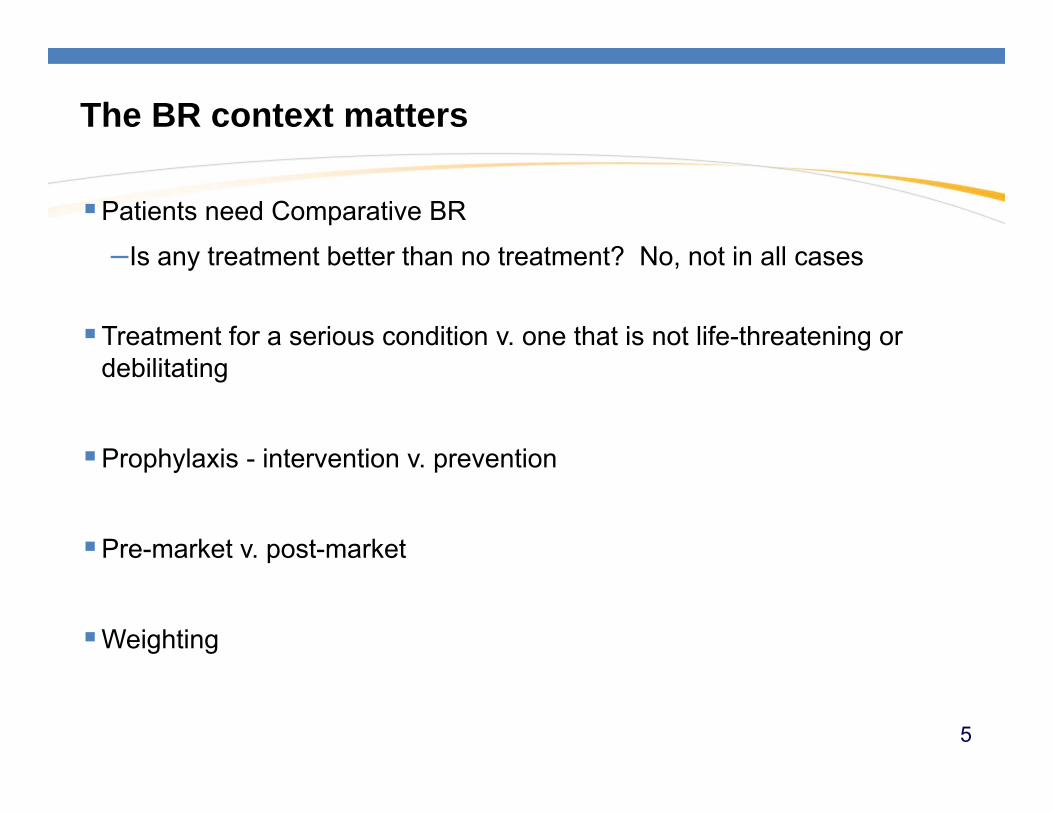
The BR context matters
Patients need Comparative BR
–Is any treatment better than no treatment? No, not in all cases
Treatment for a serious condition v. one that is not life-threatening or debilitating
Prophylaxis - intervention v. prevention
Pre-market v. post-market
Weighting
5
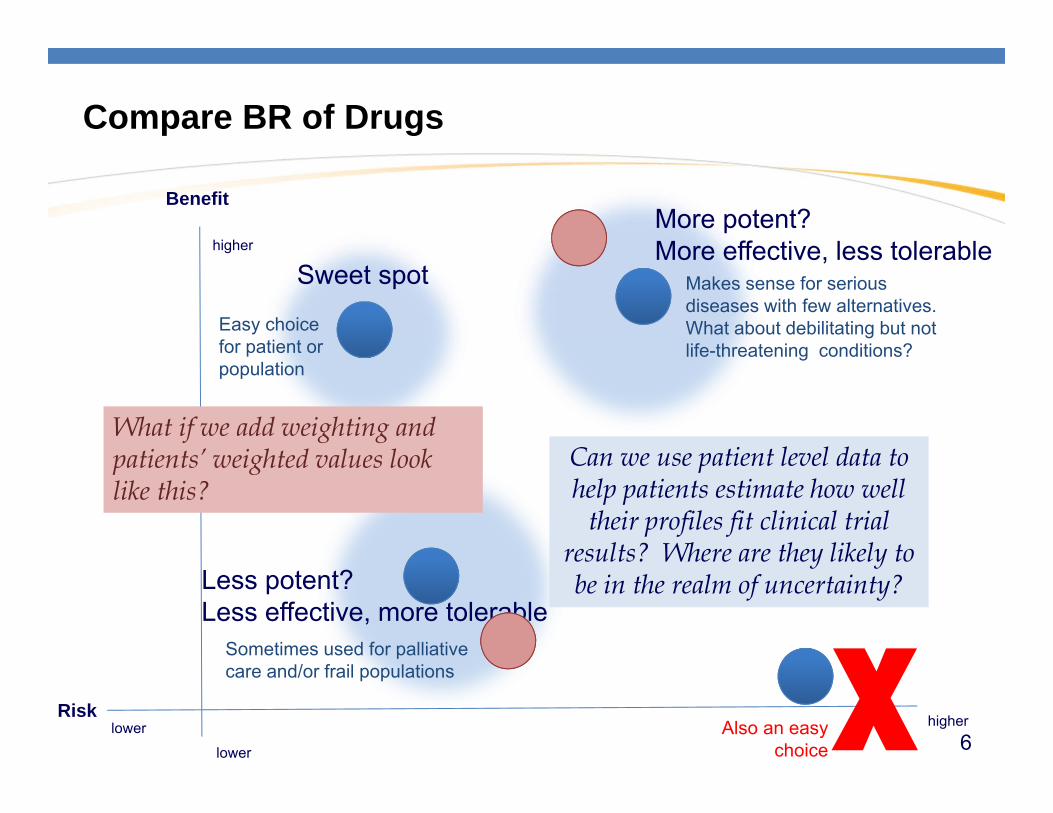
Compare BR of Drugs
Benefit
Risk higher
higher
lower
lower XLess potent?Less effective, more tolerable
Sweet spot
More potent?More effective, less tolerable
Can we use patient level data to help patients estimate how well
their profiles fit clinical trial results? Where are they likely to be in the realm of uncertainty?
Easy choice for patient or population
Makes sense for serious diseases with few alternatives.What about debilitating but not life-threatening conditions?
Sometimes used for palliative care and/or frail populations
Also an easy choice
What if we add weighting and patients’ weighted values look like this?
6
Moving from the population level to the patient level is not straightforward
7
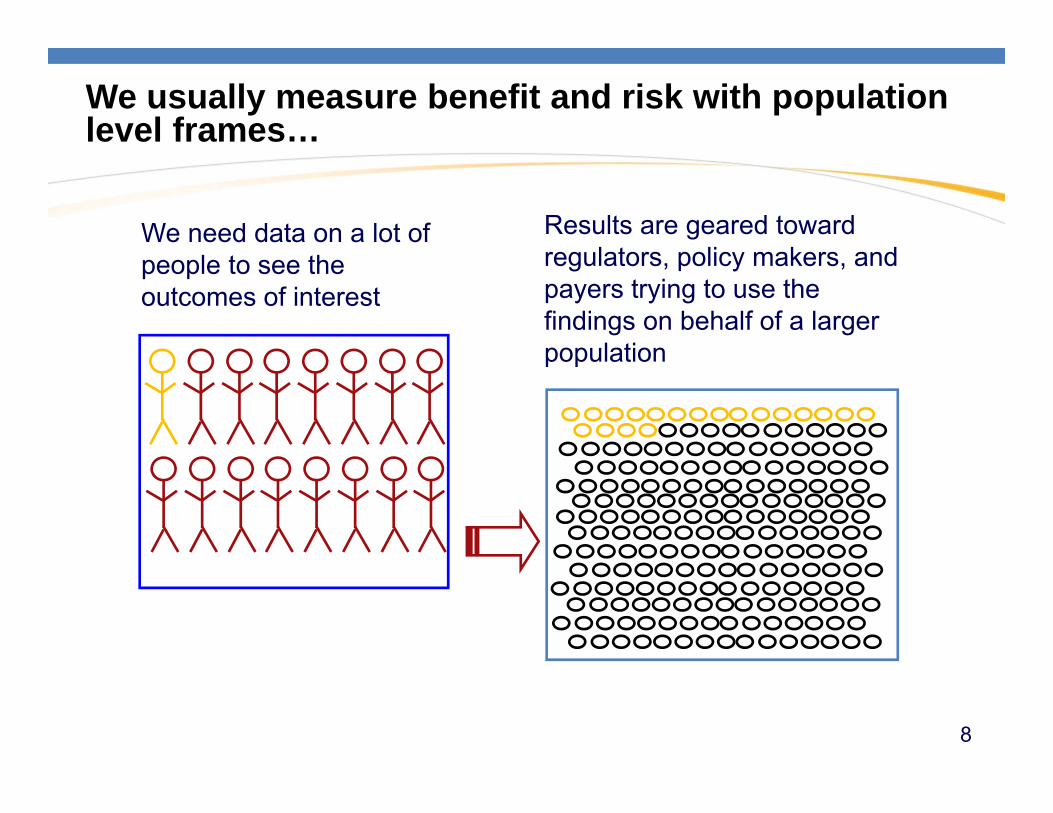
Results are geared toward regulators, policy makers, and payers trying to use the findings on behalf of a larger population
We need data on a lot of people to see the outcomes of interest
We usually measure benefit and risk with population level frames…
8
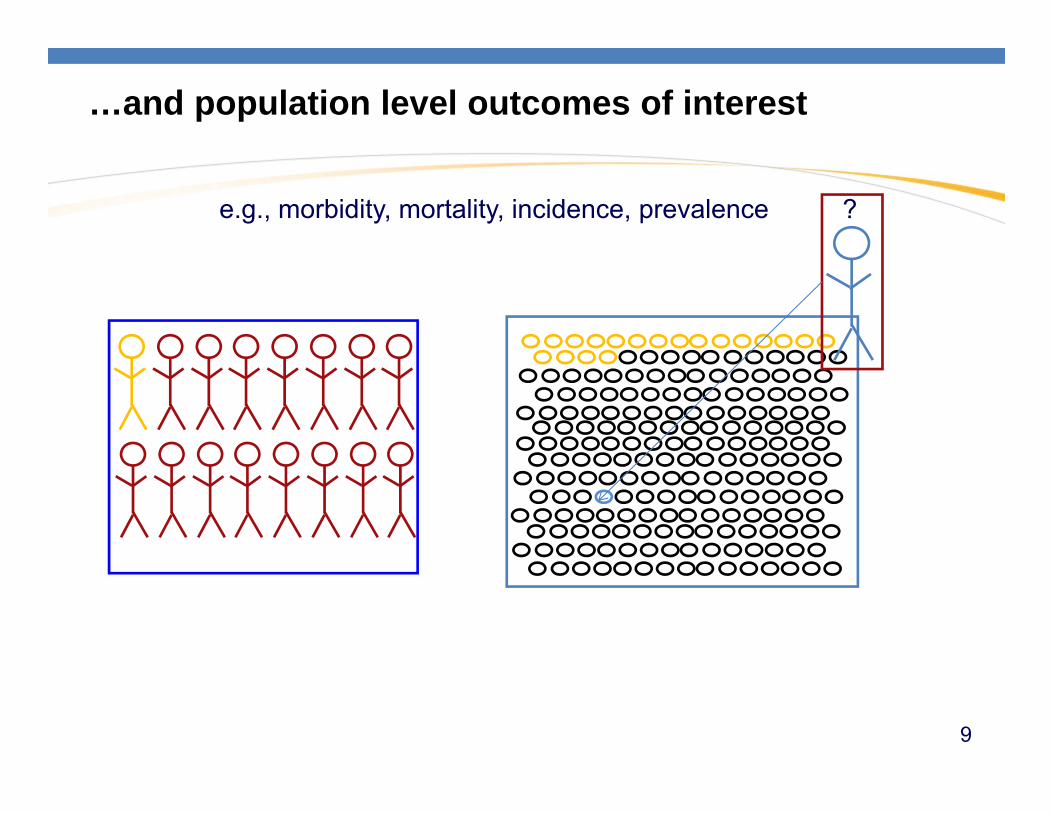
…and population level outcomes of interest
e.g., morbidity, mortality, incidence, prevalence ?
9
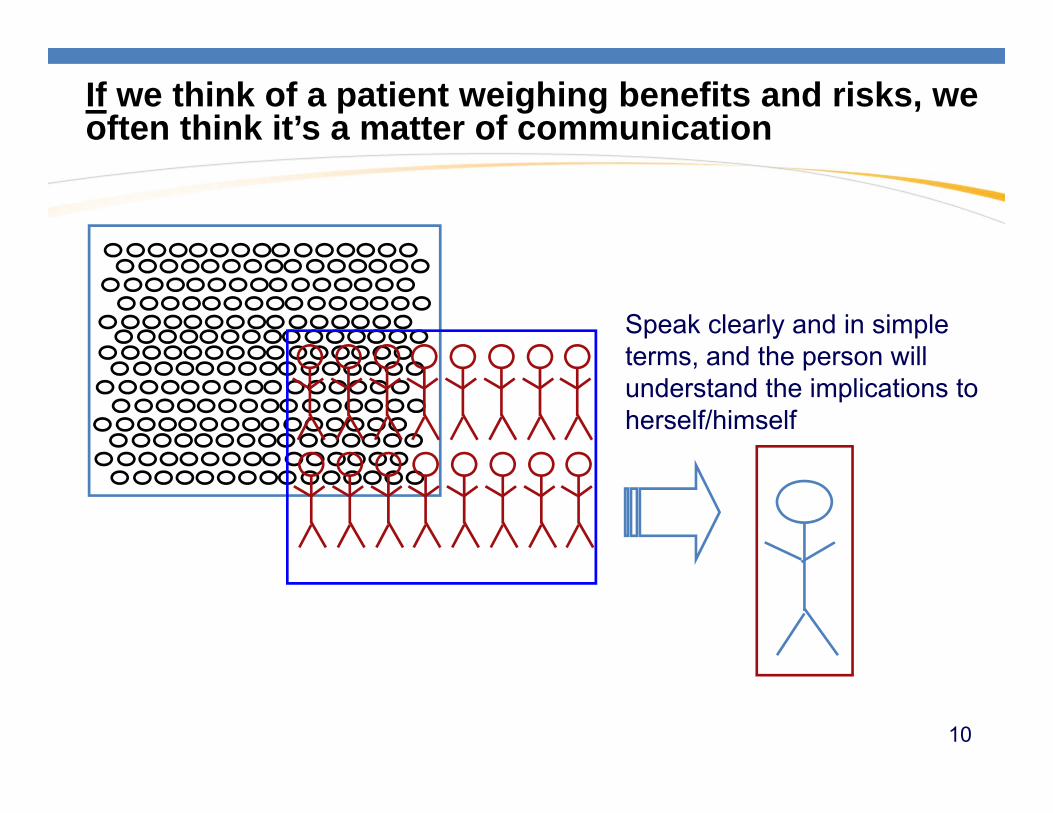
If we think of a patient weighing benefits and risks, we often think it’s a matter of communication
Speak clearly and in simple terms, and the person will understand the implications to herself/himself
10
11
Well of course it’s not just about saying it simply,
…it’s about having more to say.
So where do we start?
At the beginning!
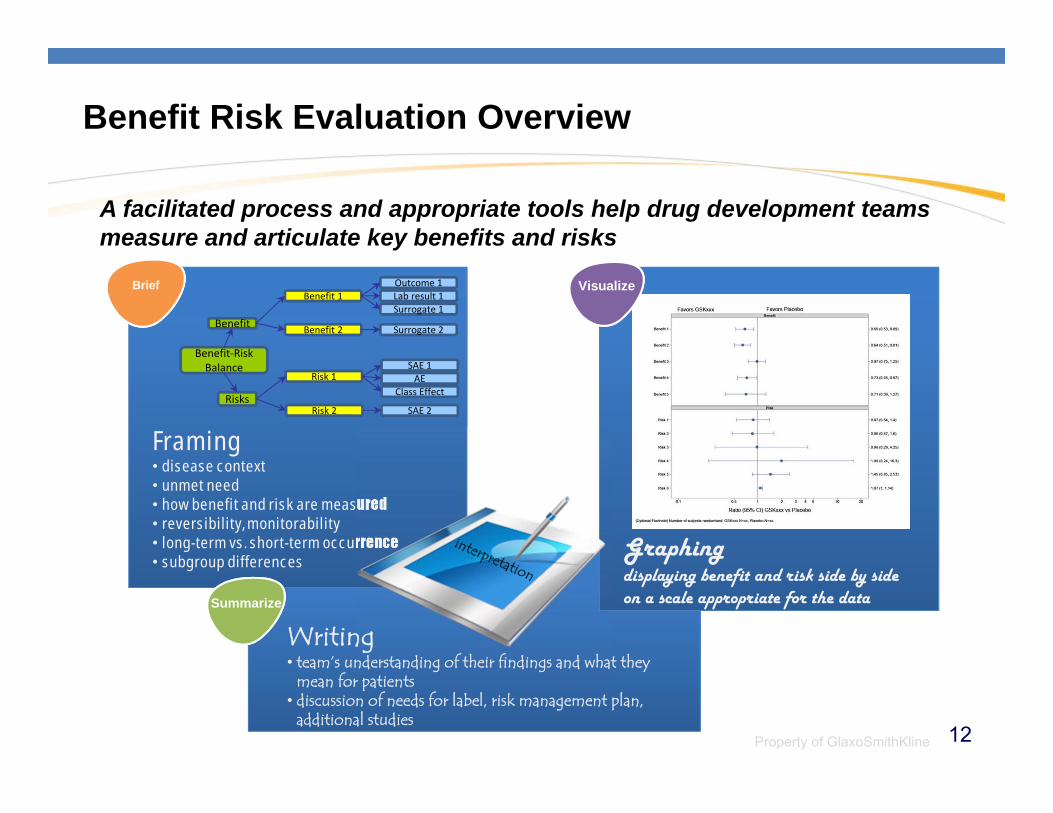
Benefit Risk Evaluation Overview
A facilitated process and appropriate tools help drug development teams measure and articulate key benefits and risks
Property of GlaxoSmithKline
Outcome 1Lab result 1Benefit 1Surrogate 1
Surrogate 2Benefit 2
Risk 2 SAE 2
SAE 1Risk 1 AE
Class Effect
Benefit
Risks
Benefit‐Risk Balance
Framing• disease context• unmet need• how benefit and risk are measured• reversibility, monitorability• long-term vs. short-term occurrence• subgroup differences
Graphingdisplaying benefit and risk side by side on a scale appropriate for the data
Writing• team’s understanding of their findings and what they
mean for patients• discussion of needs for label, risk management plan,
additional studies
VisualizeBrief
Summarize
12
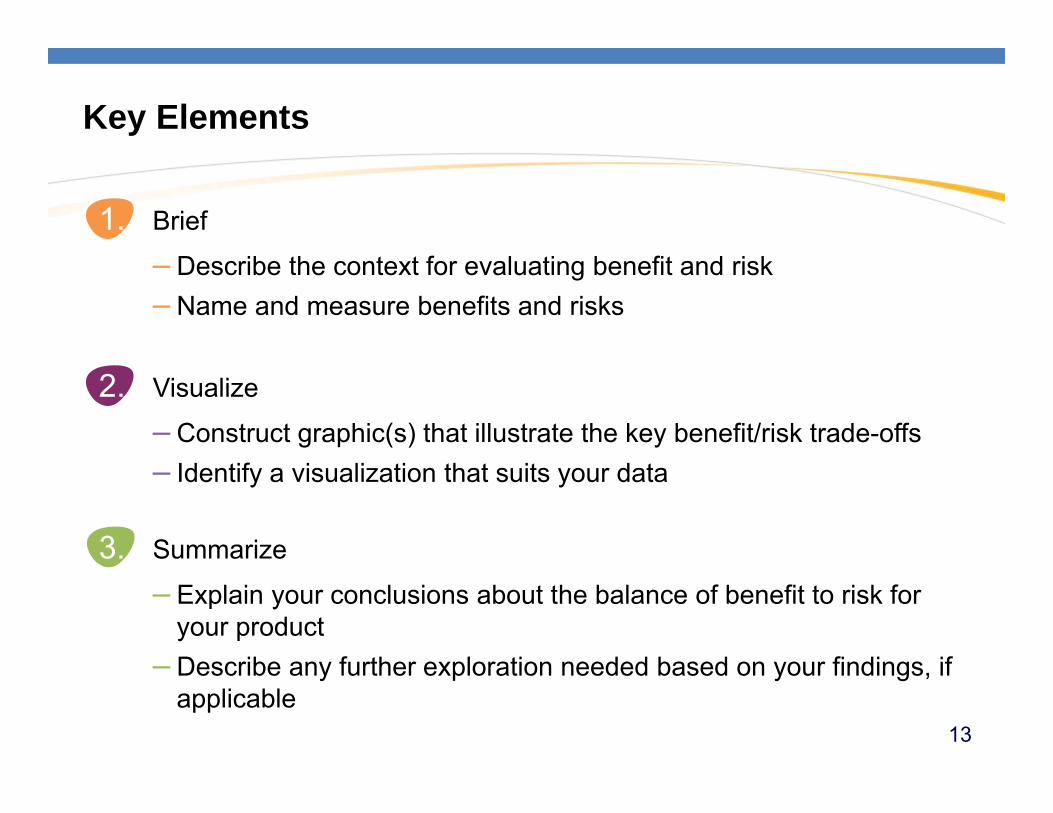
Key Elements
1. Brief
– Describe the context for evaluating benefit and risk– Name and measure benefits and risks
2. Visualize
– Construct graphic(s) that illustrate the key benefit/risk trade-offs– Identify a visualization that suits your data
3. Summarize
– Explain your conclusions about the balance of benefit to risk for your product
– Describe any further exploration needed based on your findings, if applicable
13
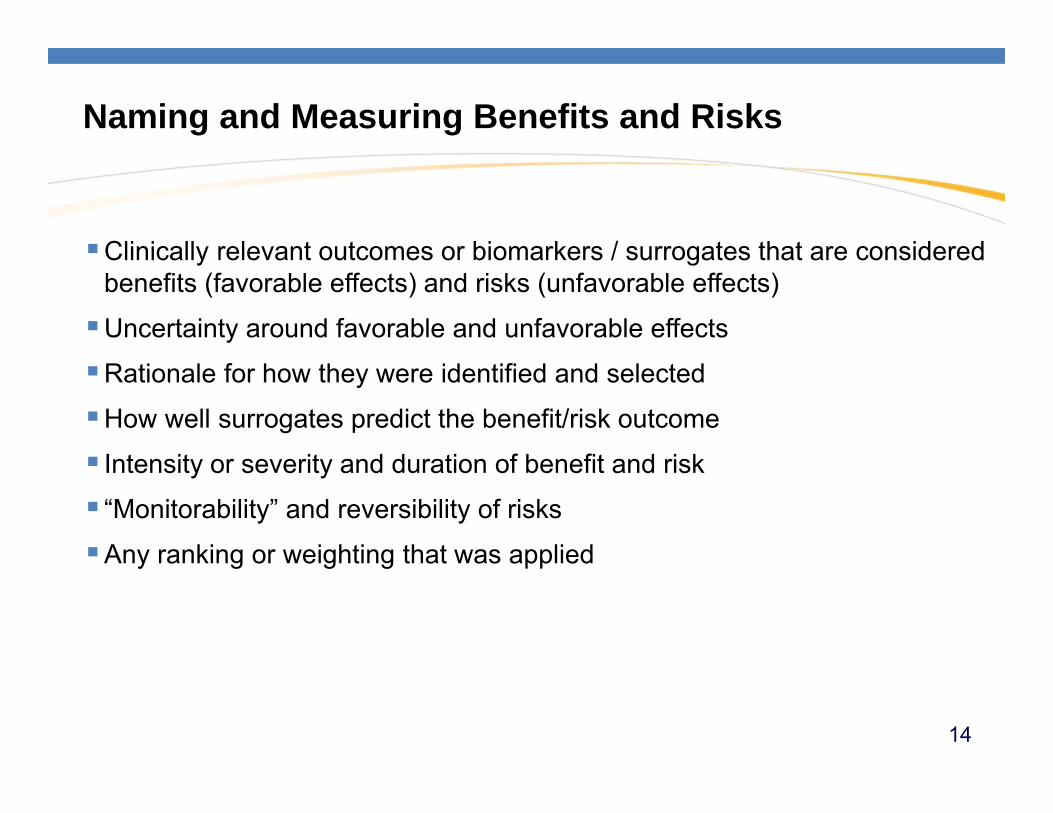
Naming and Measuring Benefits and Risks
Clinically relevant outcomes or biomarkers / surrogates that are considered benefits (favorable effects) and risks (unfavorable effects)
Uncertainty around favorable and unfavorable effects
Rationale for how they were identified and selected
How well surrogates predict the benefit/risk outcome
Intensity or severity and duration of benefit and risk
“Monitorability” and reversibility of risks
Any ranking or weighting that was applied
14
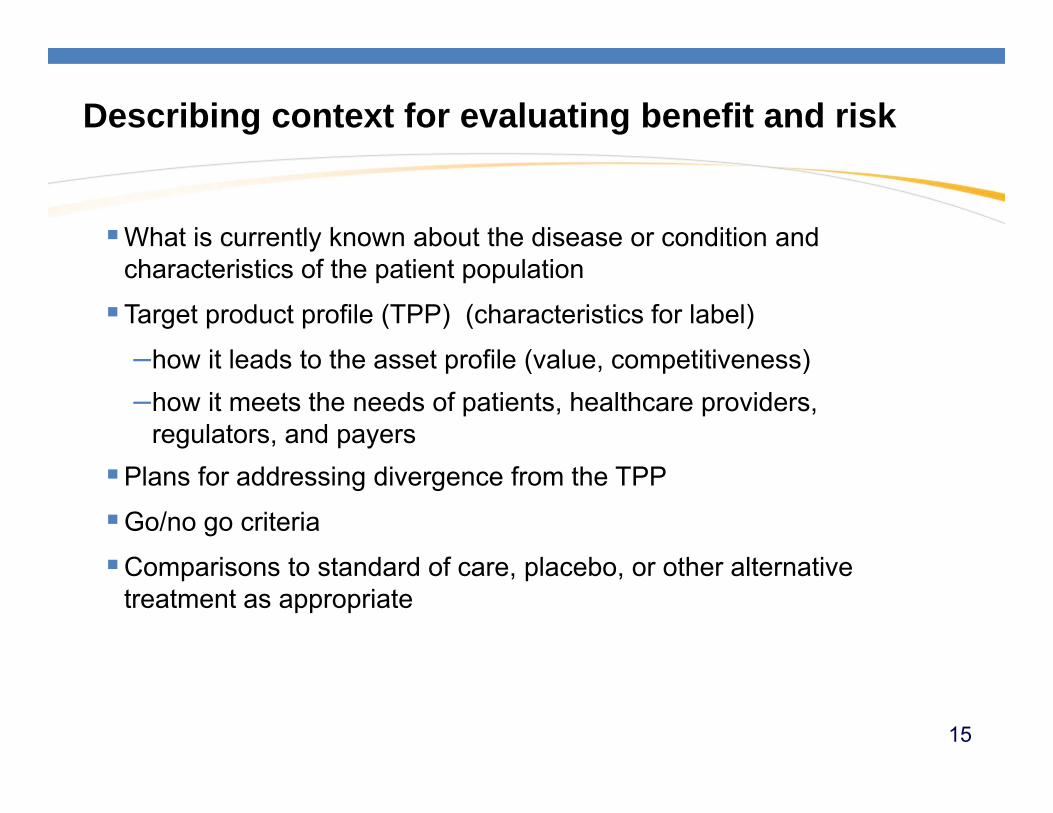
Describing context for evaluating benefit and risk
What is currently known about the disease or condition and characteristics of the patient population
Target product profile (TPP) (characteristics for label)
–how it leads to the asset profile (value, competitiveness)–how it meets the needs of patients, healthcare providers,
regulators, and payersPlans for addressing divergence from the TPP
Go/no go criteria
Comparisons to standard of care, placebo, or other alternative treatment as appropriate
15
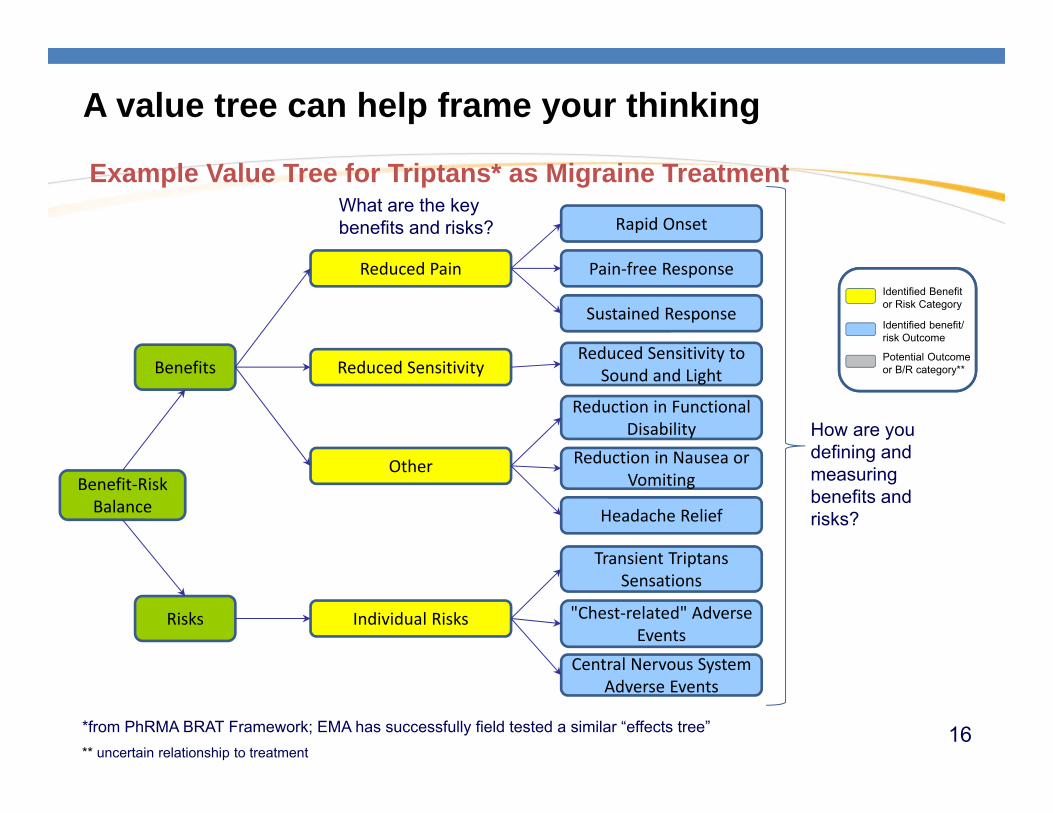
A value tree can help frame your thinking
*from PhRMA BRAT Framework; EMA has successfully field tested a similar “effects tree”** uncertain relationship to treatment
Identified Benefitor Risk Category
Identified benefit/risk Outcome
Potential Outcomeor B/R category**
Rapid Onset
Pain‐free ResponseReduced Pain
Sustained Response
Reduced Sensitivity to Sound and LightReduced Sensitivity
Reduction in Functional Disability
Other Reduction in Nausea or Vomiting
Headache Relief
Transient TriptansSensations
Individual Risks "Chest‐related" Adverse Events
Central Nervous System Adverse Events
Benefits
Risks
Benefit‐Risk Balance
How are you defining and measuring benefits and risks?
What are the key benefits and risks?
Example Value Tree for Triptans* as Migraine Treatment
16
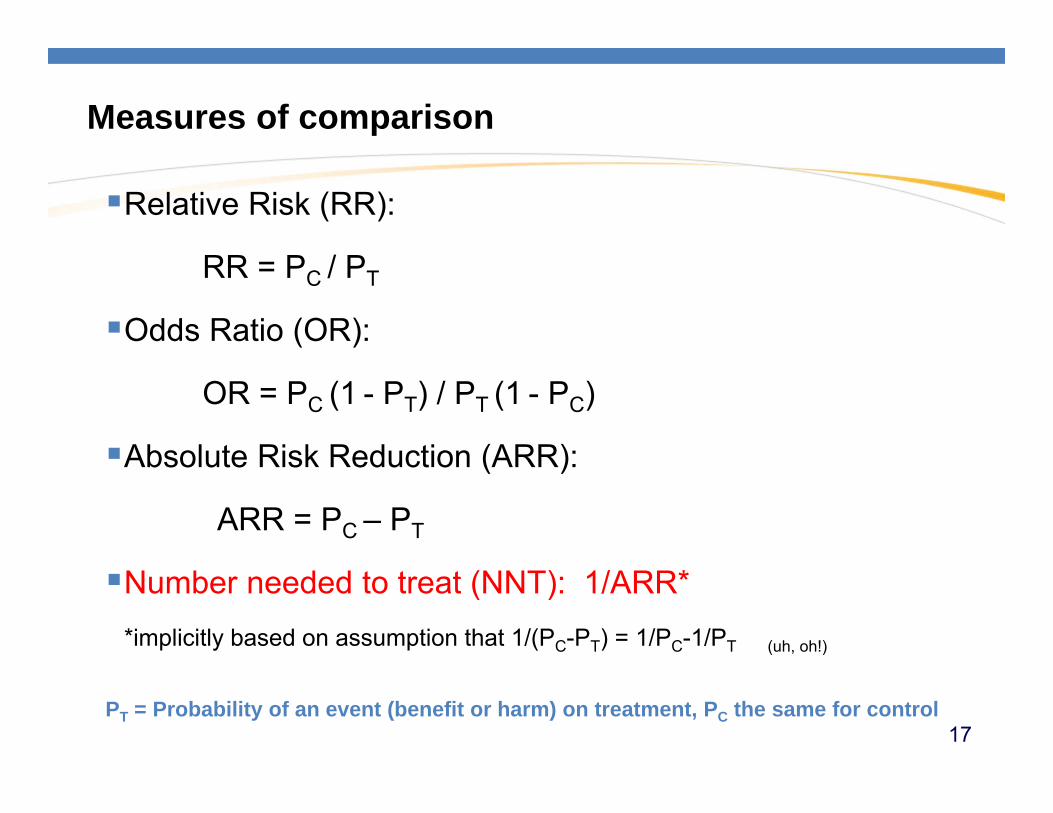
Relative Risk (RR):
RR = PC / PT
Odds Ratio (OR):
OR = PC (1 - PT) / PT (1 - PC)
Absolute Risk Reduction (ARR):
ARR = PC – PT
Number needed to treat (NNT): 1/ARR**implicitly based on assumption that 1/(PC-PT) = 1/PC-1/PT (uh, oh!)
PT = Probability of an event (benefit or harm) on treatment, PC the same for control
Measures of comparison
17
Interpretation of Number Needed to Treat or Number Needed to Harm (from a psychiatrist to fellow docs)
NNT or NNH represents how many patients one would need to treat with one intervention v. another in order to encounter one additional beneficial (NNT) or harmful (NNH) outcome.
If the NNT or NNH were three, it would mean with every three patients, a difference in outcome would be expected, and possibly commonly encountered in day-to-day clinical practice.
First step in appraising evidence is to check statistical significance and confidence interval.
Ask how often will this difference in risk be encountered in day-to-day clinical practice.
from Citrome L. Relative vs. absolute measures of benefit and risk: what’s the difference? Acta Psychiatr Scand 2010: 121: 94–102 18
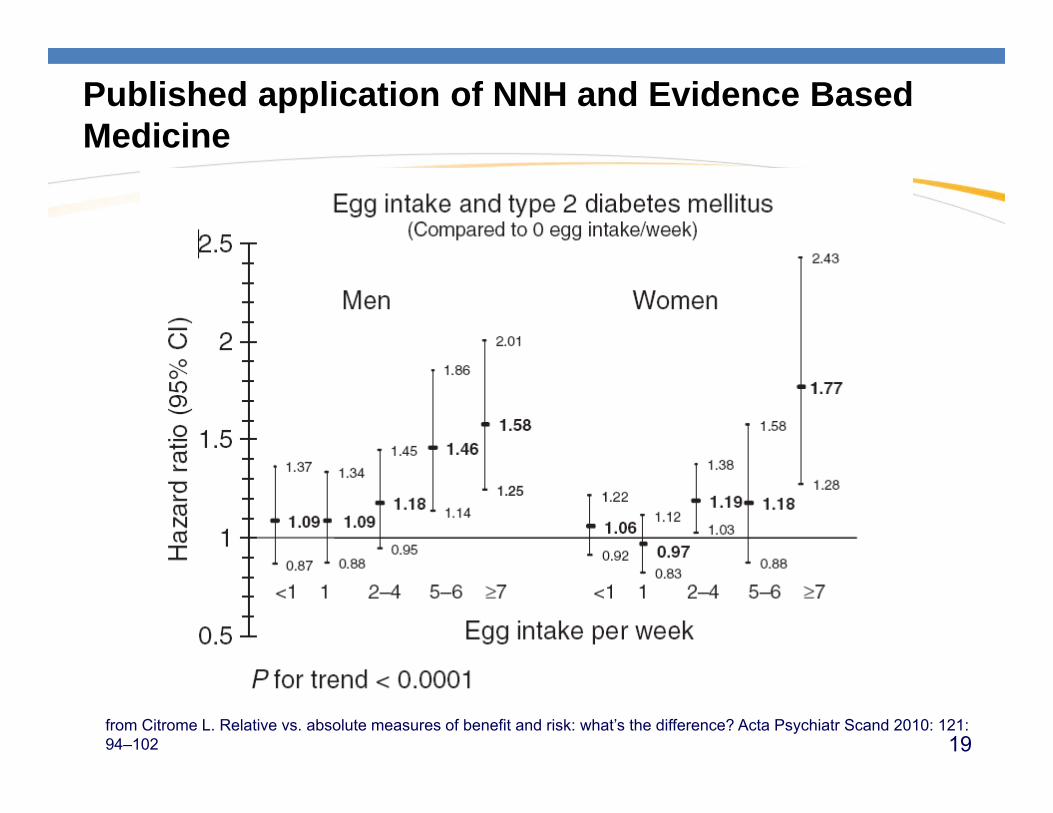
Published application of NNH and Evidence Based Medicine
from Citrome L. Relative vs. absolute measures of benefit and risk: what’s the difference? Acta Psychiatr Scand 2010: 121: 94–102 19
How to determine advice to the patient
Use the crude annualized incidence rates to calculate NNH (=137) comparing egg consumption vs. no egg consumption in a 1-year period.
For a woman with similar characteristics to those in the studied cohort, risk of developing diabetes is 77% higher if she consumes at least 7 eggs per week, but the development of diabetes will be encountered in only one extra woman in every 137 women who eat at least 7 eggs per week v. those abstaining from eggs completely.
Over time, this risk may be unacceptable, but probably remains overshadowed by overall poor diet (including what else is being consumed along with the eggs), physical inactivity and advancing age.
Also unanswered is whether or not there are appreciable relative or absolute risk differences when comparing persons among the different categories and along the continuum of egg consumption.
from Citrome L. Relative vs. absolute measures of benefit and risk: what’s the difference? Acta Psychiatr Scand 2010: 121: 94–102
20
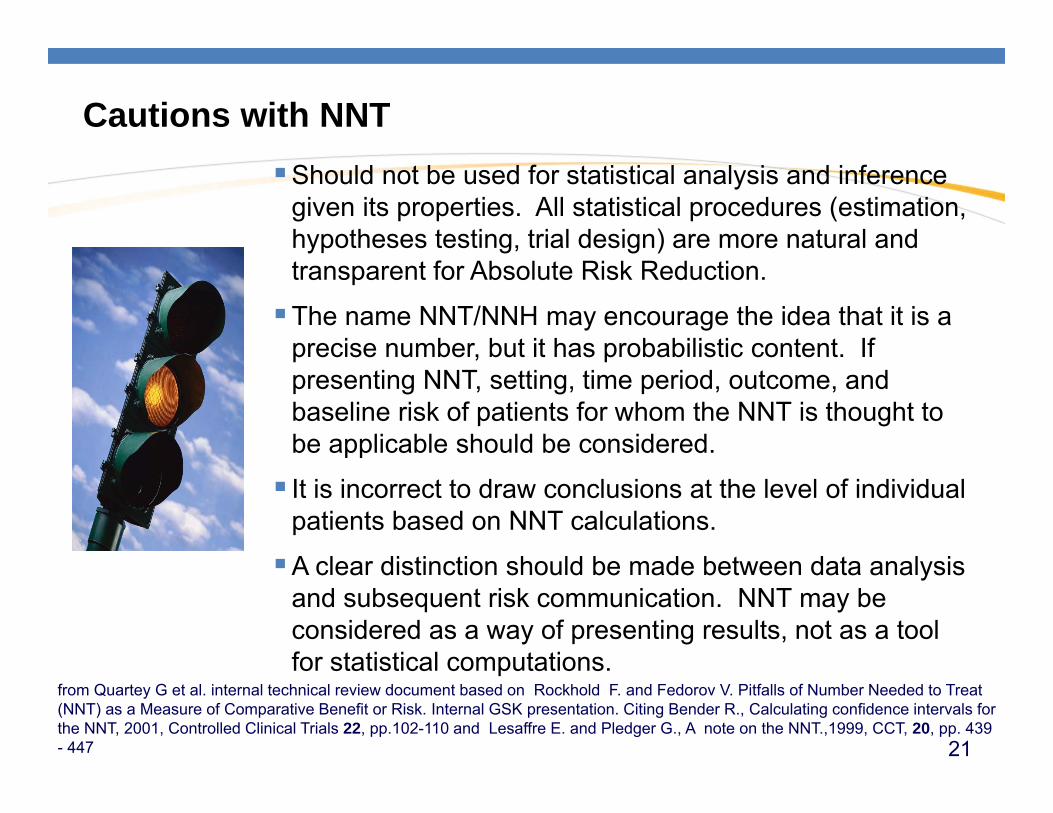
Cautions with NNTShould not be used for statistical analysis and inference
given its properties. All statistical procedures (estimation, hypotheses testing, trial design) are more natural and transparent for Absolute Risk Reduction.
The name NNT/NNH may encourage the idea that it is a precise number, but it has probabilistic content. If presenting NNT, setting, time period, outcome, and baseline risk of patients for whom the NNT is thought to be applicable should be considered.
It is incorrect to draw conclusions at the level of individual patients based on NNT calculations.
A clear distinction should be made between data analysis and subsequent risk communication. NNT may be considered as a way of presenting results, not as a tool for statistical computations.
from Quartey G et al. internal technical review document based on Rockhold F. and Fedorov V. Pitfalls of Number Needed to Treat (NNT) as a Measure of Comparative Benefit or Risk. Internal GSK presentation. Citing Bender R., Calculating confidence intervals for the NNT, 2001, Controlled Clinical Trials 22, pp.102-110 and Lesaffre E. and Pledger G., A note on the NNT.,1999, CCT, 20, pp. 439 - 447 21
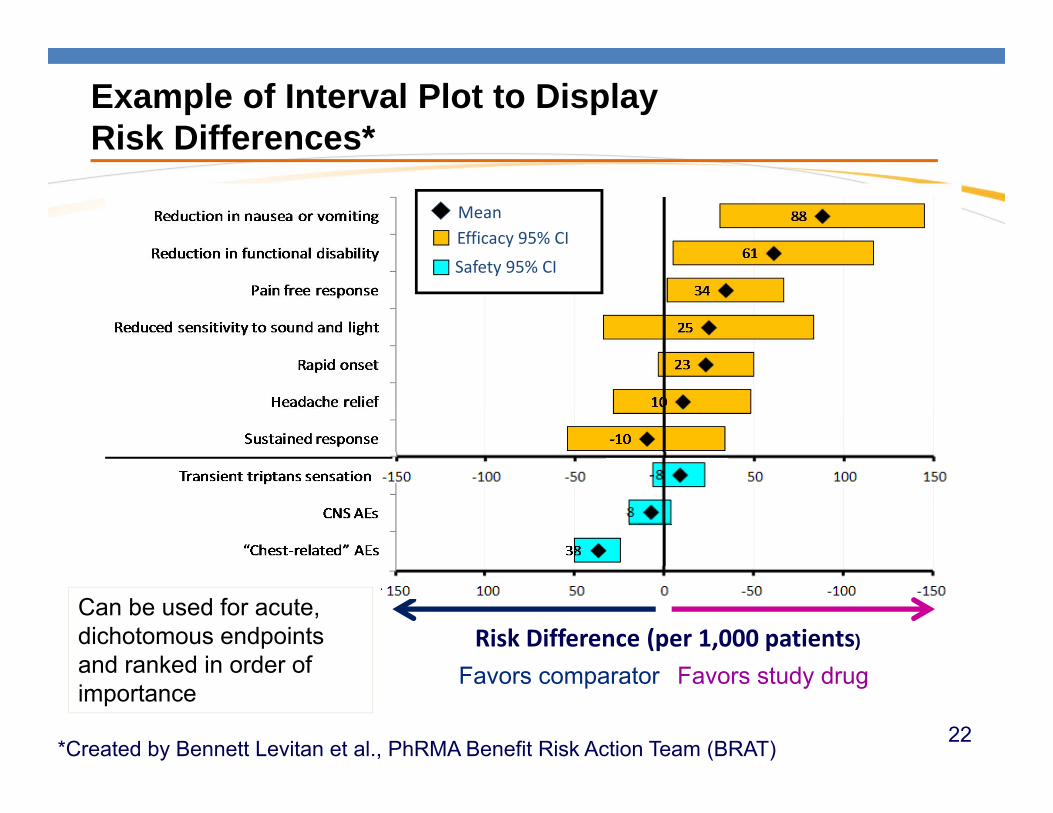
Example of Interval Plot to DisplayRisk Differences*
Reduction in
Favors comparator Favors study drug
Reduction in
Reduction in
Efficacy 95% CISafety 95% CI
Mean
-
Risk Difference (per 1,000 patients)
*Created by Bennett Levitan et al., PhRMA Benefit Risk Action Team (BRAT)
Can be used for acute, dichotomous endpoints and ranked in order of importance
22
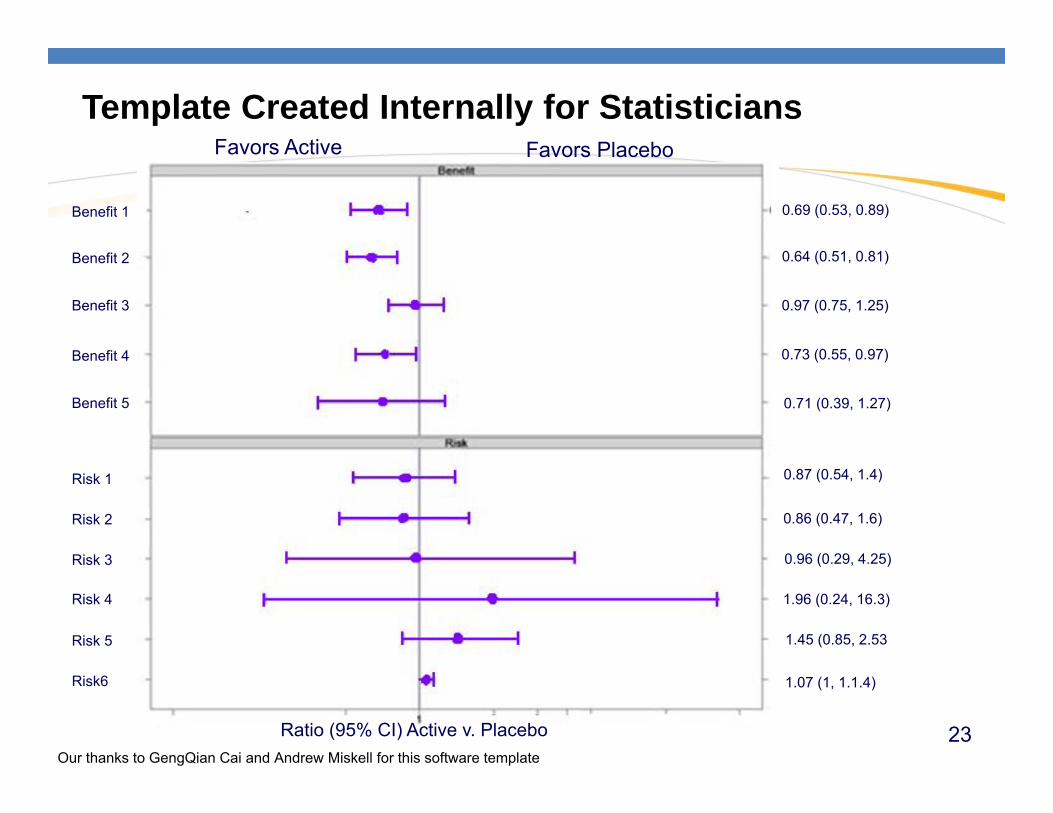
Template Created Internally for Statisticians
Our thanks to GengQian Cai and Andrew Miskell for this software template
Benefit 1
Benefit 2
Benefit 3
Benefit 4
Benefit 5
Risk 1
Risk 2
Risk 3
Risk 4
Risk 5
Risk6
0.69 (0.53, 0.89)
0.64 (0.51, 0.81)
0.97 (0.75, 1.25)
0.73 (0.55, 0.97)
0.71 (0.39, 1.27)
0.87 (0.54, 1.4)
0.86 (0.47, 1.6)
0.96 (0.29, 4.25)
1.96 (0.24, 16.3)
1.45 (0.85, 2.53
1.07 (1, 1.1.4)
Ratio (95% CI) Active v. Placebo
Favors Active Favors Placebo
23
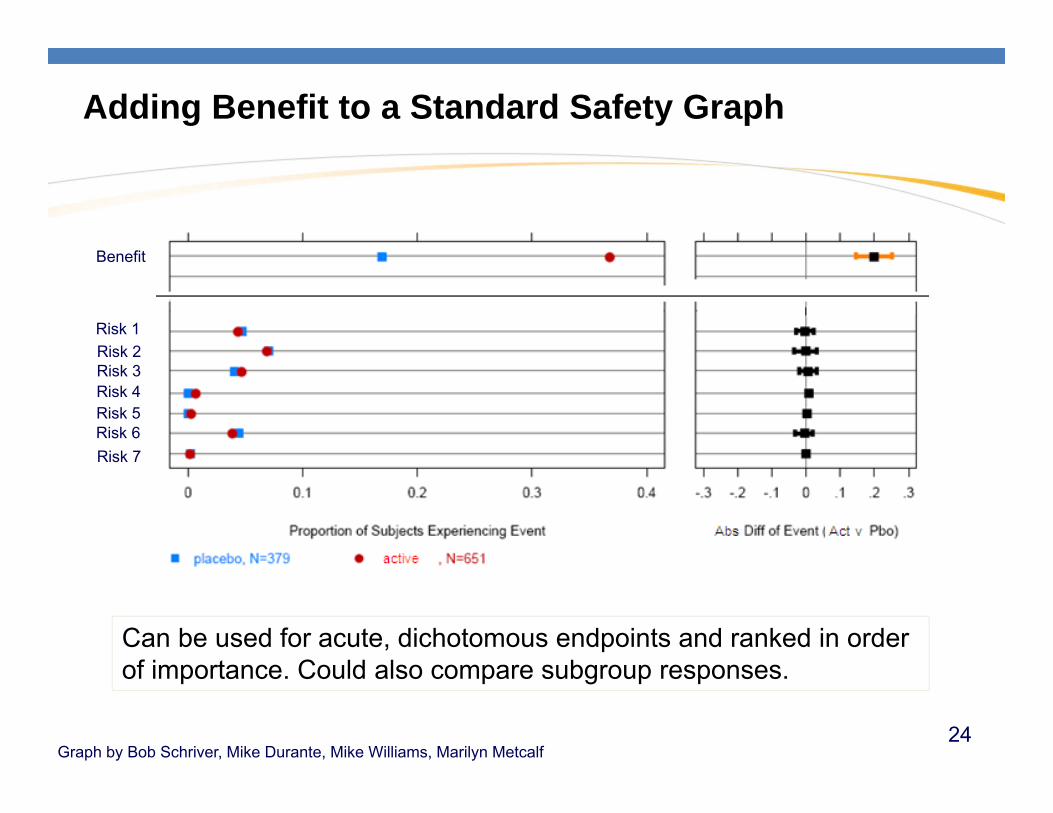
Graph by Bob Schriver, Mike Durante, Mike Williams, Marilyn Metcalf
Adding Benefit to a Standard Safety Graph
Can be used for acute, dichotomous endpoints and ranked in order of importance. Could also compare subgroup responses.
Benefit
Risk 1Risk 2Risk 3Risk 4Risk 5Risk 6Risk 7
24
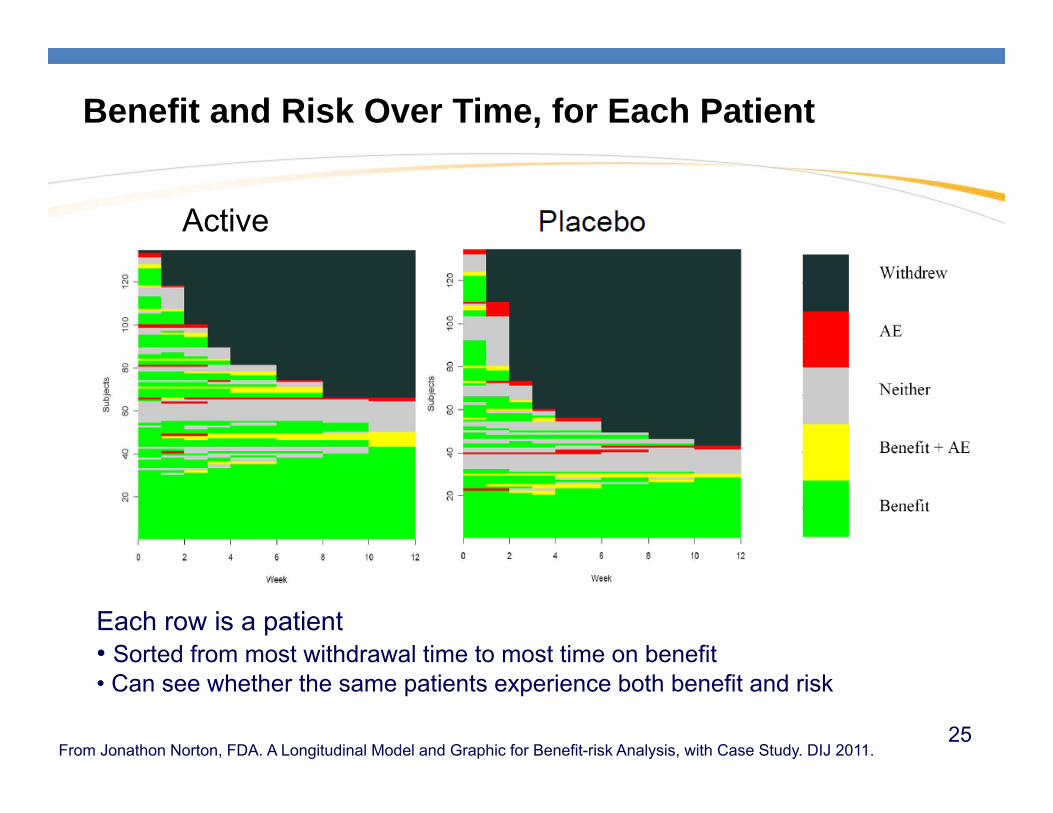
Benefit and Risk Over Time, for Each Patient
Active
From Jonathon Norton, FDA. A Longitudinal Model and Graphic for Benefit-risk Analysis, with Case Study. DIJ 2011.
Each row is a patient• Sorted from most withdrawal time to most time on benefit• Can see whether the same patients experience both benefit and risk
25
Weighting
Like any analysis, weighting is a structured way to capture thinking, not an answer in and of itself.
Weighting of Benefits and Risks is difficult and controversial
Methods for collecting weights exist and can be improved.
Methods for communications among groups who offer different weights will be the more important contribution.
26
Explaining your conclusions from your analysis
Does benefit outweigh risk?How does your evidence support this conclusion*?
Consider the following:
How much uncertainty is there around the favorable and unfavorable effects?
Is the benefit durable?
Does the risk increase or decrease over time?
Do some patients experience more benefit and/or more risk than others?–Are there subgroup differences? (e.g., age, sex, ethnicity, organ function,
disease severity, or genetic polymorphism)–Do those patients at higher/lower risk experience higher or lower benefits?
What are the implications for the patient?27
What it all boils down to – Clear Communication
Complete Disclosure and Clear & Transparent communications = meaningful dialogue about potential impact of treatment to patients and providersDisclosure (e.g. label) does not automatically equal
transparency.
28
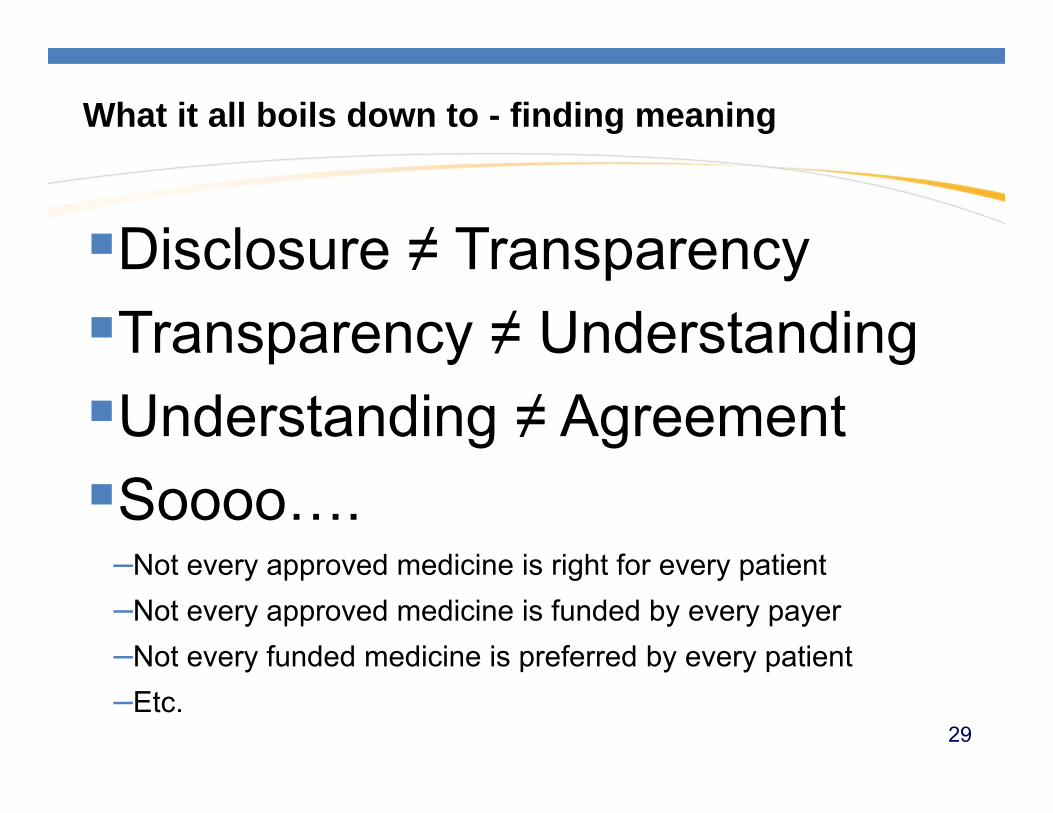
What it all boils down to - finding meaning
Disclosure ≠ TransparencyTransparency ≠ UnderstandingUnderstanding ≠ AgreementSoooo….
–Not every approved medicine is right for every patient–Not every approved medicine is funded by every payer–Not every funded medicine is preferred by every patient–Etc.
29
Governance
Pharmacovigilance lasts throughout the life of a medicine, and is a continual process. Ensuring that benefit to risk remains positive throughout that lifecycle requires consistent assessment within a product and some level of uniformity across products.
Milestone reviews provide an opportunity for these kinds of consistent BR assessments.
30
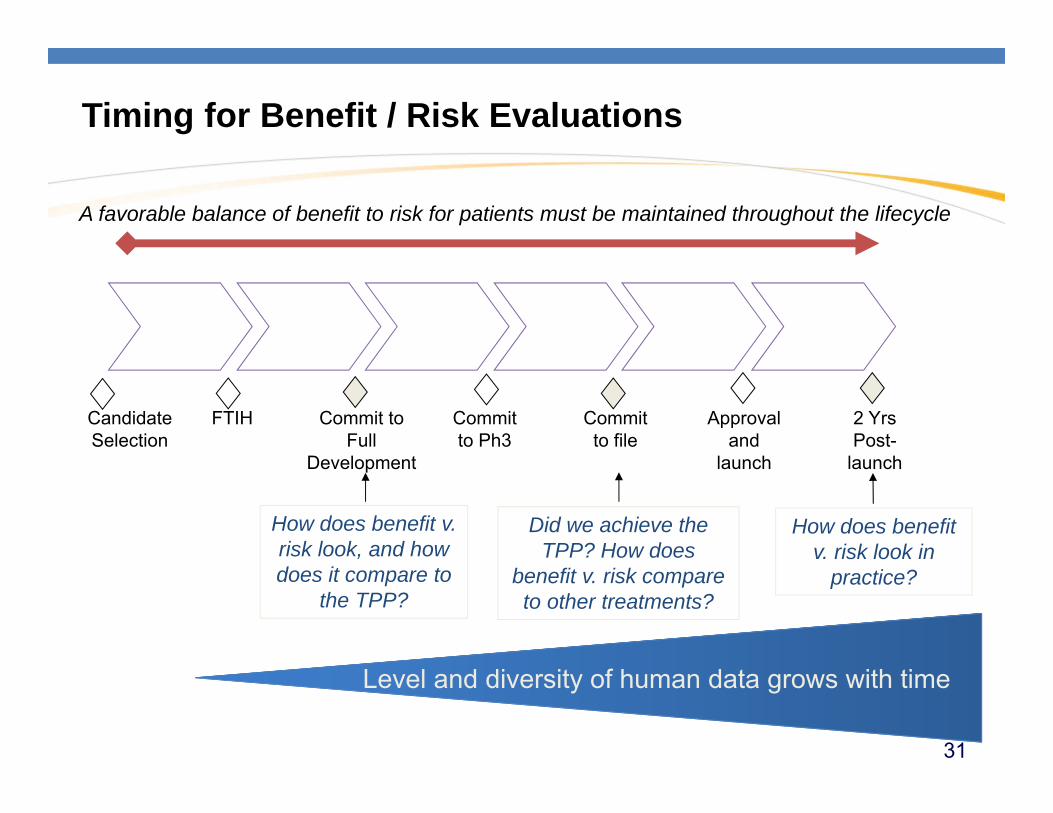
Timing for Benefit / Risk Evaluations
A favorable balance of benefit to risk for patients must be maintained throughout the lifecycle
.
FTIH Commit to Full
Development
Commit to Ph3
Commit to file
Approval and
launch
Candidate Selection
Did we achieve the TPP? How does
benefit v. risk compare to other treatments?
How does benefit v. risk look in
practice?
How does benefit v. risk look, and how does it compare to
the TPP?
Level and diversity of human data grows with time
2 Yrs Post-
launch
31
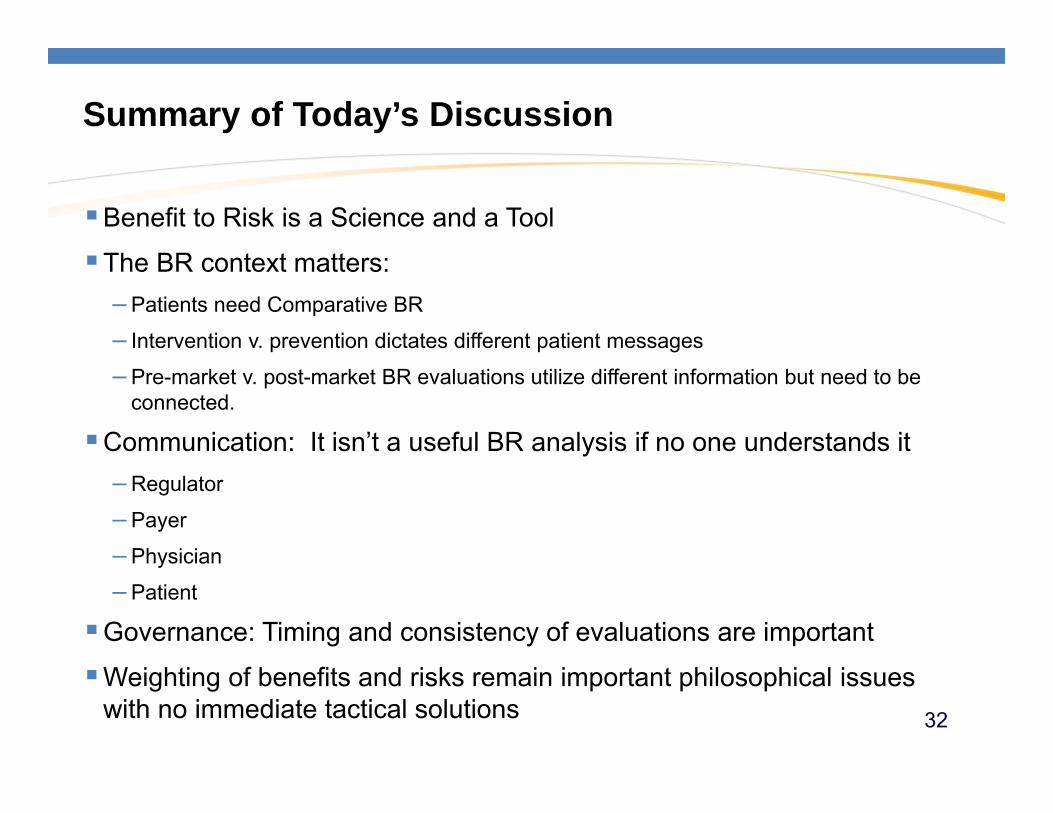
Summary of Today’s Discussion
Benefit to Risk is a Science and a Tool
The BR context matters:– Patients need Comparative BR
– Intervention v. prevention dictates different patient messages
– Pre-market v. post-market BR evaluations utilize different information but need to be connected.
Communication: It isn’t a useful BR analysis if no one understands it– Regulator
– Payer
– Physician
– Patient
Governance: Timing and consistency of evaluations are important
Weighting of benefits and risks remain important philosophical issues with no immediate tactical solutions 32
Q&A
33
Backup
34
Abstract
ABSTRACT: The term Benefit to Risk has long been used in the Pharmaceutical Industry, but not until the last ten years has much work been done in attempting to quantify this concept at either the population or patient level. Numerous activities in the US and Europe have been spawned to look at this and some regulators have been strong proponents of such a quantitative approach. The advantage is that it supplies a balanced and objective framework to weigh benefits and risks of medicines, while the drawbacks may be in the clarity of the presentation of the findings. The level of rigor needed to “quantify” these concepts remains a topic of debate, but what is eminently clear is the need to communicate the methods and findings to a broad audience of diverse backgrounds. The merits and examples of simple ways to communicate the concepts at the population and patient level will be discussed.
35
From stats to individual
What is the threshold for the patient’s “group”? Maximize the BR for that patient’s group
Venn diagrams of probability – does the patient sit at the right intersections?
Enough information for the patient to have a reasonable belief that they will receive benefit
36
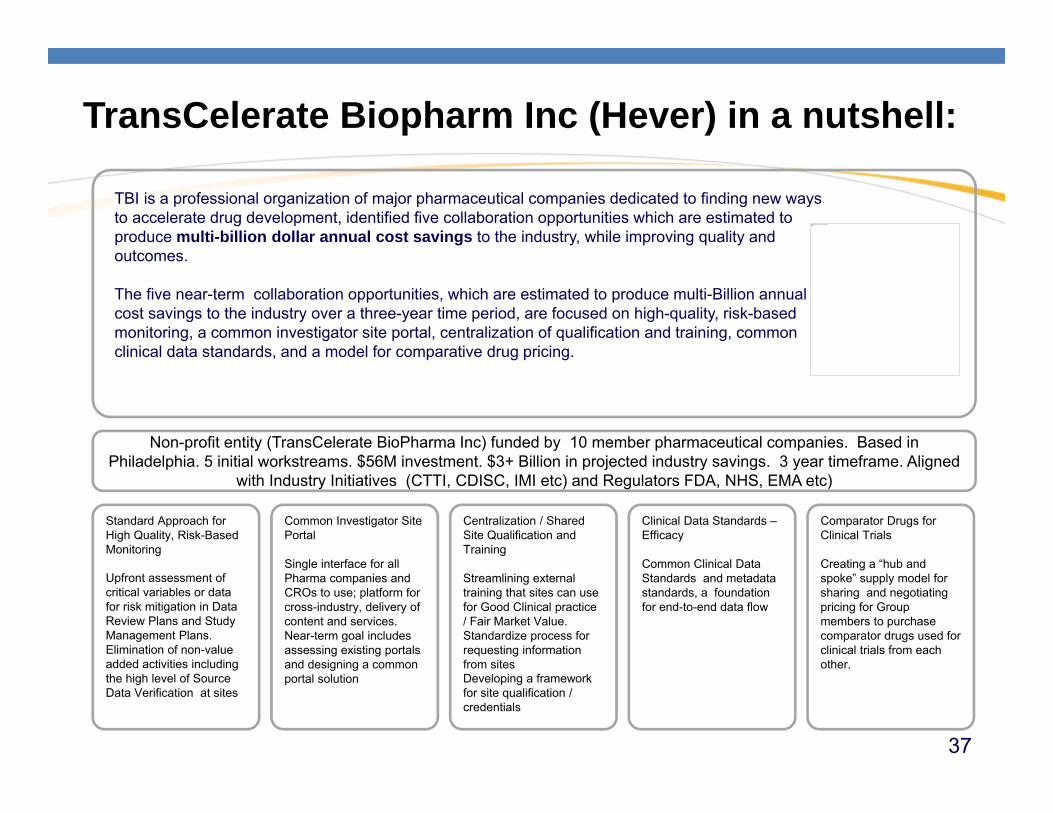
TransCelerate Biopharm Inc (Hever) in a nutshell:
Non-profit entity (TransCelerate BioPharma Inc) funded by 10 member pharmaceutical companies. Based in Philadelphia. 5 initial workstreams. $56M investment. $3+ Billion in projected industry savings. 3 year timeframe. Aligned
with Industry Initiatives (CTTI, CDISC, IMI etc) and Regulators FDA, NHS, EMA etc)
Clinical Data Standards –Efficacy
Common Clinical Data Standards and metadata standards, a foundation for end-to-end data flow
Centralization / Shared Site Qualification and Training
Streamlining external training that sites can use for Good Clinical practice / Fair Market Value. Standardize process for requesting information from sitesDeveloping a framework for site qualification / credentials
Common Investigator Site Portal
Single interface for all Pharma companies and CROs to use; platform for cross-industry, delivery of content and services. Near-term goal includes assessing existing portals and designing a common portal solution
Standard Approach for High Quality, Risk-Based Monitoring
Upfront assessment of critical variables or data for risk mitigation in Data Review Plans and Study Management Plans. Elimination of non-value added activities including the high level of Source Data Verification at sites
Comparator Drugs for Clinical Trials
Creating a “hub and spoke” supply model for sharing and negotiating pricing for Group members to purchase comparator drugs used for clinical trials from each other.
This image cannot currently be displayed.
TBI is a professional organization of major pharmaceutical companies dedicated to finding new ways to accelerate drug development, identified five collaboration opportunities which are estimated to produce multi-billion dollar annual cost savings to the industry, while improving quality and outcomes.
The five near-term collaboration opportunities, which are estimated to produce multi-Billion annual cost savings to the industry over a three-year time period, are focused on high-quality, risk-based monitoring, a common investigator site portal, centralization of qualification and training, common clinical data standards, and a model for comparative drug pricing.
37
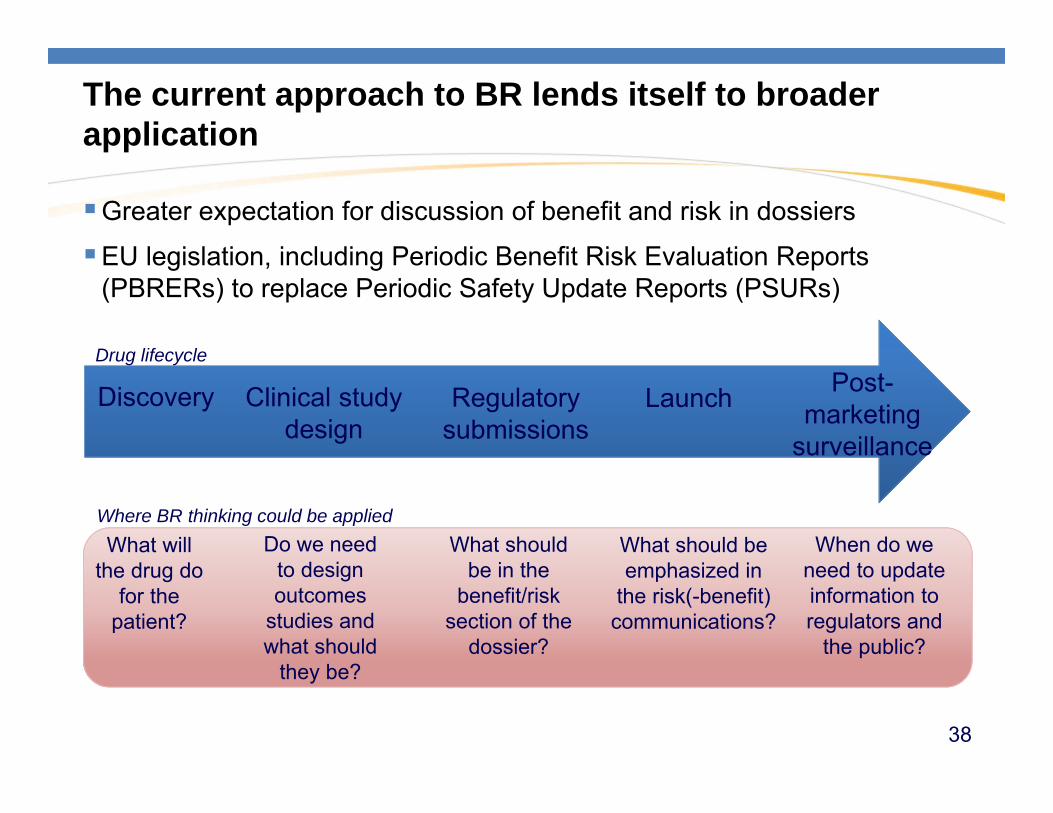
The current approach to BR lends itself to broader application
Greater expectation for discussion of benefit and risk in dossiers
EU legislation, including Periodic Benefit Risk Evaluation Reports (PBRERs) to replace Periodic Safety Update Reports (PSURs)
Discovery Clinical study design
What will the drug do
for the patient?
Do we need to design outcomes
studies and what should
they be?
When do we need to update information to regulators and
the public?
What should be emphasized in
the risk(-benefit) communications?
Regulatory submissions
Drug lifecycle
Where BR thinking could be applied
Post-marketing
surveillance
Launch
What should be in the
benefit/risk section of the
dossier?
38
Summary
Medicine Safety and PV is a complex and fascinating exercise
Statistics and statisticians play a central and pivotal role in methods development and interpretation
Sources of data are varied driving the need for a variety of methods
Inference goes well beyond the p-value -- needs true linkage of data, analysis, medical expertise and thought.
Data Visualization tools are vital to interpretation
Safety is a key component of Quantifying benefit to Risk
39