economic effects of ftth - neo fiber
TRANSCRIPT
ECONOMIC EFFECTS OF BROADBAND INFRASTRUCTURE DEPLOYMENT AND TAX INCENTIVES FOR BROADBAND
DEPLOYMENT
HAL J. SINGER JEFFREY D. WEST
PREPARED ON BEHALF OF THE FIBER‐TO‐THE‐HOME COUNCIL
MARCH 2, 2010
P a g e | 1
ECONOMIC EFFECTS OF BROADBAND INFRASTRUCTURE DEPLOYMENT AND TAX INCENTIVES FOR BROADBAND
DEPLOYMENT
HAL J. SINGER1 JEFFREY D. WEST2
MARCH 2, 2010
ABSTRACT
Without any regulatory intervention, broadband service providers (“BSPs”) are prepared to invest nearly $30 billion per year over the coming years in next‐generation access technologies. This investment will support hundreds of thousands of domestic jobs and will stimulate activity in the U.S. economy. Yet this investment will not result in ubiquitous availability of broadband for U.S. consumers, nor will it result in competitive access to faster, next‐generation broadband services for a large portion of consumers. The Fiber‐to‐the‐Home Council has proposed that the Federal Communications Commission address this shortfall in broadband deployment in the National Broadband Plan. Specifically, the Council recommends that the Commission adopt two principal goals for the Plan, both to be achieved by 2015: (1) universal access to current generation broadband capability at 3 Mbps downstream and 768 Kbps upsteam; and (2) 80% of homes passed with competitive next generation broadband capability at 50 Mbps downstream and 20 Mbps upstream delivered at peak periods. This paper presents the economic impact in terms of job creation and economic output associated with achieving the goals espoused by the Council. It also examines, as an illustrative example of a policy designed to achieve these goals, the use of tax incentives to BSPs to wire marginally profitable areas. In this study, we analyze the effect of two potential tax incentives—capital expensing allowances and tax‐credit bonds—on BSP investments, and we estimate the marginal effects on economic activity and job creation. In particular, we estimate the additional number of homes passed that would be attributable to the tax incentives above and beyond what would be occur in its absence of any incentive, and we calculate the associated, incremental economic impact.
1. Hal J. Singer is a Managing Director at Navigant Economics, and Adjunct Professor at McDonough School of Business, Georgetown University.
2. Jeffrey D. West is an Associate Director at Navigant Economics. The authors would like to thank Corning, Inc. for funding.

P a g e | 2
Contents I. INTRODUCTION AND EXECUTIVE SUMMARY ............................................................... 3
II. ECONOMIC EFFECTS OF INVESTMENTS REQUIRED TO MEET CURRENT GENERATION GOAL ......................................................................................................... 6
A. Estimating Additional Capital Expenditures Required ..................................... 6
B. Analysis of Direct Effects ..................................................................................... 8
1. Methodology and Assumptions ............................................................... 8
2. Results of Direct Effects Analysis .......................................................... 10
C. Analysis of Indirect Effects ................................................................................ 10
1. Methodology and Assumptions ............................................................. 11
2. Results of Indirect Effects Analysis ....................................................... 11
III. ECONOMIC EFFECTS OF INVESTMENTS REQUIRED TO MEET NEXT‐GENERATION GOAL OF COMPETITIVE ACCESS BY 2015 .......................................... 12
A. Estimating Additional Capital Expenditures Required ................................... 12
B. Analysis of Direct Effects ................................................................................... 14
C. Analysis of Indirect Effects ................................................................................ 14
IV. THE IMPACT OF TAX INCENTIVES ON INVESTMENT AND THE ECONOMY ............ 18
A. Expensing Proposals .......................................................................................... 18
B. Tax‐Credit Bond Proposal ................................................................................. 19
C. Estimating Additional Capital Expenditures Resulting from Tax Incentives ............................................................................................................ 19
D. Analysis of Direct Effects ................................................................................... 21
E. Impact on Tax Revenues .................................................................................... 23
F. Analysis of Indirect Effects ................................................................................ 25
V. CONCLUSION .................................................................................................................. 25
P a g e | 3
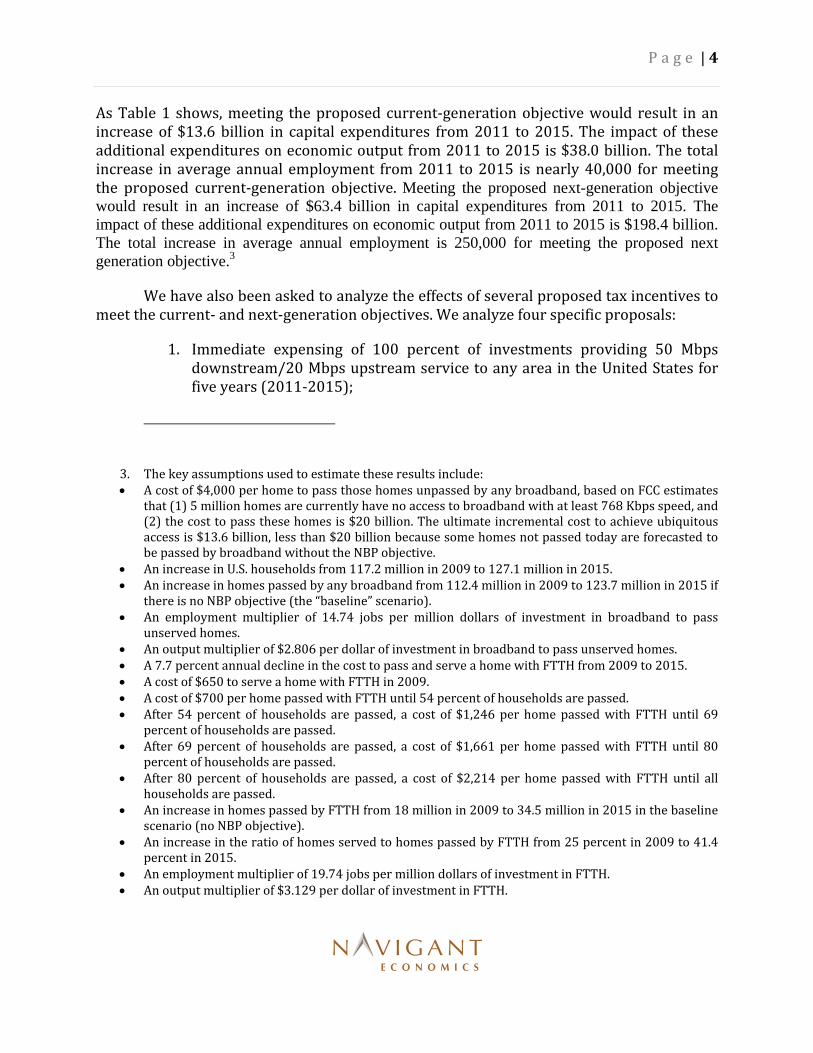
I. INTRODUCTION AND EXECUTIVE SUMMARY
In this report we analyze the economic impact of the incremental investment in broadband technologies required to meet the FTTH Council’s proposed goals for the FCC’s National Broadband Plan (NBP):
Deploy current‐generation access (3 megabits per second (Mbps) downstream, 768 kilobits per second (Kbps) upstream) to all U.S. households by 2015, and
Serve 80 percent of all U.S. households with competitive access to next‐generation access by 2015 that delivers peak‐period speeds of at least 50 Mbps downstream and 20 Mbps upstream.
Meeting each of these goals will generate significant benefits for the U.S. economy, measured both in terms of increased gross domestic product (“GDP”) and increased employment. GDP and employment will increase over the next five years because of the increased investments by broadband service providers (“BSPs”) required to meet the NBP goals (“direct effect”). Table 1 shows the economic impact of reaching each of the two objectives.
TABLE 1: SUMMARY OF DIRECT ECONOMIC EFFECTS ON JOBS AND OUTPUT OF MEETING PROPOSED OBJECTIVES OF THE NATIONAL BROADBAND PLAN, 2011‐2015
Current Generation Competitive Next Generation
No National Broadband Plan objectives
Capex* ($Billion, total) $37.1 $10.9
Households Passed, 2015** (Million) 123.7 34.5
Proposed National Broadband Plan objectives met
Capex* ($Billion, total) $50.6 $74.3
Difference $13.6 $63.4
Households Passed, 2015** (Million) 127.1 101.6
Difference 3.4 67.1
Direct Effect of Additional Capex
– Output ($Billion, total) $38.0 $198.4
– Jobs (Annual Increase) 39,961 250,397
Note: *For current generation, the capex for deployment of broadband in unserved areas. For competitive next generation, the capex for deployment of broadband over FTTH networks. **For current generation, the number of total U.S. households served. For next generation, the number of U.S. households served by at least two providers. Cable investment is excluded from the estimates of next‐generation broadband capital expenditures because the NBP objective will have no effect on forecasted cable investment.
P a g e | 4
As Table 1 shows, meeting the proposed current‐generation objective would result in an increase of $13.6 billion in capital expenditures from 2011 to 2015. The impact of these additional expenditures on economic output from 2011 to 2015 is $38.0 billion. The total increase in average annual employment from 2011 to 2015 is nearly 40,000 for meeting the proposed current‐generation objective. Meeting the proposed next-generation objective would result in an increase of $63.4 billion in capital expenditures from 2011 to 2015. The impact of these additional expenditures on economic output from 2011 to 2015 is $198.4 billion. The total increase in average annual employment is 250,000 for meeting the proposed next generation objective.3
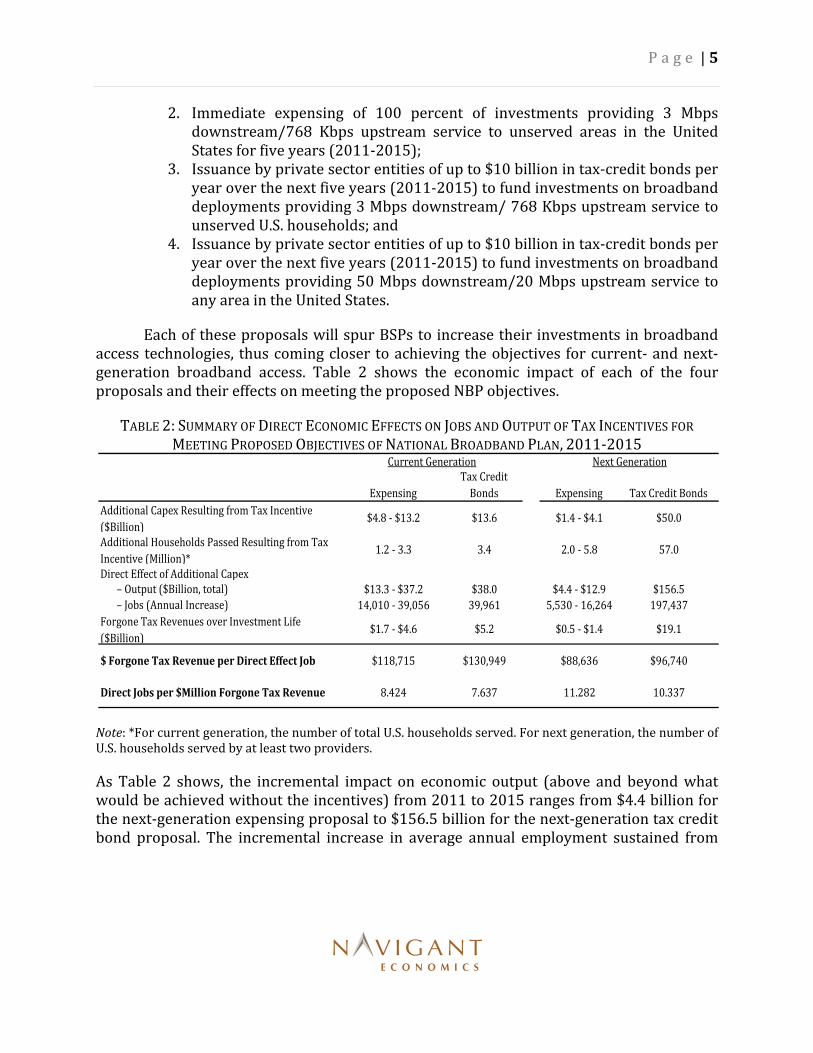
We have also been asked to analyze the effects of several proposed tax incentives to meet the current‐ and next‐generation objectives. We analyze four specific proposals:
1. Immediate expensing of 100 percent of investments providing 50 Mbps downstream/20 Mbps upstream service to any area in the United States for five years (2011‐2015);
3. The key assumptions used to estimate these results include: A cost of $4,000 per home to pass those homes unpassed by any broadband, based on FCC estimates
that (1) 5 million homes are currently have no access to broadband with at least 768 Kbps speed, and (2) the cost to pass these homes is $20 billion. The ultimate incremental cost to achieve ubiquitous access is $13.6 billion, less than $20 billion because some homes not passed today are forecasted to be passed by broadband without the NBP objective.
An increase in U.S. households from 117.2 million in 2009 to 127.1 million in 2015. An increase in homes passed by any broadband from 112.4 million in 2009 to 123.7 million in 2015 if
there is no NBP objective (the “baseline” scenario). An employment multiplier of 14.74 jobs per million dollars of investment in broadband to pass
unserved homes. An output multiplier of $2.806 per dollar of investment in broadband to pass unserved homes. A 7.7 percent annual decline in the cost to pass and serve a home with FTTH from 2009 to 2015. A cost of $650 to serve a home with FTTH in 2009. A cost of $700 per home passed with FTTH until 54 percent of households are passed. After 54 percent of households are passed, a cost of $1,246 per home passed with FTTH until 69
percent of households are passed. After 69 percent of households are passed, a cost of $1,661 per home passed with FTTH until 80
percent of households are passed. After 80 percent of households are passed, a cost of $2,214 per home passed with FTTH until all
households are passed. An increase in homes passed by FTTH from 18 million in 2009 to 34.5 million in 2015 in the baseline
scenario (no NBP objective). An increase in the ratio of homes served to homes passed by FTTH from 25 percent in 2009 to 41.4
percent in 2015. An employment multiplier of 19.74 jobs per million dollars of investment in FTTH. An output multiplier of $3.129 per dollar of investment in FTTH.
P a g e | 5
2. Immediate expensing of 100 percent of investments providing 3 Mbps downstream/768 Kbps upstream service to unserved areas in the United States for five years (2011‐2015);
3. Issuance by private sector entities of up to $10 billion in tax‐credit bonds per year over the next five years (2011‐2015) to fund investments on broadband deployments providing 3 Mbps downstream/ 768 Kbps upstream service to unserved U.S. households; and
4. Issuance by private sector entities of up to $10 billion in tax‐credit bonds per year over the next five years (2011‐2015) to fund investments on broadband deployments providing 50 Mbps downstream/20 Mbps upstream service to any area in the United States.
Each of these proposals will spur BSPs to increase their investments in broadband access technologies, thus coming closer to achieving the objectives for current‐ and next‐generation broadband access. Table 2 shows the economic impact of each of the four proposals and their effects on meeting the proposed NBP objectives.
TABLE 2: SUMMARY OF DIRECT ECONOMIC EFFECTS ON JOBS AND OUTPUT OF TAX INCENTIVES FOR MEETING PROPOSED OBJECTIVES OF NATIONAL BROADBAND PLAN, 2011‐2015
Note: *For current generation, the number of total U.S. households served. For next generation, the number of U.S. households served by at least two providers.
As Table 2 shows, the incremental impact on economic output (above and beyond what would be achieved without the incentives) from 2011 to 2015 ranges from $4.4 billion for the next‐generation expensing proposal to $156.5 billion for the next‐generation tax credit bond proposal. The incremental increase in average annual employment sustained from
Expensing
Tax Credit
Bonds Expensing Tax Credit Bonds
Additional Capex Resulting from Tax Incentive
($Billion)$4.8 ‐ $13.2 $13.6 $1.4 ‐ $4.1 $50.0
Additional Households Passed Resulting from Tax
Incentive (Million)*1.2 ‐ 3.3 3.4 2.0 ‐ 5.8 57.0
Direct Effect of Additional Capex– Output ($Billion, total) $13.3 ‐ $37.2 $38.0 $4.4 ‐ $12.9 $156.5
– Jobs (Annual Increase) 14,010 ‐ 39,056 39,961 5,530 ‐ 16,264 197,437
Forgone Tax Revenues over Investment Life
($Billion)$1.7 ‐ $4.6 $5.2 $0.5 ‐ $1.4 $19.1
$ Forgone Tax Revenue per Direct Effect Job $118,715 $130,949 $88,636 $96,740
Direct Jobs per $Million Forgone Tax Revenue 8.424 7.637 11.282 10.337
Next GenerationCurrent Generation
P a g e | 6
2011 to 2015 ranges from 5,530 net new jobs for the next‐generation expensing proposal to 197,437 net new jobs for the next‐generation tax credit bond proposal.4
Table 2 also shows the forgone tax revenues from each proposal. Our estimates of forgone tax revenues represent only the direct effect of each policy, and do not account for offsetting revenues resulting from increased incomes for suppliers of the inputs for broadband deployment (e.g., income taxes resulting from increased employment). Our estimates of the forgone tax revenues over the 15‐year depreciable life of the investments made from 2011 to 2015 range from $0.5 billion to $19.1 billion for each of the four proposals. Thus, from 2011 to 2015, each of the four proposals will sustain an average of between 8.4 and 11.3 net new jobs per million dollars of forgone tax revenue as a result of the direct effect of increased broadband capital expenditures. Compared to other stimulus packages, the broadband tax credit would be a relatively efficient use of taxpayer money. For example, the Congressional Budget Office’s estimates the average number of jobs created by the American Recovery and Reinvestment Act from 2009 to 2012 is between 700,000 and 1,875,000.5 Given the $787 billion cost of the stimulus bill, this translates to 0.89 to 2.38 jobs created per million dollars of foregone revenue. The efficiency of the stimulus bill in job creation pales in comparison to the job creation of the broadband tax proposals (7.6 to 11.3 jobs per million dollars of foregone revenue).
II. ECONOMIC EFFECTS OF INVESTMENTS REQUIRED TO MEET CURRENT GENERATION GOAL
In this section, we estimate the capital expenditures necessary to meet the proposed NBP objective of ubiquitous availability to current‐generation broadband. We also estimate the direct and indirect economic effects of reaching this goal, in terms of increased employment and economic output.
A. Estimating Additional Capital Expenditures Required
According to the November 2009 report Broadband in America, prepared for the FCC by the Columbia Institute for Telecommunication (CITI), 95.7 percent of households
4. The key assumptions used to estimate these results, in addition to those listed in footnote 3, include: • Annual non‐bonus depreciation, based on 15‐year property with half‐year convention, at 150 percent
declining balance (Revenue Procedure 87‐57). • Marginal tax rate of 35 percent. • BSPs’ price elasticity of demand ranges from –0.85 to –2.5. • BSPs will issue as much in tax credit bonds as allowed. • An effective interest rate of 4.78 percent for the tax credit bonds. 5. Congressional Budget Office, Estimated Impact of the American Recovery and Reinvestment Act on
Employment and Economic Output From October 2009 Through December 2009, at 9 (Feb. 2010) (available at http://cbo.gov/ftpdocs/110xx/doc11044/02-23-ARRA.pdf).
P a g e | 7
are forecasted to be passed by wired broadband in 2015.6 In addition, 69.3 percent of all households are also forecasted to be served by wired broadband in 2015. Although the report does not define the speeds of broadband used in estimating 95.7 percent homes passed, we assume for our purposes that all of the forecasted homes passed are passed with broadband of 3 Mbps downstream/768 Kbps upstream.
To estimate the number of homes passed by 3 Mbps / 768 Kbps service by 2015 assuming there is no NBP objective of ubiquitous access, we use data from Morgan Stanley’s forecast of residential broadband homes.7 Morgan Stanley forecasts the number of homes passed for cable broadband services through 2011, but does not forecast the number of homes passed by DSL service. We assume that if a home is not passed by cable broadband, then it is not passed by any other 3 Mbps / 768 Kbps broadband service. Furthermore, we assume that the number of homes passed by broadband service without the NBP goal would increase by 1.57 percent annually (equal to Morgan Stanley’s forecasted increase in homes passed by cable broadband from 2010 to 2011). For the number of U.S. households, we use U.S. Census data on households from 2009 (117.2 million)8 and assume a constant annual percentage rate of growth to CSMG’s 2015 estimate of 127.1 million households.9 Finally, we assume that all the cable broadband homes passed will provide broadband speeds of at least 3 Mbps / 768 Kbps service by 2015. Based on the forecasts of total households and homes passed by cable broadband, 9.3 million homes will be passed by broadband from 2011 to 2015, leaving 3.4 million homes (equal to 2.7 percent of all households) not passed by broadband in 2015.
The FCC estimates the total cost to expand availability to the 5 million homes currently unserved by broadband is $20 billion in 2009.10 This translates to an average cost to deploy broadband of to unserved homes is $4,000 per home passed. We assume that the cost to serve any home not passed by broadband from 2011 to 2015 is $4,000 per home.
6. Robert C. Atkinson & Ivy E. Schultz, Columbia Institute for Tele‐Information (CITI), Broadband in America: Where It Is and Where It Is Going (According to Broadband Service Providers), Preliminary Report Prepared for the Staff of the FCC’s Omnibus Broadband Initiative, Nov. 11, 2009, at 59 [hereinafter Broadband in America].
7. Benjamin Swinburne, David Gober, & Ryan Fiftal, Morgan Stanley, Cable/Satellite: After Years of Deflation, Broadband Pricing set to Rise (Oct. 20, 2009), at Ex. 29.
8. U.S. Census Bureau, Households by Type, available at http://www.census.gov/population/socdemo/hh‐fam/hh1.xls
9. CSMG, National Broadband Plan Policy Evaluation (Nov. 2, 2009), at 5 [hereinafter CSMG NBP Evaluation].
10. Federal Communications Commission, National Broadband Plan, September Commission Meeting, at 16 (Sep. 29, 2009) (available at http://hraunfoss.fcc.gov/edocs_public/attachmatch/DOC‐293742A1.pdf).
P a g e | 8
B. Analysis of Direct Effects
1. Methodology and Assumptions
The incremental capital expenditures that are required to meet the goal of ubiquitous current‐generation broadband availability would have a direct, multiplicative effect on output and job creation when the economy is at less than full employment, as it is today.11 The direct effects are jobs and economic activity created as a direct result of increased outlays for equipment, increased employment for installation, and associated expenses (for example, jobs resulting from increased purchases of equipment needed for installation, such as bucket trucks and construction equipment). The most authoritative and generally accepted means of estimating the direct effect of increased investment is the RIMS II model, developed by the Bureau of Economic Analysis.
To estimate this direct effect, we use the most recent RIMS II multipliers on detailed industries by NAICS code, based on 1997 national benchmark input‐output data and 2006 regional data. Broadband deployment requires capital spending on equipment and construction. Therefore, we use multipliers for telephone apparatus manufacturing, fiber optic cable manufacturing, and construction.12 Eisenach, Singer and West (2009) use these
11. The multiplier is a standard principle in the macroeconomics literature. See, e.g., RUDIGER DORNBUSCH & STANLEY FISCHER, MACROECONOMICS 66 (McGraw Hill 6th ed. 1994). Richard Kahn first introduced the multiplier concept as an “employment multiplier.” See Richard F. Kahn, The Relation of Home Investment To Employment, 41 ECON. J. 173, 173‐98 (1931). John Maynard Keynes expanded upon this concept by introducing the “investment multiplier,” which is the multiplier used in our analysis. See John Maynard Keynes, A GENERAL THEORY OF EMPLOYMENT, INTEREST, AND MONEY 115 (Harcourt Brace & Co. 1964) (1936).
12. U.S. Department of Commerce, Bureau of Economic Analysis, Regional Input‐Output Modeling System (RIMS II), Table 1.5 (2008). Multipliers are based on the 1997 Benchmark Input‐Output Table for the Nation and 2006 regional data. These industries approximately match the expenditures made to deploy and connect broadband more closely than any other multiplier category. According to the 1997 NAICS definition, industry 334210 (Telephone apparatus manufacturing) consists of “[e]stablishments primarily engaged in manufacturing wire telephone and data communications equipment. These products may be standalone or board‐level components of a larger system. Examples of products made by these establishments are central office switching equipment, cordless telephones (except cellular), PBX equipment, telephones, telephone answering machines, and data communications equipment, such as bridges, routers, and gateways.” Industry 335921 (Fiber optic cable manufacturing) consists of “[e]stablishments primarily engaged in manufacturing insulated fiber‐optic cable from purchased fiber‐optic strand.” Industry 230000 (Construction) includes, among other types of construction establishments, “[e]stablishments primarily responsible for the entire construction (i.e., new work, reconstruction, or repairs) of electric power and communication transmission lines and towers, radio and television transmitting/receiving towers, cable laying, and cable television lines; (2) establishments identified as power and communication transmission line construction management firms; and (3) establishments identified as special trade contractors engaged in activities primarily related to power and communication transmission line construction.” Industry 334220 (Broadcast and wireless communications equipment) includes “establishments primarily engaged in manufacturing radio and television broadcast and wireless communications equipment. Examples of products made by these establishments are: transmitting and receiving antennas, cable television equipment, GPS equipment, pagers,
P a g e | 9
multipliers to estimate separate multipliers for different types of broadband spending by applying weights to each of the industry multipliers based on the allocation of broadband capital spending to each industry.13 They estimate a weighted average employment multiplier of 14.7412 for DSL and cable broadband.14 They estimate a final demand output multiplier of 2.8063 for DSL and cable broadband. We use these current‐generation broadband multipliers here in our analysis of the direct effect of capital expenditures required to make current‐generation broadband deployment ubiquitous by 2015.
These multipliers translate the effect of broadband capital spending on U.S. employment and GDP. The multiplicative effect occurs because higher expenditures on broadband deployment—equivalent to higher demand for construction and the products of equipment manufacturers—causes the equipment manufacturers and construction firms to hire more employees to meet the increased demand. The equipment manufacturers’ incomes and construction firms’ incomes increase as well due to the increased expenditures, which, according to the consumption function, will increase their consumption as well. The increased consumption of equipment manufacturers and construction firms will in turn increase the income and employment of their suppliers. The income and employment of those suppliers will then increase, and so on.
These multipliers show that a $1 million increase in the final demand for current‐generation broadband investment would create approximately 15 new jobs nationally. The timeframe over which employment would increase is debatable. In most cases, the BEA considers one year to be the appropriate time horizon for its multipliers to have achieved full effect.15 Other economists have estimated that at least two years may be required for incremental investment to achieve its full impact on the economy.16 The multiplier effect is most fully realized when there is substantial excess capacity, during economic recessions or sharp declines in specific sectors. Given the slack in the U.S. economy, which manifests itself in the form of a January 2010 unemployment rate of 9.7 percent,17 our estimates of the multiplier effect of increased capital expenditures reasonably capture the effect that
cellular phones, mobile communications equipment, and radio and television studio and broadcasting equipment.” See U.S. Census Bureau, 1997 NAICS and 1987 SIC Correspondence Tables, available at http://www.census.gov/epcd/www/naicstab.htm.
13. Jeffrey A. Eisenach, Hal J. Singer, & Jeffrey D. West, Economic Effects of Tax Incentives for Broadband Infrastructure Deployment, Fiber‐to‐the‐Home Council (2009) at 8.
14. Id. Table 2 at 8. Cable and DSL weights are 80 percent for telephone apparatus manufacturing and 20 percent for construction.
15. U.S. DEPARTMENT OF COMMERCE, BUREAU OF ECONOMIC ANALYSIS, REGIONAL INPUT‐OUTPUT MODELING SYSTEM REGIONAL MULTIPLIERS: A USER HANDBOOK FOR THE REGIONAL INPUT‐OUTPUT MODELING SYSTEM (RIMS II), at 8 (Mar. 1997).
16. See, e.g., OLIVER BLANCHARD, MACROECONOMICS 72‐73 (Prentice Hall 1997). 17. Press Release, U.S. Dept. of Labor, Bureau of Labor Statistics, The Employment Situation – January
2010 (Feb. 5, 2010) (on file with authors).
P a g e | 10
increased capital spending by BSPs would have on the U.S. economy. Because of today’s excess capacity in the labor market, the increased employment from the additional investment are more likely to occur within one‐year of the investment (as estimated by the BEA) than the two‐years estimated by other economists.
2. Results of Direct Effects Analysis
Table 3 shows our estimates of the direct effect of the increased capital expenditures required to reach ubiquitous deployment of current‐generation broadband by 2015.
TABLE 3: DIRECT ECONOMIC EFFECT OF EXPENDITURES REQUIRED TO REACH UBIQUITOUS DEPLOYMENT
OF 3 MBPS/768 KBPS BROADBAND, 2011‐2015 Total, 2011‐2015 Capital Expenditures on Broadband in Unserved Areas ($Billion)
Baseline ‐ No NBP Objective $37.1
Meet NBP Objective $50.6
Difference $13.6
Direct Effect on Employment (Avg. Annual Jobs) 39,961
Direct Effect on GDP ($Billion) $38.0
As Table 3 shows, we estimate that ubiquitous deployment of current‐generation broadband to unserved areas will increase capital expenditures by $13.6 billion from 2011 to 2015. This increase will directly result in an increase in GDP of $38.0 billion over those five years. On average over the five years, the increased investment will maintain an additional 39,961 jobs per year.
C. Analysis of Indirect Effects
In addition to these direct effects, the additional availability of broadband services will result in increased adoption, which in turn will lead to increased productivity and demand for other goods and services (“indirect effect”). The indirect effects of increased broadband investment result from the productivity increases, price reductions, and related savings associated with increased broadband adoption. Meeting the proposed NBP current‐generation objective would increase broadband adoption due to increased broadband availability in unserved areas. Our estimate utilizes reasonable assumptions regarding the impact of increased availability, and applies the results of authoritative empirical research on the impact of broadband adoption on employment to estimate these indirect effects. In this section, we estimate the indirect effects from increased broadband adoption resulting from the increased deployment necessary to meet the proposed NBP objective of ubiquitous access to current generation broadband.

P a g e | 11
1. Methodology and Assumptions
In our analysis of the direct effects, we estimated the effects resulting directly from increased investment in broadband infrastructure. The ultimate effect of this investment, however, will be to make broadband available in areas where broadband service is unavailable today. According to Morgan Stanley, the national residential broadband penetration rate was approximately 55 percent of all households as of 2009, and was forecasted to increase to 58.2 percent as of 2011.18 We assume that households who receive broadband availability as a result of the proposed current generation goal will begin subscribing to broadband in the year following deployment, and that once subscriptions begin, they will subscribe to broadband at the national average rate over the course of three years—that is, that 20 percent of households will subscribe in the first year, 40 percent in the second year, and 60 percent in the third year. Under this assumption, 49 percent of all new homes passed as a result of the proposed current generation NBP objective would be subscribers as of 2015.
To estimate the impact of increased broadband penetration on employment, we rely on the results of a 2007 study published by the Brookings Institution. In that study, Robert Crandall, William Lehr and Robert Litan found that a one percentage point increase in broadband population penetration (defined as broadband lines per person) will increase private, nonfarm employment by 293,200 jobs over the following year (when the economy is not at full employment).19
2. Results of Indirect Effects Analysis
Table 4 shows the results of our analysis of the indirect economic effects on job creation of the incremental investment required to meet the current generation NBP proposal. Specifically, we find that ubiquitous current‐generation broadband deployment beyond what is currently forecasted would increase employment by a total of at least 149,000 jobs by 2015.
TABLE 4: SUMMARY OF INDIRECT EFFECTS OF UBIQUITOUS CURRENT GENERATION ACCESS ON JOB CREATION, 2011‐2015
2011-2015 Additional Homes Passed (Million) 3.389 Additional Subscribers (Million) 1.656
Increase in Overall U.S. Broadband Penetration Rate 0.51% Additional Jobs 149,105
18 Benjamin Swinburne, David Gober, & Ryan Fiftal, Morgan Stanley, Cable/Satellite: After Years of Deflation, Broadband Pricing set to Rise (Oct. 20, 2009), at Ex. 29.
19 Robert Crandall, William Lehr, & Robert Litan, The Effects of Broadband Deployment on Output & Employment: A Cross Sectional Analysis of U.S. Data, 6 ISSUES IN ECONOMIC POLICY 12‐14 (July 2007).
P a g e | 12
III. ECONOMIC EFFECTS OF INVESTMENTS REQUIRED TO MEET NEXT‐GENERATION GOAL OF COMPETITIVE ACCESS BY 2015
In this section, we compare the current forecasts of investment in next‐generation broadband deployment with the investments required to achieve the goal of competitive access to 50 Mbps downstream speed and 20 Mbps upstream speed for 80 percent of U.S. households by 2015. We assume that the additional investment would be fiber‐to‐the‐home (“FTTH”) exclusively. Currently, the largest FTTH provider is Verizon, whose FTTH product is called “FiOS.”
A. Estimating Additional Capital Expenditures Required
For our baseline forecasts with no tax incentives, we use the forecasts of homes passed and homes served by FTTH for 2009 and 2015 from CSMG.20 CSMG forecasts 18 million homes passed by FTTH in 2009 (equal to 15 percent of all U.S. households) and 34.5 million homes passed in 2015 (equal to 27 percent of all U.S. households). CSMG forecasts 4.5 million homes served by FTTH in 2009 (25 percent of homes passed) and 14.3 million homes served in 2015 (41 percent of homes passed). We assume a constant increase in the number of homes passed and served for the years between 2009 and 2015.
To estimate the cost to deploy and serve a home with FTTH, we use CSMG’s 2009 cost estimates, which are broken down by three levels based on the topography being passed.21 CSMG estimates providers’ cost to pass a home with FTTH to be $700 per home passed for the lowest 54th percentile of homes (in terms of cost), $1,246 per home passed for the 55th to 69th percentile, and $1,661 per home passed for the 70th to 80th percentile (33 percent higher than the $1,246 cost to pass a home in the 55th to 69th percentile).22 CSMG does not provide a cost estimate for deploying FTTH to the costliest 20th percentile of homes. We assume that the cost is $2,214 per home in 2009—33 percent higher than the cost to pass a home in the 70th to 80th percentile. CSMG estimates the 2009 cost per home served to be $650 for all homes served regardless of area.23 After 2009, we assume a 7.7 percent annual decrease in the cost to pass and serve a home with FTTH, based on averages of the estimates presented by CSMG.24 Finally, we assume that 100 percent of forecasted FTTH capital expenditures would meet the speed limits necessary for eligibility for the tax expensing and tax‐credit bond proposals.
20. CSMG NBP Evaluation, at 5. 21. Id. at 35‐36. 22. Id. at 36. 23. Id. 24. Id. at 35.
P a g e | 13
To estimate capital expenditures required to meet the proposed NBP objectives for competitive next‐generation deployment for 80 percent of U.S. households, we first note that cable companies are already forecasted to pass 92 percent of U.S. households with DOCSIS 3.0 upgraded broadband service by 2013.25 Advertised speeds for DOCSIS 3.0 are already as high as 50 Mbps and 101 Mbps downstream;26 accordingly, we assume that no incremental cable broadband investment is required to meet the proposed objective. Because at least two BSPs providing next‐generation service are required to meet the proposed NBP objective for competitive access, we assume that the second BSP in an area already forecasted to be passed by cable is a FTTH provider. We assume that the number of homes passed by next‐generation broadband (other than cable) grows at a constant level from 2010 to 2015. We assume that the ratio of homes served to homes passed by FTTH remains the same as in the baseline scenario. Finally, we assume that the costs per home passed and home served are the same in the baseline scenario as in the baseline scenario.
Table 5 compares the percent of homes passed, homes served, and capital expenditures for FTTH.
TABLE 5: DEPLOYMENT OF FTTH REQUIRED TO PROVIDE COMPETITIVE ACCESS TO BROADBAND AT SPEEDS OF 50 MBPS DOWNSTREAM/20 MBPS UPSTREAM FOR 80 PERCENT OF U.S. HOUSEHOLDS,
2011‐2015 2011 2012 2013 2014 2015 Total Homes Passed by FTTH (Million)
Baseline - No NBP Objective 23.5 26.3 29.0 31.8 34.5 34.5 Meet NBP Objective 36.9 53.1 69.3 85.5 101.6 101.6
Difference 13.4 26.9 40.3 53.7 67.1 67.1
Homes Served by FTTH (Million) Baseline - No NBP Objective 7.8 9.4 11.0 12.7 14.3 14.3 Meet NBP Objective 12.2 19.0 26.4 34.1 42.1 42.1
Difference 4.4 9.6 15.3 21.4 27.8 27.8
Capital Expenditures on FTTH ($Billion) Baseline - No NBP Objective $2.5 $2.4 $2.2 $2.0 $1.9 $10.9 Meet NBP Objective $13.0 $12.4 $12.7 $16.9 $19.3 $74.3
Difference $10.5 $10.0 $10.5 $14.9 $17.5 $63.4
As Table 5 shows, 67.1 million additional homes would be passed by FTTH if the NBP goal of competitive deployment of next‐generation broadband to 80 percent of U.S. households
25. Broadband in America, at 8. 26. Id.
P a g e | 14
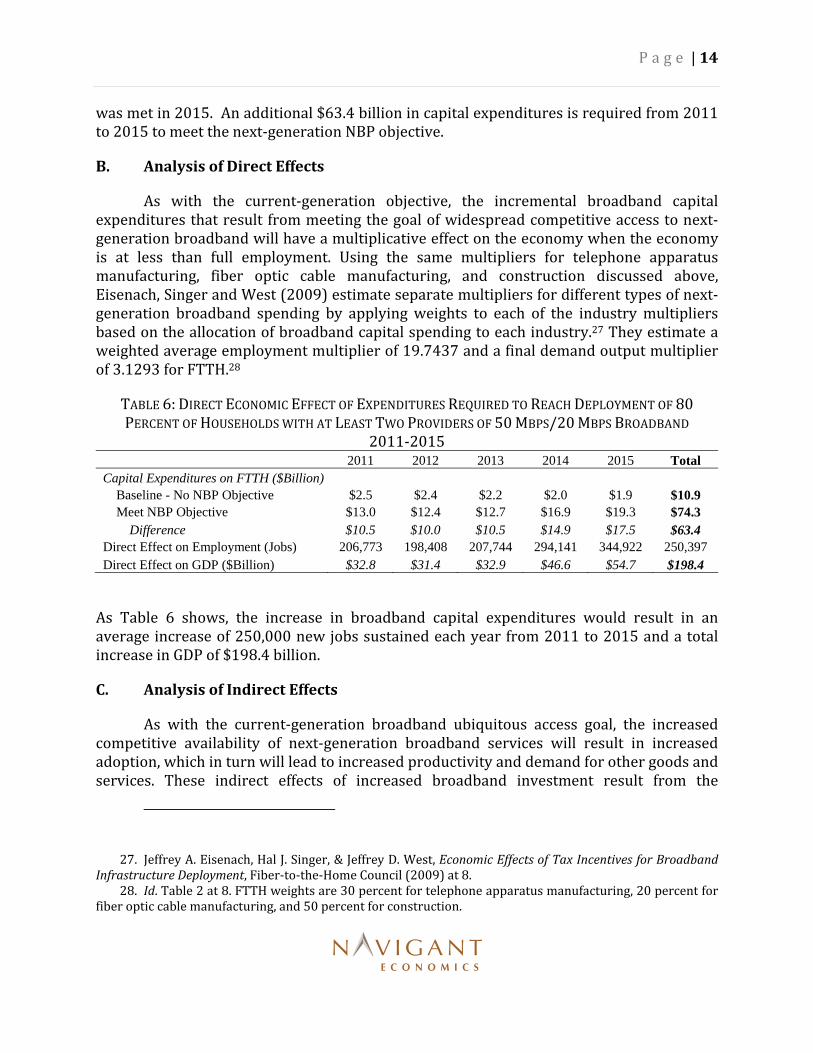
was met in 2015. An additional $63.4 billion in capital expenditures is required from 2011 to 2015 to meet the next‐generation NBP objective.
B. Analysis of Direct Effects
As with the current‐generation objective, the incremental broadband capital expenditures that result from meeting the goal of widespread competitive access to next‐generation broadband will have a multiplicative effect on the economy when the economy is at less than full employment. Using the same multipliers for telephone apparatus manufacturing, fiber optic cable manufacturing, and construction discussed above, Eisenach, Singer and West (2009) estimate separate multipliers for different types of next‐generation broadband spending by applying weights to each of the industry multipliers based on the allocation of broadband capital spending to each industry.27 They estimate a weighted average employment multiplier of 19.7437 and a final demand output multiplier of 3.1293 for FTTH.28
TABLE 6: DIRECT ECONOMIC EFFECT OF EXPENDITURES REQUIRED TO REACH DEPLOYMENT OF 80 PERCENT OF HOUSEHOLDS WITH AT LEAST TWO PROVIDERS OF 50 MBPS/20 MBPS BROADBAND
2011‐2015 2011 2012 2013 2014 2015 Total Capital Expenditures on FTTH ($Billion)
Baseline - No NBP Objective $2.5 $2.4 $2.2 $2.0 $1.9 $10.9 Meet NBP Objective $13.0 $12.4 $12.7 $16.9 $19.3 $74.3
Difference $10.5 $10.0 $10.5 $14.9 $17.5 $63.4 Direct Effect on Employment (Jobs) 206,773 198,408 207,744 294,141 344,922 250,397 Direct Effect on GDP ($Billion) $32.8 $31.4 $32.9 $46.6 $54.7 $198.4
As Table 6 shows, the increase in broadband capital expenditures would result in an average increase of 250,000 new jobs sustained each year from 2011 to 2015 and a total increase in GDP of $198.4 billion.
C. Analysis of Indirect Effects
As with the current‐generation broadband ubiquitous access goal, the increased competitive availability of next‐generation broadband services will result in increased adoption, which in turn will lead to increased productivity and demand for other goods and services. These indirect effects of increased broadband investment result from the
27. Jeffrey A. Eisenach, Hal J. Singer, & Jeffrey D. West, Economic Effects of Tax Incentives for Broadband Infrastructure Deployment, Fiber‐to‐the‐Home Council (2009) at 8.
28. Id. Table 2 at 8. FTTH weights are 30 percent for telephone apparatus manufacturing, 20 percent for fiber optic cable manufacturing, and 50 percent for construction.

P a g e | 15
productivity increases, price reductions, and related savings associated with increased broadband adoption. The increase in competitive next‐generation access would increase broadband adoption due to the reduced prices and improved quality associated with the availability of more technologically advanced broadband infrastructures generally.
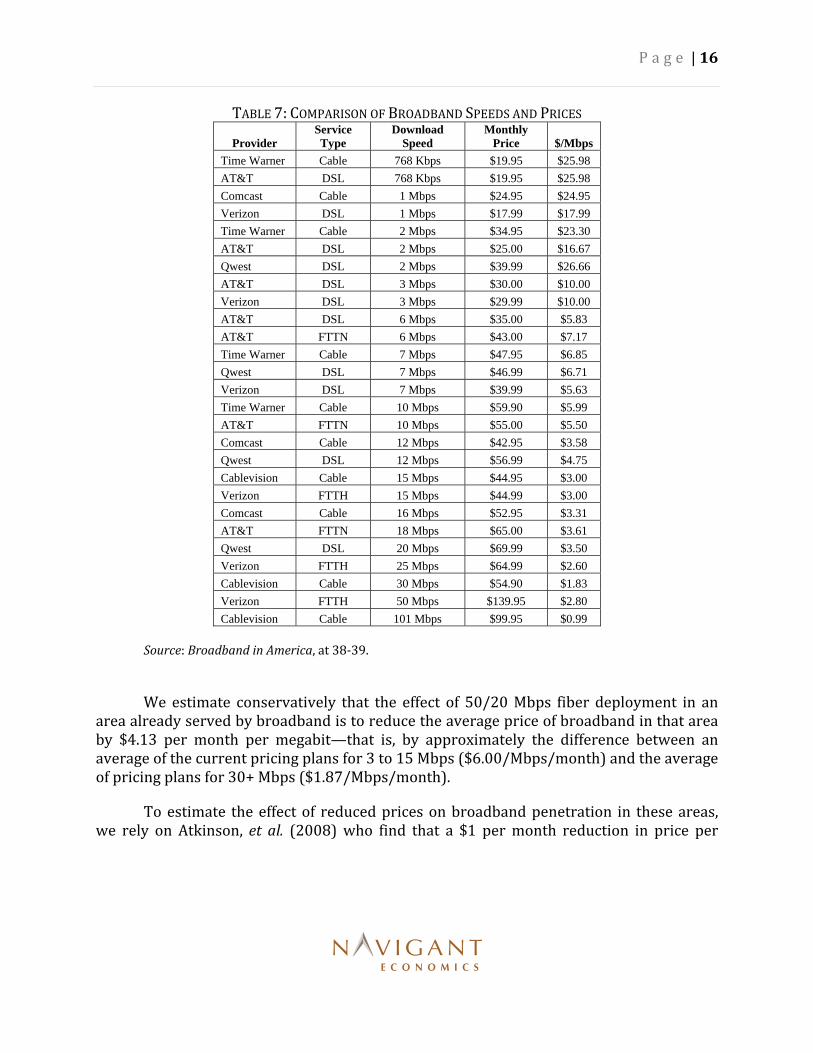
We model the adoption effect of increased competitive high‐speed broadband access (50/20Mpbs) as an effective reduction in the price, where price is measured as the monthly cost per downstream megabit.29 As shown in Table 7 below, the price per megabit for high speed services is far lower than for slower DSL and cable connections.
29. Price per megabit is a widely utilized measure of broadband pricing, as it captures the “quality” element associated with higher speed services. See, e.g., OECD Broadband Portal, available at http://www.oecd.org/sti/ict/broadband.
P a g e | 16
TABLE 7: COMPARISON OF BROADBAND SPEEDS AND PRICES
Provider Service Type
Download Speed
Monthly Price $/Mbps
Time Warner Cable 768 Kbps $19.95 $25.98
AT&T DSL 768 Kbps $19.95 $25.98
Comcast Cable 1 Mbps $24.95 $24.95
Verizon DSL 1 Mbps $17.99 $17.99
Time Warner Cable 2 Mbps $34.95 $23.30
AT&T DSL 2 Mbps $25.00 $16.67
Qwest DSL 2 Mbps $39.99 $26.66
AT&T DSL 3 Mbps $30.00 $10.00
Verizon DSL 3 Mbps $29.99 $10.00
AT&T DSL 6 Mbps $35.00 $5.83
AT&T FTTN 6 Mbps $43.00 $7.17
Time Warner Cable 7 Mbps $47.95 $6.85
Qwest DSL 7 Mbps $46.99 $6.71
Verizon DSL 7 Mbps $39.99 $5.63
Time Warner Cable 10 Mbps $59.90 $5.99
AT&T FTTN 10 Mbps $55.00 $5.50
Comcast Cable 12 Mbps $42.95 $3.58
Qwest DSL 12 Mbps $56.99 $4.75
Cablevision Cable 15 Mbps $44.95 $3.00
Verizon FTTH 15 Mbps $44.99 $3.00
Comcast Cable 16 Mbps $52.95 $3.31
AT&T FTTN 18 Mbps $65.00 $3.61
Qwest DSL 20 Mbps $69.99 $3.50
Verizon FTTH 25 Mbps $64.99 $2.60
Cablevision Cable 30 Mbps $54.90 $1.83
Verizon FTTH 50 Mbps $139.95 $2.80
Cablevision Cable 101 Mbps $99.95 $0.99
Source: Broadband in America, at 38‐39.
We estimate conservatively that the effect of 50/20 Mbps fiber deployment in an area already served by broadband is to reduce the average price of broadband in that area by $4.13 per month per megabit—that is, by approximately the difference between an average of the current pricing plans for 3 to 15 Mbps ($6.00/Mbps/month) and the average of pricing plans for 30+ Mbps ($1.87/Mbps/month).
To estimate the effect of reduced prices on broadband penetration in these areas, we rely on Atkinson, et al. (2008) who find that a $1 per month reduction in price per
P a g e | 17
megabit increases broadband penetration by 2.4 percentage points.30 We assume the full effect of reduced prices would be felt over four years, beginning once the deployment has been made (i.e., at the end of each year). Thus, a $4.13 reduction in price/Mbps would result in a 9.91 percentage point increase in broadband penetration by the end of 2015.31 Finally, we use the same estimates discussed above from the 2007 Brookings Institution study to estimate the increase in employment resulting from increased broadband penetration.
In addition, we assume that 10 percent of all homes passed by fiber as a result of the various 50/20 Mbps proposals would be located in areas that would not have broadband availability without the expanded fiber deployment. Therefore, we assume that 49 percent of those newly passed homes become broadband subscribers by the end of 2015, just as we assumed in our analysis above of the indirect effects of the proposed current generation goal.
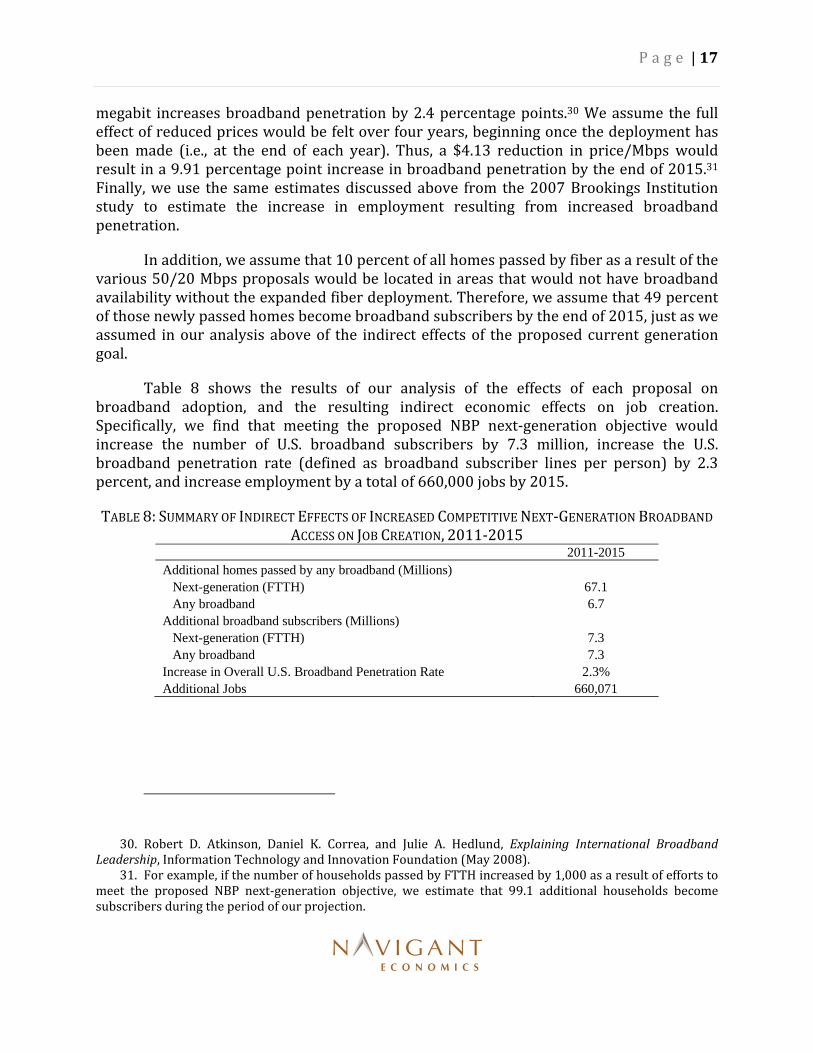
Table 8 shows the results of our analysis of the effects of each proposal on broadband adoption, and the resulting indirect economic effects on job creation. Specifically, we find that meeting the proposed NBP next‐generation objective would increase the number of U.S. broadband subscribers by 7.3 million, increase the U.S. broadband penetration rate (defined as broadband subscriber lines per person) by 2.3 percent, and increase employment by a total of 660,000 jobs by 2015.
TABLE 8: SUMMARY OF INDIRECT EFFECTS OF INCREASED COMPETITIVE NEXT‐GENERATION BROADBAND ACCESS ON JOB CREATION, 2011‐2015
2011-2015 Additional homes passed by any broadband (Millions) Next-generation (FTTH) 67.1 Any broadband 6.7 Additional broadband subscribers (Millions) Next-generation (FTTH) 7.3 Any broadband 7.3 Increase in Overall U.S. Broadband Penetration Rate 2.3% Additional Jobs 660,071
30. Robert D. Atkinson, Daniel K. Correa, and Julie A. Hedlund, Explaining International Broadband Leadership, Information Technology and Innovation Foundation (May 2008).
31. For example, if the number of households passed by FTTH increased by 1,000 as a result of efforts to meet the proposed NBP next‐generation objective, we estimate that 99.1 additional households become subscribers during the period of our projection.
P a g e | 18
IV. THE IMPACT OF TAX INCENTIVES ON INVESTMENT AND THE ECONOMY
Investment tax incentives would serve an important role in achieving the proposed NBP current‐ and next‐generation goals. Tax incentives would help achieve the objectives by reducing the after‐tax cost of investment and thus increasing the effective rate of return on investment (ROI) from what it would be in the absence of the tax incentive. As a result, firms choose to make investments that would otherwise be uneconomic, and the overall amount of investment in the economy increases accordingly.32
We analyze two specific proposals each for current‐generation and next‐generation deployments. In this section, we briefly describe each.
A. Expensing Proposals
Expensing (or accelerated depreciation) affects the after‐tax cost of investment by allowing a firm to deduct from its taxable earnings the full amount spent on the investment, rather than stretching that deduction out based on the depreciation schedule for that investment. The after‐tax cost of the investment is thus reduced by the difference between the value of the tax deduction taken in year one, on the one hand, and the present value of the flow of tax deductions that would otherwise be taken over the life of the equipment. The impact of expensing thus depends on the depreciation life (for tax purposes) of the eligible investment, and on the applicable tax rate.
32. The evidence of increased economic benefits from tax incentives for capital spending is widespread. For example, the Institute for Policy Innovation has found that tax cuts designed to decrease the cost of capital investment generate the biggest economic benefits. See Aldona Robbins & Gary Robbins, What’s the Most Potent Way to Stimulate the Economy?, Institute for Policy Innovation Issue Brief, Oct. 10, 2001, available at http://www.ipi.org/IPI%5CIPIPublications.nsf/PublicationLookupFullTextPDF/CD7A8BCC847C6B2586256AE1007ADDA9/$File/IB-Stimulus.pdf?OpenElement. Two former Treasury Department officials recently argued that “Capital investment is a sure-fire way of creating jobs and income, and more if it is badly needed.” Ernest S. Christian & Gary A. Robbins, Obama’s Best Jobs Idea, WALL ST. J., Dec. 12, 2009, available at http://online.wsj.com/article/SB10001424052748704517504574589983993789584.html. In particular, complete expensing of the cost of capital would encourage investment. See R. Glenn Hubbard, A Fiscal Plan with Global Benefits, FINANCIAL TIMES, Mar. 18, 2005. Increased capital expensing is therefore supported by the U.S. Chamber of Commerce. See Statement by U.S. Chamber Vice President and Chief Economist Martin Regalia before the House Small Business Subcommittee on Tax, Finance, and Exports on Small Business Expensing Provisions, Apr. 3, 2003, available at http://www.uschamber.com/issues/testimony/2003/030403regalia.htm. Long-term growth and increased employment would be the direct result of increased investment through accelerated depreciation (such as complete expensing). See Frederick w. Smith, One Simple Way to Create Jobs, WALL STREET JOURNAL, Feb. 5, 2010; Council on Competitiveness, Rebound: Three Essentials To Get the Economy Back on Track, available at http://www.compete.org/publications/detail/632/rebound; Bruce Bartlett, A Republican Strategy for Stimulus, FORBES.COM, Jan. 16, 2009, available at http://www.forbes.com/2009/01/15/republicans-taxes-investment-oped-cx_bb_0116bartlett.html; N. Gregory Mankiw, Tax Cuts Might Accomplish What Spending Hasn’t, N.Y. TIMES, Dec. 12, 2009, available at http://www.nytimes.com/2009/12/13/business/economy/13view.html.
P a g e | 19
50/20 Mbps: The specific expensing proposal we were asked to analyze would allow for immediate expensing of 100 percent of investments made over five years (2011‐2015) that provide 50 Mbps downstream/20 Mbps upstream service to any area in the United States.
3 Mbps / 768 Kbps: The second specific expensing proposal we were asked to analyze would allow for immediate expensing of 100 percent of investments made over five years (2011‐2015) that provide 3 Mbps downstream/768 Kbps upstream service to areas in the United States currently unserved by any broadband service of that speed.
B. Tax‐Credit Bond Proposal
Tax‐credit bonds are debt instruments that qualify bondholders to receive tax credits from the U.S. Treasury, effectively reducing the bondholders’ tax liability by an amount equal to the tax credit. As a result, the yield required to sell such bonds at par is reduced by the value of the tax credit to the bonds’ purchasers.
The tax‐credit bond proposals we were asked to analyze call for the Secretary of the Treasury to establish tax credits that would allow issuers to sell the bonds at a zero coupon rate. Thus, bondholders would receive tax credits equal to the amount they would have received in interest had the bonds been sold without the tax credit. Under the next‐generation proposal, private sector entities would be able to borrow up to $10 billion in tax‐credit bonds per year over the next five years (2011‐2015) to fund investments on broadband deployments providing 50 Mbps downstream/20 Mbps upstream service to any area in the United States. Under the current‐generation proposal, private sector entities would be able to borrow up to $10 billion in tax‐credit bonds per year over the next five years (2011‐2015) to fund investments on broadband deployments providing 3 Mbps downstream/768 Kbps upstream service to any area in the United States unserved by any broadband service of that speed.
C. Estimating Additional Capital Expenditures Resulting from Tax Incentives
To estimate the additional capital expenditures on broadband deployment resulting from the proposed tax incentives, we make several assumptions about the effects of expensing and tax credit bonds on the cost of deployments. Each expensing proposal lowers the after‐tax cost of the goods and services purchased through a BSP’s capital investments. Under the 100 percent tax expensing proposal, expenditures are expensed completely in the year they are made. Without the expensing proposal, those expenditures would have been expensed over several years according to the appropriate depreciation schedule. To estimate the effective decrease in cost resulting from the tax expensing proposal, we estimate the net present value (NPV) of the forgone tax savings in future years for the broadband provider resulting from the immediate expensing of capital in year one under the proposal. We assume that the investment is 15‐year depreciable property, and the taxpayer follows a half‐year convention and applies a 150 percent declining
P a g e | 20
balance depreciation method. Therefore, from a $100 investment, we deduct $5 for normal first‐year depreciation. This leaves $95 to be deducted under broadband expensing. We then determine the NPV of a $95 tax deduction, which we estimate at $33.25, assuming a 35 percent corporate tax rate. Next, using a weighted average cost of capital (WACC) of 10 percent, we reduce $33.25 by the NPV of the year 2‐15 depreciation deductions that would have been available in the absence of broadband expensing, equal to $18.17. Reducing $33.25 by $18.17, the remaining $15.08 would be the benefit of 100 percent broadband expensing, equating to 15.08 percent of the total investment.
To estimate changes in capital expenditures resulting from the lower after‐tax cost of the products and services purchased by BSPs due to the expensing proposals, we assume that the elasticity of the BSPs’ demand for those products and services is between ‐0.85 and ‐2.5. With an elasticity of demand of ‐0.85, a reduction in the BSP’s cost of expenditures of 1 percent will increase its demand for those products and services by 0.85 percent. Likewise, an elasticity of ‐2.5 indicates that a reduction in the BSP’s cost of expenditures of 1 percent will increase its demand for those products and services by 2.5 percent.
As discussed above, the tax‐credit bond proposals call for the Secretary of the Treasury to establish tax credits that allow the bonds to be sold at a zero coupon rate—that is, providing the eligible borrowers with interest‐free financing for the eligible projects. We assume that these terms are sufficiently attractive that the bonds would be utilized up to the specified limits—that is, $10 billion annually. We assume that an equal amount of $10 billion in private sector tax‐credit bonds are issued annually beginning in 2011.
Further, because the proposal calls for the private bonds to be used only to finance projects approved by state public utility commissions, we assume that 100 percent of the investment that results is incremental—that is, used for projects that would not otherwise have been undertaken. Hence, we assume that the effect of each of the tax‐credit bond proposals is to increase total investment in current and next‐generation broadband projects by an average of $10 billion annually for five years, or until deployment is ubiquitous.
Finally, all of our estimates assume continuation of the current regulatory environment for broadband deployment and access. Any additional regulations, such as open access rules for FTTH or “net neutrality” rules, would decrease the baseline investments and our estimates of incremental investments attributable to the tax incentives.33
33. See Robert W. Crandall & Hal J. Singer, The Economic Impact of Broadband (2010) for a discussion of how those proposals would decrease a BSP’s incentives to invest in infrastructure.
P a g e | 21
TABLE 9: INCREMENTAL CAPITAL EXPENDITURES RESULTING FROM BROADBAND TAX INCENTIVES
Baseline Meet NBP
Goal 100% Tax Expensing
Tax Credit Bonds
Current-Generation Homes Passed in 2015 (Million) 123.7 127.1 124.8 - 127.0 127.1
Capital Expenditures on Unpassed Homes, 2011-2015 ($Billion) $37.1 $50.6 $41.8 - $50.3 $50.6 Next-Generation Homes Passed in 2015 (Million) 34.5 101.6 36.5 - 40.3 91.5 Homes Served in 2015 (Million) 14.3 42.1 15.1 - 16.7 37.9 Capital Expenditures, 2011-2015 ($Billion) $10.9 $74.3 $12.3 - $15.0 $60.9
As Table 9 shows, the tax expensing proposal increases the number of homes with access to current‐generation broadband to between 124.8 million and 127.0 million. The tax credit bond proposal results in ubiquitous deployment of current‐generation broadband. The tax expensing proposal for next‐generation broadband increases the number of homes with competitive access to 50/20 Mbps broadband from 34.5 million to between 36.5 million and 40.3 million in 2015. This increase is far short of the increase needed to reach 80 percent of all U.S. households (101.6 million) in 2015. The tax credit bonds, however, result in 91.5 million homes with competitive access to 50/20 Mbps broadband, much closer to the goal of 101.6 million homes passed.
D. Analysis of Direct Effects
Table 10 shows our estimates of the direct effect of increased capital expenditures in broadband if the 3 Mbps/768 Kbps broadband expensing proposal is implemented for 2011‐2015.
TABLE 10: DIRECT ECONOMIC EFFECT OF 3 MBPS /768 KBPS TAX INCENTIVE PROPOSALS, 2011‐2015 Tax Expensing Tax Credit Bonds
Capital Expenditures on Broadband in Unserved Areas ($Billion)
Baseline ‐ No NBP Objective $37.1 $37.1
Tax Incentive $41.8 ‐ $50.3 $50.6
Difference $4.8 ‐ $13.2 $13.6
Direct Effect on Employment (Avg. Annual Jobs) 14,010 ‐ 39,056 39,961
Direct Effect on GDP ($Billion) $13.3 ‐ $37.2 $38.0
As Table 10 shows, we estimate that the 3 Mbps/768 Kbps expensing proposal will increase capital expenditures on broadband by between $4.8 billion and $13.2 billion from 2011 to 2015. This increase will directly result in an increase in GDP of between $13.3 billion and $37.2 billion over the five years. On average over the five years, the increased investment will maintain an additional 14,010 to 39,056 jobs per year. The direct effect on
P a g e | 22
the economy of the tax credit bond proposal would be 39,961 new jobs sustained per year and a $38.0 billion increase in GDP from 2011 to 2015.
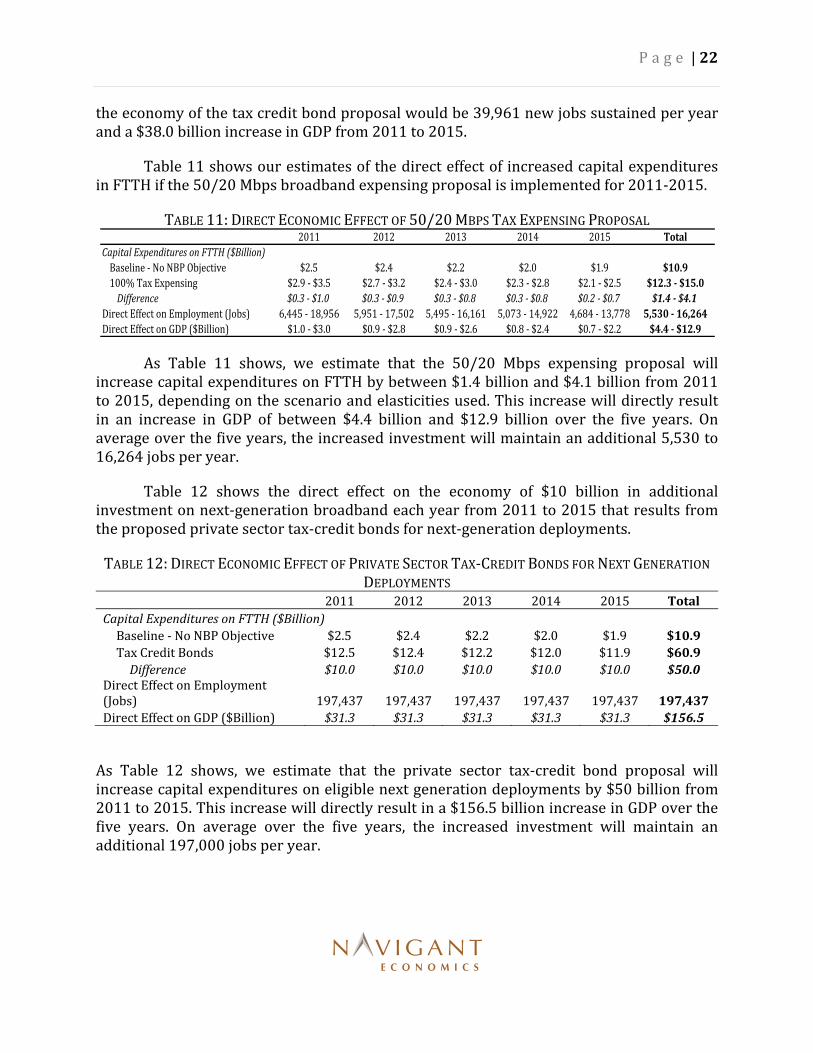
Table 11 shows our estimates of the direct effect of increased capital expenditures in FTTH if the 50/20 Mbps broadband expensing proposal is implemented for 2011‐2015.
TABLE 11: DIRECT ECONOMIC EFFECT OF 50/20 MBPS TAX EXPENSING PROPOSAL
As Table 11 shows, we estimate that the 50/20 Mbps expensing proposal will increase capital expenditures on FTTH by between $1.4 billion and $4.1 billion from 2011 to 2015, depending on the scenario and elasticities used. This increase will directly result in an increase in GDP of between $4.4 billion and $12.9 billion over the five years. On average over the five years, the increased investment will maintain an additional 5,530 to 16,264 jobs per year.
Table 12 shows the direct effect on the economy of $10 billion in additional investment on next‐generation broadband each year from 2011 to 2015 that results from the proposed private sector tax‐credit bonds for next‐generation deployments.
TABLE 12: DIRECT ECONOMIC EFFECT OF PRIVATE SECTOR TAX‐CREDIT BONDS FOR NEXT GENERATION DEPLOYMENTS
2011 2012 2013 2014 2015 Total
Capital Expenditures on FTTH ($Billion)
Baseline ‐ No NBP Objective $2.5 $2.4 $2.2 $2.0 $1.9 $10.9
Tax Credit Bonds $12.5 $12.4 $12.2 $12.0 $11.9 $60.9
Difference $10.0 $10.0 $10.0 $10.0 $10.0 $50.0 Direct Effect on Employment (Jobs) 197,437 197,437 197,437 197,437 197,437 197,437
Direct Effect on GDP ($Billion) $31.3 $31.3 $31.3 $31.3 $31.3 $156.5
As Table 12 shows, we estimate that the private sector tax‐credit bond proposal will increase capital expenditures on eligible next generation deployments by $50 billion from 2011 to 2015. This increase will directly result in a $156.5 billion increase in GDP over the five years. On average over the five years, the increased investment will maintain an additional 197,000 jobs per year.
2011 2012 2013 2014 2015 Total
Capital Expenditures on FTTH ($Billion)
Baseline ‐ No NBP Objective $2.5 $2.4 $2.2 $2.0 $1.9 $10.9
100% Tax Expensing $2.9 ‐ $3.5 $2.7 ‐ $3.2 $2.4 ‐ $3.0 $2.3 ‐ $2.8 $2.1 ‐ $2.5 $12.3 ‐ $15.0
Difference $0.3 ‐ $1.0 $0.3 ‐ $0.9 $0.3 ‐ $0.8 $0.3 ‐ $0.8 $0.2 ‐ $0.7 $1.4 ‐ $4.1
Direct Effect on Employment (Jobs) 6,445 ‐ 18,956 5,951 ‐ 17,502 5,495 ‐ 16,161 5,073 ‐ 14,922 4,684 ‐ 13,778 5,530 ‐ 16,264
Direct Effect on GDP ($Billion) $1.0 ‐ $3.0 $0.9 ‐ $2.8 $0.9 ‐ $2.6 $0.8 ‐ $2.4 $0.7 ‐ $2.2 $4.4 ‐ $12.9
P a g e | 23
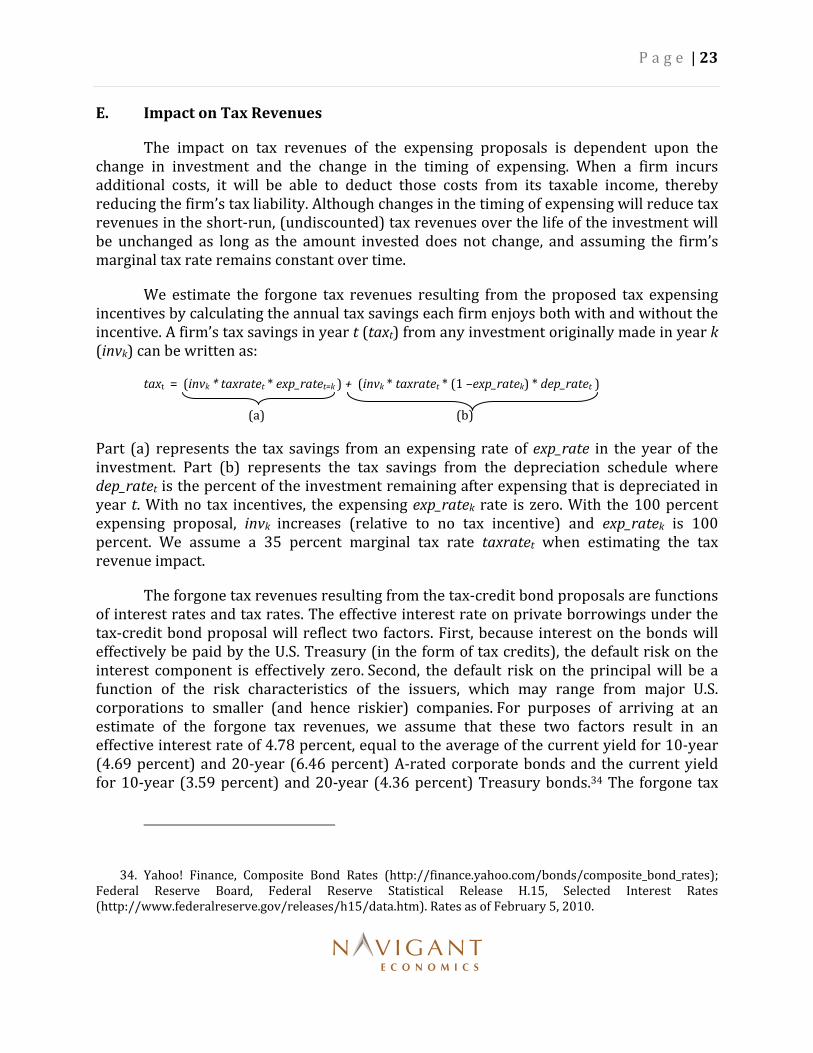
E. Impact on Tax Revenues
The impact on tax revenues of the expensing proposals is dependent upon the change in investment and the change in the timing of expensing. When a firm incurs additional costs, it will be able to deduct those costs from its taxable income, thereby reducing the firm’s tax liability. Although changes in the timing of expensing will reduce tax revenues in the short‐run, (undiscounted) tax revenues over the life of the investment will be unchanged as long as the amount invested does not change, and assuming the firm’s marginal tax rate remains constant over time.
We estimate the forgone tax revenues resulting from the proposed tax expensing incentives by calculating the annual tax savings each firm enjoys both with and without the incentive. A firm’s tax savings in year t (taxt) from any investment originally made in year k (invk) can be written as:
taxt = (invk * taxratet * exp_ratet=k ) + (invk * taxratet * (1 –exp_ratek) * dep_ratet )
(a) (b)
Part (a) represents the tax savings from an expensing rate of exp_rate in the year of the investment. Part (b) represents the tax savings from the depreciation schedule where dep_ratet is the percent of the investment remaining after expensing that is depreciated in year t. With no tax incentives, the expensing exp_ratek rate is zero. With the 100 percent expensing proposal, invk increases (relative to no tax incentive) and exp_ratek is 100 percent. We assume a 35 percent marginal tax rate taxratet when estimating the tax revenue impact.
The forgone tax revenues resulting from the tax‐credit bond proposals are functions of interest rates and tax rates. The effective interest rate on private borrowings under the tax‐credit bond proposal will reflect two factors. First, because interest on the bonds will effectively be paid by the U.S. Treasury (in the form of tax credits), the default risk on the interest component is effectively zero. Second, the default risk on the principal will be a function of the risk characteristics of the issuers, which may range from major U.S. corporations to smaller (and hence riskier) companies. For purposes of arriving at an estimate of the forgone tax revenues, we assume that these two factors result in an effective interest rate of 4.78 percent, equal to the average of the current yield for 10‐year (4.69 percent) and 20‐year (6.46 percent) A‐rated corporate bonds and the current yield for 10‐year (3.59 percent) and 20‐year (4.36 percent) Treasury bonds.34 The forgone tax
34. Yahoo! Finance, Composite Bond Rates (http://finance.yahoo.com/bonds/composite_bond_rates); Federal Reserve Board, Federal Reserve Statistical Release H.15, Selected Interest Rates (http://www.federalreserve.gov/releases/h15/data.htm). Rates as of February 5, 2010.
P a g e | 24
revenues in each year until maturity resulting from the private tax‐credit bond proposal is equal to the effective interest rate multiplied by the amount issued.
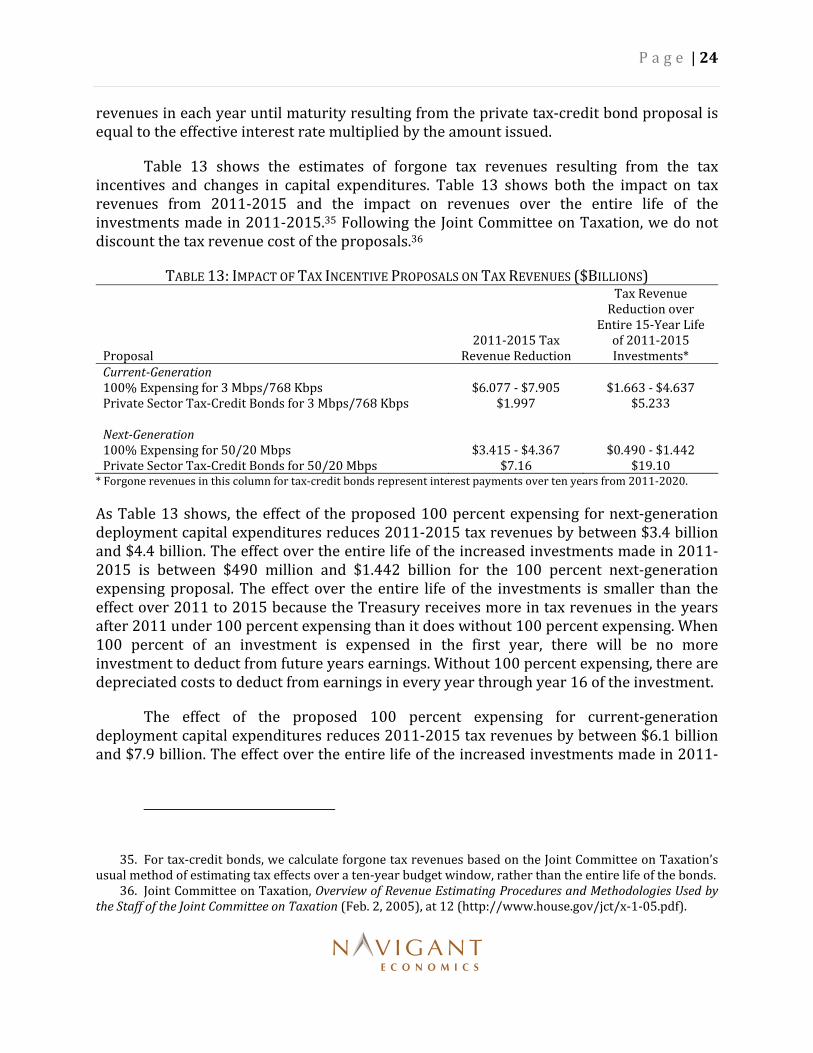
Table 13 shows the estimates of forgone tax revenues resulting from the tax incentives and changes in capital expenditures. Table 13 shows both the impact on tax revenues from 2011‐2015 and the impact on revenues over the entire life of the investments made in 2011‐2015.35 Following the Joint Committee on Taxation, we do not discount the tax revenue cost of the proposals.36
TABLE 13: IMPACT OF TAX INCENTIVE PROPOSALS ON TAX REVENUES ($BILLIONS)
Proposal 2011‐2015 Tax
Revenue Reduction
Tax Revenue Reduction over
Entire 15‐Year Life of 2011‐2015 Investments*
Current‐Generation 100% Expensing for 3 Mbps/768 Kbps $6.077 ‐ $7.905 $1.663 ‐ $4.637Private Sector Tax‐Credit Bonds for 3 Mbps/768 Kbps $1.997 $5.233 Next‐Generation 100% Expensing for 50/20 Mbps $3.415 ‐ $4.367 $0.490 ‐ $1.442Private Sector Tax‐Credit Bonds for 50/20 Mbps $7.16 $19.10* Forgone revenues in this column for tax‐credit bonds represent interest payments over ten years from 2011‐2020.
As Table 13 shows, the effect of the proposed 100 percent expensing for next‐generation deployment capital expenditures reduces 2011‐2015 tax revenues by between $3.4 billion and $4.4 billion. The effect over the entire life of the increased investments made in 2011‐2015 is between $490 million and $1.442 billion for the 100 percent next‐generation expensing proposal. The effect over the entire life of the investments is smaller than the effect over 2011 to 2015 because the Treasury receives more in tax revenues in the years after 2011 under 100 percent expensing than it does without 100 percent expensing. When 100 percent of an investment is expensed in the first year, there will be no more investment to deduct from future years earnings. Without 100 percent expensing, there are depreciated costs to deduct from earnings in every year through year 16 of the investment.
The effect of the proposed 100 percent expensing for current‐generation deployment capital expenditures reduces 2011‐2015 tax revenues by between $6.1 billion and $7.9 billion. The effect over the entire life of the increased investments made in 2011‐
35. For tax‐credit bonds, we calculate forgone tax revenues based on the Joint Committee on Taxation’s usual method of estimating tax effects over a ten‐year budget window, rather than the entire life of the bonds.
36. Joint Committee on Taxation, Overview of Revenue Estimating Procedures and Methodologies Used by the Staff of the Joint Committee on Taxation (Feb. 2, 2005), at 12 (http://www.house.gov/jct/x‐1‐05.pdf).
P a g e | 25
2015 due to the current‐generation expensing proposal is between $1.7 billion and $4.6 billion.
By focusing only on firms’ increased expenses, Table 13 overstates the true net impact of the various tax proposals on tax revenues. We do not attempt to estimate the increase in tax revenues that would result from the tax incentives in our analysis. For example, increased employment through the direct effects would result in increased personal incomes, which would result in increased income tax revenues. In addition, firms making the investments would see their profits increase through greater consumption of their broadband services, which would increase their corporate income taxes.
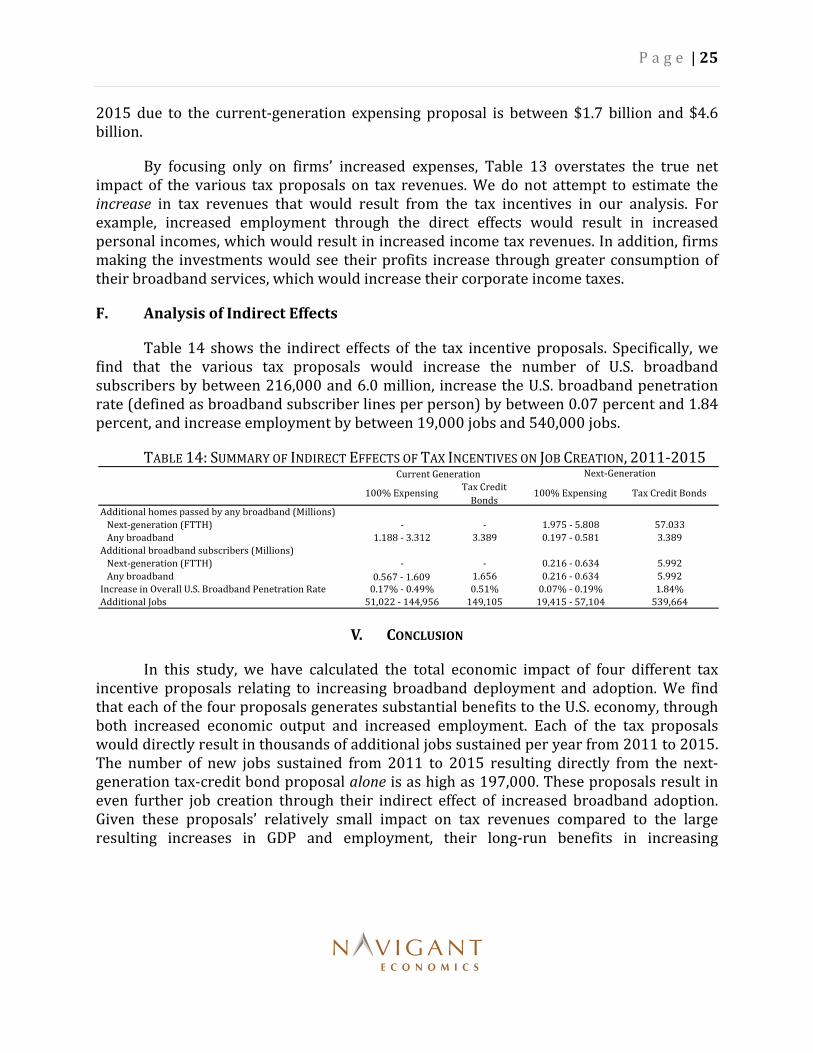
F. Analysis of Indirect Effects
Table 14 shows the indirect effects of the tax incentive proposals. Specifically, we find that the various tax proposals would increase the number of U.S. broadband subscribers by between 216,000 and 6.0 million, increase the U.S. broadband penetration rate (defined as broadband subscriber lines per person) by between 0.07 percent and 1.84 percent, and increase employment by between 19,000 jobs and 540,000 jobs.
TABLE 14: SUMMARY OF INDIRECT EFFECTS OF TAX INCENTIVES ON JOB CREATION, 2011‐2015
V. CONCLUSION
In this study, we have calculated the total economic impact of four different tax incentive proposals relating to increasing broadband deployment and adoption. We find that each of the four proposals generates substantial benefits to the U.S. economy, through both increased economic output and increased employment. Each of the tax proposals would directly result in thousands of additional jobs sustained per year from 2011 to 2015. The number of new jobs sustained from 2011 to 2015 resulting directly from the next‐generation tax‐credit bond proposal alone is as high as 197,000. These proposals result in even further job creation through their indirect effect of increased broadband adoption. Given these proposals’ relatively small impact on tax revenues compared to the large resulting increases in GDP and employment, their long‐run benefits in increasing
100% ExpensingTax Credit
Bonds100% Expensing Tax Credit Bonds
Additional homes passed by any broadband (Millions)
Next‐generation (FTTH) ‐ ‐ 1.975 ‐ 5.808 57.033
Any broadband 1.188 ‐ 3.312 3.389 0.197 ‐ 0.581 3.389
Additional broadband subscribers (Millions)
Next‐generation (FTTH) ‐ ‐ 0.216 ‐ 0.634 5.992
Any broadband 0.567 ‐ 1.609 1.656 0.216 ‐ 0.634 5.992
Increase in Overall U.S. Broadband Penetration Rate 0.17% ‐ 0.49% 0.51% 0.07% ‐ 0.19% 1.84%
Additional Jobs 51,022 ‐ 144,956 149,105 19,415 ‐ 57,104 539,664
Current Generation Next‐Generation

P a g e | 26
productivity and competitiveness, and their significant and virtually immediate impact on economic activity,37 the adoption of any of these proposals would create substantial net benefits to the U.S. economy.
37. For a discussion of the importance of timing in the effectiveness of fiscal stimulus policies, see Peter R. Orszag, Options for Responding to Short‐Term Economic Weakness, Testimony Before the Committee on Finance, United States Senate (January 22, 2008), especially at 5 (“The timing of fiscal stimulus is critical. If the policies do not generate additional spending when the economy is in a phase of very slow growth or a recession, they will provide little help to the economy when it is needed.”) and at 8 (“Tax cuts for business investment may be more effective in boosting short‐term demand if they are temporary than if they are permanent. Firms may view them as one‐time opportunities for tax savings, which may induce firms to move up some of their future investment plans to the present.”)