dr, reddy - betapharm
DESCRIPTION
Dr, Reddy - BetapharmTRANSCRIPT
Dr. Reddy - Betapharm
Deal Ya No Deal – Team 1

Pre- Deal
Deal
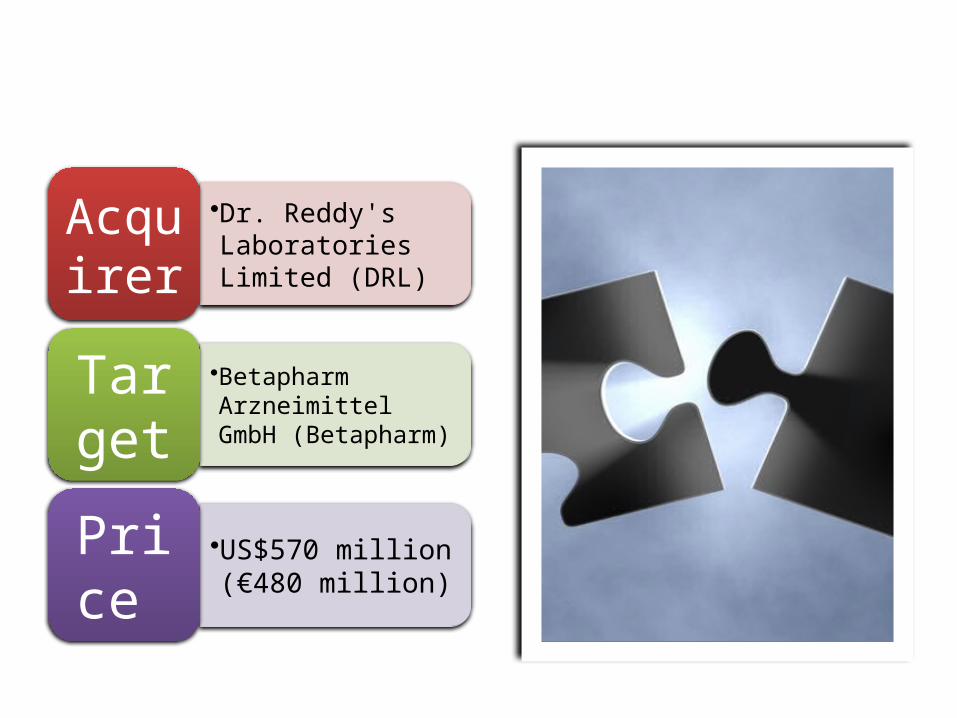
•Dr. Reddy's Laboratories Limited (DRL)
Acquirer
•Betapharm Arzneimittel GmbH (Betapharm)
Target
•US$570 million (€480 million)
Price
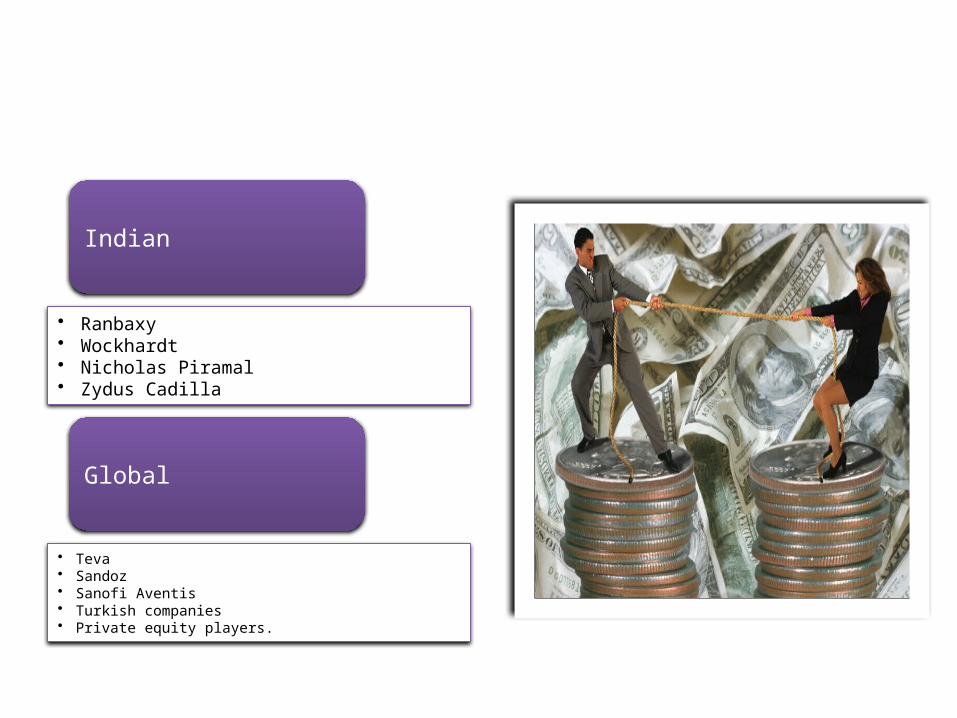
Other Bidders
Indian
• Ranbaxy• Wockhardt• Nicholas Piramal• Zydus Cadilla
Global
• Teva• Sandoz• Sanofi Aventis• Turkish companies• Private equity players.
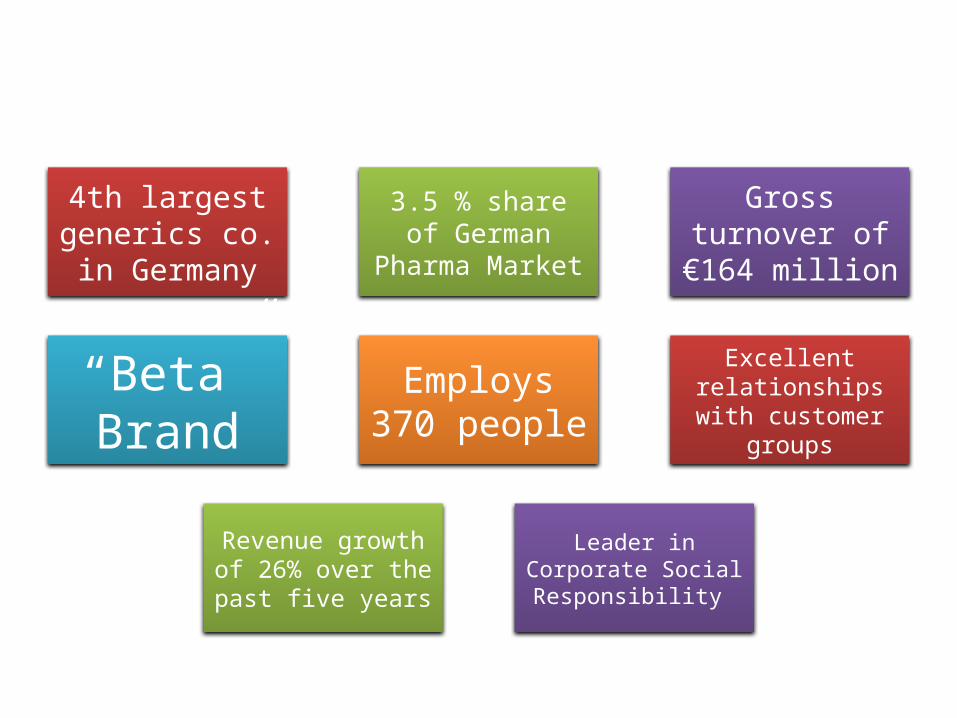
Betapharm
4th largest generics co. in Germany
3.5 % share of German
Pharma Market
Gross turnover of €164 million
“Beta” Brand
Employs 370 people
Excellent relationships
with customer groups
Revenue growth of 26% over the past five years
Leader in Corporate Social Responsibility
Dr. Reddy Labs
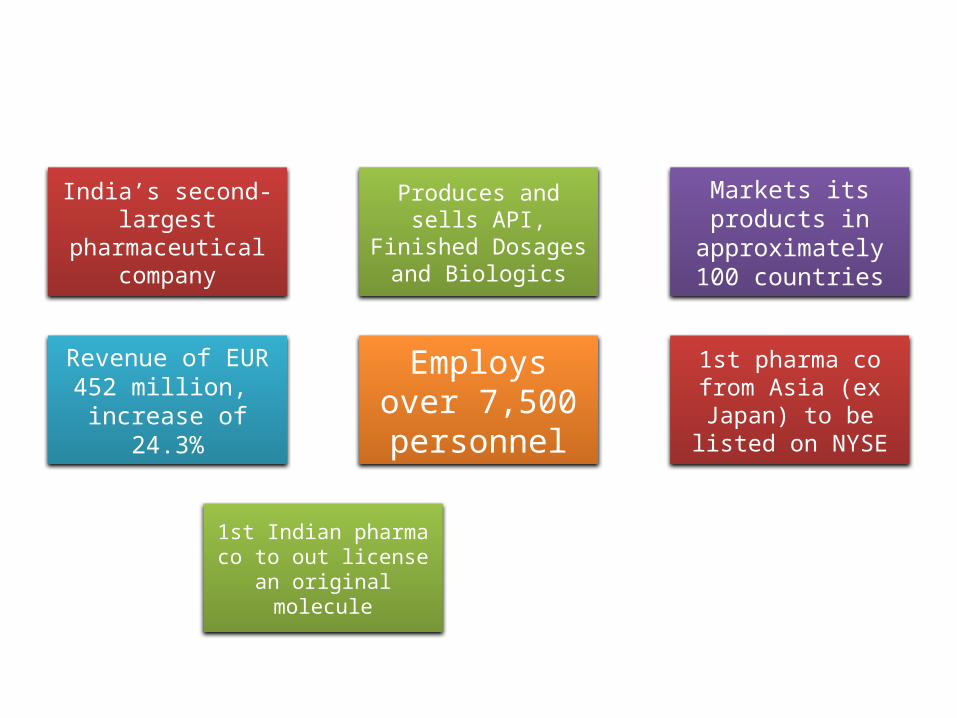
India’s second-largest
pharmaceutical company
Produces and sells API, Finished
Dosages and Biologics
Markets its products in
approximately 100 countries
Revenue of EUR 452 million, increase of
24.3%
Employs over 7,500 personnel
1st pharma co from Asia (ex Japan) to be
listed on NYSE
1st Indian pharma co to out
license an original molecule

Perfect Pharma Acquisition

Rationale
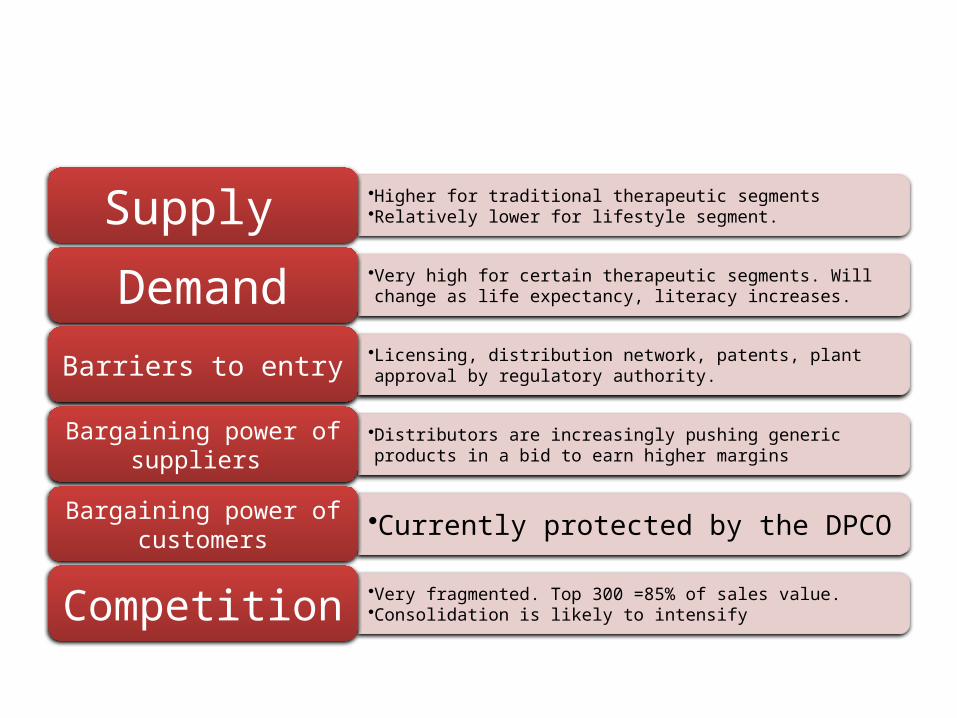
Limitations in India
•Higher for traditional therapeutic segments•Relatively lower for lifestyle segment.Supply •Very high for certain therapeutic segments. Will change as life expectancy, literacy increases.Demand•Licensing, distribution network, patents, plant approval by regulatory authority.Barriers to entry
•Distributors are increasingly pushing generic products in a bid to earn higher margins
Bargaining power of suppliers
•Currently protected by the DPCOBargaining power of customers
•Very fragmented. Top 300 =85% of sales value. •Consolidation is likely to intensifyCompetition
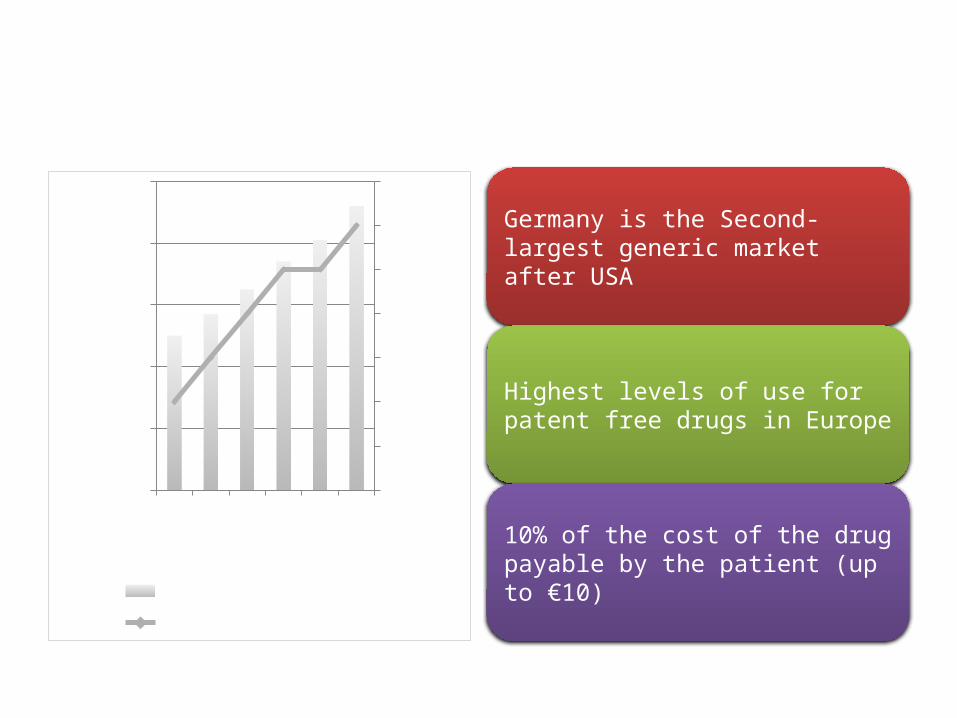
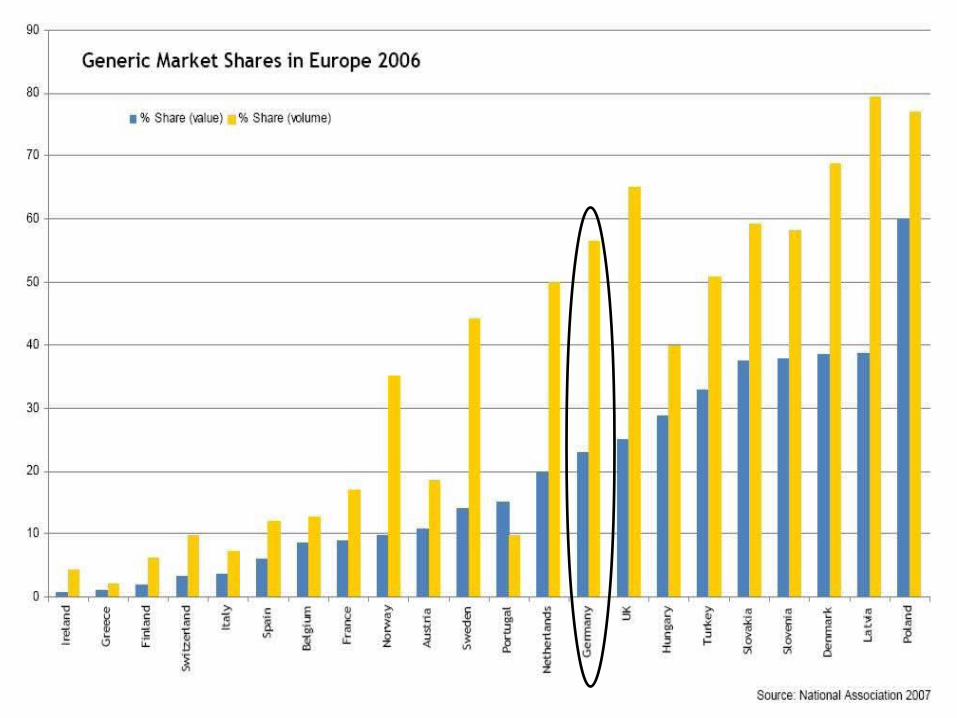
Access to the German Generics
Germany is the Second-largest generic market after USA
Highest levels of use for patent free drugs in Europe
10% of the cost of the drug payable by the patient (up to €10)
2001
2002
2003
2004
2005
2006
0
2
4
6
8
10
25
26
27
28
29
30
31
32
Gernerics (USD Bn)Penetration %
Gen
eri
cs
Pen
etr
ati
on
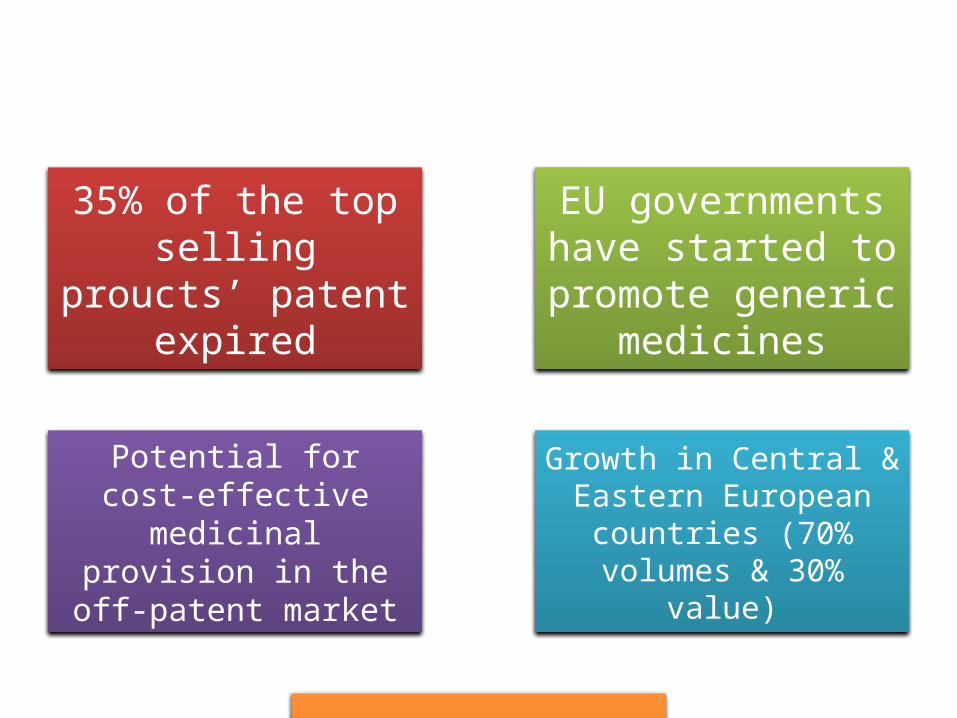
Strategic presence in the Europe
35% of the top selling proucts’ patent expired
EU governments have started to promote generic
medicines
Potential for cost-effective medicinal
provision in the off-patent market
Growth in Central & Eastern European
countries (70% volumes & 30%
value)
Availability of affordable generic medicines is major budgetary factor
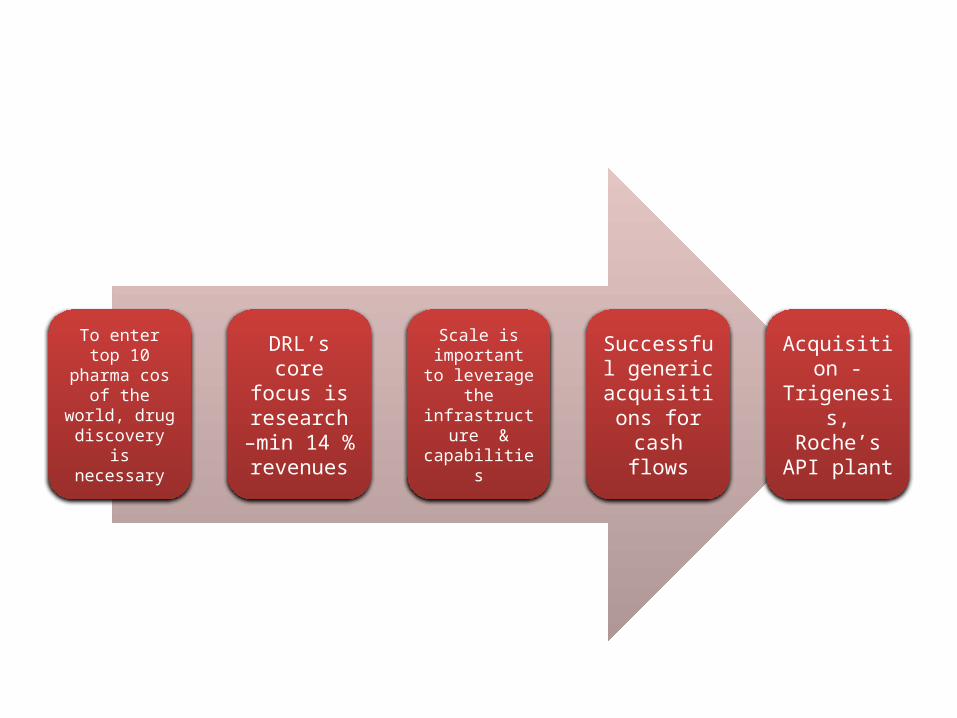
De Risking Drug discovery
To enter top 10 pharma cos of the
world, drug discovery is necessary
DRL’s core focus is
research –min 14 % revenues
Scale is important
to leverage the
infrastructure &
capabilities
Successful generic acquisitio
ns for cash flows
Acquisition -
Trigenesis,
Roche’s API plant
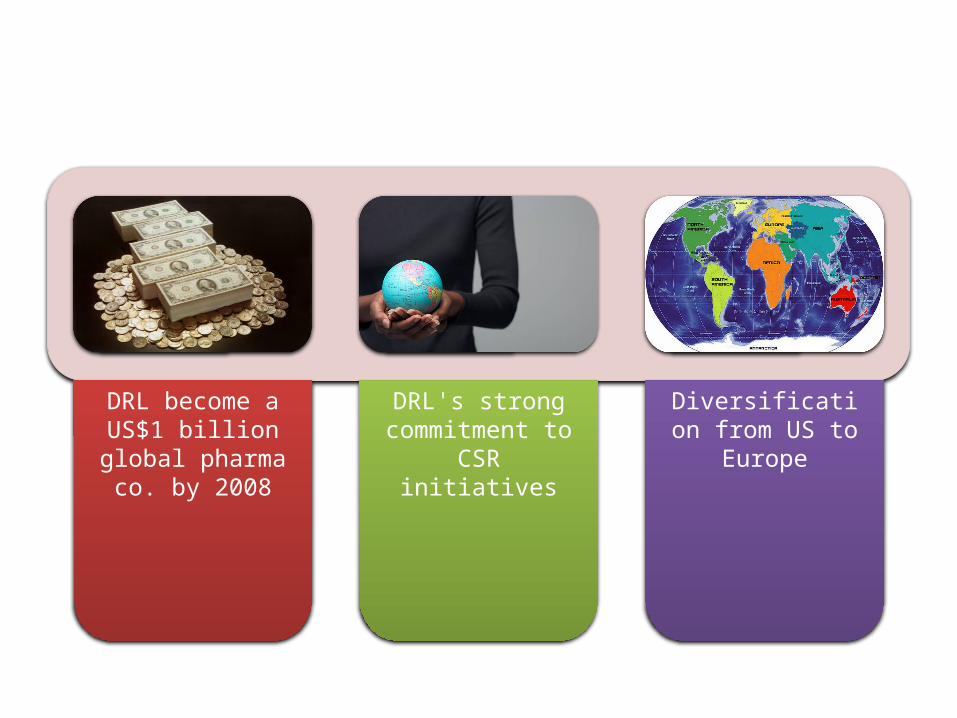
Miscellaneous
DRL become a US$1 billion
global pharma co. by 2008
DRL's strong commitment to CSR initiatives
Diversification from US to
Europe
Options
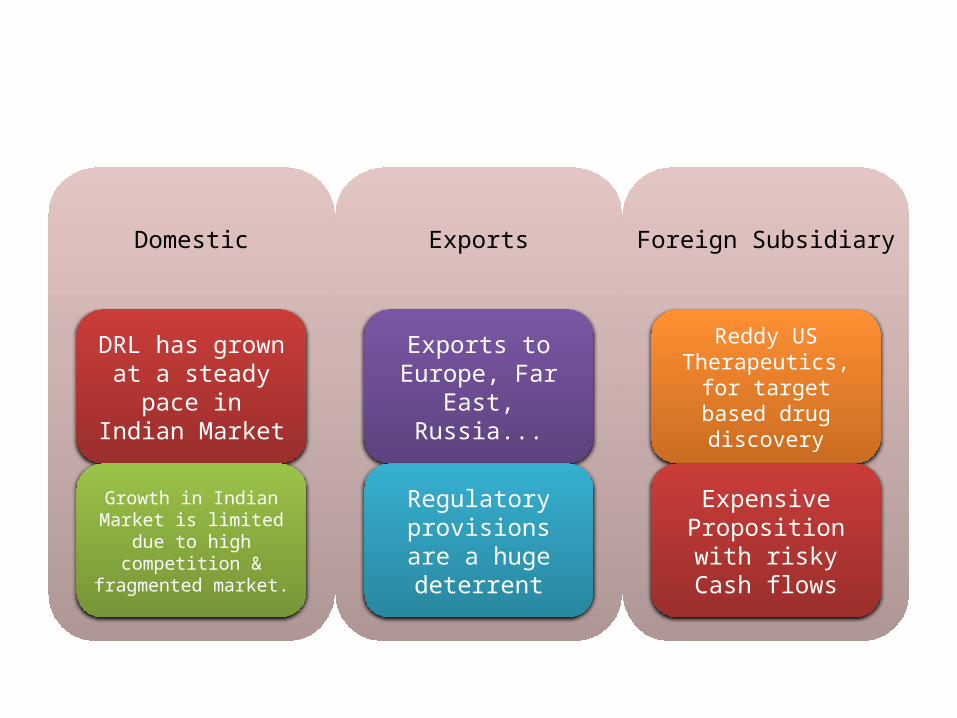
Organic
Domestic
DRL has grown at a steady
pace in Indian Market
Growth in Indian Market is limited
due to high competition &
fragmented market.
Exports
Exports to Europe, Far
East, Russia...
Regulatory provisions are a huge deterrent
Foreign Subsidiary
Reddy US Therapeutics,
for target based drug discovery
Expensive Proposition with risky Cash flows
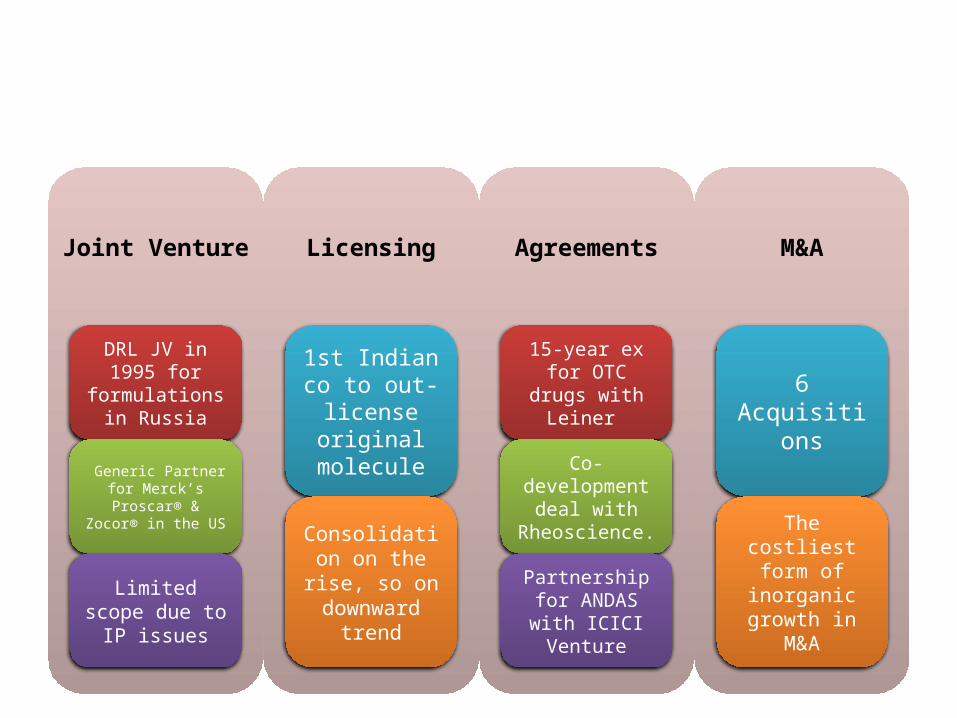
Inorganic
Joint Venture
DRL JV in 1995 for
formulations in Russia
Generic Partner for Merck’s Proscar® &
Zocor® in the US
Limited scope due to IP issues
Licensing
1st Indian co to out-
license original
molecule
Consolidation on the rise, so on downward
trend
Agreements
15-year ex for OTC drugs with Leiner
Co-development
deal with Rheoscience.
Partnership for ANDAS with ICICI Venture
M&A
6 Acquisition
s
The costliest form of
inorganic growth in
M&A
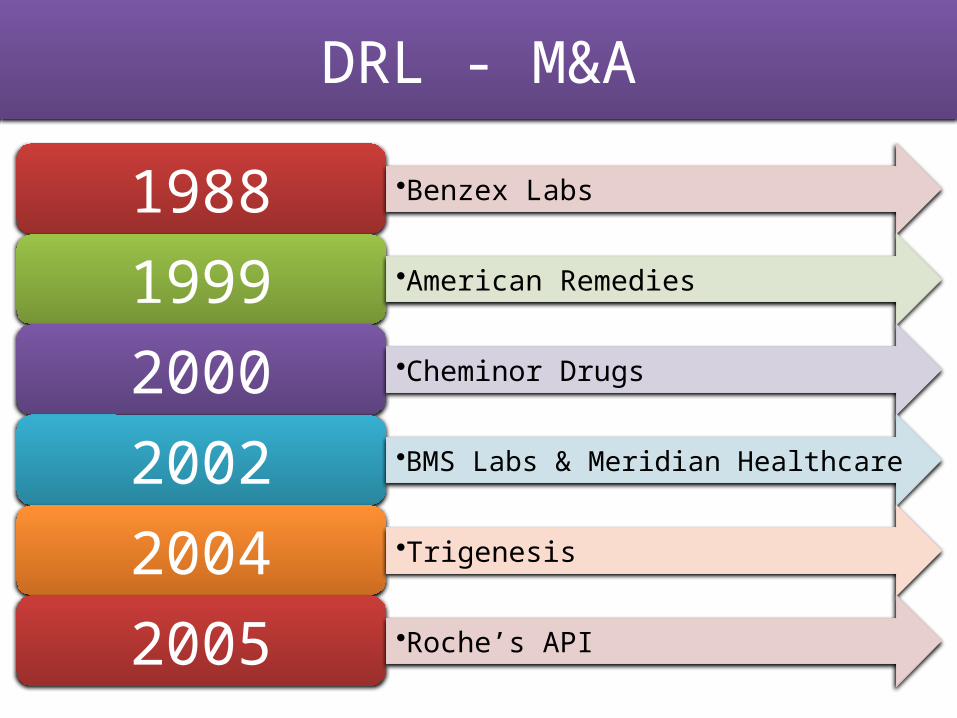
DRL - M&A
1988 •Benzex Labs
1999 •American Remedies
2000 •Cheminor Drugs
2002 •BMS Labs & Meridian Healthcare
2004 •Trigenesis
2005 •Roche’s API
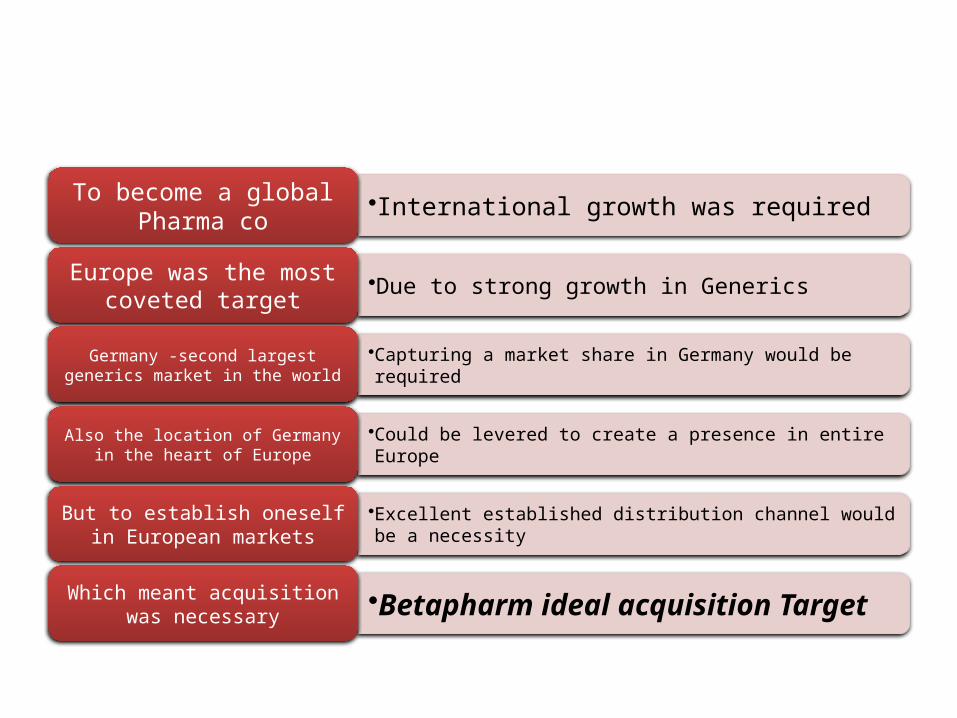
Betapharm – Ideal Acquisition
•International growth was requiredTo become a global Pharma co
•Due to strong growth in GenericsEurope was the most coveted target
•Capturing a market share in Germany would be required
Germany -second largest generics market in the world
•Could be levered to create a presence in entire EuropeAlso the location of Germany
in the heart of Europe
•Excellent established distribution channel would be a necessity
But to establish oneself in European markets
•Betapharm ideal acquisition TargetWhich meant acquisition
was necessary
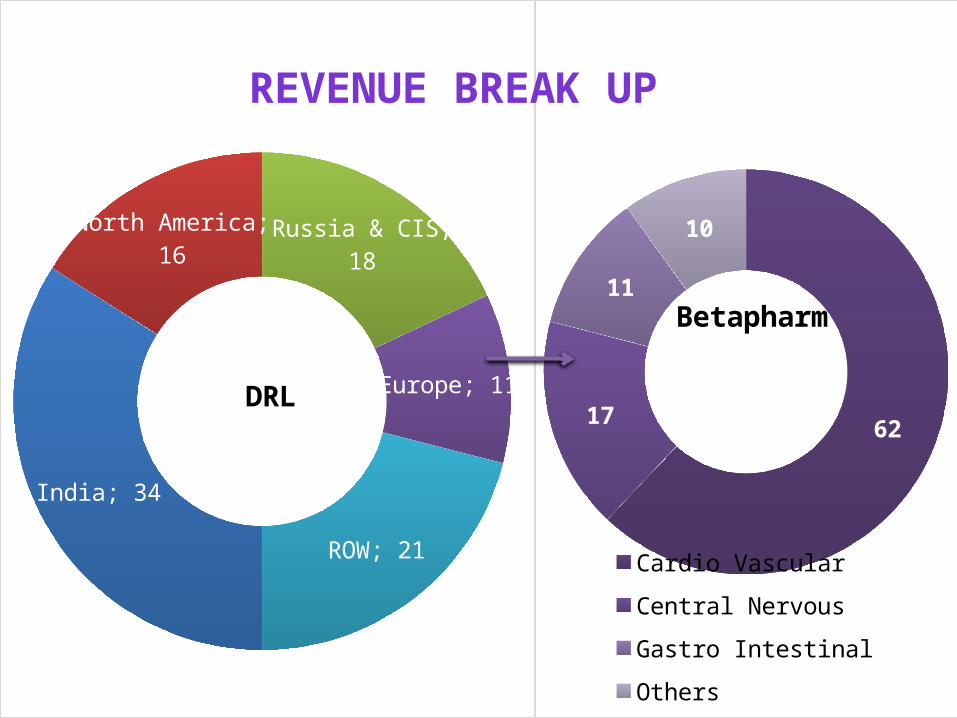
India; 34
North America; 16
Russia & CIS; 18
Europe; 11
ROW; 21
DRL6217
11
10
Betapharm
Cardio Vascular
Central Nervous
Gastro Intestinal
Others
REVENUE BREAK UP
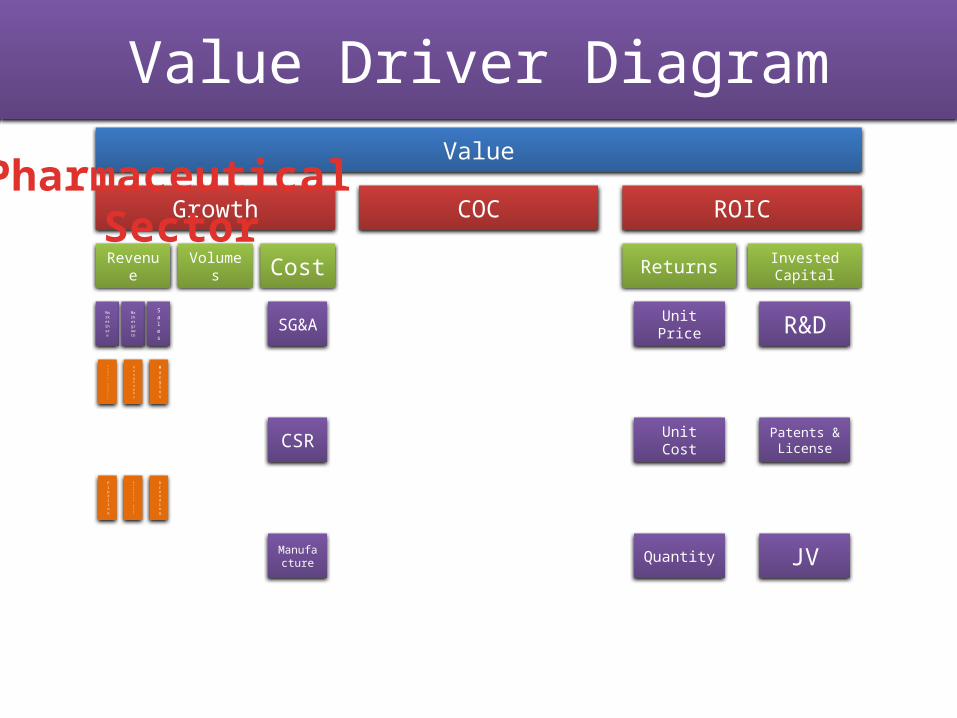
Value Driver DiagramValue
Growth
Revenue
Market Share
Product Quality
Pipeline
Market growth
Geography
Business Unit
Sales
Margins
Branding
Volumes Cost
SG&A
CSR
Manufacture
COC ROIC
Returns
Unit Price
Unit Cost
Quantity
Invested Capital
R&D
Patents & License
JV
Pharmaceutical Sector

Valuation
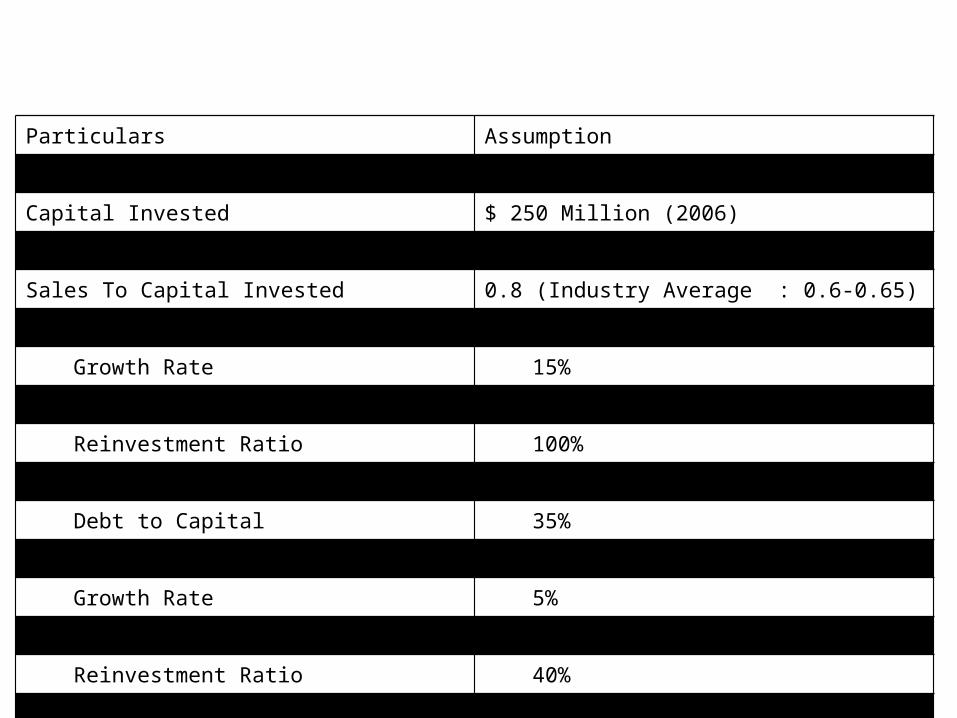
DCF Valuation - Base CaseParticulars Assumption
Revenue $ 200 Million (2006)
Capital Invested $ 250 Million (2006)
German Corporate Tax Rate 30% (Marginal)
Sales To Capital Invested 0.8 (Industry Average : 0.6-0.65)
High Growth Period 5 years
Growth Rate 15%
EBIT Margin 25%
Reinvestment Ratio 100%
ROIC 15%
Debt to Capital 35%
Stable Period Perpetuity
Growth Rate 5%
EBIT Margin 18%
Reinvestment Ratio 40%
ROIC 12%
Debt to Capital 35%

Valuation - Base Case
Particulars Value
Enterprise Value (EV) $ 333.52 Million
EV/EBIT 6.67
EV/EBIT(1-t) 9.53
EV/Sales 1.67
EV/Capital Invested 1.33
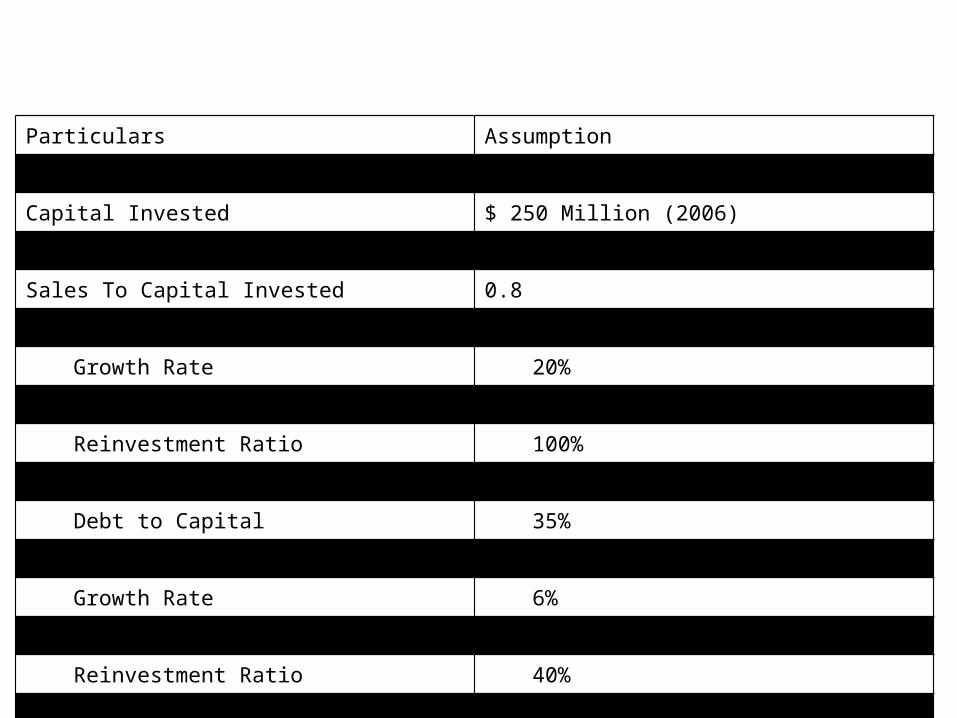
Scenario 1 - OptimisticParticulars Assumption
Revenue $ 200 Million (2006)
Capital Invested $ 250 Million (2006)
German Corporate Tax Rate 30% (Marginal)
Sales To Capital Invested 0.8
High Growth Period 8 years
Growth Rate 20%
EBIT Margin 25%
Reinvestment Ratio 100%
ROIC 20%
Debt to Capital 35%
Stable Period Perpetuity
Growth Rate 6%
EBIT Margin 20%
Reinvestment Ratio 40%
ROIC 15%
Debt to Capital 35%

Valuation - Optimistic
Particulars Value
Enterprise Value (EV) $ 640.47 Million
EV/EBIT 12.81
EV/EBIT(1-t) 18.30
EV/Sales 3.20
EV/Capital Invested 3.66

Scenario 2 - PessimisticParticulars Assumption
Revenue $ 200 Million (2006)
Capital Invested $ 250 Million (2006)
German Corporate Tax Rate 30% (Marginal)
Sales To Capital Invested 0.8
High Growth Period 5 years
Growth Rate 15%
EBIT Margin 15%
Reinvestment Ratio 100%
ROIC 10%
Debt to Capital 35%
Stable Period Perpetuity
Growth Rate 5%
EBIT Margin 15%
Reinvestment Ratio 40%
ROIC 8%
Debt to Capital 35%
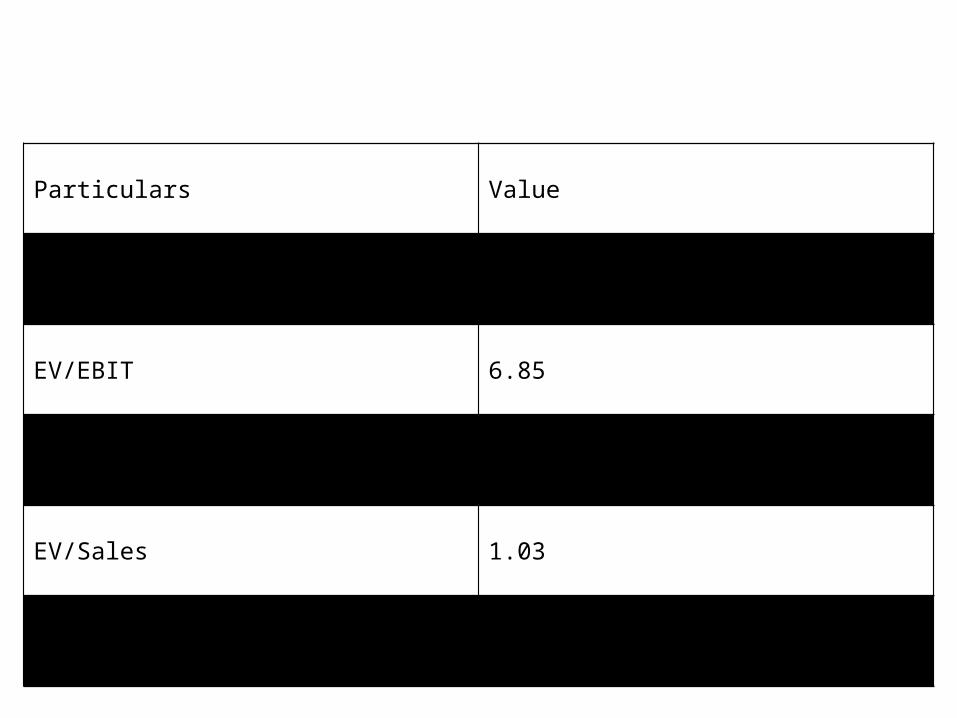
Valuation - Pessimistic
Particulars Value
Enterprise Value (EV) $ 205.52 Million
EV/EBIT 6.85
EV/EBIT(1-t) 9.79
EV/Sales 1.03
EV/Capital Invested 0.82

Scenario 3 - Worst CaseParticulars Assumption
Revenue $ 200 Million (2006)
Capital Invested $ 250 Million (2006)
German Corporate Tax Rate 30% (Marginal)
Sales To Capital Invested 0.8
High Growth Period 5 years
Growth Rate 10%
EBIT Margin 15%
Reinvestment Ratio 100%
ROIC 8%
Debt to Capital 35%
Stable Period Perpetuity
Growth Rate 3%
EBIT Margin 15%
Reinvestment Ratio 40%
ROIC 6.5%
Debt to Capital 35%

Valuation - Worst Case
Particulars Value
Enterprise Value (EV) $ 138.53 Million
EV/EBIT 4.60
EV/EBIT(1-t) 6.61
EV/Sales 0.69
EV/Capital Invested 0.55
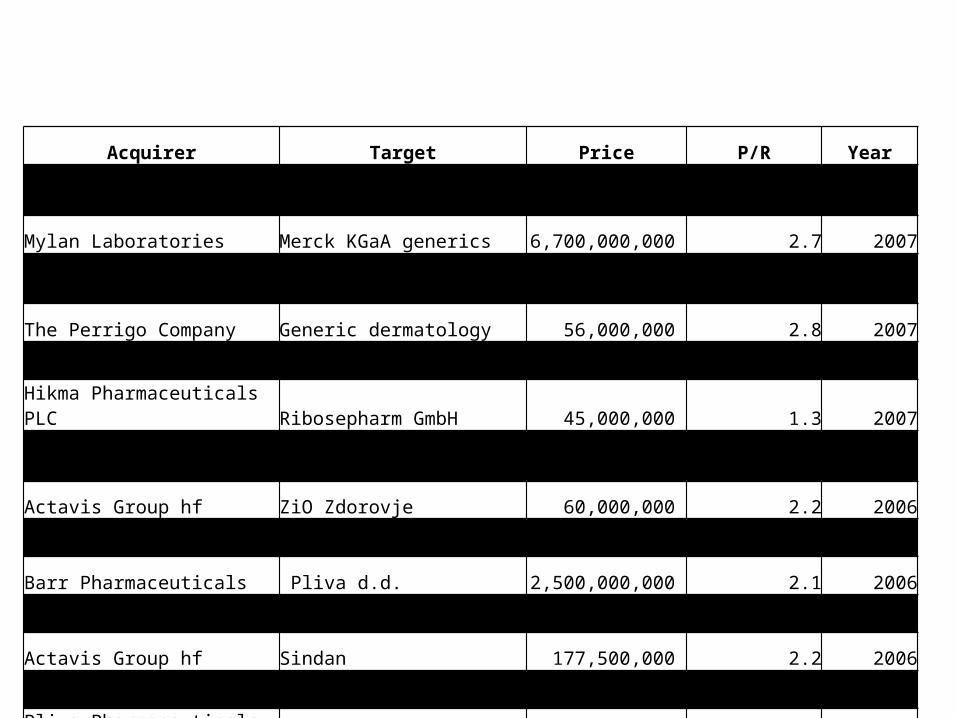
Comparable TransactionsAcquirer Target Price P/R Year
Sun Pharmaceutical Industries Taro 454,000,000 1.5 2007
Mylan Laboratories Merck KGaA generics 6,700,000,000 2.7 2007
Ranbaxy Laboratories. Be-Tabs Pharmaceuticals 70,000,000 2.2 2007
The Perrigo Company Generic dermatology 56,000,000 2.8 2007
Zentiva NV Eczacibisi Generic 606,200,000 2.4 2007Hikma Pharmaceuticals PLC Ribosepharm GmbH 45,000,000 1.3 2007
Actavis Group hfAbrika Pharmaceuticals, Inc. 225,000,000 8.7 2006
Actavis Group hf ZiO Zdorovje 60,000,000 2.2 2006
Dava Pharmaceuticals Stada, Inc. 40,000,000 0.8 2006
Barr Pharmaceuticals Pliva d.d. 2,500,000,000 2.1 2006
Ranbaxy Laboratories. Terapia S.A. 324,000,000 4.1 2006
Actavis Group hf Sindan 177,500,000 2.2 2006
Watson Pharmaceuticals Andrx Corporation 1,900,000,000 1.7 2006
Pliva Pharmaceuticals d.d Uso Racional 25,640,000 1.8 2006
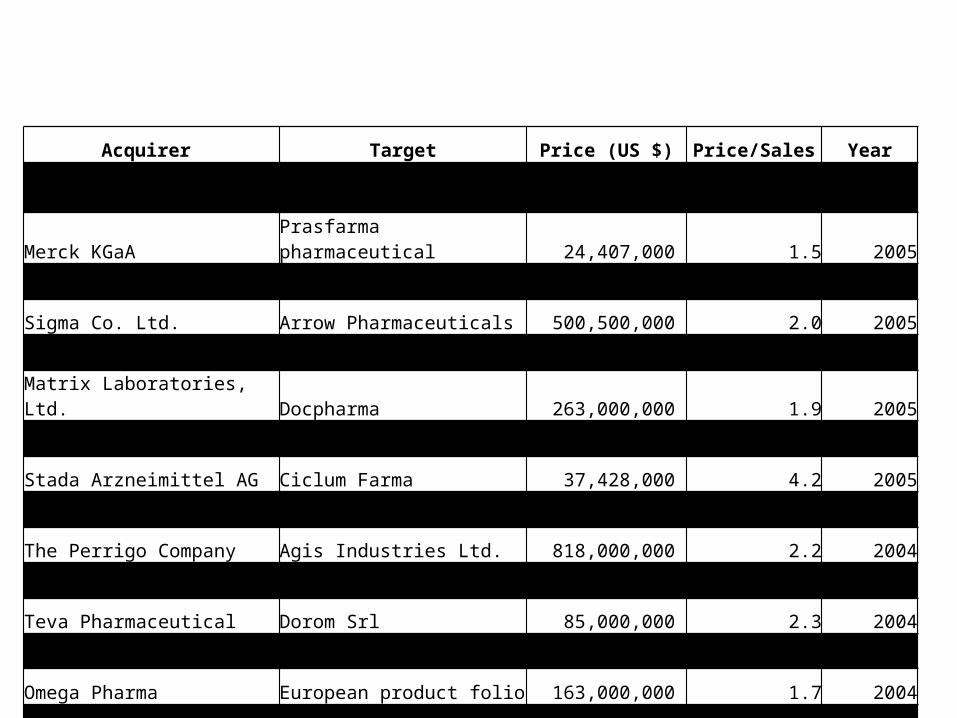
Comparable TransactionsAcquirer Target Price (US $) Price/Sales Year
Actavis Group hf Global generics business 810,000,000 1.1 2005
Merck KGaA Prasfarma pharmaceutical 24,407,000 1.5 2005
Zentiva NV SC Sicomed SA 102,000,000 1.4 2005
Sigma Co. Ltd. Arrow Pharmaceuticals 500,500,000 2.0 2005
Teva Pharmaceutical Ivax Corporation 7,960,000,000 4.2 2005
Matrix Laboratories, Ltd. Docpharma 263,000,000 1.9 2005
Actavis Group hf Amide Pharmaceutical, 600,000,000 5.6 2005
Stada Arzneimittel AG Ciclum Farma 37,428,000 4.2 2005
Novartis AG Two generic companies 8,400,000,000 3.9 2005
The Perrigo Company Agis Industries Ltd. 818,000,000 2.2 2004
Merck KGaA NM Pharma 65,000,000 1.4 2004
Teva Pharmaceutical Dorom Srl 85,000,000 2.3 2004
Novartis AG Sabex Holding, Inc. 565,000,000 6.3 2004
Omega Pharma European product folio 163,000,000 1.7 2004
3i Group Plc betapharm Arzneimittel 366,000,000 2.8 2004
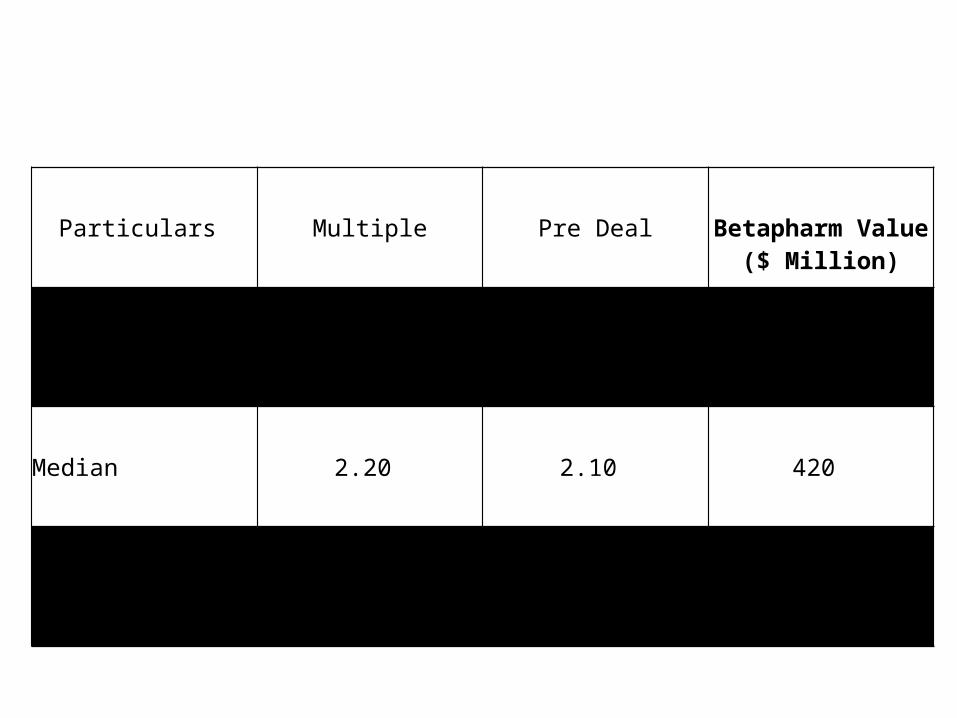
Valuation - Comparable Deals
Particulars Multiple Pre Deal Betapharm Value
($ Million)
Mean 2.73 2.77 554
Median 2.20 2.10 420
Harmonic Mean 2.08 2.14 427
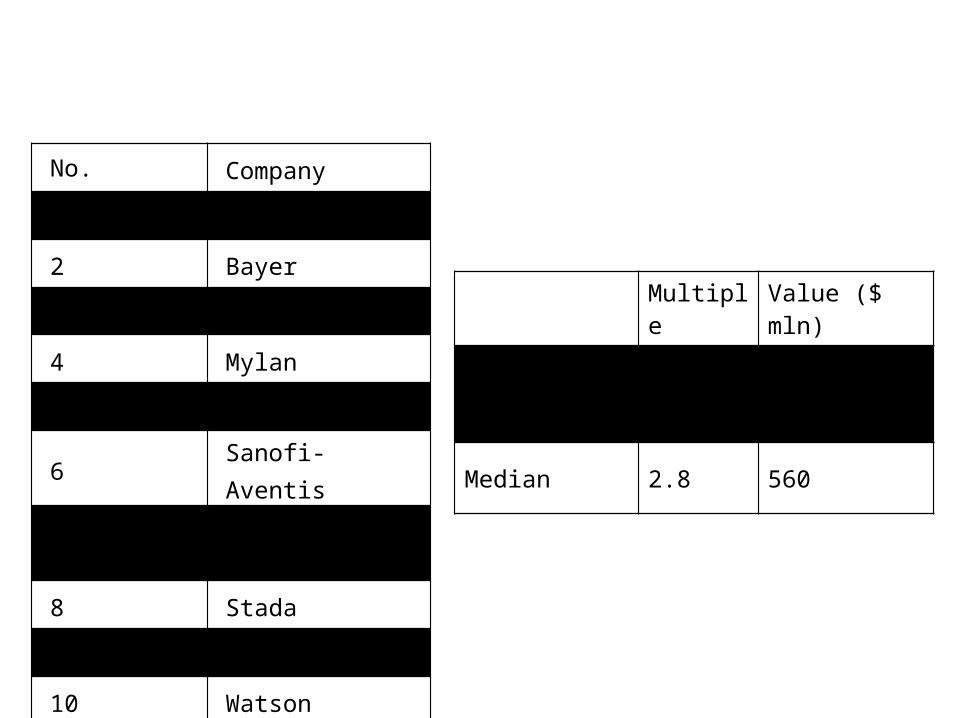
Comparable Multiples
No. Company
1 Barr
2 Bayer
3 Merck
4 Mylan
5 Novartis
6 Sanofi-Aventis
7Schering Plough
8 Stada
9 Teva
10 Watson
Multiple Value ($ mln)
Harmonic Mean 2.9 581
Median 2.8 560
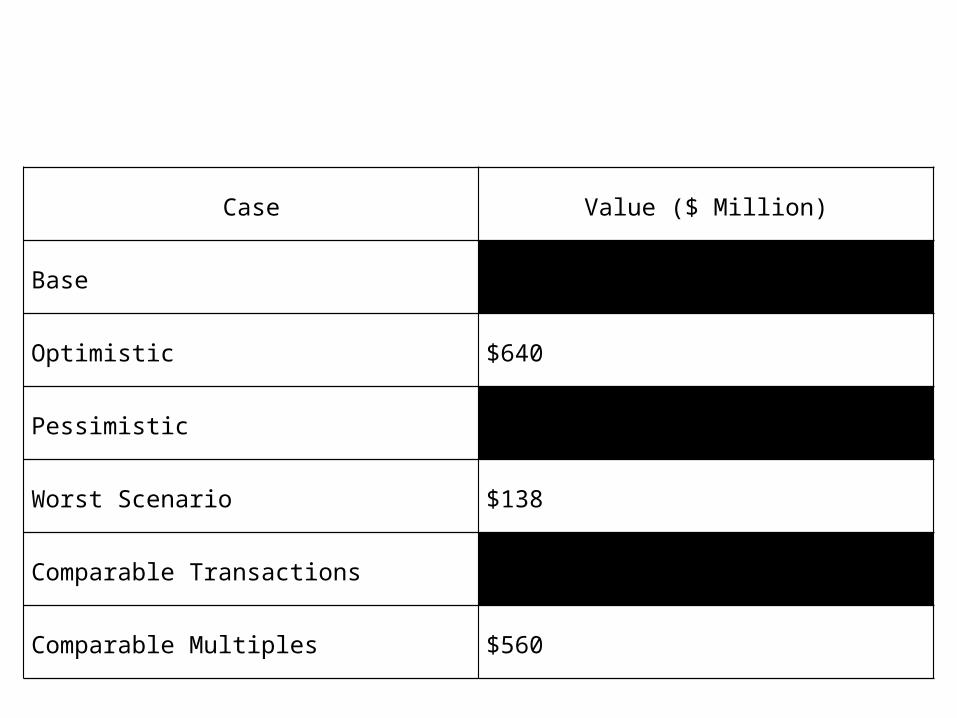
Valuation - Summary
Case Value ($ Million)
Base $333
Optimistic $640
Pessimistic $205
Worst Scenario $138
Comparable Transactions $420
Comparable Multiples $560
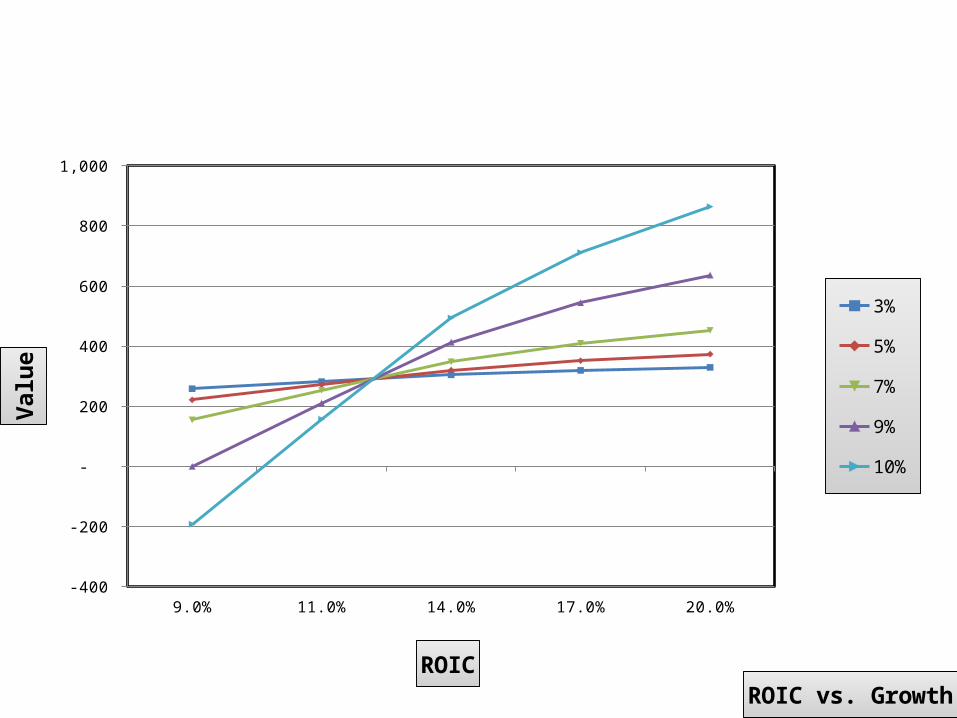
Sensitivity Analysis
9.0% 11.0% 14.0% 17.0% 20.0%-400
-200
-
200
400
600
800
1,000
ROIC vs. Growth
3%
5%
7%
9%
10%
ROIC
Valu
e

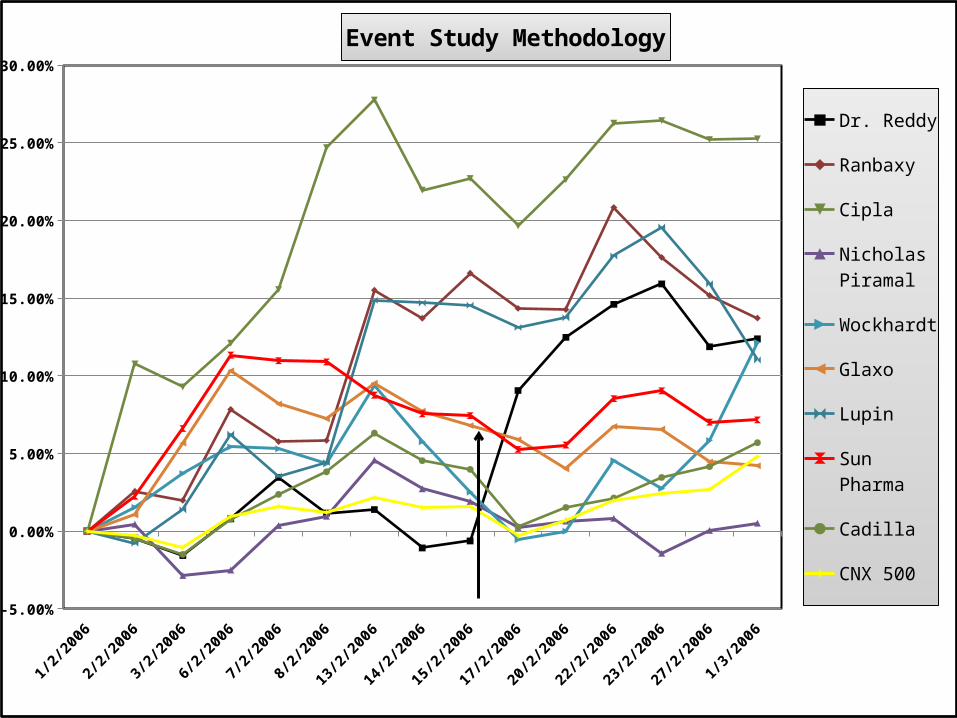
Market Perception - Event Study
-5.00%
0.00%
5.00%
10.00%
15.00%
20.00%
25.00%
30.00%
Event Study Methodology
Dr. Reddy
Ranbaxy
Cipla
Nicholas Piramal
Wockhardt
Glaxo
Lupin
Sun Pharma
Cadilla
CNX 500
Post Deal
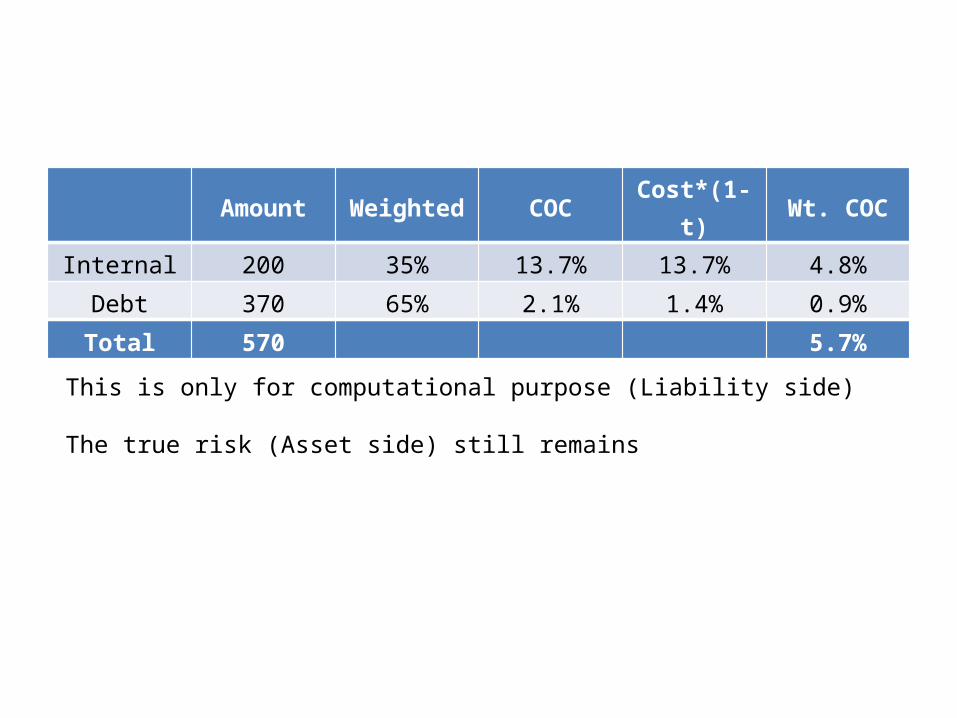
Financing
Amount Weighted COCCost*(1-
t)Wt. COC
Internal 200 35% 13.7% 13.7% 4.8%
Debt 370 65% 2.1% 1.4% 0.9%
Total 570 5.7%
This is only for computational purpose (Liability side)
The true risk (Asset side) still remains
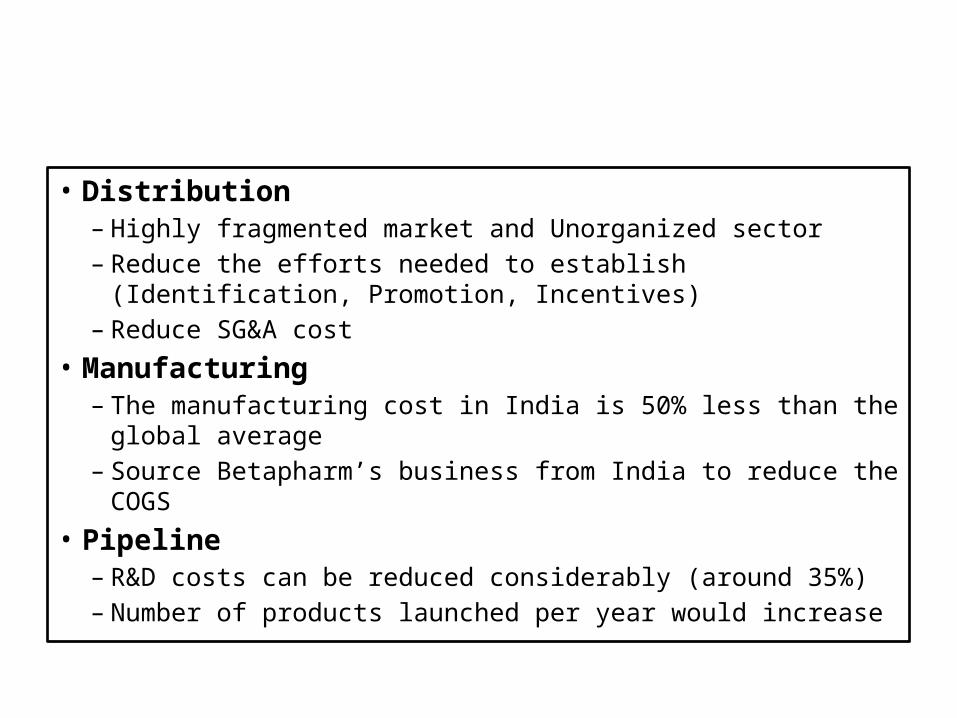
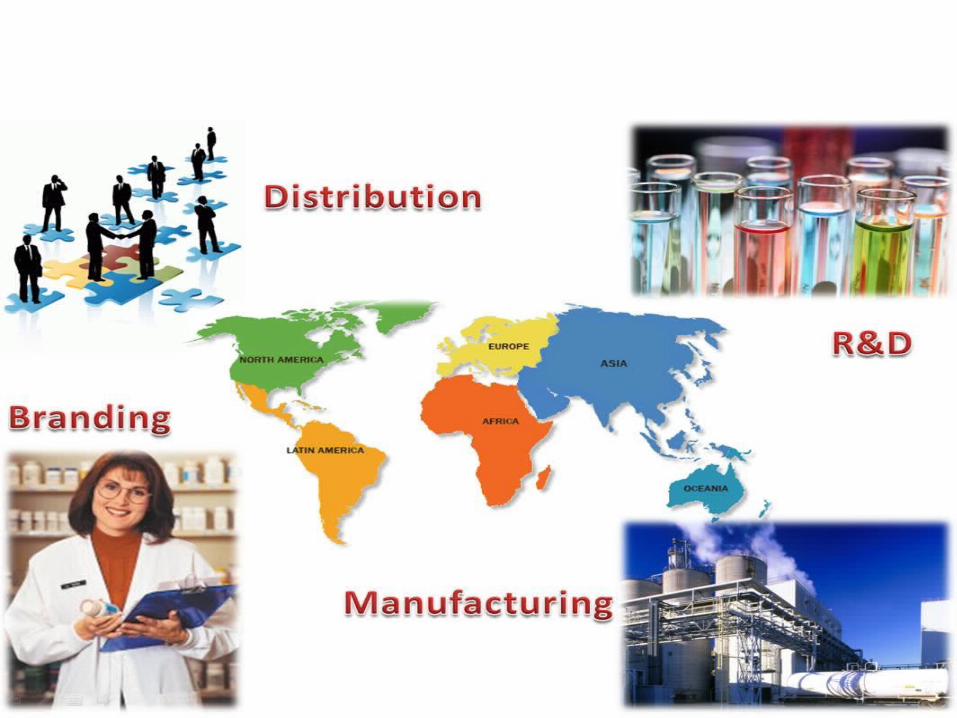
Synergy
• Distribution– Highly fragmented market and Unorganized sector– Reduce the efforts needed to establish (Identification,
Promotion, Incentives) – Reduce SG&A cost
• Manufacturing– The manufacturing cost in India is 50% less than the
global average– Source Betapharm’s business from India to reduce the
COGS
• Pipeline– R&D costs can be reduced considerably (around 35%)– Number of products launched per year would increase
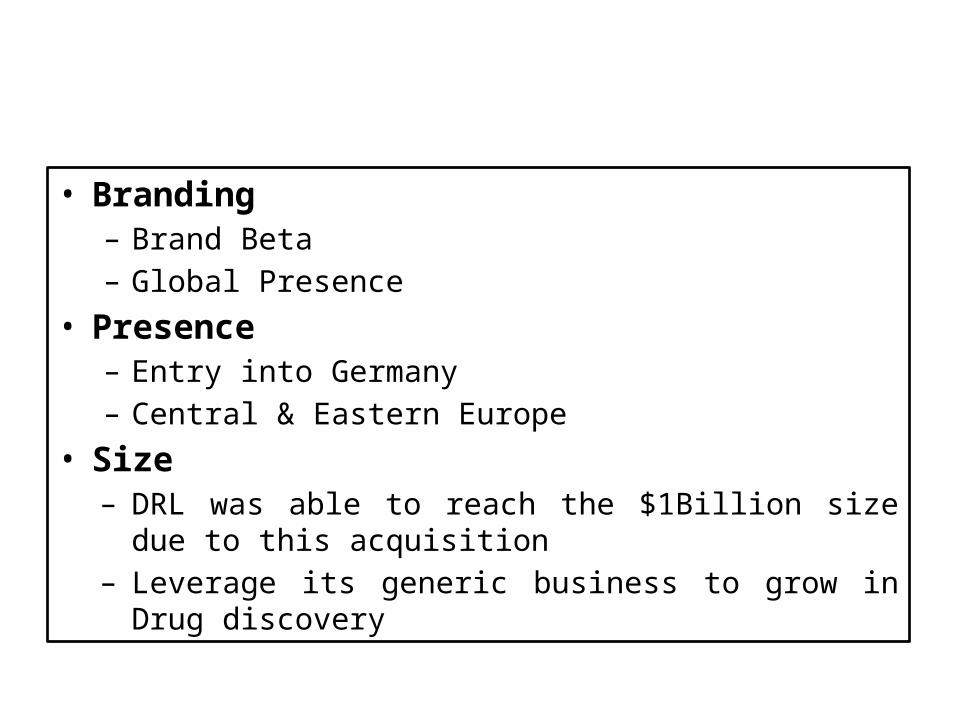
Synergy
• Branding– Brand Beta– Global Presence
• Presence– Entry into Germany – Central & Eastern Europe
• Size– DRL was able to reach the $1Billion size due to
this acquisition– Leverage its generic business to grow in Drug
discovery

Integration
Post Merger Integration
• Management of Control
• Execution Challenges
• Tax and Transfer Pricing
• Accounting
• Significant Vs Non Significant Entity
• Risk Management
Cultural Integration
• Managing language barriers and cultural diversities
• Alignment of strategies and business models of acquired company and the acquirer
• Retaining talent and employee motivation• Balancing interpersonal connections with
formal controls and processes• Emphasize direct communication• Encourage Innovation
What Went Wrong
• The Economic Optimisation of Pharmaceutical Care Act (Germany, May 2006)
• Price caps in place - affected the margins of betapharm
• Reduced prices by 15-25% in two phases
• Longer than expected payback - other plans shelved
What Went Wrong
• Betapharm revenues grew by 3% over the last 2 years
• Patients use medicines endorsed by their Sick Funds (Regulation)
• Supply Chain problems• Salutas (Contract manufacturer,
Germany) terminates contract
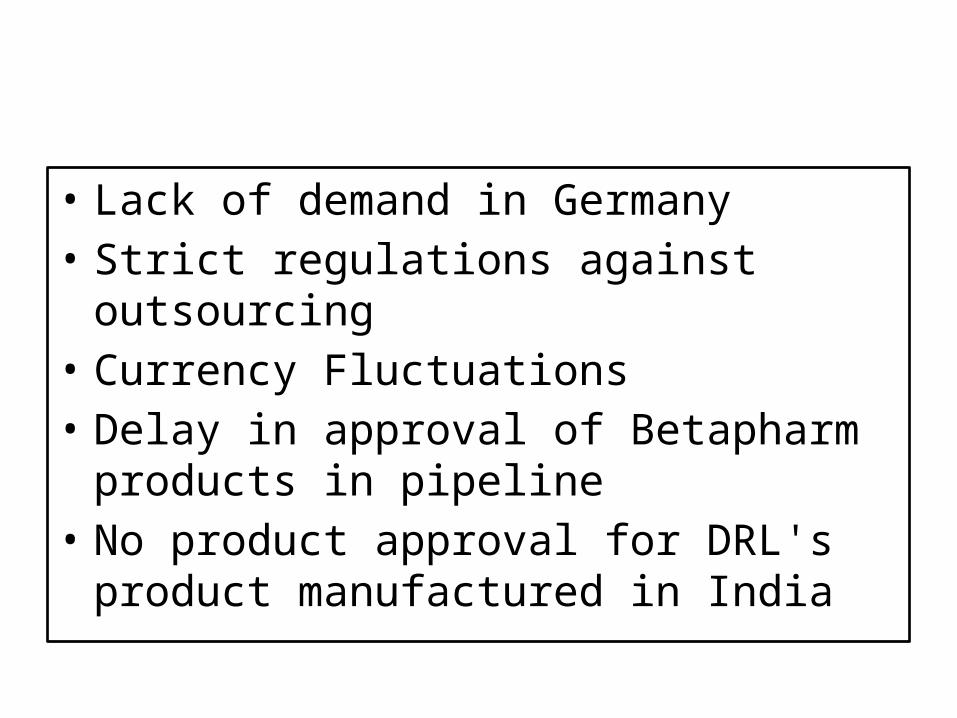
What Went Wrong
• Lack of demand in Germany• Strict regulations against outsourcing• Currency Fluctuations• Delay in approval of Betapharm
products in pipeline• No product approval for DRL's
product manufactured in India
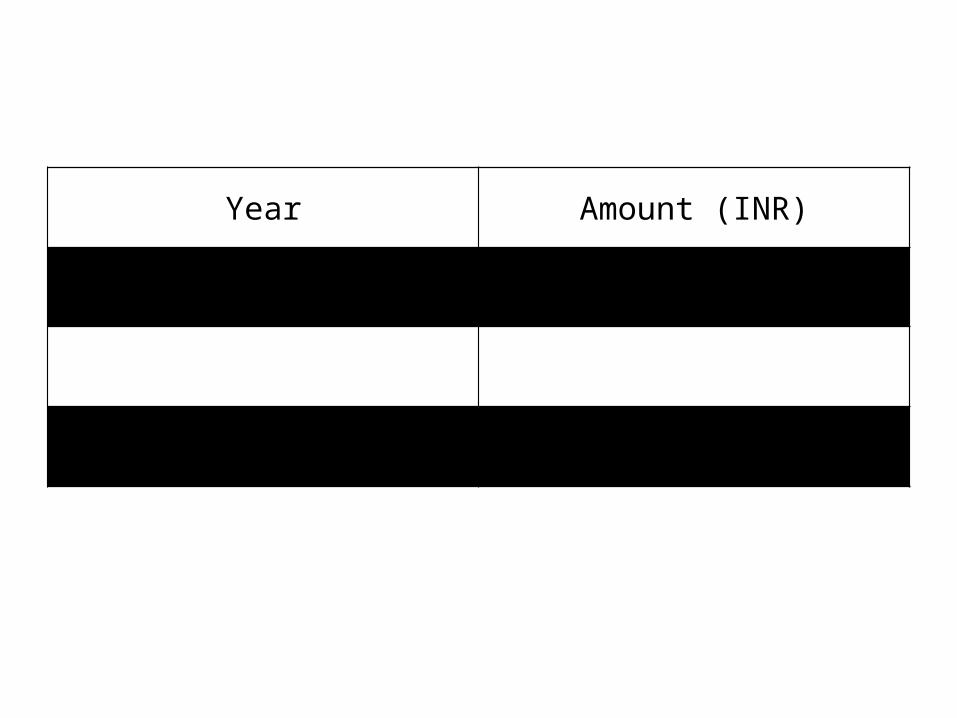
Write - Down
Year Amount (INR)
2006-2007 177 crore
2007-2008 236.1 crore
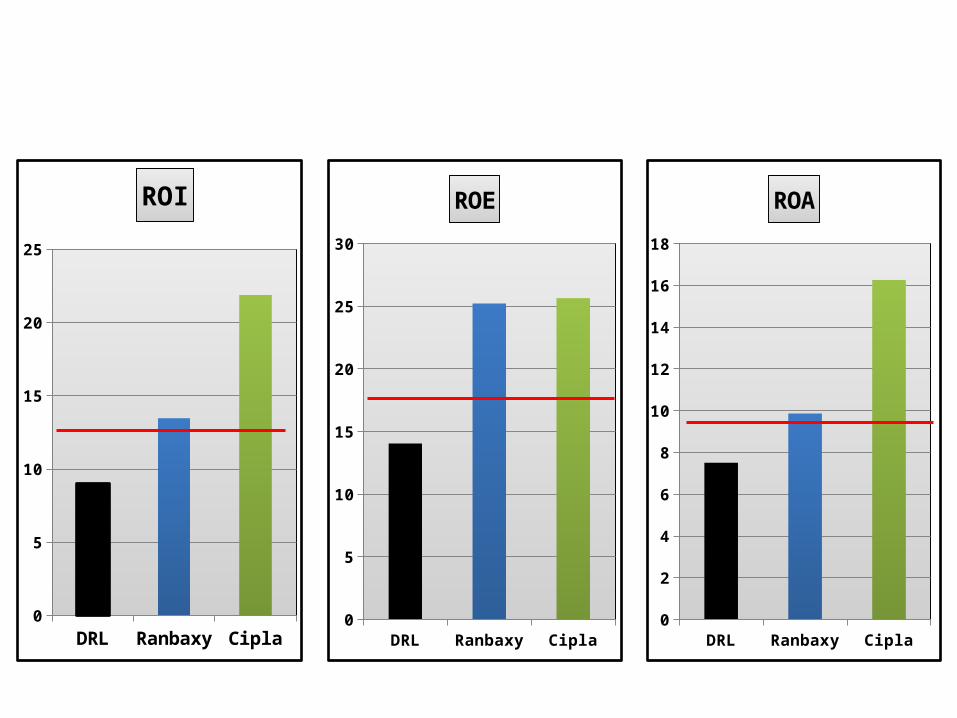
Relative Performance
DRL Ranbaxy Cipla0
5
10
15
20
25
ROI
DRL Ranbaxy Cipla0
5
10
15
20
25
30
ROE
DRL Ranbaxy Cipla0
2
4
6
8
10
12
14
16
18
ROA
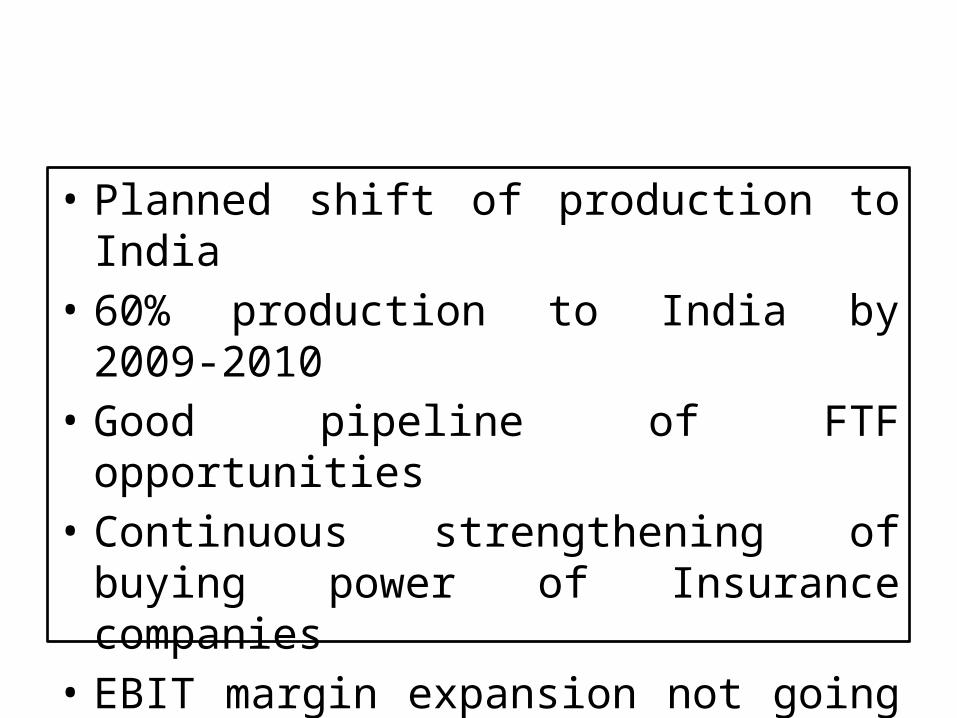
The Road Ahead
• Planned shift of production to India• 60% production to India by 2009-
2010• Good pipeline of FTF opportunities• Continuous strengthening of buying
power of Insurance companies• EBIT margin expansion not going to
be visible over short to medium term
Conclusion
• As of now, the deal seems to be a failure and DRL would have been better of without Betapharm– Premium paid– Excessive misplaced optimism– Inadequate due diligence– Failure to account for External environment
risks– Shelving of other plans– Margin erosion of the parent company and
underperformance vs. peers

Thank You