development and validation of uv-spectrophotometric ...€¦ · uv-spectrophotometric procedures...
TRANSCRIPT
Development and Validation of UV-Spectrophotometric Procedures for Secnidazole Quantitative Determination
Oksana V. Shovkova, Lina Yu. Klimenko*, Svitlana M. Kovalenko, Tamara V. Zhukova
Analytical Chemistry Department, National University of Pharmacy 53, Pushkinska str., Kharkiv, 61002, Ukraine
Abstract Secnidazole is one of the antiprotozoal medicines from the group of 5-nitroimidazoles, which is characterized by a prolonged serum half-life. For secnidazole determination the method of HPLC is widely used, but secnidazole is applied in high concen-tration and less sensitive methods of analysis such as spectrophotometry may be useful for its quantification. The aim is to de-velop a number of UV-spectrophotometric procedures of secnidazole quantification and carry out step-by-step validation of the developed procedures. UV-spectra of secnidazole in 0.1 M hydrochloric acid solution (A), 96% ethanol (B), 0.1 M potassium hydroxide solution in methanol (C), 0.1 M sodium hydroxide solution (D) have been investigated and it has been set that when in-creasing the рН value step-by-step shift of substance maximum absorption to the right is observed (277 nm → 310 nm → 314 nm → 319 nm). The procedures of secnidazole quantitative determination by the method of UV-spectrophotometry have been devel-oped using the mentioned solvents and wavelengths respectively. Their validation by such parameters as stability, linearity, accu-racy and precision in the variants of the method of calibration curve and method of standard has been carried out. The proce-dures A, B and D of secnidazole quantitative determination are acceptable for application. The best linearity, accuracy and re-peatability have been fixed for the procedure D in the variant of the method of calibration curve.
Keywords: secnidazole, UV-spectrophotometry, validation, method of calibration curve, method of standard
INTRODUCTION 5-nitroimidazoles are the group of antiprotozoal
medicines widely used for treatment of infectious diseases caused by Trichomonas, Lamblia, Leishmania, etc. [1 – 8]. The action mechanism of nitroimidazoles consists in bio-chemical reduction of 5-nitrogroup by intracellular transport proteins of anaerobes and protozoa. Reduced ni-troimidazoles interact with DNA of microorganism cells and inhibit synthesis of their nucleic acids that leads to mi-croorganism death [6, 9 – 11].
Secnidazole is one of the medicines from the group of 5-nitroimidazoles, it is characterized by a prolonged se-rum half-life [12, 13]. Chemically, secnidazole is 1-(2-methyl-5-nitroimidazol-1-yl)propan-2-ol and has the struc-tural formula as shown on Figure 1.
The medicine has a number of side effects manifest-ed by usual symptoms of acute intoxication (giddiness, nausea, vomiting), especially when interacting with other drugs [2, 7, 14]. And the case of taking with alcohol may be toxic for patient even when therapeutic dose is taken [14].
For secnidazole determination the method of HPLC is widely used, it ensures high selectivity and sensitivity of analysis [15 – 24].
Secnidazole is applied in high concentration; single oral dose is 1 – 2 g [7, 8, 12 – 14, 25 – 27]. Thus, we may use for determination of the medicine less sensitive meth-ods of analysis such as spectrophotometry. Sometimes spectrophotometric methods are used with this purpose, but only in visible range after preliminary derivatization or complex formation [17, 28, 29]. But chemical structure of secnidazole allows to use direct UV-spectrophotometry for its quantification.
So the purpose of our paper is to develop a number of UV-spectrophotometric procedures of secnidazole quan-tification and carry out step-by-step validation of the devel-oped procedures in the variants of the method of calibration curve (MCC) and method of standard (MS) to choose the optimal variant for further application.
N
N
N CH3
OHO
O
Figure 1. Chemical structure of secnidazole
MATERIALS AND METHODS Equipment
All spectrophotometric measurements were carried out using a single beam UV/VIS spectrophotometer SPEKOL®1500 (Analytik Jena AG, Germany) with wave-length scanned from 1100 nm to 190 nm. The software was WinASPECT®Spekol 2.3. The spectral band width was 1 nm. The pair of quartz square cells S90-309Q (UNICO, USA) with 10 mm pathlength and wavelength range from 200 to 1200 nm was used throughout the whole experiment.
Weighing was carried out using digital analytical balance АN100 (AXIS, Ukraine) with d = 0.0001 g.
Glassware satisfied ISO 648:2008 «Laboratory glassware – Single-volume pipettes», ISO 1042:1998 «La-boratory glassware – One-mark volumetric flasks», ISO 4788:2005 «Laboratory glassware – Graduated measuring cylinders», ISO 385:2005 «Laboratory glassware – Bu-
Oksana V. Shovkova et al /J. Pharm. Sci. & Res. Vol. 9(4), 2017, 338-348
338
rettes» and calibrated according to ISO 4787:2010 «Labor-atory glassware – Volumetric instruments – Methods for testing of capacity and for use» and «Guidelines for cali-bration in analytical chemistry» [30] was used throughout this study. Reagents and chemicals
Secnidazole was of pharmacopoeial purity. Hydro-chloric acid (≥37%, puriss. p.a., ACS reagent, fuming), methanol (≥99.8%, puriss. p.a., ACS reagent) were pur-chased from Sigma-Aldrich Co. LLC (USA). All other rea-gents (ethanol, sodium hydroxide, potassium hydroxide) were of analytical grade. Reference and model solutions (Scheme 1)
The stock solutions 1 and 2 (250 μg/mL) were pre-pared by dissolving 50.0 mg of secnidazole in the solvent and the solutions were diluted to 200.0 mL with the same solvent. The reference solution (20 μg/mL) was prepared by diluting 4.00 mL of the stock solution 1 to 50.0 mL with the solvent. The stock solution 2 was diluted with the sol-vent to prepare the model solutions 1 – 7 having concentra-tions of 5; 10; 15; 20; 25; 30 and 35 μg/mL respectively.
For all cases the solutions batches A, B, C and D were prepared using 4 different solvents such as 0.1 M hy-drochloric acid solution, 96% ethanol, 0.1 M potassium hydroxide solution in methanol and 0.1 M sodium hydrox-ide solution respectively.
The absorbance of the model solutions 1 – 7 was measured 3 times with randomization of cell position. The respective solvent was used as a compensation solution.
RESULTS AND DISCUSSION Analytical procedures development
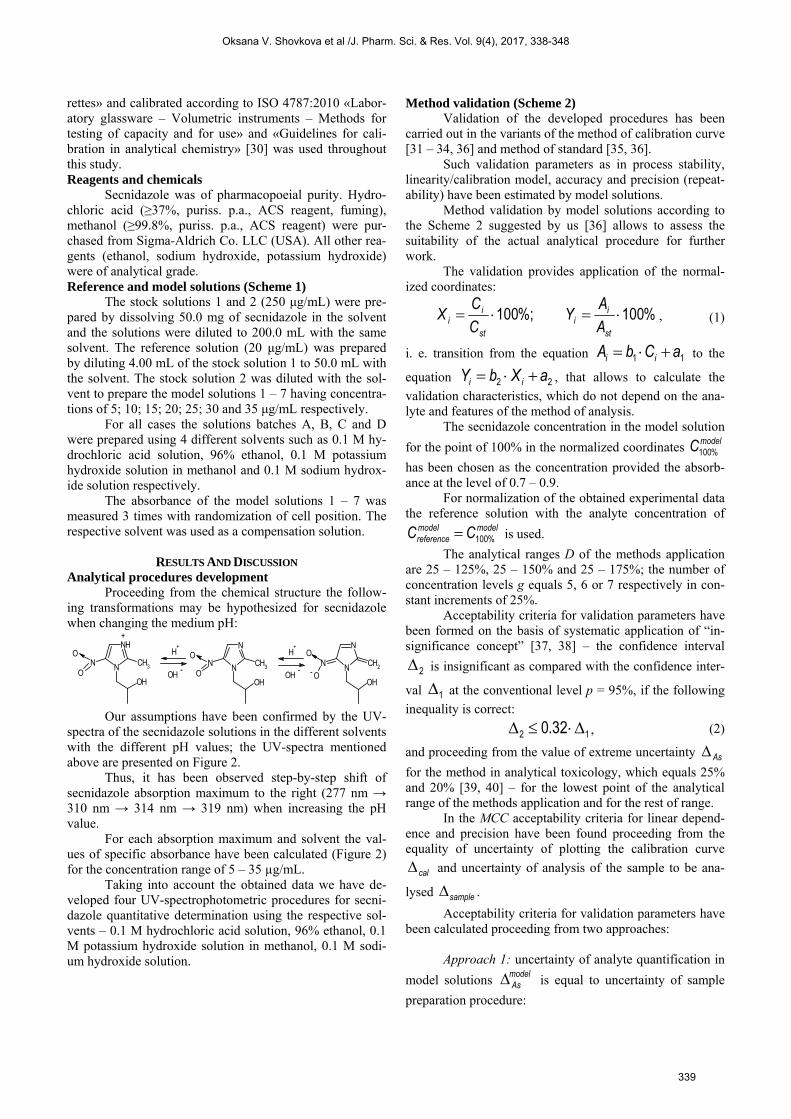
Proceeding from the chemical structure the follow-ing transformations may be hypothesized for secnidazole when changing the medium pH:
N
NH
N CH3
OHO
H+
N
N
N CH3
OHO
H+
N
N
N CH2
OHO
+
OH-
OH-
O
-
OO
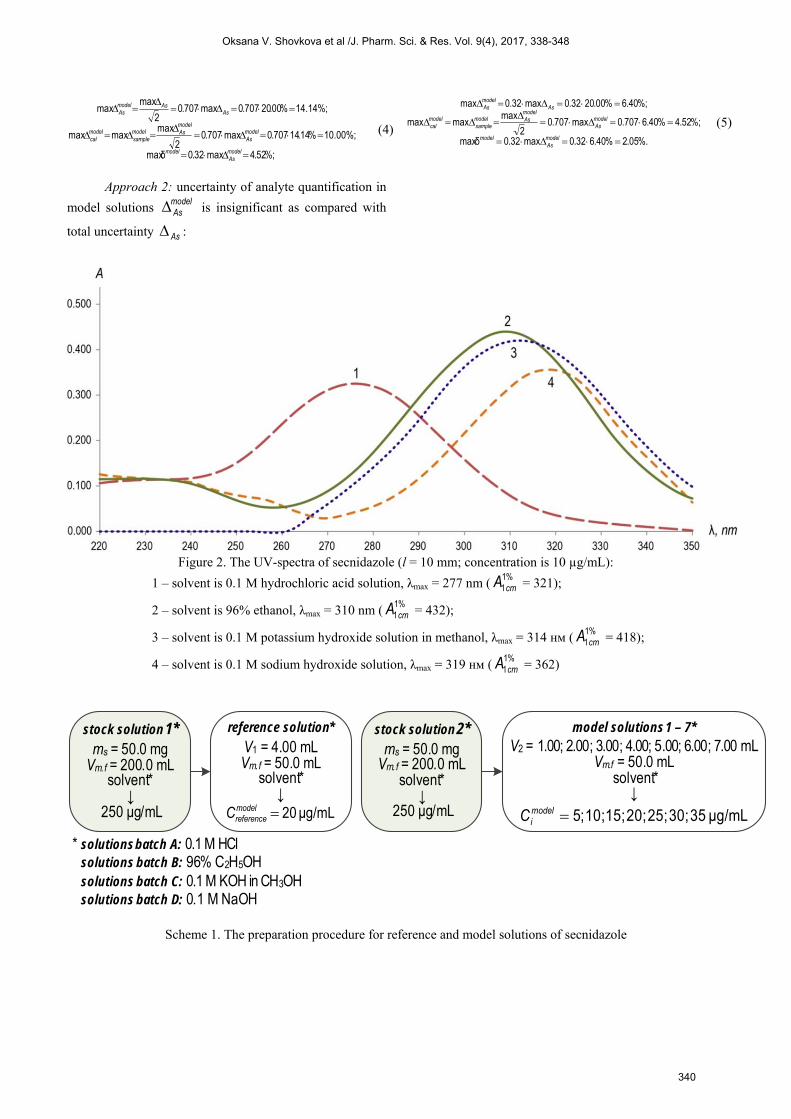
Our assumptions have been confirmed by the UV-spectra of the secnidazole solutions in the different solvents with the different pH values; the UV-spectra mentioned above are presented on Figure 2.
Thus, it has been observed step-by-step shift of secnidazole absorption maximum to the right (277 nm → 310 nm → 314 nm → 319 nm) when increasing the рН value.
For each absorption maximum and solvent the val-ues of specific absorbance have been calculated (Figure 2) for the concentration range of 5 – 35 µg/mL.
Taking into account the obtained data we have de-veloped four UV-spectrophotometric procedures for secni-dazole quantitative determination using the respective sol-vents – 0.1 M hydrochloric acid solution, 96% ethanol, 0.1 M potassium hydroxide solution in methanol, 0.1 M sodi-um hydroxide solution.
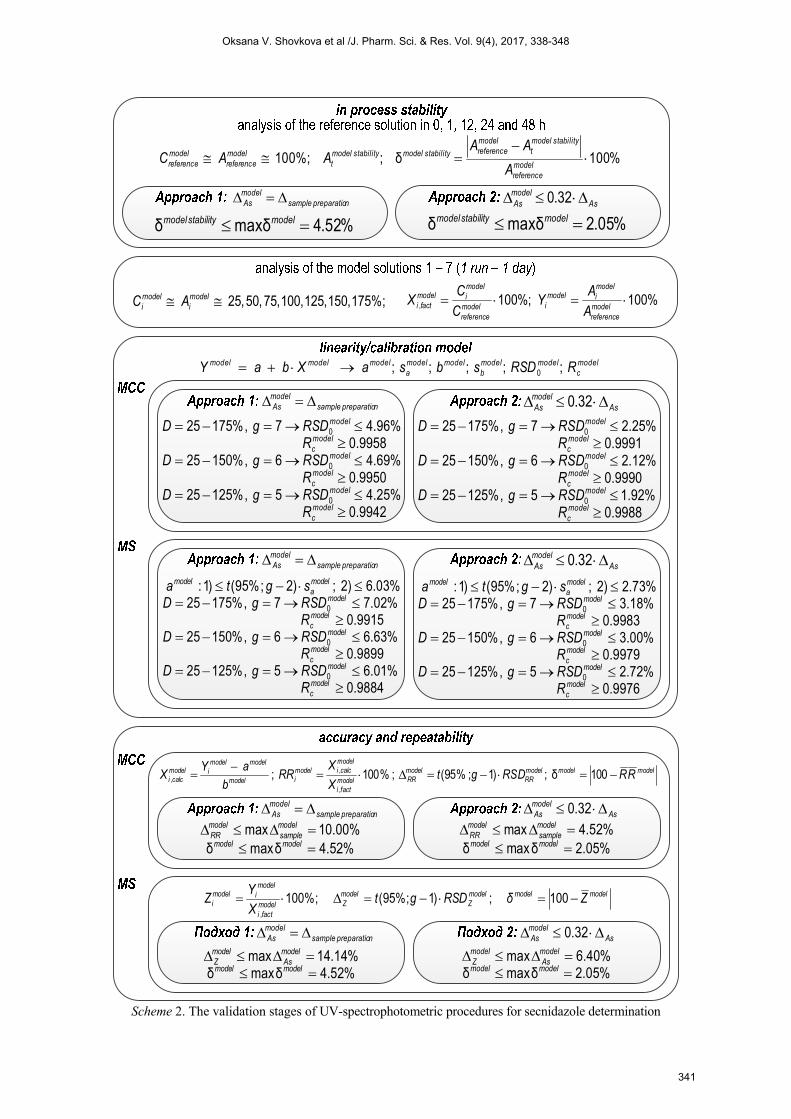
Method validation (Scheme 2) Validation of the developed procedures has been
carried out in the variants of the method of calibration curve [31 – 34, 36] and method of standard [35, 36].
Such validation parameters as in process stability, linearity/calibration model, accuracy and precision (repeat-ability) have been estimated by model solutions.
Method validation by model solutions according to the Scheme 2 suggested by us [36] allows to assess the suitability of the actual analytical procedure for further work.
The validation provides application of the normal-ized coordinates:
%100 %;100 st
ii
st
ii A
AY
CC
X , (1)
i. e. transition from the equation 11 aCbA ii to the
equation 22 aXbY ii , that allows to calculate the
validation characteristics, which do not depend on the ana-lyte and features of the method of analysis.
The secnidazole concentration in the model solution
for the point of 100% in the normalized coordinates modelC %100
has been chosen as the concentration provided the absorb-ance at the level of 0.7 – 0.9.
For normalization of the obtained experimental data the reference solution with the analyte concentration of
modelmodelreference CC %100 is used.
The analytical ranges D of the methods application are 25 – 125%, 25 – 150% and 25 – 175%; the number of concentration levels g equals 5, 6 or 7 respectively in con-stant increments of 25%.
Acceptability criteria for validation parameters have been formed on the basis of systematic application of “in-significance concept” [37, 38] – the confidence interval
2 is insignificant as compared with the confidence inter-
val 1 at the conventional level p = 95%, if the following
inequality is correct:
12 32.0 , (2)
and proceeding from the value of extreme uncertainty Asfor the method in analytical toxicology, which equals 25% and 20% [39, 40] – for the lowest point of the analytical range of the methods application and for the rest of range.
In the MCC acceptability criteria for linear depend-ence and precision have been found proceeding from the equality of uncertainty of plotting the calibration curve
cal and uncertainty of analysis of the sample to be ana-
lysed sample .
Acceptability criteria for validation parameters have been calculated proceeding from two approaches:
Approach 1: uncertainty of analyte quantification in
model solutions modelAs is equal to uncertainty of sample
preparation procedure:
Oksana V. Shovkova et al /J. Pharm. Sci. & Res. Vol. 9(4), 2017, 338-348
339
%;52.4max32.0maxδ
10.00%;%14.14707.0max707.02
max maxmax
14.14%;%00.20707.0max707.02
max max
modelAs
model
modelAs
modelAsmodel
samplemodelcal
AsAsmodel
As
(4)
Approach 2: uncertainty of analyte quantification in
model solutions modelAs is insignificant as compared with
total uncertainty As :
%.05.2%40.632.0max32.0maxδ
%;52.4%40.6707.0max707.02
max maxmax
%;40.6%00.2032.0max.320 max
modelAs
model
modelAs
modelAsmodel
samplemodelcal
AsmodelAs
(5)
Figure 2. The UV-spectra of secnidazole (l = 10 mm; concentration is 10 µg/mL):
1 – solvent is 0.1 M hydrochloric acid solution, λmax = 277 nm (%1
1cmA = 321);
2 – solvent is 96% ethanol, λmax = 310 nm (%1
1cmA = 432);
3 – solvent is 0.1 M potassium hydroxide solution in methanol, λmax = 314 нм (%1
1cmA = 418);
4 – solvent is 0.1 M sodium hydroxide solution, λmax = 319 нм (%1
1cmA = 362)
* solutionsbatch A: 0.1 M HClsolutions batch B: 96% C2H5OHsolutions batch C: 0.1 M KOH in CH3OHsolutions batch D: 0.1 M NaOH
stock solution1*ms = 50.0 mg
Vm.f = 200.0 mLsolvent*
↓250 μg/mL
reference solution*
V1 = 4.00 mLVm.f = 50.0 mL
solvent*↓
μg/mL20modelreferenceC
model solutions1 – 7*V2 = 1.00; 2.00; 3.00; 4.00; 5.00; 6.00; 7.00 mL
Vm.f = 50.0 mLsolvent*
↓
stock solution2*ms = 50.0 mg
Vm.f = 200.0 mLsolvent*
↓250 μg/mL μg/mL35 30; 25; 20; 15; 10; ;5model
iC
Scheme 1. The preparation procedure for reference and model solutions of secnidazole
Oksana V. Shovkova et al /J. Pharm. Sci. & Res. Vol. 9(4), 2017, 338-348
340
npreparatiosamplemodelAs As
modelAs 32.0
modelc
modelmodelb
modelmodela
modelmodelmodel R RSD s b s a X b a Y ;;;;; 0
modelmodelmodelZ
modelZmodel
facti
modelimodel
i ZδRSDgtXY
Z 100 ;)1%;95( %;100,
npreparatiosamplemodelAs As
modelAs 32.0
npreparatiosamplemodelAs As
modelAs 32.0
npreparatiosamplemodelAs As
modelAs 32.0
%52.4δmaxδ modelstabilitymodel %05.2δmaxδ modelstabilitymodel
%100δ;00%;1
modelreference
stabilitymodelt
modelreferencestabilitymodelstabilitymodel
tmodelreference
modelreference A
AAAAC
75%;1 ,501 ,251 ,001 ,57 ,50 ,25 modeli
modeli AC %100%;100, model
reference
modelimodel
imodelreference
modelimodel
facti AA
YCC
X
npreparatiosamplemodelAs As
modelAs 32.0
9942.0 %25.45 %,12525
9950.0 %69.46 %,15025
9958.0 %96.47 %,17525
0
0
0
modelc
model
modelc
model
modelc
model
RRSDgDRRSDgDRRSDgD
9988.0 %92.15 %,12525
9990.0 %12.26 %,15025
9991.0 %25.27 %,17525
0
0
0
modelc
model
modelc
model
modelc
model
RRSDgDRRSDgDRRSDgD
9884.0 %01.65 %,12525
9899.0 %63.66 %,15025
9915.0 %02.77 %,17525%03.62) ;)2%;95()1:
0
0
0
modelc
model
modelc
model
modelc
model
modela
model
RRSDgDRRSDgDRRSDgDsgta
9976.0 %72.25 %,12525
9979.0 %00.36 %,15025
9983.0 %18.37 %,17525%73.22) ;)2%;95()1:
0
0
0
modelc
model
modelc
model
modelc
model
modela
model
RRSDgDRRSDgDRRSDgDsgta
%52.4δmaxδ%00.10max
modelmodel
modelsample
modelRR
%05.2δmaxδ%52.4max
modelmodel
modelsample
modelRR
%52.4δmaxδ%14.14max
modelmodel
modelAs
modelZ
%05.2δmaxδ%40.6max
modelmodel
modelAs
modelZ
modelmodelmodelRR
modelRRmodel
facti
modelcalcimodel
imodel
modelmodelimodel
calci RRRSDgtX
XRR
baY
X
100δ ;)1% ;95(% ;100 ;
,
,,
Scheme 2. The validation stages of UV-spectrophotometric procedures for secnidazole determination
Oksana V. Shovkova et al /J. Pharm. Sci. & Res. Vol. 9(4), 2017, 338-348
341
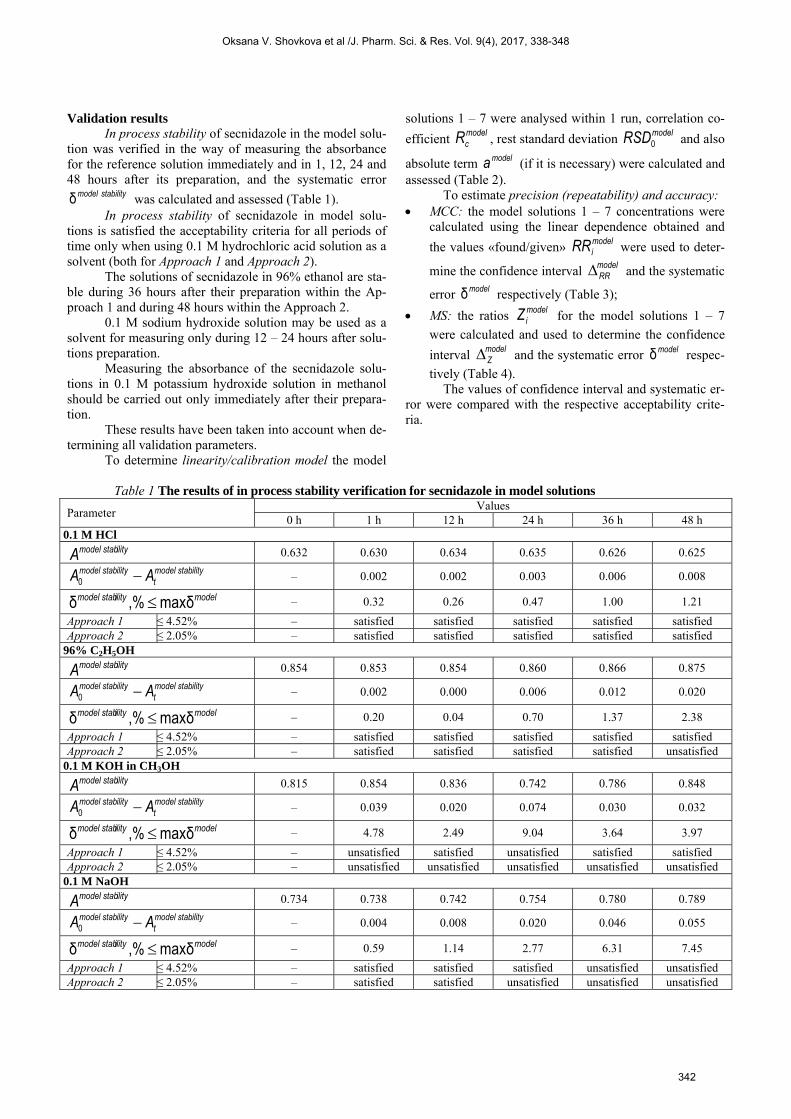
Validation results
In process stability of secnidazole in the model solu-tion was verified in the way of measuring the absorbance for the reference solution immediately and in 1, 12, 24 and 48 hours after its preparation, and the systematic error
stabilitymodel δ was calculated and assessed (Table 1). In process stability of secnidazole in model solu-
tions is satisfied the acceptability criteria for all periods of time only when using 0.1 M hydrochloric acid solution as a solvent (both for Approach 1 and Approach 2).
The solutions of secnidazole in 96% ethanol are sta-ble during 36 hours after their preparation within the Ap-proach 1 and during 48 hours within the Approach 2.
0.1 M sodium hydroxide solution may be used as a solvent for measuring only during 12 – 24 hours after solu-tions preparation.
Measuring the absorbance of the secnidazole solu-tions in 0.1 M potassium hydroxide solution in methanol should be carried out only immediately after their prepara-tion.
These results have been taken into account when de-termining all validation parameters.
To determine linearity/calibration model the model
solutions 1 – 7 were analysed within 1 run, correlation co-
efficient modelcR , rest standard deviation modelRSD0 and also
absolute term modela (if it is necessary) were calculated and assessed (Table 2).
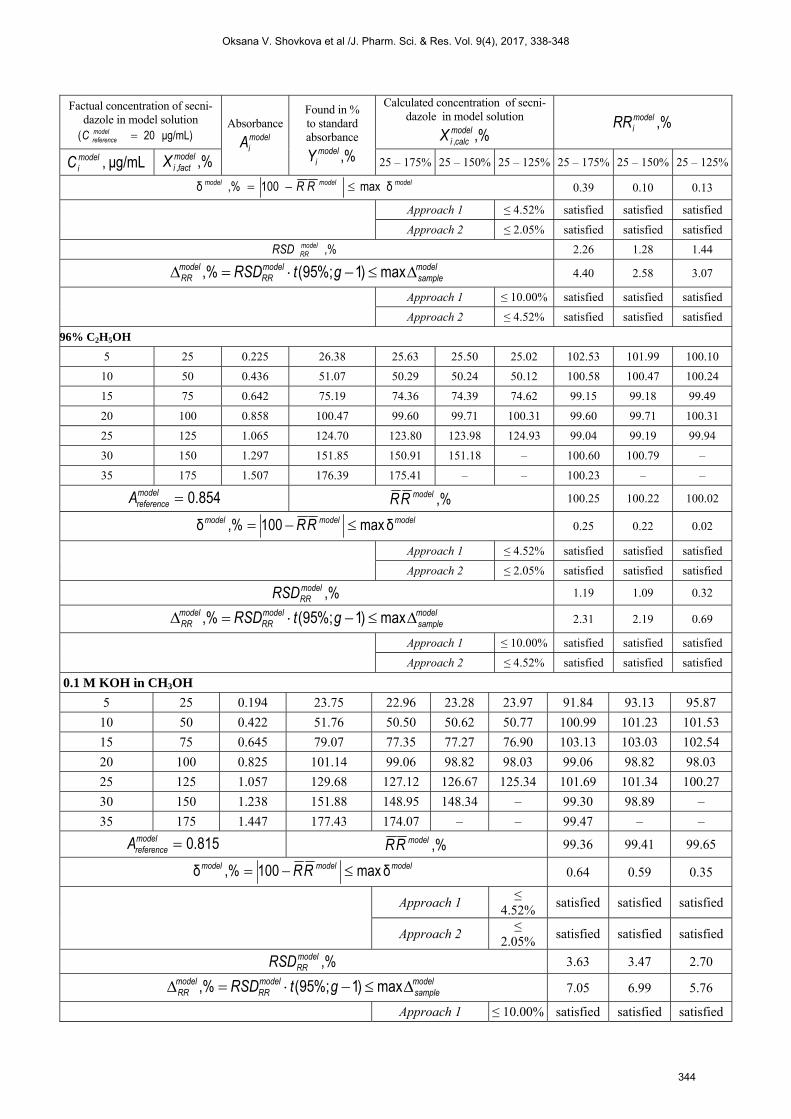
To estimate precision (repeatability) and accuracy: MCC: the model solutions 1 – 7 concentrations were
calculated using the linear dependence obtained and
the values «found/given» modeliRR were used to deter-
mine the confidence interval modelRR and the systematic
error modelδ respectively (Table 3);
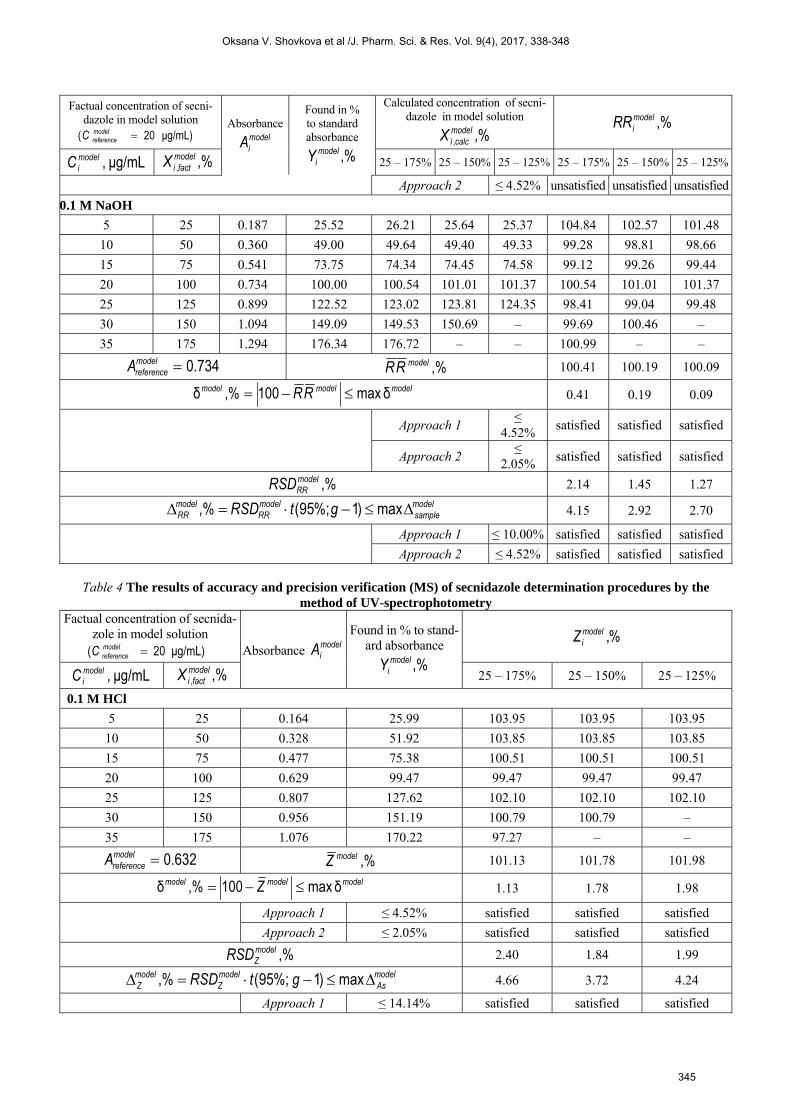
MS: the ratios modeliZ for the model solutions 1 – 7
were calculated and used to determine the confidence
interval modelZ and the systematic error modelδ respec-
tively (Table 4). The values of confidence interval and systematic er-
ror were compared with the respective acceptability crite-ria.
Table 1 The results of in process stability verification for secnidazole in model solutions
Parameter Values
0 h 1 h 12 h 24 h 36 h 48 h 0.1 M HCl
ilitymodel stabA 0.632 0.630 0.634 0.635 0.626 0.625
ilitymodel stabt
ilitymodel stab AA 0 – 0.002 0.002 0.003 0.006 0.008
modelilitymodel stab δmax,%δ – 0.32 0.26 0.47 1.00 1.21
Approach 1 ≤ 4.52% – satisfied satisfied satisfied satisfied satisfied Approach 2 ≤ 2.05% – satisfied satisfied satisfied satisfied satisfied
96% C2H5OH ilitymodel stabA 0.854 0.853 0.854 0.860 0.866 0.875
ilitymodel stabt
ilitymodel stab AA 0 – 0.002 0.000 0.006 0.012 0.020
modelilitymodel stab δmax,%δ – 0.20 0.04 0.70 1.37 2.38
Approach 1 ≤ 4.52% – satisfied satisfied satisfied satisfied satisfied Approach 2 ≤ 2.05% – satisfied satisfied satisfied satisfied unsatisfied
0.1 M KOH in CH3OH ilitymodel stabA 0.815 0.854 0.836 0.742 0.786 0.848
ilitymodel stabt
ilitymodel stab AA 0 – 0.039 0.020 0.074 0.030 0.032
modelilitymodel stab δmax,%δ – 4.78 2.49 9.04 3.64 3.97
Approach 1 ≤ 4.52% – unsatisfied satisfied unsatisfied satisfied satisfied Approach 2 ≤ 2.05% – unsatisfied unsatisfied unsatisfied unsatisfied unsatisfied
0.1 M NaOH ilitymodel stabA 0.734 0.738 0.742 0.754 0.780 0.789
ilitymodel stabt
ilitymodel stab AA 0 – 0.004 0.008 0.020 0.046 0.055
modelilitymodel stab δmax,%δ – 0.59 1.14 2.77 6.31 7.45
Approach 1 ≤ 4.52% – satisfied satisfied satisfied unsatisfied unsatisfied Approach 2 ≤ 2.05% – satisfied satisfied unsatisfied unsatisfied unsatisfied
Oksana V. Shovkova et al /J. Pharm. Sci. & Res. Vol. 9(4), 2017, 338-348
342
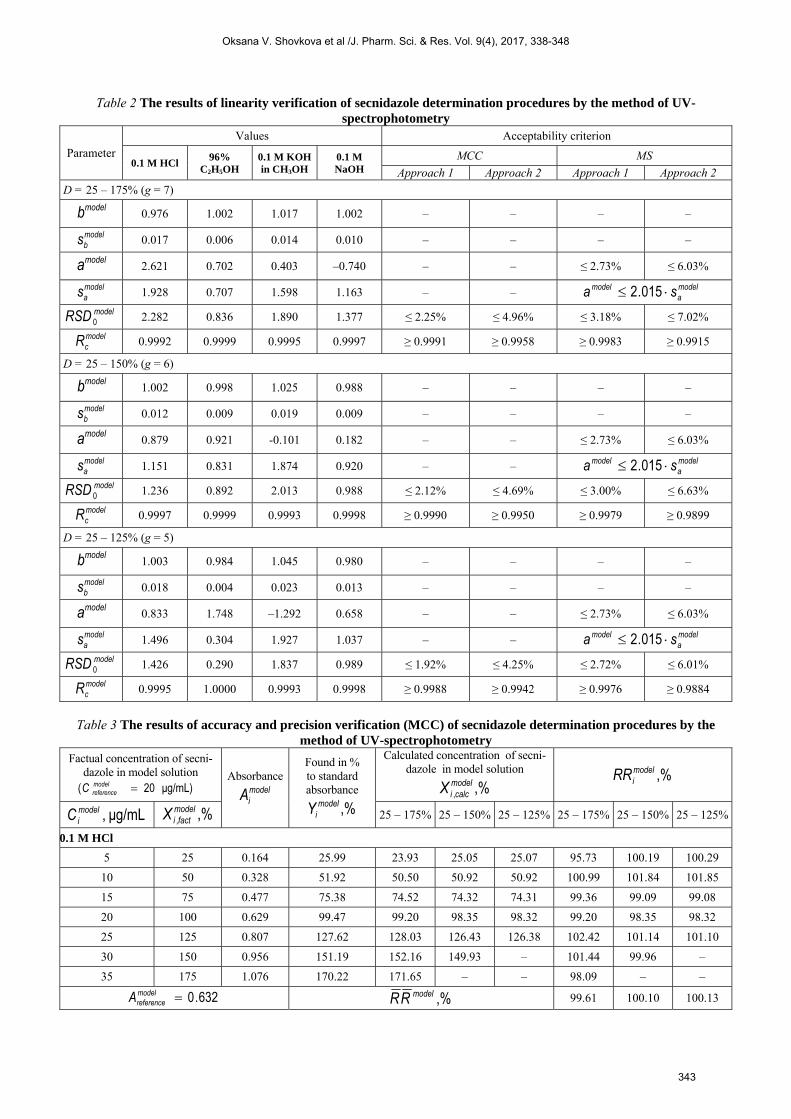
Table 2 The results of linearity verification of secnidazole determination procedures by the method of UV-spectrophotometry
Parameter
Values Acceptability criterion
0.1 M HCl 96%
C2H5OH 0.1 M KOH in CH3OH
0.1 M NaOH
MCC МS
Approach 1 Approach 2 Approach 1 Approach 2
D = 25 – 175% (g = 7)
modelb 0.976 1.002 1.017 1.002 – – – –
modelbs 0.017 0.006 0.014 0.010 – – – –
modela 2.621 0.702 0.403 –0.740 – – ≤ 2.73% ≤ 6.03%
modelas 1.928 0.707 1.598 1.163 – – 015.2 model
amodel sa
modelRSD 0 2.282 0.836 1.890 1.377 ≤ 2.25% ≤ 4.96% ≤ 3.18% ≤ 7.02%
modelcR 0.9992 0.9999 0.9995 0.9997 ≥ 0.9991 ≥ 0.9958 ≥ 0.9983 ≥ 0.9915
D = 25 – 150% (g = 6)
modelb 1.002 0.998 1.025 0.988 – – – –
modelbs 0.012 0.009 0.019 0.009 – – – –
modela 0.879 0.921 -0.101 0.182 – – ≤ 2.73% ≤ 6.03%
modelas 1.151 0.831 1.874 0.920 – – 015.2 model
amodel sa
modelRSD 0 1.236 0.892 2.013 0.988 ≤ 2.12% ≤ 4.69% ≤ 3.00% ≤ 6.63%
modelcR 0.9997 0.9999 0.9993 0.9998 ≥ 0.9990 ≥ 0.9950 ≥ 0.9979 ≥ 0.9899
D = 25 – 125% (g = 5)
modelb 1.003 0.984 1.045 0.980 – – – –
modelbs 0.018 0.004 0.023 0.013 – – – –
modela 0.833 1.748 –1.292 0.658 – – ≤ 2.73% ≤ 6.03%
modelas 1.496 0.304 1.927 1.037 – – 015.2 model
amodel sa
modelRSD 0 1.426 0.290 1.837 0.989 ≤ 1.92% ≤ 4.25% ≤ 2.72% ≤ 6.01%
modelcR 0.9995 1.0000 0.9993 0.9998 ≥ 0.9988 ≥ 0.9942 ≥ 0.9976 ≥ 0.9884
Table 3 The results of accuracy and precision verification (MCC) of secnidazole determination procedures by the
method of UV-spectrophotometry Factual concentration of secni-
dazole in model solution μg/mL)20( model
referenceC Absorbance
modeliA
Found in % to standard absorbance
,%modeliY
Calculated concentration of secni-dazole in model solution
,%,modelcalciX
,%modeliRR
μg/mL,modeliC ,%,
modelfactiX 25 – 175% 25 – 150% 25 – 125% 25 – 175% 25 – 150% 25 – 125%
0.1 M HCl
5 25 0.164 25.99 23.93 25.05 25.07 95.73 100.19 100.29
10 50 0.328 51.92 50.50 50.92 50.92 100.99 101.84 101.85
15 75 0.477 75.38 74.52 74.32 74.31 99.36 99.09 99.08
20 100 0.629 99.47 99.20 98.35 98.32 99.20 98.35 98.32
25 125 0.807 127.62 128.03 126.43 126.38 102.42 101.14 101.10
30 150 0.956 151.19 152.16 149.93 – 101.44 99.96 –
35 175 1.076 170.22 171.65 – – 98.09 – –
632.0modelreferenceA ,%modelRR 99.61 100.10 100.13
Oksana V. Shovkova et al /J. Pharm. Sci. & Res. Vol. 9(4), 2017, 338-348
343
Factual concentration of secni-dazole in model solution
μg/mL)20( modelreferenceC
Absorbance modeliA
Found in % to standard absorbance
,%modeliY
Calculated concentration of secni-dazole in model solution
,%,modelcalciX
,%modeliRR
μg/mL,modeliC ,%,
modelfactiX 25 – 175% 25 – 150% 25 – 125% 25 – 175% 25 – 150% 25 – 125%
modelmodelmodel RR δmax100,%δ 0.39 0.10 0.13
Approach 1 ≤ 4.52% satisfied satisfied satisfied
Approach 2 ≤ 2.05% satisfied satisfied satisfied
,%modelRRRSD 2.26 1.28 1.44
modelsample
modelRR
modelRR gtRSD max)1%;95(,% 4.40 2.58 3.07
Approach 1 ≤ 10.00% satisfied satisfied satisfied
Approach 2 ≤ 4.52% satisfied satisfied satisfied
96% C2H5OH
5 25 0.225 26.38 25.63 25.50 25.02 102.53 101.99 100.10
10 50 0.436 51.07 50.29 50.24 50.12 100.58 100.47 100.24
15 75 0.642 75.19 74.36 74.39 74.62 99.15 99.18 99.49
20 100 0.858 100.47 99.60 99.71 100.31 99.60 99.71 100.31
25 125 1.065 124.70 123.80 123.98 124.93 99.04 99.19 99.94
30 150 1.297 151.85 150.91 151.18 – 100.60 100.79 –
35 175 1.507 176.39 175.41 – – 100.23 – –
854.0modelreferenceA ,%modelRR 100.25 100.22 100.02
modelmodelmodel RR δmax100,%δ 0.25 0.22 0.02
Approach 1 ≤ 4.52% satisfied satisfied satisfied
Approach 2 ≤ 2.05% satisfied satisfied satisfied
,%modelRRRSD 1.19 1.09 0.32
modelsample
modelRR
modelRR gtRSD max)1%;95(,% 2.31 2.19 0.69
Approach 1 ≤ 10.00% satisfied satisfied satisfied
Approach 2 ≤ 4.52% satisfied satisfied satisfied
0.1 M KOH in CH3OH
5 25 0.194 23.75 22.96 23.28 23.97 91.84 93.13 95.87
10 50 0.422 51.76 50.50 50.62 50.77 100.99 101.23 101.53
15 75 0.645 79.07 77.35 77.27 76.90 103.13 103.03 102.54
20 100 0.825 101.14 99.06 98.82 98.03 99.06 98.82 98.03
25 125 1.057 129.68 127.12 126.67 125.34 101.69 101.34 100.27
30 150 1.238 151.88 148.95 148.34 – 99.30 98.89 –
35 175 1.447 177.43 174.07 – – 99.47 – –
815.0modelreferenceA ,%modelRR 99.36 99.41 99.65
modelmodelmodel RR δmax100,%δ 0.64 0.59 0.35
Approach 1
≤ 4.52%
satisfied satisfied satisfied
Approach 2 ≤
2.05% satisfied satisfied satisfied
,%modelRRRSD 3.63 3.47 2.70
modelsample
modelRR
modelRR gtRSD max)1%;95(,% 7.05 6.99 5.76
Approach 1 ≤ 10.00% satisfied satisfied satisfied
Oksana V. Shovkova et al /J. Pharm. Sci. & Res. Vol. 9(4), 2017, 338-348
344
Factual concentration of secni-dazole in model solution
μg/mL)20( modelreferenceC
Absorbance modeliA
Found in % to standard absorbance
,%modeliY
Calculated concentration of secni-dazole in model solution
,%,modelcalciX
,%modeliRR
μg/mL,modeliC ,%,
modelfactiX 25 – 175% 25 – 150% 25 – 125% 25 – 175% 25 – 150% 25 – 125%
Approach 2 ≤ 4.52% unsatisfied unsatisfied unsatisfied
0.1 M NaOH
5 25 0.187 25.52 26.21 25.64 25.37 104.84 102.57 101.48
10 50 0.360 49.00 49.64 49.40 49.33 99.28 98.81 98.66
15 75 0.541 73.75 74.34 74.45 74.58 99.12 99.26 99.44
20 100 0.734 100.00 100.54 101.01 101.37 100.54 101.01 101.37
25 125 0.899 122.52 123.02 123.81 124.35 98.41 99.04 99.48
30 150 1.094 149.09 149.53 150.69 – 99.69 100.46 –
35 175 1.294 176.34 176.72 – – 100.99 – –
734.0modelreferenceA ,%modelRR 100.41 100.19 100.09
modelmodelmodel RR δmax100,%δ 0.41 0.19 0.09
Approach 1
≤ 4.52%
satisfied satisfied satisfied
Approach 2 ≤
2.05% satisfied satisfied satisfied
,%modelRRRSD 2.14 1.45 1.27
modelsample
modelRR
modelRR gtRSD max)1%;95(,% 4.15 2.92 2.70
Approach 1 ≤ 10.00% satisfied satisfied satisfied
Approach 2 ≤ 4.52% satisfied satisfied satisfied
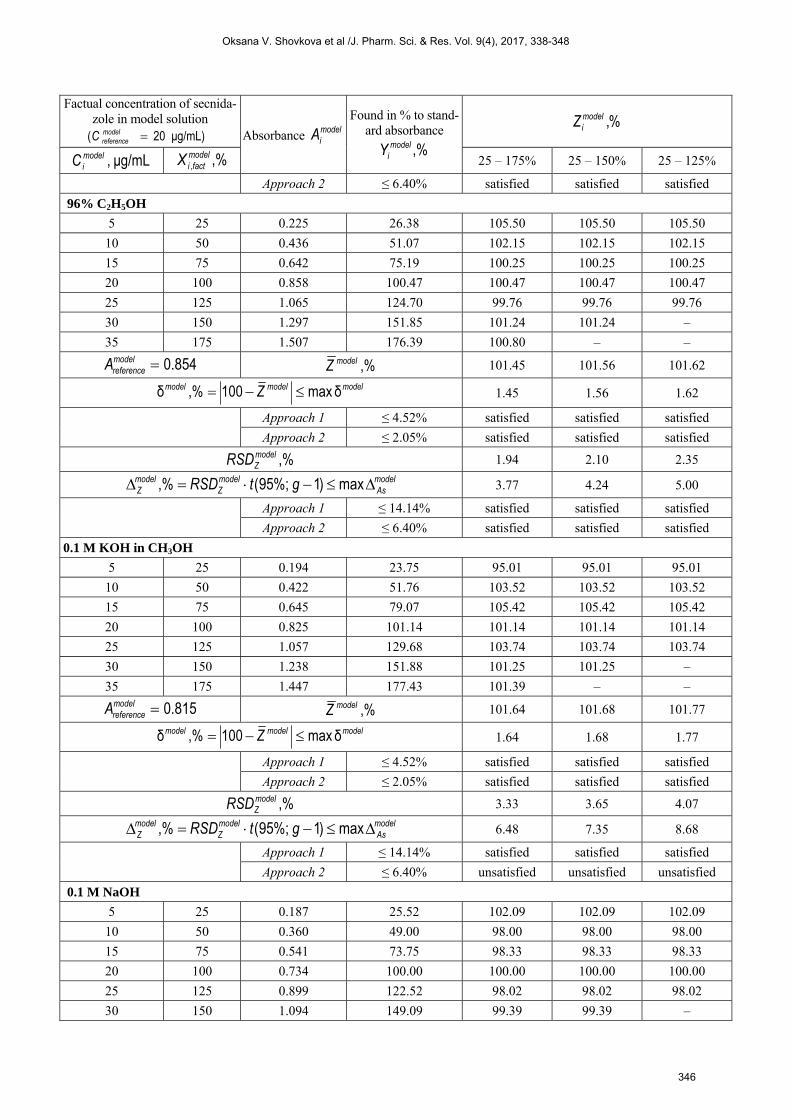
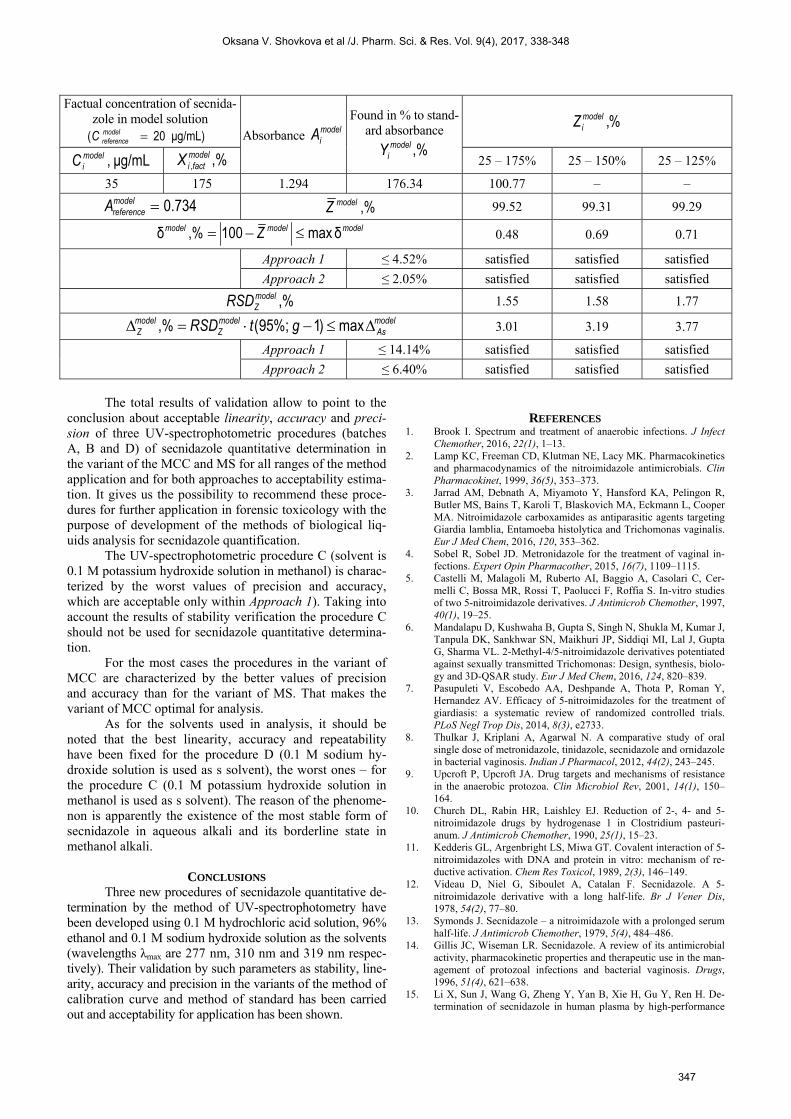
Table 4 The results of accuracy and precision verification (MS) of secnidazole determination procedures by the method of UV-spectrophotometry
Factual concentration of secnida-zole in model solution
μg/mL)20( modelreferenceC Absorbance model
iA
Found in % to stand-ard absorbance
,%modeliY
%,modeliZ
μg/mL,modeliC ,%,
modelfactiX 25 – 175% 25 – 150% 25 – 125%
0.1 M HCl
5 25 0.164 25.99 103.95 103.95 103.95
10 50 0.328 51.92 103.85 103.85 103.85
15 75 0.477 75.38 100.51 100.51 100.51
20 100 0.629 99.47 99.47 99.47 99.47
25 125 0.807 127.62 102.10 102.10 102.10
30 150 0.956 151.19 100.79 100.79 –
35 175 1.076 170.22 97.27 – –
632.0modelreferenceA ,%modelZ 101.13 101.78 101.98
modelmodelmodel Z δmax100,%δ 1.13 1.78 1.98
Approach 1 ≤ 4.52% satisfied satisfied satisfied
Approach 2 ≤ 2.05% satisfied satisfied satisfied
,%modelZRSD 2.40 1.84 1.99
modelAs
modelZ
modelZ gtRSD max)1%;95(,% 4.66 3.72 4.24
Approach 1 ≤ 14.14% satisfied satisfied satisfied
Oksana V. Shovkova et al /J. Pharm. Sci. & Res. Vol. 9(4), 2017, 338-348
345
Factual concentration of secnida-zole in model solution
μg/mL)20( modelreferenceC Absorbance model
iA
Found in % to stand-ard absorbance
,%modeliY
%,modeliZ
μg/mL,modeliC ,%,
modelfactiX 25 – 175% 25 – 150% 25 – 125%
Approach 2 ≤ 6.40% satisfied satisfied satisfied
96% C2H5OH
5 25 0.225 26.38 105.50 105.50 105.50
10 50 0.436 51.07 102.15 102.15 102.15
15 75 0.642 75.19 100.25 100.25 100.25
20 100 0.858 100.47 100.47 100.47 100.47
25 125 1.065 124.70 99.76 99.76 99.76
30 150 1.297 151.85 101.24 101.24 –
35 175 1.507 176.39 100.80 – –
854.0modelreferenceA ,%modelZ 101.45 101.56 101.62
modelmodelmodel Z δmax100,%δ 1.45 1.56 1.62
Approach 1 ≤ 4.52% satisfied satisfied satisfied
Approach 2 ≤ 2.05% satisfied satisfied satisfied
,%modelZRSD 1.94 2.10 2.35
modelAs
modelZ
modelZ gtRSD max)1%;95(,% 3.77 4.24 5.00
Approach 1 ≤ 14.14% satisfied satisfied satisfied
Approach 2 ≤ 6.40% satisfied satisfied satisfied
0.1 M KOH in CH3OH
5 25 0.194 23.75 95.01 95.01 95.01
10 50 0.422 51.76 103.52 103.52 103.52
15 75 0.645 79.07 105.42 105.42 105.42
20 100 0.825 101.14 101.14 101.14 101.14
25 125 1.057 129.68 103.74 103.74 103.74
30 150 1.238 151.88 101.25 101.25 –
35 175 1.447 177.43 101.39 – –
815.0modelreferenceA ,%modelZ 101.64 101.68 101.77
modelmodelmodel Z δmax100,%δ 1.64 1.68 1.77
Approach 1 ≤ 4.52% satisfied satisfied satisfied
Approach 2 ≤ 2.05% satisfied satisfied satisfied
,%modelZRSD 3.33 3.65 4.07
modelAs
modelZ
modelZ gtRSD max)1%;95(,% 6.48 7.35 8.68
Approach 1 ≤ 14.14% satisfied satisfied satisfied
Approach 2 ≤ 6.40% unsatisfied unsatisfied unsatisfied
0.1 M NaOH
5 25 0.187 25.52 102.09 102.09 102.09
10 50 0.360 49.00 98.00 98.00 98.00
15 75 0.541 73.75 98.33 98.33 98.33
20 100 0.734 100.00 100.00 100.00 100.00
25 125 0.899 122.52 98.02 98.02 98.02
30 150 1.094 149.09 99.39 99.39 –
Oksana V. Shovkova et al /J. Pharm. Sci. & Res. Vol. 9(4), 2017, 338-348
346
Factual concentration of secnida-zole in model solution
μg/mL)20( modelreferenceC Absorbance model
iA
Found in % to stand-ard absorbance
,%modeliY
%,modeliZ
μg/mL,modeliC ,%,
modelfactiX 25 – 175% 25 – 150% 25 – 125%
35 175 1.294 176.34 100.77 – –
734.0modelreferenceA ,%modelZ 99.52 99.31 99.29
modelmodelmodel Z δmax100,%δ 0.48 0.69 0.71
Approach 1 ≤ 4.52% satisfied satisfied satisfied
Approach 2 ≤ 2.05% satisfied satisfied satisfied
,%modelZRSD 1.55 1.58 1.77
modelAs
modelZ
modelZ gtRSD max)1%;95(,% 3.01 3.19 3.77
Approach 1 ≤ 14.14% satisfied satisfied satisfied
Approach 2 ≤ 6.40% satisfied satisfied satisfied
The total results of validation allow to point to the conclusion about acceptable linearity, accuracy and preci-sion of three UV-spectrophotometric procedures (batches A, B and D) of secnidazole quantitative determination in the variant of the MCC and MS for all ranges of the method application and for both approaches to acceptability estima-tion. It gives us the possibility to recommend these proce-dures for further application in forensic toxicology with the purpose of development of the methods of biological liq-uids analysis for secnidazole quantification.
The UV-spectrophotometric procedure C (solvent is 0.1 M potassium hydroxide solution in methanol) is charac-terized by the worst values of precision and accuracy, which are acceptable only within Approach 1). Taking into account the results of stability verification the procedure C should not be used for secnidazole quantitative determina-tion.
For the most cases the procedures in the variant of MCC are characterized by the better values of precision and accuracy than for the variant of MS. That makes the variant of MCC optimal for analysis.
As for the solvents used in analysis, it should be noted that the best linearity, accuracy and repeatability have been fixed for the procedure D (0.1 M sodium hy-droxide solution is used as s solvent), the worst ones – for the procedure C (0.1 M potassium hydroxide solution in methanol is used as s solvent). The reason of the phenome-non is apparently the existence of the most stable form of secnidazole in aqueous alkali and its borderline state in methanol alkali.
CONCLUSIONS
Three new procedures of secnidazole quantitative de-termination by the method of UV-spectrophotometry have been developed using 0.1 M hydrochloric acid solution, 96% ethanol and 0.1 M sodium hydroxide solution as the solvents (wavelengths λmax are 277 nm, 310 nm and 319 nm respec-tively). Their validation by such parameters as stability, line-arity, accuracy and precision in the variants of the method of calibration curve and method of standard has been carried out and acceptability for application has been shown.
REFERENCES
1. Brook I. Spectrum and treatment of anaerobic infections. J Infect Chemother, 2016, 22(1), 1–13.
2. Lamp KC, Freeman CD, Klutman NE, Lacy MK. Pharmacokinetics and pharmacodynamics of the nitroimidazole antimicrobials. Clin Pharmacokinet, 1999, 36(5), 353–373.
3. Jarrad AM, Debnath A, Miyamoto Y, Hansford KA, Pelingon R, Butler MS, Bains T, Karoli T, Blaskovich MA, Eckmann L, Cooper MA. Nitroimidazole carboxamides as antiparasitic agents targeting Giardia lamblia, Entamoeba histolytica and Trichomonas vaginalis. Eur J Med Chem, 2016, 120, 353–362.
4. Sobel R, Sobel JD. Metronidazole for the treatment of vaginal in-fections. Expert Opin Pharmacother, 2015, 16(7), 1109–1115.
5. Castelli M, Malagoli M, Ruberto AI, Baggio A, Casolari C, Cer-melli C, Bossa MR, Rossi T, Paolucci F, Roffia S. In-vitro studies of two 5-nitroimidazole derivatives. J Antimicrob Chemother, 1997, 40(1), 19–25.
6. Mandalapu D, Kushwaha B, Gupta S, Singh N, Shukla M, Kumar J, Tanpula DK, Sankhwar SN, Maikhuri JP, Siddiqi MI, Lal J, Gupta G, Sharma VL. 2-Methyl-4/5-nitroimidazole derivatives potentiated against sexually transmitted Trichomonas: Design, synthesis, biolo-gy and 3D-QSAR study. Eur J Med Chem, 2016, 124, 820–839.
7. Pasupuleti V, Escobedo AA, Deshpande A, Thota P, Roman Y, Hernandez AV. Efficacy of 5-nitroimidazoles for the treatment of giardiasis: a systematic review of randomized controlled trials. PLoS Negl Trop Dis, 2014, 8(3), e2733.
8. Thulkar J, Kriplani A, Agarwal N. A comparative study of oral single dose of metronidazole, tinidazole, secnidazole and ornidazole in bacterial vaginosis. Indian J Pharmacol, 2012, 44(2), 243–245.
9. Upcroft P, Upcroft JA. Drug targets and mechanisms of resistance in the anaerobic protozoa. Clin Microbiol Rev, 2001, 14(1), 150–164.
10. Church DL, Rabin HR, Laishley EJ. Reduction of 2-, 4- and 5-nitroimidazole drugs by hydrogenase 1 in Clostridium pasteuri-anum. J Antimicrob Chemother, 1990, 25(1), 15–23.
11. Kedderis GL, Argenbright LS, Miwa GT. Covalent interaction of 5-nitroimidazoles with DNA and protein in vitro: mechanism of re-ductive activation. Chem Res Toxicol, 1989, 2(3), 146–149.
12. Videau D, Niel G, Siboulet A, Catalan F. Secnidazole. A 5-nitroimidazole derivative with a long half-life. Br J Vener Dis, 1978, 54(2), 77–80.
13. Symonds J. Secnidazole – a nitroimidazole with a prolonged serum half-life. J Antimicrob Chemother, 1979, 5(4), 484–486.
14. Gillis JC, Wiseman LR. Secnidazole. A review of its antimicrobial activity, pharmacokinetic properties and therapeutic use in the man-agement of protozoal infections and bacterial vaginosis. Drugs, 1996, 51(4), 621–638.
15. Li X, Sun J, Wang G, Zheng Y, Yan B, Xie H, Gu Y, Ren H. De-termination of secnidazole in human plasma by high-performance
Oksana V. Shovkova et al /J. Pharm. Sci. & Res. Vol. 9(4), 2017, 338-348
347
liquid chromatography with UV detection and its application to the bioequivalence studies. Biomed Chromatogr, 2007, 21(3), 304–309.
16. Ravi SK, Naidu MU, Sekhar EC, Rao TR, Shobha JC, Rani PU,Surya KJ. Rapid and selective analysis of secnidazole in humanplasma using high-performance liquid chromatography with ultra-violet detection. J Chromatogr B Biomed Sci Appl, 1997, 691(1),208–211.
17. El Wallily AF, Abdine HH, Razak OA, Zamel S. Spectrophotomet-ric and HPLC determination of secnidazole in pharmaceutical tab-lets. J Pharm Biomed Anal, 2000, 22(6), 887–897.
18. Mitrowska K, Antczak M. Development and validation of a liquidchromatography with tandem mass spectrometry method for the de-termination of nitroimidazole residues in beeswax. J Sep Sci, 2017,doi: 10.1002/jssc.201600928.
19. Hernández-Mesa M, D'Orazio G, Rocco A, García-Campaña AM,Blanco CC, Fanali S. Capillary electrochromatography-mass spec-trometry for the determination of 5-nitroimidazole antibiotics inurine samples. Electrophoresis, 2015, 36(20), 2606–2615.
20. Rúbies A, Sans G, Kumar P, Granados M, Companyó R, CentrichF. High-throughput method for the determination of nitroimidazolesin muscle samples by liquid chromatography coupled to mass spec-trometry. Anal Bioanal Chem, 2015, 407(15), 4411–4421.
21. Du J, Zhang Y, Chen Y, Liu D, Chen X, Zhong D. EnantioselectiveHPLC determination and pharmacokinetic study of secnidazole en-antiomers in rats. J Chromatogr B Analyt Technol Biomed Life Sci,2014, 965, 224–230.
22. Sun H, Wang F, Ai L, Guo C, Chen R. Validated method for deter-mination of eight banned nitroimidazole residues in natural casingsby LC/MS/MS with solid-phase extraction. J AOAC Int, 2009,92(2), 612–621.
23. Sun HW, Wang FC, Ai LF. Simultaneous determination of sevennitroimidazole residues in meat by using HPLC-UV detection withsolid-phase extraction. J Chromatogr B Analyt Technol Biomed LifeSci, 2007, 857(2), 296–300.
24. Bakshi M, Singh S. ICH guidance in practice: establishment ofinherent stability of secnidazole and development of a validatedstability-indicating high-performance liquid chromatographic assaymethod. J Pharm Biomed Anal, 2004, 36(4), 769–775.
25. Tenenbaum H, Cuisinier FJ, Le Liboux A, Pichard E, Montay G,Frydman A. Secnidazole concentrations in plasma and crevicularfluid after a single oral dose. J Clin Periodontol, 1993, 20(7), 505–508.
26. Zhu DQ, Hu KL, Tao WX, Feng L, Duan H, Jiang XG, Chen J.Evaluation of the bioequivalence and pharmacokinetics of two for-mulations of secnidazole after single oral administration in healthyvolunteers. Arzneimittelforschung, 2007, 57(11), 723–726.
27. Khan S, Haseeb M, Baig MH, Bagga PS, Siddiqui HH, Kamal MA,Khan MS. Improved efficiency and stability of secnidazole – Anideal delivery system. Saudi J Biol Sci, 2015, 22(1), 42–49.
28. Darwish KM, Salama I, Mostafa S, El-Sadek M. Extractional spec-trophotometric analysis of metronidazole, tinidazole, ornidazole and
secnidazole bases through acid-dye complexation using bromothy-mol blue dye. Pak J Pharm Sci, 2012, 25(1), 207–217.
29. Saffaj T, Charrouf M, Abourriche A, Abboud Y, Bennamara A,Berrada M. Spectrophotometric determination of metronidazole andsecnidazole in pharmaceutical preparations. Farmaco, 2004, 59(10),843–846.
30. Danzer K, Otto M, Currie LA. Guidelines for calibration in analyti-cal chemistry. Part 2. Multispecies calibration. Pure Appl Chem, 2004, 76(6), 1215–1225.
31. Klimenko LYu, Petyunin GP. Development of approaches to vali-dation of UV-spectrophotometric methods of quantitative determi-nation in forensic and toxicological analysis: linearity and applica-tion range. Farmatsevtychnyi chasopys, 2014, 2(30), 46–51.
32. Klimenko LYu, Petyunin GP, Trut SM, Moroz VP. [Acceptabilitycriteria for linear dependence when validating UV-spectrophotometric methods of quantitative determination in foren-sic and toxicological analysis]. Current issues in pharmacy andmedicine: science and practice, 2014, 2(15), 15–22 [Article in Rus-sian].
33. Klimenko LYu, Trut SM, Petyunin GP, Kostina TA. Determiningaccuracy in validation of UV-spectrophotometric methods of quan-titative measurement in forensic toxicological analysis. UkrainianBiopharmaceutical Journal, 2014, 2(31), 55–67.
34. Klimenko LYu, Trut SM, Mykytenko OYe. Approaches to determi-nation of precision for UV-spectrophotometric methods of quantita-tive determination in forensic and toxicological analysis. Far-matsyia Kazakhstana, 2014, 3(154), 44–48.
35. Klimenko LYu. [Development of approaches to determination oflinearity, accuracy and precision of UV-spectrophotometric meth-ods of quantitative determination by the method of standard in fo-rensic and toxicological analysis]. Farmatsyia Kazakhstana, 2014,4(155), 31–35 [Article in Russian].
36. Klimenko LYu. The integrated approach to development and vali-dation of the procedures of analytes quantification in biological flu-ids for chemical and toxicological analysis, DSc thesis, NationalUniversity of Pharmacy (Kharkiv, Ukraine, 2016) [in Russian].
37. State Pharmacopoeia of Ukraine, SE «Ukrainian Scientific Pharma-copoeial Center for Quality of Medicines», Kharkiv, 2016, 2nd ed.
38. Gryzodub OI. Standardized validation procedures for methods ofmedicines quality control, SE «Ukrainian Scientific Pharmacopoe-ial Center for Quality of Medicines», Kharkiv, 2016.
39. Guidance for the Validation of Analytical Methodology and Cali-bration of Equipment used for Testing of Illicit Drugs in SeizedMaterials and Biological Specimens, United Nations Office onDrugs and Crime, Laboratory and Scientific Section, New York,2009.
40. Moffat AC, Osselton MD, Widdop B. Clarke’s analysis of drugsand poisons in pharmaceuticals, body fluids and postmortem mate-rial, Pharmaceutical Press, London, 2011, 4th ed.
Oksana V. Shovkova et al /J. Pharm. Sci. & Res. Vol. 9(4), 2017, 338-348
348