to perform analytical method validation of paracetamol tablets by uv-spectrophotometric method
TRANSCRIPT
Drug Regulation & Regulatory Authorities
Dept. Of Quality Assurance & Regulatory Affairs L. J. Institute of Pharmacy, Ahmedabad.
EXPERIMENT NO.: DATE:
AIM: To perform Analytical method validation of Paracetamol Tablets by UV-
spectrophotometric method.
REFERENCES:
1) ICH Q2 (R1) guidelines for validation of analytical procedures.
2) Indian Pharmacopoeia, 2010 vol. III, Govt. of India Ministry of health and Family
Welfare Published by The Indian Pharmacopoeia Commission , Ghaziabad; 1861-
1862.
REQUIREMETNS:
Apparatus: 100ml & 10ml volumetric flasks, pipettes, beakers.
Reagents: Paracetamol API, Paracetamol Tablet, Methanol, Distilled Water.
Equipments:
1) Shimadzu UV-1800
Sr. No.: A114550/08677
2) Shimadzu UV-1800
Sr. No.: A114549/08780
THEORY:
General Description of Paracetamol:
Name: Paracetamol INN or Acetaminophen USAN.
Dose: 500 mg.
Chemical name: N-Acetyl-p-aminophenol.
Structure:
Class: mild analgesic.
Use: over-the-counter analgesic (pain reliever) and antipyretic (fever reducer).It is
commonly used for the relief of headaches and other minor aches and pains and is a major
ingredient in numerous cold and flu remedies. In combination with opioid analgesics,
Drug Regulation & Regulatory Authorities
Dept. Of Quality Assurance & Regulatory Affairs L. J. Institute of Pharmacy, Ahmedabad.
Paracetamol can also be used in the management of more severe pain such as post-surgical
pain and providing palliative care in advanced cancer patients. Though Paracetamol is
used to treat inflammatory pain, it is not generally classified as an NSAID because it
exhibits only weak anti-inflammatory activity.
Half-life: 1–4 hours.
Adverse effects: causes gastrointestinal problems or allergic skin reactions. Blood
dyscrasia (e.g. thrombocytopenia), methaemoglobinemia, and hemolytic anemia are very
rare.
Validation Of Analytical Methods
Validation of an analytical method is documented evidence which provide a high
degree of assurance that the given method will consistently produce a product meeting its
predetermined specifications and quality attributes.
Validation parameters as per ICH
1) Accuracy
The accuracy of an analytical method may be defined as the closeness of the test
results obtained by the method to the true value. It is the measure of the exactness of the
analytical method developed. Accuracy may often be expressed as percent recovery by the
assay of a known amount of analyte added. Accuracy may be determined by applying the
method to samples or mixture of excipients to which known amount of analyte have been
added both above and below the normal levels expected in the samples. Accuracy is then
calculated from the test results as the percentage of the analyte recovered by the assay.
Dosage form assays commonly provide accuracy within 3-5% of the true value. The ICH
documents recommend that accuracy should be assessed using a minimum of nine
determinations over a minimum of three concentration levels, covering the specified range
(i.e. three concentrations and three replicates of each concentration).
2) Precision
The precision of an analytical method is the degree of agreement among individual
test results when the method is applied repeatedly to multiple sampling of homogenous
samples. This is usually expressed as the standard deviation or the relative standard
deviation (coefficient of variation). Precision is a measure of the degree of reproducibility
or of the repeatability of the analytical method under normal operating circumstances.
Repeatability:
Repeatability can be defined as the precision of the procedure when repeated by
same analyst under the same operating conditions (same reagents, equipments, settings
Drug Regulation & Regulatory Authorities
Dept. Of Quality Assurance & Regulatory Affairs L. J. Institute of Pharmacy, Ahmedabad.
and laboratory) over a short interval of time. Repeatability is also termed as intra-assay
precision.
The ICH documents recommend that repeatability should be assessed using:
a) A minimum of 9 determinations covering the specified range for the procedure (e.g., 3
concentrations/3 replicates each); or
b) A minimum of 6 determinations at 100% of the test concentration.
It is normally expected that at least six replicates be carried out and a table showing each
individual result provided from which the mean, standard deviation and co-efficient of
variation should be calculated for set of n values.
The RSD values are important for showing degree of variation expected when the
analytical procedure is repeated several times in a standard situation. (RSD below 1% for
bulk drugs and RSD below 2% for assays in finished product).
Intermediate precision:
Intermediate precision expresses within-laboratories variations: different days,
different analysts, different equipment, etc.
The extent to which intermediate precision should be established depends on the
circumstances under which the procedure is intended to be used. The applicant should
establish the effects of random events on the precision of the analytical procedure. Typical
variations to be studied include days, analysts, equipment etc. It is not considered
necessary to study these effects individually. The use of an experimental design (matrix) is
encouraged.
Reproducibility:
Reproducibility means the precision of the procedure when it is carried out under
different conditions-usually in different laboratories-on separate, identical samples taken
from the same homogenous batch of material. Comparisons of results obtained by
different analysts, by the use of different equipments, or by carrying out the analysis at
different times can also provide valuable information.
3) Linearity
The linearity of an analytical procedure is its ability (within a given range) to
obtain test results which are directly proportional to the concentration (amount) of analyte
in the sample.
A linear relationship should be evaluated across the range of the analytical procedure. It
may be demonstrated directly on the drug substance (by dilution of a standard stock
Drug Regulation & Regulatory Authorities
Dept. Of Quality Assurance & Regulatory Affairs L. J. Institute of Pharmacy, Ahmedabad.
solution) and/or separate weighing of synthetic mixtures of the drug product components
using the proposed procedure.
Linearity should be evaluated by visual inspection of a plot of signals as a function of
analyte concentration or content. If there is a linear relationship, test results should be
evaluated by appropriate statistical methods, for example, by calculation of a regression
line by the method of least squares. The correlation coefficient, y-intercept, slope of the
regression line and residual sum of squares should be submitted. A plot of the data should
be included. In addition, an analysis of the deviation of the actual data points from the
regression line may also be helpful for evaluating linearity.
The linear range of detectability that obeys Beer’s law is dependent on the compound
analyzed and the detector used. The working sample concentration and samples tested for
accuracy should be in the linear range. The claim that the method is linear is to be justified
with additional mention of zero intercept by processing data by linear least square
regression. Data is processed by linear least square regression declaring the regression co-
efficient and b of the linear equation y= ax + b together with the correlation coefficient of
determination r. For the method to be linear the r value should be close to1.
For the establishment of linearity, a minimum of 5 concentrations is recommended. Other
approaches should be justified.
4) Range
The range of an analytical procedure is the interval between the upper and lower
concentration (amounts) of analyte in the sample (including these concentrations) for
which it has been demonstrated that the analytical procedure has a suitable level of
precision, accuracy and linearity.
The specified range is normally derived from linearity studies and depends on the intended
application of the procedure. The following minimum specified ranges should be
considered:
For the assay of a drug substance or a finished (drug) product: normally from 80 to 120%
of the test concentration;
For content uniformity, covering a minimum of 70 to 130% of the test concentration,
unless a wider more appropriate range, based on the nature of the dosage form (e.g.,
metered dose inhalers), is justified;
For dissolution testing: +/-20 % over the specified range;
e.g., if the specifications for a controlled released product cover a region from20%, after 1
hour, up to 90%, after 24 hours, the validated range would be 0-110% of the label claim.
Drug Regulation & Regulatory Authorities
Dept. Of Quality Assurance & Regulatory Affairs L. J. Institute of Pharmacy, Ahmedabad.
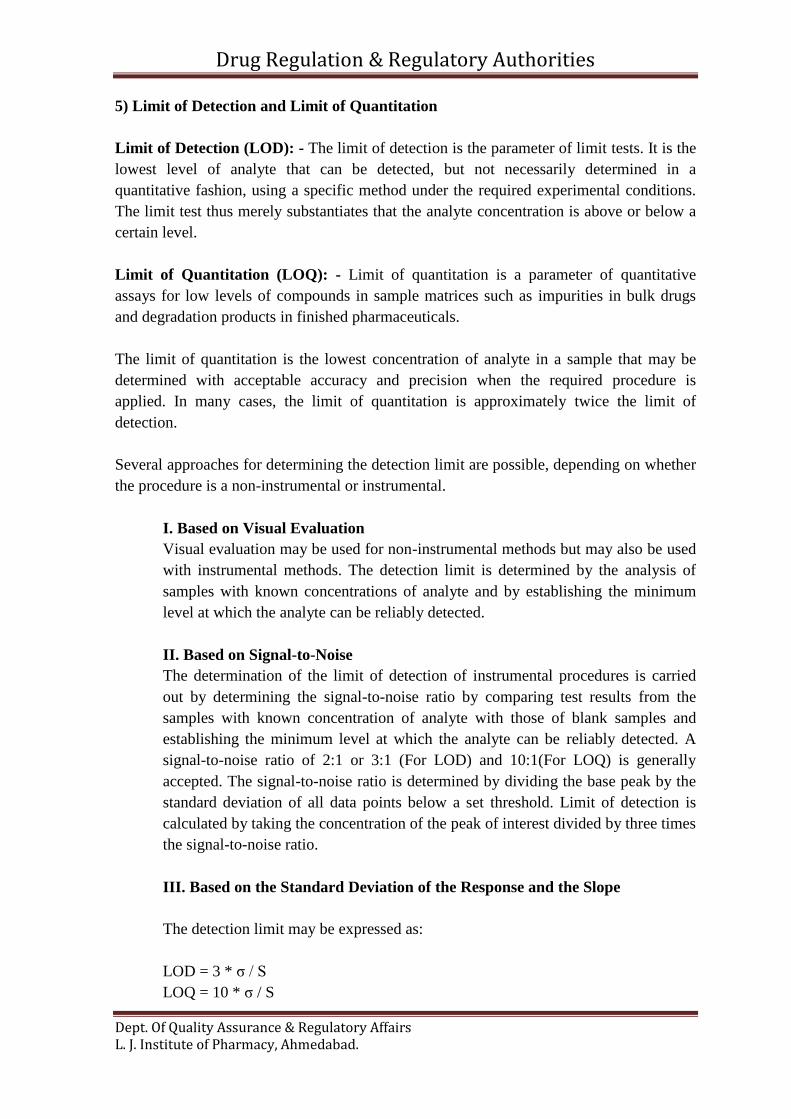
5) Limit of Detection and Limit of Quantitation
Limit of Detection (LOD): - The limit of detection is the parameter of limit tests. It is the
lowest level of analyte that can be detected, but not necessarily determined in a
quantitative fashion, using a specific method under the required experimental conditions.
The limit test thus merely substantiates that the analyte concentration is above or below a
certain level.
Limit of Quantitation (LOQ): - Limit of quantitation is a parameter of quantitative
assays for low levels of compounds in sample matrices such as impurities in bulk drugs
and degradation products in finished pharmaceuticals.
The limit of quantitation is the lowest concentration of analyte in a sample that may be
determined with acceptable accuracy and precision when the required procedure is
applied. In many cases, the limit of quantitation is approximately twice the limit of
detection.
Several approaches for determining the detection limit are possible, depending on whether
the procedure is a non-instrumental or instrumental.
I. Based on Visual Evaluation
Visual evaluation may be used for non-instrumental methods but may also be used
with instrumental methods. The detection limit is determined by the analysis of
samples with known concentrations of analyte and by establishing the minimum
level at which the analyte can be reliably detected.
II. Based on Signal-to-Noise
The determination of the limit of detection of instrumental procedures is carried
out by determining the signal-to-noise ratio by comparing test results from the
samples with known concentration of analyte with those of blank samples and
establishing the minimum level at which the analyte can be reliably detected. A
signal-to-noise ratio of 2:1 or 3:1 (For LOD) and 10:1(For LOQ) is generally
accepted. The signal-to-noise ratio is determined by dividing the base peak by the
standard deviation of all data points below a set threshold. Limit of detection is
calculated by taking the concentration of the peak of interest divided by three times
the signal-to-noise ratio.
III. Based on the Standard Deviation of the Response and the Slope
The detection limit may be expressed as:
LOD = 3 * σ / S
LOQ = 10 * σ / S
Drug Regulation & Regulatory Authorities
Dept. Of Quality Assurance & Regulatory Affairs L. J. Institute of Pharmacy, Ahmedabad.
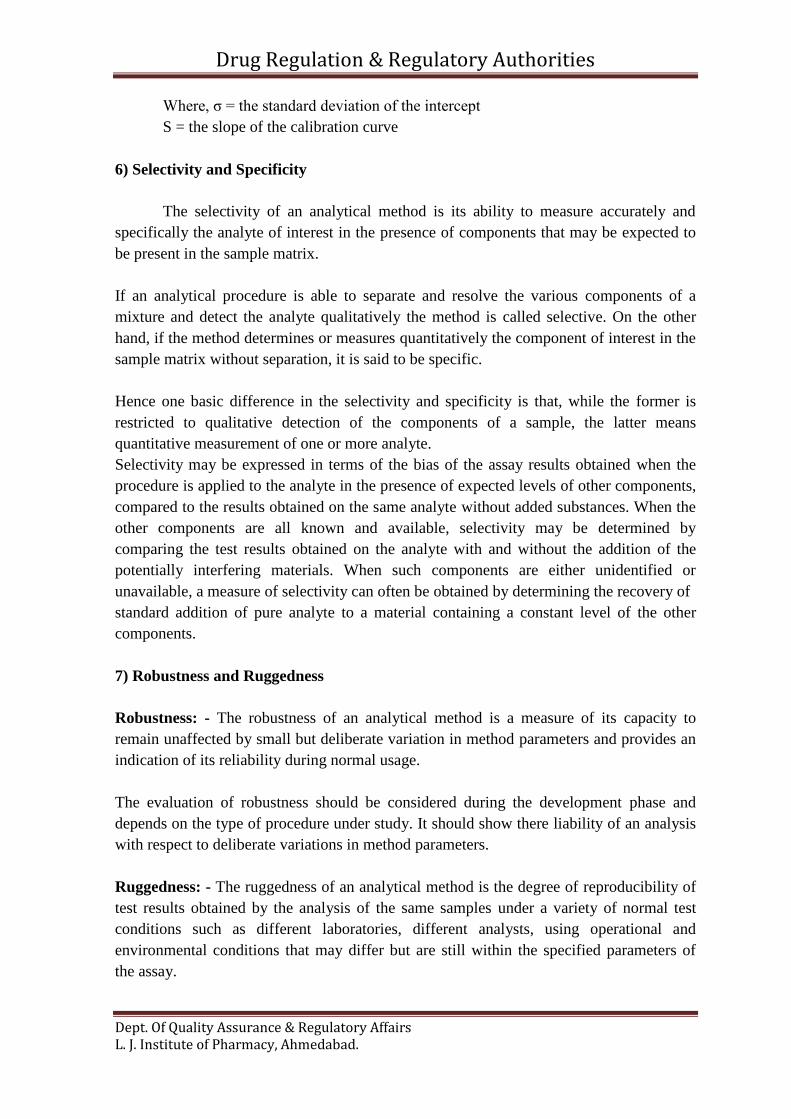
Where, σ = the standard deviation of the intercept
S = the slope of the calibration curve
6) Selectivity and Specificity
The selectivity of an analytical method is its ability to measure accurately and
specifically the analyte of interest in the presence of components that may be expected to
be present in the sample matrix.
If an analytical procedure is able to separate and resolve the various components of a
mixture and detect the analyte qualitatively the method is called selective. On the other
hand, if the method determines or measures quantitatively the component of interest in the
sample matrix without separation, it is said to be specific.
Hence one basic difference in the selectivity and specificity is that, while the former is
restricted to qualitative detection of the components of a sample, the latter means
quantitative measurement of one or more analyte.
Selectivity may be expressed in terms of the bias of the assay results obtained when the
procedure is applied to the analyte in the presence of expected levels of other components,
compared to the results obtained on the same analyte without added substances. When the
other components are all known and available, selectivity may be determined by
comparing the test results obtained on the analyte with and without the addition of the
potentially interfering materials. When such components are either unidentified or
unavailable, a measure of selectivity can often be obtained by determining the recovery of
standard addition of pure analyte to a material containing a constant level of the other
components.
7) Robustness and Ruggedness
Robustness: - The robustness of an analytical method is a measure of its capacity to
remain unaffected by small but deliberate variation in method parameters and provides an
indication of its reliability during normal usage.
The evaluation of robustness should be considered during the development phase and
depends on the type of procedure under study. It should show there liability of an analysis
with respect to deliberate variations in method parameters.
Ruggedness: - The ruggedness of an analytical method is the degree of reproducibility of
test results obtained by the analysis of the same samples under a variety of normal test
conditions such as different laboratories, different analysts, using operational and
environmental conditions that may differ but are still within the specified parameters of
the assay.
Drug Regulation & Regulatory Authorities
Dept. Of Quality Assurance & Regulatory Affairs L. J. Institute of Pharmacy, Ahmedabad.
For the determination of ruggedness, the degree of reproducibility of test result is
determined as function of the assay variable. This reproducibility may be compared to the
precision of the assay under normal condition to obtain a measure of the ruggedness of the
analytical method.
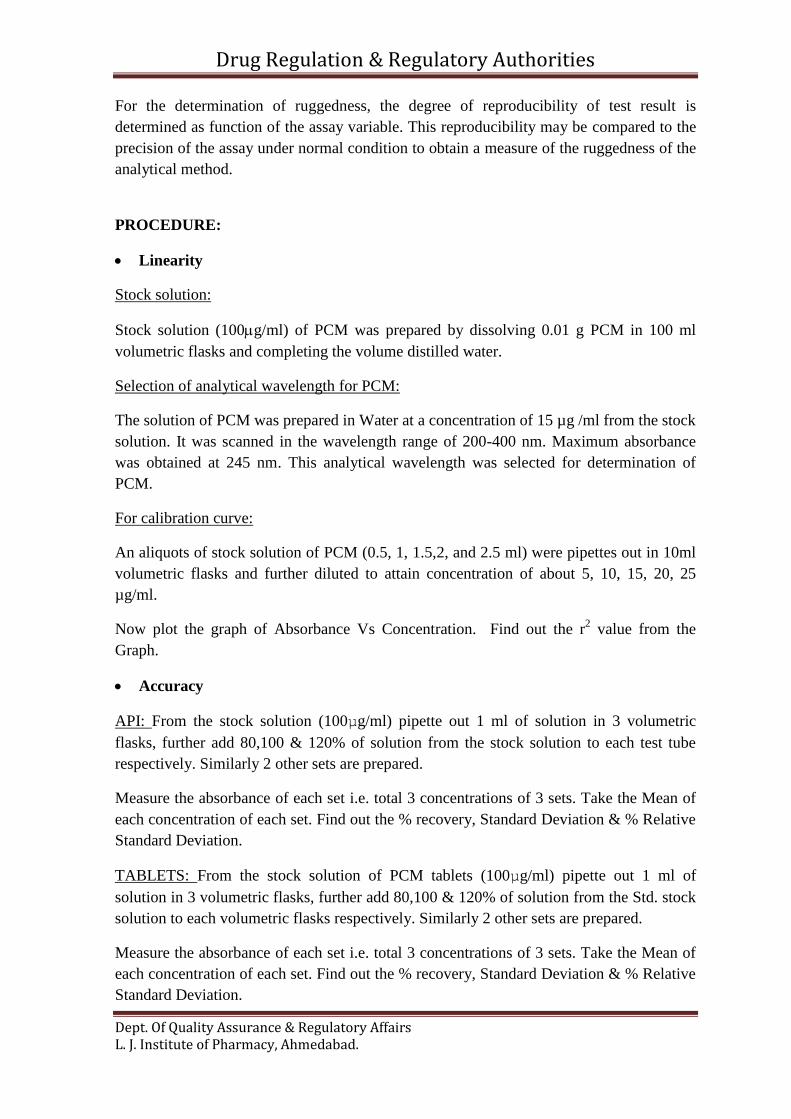
PROCEDURE:
Linearity
Stock solution:
Stock solution (100g/ml) of PCM was prepared by dissolving 0.01 g PCM in 100 ml
volumetric flasks and completing the volume distilled water.
Selection of analytical wavelength for PCM:
The solution of PCM was prepared in Water at a concentration of 15 µg /ml from the stock
solution. It was scanned in the wavelength range of 200-400 nm. Maximum absorbance
was obtained at 245 nm. This analytical wavelength was selected for determination of
PCM.
For calibration curve:
An aliquots of stock solution of PCM (0.5, 1, 1.5,2, and 2.5 ml) were pipettes out in 10ml
volumetric flasks and further diluted to attain concentration of about 5, 10, 15, 20, 25
µg/ml.
Now plot the graph of Absorbance Vs Concentration. Find out the r2 value from the
Graph.
Accuracy
API: From the stock solution (100µg/ml) pipette out 1 ml of solution in 3 volumetric
flasks, further add 80,100 & 120% of solution from the stock solution to each test tube
respectively. Similarly 2 other sets are prepared.
Measure the absorbance of each set i.e. total 3 concentrations of 3 sets. Take the Mean of
each concentration of each set. Find out the % recovery, Standard Deviation & % Relative
Standard Deviation.
TABLETS: From the stock solution of PCM tablets (100µg/ml) pipette out 1 ml of
solution in 3 volumetric flasks, further add 80,100 & 120% of solution from the Std. stock
solution to each volumetric flasks respectively. Similarly 2 other sets are prepared.
Measure the absorbance of each set i.e. total 3 concentrations of 3 sets. Take the Mean of
each concentration of each set. Find out the % recovery, Standard Deviation & % Relative
Standard Deviation.
Drug Regulation & Regulatory Authorities
Dept. Of Quality Assurance & Regulatory Affairs L. J. Institute of Pharmacy, Ahmedabad.
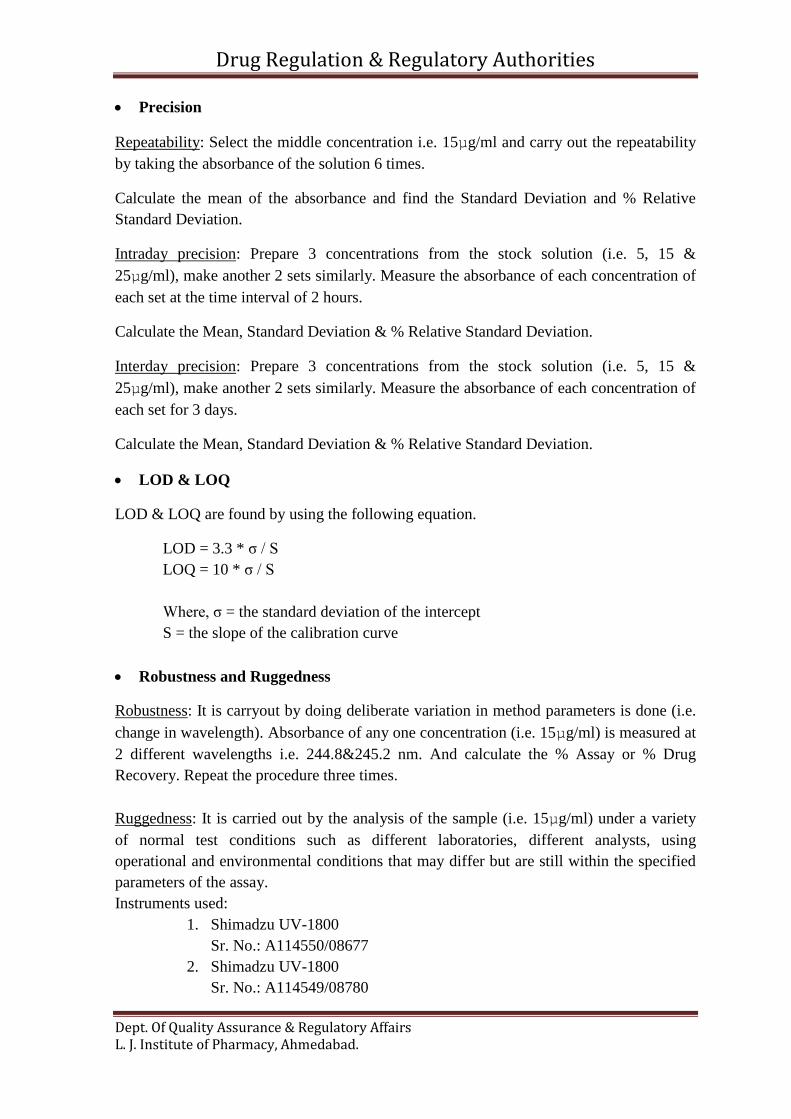
Precision
Repeatability: Select the middle concentration i.e. 15µg/ml and carry out the repeatability
by taking the absorbance of the solution 6 times.
Calculate the mean of the absorbance and find the Standard Deviation and % Relative
Standard Deviation.
Intraday precision: Prepare 3 concentrations from the stock solution (i.e. 5, 15 &
25µg/ml), make another 2 sets similarly. Measure the absorbance of each concentration of
each set at the time interval of 2 hours.
Calculate the Mean, Standard Deviation & % Relative Standard Deviation.
Interday precision: Prepare 3 concentrations from the stock solution (i.e. 5, 15 &
25µg/ml), make another 2 sets similarly. Measure the absorbance of each concentration of
each set for 3 days.
Calculate the Mean, Standard Deviation & % Relative Standard Deviation.
LOD & LOQ
LOD & LOQ are found by using the following equation.
LOD = 3.3 * σ / S
LOQ = 10 * σ / S
Where, σ = the standard deviation of the intercept
S = the slope of the calibration curve
Robustness and Ruggedness
Robustness: It is carryout by doing deliberate variation in method parameters is done (i.e.
change in wavelength). Absorbance of any one concentration (i.e. 15µg/ml) is measured at
2 different wavelengths i.e. 244.8&245.2 nm. And calculate the % Assay or % Drug
Recovery. Repeat the procedure three times.
Ruggedness: It is carried out by the analysis of the sample (i.e. 15µg/ml) under a variety
of normal test conditions such as different laboratories, different analysts, using
operational and environmental conditions that may differ but are still within the specified
parameters of the assay.
Instruments used:
1. Shimadzu UV-1800
Sr. No.: A114550/08677
2. Shimadzu UV-1800
Sr. No.: A114549/08780
Drug Regulation & Regulatory Authorities
Dept. Of Quality Assurance & Regulatory Affairs L. J. Institute of Pharmacy, Ahmedabad.
Measure the Absorbance and calculate Mean, Standard Deviation, % Relative standard
deviation & % Assay.
CALCULATIONS:
Equations
Std. Deviation =
Where, ∑= Sum across the value
X= Number of values
X= mean or Average
n = Number of values
% RSD = Std. Deviation * 100 / Mean
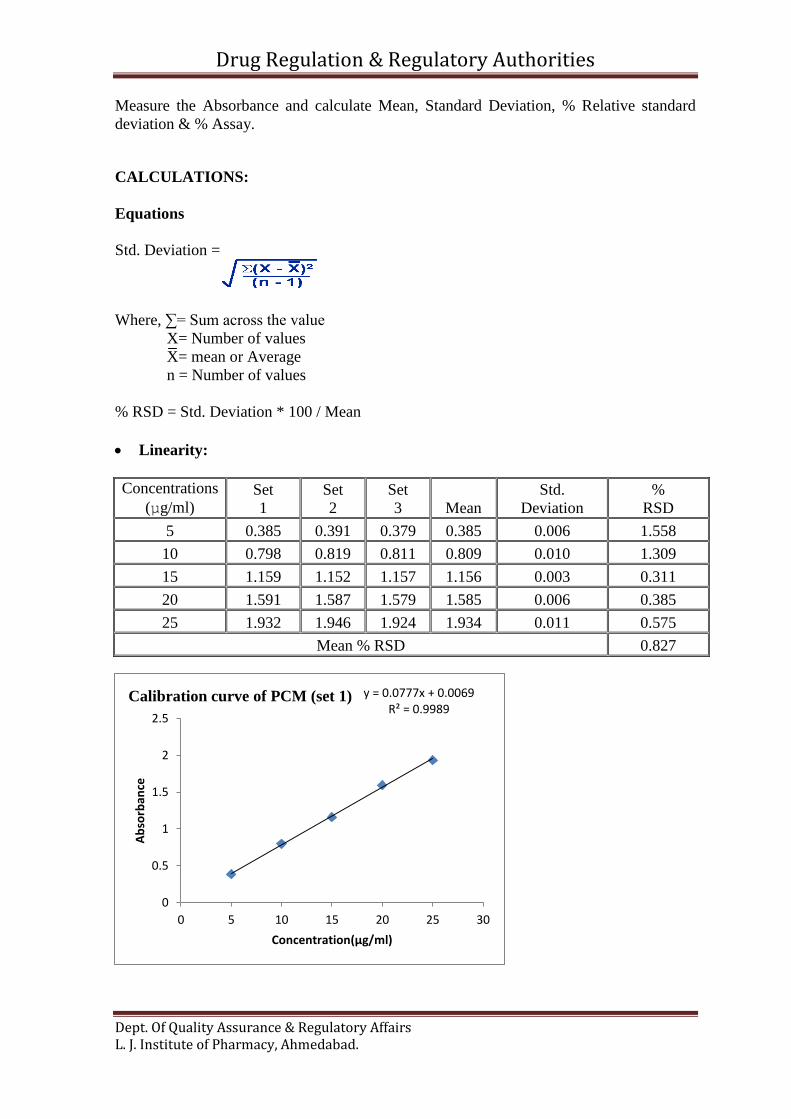
Linearity:
Concentrations
(µg/ml) Set
1
Set
2
Set
3 Mean
Std.
Deviation
%
RSD
5 0.385 0.391 0.379 0.385 0.006 1.558
10 0.798 0.819 0.811 0.809 0.010 1.309
15 1.159 1.152 1.157 1.156 0.003 0.311
20 1.591 1.587 1.579 1.585 0.006 0.385
25 1.932 1.946 1.924 1.934 0.011 0.575
Mean % RSD 0.827
y = 0.0777x + 0.0069 R² = 0.9989
0
0.5
1
1.5
2
2.5
0 5 10 15 20 25 30
Ab
sorb
ance
Concentration(µg/ml)
Calibration curve of PCM (set 1)
Drug Regulation & Regulatory Authorities
Dept. Of Quality Assurance & Regulatory Affairs L. J. Institute of Pharmacy, Ahmedabad.
Accuracy(Std. addition method):
Sr.
No. Concentration 1 2 3 Mean
Std.
Deviation % RSD
% Drug
recovery
1 80% 1.215 1.202 1.195 1.204 0.01015 0.84293 85.92 %
2 100% 1.295 1.327 1.326 1.316 0.01819 1.38248 84.62 %
3 120% 1.425 1.472 1.465 1.454 0.02536 1.74398 84.62 %
Mean of % RSD 1.32313
85.03 % Average of % Drug Recovery
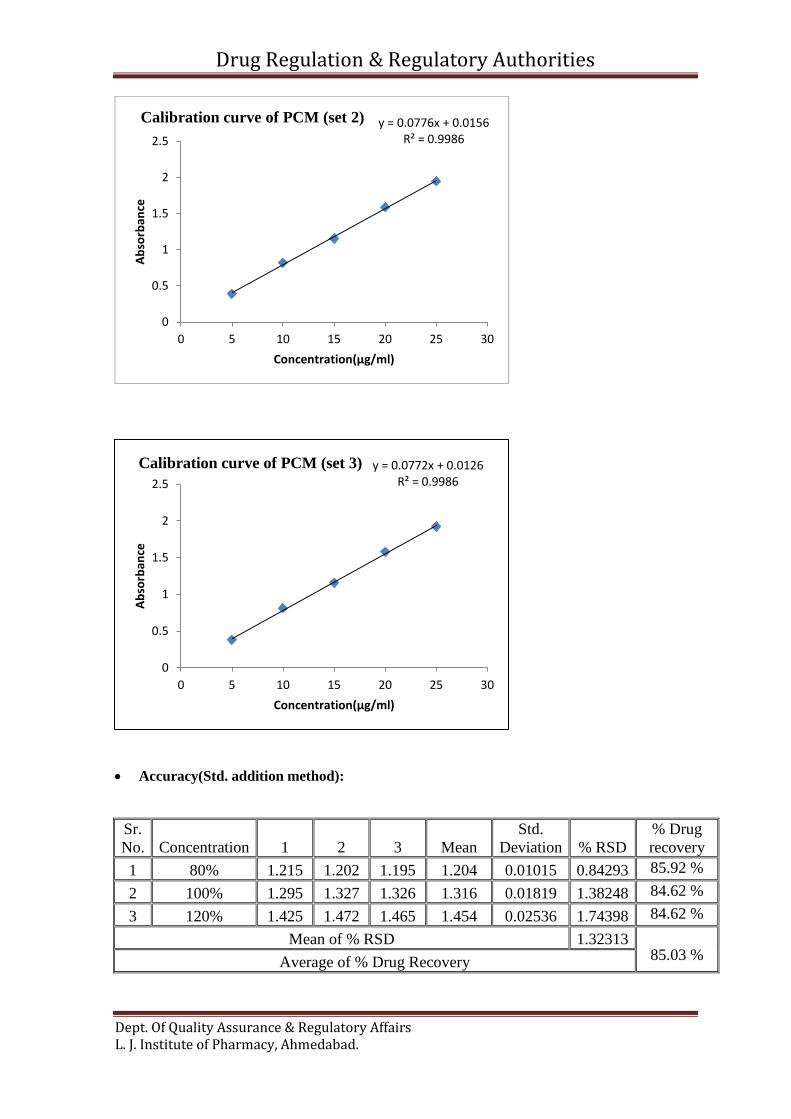
y = 0.0776x + 0.0156 R² = 0.9986
0
0.5
1
1.5
2
2.5
0 5 10 15 20 25 30
Ab
sorb
ance
Concentration(µg/ml)
Calibration curve of PCM (set 2)
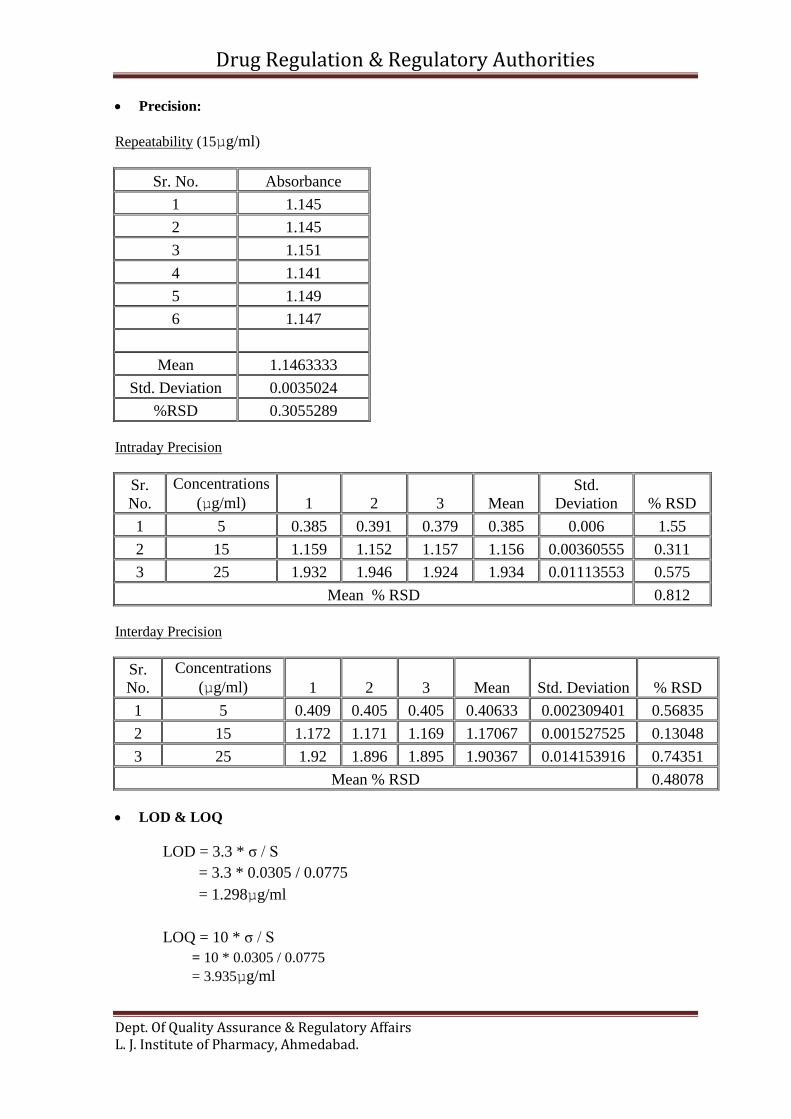
y = 0.0772x + 0.0126 R² = 0.9986
0
0.5
1
1.5
2
2.5
0 5 10 15 20 25 30
Ab
sorb
ance
Concentration(µg/ml)
Calibration curve of PCM (set 3)
Drug Regulation & Regulatory Authorities
Dept. Of Quality Assurance & Regulatory Affairs L. J. Institute of Pharmacy, Ahmedabad.
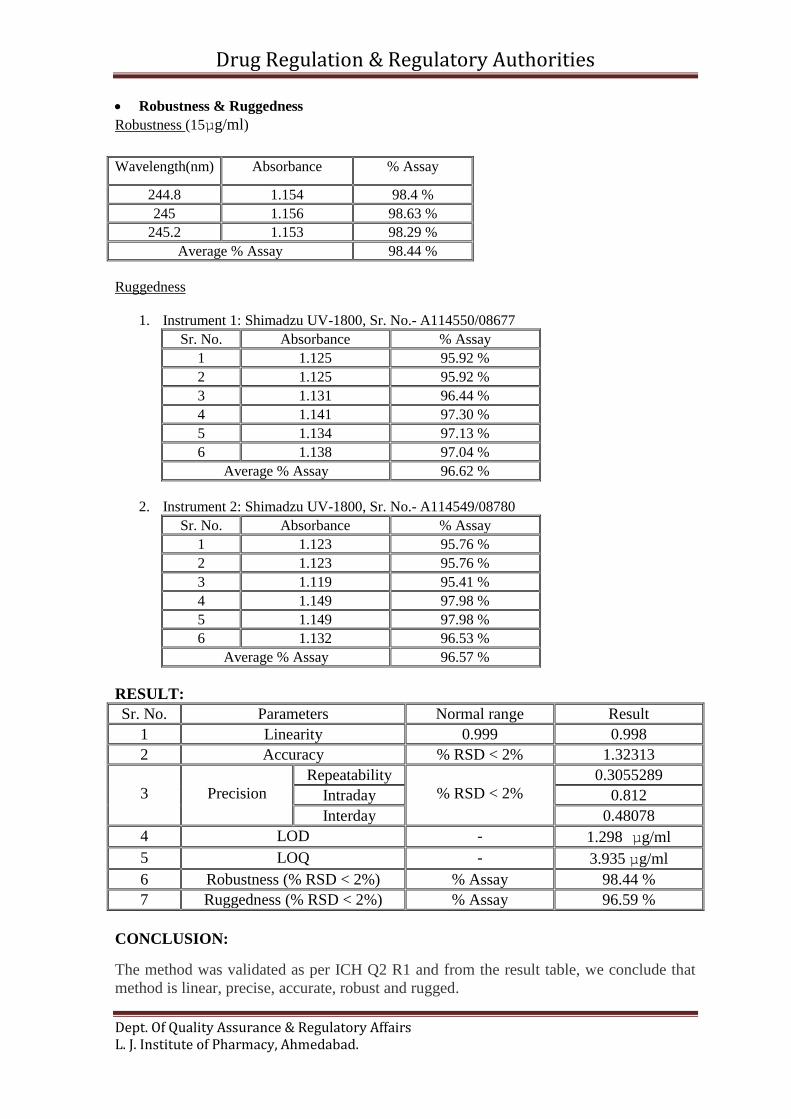
Precision:
Repeatability (15µg/ml)
Sr. No. Absorbance
1 1.145
2 1.145
3 1.151
4 1.141
5 1.149
6 1.147
Mean 1.1463333
Std. Deviation 0.0035024
%RSD 0.3055289
Intraday Precision
Sr.
No.
Concentrations
(µg/ml) 1 2 3 Mean
Std.
Deviation % RSD
1 5 0.385 0.391 0.379 0.385 0.006 1.55
2 15 1.159 1.152 1.157 1.156 0.00360555 0.311
3 25 1.932 1.946 1.924 1.934 0.01113553 0.575
Mean % RSD 0.812
Interday Precision
Sr.
No.
Concentrations
(µg/ml) 1 2 3 Mean Std. Deviation % RSD
1 5 0.409 0.405 0.405 0.40633 0.002309401 0.56835
2 15 1.172 1.171 1.169 1.17067 0.001527525 0.13048
3 25 1.92 1.896 1.895 1.90367 0.014153916 0.74351
Mean % RSD 0.48078
LOD & LOQ
LOD = 3.3 * σ / S
= 3.3 * 0.0305 / 0.0775
= 1.298µg/ml
LOQ = 10 * σ / S
= 10 * 0.0305 / 0.0775
= 3.935µg/ml
Drug Regulation & Regulatory Authorities
Dept. Of Quality Assurance & Regulatory Affairs L. J. Institute of Pharmacy, Ahmedabad.
Robustness & Ruggedness
Robustness (15µg/ml)
Wavelength(nm) Absorbance % Assay
244.8 1.154 98.4 %
245 1.156 98.63 %
245.2 1.153 98.29 %
Average % Assay 98.44 %
Ruggedness
1. Instrument 1: Shimadzu UV-1800, Sr. No.- A114550/08677
Sr. No. Absorbance % Assay
1 1.125 95.92 %
2 1.125 95.92 %
3 1.131 96.44 %
4 1.141 97.30 %
5 1.134 97.13 %
6 1.138 97.04 %
Average % Assay 96.62 %
2. Instrument 2: Shimadzu UV-1800, Sr. No.- A114549/08780
Sr. No. Absorbance % Assay
1 1.123 95.76 %
2 1.123 95.76 %
3 1.119 95.41 %
4 1.149 97.98 %
5 1.149 97.98 %
6 1.132 96.53 %
Average % Assay 96.57 %
RESULT:
Sr. No. Parameters Normal range Result
1 Linearity 0.999 0.998
2 Accuracy % RSD < 2% 1.32313
3
Precision
Repeatability
% RSD < 2%
0.3055289
Intraday 0.812
Interday 0.48078
4 LOD - 1.298 µg/ml
5 LOQ - 3.935 µg/ml
6 Robustness (% RSD < 2%) % Assay 98.44 %
7 Ruggedness (% RSD < 2%) % Assay 96.59 %
CONCLUSION:
The method was validated as per ICH Q2 R1 and from the result table, we conclude that
method is linear, precise, accurate, robust and rugged.