delivering energy efficiency in the middle east and...
TRANSCRIPT
Delivering Energy Efficiencyin the Middle East and North Africa
Achieving Energy Efficiency Potential in the Industry, Services and Residential Sectors
May 6, 2016
Energy & Extractives Global Practice (GEEDR)Middle East & North Africa Region (MENA)
Project funded by the European Union
Pub
lic D
iscl
osur
e A
utho
rized
Pub
lic D
iscl
osur
e A
utho
rized
Pub
lic D
iscl
osur
e A
utho
rized
Pub
lic D
iscl
osur
e A
utho
rized
Pub
lic D
iscl
osur
e A
utho
rized
Pub
lic D
iscl
osur
e A
utho
rized
Pub
lic D
iscl
osur
e A
utho
rized
Pub
lic D
iscl
osur
e A
utho
rized

© 2016 International Bank for Reconstruction and Development
The World Bank
1818 H Street NW Washington DC 20433Telephone: 202–473–1000
www.worldbank.org
This work is a product of the staff of the World Bank with external contributions. The findings, interpretations, and conclusions expressed in this work do not necessarily reflect the views of the World Bank, its Board of Executive Directors, or the governments they represent.
The World Bank does not guarantee the accuracy of the data included in this work. The boundaries, colors, denominations, and other information shown on any map in this work do not imply any judgment on the part of the World Bank concerning the legal status of any territory or the endorsement or acceptance of such boundaries.
Rights and Permissions
The material in this work is subject to copyright. Because the World Bank encourages dissemination of its knowledge, this work may be reproduced, in whole or in part, for noncommercial purposes as long as full attribution to this work is given.
Any queries on rights and licenses, including subsidiary rights, should be addressed to the Office of the Publisher, the World Bank, 1818 H Street NW, Washington, DC 20433, USA; fax: 202–522–2422; e-mail: [email protected]
Cover image: “Night sky over Chefchaouen the blue city in Morocco” © Kostenyukova Nataliya (Shutterstock).
Back cover image: “Place des Nations Unies –Casablanca, Morocco” © Arne Hoel, World Bank.

De
liv
er
ing
en
er
gy
ef
fic
ien
cy
in
th
e M
iDD
le e
ast
an
D n
or
th
af
ric
a
1
Contents
Acknowledgments iii
Disclaimer v
Abbreviationsandacronyms vi
executivesummary 9
Introduction 17
Background 17
Structure of this report 20
1.energyuseandthepotentialforenergysavingsinMenA 23
Trends in energy supply and demand 24
Energy supply 24
Energy consumption 25
Projected energy savings 26
Regional 26
National 28
Recent progress in energy efficiency 30
Energy prices and subsidies 36
Summary 40
2.strengtheningtheenablingenvironmentforenergyefficiency 41
Enabling framework 43
The policy framework 43
Institutional framework 44
Monitoring, reporting, and verifying 46
Capacity building 46
Financing mechanisms for EE programs 46
Public financing 48
Private financing 49
Delivery mechanisms 51
Utility delivery of energy efficiency 51
Business models 53
Implementation mechanisms for the three priority sectors 53
Industry 53
Services 53
Residential 54

WO
RLD
BA
NK
GR
OU
P
2
3.Globalexperienceinfinancinganddeliveringenergyefficiency 55
Commercial financial institutions 56
Utility delivery of energy efficiency 60
California, United States 61
New South Wales, Australia 63
South Africa 63
China 64
India 65
Brazil 66
Summary of global experience 69
Financing 69
Delivery in six countries 69
Moving from MDB support to self-sustainability over the long run 70
4.optionsforscalingupenergyefficiencyinMenA 71
Setting the stage: Enhancing the enabling environment in MENA 72
Element 1: policy and regulations 73
Element 2: institutions and organizations 75
Element 3: finance 78
Element 4: capacity and awareness building 87
Element 5: information and reporting 89
Approaches to EE for net energy exporters and importers 90
Differences between net energy importing and exporting countries 90
Potential for EE by sector and subregion 102
Region-wide options for EE in the electricity sector 103
Enabling environment 103
Options for EE measures by sub-region 104
Maghreb 104
Industry 104
Residential 106
Mashreq 107
Residential 108
Services 110
Industry 110
Gulf cooperation council 111
Industry 112
Services 112
Residential 113
Looking ahead 114
Appendix1. Assessing energy use—data sources, assumptions, caveats, and methods 115
Appendix2. Benefits of utility delivery of EE 119
Appendix3. Other examples of utility delivery of EE 121
Appendix4.Background to implementation strategies for three priority sectors 131
References 134

De
liv
er
ing
en
er
gy
ef
fic
ien
cy
in
th
e M
iDD
le e
ast
an
D n
or
th
af
ric
a
3
ACknowledGMents
This study was initiated and guided throughout by Charles Cormier (Practice Man-ager). The primary authors were Jonathan Sinton (Senior Energy Specialist) and Rutu Dave (Energy Specialist), with Mohab Hallouda (Senior Energy Specialist), Therese Murphy (Consultant), Lisa Ryan (Consultant), and the authors of this study’s subreports, prepared by the Regional Center for Renewable Energy and En-ergy Efficiency (RCREEE) and the Regulatory Assistance Program (RAP). Contri-butions towards this report were also received from Anand Subbiah (Consultant), Waleed Alsuraih (Senior Energy Specialist), Ferhat Esen (Senior Energy Special-ist), Fanny Missfeldt-Ringius (Senior Energy Economist), and Simon Stolp (Lead Energy Specialist). Sara Trab Nielsen (Consultant) coordinated the final comments and publication of the report. The editor was Bruce Ross-Larson (Communications Development Inc.) and graphical design and layout was done by Dania Kibbi (Base Three Studio).
We acknowledge with gratitude the European Commission and the Italian Gov-ernment for their financial contributions to the production of this report and asso-ciated outreach materials. Thanks are also due to the Energy Sector Management and Assistance Program (ESMAP), which provided funding for publication, trans-lation and dissemination of this report.
Additional technical inputs were provided by Daron Bedrosyan (Consultant). Maria Sarraf (Lead Environmental Specialist), Roger Coma Cunill (Senior Energy Specialist) and N.K. Thondaiman (Resource Management Analyst) guided admin-istration of grant funds. Colleagues at the Center for Mediterranean Integration, who were instrumental in organizing a very productive workshop in Marseille, include Mourad Ezzine (Director) and Hervé Lévite (Senior Environmental Spe-cialist), This report would not have been possible without administrative support from Katerina Baxevanis, Florencia Liporaci, Daisy Martinez, Daro Fall, Gaida Hela, Achraf Remili, and Melissa Taylor.
Comments were provided by reviewers, including Alexios Pantelias, Fanny Missfeldt-Ringius, Roger Coma, Ashok Sarkar, Ashish Khanna, Franck Bousquet, Nikolay Nikolov, and Charles Cormier. We also are grateful for the input and per-spectives that participant in workshops in Beirut and Marseille (September 2014) and in Tunis graciously shared with the team. All share credit for improving this report. Any errors that may remain are the responsibility of the main authors.

WO
RLD
BA
NK
GR
OU
P
4
Participants in the workshops included:
Ms. Dalia Abdelhalim El-Toukhy, KAHRA MAA, Qatar General Electricity and Water Corporation, Conservation and Energy Efficiency Department
Mr. Mohammed Ahachad, National Coordinator, EE Program in Building (CEEB)/UNDP, ADEREE, Morocco
Mr. Tareq Akel, Managing Director, AZ Investment, Ltd., Jordan
Ms. Salma Aouinti, Financial Manager, ANME, Jordan
Mr. Mohammed Al Badrawy, Energy Statistics Expert, independent consultant
Mr. Dhahwi Al Hameli, Director, Emergency Electrical Networks Department, Ministry of Electricity and Water, Kuwait
Mr. Younes Ali, Deputy General Director, National Energy Research Center (NERC), Syria
Ms. Wafaa Mahmoud Al Obaidi, Senior Chief Engineer, Ministry of Oil, Iraq
Mr. Nasser Al-Ruwaili, Advisor to H.E the Chief Executive of Electricity and Water Authority, Water and Electricity Authority, Bahrain
Ms. Ruba Al-Zubi, Clean Technology Sector Director, USAID Jordan Competitiveness Program (JCP)
Mr. Emmanuel Bergasse, Energy Economist, RCREEE
Mr. Mongi Bida, Energy Officer, UNESCWA
Mr. Abdelaziz Bourahla, Energy Environment and Statistics Expert
Ms. Afef Challouf, Directrice des Etudes et de la Planification, Société Tunisienne d’Electricité et du Gaz (STEG), Tunisia
Ms. Rima le Coguic, Deputy Head, Sustainable Energy and Transport Division, l’Agence française de développement (AFD)
Mr. Mohamed Dabbas, Head of Energy Efficiency department, Ministry of Energy and Mineral Resources, Jordan
Dr. Abdel Ali Dakkina, Directeur du Pôle de la Stratégie et du Développement, Agence Nationale pour le Développement des Energies Renouvelables et de l’Efficacité Energétique (ADEREE), Morocco
Mr. Kamel Dali, Directeur de projets, l’Agence Nationale pour la Promotion et la Rationalisation de l’Utilisation de l’Energie (APRUE), Algeria
Mr. Mohamed Ekhalat, Consultant, REAOL, Libya
Mr. Sharf Eldin ElAgieb, Electricity Regulatory Authority (ERA), Sudan
Mr. Habib El Andaloussi, Chief of Energy Section, Sustainable Development and Productivity Division, UNESCWA
Ms. Rana El-Guindy, Research Analyst, RCREEE
Mr. Karim El-Menoufi, Research Analyst, RCREEE
Mr. Ziad El-Zein, Public Relations Officer, Lebanese Centre for Energy Conservation
Mr. Tareq Emtairah, Director, Regional Center for Renewable Energy and Energy Efficiency (RCREEE)
Mr. Steffen Erdle, Head, Regional Project RE-ACTIVATE “Promoting Development and Employment through Renewable Energy and Energy Efficiency in the Middle East and North Africa”, GIZ
Mr. Ali El Amine Fechtali, Chef de la Division Ventes, ONEE, Morocco
Ms. Therese Gemayel, Energy Statistician, RCREEE
Mr. Sam Gouda, President and Lead Expert, Creara International LLC, Egypt
Mr. Christian de Gromard, Chef de Projet Senior, AFD
Mr. Najlae Habibi, Ingénieur en Efficacité Energétique, Ministère de l’Energie, des Mines, de l’Eau et de l’Environnement, Morocco
Mr. Hamdi Harrouch, General Director, ANME, Tunisia
Ms. Wafa Aboul Hosn, Head of Economic Statistics Section, United Nations Economic and Social Commission for Western Asia (UNESCWA)
Mr. Ihab Ismail, Head of the Planning Department, New Renewable Energy Authority, Egypt
Ms. Sohbet Karbuz, Director of Hydrocarbons Division, Observatoire Méditerranéen de l’Energie (OME)
Mr. Naseer Kareem Kasim, Head of Department, Renewable Energy and Environment Center, Iraq
Mr. Abdelhamid Khalfallah, Directeur Adjoint Efficacite Energetiques et Energies Renouvelables, Direction Générale de l’Energie (DGE), Tunisia
Mr. Ezzedine Khalfallah, Independent Consultant, Tunisia
Mr. Vladimir Kubecek, Energy Statistics Section, International Energy Agency (IEA)
Mr. Rachid Laarabi, Chef de Division Marketing, Chef de Projet LBC, ONEE, Morocco

De
liv
er
ing
en
er
gy
ef
fic
ien
cy
in
th
e M
iDD
le e
ast
an
D n
or
th
af
ric
a
5
Mr. Ihab Ismail, Head of the Planning Department, New Renewable Energy Authority, Egypt
Ms. Sohbet Karbuz, Director of Hydrocarbons Division, Observatoire Méditerranéen de l’Energie (OME)
Mr. Naseer Kareem Kasim, Head of Department, Renewable Energy and Environment Center, Iraq
Mr. Abdelhamid Khalfallah, Directeur Adjoint Efficacite Energetiques et Energies Renouvelables, Direction Générale de l’Energie (DGE), Tunisia
Mr. Ezzedine Khalfallah, Independent Consultant, Tunisia
Mr. Vladimir Kubecek, Energy Statistics Section, International Energy Agency (IEA)
Mr. Rachid Laarabi, Chef de Division Marketing, Chef de Projet LBC, ONEE, Morocco
Mme. Samira Lakhlifi, Chef de Service Etudes Stratégiques, ADEREE, Morocco
Ms. Kaouther Lihidheb, Key Expert, Business Development & Financing, MED-ENEC
Mr. AbdelRahman A. Maali, Technical Advisor, Ministry of Water, Resources and Electricity, Sudan
Mr. Maged K. Mahmoud, Senior Expert, Head of Projects and Technical Affairs, RCREEE
Mr. Yacoub Elias Marar, Head of Solar Energy Section, Ministry of Energy and Mineral Resources, Jordan
Mr. Rafik Missaoui, Energy Efficiency Consultant, Tunisia
Mr. Ramy Aly Mohammed, Director Renewable Energy, Manager of Renewable Energy Department, Yemen
Ms. Sorina Mortada, Technical Consultant to Lebanese Center for Energy Conservation (LCEC)
Mr. Adel Mourtada, Senior Energy Efficiency Advisor, RCREEE
Ms. Nurzat Myrsalieva, Project Manager, RCREEE
Ms. Helen Naser, Consultant, GFA Group
Ms. Caroline Orjebin-Yousfaoui, Project Manager, Water Energy Transport, IPEMED
Mr. Tagreed Saeed, Manager, Energy Efficiency Unit, Ministry of Electricity and Renewable Energy, Egypt
Mr. Tarek Saleh, Resource Efficiency and Cleaner Production Specialist, Egypt National Cleaner Production Center (ENCPC), Ministry of Trade, Industry and SMEs
Ms. Amina Seghali, Ingénieur d’études, Sonelgaz, Algeria
Mr. Ali Abo Sena, Director, National Center for Cleaner Production, Egypt
Mr. Mohamed Sidon, Director, Chairman’s Office, Renewable Energy Authority of Libya
Ms. Florentine Visser, Key Expert, Energy-efficient Building and Urban Planning, Project on Energy Efficiency in the Construction Sector in the Mediterranean (MED-ENEC)
Mr. Bassel Yassin, Director Energy Environmental Impact Department, Palestinian Energy and Environmental Research Center (PEC), Palestinian Energy Authority (PEA)
Mr. Radouan Yessouf, Chef de Service, Efficacité Energétique dans le Bâtiment, ADEREE, Morocco
Mr. Fawzi Ben Zaid, Ministry of Energy and Mines, Algeria
Mr. Mohamed Chaker Zorgati, Chef de Division, Société Tunisienne d’Electricité et du Gaz (STEG)
DISCLAIMER
This publication has been produced with the assis-tance of the European Union. The contents of this publication are the sole responsibility of the World Bank Group and can in no way be interpreted as re-flecting the views of the European Union.
Mme. Samira Lakhlifi, Chef de Service Etudes Stratégiques, ADEREE, Morocco
Ms. Kaouther Lihidheb, Key Expert, Business Development & Financing, MED-ENEC
Mr. AbdelRahman A. Maali, Technical Advisor, Ministry of Water, Resources and Electricity, Sudan
Mr. Maged K. Mahmoud, Senior Expert, Head of Projects and Technical Affairs, RCREEE
Mr. Yacoub Elias Marar, Head of Solar Energy Section, Ministry of Energy and Mineral Resources, Jordan
Mr. Rafik Missaoui, Energy Efficiency Consultant, Tunisia
Mr. Ramy Aly Mohammed, Director Renewable Energy, Manager of Renewable Energy Department, Yemen
Ms. Sorina Mortada, Technical Consultant to Lebanese Center for Energy Conservation (LCEC)
Mr. Adel Mourtada, Senior Energy Efficiency Advisor, RCREEE
Ms. Nurzat Myrsalieva, Project Manager, RCREEE
Ms. Helen Naser, Consultant, GFA Group
Ms. Caroline Orjebin-Yousfaoui, Project Manager, Water Energy Transport, IPEMED
Mr. Tagreed Saeed, Manager, Energy Efficiency Unit, Ministry of Electricity and Renewable Energy, Egypt
Mr. Tarek Saleh, Resource Efficiency and Cleaner Production Specialist, Egypt National Cleaner Production Center (ENCPC), Ministry of Trade, Industry and SMEs
Ms. Amina Seghali, Ingénieur d’études, Sonelgaz, Algeria
Mr. Ali Abo Sena, Director, National Center for Cleaner Production, Egypt
Mr. Mohamed Sidon, Director, Chairman’s Office, Renewable Energy Authority of Libya
Ms. Florentine Visser, Key Expert, Energy-efficient Building and Urban Planning, Project on Energy Efficiency in the Construction Sector in the Mediterranean (MED-ENEC)
Mr. Bassel Yassin, Director Energy Environmental Impact Department, Palestinian Energy and Environmental Research Center (PEC), Palestinian Energy Authority (PEA)
Mr. Radouan Yessouf, Chef de Service, Efficacité Energétique dans le Bâtiment, ADEREE, Morocco
Mr. Fawzi Ben Zaid, Ministry of Energy and Mines, Algeria
Mr. Mohamed Chaker Zorgati, Chef de Division, Société Tunisienne d’Electricité et du Gaz (STEG)
DISCLAIMER
This publication has been pro-duced with the assistance of the European Union. The con-tents of this publication are the sole responsibility of the World Bank Group and can in no way be interpreted as reflecting the views of the European Union.
WO
RLD
BA
NK
GR
OU
P
6
AbbRevIAtIonsAndACRonyMs
AFEX Arab Future Energy Index
ALMEE Lebanese Association of Energy Saving and for Environment
ANEEL Agência Nacional de Energia Elétrica
ANME Tunisia’s National Agency for Energy Management
BEE India’s Bureau of Energy Efficiency
CFL compact fluorescent lamp
CPUC California Public Utility Commission
DSM demand-side management
EE energy efficiency
EERS energy efficiency resource standards
EGAT Electricity Generating Authority of Thailand
ESC energy savings certificate
ESCO energy service company
ESMAP Energy Sector Management Assistance Program
FI financial institution
FNME National Energy Management Fund (Tunisia)
GCC Gulf Cooperation Council
GDP Gross Domestic Product
GEF Global Environment Facility
GNI Gross National Income
GWh gigawatt-hour
HEECP Hungary Energy Efficiency Co-Financing Program
IEA International Energy Agency
IFC International Finance Corporation
IFI international financial institution
IMF International Monetary Fund
IPMVP International Performance Measurement and Verification Protocol
IREDA Indian Renewable Energy Development Agency
kgoe kilograms of oil equivalent
ktoe kiloton (1,000 tons) of oil equivalent.
kWh kilowatt-hour
LCEC Lebanese Center for Energy Conservation
LED light-emitting diode
MDBs multilateral development banks

De
liv
er
ing
en
er
gy
ef
fic
ien
cy
in
th
e M
iDD
le e
ast
an
D n
or
th
af
ric
a
7
MED-ENEC Project on Energy Efficiency in the Construction Sector in
the Mediterranean
MED-EMIP Support for the Enhanced Integration and the Improved Security of the
Euro-Mediterranean Energy Market
MENA Middle East and North Africa
MEPS minimum energy performance standard
MJ megajoule
MRV measurement, reporting, and verification
Mtoe million tons of oil equivalent
MWh megawatt-hour
NAFIN Nacional Financiera, SNC (Mexico)
NDRC National Development and Reform Commission (China)
NEEAP national energy efficiency action plan
NEEREA National EE and Renewable Energy Action Fund (Lebanon)
NERSA National Energy Regulator of South Africa
NGAC NSW Greenhouse Abatement Certificates
NGO non-governmental organization
NSW New South Wales
OECD Organization for Economic Co-operation and Development
PEE Programa de Eficiência Energética/Brazil Energy Efficiency Program
PPP purchasing power parity
RAP regulatory assistance project
RCREEE Regional Center for Renewable Energy and Energy Efficiency
RISE Readiness for Investment in Sustainable Energy (World Bank survey)
R&D Research and Development
SE4ALL UN Sustainable Energy for All intiative
TPES total primary energy supply (statistically identical to total primary
energy consumption)
TWh terawatt-hour
UAE United Arab Emirates
UNEP United Nations Environment Programme
UN ESCWA United Nations Economic and Social Commission for Western Asia
WEC World Energy Council

WO
RLD
BA
NK
GR
OU
P
8

De
liv
er
ing
en
er
gy
ef
fic
ien
cy
in
th
e M
iDD
le e
ast
an
D n
or
th
af
ric
a
9
exeCutIvesuMMARy
Reductions in energy intensity in the Middle East and North Africa (MENA) have lagged behind those in other regions. From 2000 to 2012, the energy intensity of lower-middle-income countries worldwide fell by 2.5 percent a year, while the av-erage intensity of MENA countries in the same income bracket rose by 0.4 percent. Upper-middle-income countries worldwide saw energy intensity fall by 0.5 percent a year over the period, while those in MENA fell by only 0.1 percent. Among high-income countries, energy intensity fell across the globe at 1.6 percent a year, in contrast to its increase in the MENA region of 0.9 percent.
The potential for greater energy efficiency (EE) is huge across the region. Re-alizing this potential would benefit resource-rich countries and those needing to import fuel. The current low level of oil prices presents an opportunity for many of them to act. While the benefits of EE are widely recognized, persistent barriers obstruct the necessary investments and behavioral and operational changes. Given market imperfections, a lack of information, insufficient technical skills, and weak incentives EE has been insufficiently pursued. The rationale for supporting EE implementation is clear. The challenge is delivering it.
Many MENA countries are adopting or drafting national energy efficiency ac-tion plans. Such initiatives have raised the efficiency of industrial processes, motor vehicles, appliances, equipment, buildings, power plants, and distribution systems. But the scale remains small, with approaches intermittent and piecemeal, often driven by the most urgent national priorities rather than a long-term strategy.
The potential for savings from EE is estimated at 21 percent of projected total primary energy supply in MENA countries by 2025. Nearly three-quarters of these savings are from greater efficiency in end-use sectors—219 of 300 million tons of oil equivalent (Mtoe). Of those sectors, the industry sector offers the largest scope for energy savings over the projected period, contributing just over one-fifth of the total potential savings. The residential sector holds the second largest potential, followed by transport and then commercial and public services (referred to simply as ‘services’) and finally agriculture. The share of industry shrinks slightly over time as the potential for energy savings rises faster in the electricity supply sector.
For many countries in the region, electricity shortages—often connected to the cost and availability of imported fuel—are key motivators for raising EE. Relieving these shortages requires balancing more expensive supplies with demand from sec-tors most responsible for raising electricity use; i.e. industry, residential, and ser-vices. As a result, this report primarily deals with EE in these electricity-intensive end-use sectors, and to a certain extent with power generation. It does not cover the agricultural or the transport sectors.
IndustryEnergy prices in the industry sector are widely subsidized, though less so than for the residential sector. Therefore, industrial customers are somewhat more moti-vated to reduce energy costs. Utilities and service providers such as energy service companies (ESCOs) are well suited to undertake EE programs because the in-

WO
RLD
BA
NK
GR
OU
P
10
dustry sector needs technical expertise and trained personnel. Utilities, with their knowledge of customer-demand patterns, can identify EE opportunities that bene-fit customers and the utility. Public-sector EE agencies rarely have the expertise to undertake EE in this sector, but can serve as facilitators and support implementing agencies in accessing resources and incentives.
servicesCustomer motivation for EE in commercial and public services depends on energy prices and their energy spending compared to other costs. Few prices for commer-cial customers are subsidized, but energy bills may constitute only a small portion of their operating costs. Public service customers are also seldom motivated to undertake EE measures because their energy costs are part of fixed budgetary al-locations. Long-term improvements in the efficiency of buildings in the services sector—including public and commercial buildings, schools and hospitals—are per-haps best achieved through building codes and standards and through appliance performance standards, whether for new or existing buildings.
Compliance with regulations accounts for an estimated two-fifths of EE mea-sures in Europe, and three-fifths of countries surveyed globally have established mandatory or voluntary new-building codes. In the short term, MENA’s ESCOs and utilities can undertake energy audits to identify retrofit options for reducing energy use in buildings. Utilities and ESCOs are also well suited to undertake EE in street lighting and public services such as water pumping, where end-users general-ly lack technical expertise and are not motivated to lower operational costs. Public sector agencies can monitor compliance to ensure that program goals are met and to undertake customer education programs.
ResidentialThis diverse sector, with multiple consumer preferences and motivations, is the most challenging for EE, especially in countries where energy prices are subsidized. Regulations, a principal mechanism to promote EE, could target the development of appliance labeling and performance standards. Minimum efficiency standards are important, but so is labeling that promotes voluntary actions. Regulations can also phase out inefficient equipment such as incandescent lamps in the residen-tial and other sectors. Utilities are well suited to undertake lighting retrofits and weatherization programs (insulation for facilities, for example) in the residential sector, given their relationship to the customer and their ability to charge custom-ers through utility bills. Public agencies are well suited to monitor programs and to undertake customer awareness and education programs, critical for implementing programs in the residential sector.
Given diverse market dynamics and policy and regulatory frameworks, wide implementation of EE in MENA energy markets will not be easy. Countries in other regions that have faced similar hurdles can provide useful lessons for the MENA region. While it is unlikely that MENA countries will be able to address all barriers, it is important to align the interests of stakeholders and help move their economies toward lowering the intensity of energy use in sectors with the greatest potential for EE.
The need is growing for MENA countries to develop mechanisms for financing (often through domestic financial institutions) and for delivery (through utilities). The delivery mechanisms must reflect the requirements of different sectors. The mechanisms must also operate within an integrated framework, grounded in a strong

De
liv
er
ing
en
er
gy
ef
fic
ien
cy
in
th
e M
iDD
le e
ast
an
D n
or
th
af
ric
a
11
enabling environment of clear and competent policy, regulatory and institutional structures, and supported by relevant financing mechanisms.
The five main categories of a good enabling environment for energy efficiency are
> Policies and regulations.
> Institutions and organizations.
> Finance and incentives.
> Capacity and awareness building.
> Information and reporting.
Within this enabling environment, countries need to develop viable business models that meet the objectives of stakeholders. For instance, households facing subsidized energy prices may not be motivated to purchase relatively expensive EE appliances, but commercial and industrial consumers that cross-subsidize residen-tial consumers and pay higher tariffs may be motivated to undertake EE measures to reduce production costs. This poses a challenge for utilities that would like to increase sales to higher-paying customers and reduce sales to subsidized consumers. Governments may wish to replace existing subsidies with funding EE for subsidized consumers. Balancing these competing and at times conflicting objectives of stake-holders will be a major challenge to undertaking EE in MENA countries.
Putting in place a robust framework to deliver on EE measures will require substantial planning and resources—and more critically, political willingness to set targets and implement EE programs. The key elements of the framework would be common to all MENA economies, but each country will have to develop its own roadmap suited to its energy, economic and market conditions, as well as their national EE action plans.
The full report offers options tailored to subregions in MENA (Maghreb, Mashreq and Gulf Cooperation Council [GCC]),1 and in some instances to specific countries. Here we summarize the options in more general terms.
PoliciesandregulationsThe success of any EE policy depends on the degree of government commitment, level of program ambition, and the stability of public support. Experience shows that well-designed policies include clearly defined targets supported by an overar-ching EE legal and regulatory framework. A bottom-up approach is better for set-ting national targets because the potential for EE improvement varies considerably by sector. It is imperative that the sectoral targets for EE are appropriate on energy intensity, specific energy consumption, and percentage reduction. Targets are most effective—and much easier to implement—when stakeholders participate from the earliest stages. This requires placing EE units in key sectoral ministries that can recommend suitable targets and mechanisms to a central unit.
MENA countries at the early stages of EE policy development may also find it effective to introduce realistic and quickly demonstrable (initially short- and medi-um-term) goals and targets to help achieve public support and stakeholder buy-in. Aligning the interests of stakeholders and demonstrating results in a short time helps to sustain activity.
Energy subsidies and other forms of price distortion encourage consumers to un-dervalue energy and diminish the financial incentive to adopt EE measures. For con-sumers to understand the benefits of EE, the price they pay for energy consumption

WO
RLD
BA
NK
GR
OU
P
12
must reflect costs. Subsidies are distortive in all countries, particularly to net energy importers such as Egypt, Jordan, Lebanon, Morocco and Tunisia. In recent years, several MENA countries have embarked on subsidy reforms, and energy importers are making considerable progress.
Phasing out energy subsidies will cost consumers. As a result, reforms will have to secure public support. It may be important to introduce EE incentive programs supported by defined funding sources, as such measures can help consumers re-duce their energy usage and hence the financial burden of the subsidy reform. It is also important to include social safety net programs and other mitigation mecha-nisms to support the poor and vulnerable.
Governments should issue new regulations to support new EE policies, includ-ing rules that provide energy performance standards and enforcement mechanisms. Internationally, appliance labeling (especially lighting, refrigerators, air condition-ers, and water heaters), buildings, and industrial equipment and processes have delivered results at low cost. A number of Arab countries have already adopted standards and labels for appliances, and a few have adopted building codes. The task is to enforce them.
InstitutionsandorganizationsSuccessful delivery of EE requires strong leadership from government and other institutions. Their roles and responsibilities must avoid duplication of tasks. Based on experience across many regions, EE programs should be commercially oriented, responsive to the needs of target sectors, demand driven, and flexible. A central body should coordinate these new programs to provide a principal hub for all stakeholders. Depending on the characteristics of a particular market, it may be appropriate to assign these responsibilities to a dedicated state agency or agencies. Conversely, where the majority of programs will be delivered by utilities, the utili-ties regulator may be more suitable.
Having a dedicated energy agency or agencies with the authority to deliver EE policies and the responsibility for achieving goals has been highly effective internationally. However, it is also important to ensure that the new EE policies and activities match with those of other public and private agencies. The utilities regulator can also provide an effective channel for delivery of EE programs, as it can introduce a range of sectoral EE initiatives through utilities’ mandates and incentives programs, as well as supplier obligation schemes. Internationally, there are many examples of successful regulation programs to incentivize utilities, based on a long-term EE strategy for each economic sector and identifying near-, mid-, and long-term measures.
Clear responsibility for monitoring and verifying results is also necessary to confirm compliance with program requirements and to provide evidence of in-dividual, sectoral, and national benefits from the EE programs. Data gathered is useful in evaluating the effectiveness of EE programs and helping them adapt to changing markets.
FinanceandincentivesFinancing is one of the main barriers to wide implementation of EE, especially in developing countries with inadequate public funds and little access to commercial sources. Yet regardless of economic and structural differences among countries, multiple approaches that combine public and commercial financing, as well as fis-cal and economic incentives, will likely be essential. Financing mechanisms must

De
liv
er
ing
en
er
gy
ef
fic
ien
cy
in
th
e M
iDD
le e
ast
an
D n
or
th
af
ric
a
13
match the needs of end-use sectors—one appropriate for industry may not work for the service or residential sectors.
The implementation mechanisms for deploying EE will also to an extent dic-tate the financing mechanism best suited for an end-use sector—for instance, while utility-driven EE programs can leverage the ability of utilities to finance programs through the rate basis (which may increase rates for all or a segment of customers), programs targeting low-income households may need a different approach. In the long run, as markets mature, commercial financing options are critical to create a sustainable market for EE services.
Some barriers are common to all countries – weak recognition of energy sav-ings from efficiency investments, small projects, and a lack of information and capacity to manage EE project finance. However, developing countries also have their own barriers, including low capital market development, governance issues, small markets for EE, high capital costs, and higher perceived national risk for investors.
Countries at an early stage of development of capital and EE markets need to incentivize and provide finance. Financial instruments must reflect the country’s needs and its commercial and financial markets. In countries with weak capital markets, investment in EE comes primarily from public finance through grants and concessional loan instruments. Incentives may also be in the form of parafiscal measures, such as reduced duties on energy-efficient devices that cannot be manu-factured domestically. As development picks up, the proportion of EE investment supported by commercial finance usually grows.
Governments typically have the greatest success with public finance when they have been integrated into wider national action plans and programs, developed in collaboration with the business and financial communities, and tailored to address local investment risks and market constraints.
The suitability of a finance option will depend on several key market charac-teristics. One important element is the cost-reflectiveness of energy prices, a major factor that measures the level of energy subsidy. Electricity market liberalization also matters—that is, whether there is active supply-side competition over electrici-ty companies or they are largely state-owned monopolies. More general factors are the level of capitalization within the market and the level of functionality within the banking system. In the design of public finance, an exit strategy should be available for occasions when the EE market develops enough for private financial markets to take over financing.
CapacityandawarenessbuildingEffective implementation of EE policies requires all stakeholders to be aware of the benefits of improved EE, necessitating strong and well-targeted communication strategies. In addition, the organizations and institutions directly involved in im-plementation need the internal capacity to deliver the programs, including dedicat-ed, trained individuals with the expertise to develop and deliver the sector-based programs sustainably.
Targeted efforts to build capacity are therefore an integral part of the enabling environment, and should include education initiatives to meet the requirements of all stakeholders. Although the overall objective of capacity-building initiatives and training programs is to promote EE and create awareness of the benefits and the im-portance of reducing energy use, each sector has its own requirements. For example, within the industrial sector companies, ESCOs, utilities, equipment manufacturers,

WO
RLD
BA
NK
GR
OU
P
14
energy agencies, and commercial banks all need to understand why investment in EE is important.
Capacity building and training for consumers, project developers, and lenders are also necessary to promote EE in the service sector, as its consumers gener-ally have little information about the benefits of improved EE and the best op-tions open to them. A strong public sector strategy would have clear rules and standards for public procurement and activities to establish public buildings as role models. More generally, capacity and awareness building initiatives can ensure that the market for EE products and services develops with credibility and integrity. Certification programs would provide assurance to consumers and build their confidence in EE investment. These programs should include manufacturers of EE equipment and appliances, as well as service providers and equipment installers.
InformationandreportingDeveloping a new EE policy is the first step toward energy savings and improved social welfare. To encourage continued investment, governments will need to pro-vide evidence of the national economic benefits from existing policies and raise the profile of EE in the country as a whole.
Reliable and robust measuring, reporting, and verifying (MRV) systems and program evaluation help ensure that EE policy goals are met. The data collected through the MRV systems can also communicate the effectiveness of current ini-tiatives. A standardized data gathering methodology, including metrics like cost-ef-fectiveness, is crucial. Baselines must be set for energy consumption and efficien-cy against which to measure outcomes of interventions; whether site-specific or sector-wide. The existing data gathering and reporting systems in many MENA countries are likely to benefit from internationally used systems such as the In-ternational Performance Measurement and Verification Protocol (IPMVP), which can be adapted to specific country situations.
Another crucial piece of the enabling environment is timely and accurate provi-sion of information to consumers. This can include periodic real-time information on energy costs, and possible steps to reduce it. Metering systems are highly reali-able, and have been effective internationally at gathering information on energy use and monitoring energy savings.
Countries relatively advanced in their EE efforts can benefit from introducing more-targeted programs aimed at well-defined sets of energy consumers to stimu-late demand for EE services. This would help to build the environment needed to sustain a functioning market that could be served by ESCOs and other dedicated providers of efficiency services. The goal would be to create an EE market that would gradually require less public support and eventually rely mainly on commer-cial activity.
MENA countries at earlier stages of developing their approaches to EE may find it effective to adopt relatively modest targets against which demonstrable gains may be quickly made, with the aim of fostering the public support and stakeholder buy-in needed to proceed with more ambitious activities. Countries with heavily subsidized energy prices might wish to focus on attaining EE gains first in the public sector and through regulatory means, while gradually introducing energy subsidy reforms. These countries may also find it productive to launch national campaigns to raise awareness of the importance of EE, and build public support for lifting energy subsidies.
De
liv
er
ing
en
er
gy
ef
fic
ien
cy
in
th
e M
iDD
le e
ast
an
D n
or
th
af
ric
a
15
Countries can carry out several of these steps on their own, but to be most effective, some steps would benefit from concerted action, such as harmonization of standards and labels for energy-consuming appliances and equipment. This ap-proach would enhance the integration of markets and provide strong incentives to improve the supply chains for more efficient equipment.
Much can also be gained by continuing information exchanges on what has worked, taking into account national circumstances, such as the balance of oil trade and energy prices and subsidies. Policy and institutional frameworks that scale up EE investments will develop, even as groundwork begins for gradually addressing issues of energy pricing and subsidies, which link to broader socioeco-nomic development policy.

WO
RLD
BA
NK
GR
OU
P
16

De
liv
er
ing
en
er
gy
ef
fic
ien
cy
in
th
e M
iDD
le e
ast
an
D n
or
th
af
ric
a
17
IntRoduCtIon
BACKGROUND
Clients in the Middle East and North Africa (MENA) created this project in re-sponse to a longstanding and growing demand for support in improving energy efficiency (EE). Reductions in energy intensity have lagged behind those in other regions (World Bank and IEA 2015; Portale and de Wit 2014). From 2000 to 2012, for instance, the energy intensity of lower-middle-income countries worldwide fell by 2.5 percent a year, while the average intensity of MENA countries in the same income bracket rose by 0.4 percent (Figure 1). Upper-middle-income countries worldwide saw energy intensity fall by 0.5 percent a year over the period, while those in MENA fell by only 0.1 percent. Among high-income countries, energy intensity fell across the globe at 1.6 percent a year, in contrast to its increase in the MENA region of 0.9 percent.
The potential for better performance, which would benefit both resource-rich countries and those needing to import fuel, is therefore huge in all sectors across the region. While the benefits of EE are widely recognized, the necessary investments and changes are obstructed by persistent barriers—market imperfections, lack of information and awareness, insufficient technical skill, and weak incentives. The rationale supporting EE implementation is clear. The challenge is delivering it.
The MENA region is, of course, not unique in its extensive potential to increase EE, and the experience of other countries with similar ranges of energy intensity and per capita energy use are worth exploring for ideas on scaling up EE invest-ments (Figure 2). Even developed countries known for high levels of EE are con-stantly finding new ways to improve their performance. The International Energy Agency (IEA) estimates that better EE could reduce growth in the global primary energy demand to 1.1 percent a year from 2012 to 2040, down from 1.9 percent a year from 1980 to 2011 (IEA 2014a). An earlier similar scenario (IEA 2012) showed that even significant policy efforts targeting energy savings could still leave untapped four-fifths of the technical potential in the buildings sector and more than half of the potential in industry.
Many such unused resources in developed countries already enjoy robust en-abling (policy, regulatory and institutional) environments. Other studies confirm countries’ efforts to confront this EE challenge: a survey of 85 countries showed that more than 90 percent had national agencies responsible for EE, just under half had national or sectoral targets for EE, and most had enabling environments and established, dedicated EE institutions (WEC 2013).2 Nonetheless, much potential for energy savings remains unrealized.

WO
RLD
BA
NK
GR
OU
P
18
National energy efficiency action plans (NEEAPs) are being adopted or drafted. Such initiatives have raised the efficiency of industrial processes, motor vehicles, appliances, equipment, buildings, power plants and transmission and distribution systems. Numerous activities supported by international financial institutions (IFIs) and development organizations have had positive outcomes, but the scale remains small, with approaches intermittent and piecemeal, often driven by the most urgent national priorities rather than a long-term strategy.
Lessons are apparent from high- and middle-income countries in other regions that have successfully delivered EE at scale. Exchanges among countries in the MENA region on what has worked—taking into account national circumstances, such as the balance of oil trade and energy prices and subsidies—have been effec-tive. Policy and institutional frameworks required to scale up EE investments can be reinforced, even as groundwork is laid for gradually addressing issues of energy pricing and subsidies, which are intimately linked to broader socioeconomic de-velopment policy.
The most recent effort by the Bank Group to inform a strategic approach was the 2009 Energy Sector Management Assistance Program (ESMAP) report, Tap-ping a Hidden Resource: Energy Efficiency in the Middle East and North Africa. That report laid out the rationale for and benefits of EE, analyzed the linkages between energy prices and EE, and explored at a conceptual level the institutional, policy, and financial building blocks to harvest EE potential.
In recent years, the Bank Group has also supported MENA countries to pro-duce national-level analyses addressing various aspects of EE. Other organizations have generated much data and analysis—the Mediterranean Solar Plan, publications by the Regional Center for Renewable Energy and Energy Efficiency (RCREEE), the Project on Energy Efficiency in the Construction Sector in the Mediterranean (MED-ENEC 2013) and the United Nations Economic and Social Commission for Western Asia (UN ESCWA).
In addition, regional EE work, and global initiatives are also generating in-formation of relevance to the MENA region. In particular, the Bank Group is launching a survey of Readiness for Investment in Sustainable Energy (RISE), an initiative patterned after the Doing Business survey of the International Finance Corporation (IFC), to gauge the environment for private investment activity that could contribute to attaining the goals of UN Sustainable Energy for All (World Bank, 2014d).

De
liv
er
ing
en
er
gy
ef
fic
ien
cy
in
th
e M
iDD
le e
ast
an
D n
or
th
af
ric
a
19
22000 2002 2004 2006 2008
LIC global average–2.7% p.a.
UMIC global average–0.5% p.a.
HIC global average–1.6% p.a.
UMIC MENA average–0.1% p.a.
Low-income and lower-middle income countries Upper-middle income countries
Pri
mar
y en
ergy
inte
nsi
ty (
MJ/
$201
1, P
PP
)
High-income countries
LMIC global average–2.5% p.a.
Sudan–2.0% p.a.
Libya–0.8% p.a.
Jordan–1.8% p.a.
Qatar –1.1% p.a.
Bahrain–1.0% p.a.
Oman+5.6% p.a.
UAE+1.9% p.a.
Saudi Arabia+0.5% p.a.
Kuwait+0.3% p.a.
Algeria+0.8% p.a. Iraq
+0.4% p.a.
Lebanon –1.9% p.a.
Egypt: +1.2% p.a.
Morocco +0.2% p.a.
Yemen +1.1% p.a.
LMIC MENA average+0.4% p.a.
2010 2012 2000 2002 2004 2006 2008 2010 2012 2000 2002 2004 2006 2008 2010 2012
3
4
5
6
7
8
9
10
11
HIC MENA average+0.9% p.a.
Tunisia–1.4% p.a.
global average
United States
Russian Federation
Japan
Germany
Korea, Rep.
France
Canada
Saudi Arabia
UK
Italy
Australia United Arab EmiratesKuwait
Oman
Bahrain
China
Brazil
Iran
South Africa
Thailand
Turkey
Venezuela, RB
Algeria
Iraq
Tunisia
Jordan
Lebanon
India
Nigeria
Egypt
Philippines
Morocco
Sudan
Yemen
Tanzania
MJ 2011 USD
Kenya
2.5
7.5
0 50 100 150 200 250 300 350 400 450
High-income countries
Upper-middle-income countries
Lower-middle-income countries
Low-income countries
GJ/person
Bubble size is proportionalto each country’s totalprimary energy supply
Mexico
global average
ee
FIGuRe1.energyintensitybyincomegroup,globally,andfortheMenAregion
Source: RCREE 2014; World Development Indicators database; IEA database. Note: Economies are divided among income groups according to 2013 gross national income (GNI) per capita, calculated using the World Bank Atlas method. Low-income countries: ≤ $1,045. Lower-middle-income countries: $1,046–$4,125. Upper-middle-income countries: $4,126–$12,745. High-income countries: ≥ $12,746. Energy intensity is expressed as primary energy consumption in megajoules (MJ) per constant 2011 international dollar of GDP in purchasing power parity (PPP) terms. West Bank and Gaza (in the low-income countries category) is excluded due to missing data.
Source: World Development Indicators database; IEA database. Note: The scale does not allow depiction of Qatar, which had per capita energy consumption in 2012 of over 770 GJ per person, and energy intensity of 6 MJ/2011 USD, just above the world average.
FIGuRe2.Primaryenergyintensityvs.primaryenergyconsumptionpercapita,selectedcountries,2012

WO
RLD
BA
NK
GR
OU
P
20REPORT OBJECTIVE AND STRUCTURE
The main objective of this report is to provide an intermediate step toward building more energy-efficient economies in the region. The present study complements the 2009 ESMAP report by providing a quantitative basis for sectoral targeting and focusing on delivery mechanisms. Taking advantage of the results of the RCREEE and preliminary results of the RISE Survey, the report is able to assess the areas where countries in MENA can gain most from the EE potential and build an en-abling environment for enhancing EE. Finally, the report draws on lessons learned on EE from other middle-income and high-income countries and brings in per-spectives that can serve as beneficial for the MENA countries.
The report focuses primarily on the three most electricity intense end use sectors: the industry, services, and residential sectors. For many countries in the MENA region, electricity shortages—often connected to the cost and availability of imported fuels—are key motivators for raising EE. Relieving these shortages re-quires balancing more expensive supplies with demand from sectors most responsi-ble for raising electricity use. While the RCREEE study examined energy use in all sectors (including energy supply as well as the transport3 and agriculture end use sectors), the delivery mechanisms for EE vary greatly, and given limited resources, it was necessary to focus on a few priority sectors only. Improving efficiency in the electricity supply sector is typically part of a national effort to reform the power sector—an approach that differs fundamentally from that for end use consumption sectors. While scenario results for the electricity sector appear for comparison in this chapter, the analysis is focused on the three identified priority end use sectors.
The needs and circumstances of MENA countries vary greatly, and some ma-terial presented in this regional report may be applicable to just a few countries, while some are germane to all. It deserves mentioning, that a great deal of work on EE has proceeded in past decades in some MENA countries, while in others efforts began more recently.

De
liv
er
ing
en
er
gy
ef
fic
ien
cy
in
th
e M
iDD
le e
ast
an
D n
or
th
af
ric
a
21
Chapter 1 seeks to provide a quantitative basis for considering EE priorities. It draws primarily on a set of scenarios prepared by the RCREEE (2014) that con-sider prospects over the next 10 years for energy use by sector in 17 economies,4 as well as the technical potential for reducing energy demand through greater EE. This analysis is concerned primarily with electricity end uses, which are particular-ly urgent in MENA. Chapter 1 also presents the results of an initial application of the RISE survey to MENA countries, with the intent to generate ideas that could contribute to developing well-founded strategies for increasing EE in the three identified priority end use sectors: industry, services, and residential.
Chapter 2 presents a comprehensive, integrated framework to support EE. Coun-tries are best able to deliver EE at scale by taking a portfolio approach compris-ing policies, institutions, information processes, technical capacity, and financing issues. This chapter explores the variety of enablers that increase the possibility of technical and financial activities to undertake efficiency investments. As other studies have dealt with enabling conditions more broadly, this chapter focuses on financing options for scaling up EE investment.
Chapter 3 draws on examples from other regions of how energy savings have al-ready been delivered through mechanisms involving two classes of agents—energy utilities and domestic finance institutions—whose participation is key to scaling up EE. Drawing on a report by the Regulatory Assistance Project (Allen and Crossley 2014), this chapter presents detailed experiences from six countries.
Chapter 4 combines the information in the previous three chapters, and offers op-tions for how to enhance EE in the MENA region. These options are considered first within the integrated framework of the broader enabling environment for EE. Although the key elements of the framework are common to all MENA economies, the report recognizes that each country will need to develop its own roadmap that considers its unique energy, economic, and market conditions. This chapter then considers the potential for EE in the three identified priority end use sectors and sub-regions within MENA, and suggests several initial and more intermediate mea-sures to stimulate discussion among stakeholders.

WO
RLD
BA
NK
GR
OU
P
22

De
liv
er
ing
en
er
gy
ef
fic
ien
cy
in
th
e M
iDD
le e
ast
an
D n
or
th
af
ric
a
23
eneRGyuseAndthePotentIAlFoReneRGysAvInGsInMenA
MENA has abundant energy resources that account for 52 percent of the world’s proven oil reserves and 47 percent of proven natural gas resources (BP 2015). The region also has substantial renewable energy resources, especially solar, although differences among countries’ resource endowments are considerable. The relative abundance of fossil energy in some countries has resulted in widespread neglect of EE and renewable energy.
With many countries in the region growing rapidly, demand for energy is cer-tain to rise, and better management and efficient use of energy resources will be necessary to sustain growth. As part of this study, the Regional Center for Renew-able Energy and Energy Efficiency (RCREEE 2014) assessed the outlook for energy consumption in the MENA region through 2025 and the potential for saving en-ergy through greater EE. The RCREEE prepared scenarios and estimates drawing on the latest available data and publicly accessible studies, a simple econometric model and business-as-usual assumptions. (See appendix 1 for a summary of data and methods, which are explained in detail in RCREEE 2014).5
The scenarios benefited from review and guidance by an advisory group with members drawn from MENA countries. Data and results were checked extensively with experts in the region. Two workshops were held in September 2014, one in Beirut and one in Marseille, during which stakeholders were invited to comment on the draft scenarios, and a workshop was held in Tunis in March 2015 to seek additional input on the report as whole. RCREEE’s second detailed examination of EE developments in the MENA region, Arab Future Energy Index (AFEX) 2015, provided additional information reflected in this chapter (RCREEE 2015).
This chapter provides a synopsis of the assessment undertaken by the RCREEE (2014) and identifies the three end use sectors (industrial, residential, and services/tertiary6) for developing enabling environments and implementing programs to re-alize the potential for energy savings.
1

WO
RLD
BA
NK
GR
OU
P
24
TRENDS IN ENERGY SUPPLY AND DEMAND
energysupply
Use of all primary energy sources grew between 2000 and 2012. Total primary en-ergy supply7 in the MENA region in 2011 amounted to about 580 million tons of oil equivalent (Mtoe), an increase of more than two-thirds from about 350 Mtoe in 2000 (figure 1.1). At the beginning and end of the period, oil accounted for roughly half of region-wide primary energy use.
The use of natural gas surged over the same period, growing in volume by over 90 percent, and its share in primary energy increased from 41 percent in 2000 to 47 percent in 2011. For comparison, from 2000 to 2011, oil use rose by somewhat less than 60 percent, while its share in primary energy fell from 54 percent to 50 percent. These trends will likely continue, with both fuels continuing to provide the great majority of the region’s energy needs, and the relative share of gas gradually rising.
Total electricity generation in the region rose from 428 terawatt-hours (TWh) in 2000 to 925 TWh in 2012. About 59 percent of electricity in the MENA region comes from natural gas and 40 percent from crude oil and oil products. Less than 0.2 percent came from renewable energy sources in 2012 (RCREEE 2014).8
Source: Data from RCREEE 2014.
02000 2005 2010 2015 2020 2025
200
400
600
800
1,000
1,200
Oil & oil products4% p.a.
Oil & oil products4% p.a.
Natural gas5% p.a.
Natural gas6% p.a.
Primary electricity5% p.a.
Coal 19% p.a.
Primary electricity5% p.a.
Coal 19% p.a.
Combustiblerenewable & waste
1% p.a.
Combustiblerenewable & waste
.4% p.a.
2012
Mto
e
Historical Projected
Figure1.1.historicalandprojectedprimaryenergysupplyinMenAbyenergysource

De
liv
er
ing
en
er
gy
ef
fic
ien
cy
in
th
e M
iDD
le e
ast
an
D n
or
th
af
ric
a
25
energyconsumption
Total energy consumption in all sectors came to just above 400 Mtoe in 2012. This is a steep rise from less than 220 Mtoe in 2000. In 2000 industry accounted for the largest share, just ahead of transport (figure 1.2). However, by 2011 that order had reversed as transport edged slightly higher. Over the same period, the share of final energy use from the residential sector also edged up slightly, and the share of the services sector use doubled. The largest change in structure was a substantial drop in the share of non-energy use, such as fossil fuel for petrochemical feedstocks.
The region’s final energy consumption in 2020 is predicted to grow to more than 620 Mtoe, an almost 60 percent increase over 2011, with a minimal change in sectoral shares, as all economic sectors are likely to expand. Total electricity generation will likely rise by about three-fourths to more than 1,500 TWh in 2020.
In 2025, projected final energy consumption will be just above 860 Mtoe, a 120 percent increase since 2011. Electricity generation will likely grow even more, by nearly 140 percent over the same period, typical as countries industrialize and become wealthier. The sectoral distribution of energy consumption is likely to be very similar to its quantity in 2020 (see figure 1.2).
Figure1.2.historicalandprojectedfinalenergyconsumptioninMenAbyend-use
sector
Source: Data from RCREEE 2014. Note: Non-energy consumption includes mainly feedstock use.
1% p.a.
6% p.a.
5% p.a.
5% p.a.
5% p.a.
0
100
200
300
400
500
600
700
2000 2005 2010
Historical
Mto
e
Projected
2015 2020 2025
Agriculture
Services
Households
Transport
Industry
5% p.a.
4% p.a.
5% p.a.
5% p.a.
10% p.a.
2012

WO
RLD
BA
NK
GR
OU
P
26
In the recent past and in projections, three countries clearly dominate the re-gional energy picture: Saudi Arabia, the UAE, and Egypt (figure 1.3). These ac-counted in 2011 for 32 percent, 12 percent, and 16 percent of energy use, respec-tively. By 2025, these shares will be approximately 33 percent, 17 percent, and 13 percent. The UAE is one of the fastest-growing countries in the region, with consumption more than tripling from 2011 to 2025. Oman will probably grow at a similar rate, and Qatar even faster, quadrupling during the same time.
Figure1.3.historicalandprojectedfinalenergyconsumptioninMenAbycountry
Source: Data from RCREEE 2014.
PROJECTED ENERGY SAVINGS
Regional
The technical potential for avoided energy consumption through greater de-ployment of available EE technologies and measures in MENA countries was es-timated in a static analysis in the base year, which for most countries was 2012.9
On this basis, projections of energy savings were prepared for 2020 based on a simple extrapolation, assuming no change in availability or performance of effi-ciency technologies. Although this is, in one sense, a conservative assumption, in fact it mimics the deployment over an eight-year period of currently available tech-nologies. Given the widely varying lifetimes of energy-using equipment in different applications and sectors, this is a reasonable central assumption. For 2025, tech-nical potential for energy savings was estimated by extrapolating from the 2020 estimates, but introducing adjustment factors to account for new EE targets and the NEEAPs adopted in 12 out of the 16 countries analyzed.
The potential for savings from EE in 2020 will be about 22 percent of projected total primary energy supply and about 21 percent in 2025—the drop resulting from
Yemen
UAE
TunisiaSudan
Saudi Arabia
QatarPalestine
OmanMoroccoLibyaLebanonKuwaitJordanIraq
Egypt
Bahrain
Algeria
Historical Projected
0
100
200
300
400
500
600
700
2000 2005 2010
2012M
toe
2015 2020 2025

De
liv
er
ing
en
er
gy
ef
fic
ien
cy
in
th
e M
iDD
le e
ast
an
D n
or
th
af
ric
a
27
the growing share of primary fossil energy converted to electricity.10 The estimates include potential energy savings in the electricity supply sector (generation, trans-mission, and distribution), which accounts for more than one-quarter of the total, and in end-use sectors, which account for most potential savings region-wide (ta-ble 1.1). The purpose of this analysis is to provide a starting point for evaluating the relative size of savings among sectors. However, a deeper analysis of the technical potential for energy savings may produce somewhat different results.
table1.1.PotentialforenergysavingsintheMenAregion,2020and2025
2020 2025
Mtoe share Mtoe share
Potentialenergysavings
Electricity sector 57 26% 82 27%
End-use sectors: Subtotal 165 74% 219 73%
Industry 51 23% 66 22%
Transport 39 17% 51 17%
Residential 45 20% 60 20%
Services 29 13% 40 13%
Agriculture & fishing 1 1% 2 1%
totalpotentialsavings 223 100% 300 100%
ProjectedtPes 1,015 1,455
Saving share of TPES 22% 21%
Source: RCREEE 2014. Note: Total primary energy supply (TPES) is statistically identical to total primary energy consumption.
In the region as a whole, nearly three-quarters of the potential for energy savings from greater efficiency—219 of 300 Mtoe in 2025—is in end-use sectors. Among end-use sectors, the industry sector offers the largest scope for energy savings over the projection period, contributing just over one-fifth of the total. The residential sector is next largest, followed by the transport sector and then commercial and public services sector and finally the agriculture sector. The share of the industry sector shrinks slightly over time as the potential for energy savings rises faster in the electricity supply sector.
The electricity supply sector—generation, transmission, and distribution—holds the largest potential for energy savings among these sectors (table 1.1). Total elec-tricity generation in MENA countries in 2025 will likely be just above 2,000 TWh, up from 925 TWh in 2012. The potential for savings through EE in the electricity supply sector is about 46 percent of total generation, or nearly 82 Mtoe in fuel savings. About 85 percent of that vast potential for savings could come from better power generation technologies, with the remainder from improvements in trans-mission and distribution systems.
For many countries, the electricity supply sector has been the first target for EE investments, often in the course of reforming state-owned power sectors. Many MENA countries will address efficiency opportunities in this sector as a matter of course. Therefore, as earlier noted, this sector is not a focus of this report, which is concerned mainly with end-use sectors, where delivering efficiency has proven repeatedly to be much more challenging.

WO
RLD
BA
NK
GR
OU
P
28
national
The potential for energy savings varies widely among MENA countries (table 1.2), due in large part to significant differences in economic structure, relative wealth, size, technological capacity and resource endowment. The highest potential in ab-solute terms for EE is in Saudi Arabia, UAE, and Egypt, which have the largest economies in the region. Relative to their total primary energy supply, Bahrain and Qatar, which have strong and relatively efficient economies, as well as Tunisia, which has already undertaken substantial EE programs, will probably gain corre-spondingly less from EE than other countries in the region.
Only a few countries in the MENA region have so far made sustained and well-re-sourced efforts to improve the efficiency of energy consumption. For the other coun-tries, taking advantage of the potential energy savings will require strong commit-ment, considerable investment, robust program planning, tenacious implementation and effective monitoring and verification systems. Incentives to deploy efficiency measures go hand-in-hand with reforms to make energy prices more cost-reflective.
table1.2.PotentialforenergysavingsinMenAcountries,2025
economyPotentialforenergysavings
)ktoe,2025(
Potentialforenergysavings
as%oftPes
Saudi Arabia 102,418 25%
UAE 41,339 25%
Egypt 32,794 20%
Oman 21,115 28%
Algeria 20,236 30%
Iraq 18,071 11%
Kuwait 15,428 26%
Qatar 12,079 6%
Morocco 10,362 19%
Sudan 6,375 19%
Libya 5,125 37%
Bahrain 3,168 14%
Lebanon 2,434 33%
Tunisia 2,412 14%
Jordan 2,046 13%
Yemen 1,271 23%
West Bank and Gaza 671 21%
totalenergysavings 297,344
totalprimaryenergysupply 1,455,248
Source: RCREEE 2014.
The sectoral structure of potential energy savings varies significantly among coun-tries, providing information to policy makers as they make decisions about which sectors to prioritize (table 1.3). A few examples will show how different development paths can influence the contributions of sectors to overall potential energy savings.

De
liv
er
ing
en
er
gy
ef
fic
ien
cy
in
th
e M
iDD
le e
ast
an
D n
or
th
af
ric
a
29
table1.3.PotentialforannualeeinMenAcountriesbysector,2025
In Saudi Arabia, which is by far the largest energy consumer and thus has the greatest potential savings, the electricity supply sector can deliver over a quarter of potential energy savings in 2025, mainly through raising the efficiency of power gen-eration by switching from oil to gas. Reducing transmission and distribution losses would contribute only about one-tenth as much in energy savings. The residential sector could supply about one-fifth of energy savings, primarily through electricity efficiency, and the transport sector a similar share, from greater fuel efficiency.
This contrasts with the UAE, the second-largest contributor to potential regional energy savings, where projected growth in industrial output means that a large share—nearly 40 percent—of energy savings comes from that sector. Industrial activity is large in proportion to population, accounting for more than two-thirds of energy use. The UAE has a thriving services sector that will continue growing, accounting for the sec-ond-largest share of savings potential, 18 percent.
Egypt, with the third-largest energy savings potential and the largest population in the MENA region, is facing a different growth trajectory than the energy-export-ing Gulf Cooperation Council (GCC) countries. The industry sector, already the country’s biggest energy user, would contribute over one-quarter of total savings. The services sector now consumes slightly more than half the amount of energy than the industry sector does—but its consumption is projected to double over time, while industry’s consumption will increase by about half of its present amount.
Industry services Residential transportAgriculture&
fishing electricitytotaleepotential
)ktoe(
ktoe % ktoe % ktoe % ktoe % ktoe % ktoe % -
Algeria 3,024 19.7 1,407 9.2 3,543 23.1 4,173 27.2 - 0.0 3,211 20.9 20,236
Bahrain 687 21.7 627 19.8 665 21.0 370 11.7 - 0.0 819 25.9 3,168
Egypt 9,153 27.9 9,166 28.0 8,497 25.9 2,137 6.5 996 3.0 2,844 8.7 32,793
Iraq 1,372 7.6 302 1.7 2,087 11.5 1,012 5.6 60 0.3 13,237 73.3 18,070
Jordan 370 17.5 478 22.7 609 28.9 284 13.5 23 1.1 344 16.3 2,107
Kuwait 2,750 17.8 718 4.7 3,658 23.7 2,178 14.1 - 0.0 6,124 39.7 15,428
Lebanon 163 6.7 90 3.7 754 31.0 355 14.6 39 1.6 1,033 42.4 2,434
Libya 159 3.1 466 9.1 492 9.6 1,543 30.1 4 0.1 2,462 48.0 5,126
Morocco 1,388 13.4 284 2.7 3,285 31.7 2,602 25.1 124 1.2 2,679 25.9 10,362
Oman 10,198 48.3 1,553 7.4 1,839 8.7 3,944 18.7 10 0.0 3,570 16.9 21,114
West Bank & Gaza 24 3.6 51 7.6 418 62.2 151 22.5 0 0.0 27 4.0 671
Qatar 4,959 41.1 459 3.8 1,667 13.8 1,805 14.9 - 0.0 3,189 26.4 12,079
Saudi Arabia 13,688 14.4 15,174 15.9 20,144 21.2 20,764 21.8 77 0.1 25,317 26.6 95,164
Tunisia 620 25.7 351 14.6 356 14.8 244 10.1 123 5.1 717 29.7 2,412
UAE 16,179 39.1 7,528 18.2 6,077 14.7 4,636 11.2 - 0.0 6,920 16.7 41,340
Yemen 227 17.9 225 17.7 137 10.8 311 24.5 127 10.0 244 19.2 1,271
Sources: Authors; RCREEE 2014. Note: No results available for Sudan. Results are displayed for transport, agriculture and electricity generation for comparison, although these sectors are not the focus in this report’s analysis of means to deliver energy efficiency.
WO
RLD
BA
NK
GR
OU
P
30
With so many options for the electricity-intensive services sector, its contri-bution to savings would be similar to the industry sector. The size and growth prospects of the residential sector mean that it would also contribute substantially to savings. The roles of the transport and electricity supply sectors are correspond-ingly smaller than in other MENA countries.
The effect of the economic structure on efficiency potential is particularly ap-parent in West Bank and Gaza. With very little industry and commerce, over 60 percent of the efficiency potential is in the residential sector, and most of the rest is in transport. Governments should also consider some other factors when setting priorities:
The industrial sector generally pays higher prices for energy than other sectors. It would benefit from targeted policies to improve EE and productivity. Energy-in-tensive industries also generally have the financial and human resources to adopt EE measures.
The residential sector typically presents a significant opportunity for energy savings, but customers have the least incentive given the subsidized price of en-ergy in MENA countries. How to create incentives for improving EE? Alongside longer-term efforts to address energy pricing, programs with near-term results are important, such as introducing efficient lights and appliances through market transformation programs, and public support for the purchase of efficient devices and the disposal of obsolete equipment. Introducing and enforcing such standards can be challenging in their own right, and require time and resources to stimulate customer awareness.
A segment of the services sector, commercial services (i.e. excluding transport, which is sometimes rolled into accounts of services), often cross-subsidizes resi-dential customers and for this reason has an incentive to reduce energy use. Com-mercial services can be targeted through building codes and regulations to improve the efficiency of its energy use. Program effectiveness will depend, however, on the enforcement of regulations and on price incentives for customers to improve their efficiency.
Another segment is state- and municipal-owned facilities, which contain siz-able potential for EE, but they have the smallest financial incentive to undertake relevant measures. Much like the energy generation sector, governments would also benefit from improving efficiency in public-sector facilities such as schools, hospitals, water pumping, street lighting and so on.
RECENT PROGRESS IN ENERGY EFFICIENCY
Most MENA countries have taken significant steps to improve the environment for EE. Table 1.4 captures the most significant national developments, based on the most recent region-wide survey of EE policy activity (RCREEE 2015). In recent years, six countries have adopted NEEAPs or equivalent comprehensive national plans to address EE, bringing the total to 12. Most of the 16 countries in the table have achieved significant accomplishments in advancing sectoral regulations and measures.
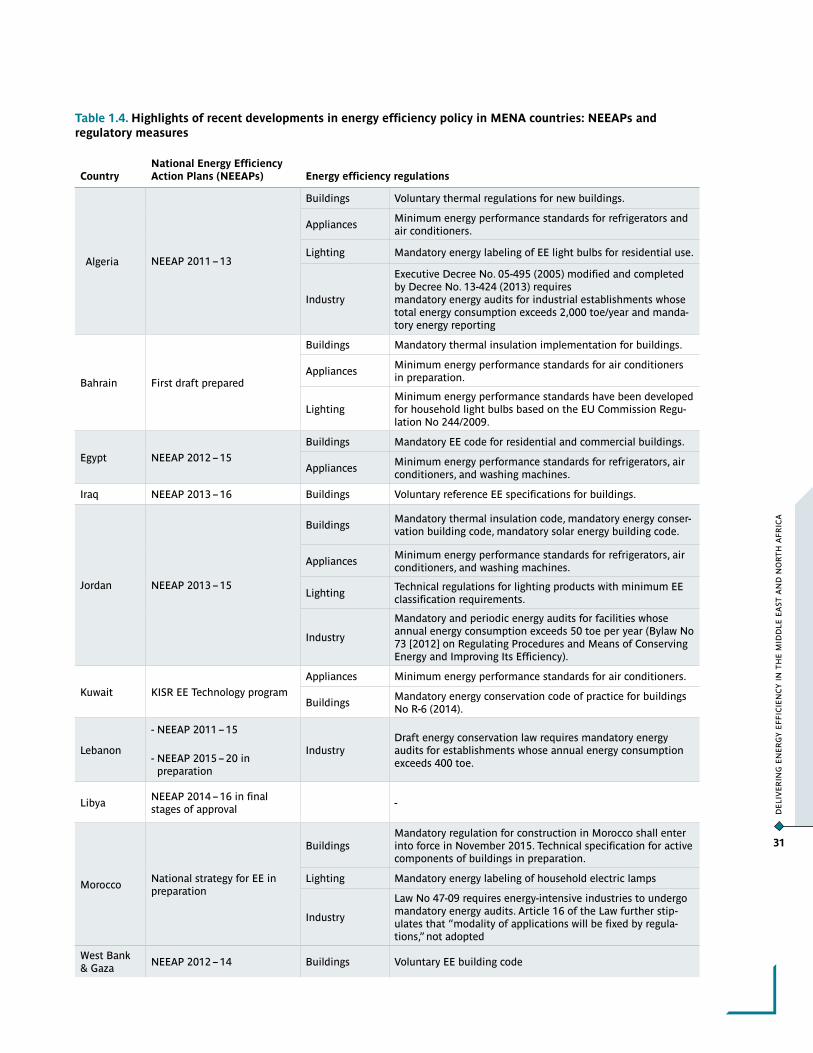
De
liv
er
ing
en
er
gy
ef
fic
ien
cy
in
th
e M
iDD
le e
ast
an
D n
or
th
af
ric
a
31
table1.4.highlightsofrecentdevelopmentsinenergyefficiencypolicyinMenAcountries:neeAPsandregulatorymeasures
CountrynationalenergyefficiencyActionPlans)neeAPs( energyefficiencyregulations
Algeria NEEAP 2011–13
Buildings Voluntary thermal regulations for new buildings.
AppliancesMinimum energy performance standards for refrigerators and air conditioners.
Lighting Mandatory energy labeling of EE light bulbs for residential use.
Industry
Executive Decree No. 05-495 (2005) modified and completed by Decree No. 13-424 (2013) requires mandatory energy audits for industrial establishments whose total energy consumption exceeds 2,000 toe/year and manda-tory energy reporting
Bahrain First draft prepared
Buildings Mandatory thermal insulation implementation for buildings.
AppliancesMinimum energy performance standards for air conditioners in preparation.
LightingMinimum energy performance standards have been developed for household light bulbs based on the EU Commission Regu-lation No 244/2009.
Egypt NEEAP 2012–15
Buildings Mandatory EE code for residential and commercial buildings.
AppliancesMinimum energy performance standards for refrigerators, air conditioners, and washing machines.
Iraq NEEAP 2013–16 Buildings Voluntary reference EE specifications for buildings.
Jordan NEEAP 2013–15
BuildingsMandatory thermal insulation code, mandatory energy conser-vation building code, mandatory solar energy building code.
AppliancesMinimum energy performance standards for refrigerators, air conditioners, and washing machines.
LightingTechnical regulations for lighting products with minimum EE classification requirements.
Industry
Mandatory and periodic energy audits for facilities whose annual energy consumption exceeds 50 toe per year (Bylaw No 73 [2012] on Regulating Procedures and Means of Conserving Energy and Improving Its Efficiency).
Kuwait KISR EE Technology program
Appliances Minimum energy performance standards for air conditioners.
BuildingsMandatory energy conservation code of practice for buildings No R-6 (2014).
Lebanon
- NEEAP 2011–15
- NEEAP 2015–20 in preparation
IndustryDraft energy conservation law requires mandatory energy audits for establishments whose annual energy consumption exceeds 400 toe.
LibyaNEEAP 2014–16 in final stages of approval
-
MoroccoNational strategy for EE in preparation
BuildingsMandatory regulation for construction in Morocco shall enter into force in November 2015. Technical specification for active components of buildings in preparation.
Lighting Mandatory energy labeling of household electric lamps
Industry
Law No 47-09 requires energy-intensive industries to undergo mandatory energy audits. Article 16 of the Law further stip-ulates that “modality of applications will be fixed by regula-tions,” not adopted
West Bank & Gaza
NEEAP 2012–14 Buildings Voluntary EE building code

WO
RLD
BA
NK
GR
OU
P
32
CountrynationalenergyefficiencyActionPlans)neeAPs( energyefficiencyregulations
Qatar“Tarsheed” the National Con-servation and Energy Efficien-cy Program 2012–17
AppliancesMandatory minimum energy performance standards for air conditioners
LightingIn 2014, the Ministry of Environment issued a regulation ban-ning the import of incandescent light bulbs. First phase of the ban includes 100W and 75W incandescent bulbs.
Saudi ArabiaNational Energy Efficiency Program
Lighting
The Saudi Energy Efficiency Program is drafting regulations that focus on the phase-out of least efficient light sources in residential and commercial lighting. The program is in prepa-ration.
Appliances Minimum energy performance standards for air conditioners.
Buildings Mandatory Saudi Energy Efficiency building code (2007).
Sudan NEEAP 2013–16 -
TunisiaNew Energy Program 2013–20
Buildings
Mandatory EE specifications for administrative buildings (2008). Mandatory EE specifications for residential buildings (2009). Voluntary minimum EE performance specifications for hospitals and hotels.
LightingThe sale of incandescent light bulbs with power superior or equal to 100 watt and voltage superior or equal to 100 volt is banned.
AppliancesMinimum energy performance standards for refrigerators and air conditioners.
Industry
Decree No 2004-2144 (2004) as amended by decree No 2269-2009 of 31 July 2009 requires:
Mandatory audits for industrial establishments with annual energy consumption exceeding 800 toe.
Mandatory prior consultation with ANME for new industrial projects whose total projected energy consumption exceeds 800 toe and for new construction projects for residential and services sectors whose total projected energy consumption exceeds 200 toe.
Prior authorization from the ministry in charge of energy for new industrial projects or expansion of existing industrial facilities whose total projected energy consumption exceeds 7,000 toe.
UAEAbu Dhabi Comprehensive Cooling Plan
Buildings
Mandatory regulations on technical specifications for thermal insulation systems (2003).
Mandatory green building regulations and specifications (2011).
Lighting
The Emirates Authority for Standardization and Meteorology (ESMA) banned the import of incandescent light bulbs effec-tive from July 1, 2014. The retailers and wholesalers have 6 months to sell their current stock of inefficient bulbs. From January 1st, 2015, the sales ban of incandescent and low-quali-ty energy saving bulbs will come into place.
AppliancesMinimum energy performance standards for air conditioners, refrigerators, and washing machines.
Yemen NEEAP in preparation None -
Source: RCREEE 2015.

De
liv
er
ing
en
er
gy
ef
fic
ien
cy
in
th
e M
iDD
le e
ast
an
D n
or
th
af
ric
a
33
As a step toward the inclusion of MENA countries in the global RISE survey mentioned in the Introduction, a number of the survey’s EE indicators were ap-plied to the 16 countries analyzed in this report. When the full analysis is com-pleted, it will be possible to consider the accomplishments of MENA countries in comparison to more than 90 other countries. This report has information on about one-third of the detailed sub-indicators that will be in the full RISE report.
Moreover, the RISE survey measures only the presence of factors, generally un-der the control of policy makers, which have been shown to be effective in many countries in enabling investments in EE. It is not possible to measure in any way, that is comparable across countries, the relative effectiveness of a given factor. The RISE survey is a snapshot of conditions prevailing in 2015. The survey is designed to be undertaken biannually, with its full value emerging over time as it tracks trends in indicators. Below we review some of the key features that the first phase of the survey illuminates.
At the broadest level, most MENA countries already have in place national tar-gets and/or plans for EE, and most also have specialized agencies authorized to carry them out (Figure 1.4.a). These are fundamental “infrastructure”, but are by no means sufficient for carrying forward successful EE initiatives.
A fundamental basis for EE is information about energy consumption. Without knowing whether one is consuming more or less, there is no incentive to conserve. Electric utilities in all countries in the region already provide such information to consumers, though with variation in means of communication, periodicity, and other details (Figure 1.4.b). Only about half of the countries, though, have utilities that also provide information on energy-saving opportunities to customers
Governments have the most direct impact in creating markets for EE investment in the arena of public services—for example, government buildings, street lighting, and water supply. Mandates on public entities to implement EE are thus important, and a range of adoption is evident across MENA countries (Figure 1.4c). All 16 countries allow local administrations to enter into multi-year contracts (a funda-mental condition for ESCOs to function). A majority also have EE-specific policies in place, including obligations for public buildings to save energy and, more rarely, obligations for public services to save energy, or procurement rules mandating the purchase of EE equipment. Only Qatar and Tunisia have the full range of such mea-sures in place.
Large energy consumers, mainly industrial facilities, are key influences on EE in most countries, and so it is particularly important to gauge the conditions in this sector. Nearly half of the countries in MENA have enacted mandates of some sort on this class of consumer (Figure 1.4.d). Six countries have also enacted incentives and/or other measures to stimulate uptake of efficiency.
Energy performance standards and labels are a proven, cost-effective way to in-troduce efficiency for energy-using appliances, equipment and vehicles. Enforceable penalties for non-compliance increases their effectiveness. About two-thirds of the surveyed countries have adopted at least some of these (Figure 1.4.e).
Energy use in buildings is expected to be a key driver of future energy demand in the MENA countries, so building energy codes is crucial. Adoption of such codes is about as widespread as EE standards and labels (Figure 1.4.f). The scores on this in-dicator are relatively high, which is encouraging, as setting and implementing energy codes for buildings is much more difficult than for discrete devices, and the prospec-tive growth in energy demand from buildings is very large. Enforcement will be the key to benefiting from the promise of energy savings that building energy codes offer.

WO
RLD
BA
NK
GR
OU
P
34
Figure1.4.ComparisonamongMenAcountriesofselectedRIseeeindicators
a.eeplanningandinstitutions
b.Informationprovidedbyutilitiestocustomers
c.Policiestopromotepublicsectoree
Algeria
Jord
an
Leba
non
Tunisi
aEg
ypt
Iraq
Kuwait
Pales
tine
Qatar
Saud
i Ara
bia
UAE
Yem
en
Mor
occo
Bahra
inLib
ya
Oman
RISE indicator score Prevalence of good practices
National energy efficiency target
Energy efficiency legislation/action plan
Energy efficiency entities
Sub-sectoral targets
100 10097 97 94 93 90 88 88
84 82 81%
81%
44%
38%
57
50
25 2522
0 25 50 75 100
National energyefficiency target
Energy efficiencylegislation/action plan
Energy efficiencyentities
Sub-sectoraltargets
0
20
40
60
80
100
0
20
40
60
80
100
Oman
Iraq
UAE
Mor
occo
Qatar
Jord
an
Tunisi
a
Algeria
Kuwait
Pales
tine
Egyp
t
Yem
en
Saud
i Ara
bia
Libya
Leba
non
Bahra
in
RISE indicator score
Electricity usage reports provided by utilities
Quality of information in report
Comparison with other users
Energy saving information provided by utilities
63 60 5854 54 54 51 50 50 50 50
94%
94%
94%
6%
38%
42 42 4033
0
0 25 50 75 100
Electricity usage reportsprovided by utilities
Energy savinginformation provided
by utilities
Monthlyreporting
Price level
Comparison withother usersQ
ual
ity
of in
form
atio
npr
ovid
ed t
o co
nsu
mer
sab
out
elec
tric
ity
usa
ge
Prevalence of good practices
0
20
40
60
80
100
Oman
Egyp
t
Jord
an
Algeria
Libya
Qatar
UAE
Tunisi
aIra
q
Mor
occo
Bahra
in
Kuwait
Saud
i Ara
bia
Yem
en
Leba
non
Pales
tine
RISE indicator score
Multi year contracts with service providers
Obligations for public buildings
Obligations for other public facilities
Public procurement of EE products
Allowance to retain energy savings
100 100
90
70
60 60
50
40
30 30 30
100%
31%
31%
19%
19%
20 20 20 20 20
0 25 50 75 100
Prevalence of good practices
Multi year contractswith service providers
Obligations forpublic buildings
Obligations for otherpublic facilities
Public procurementof EE products
Allowance to retainenergy savings

De
liv
er
ing
en
er
gy
ef
fic
ien
cy
in
th
e M
iDD
le e
ast
an
D n
or
th
af
ric
a
35
d.Policiestopromoteeeatlargefacilities)industrialconsumers(
e.energyperformancestandardsandlabels
f.buildingenergycodes
Source: Authors.
0
20
40
60
80
100
Mor
occo
Leba
nonQat
ar
Jord
an
Saud
i Ara
bia
Algeria
Bahra
inEg
ypt
Tunisi
a
Kuwait Ira
qLib
yaUAE
Yem
en
Oman
Pales
tine
RISE indicator score
Mandates for large-scale users
Penalties for non-compliance
Measurement of savings
Incentives for large-scale users
100
75 75
50 50
25 25 25
0 0 0
25%
31%
25%
19%
19%
13%
25%0 0 0 0 0
0 25 50 75 100
Prevalence of good practices
Targets
Mandatory audits
Progress/tracking reports
Energy-mgmt system
Penalties fornon-compliance
Measurement of savings
Incentives forlarge-scale users
0
20
40
60
80
100
Qatar
Egyp
t
Algeria
Mor
occo
Bahra
in
Tunisi
a
Kuwait
Saud
i Ara
bia
Jord
an
Pales
tine
Iraq
Leba
nonUAE
Yem
enLib
ya
Oman
RISE indicator score
Standards for appliances
Labeling for appliances
Standards
Labeling
Labeling
Standards
Labeling
Penalties fornon-compliance
Standards for lighting
Labeling for lighting
86
6461
57
3936 36 36
29
14
0 0 0 0 0 0
Standards for light duty vehicles
Labeling for light duty vehicles
Penalties for non-compliance
Prevalence of good practices
Ligh
t du
tyve
hic
les
App
lian
ces
0 25 50 75 100
50%
63%
31%
25%
19%
50%
0
20
40
60
80
100
Egyp
t
Kuwait
Tunisi
a
Bahra
in
Saud
i Ara
bia
UAEIra
qQat
ar
Jord
an
Mor
occo
Leba
non
Pales
tine
Algeria
Yem
enLib
ya
Oman
RISE indicator score
Residential buildings
Commercial buildings
Compliance system
Renovated buildings
8664 61 57 39
36 3636
69%
69%
50%
50%
44%
31%
0%
6%
2914 0
00 0 0 0
Building energy information and labeling
Buildingenergycodes
Renovatedbuildings
Buildingenergy
informationand labeling
0 25 50 75 100
Residential
Commercial
Residential
Commercial
Compliance system
Standardizedrating system
Disclosure whensold/leased
Disclosure annually
Prevalence of good practices

WO
RLD
BA
NK
GR
OU
P
36
ENERGY PRICES AND SUBSIDIES
Many MENA countries have price controls and subsidies that result in retail ener-gy prices that do not reflect the full cost of supply. While such policies can achieve important socioeconomic development goals, there are numerous unwanted ef-fects (box 1.1; World Bank, 2014b). Fully and even partly cost-reflective energy prices provide important incentives for adopting EE measures. Thus, reducing en-ergy subsidies and other measures confronting consumers with more cost-reflec-tive prices are typically central elements in national strategies to encourage greater efficiency.
Recent developments in oil prices present a challenge to MENA countries to maintain a commitment to greater EE, both to those that depend on oil import revenues, and those that are net importers and consequently face less immediate pressure from oil import bills (box 1.1).
box1.1.energysubsidies:hiddencosts
The MENA region has 5.5 percent of the world’s population, 3.3 percent of the world’s GDP—and just under 50 percent of the world’s energy subsidies. The well-known negative impacts of energy subsides are felt even more acutely throughout the MENA region than in other parts of the world and have been correlated with, among other events, slow economic growth.
Energy subsidies crowd out public spending on health, education, and overall investment. Egypt, for example, spends seven times more on fuel subsidies than it does on health.
Below-cost retail prices also encourage higher levels of energy consumption. This can contribute to a variety of negative results that range from unemployment, air pollution, and water depletion to an increase in road accidents caused by traffic congestion. In
some circumstances, these results can exacerbate socioeconomic instabilities.
Source: Authors
Phasing out energy subsidies, although necessary, must be done gradually and carefully, respecting social norms. Unintended impacts on vulnerable populations and sectors will have to be mitigated (World Bank 2014c). In any case, energy price reform is by no means the only way to encourage EE (Schwanitz and others 2014). It is just one necessary measure among many (discussed further in chapter 2).
To a certain extent, regulatory and administrative steps—such as enforcement of energy performance standards for appliances, equipment and vehicles—can deliver EE in the absence of price reforms. But without progress in achieving cost-reflec-tive prices, much of the technical potential for EE will remain financially unat-tractive and out of the reach of both public and private stakeholders.
The International Monetary Fund (IMF) (2014) estimates that energy subsi-dies in MENA countries amounted to 8.6 percent of regional GDP, more than in any other region, and accounted for about 48 percent of global energy subsidies in 2011. About half the subsidies are for oil products, the rest for electricity and natural gas.
As expected, energy-exporting countries subsidize energy more than non-ex-porting countries, but the IMF estimates that energy subsidies are greater than 5 percent of GDP in two-thirds of MENA countries, varying from less than 1 percent in Morocco to more than 11 percent in Iraq. ESMAP (2009) estimates that average

De
liv
er
ing
en
er
gy
ef
fic
ien
cy
in
th
e M
iDD
le e
ast
an
D n
or
th
af
ric
a
37
energy subsidies in MENA exceeded 20 percent of government spending in 2006, ranging from 4 percent in Qatar and Morocco to about 40 percent in Syria and Libya. RCREEE (2014) found that electricity prices in Kuwait have not changed since 1966 and customers pay about 5 percent of the cost of producing electricity.
While subsidies are distortive in all countries, they are particularly damaging to net energy importers such as Egypt, Jordan, Lebanon, Morocco, and Tunisia. RCREEE (2015) reports that energy subsidies in Egypt were about $16 billion in 2012, accounting for more than 20 percent of the budget.
Many countries in the MENA regions have embarked on subsidy reforms, in-cluding Egypt, Jordan, Morocco, Sudan, Tunisia, and Yemen. All of the reforms so far have had some good foundational elements, but not all have received the same attention in implementation. Most have lacked strong communication campaigns, resulting in lower levels of acceptance than could have been fostered. Some pro-grams have lacked mitigation mechanisms to support the poor and vulnerable. Because of these and other factors, energy subsidy reforms are advancing in some MENA countries but losing ground in others. The current global oil price environ-ment may offer an opportunity in some countries for proceeding with energy price reforms (box 1.2).
box1.2.loweroilprices:anopportunitytostrengthenpricesignals
Following four years of relative stability at around USD 105 per barrel, oil prices have declined sharply since June 2014 and will likely remain low for a long time. The recent plunge in oil prices has been driven by (i) several years of surprisingly rapid growth in unconventional oil output, (ii) weakening global demand for oil, (iii) a significant shift in OPEC policy, (iv) reduction of some geopolitical risks (alongside the emergence of others), and (v) an appreciation of the US dollar.
The decline in oil prices will lead to significant real income shifts from oil exporters to oil importers. While the positive impact for oil importers could be more diffuse and take some time to materialize, the negative impact on exporters is immediate, and in some cases exacerbated by financial market pressures.
Although the loss in oil revenues will strain public finances for exporters, lower oil prices offer an opportunity to implement structural reforms. For net oil importers especially, the lower prices offer a window for reforming fuel and electricity prices in the region with lower adverse fiscal impacts than in other scenarios. Fiscal resources released by lower fuel subsidies could be used to rebuild fiscal space or reallocated toward other programs.
The low-price environment also offers time in which to organize public education campaigns to raise awareness, and to put in place social protection mechanisms to support sensitive populations when market prices eventually rise and, as a result of subsidy and tariff reforms, are passed on to energy consumers. It also provides time to add energy efficiency measures to ensure that consumers pay lower bills in the future.
Sources: Baffes and others 2015.
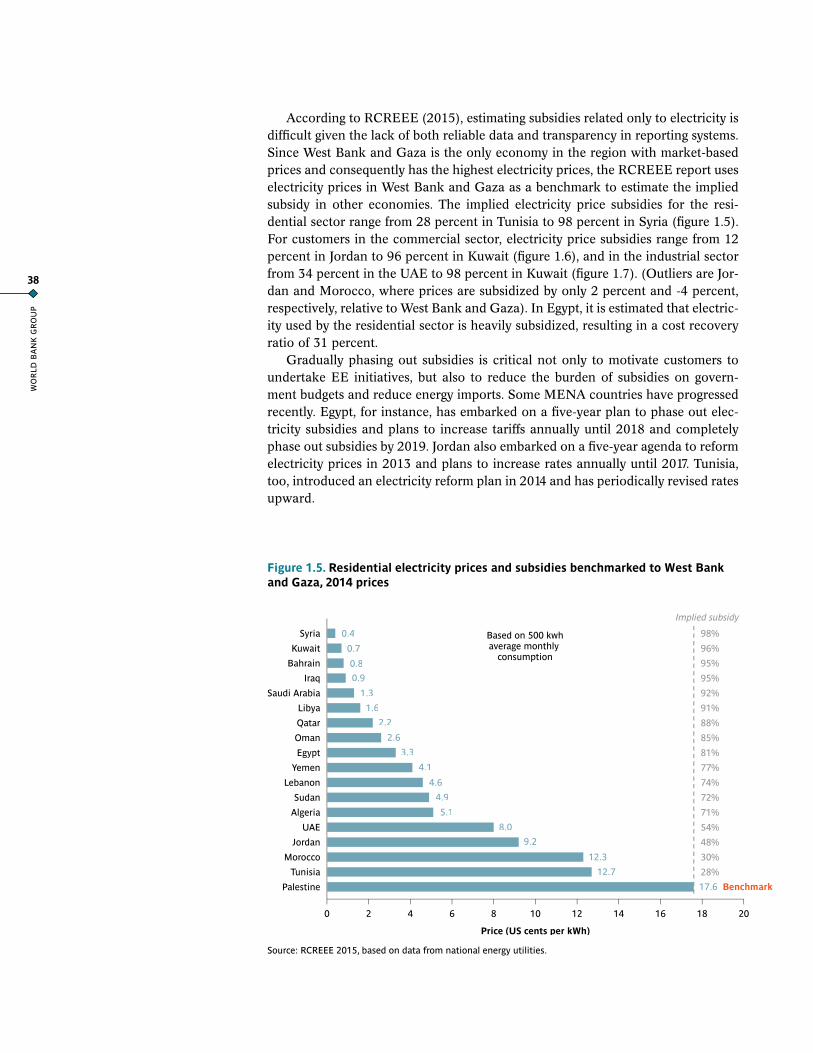
WO
RLD
BA
NK
GR
OU
P
38
According to RCREEE (2015), estimating subsidies related only to electricity is difficult given the lack of both reliable data and transparency in reporting systems. Since West Bank and Gaza is the only economy in the region with market-based prices and consequently has the highest electricity prices, the RCREEE report uses electricity prices in West Bank and Gaza as a benchmark to estimate the implied subsidy in other economies. The implied electricity price subsidies for the resi-dential sector range from 28 percent in Tunisia to 98 percent in Syria (figure 1.5). For customers in the commercial sector, electricity price subsidies range from 12 percent in Jordan to 96 percent in Kuwait (figure 1.6), and in the industrial sector from 34 percent in the UAE to 98 percent in Kuwait (figure 1.7). (Outliers are Jor-dan and Morocco, where prices are subsidized by only 2 percent and -4 percent, respectively, relative to West Bank and Gaza). In Egypt, it is estimated that electric-ity used by the residential sector is heavily subsidized, resulting in a cost recovery ratio of 31 percent.
Gradually phasing out subsidies is critical not only to motivate customers to undertake EE initiatives, but also to reduce the burden of subsidies on govern-ment budgets and reduce energy imports. Some MENA countries have progressed recently. Egypt, for instance, has embarked on a five-year plan to phase out elec-tricity subsidies and plans to increase tariffs annually until 2018 and completely phase out subsidies by 2019. Jordan also embarked on a five-year agenda to reform electricity prices in 2013 and plans to increase rates annually until 2017. Tunisia, too, introduced an electricity reform plan in 2014 and has periodically revised rates upward.
Figure1.5.ResidentialelectricitypricesandsubsidiesbenchmarkedtowestbankandGaza,2014prices
Price (US cents per kWh)
Syria
Kuwait
Bahrain
Iraq
Saudi Arabia
Libya
Qatar
Oman
Egypt
Yemen
Lebanon
Sudan
Algeria
UAE
Jordan
Morocco
Tunisia
Palestine
98%
96%
95%
95%
92%
91%
88%
85%
81%
77%
74%
72%
71%
54%
48%
30%
28%
0 2 4 6 8 10 12 14 16 18 20
0.4
0.7
0.8
0.9
1.3
1.6
2.2
2.6
3.3
4.1
4.6
4.9
5.1
8.0
9.2
12.3
12.7
17.6 Benchmark
Based on 500 kwhaverage monthly
consumption
Implied subsidy
Source: RCREEE 2015, based on data from national energy utilities.

De
liv
er
ing
en
er
gy
ef
fic
ien
cy
in
th
e M
iDD
le e
ast
an
D n
or
th
af
ric
a
39
Figure1.6.CommercialsectorelectricitypricesandsubsidiesbenchmarkedtowestbankandGaza,2014prices
Price (US cents per kWh)
Kuwait
Bahrain
Iraq
Qatar
Saudi Arabia
Algeria
Syria
Oman
Libya
Sudan
UAE
Egypt
Lebanon
Yemen
Tunisia
Morocco
Jordan
Palestine
0 2 4 6 8 10 12 14 16 18 20
0.7
0.8
1.1
2.5
3.2
4.2
5.1
5.2
5.5
7.78.0
9.9
10.4
14.0
16.0
16.1
17.0
19.2
96%
96%
94%
87%
83%
78%
74%
73%
71%
60%
58%
49%
46%
27%
17%
16%
12%
Benchmark
Implied subsidyBased on 500 kwhaverage monthly
consumption
Source: RCREEE 2015.
Figure1.7.Industrialelectricityprices/subsidiesbenchmarkedtowestbankandGaza,2014prices
0 2 4 6 8 10 12 14
Based on 30,000 kwhaverage monthly
consumption
Implied subsidy
Price (US cents per kWh)
16 18 20
Kuwait
Qatar
Libya
Bahrain
Iraq
Saudi Arabia
Sudan
Oman
Algeria
Egypt
Syria
Lebanon
Tunisia
Yemen
UAE
Jordan
Palestine
Morocco
98%
88%
79%
77%
76%
75%
75%
74%
74%
73%
72%
53%
39%
37%
34%
2%
Benchmark
0.4
1.9
3.4
3.8
4.04.1
4.1
4.2
4.2
4.4
4.5
7.7
10.0
10.2
10.8
16.316.9
15.915.
Source: RCREEE 2015.

WO
RLD
BA
NK
GR
OU
P
40
SUMMARY
To realize the enormous potential for EE in MENA countries by 2020 and 2025 current policies need to be well implemented. A comprehensive analysis, which optimizes the uses of renewable energy alongside energy savings initiatives, would be very useful, although the development of more targeted policies will require further data, measured over a longer timeline.
The results of the analysis in this chapter indicate the increasing need for MENA countries to develop mechanisms for financing (often through domestic fi-nancial institutions) and delivery (through utilities). The delivery mechanisms must reflect the requirements of different sectors and be implemented on a wide scale. The mechanisms must also operate within an integrated framework, grounded in a strong regulatory and institutional environment, and supported by relevant financ-ing mechanisms. Finally, the successful delivery of EE must include capacity- and awareness-building initiatives and an effective information infrastructure.

De
liv
er
ing
en
er
gy
ef
fic
ien
cy
in
th
e M
iDD
le e
ast
an
D n
or
th
af
ric
a
41
stRenGthenInGtheenAblInGenvIRonMentFoReneRGyeFFICIenCy
MENA countries face rising energy demand as their economies grow. The region is projected to require more than 3 percent of GDP for investing in energy infrastruc-ture by 2030, compared with about 1 percent in most other countries (Hormann and others 2012). Some Gulf states are facing shortages during peak periods, and the gap between supply and demand is growing. Increased adoption of EE mea-sures in the MENA region could reduce energy demand by a quarter to a half in 2030, which would greatly reduce the need for energy resources to meet domestic demand.
Wide implementation of EE in MENA energy markets—with diverse market dynamics and policy frameworks—will not be easy. But many countries have faced similar hurdles in their quest for EE, and there are lessons to draw from their expe-riences. While it is unlikely MENA countries will be able to address all the barriers to EE, they must take steps that help move their economies toward lowering the intensity of energy use in sectors with the greatest potential, and assist stakeholders in institutionalizing EE.
Achieving EE goals is not easy, and countries are best able to succeed at scale when they take a portfolio approach, establishing a robust environment that mit-igates barriers and allows organizations involved in delivery to find efficient busi-ness models. There is no one “best” enabling environment or list of essential condi-tions. These vary over time and by country, sector and delivery mechanism. More than one feasible approach may exist in any given situation. Even so, a variety of enablers makes it more likely that the technical and financial activities to under-take efficiency investments will take place, even if the details vary.
The five main categories of a good enabling environment for energy efficiency are
> Policies, planning, and regulation.
> Agencies and institutions.
> Information and communication.
> Technical capacity.
> Financing and incentives.
Figure 2.1 gives examples of the possible elements in each category. Not all are necessary in all situations or in a given country. It is perfectly possible, for instance, to pursue EE without an EE law—but in many countries such a law makes it much easier to deliver EE.
2

WO
RLD
BA
NK
GR
OU
P
42
Figure2.1.elementsofanintegratedenablingenvironmentforenergyefficiency
Source: Authors.
Countries need to develop viable business models that meet the objectives of stake-holders. For instance, households facing subsidized energy prices may not be moti-vated to purchase relatively expensive EE appliances, but commercial and industri-al consumers that cross-subsidize residential consumers and pay higher tariffs may be motivated to undertake EE measures to reduce production costs. This poses a challenge for utilities that would like to increase sales to higher-paying customers and reduce sales to subsidized consumers. Governments, which bear the burden of energy subsidies, may wish to replace funding subsidies with funding EE for subsi-dized consumers. Balancing these competing and at times conflicting objectives of stakeholders will be a major challenge.
Customer financing of EE hinges on rational energy prices, which motivates customers to adopt cost-effective EE measures, but subsidized energy, as in many MENA countries, blurs that motivation. In the context of the challenges faced by MENA countries in monetizing the benefits of EE, reliance on customer-initiated implementation of EE is less likely to deliver desired results given distortive energy price subsidies. EE programs spearheaded by state agencies and utilities are likely to provide more benefits than other (private) approaches in the near to medium term. As countries reform their energy markets, the interests of stakeholders will be better aligned, and the motivation to implement EE could shift to end users.
Such a robust framework will require substantial planning and resources—and more critically, political willingness to set targets and implement EE programs. The key elements of the framework would be common to all MENA economies, but each country will have to develop its own roadmap suited to its market conditions, as are their national EE action plans.
Information and communication
Technical capacity Financing andincentives
Agencies andinstitutionsEE ENABLING ENVIRONMENT:
THE ESSENTIAL ELEMENTS
> Energy auditor/manager training and certification> Private sector training: banks, ESCOs/EE service providers, end users> EE project templates: audits, M&V plans, EPC bidding documents, contracts> Energy management systems
> Databases: –energy consumption –EE technologies –service and equipment providers –case studies> Market assessment: industry, buildings> Information centers> Broad, sustained public awareness> Labeling: appliances, equipment, vehicles
> Overarching legal framework, e.g. EE Law> Cost-reflective energy pricing> Codes and standards with enforcement mechanisms> EE incentive schemes with funding sources> EE targets by sector> Public budgeting and procurement rules to encourage EE
Policies, planningand regulations
SUCCESSFULDELIVERY OF
ENERGYEFFICIENCY
> Dedicated EE financing> Commercial bank lending: credit lines, guarantees> Cashflow-based EE financing> Commercial ESCO financing> Public sector EE financing> Residential home/appliance credit> Equipment leasing
> Dedicated entity with EE mandate> Clear roles and accountability> Inter-ministerial coordinating body> Monitoring and compliance enforcement> Authority to formulate, implement, evaluate, and report on programs> Tracking progress towards EE targets

De
liv
er
ing
en
er
gy
ef
fic
ien
cy
in
th
e M
iDD
le e
ast
an
D n
or
th
af
ric
a
43
ENABLING FRAMEWORK
Studies examining the implementation of EE in multiple countries consistently identify the need for an enabling framework. IEA (2014b) notes that policies and prices drive the EE market. In the absence of policies, ad hoc EE based on a plethora of stakeholder preferences is not a reliable way to achieve national goals. While rational energy pricing is critical to motivate stakeholders to adopt EE, other barriers such as the lack of knowledge, awareness, technology, expertise, financing, and regulation also need to be surmounted (box 2.1).
box2.1.Regulators’promotionofee
Coupled with clear policies, regulations are a principal mechanism to promote EE. Regulators in many countries, such as the United States, Brazil, India, South Africa, and Thailand, have mandated the implementation of EE by utilities, state EE agencies, and customers. They have also required utilities to treat EE as a resource to meet customer demand before they approve new generation capacity.
Integrated resource planning requires utilities to consider cost-effective EE and DSM measures, helping create a market for EE services and spawning new private businesses to run EE projects, as with the energy savings scheme in New South Wales, Australia (chapter 3). Regulators oversee the performance of utilities and gather detailed information to approve the rate basis and tariffs chargeable to customers, giving them leverage and an opportunity to promote EE.
Regulators can also promote building codes as well as standards for appliances. The key challenge here is to guarentee that they are enforced and periodically revised and updated to ensure relevance and progressively improve efficiency of energy use in the marketplace. Regulations are effective when they are consistently applied and the regulatory process is transparent and provides certainty to stakeholders.
Source: IEA 2014b.
thePolicyFramework
Formulating enabling policies is not an easy undertaking and requires strong po-litical commitment and aligning varied stakeholders’ interests. Countries also must consider competing factors to ensure the framework’s stability while periodically revising it.11 Factors that could either positively or negatively affect the develop-ment of enabling policies, include:
Country characteristics. Many developing countries with small domestic en-ergy resources may seek greater energy security or lower energy bills. In con-trast, more developed economies may be motivated by environmental issues. Developed countries do not face the same economic or fiscal challenges of less developed economies.
Resource availability. Energy resource constraints or endowments, and country energy intensity, can affect motivation for EE. While MENA coun-tries with abundant energy resources may be motivated to implement EE and reduce energy intensity so they can export more resources, energy-poor countries are motivated by energy security and the need to reduce spending on fuel imports.

WO
RLD
BA
NK
GR
OU
P
44
Political and administrative system. Centralized systems of government generally are better at formulating national policies and have control over implementation. Countries with devolved systems may have little control, which can allow local administrations to experiment with approaches suit-able to their particular circumstances.
Energy market structure—regulated or deregulated. Countries with deregu-lated markets, such as many Organization for Economic Co-operation and Development (OECD) countries, have to depend more on market-based mechanisms and regulatory mechanisms, while many developing countries with more regulated markets may be able to achieve EE goals through com-pliance-driven mandatory regulations.
Private participation. Countries with private utilities may have to take a different approach from those where most energy utilities are public and perhaps vertically integrated.
Energy prices and subsidies. Energy prices are a key driver for EE policies and regulations to be successful. In countries with subsidized energy prices, there is little customer motivation to implement EE, and policies and regu-lations may have to be developed to motivate and incentivize energy utilities and other stakeholders to undertake EE.
EE potential and targets. The estimated potential for cost-effective EE in different sectors of an economy, and the barriers to realizing this potential, greatly influence policies and regulations. It is important to establish sec-tor-specific energy demand and energy savings targets and to include incen-tives (or penalties) for achieving targets (or not).
Cost-effectiveness of programs. The cost-benefit criteria for EE programs influence EE policies and regulations. The cost-effectiveness of EE programs is typically evaluated based on a utility’s avoided cost of adding capacity, but with restructuring of the energy sector and deregulation, many utilities, especially in the United States, are now using the market price for the cost of purchased power as the basis for avoided-cost calculations (Barbose and others 2009).
Consistency with other legislation and goals. EE policies should be consis-tent with other laws and targets, including energy security goals and plans to cut emissions.
Institutionalframework
A robust enabling framework requires institutions or agencies with authority,12 good governance, and resources. One of the key aims of establishing a dedicated institutional framework for EE is to get stakeholders to define the implementa-tion mechanisms for delivering EE. A World Bank study of EE agencies in 27 countries categorized their structural, organizational, and functional elements into seven models (ESMAP 2008). A subsequent report examined how the governance of institutions affects EE implementation (Sarkar and Subbiah 2010). These stud-ies showed that, regardless of the regulatory approach to energy markets and the
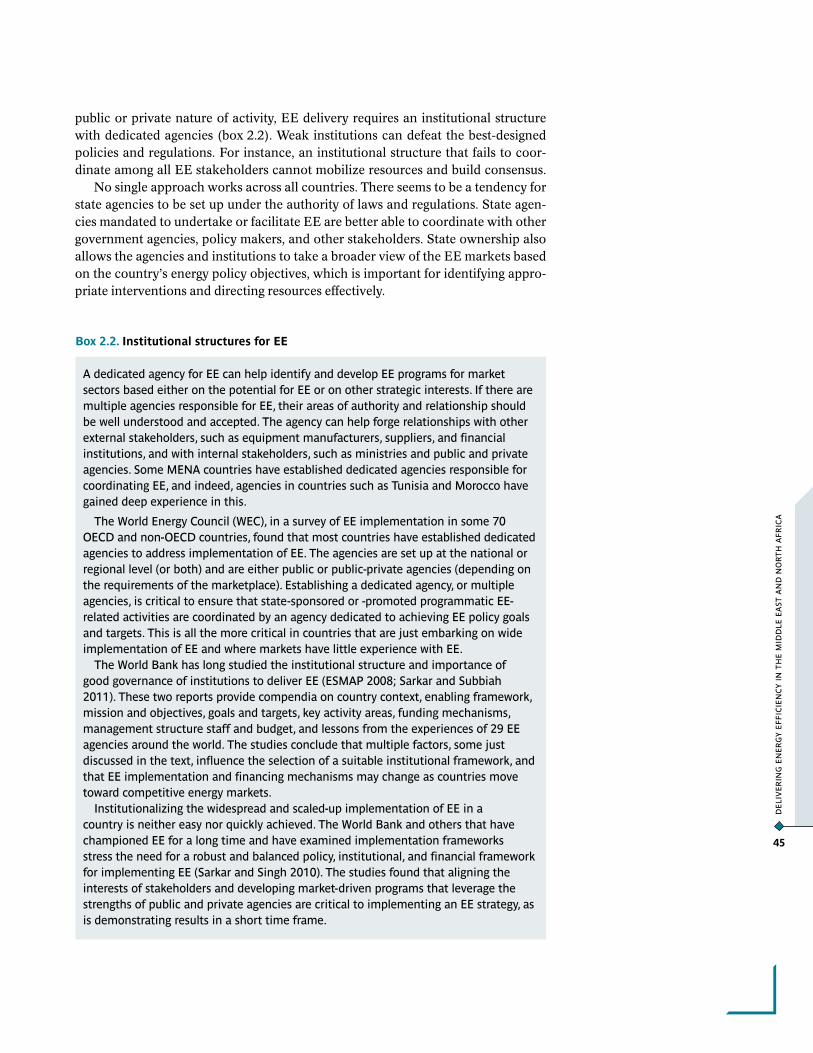
De
liv
er
ing
en
er
gy
ef
fic
ien
cy
in
th
e M
iDD
le e
ast
an
D n
or
th
af
ric
a
45
public or private nature of activity, EE delivery requires an institutional structure with dedicated agencies (box 2.2). Weak institutions can defeat the best-designed policies and regulations. For instance, an institutional structure that fails to coor-dinate among all EE stakeholders cannot mobilize resources and build consensus.
No single approach works across all countries. There seems to be a tendency for state agencies to be set up under the authority of laws and regulations. State agen-cies mandated to undertake or facilitate EE are better able to coordinate with other government agencies, policy makers, and other stakeholders. State ownership also allows the agencies and institutions to take a broader view of the EE markets based on the country’s energy policy objectives, which is important for identifying appro-priate interventions and directing resources effectively.
A dedicated agency for EE can help identify and develop EE programs for market sectors based either on the potential for EE or on other strategic interests. If there are multiple agencies responsible for EE, their areas of authority and relationship should be well understood and accepted. The agency can help forge relationships with other external stakeholders, such as equipment manufacturers, suppliers, and financial institutions, and with internal stakeholders, such as ministries and public and private agencies. Some MENA countries have established dedicated agencies responsible for coordinating EE, and indeed, agencies in countries such as Tunisia and Morocco have gained deep experience in this.
The World Energy Council (WEC), in a survey of EE implementation in some 70 OECD and non-OECD countries, found that most countries have established dedicated agencies to address implementation of EE. The agencies are set up at the national or regional level (or both) and are either public or public-private agencies (depending on the requirements of the marketplace). Establishing a dedicated agency, or multiple agencies, is critical to ensure that state-sponsored or -promoted programmatic EE-related activities are coordinated by an agency dedicated to achieving EE policy goals and targets. This is all the more critical in countries that are just embarking on wide implementation of EE and where markets have little experience with EE.
The World Bank has long studied the institutional structure and importance of good governance of institutions to deliver EE (ESMAP 2008; Sarkar and Subbiah 2011). These two reports provide compendia on country context, enabling framework, mission and objectives, goals and targets, key activity areas, funding mechanisms, management structure staff and budget, and lessons from the experiences of 29 EE agencies around the world. The studies conclude that multiple factors, some just discussed in the text, influence the selection of a suitable institutional framework, and that EE implementation and financing mechanisms may change as countries move toward competitive energy markets.
Institutionalizing the widespread and scaled-up implementation of EE in a country is neither easy nor quickly achieved. The World Bank and others that have championed EE for a long time and have examined implementation frameworks stress the need for a robust and balanced policy, institutional, and financial framework for implementing EE (Sarkar and Singh 2010). The studies found that aligning the interests of stakeholders and developing market-driven programs that leverage the strengths of public and private agencies are critical to implementing an EE strategy, as is demonstrating results in a short time frame.
box2.2.Institutionalstructuresforee

WO
RLD
BA
NK
GR
OU
P
46
Monitoring,reporting,andverifying
Reliable monitoring, reporting, and verifying systems are essential for meeting EE policy goals. As many developing countries have weak systems, it may be best for them to use internationally recognized systems such as the IPMVP, adapting them as necessary. It is common for such countries to have independent third-party eval-uation of EE programs. One of the first steps, however, is to put in place smart me-tering systems to gather data on energy use and monitor energy savings. Once again, energy utilities are well positioned to do this. Data from individual EE projects may then be collated at program level by utilities or public-sector EE agencies to track progress toward EE targets. Utilities or EE agencies should also conduct customer load surveys to understand energy consumption patterns over a day and seasonally. Data analysis may be conducted for a sector as a whole or for individual end uses.
Capacitybuilding
Capacity building and training should be an integral part of an enabling frame-work, and should target all principal stakeholders, including policy makers, EE agencies, utilities, energy service companies (ESCOs), appliance manufacturers and vendors, and financial institutions. The focus should be on building their long-term capacity to ensure that they can undertake EE programs sustainably. Customer awareness and education programs are equally important.
FINANCING MECHANISMS FOR EE PROGRAMS
Financing is one of the main barriers to wide implementation of EE, especially in developing countries with inadequate public funds and little access to commercial financing. Yet regardless of economic and structural differences among countries, multiple approaches that combine public and commercial financing, as well as fiscal and economic incentives, are crucial. The financing mechanisms must be further matched to the needs of end-use sectors—one appropriate for industry may not work for the services or residential sectors.
The implementation mechanisms for deploying EE will also to an extent dic-tate the financing mechanism best suited for an end-use sector—for instance, while utility-driven EE programs can leverage the ability of utilities to finance programs through the rate basis (which may increase rates for all or a segment of customers), programs targeting low-income households may need a different approach. In the long run, as markets mature, commercial financing options are critical to create a sustainable market for EE services (figure 2.2). The advantages and disadvantages of various financing mechanisms, public and commercial, are in table 2.1.
Figure2.2.energyefficiencyfinancingladder
Source: Authors.
Investment Subsidies
Fiscal Incentives
EE Funds
Concessional loans
Lines of Credit
Revolving Funds
Risk Mitigation Products
ESCO Financing
Utility Financing
Customer Financing
MarketMaturity
CommercialFinancing
PublicFinancing
PU
BLI
C E
E FI
NA
NC
ING
LA
DD
ER

De
liv
er
ing
en
er
gy
ef
fic
ien
cy
in
th
e M
iDD
le e
ast
an
D n
or
th
af
ric
a
47
table2.1.Prosandconsofselectedfinancingmechanisms
Financingmechanism Application Advantages disadvantages
Pu
blI
CF
InA
nC
InG
Investmentsubsidies
Direct subsidies to customers or manufacturers to lower the appliance purchase or cost of production or to promote research and development.
Stimulates market demand by lowering first cost, and can help achieve market transformation.
Can distort market pricing. Appliance sales may go down when subsidy is phased out.
Fiscalincentives
Provides tax incentives such as tax rebates on EE equipment, import duty concessions, tax holidays, tax credits, and accelerated depreciation for purchase of EE appliances.
Reduces the cost of installing EE appliances. Better option than direct subsidies.
Tax incentives need effective tax collection systems.
eefunds
Dedicated EE fund to finance EE projects. Funded through public finance and/or MDB and donor funds.
Ideal for countries with weak banking systems. Financing can be a grant or loan.
Does not help create a sustainable financing mechanism for EE. Needs strong and transparent fund management.
Concessionalloans
Provides concessional finance for EE in countries with low market capitalization, high cost of financing, and/or short loan tenors.
Can stimulate financing for EE if on-lent through local FIs with a requirement to leverage additional commercial capital. Can help local FIs develop experience with EE.
Can distort market financing terms. Commercial financing may not take place after concessional terms are withdrawn. Works only in countries with functional banking systems.
linesofcredit
Provides line of credit to commercial FIs to finance EE at concessional or market terms.
Can incentivize local FIs to finance EE and gain experience leading to sustainable commercial financing mechanisms.
Commercial financing may not take place after the credit line is exhausted or concessional terms are withdrawn. Works only in countries with functional banking systems.
Revolvingfunds
Similar to concessional loans or line-of-credit, provides a source of funds in countries with illiquid capital markets.
Funds leveraged with commercial financing can sustain operations. Can incentivize local FIs to finance EE and gain experience leading to sustainable commercial financing mechanisms.
Works only in countries with functional banking systems.
Riskmitigationproducts
Lowers the risk of financing EE projects through first-loss facilities, partial loan guarantees, etc.
Reduces real and perceived risks of EE. Helps local FIs build capacity and establish commercial EE financing.
Works only in countries with functional banking systems. Additional fee adds to cost of financing.
PR
IvA
te
FIn
An
CIn
G
esCofinancing
Finances EE through guaranteed-savings or shared-savings contract.
Financing can be channeled through ESCOs (shared savings) or through customers (guaranteed savings). Lowers performance risk.
FIs often reluctant to finance ESCOs, which may lack credit history or adequate collateral for traditional banking operations. ESCOs work better with strong enabling environments.
utilityfinancing
Finances EE installation—financing could be through grants, customer charges, concessional financing or commercial financing.
Uses utilities’ relationship with customers. Allows repayment in installments through customer bills.
Utilities reluctant to engage in financing operations. Repayment systems add complexity to billing.
Customerfinancing
Traditional financing of projects.
Customer finances cost-effective projects through normal credit and debt channels of financing.
Customers rarely take on debt for EE projects. Cost-reflective energy prices and attractive financing terms.
Source: Authors.

WO
RLD
BA
NK
GR
OU
P
48
Publicfinancing
Public financing was an early driver for EE programs and has stimulated demand in many countries. It can involve direct investment subsidies from the government budget, fiscal incentives (including tax and duty rebates), and other concessional mechanisms.
Investment subsidies. Direct subsidies generally aim at specific customer segments and specific EE technologies or appliances and serve as a temporary measure to stimulate demand or expand penetration in the marketplace. Subsidies may also be given to equipment manufacturers to lower the cost of production or to promote research and development. They may be developed in conjunction with specialized funds such as guarantee funds or revolving funds that seek to lower the cost of financing.
The World Energy Council (WEC) (2013) notes that many OECD countries introduced investment subsidies in the 1980s to help customers retrofit old equip-ment and buildings. Subsidies were also provided to manufacturers of efficient equipment. These early subsidy programs generally benefited large clients, failing to promote investments among medium and small industries and households. Indeed, large clients may not have needed subsidies anyway (i.e. receiving program benefits without actually needing them in order to change behavior, or “free riding,” which programs should be designed to forestall). But countries learned, revising the sub-sidy programs to prevent abuse and to target customers needing them most.
Subsidies should be targeted in two ways: (1) to specific EE technologies, to promote investments that can alter customer behavior (demand or energy use) and bring cost-effective benefits to customers and utilities, and (2) to constrained cus-tomer segments that need the subsidies the most. Subsidies should also be tempo-rary, initially promoting customer or manufacturer investments in EE and lowering the cost of EE technologies in the long run, and then being phased out.
Fiscal incentives. These seek to reduce the cost of financing EE programs through, for example, tax rebates on EE equipment, import duty concessions, tax holidays, tax credits for households, and accelerated depreciation for commercial and in-dustrial customers on EE appliance purchases. Such incentives lower the cost of investing in EE and improve the rate of return.
Many countries provide import duty or sales tax concessions for buying EE ap-pliances such as compact fluorescent lamps (CFLs), which used to be very expen-sive (WEC 2013). Tax rebates and credits for such purchases are widely used in developed and developing countries. Fiscal incentives typically cost less than direct subsidies and are less subject to abuse, but require robust tax collection systems. Em-pirical evidence of the fiscal impacts of such programs is sparse, but suggests positive outcomes. A study of public funding for wall insulation retrofits in the UK found evidence of strong net benefits to government finances (Rosenow and others 2014).
EE funds, concessional loans, lines of credit, revolving funds and risk mitigation products. In many developing countries, commercial financial markets are less de-veloped and financing is scarce or expensive. To overcome this hurdle, customers could obtain favorable loans to promote investments in EE. Concessions could lower the interest rates or offer longer loan-repayment periods and make low-er-cost financing available to customers. Customers would, however, still have to meet the due diligence requirements of the financial institutions.

De
liv
er
ing
en
er
gy
ef
fic
ien
cy
in
th
e M
iDD
le e
ast
an
D n
or
th
af
ric
a
49
Commercial financial markets in developing countries often lack capital, and banks prefer to lend on large projects and against collateral requirements too onerous for many small customers. Concessions could thus also be targeted at the commercial banks to incentivize them to make financing available for smaller proj-ects—typical of EE projects—and lower their risk of default. Lower-cost credit lines, first-loss facilities, and dedicated EE funds can help reduce the cost of financing for commercial banks.
The benefit of shifting the subsidy or incentive scheme from the customer to commercial banks is that it leverages the strength of financial institutions that can conduct due diligence, and can appraise projects and customers’ eligibility for fi-nancing, lowering the potential for default. In the longer run, it is desirable to strengthen and incentivize financial players to support investments in EE. But as with all incentives and subsidies, programs should be designed with a clear exit so banks do not just depend on concessions to extend financing for EE (which can distort financial markets), but develop a portfolio of EE projects on their own as they gain experience.
The World Bank/IFC, European Bank for Reconstruction and Development, Asian Development Bank, and other multilateral development banks (MDBs) and national agencies have developed financing instruments to support commercial banks in financing EE through lines of credit, revolving funds, risk mitigation prod-ucts, and other financial mechanisms.
PrivateFinancing
ESCO financing
In many countries, ESCOs are integral to EE delivery, providing cost-effective commercial EE programs more sustainably than is possible through subsidies or concessional financing (which are more appropriate at earlier stages of building markets). ESCOs make money through shared-savings or guaranteed-savings contracts for projects financed in a variety of ways. An ESCO, for example, may provide an energy savings guarantee that the customer may use as collateral to se-cure a commercial project loan. The energy savings guarantee agreement from the ESCO serves to demonstrate to the bank that project cash flow will be sufficient to cover debt repayment. The ESCO guarantee contract lowers the bank’s view of the risk, and may even help in negotiating a lower interest rate.
The earliest model of ESCO financing required the ESCO to borrow funds. This approach lowers the financial risk to the customer since the debt resides on the ES-COs balance sheet. Customers pay in accordance with the terms of the performance contract and can benefit by treating payments as operational expenses, which may have positive tax implications and not affect customers’ borrowing capacity. ESCOs could finance projects from their own equity, but this would limit their ability to fi-nance multiple projects simultaneously, confining the scale of their activities.
ESCOs typically obtain financing from commercial banks and structure perfor-mance contracts to ensure that they obtain an adequate return on their investment. Financing through commercial banks can, however, be expensive, especially in de-veloping countries where the markets have low liquidity and the cost of financing is high. Even more challenging are short loans in many developing countries, where typical repayment periods are three to five years, less than a performance contract. So even if the return on investment in the EE project is high, commercial financing

WO
RLD
BA
NK
GR
OU
P
50
may not be an option, especially where tariffs do not reflect costs. Another chal-lenge in developing countries is that few commercial banks provide project finance loans, where projected cash flow serves as collateral. Instead, banks usually require fixed collateral for a large proportion of the loan amount, limiting the ESCO’s abil-ity to finance multiple projects.
ESCOs in developing countries may thus need access to financing from other sources, such as public funds, dedicated EE funds, IFIs, and donor agencies. Public agencies and IFIs may support commercial banks through credit lines or revolving funds and risk mitigation products, which help lower the cost of financing. Utilities can also finance ESCOs. However, these are interim sources of financing that can stimulate the demand for ESCOs and help stakeholders gain experience in the ESCO model.
In the long term, sustainability of ESCOs typically requires that they seek fi-nancing from commercial banks, which in turn assumes a high degree of liquidity in commercial markets and a stable, predictable enabling environment.
Utility financing
Energy utilities may be involved in financing EE projects through multiple ties (figure 2.3 — not all of the typical elements depicted in the chart are present in every scheme).
Figure2.3.typicalelementsinutilityfinancingofee
Source: Authors.
The United States was one of the earliest countries to require utilities to implement EE measures (Allen and Crossley 2014). Utilities in countries such as the United States, Australia, Brazil, and South Africa have run EE programs with financing
Regulatory Agency
Regulated charge
Optionalloan and
repayment
Optional financing
Technical assistance
Regulatorycompliance
LoanBilateralgrants
Reporting
Technical assistance
Utility
LocalFinancingInstitution
IntermediaryFinancingInstitution
PublicFinance
Government
MDB/DonorAgency
CustomerBenefits Charge
CustomerESCO
Loan/Grant financing & EE projectimplementation services
Payment in installment through customer billsLoan repayment/program cost recovery
Revolving fund
Line-of-credit
Grants
On-lending of funds/Repayment

De
liv
er
ing
en
er
gy
ef
fic
ien
cy
in
th
e M
iDD
le e
ast
an
D n
or
th
af
ric
a
51
from customers through, for example, a public benefit charge or otherwise in-creased customer tariffs (see box 2.1). Such systems require tight regulations and strict enforcement.
Utility-driven EE programs are one of the best approaches in countries where customers have low motivation to implement EE. Such programs can channel incentives and rebates, leverage commercial financing and private sector partic-ipation, and recover costs through customer billing systems. Public EE agencies and utilities can leverage the strengths of ESCOs to ensure that only cost-effective programs are funded based on guaranteed performance targets. In countries with more developed financial markets, commercial financing and ratepayer-funded programs, coupled with fiscal and economic incentives, may be a better approach to financing EE.
DELIVERY MECHANISMS
The main issues in developing a country’s EE delivery mechanism include ener-gy savings targets, the savings objective (peak load or energy, or both), resourc-es needed, source of funding, customer sectors targeted, types of programs and cost-effectiveness, incentives to be provided and program cost recovery.
utilitydeliveryofenergyefficiency
Utilities are an obvious candidate to deliver long-term EE programs in the market-place given their role as energy providers, their technical knowledge and trained human resources and their relationship with customers—the end-users of energy. (Appendix 2 expands on these points.) Utilities, while keen on increasing revenues through more sales, also are eager to lower the cost of supplying energy and to reduce the need for investments in new generation, transmission and distribution capacity. Wide implementation of EE provides that opportunity. In countries with subsidized energy prices and a rapidly growing demand for energy, the motivation for utilities to undertake EE would be stronger in saving both capacity and energy.
Utility-driven programs can target large numbers of customers and help create a market for EE, which in turn may spawn new business opportunities. Such pro-grams are generally funded by ratepayers through a surcharge on utility bills. Because regulated utilities are required to provide detailed data and reports on operational performance and spending, there is a high level of transparency and reliability in the spending and benefits of implementing EE programs. As most utilities in the MENA region are state owned, the monetary benefits of EE also accrue to the state. Further benefits include reduced greenhouse gas emissions, improved health and well-being of populations, and wider energy access in resource-poor countries.
Yet utility-driven EE programs will not sprout automatically: they require a poli-cy, regulatory, and institutional framework and an energy-price tariff that reflects the cost of supplying energy (IEA 2013b). Subsidized electricity prices in several MENA countries are a challenge to customer uptake of EE. Without price reforms, innova-tive financing mechanisms and incentives will have to motivate customers (box 2.3). The utility stands to realize greater benefits, however, because EE will reduce the implicit subsidy burden. The lack of customer motivation to invest in EE also ripples through and can affect the availability of EE equipment in the marketplace.
WO
RLD
BA
NK
GR
OU
P
52
box2.3.ReformingenergypricesandsubsidiesinChina
MENA countries greatly subsidize energy prices (see chapter 1), raising government expenditures, encouraging wasteful energy use, and discouraging private EE investment. IMF (2014) identified multiple barriers to subsidy reform, including political unwillingness to redact subsidies, affordability of energy among poor customers, and lack of information on the cost of subsidies to the economy.
Reducing subsidies can reallocate resources to other productive needs that help the economy grow. Social safety nets can ensure that the poor do not face market-based energy prices. The reform of energy subsidies is thus likely to have a net positive impact on the economies of MENA countries. IMF (2014) recommends that countries consult stakeholders widely and draft a detailed roadmap, which includes a comprehensive energy reform plan, a phased increase in prices, improved EE to reduce the burden of subsidies, social safety nets for the energy and income poor, independent price setting without political interference, and a clear communication strategy.
China is well known for its success over the past three decades in improving EE across sectors, allowing its economy to grow much more quickly than its overall demand for energy. At the same time, the country has also gradually reformed its planned energy pricing system, starting with a two-tiered approach in the 1980s whereby a portion of coal was sold at market prices, while the remainder was sold at regulated prices according to state-supervised contracts. The liberalization that began with coal now covers oil products, such that prices for oil products now follow international prices with mechanisms to limit the amplitude and rapidity of price swings. A few exceptions remain, such as subsidies for fuel used in agricultural activities, but motor fuel prices are relatively cost-reflective. Natural gas prices have begun to change as well, in response to the need to pay for large new supplies of more expensive domestic and imported gas. But electricity prices have proven much more difficult to change, and they are one of the strongest remaining points of direct government intervention in the economy.
Thanks to these changes, the IEA (2014e) estimates that overall energy subsidies fell by nearly 40 percent just from 2011 to 2013.
There are limits, however, to the benefits of partial reforms of energy prices. In China, government controls on coal prices began in the 1980s, and nearly all coal now is sold at market-determined prices. At the same time, however, progress in reforming tariffs of electricity, the great majority of which comes from coal-fired power plants, has been very limited. Electricity prices remain highly controlled, effectively forcing implicit subsidization of generators, many of which operate at financial losses (Zhao and Ortolano, 2010). The resulting financial difficulties have hindered investments by generators in EE projects that would otherwise have the potential to lower their fuel costs and improve their financial position. While the benefits of electricity price reform are many, there is strong reluctance to proceed on a number of grounds, including perennial concerns about inflationary impacts and compounding of the current financial difficulties of China’s struggling industrial sector, the country’s biggest electricity user.

De
liv
er
ing
en
er
gy
ef
fic
ien
cy
in
th
e M
iDD
le e
ast
an
D n
or
th
af
ric
a
53
businessmodels
Business models (and implementing organizations) should reflect the country’s or region’s macroeconomic conditions, energy market characteristics, and customer income segments.
Developing business models in developing countries can be especially challeng-ing. As one study observed, “in developing countries, market information is scarce, physical infrastructure such as roads are often poor, and legal frameworks and enforcement mechanisms are unreliable. Furthermore, low-income customers in these areas lack information, and service providers able to organize anything from financial transactions to logistics may not exist. In short, the cost of doing business in low-income markets is typically high. At the same time, low-income households have a very limited budget for spending on energy, and find it difficult to make high up-front investments due to the high cost of and limited access to credit” (Gradl and Knobloch 2011).
Of course, business models are inseparable from the organizations that employ them to deliver efficiency to end-users. These organizations may be public-sector agencies (as in most MENA countries) or private ESCOs. Building developers and contractors are crucial to ensuring the success of energy standards, while oper-ations and maintenance contractors are essential to ensuring that performance meets design criteria. Manufacturers and suppliers of appliances, equipment, and vehicles can also deliver more efficient devices to end users.
Some of the other critical stakeholders include NGOs, the commercial finan-cial institutions, and trade associations representing customers and equipment sup-pliers. These additional stakeholders can support customers and policy makers to build capacity and awareness in the marketplace.
IMPLEMENTATION MECHANISMS FOR THE THREE PRIORITY SECTORS: INDUSTRY, SERVICES, AND RESIDENTIAL
The EE implementation mechanisms must serve the three priority end-use sectors.
Industry
Energy prices here are generally not subsidized and customers are motivated to reduce operational costs. Utilities and service providers such as ESCOs are well-suited to undertake EE programs because industry needs specialized knowl-edge, technical expertise, and trained personnel. Utilities, with their knowledge of customer-demand patterns, can identify EE opportunities that benefit customers and the utility. Public-sector EE agencies rarely have the expertise to undertake EE in this sector, but can serve as facilitators and support implementing agencies in accessing resources and incentives.
services
Customers’ motivation for EE in this sector (comprising both commercial and public services) depends on energy prices and their energy spending. Few prices for commercial customers are subsidized, but energy bills may constitute only a small portion of their operating costs. Public customers are also seldom motivat-ed because their energy costs are part of fixed budgetary allocations. Long-term improvements in the efficiency of buildings in the services sector—including pub-

WO
RLD
BA
NK
GR
OU
P
54
lic and commercial buildings, schools and hospitals—often occur through building codes and standards and through appliance performance standards, whether for new or existing buildings.
Compliance with regulations accounts for an estimated two-fifths of EE mea-sures in Europe, and three-fifths of countries surveyed globally (WEC 2008) have established mandatory or voluntary new-building codes. In the short term, ESCOs and utilities can undertake energy audits to identify retrofit options for reducing energy use in buildings. Utilities and ESCOs are also well suited to undertake EE in street lighting and public services such as water pumping, where end users general-ly lack technical expertise and are not motivated to lower operational costs. Public sector agencies can monitor compliance to ensure that EE program goals are met and to undertake customer education programs.
Residential
This diverse sector, with multiple consumer preferences and motivations, is the most challenging, especially in countries where energy prices are subsidized. Reg-ulations could target the development of appliance labeling and performance stan-dards. While labeling promotes voluntary actions, performance standards enforce minimum efficiency standards. Regulations can also phase out inefficient equip-ment such as incandescent lamps in the residential and other sectors. Utilities are well suited to undertake lighting retrofits and weatherization programs (insulation for facilities, for example) in the residential sector, given their relationship to the customer and their ability to charge customers through utility bills. Public agencies are well suited to monitor programs and to undertake customer awareness and education programs, critical for implementing programs in the residential sector.

De
liv
er
ing
en
er
gy
ef
fic
ien
cy
in
th
e M
iDD
le e
ast
an
D n
or
th
af
ric
a
55
GlobAlexPeRIenCeInFInAnCInGAnddelIveRInGeneRGyeFFICIenCy
As discussed in chapter 2, effective implementation of EE measures faces sever-al hurdles, including lack of financing support (or its high cost), lack of scalable implementation mechanisms, lack of enabling (policy, regulatory, and institutional) environments, subsidized energy prices, market imperfections, and lack of consumer awareness of benefits. Few of these constraints are unique to developing countries.
This chapter focuses on a diverse range of countries for the first two encum-brances, where domestic financial institutions (primarily commercial banks) and utilities (energy providers) have played a large role in scaling up EE investments. MENA countries may be able to draw on this experience as they embark on their own programs at scale.
A broad range of mechanisms can finance EE—public financing through budget allocations, dedicated EE funds or a customer charge to financial incentives such as tax credits and rebates, investment subsidies, concessional loans, credit lines, first-loss and risk mitigation and guarantee facilities, and commercial financing from capital markets and consumer financing (see chapter 2).
A wide mix of options can meet the specific requirements of different custom-er segments that may have different motivations to implement EE. For instance, large industrial consumers are knowledgeable about EE opportunities, pay higher energy prices, and may be able to directly finance EE or finance projects through commercial financial institutions. In contrast, small and medium industries may not have enough income or free cash flow to commercially finance EE projects and may require additional funding from elsewhere. Customers in the services sector range from private consumers that own and operate commercial buildings and hospitals to publicly owned facilities, schools, hospitals, and systems for street lighting and water pumping. While private consumers may need financing similar to that required by small and medium industries, public clients generally depend entirely on budgetary allocations for EE investment. Residential customers seek private and public financing depending on consumption level, energy prices, cost of financing, and investments required.
Utilities in the MENA region have considerable ability to support EE, as they are largely state owned and are generally the only providers of energy to end users. They are responsible for planning procurement of resources to meet customer en-ergy demand for efficiently and cost-effectively meeting energy demand in markets that subsidize energy prices. In MENA countries that import energy resources, util-
3

WO
RLD
BA
NK
GR
OU
P
56
ities have the most interest in restraining energy demand to reduce the import of expensive fuels, improve energy security and reduce subsidies. In MENA countries that are resource-rich and subsidize energy prices, utility producers have an incen-tive to reduce energy demand to free resources for more profitable exports. Utilities are also aware of energy-demand patterns among the customers they serve. They can also target EE improvements in energy production itself, a significant source of energy savings.
Utilities can provide technical expertise and access to trained human resources to plan and implement EE programs, to provide improved market surveillance and capacity to enforce EE policies, and to use their revenues to make EE investments. Globally, utilities have been important in improving the efficiency of energy use: in 2011 utilities spent almost $12 billion on energy saving initiatives (IEA 2013a).
COMMERCIAL FINANCIAL INSTITUTIONS
IEA (2014b) estimates that investment in EE markets worldwide in 2012 was $310 billion–$360 billion.13 New financing mechanisms and products are developing to meet the demand of diverse energy markets, increasingly with the participation of domestic finance institutions (mainly commercial banks) that have generally been risk averse to financing EE. The IEA reports that this could in part be due to the large amounts of public finance available for EE. Green investment banks capital-ized with public funds are more able to leverage commercial funds from local and global sources. IEA notes that “EE is a target sector for finance in [green invest-ment banks] established in the United Kingdom, Malaysia, South Africa, Australia, Japan, the United Arab Emirates, and the United States.”14
But many perceive financing EE as risky due to uncertain policy and regulato-ry frameworks, subsidized energy prices, high transaction costs, cost of monitor-ing and verification, and the absence of project-specific cash flows, which hinders project finance models for EE and moves the commercial banks toward greater reliance on traditional collateral-based financing. The small size of EE projects also hinders securitization of loans, a standard practice for commercial banks to leverage additional funds and mitigate risks in capital markets.
EE projects most commonly have self-financing or commercial loans (IEA 2014a). Financing ranges from customer-financed projects to public loan programs, which use tax revenues or other funds either to provide direct funds for projects or to finance rebates and incentives. Loans encompass a variety of financing mod-els, including direct customer loans, ESCO financing, utility on-bill financing, and equipment leases or mortgages. A primary hurdle to commercial bank financing of EE projects is their size, especially in the small and medium industrial and com-mercial sector and in the residential sector, which entails high costs for project due diligence and monitoring. Developmental banks in developing countries have played an important role in financing EE: examples include Sri Lanka and Bangla-desh, where public-sector development has taken the lead in developing financial products for EE investment, usually aided by funds from MDBs that have provided partial-risk loan guarantees, revolving funds, credit lines, and, somewhat different-ly, ESCO financing.15
Partial-risk loan guarantee programs. Supported by MDBs, these can create a mar-ket for financing EE by mitigating some of the risk perceived by local financial

De
liv
er
ing
en
er
gy
ef
fic
ien
cy
in
th
e M
iDD
le e
ast
an
D n
or
th
af
ric
a
57
institutions. However, the World Bank has found that loan guarantee programs work only in countries with a functional banking system and liquidity in local financial markets (Taylor and others 2008). Loan guarantee programs do not absolve cus-tomers from meeting normal bank credit, due diligence and loan security require-ments. Two successful EE loan guarantee programs are the Global Environment Fa-cility (GEF)/IFC Hungary Energy Efficiency Co-Financing Program, and the China ESCO Partial Loan Guarantee Program, both of which have been operational for several years (box 3.1). The Hungarian program, launched in 1997, has catalyzed EE lending through Hungarian commercial banks. The Chinese program, launched in 2003, has successfully backed ESCO EE investment projects. While the objectives of the two programs are different, both have worked closely with local financial institu-tions and supported them with capacity-building programs.
Revolving funds. The establishment of a dedicated revolving fund with conces-sional terms such as low or blended interest rates and longer loan tenors to finance EE has also been effective in countries with functional banking systems. Revolving funds may be established with local financial institutions, such as the program with IREDA (Indian Renewable Energy Development Agency—see box 3.1), or de-veloped as a separate legal entity with accountable and transparent governance structures. The Romanian Energy Efficiency Fund and the Bulgarian Energy Effi-ciency Fund are two examples. Independent fund structures are a good option in countries with weak local banking systems.
Development banks are also commonly used to package and offer special loan funds for EE projects. Often development banks have a mandate to promote proj-ects in the national interest and can pioneer financial products for EE, which com-mercial banks can then replicate on a larger scale.
Lines of credit. These may target industrial projects, as with the World Bank–sup-ported line of credit program for industrial EE and cogeneration in Tunisia, and the SME EE loan programs developed by Indian Banks.16 Where institutions are relatively well developed, it is also possible to target lines of credit at building EE, as with the residential building program in Lithuania.
While many of the aforementioned EE loan funds and loan guarantee funds have been successful, they have not always led to the establishment of a sustainable mechanism for expanded commercial bank lending. The unique feature of credit lines is their use of an existing delivery mechanism: the lending framework of the participating financial institution (Sarkar and others 2014).
It is thus critical to develop delivery mechanisms aligned with local financial markets and institutions and with the commercial objectives of local financial insti-tutions. The World Bank has incorporated these lessons in its support for financing EE and has collaborated with financial intermediaries—for example, in its Indian SME bank lending programs and lending programs planned in China and Brazil. The IFC is also designing programs with local financial institutions and lending strategies to motivate banks to create new lending portfolios for EE. Local financial institutions that benefit from concessional finance, lines of credit, or risk mitigation packages get incentives for meeting EE lending targets—for example, in the line of credit provided by the European Bank for Reconstruction and Development to Bulgaria. Technical assistance in risk management techniques, project evaluation, and financial due diligence is an integral part of support financial intermediaries.
Other successful dedicated EE funds include the Korea Energy Conservation

WO
RLD
BA
NK
GR
OU
P
58
Fund, established in the Republic of Korea in 1980 to promote EE through low-in-terest loans, the ENCON Fund established in Thailand in 1992 with a levy on petroleum products, and the Energy Conservation Fund, established in Sri Lanka in 2007. Several State Energy Conservation Funds are in India, starting with a Fund in the state of Kerala in 2010 (Wang and others 2013).
Commercial banks’ reasons for financing EE vary widely and depend on na-tional and sectoral circumstances. UNEP surveyed 16 public and private financial institutions in Europe, India, Japan, South Africa, the United States, and sever-al MDBs to understand their approaches and motivation, as well as the policies and regulations that influenced their decisions (Hamilton and others 2009). They found that public banks typically provide low-interest loans for EE with their own funds or by channeling funds from MDBs, provide technical assistance to clients to undertake due diligence of EE projects, develop risk mitigation options such as partial-risk guarantees, support government efforts, and contribute to innovative mechanisms such as carbon financing.
Interested mainly in providing commercial financial services, commercial banks also see EE financing as a growing market that serves clean energy and en-vironmental policies, but they may have no internal mandates to build EE lending portfolios. UNEP found, for example, that while Nedbank in South Africa and Yes Bank in India both operate in countries that would benefit from more EE, they are restricted to commercial banking products and make financing available only to the most creditworthy clients. Yes Bank developed an EE lending facility for off-balance-sheet activities such as ESCO financing, but there was little uptake, as the ESCO market was immature in India. One of the more innovative private financial institutions surveyed, EPS Capital, finances EE in Mexico and China, taking a dif-ferent approach in each (box 3.1).
box3.1.Globalexamplesofcommercialfinancingforee
hungaryenergyefficiencyCo-FinancingProgram )heeCP(.Developed in 1997 by the IFC, the GEF, and local financial institutions (FIs) as a sustainable commercial mechanism for financing EE investments, the program, which ran until 2005, included a partial risk guarantee mechanism and technical assistance to Hungarian FIs and project developers. Guarantee mechanisms for individual projects within the portfolio are in effect. Local FIs originated and structured transactions and performed due diligence and credit analysis, while the IFC provided the partial risk guarantee. The preferred borrowers were ESCOs, leasing companies, and service providers who could bundle individual EE projects. Performance guarantees from ESCO helped mitigate performance risks.
HEECP consisted of three phases. In the first phase, two FIs participated and received $5 million of GEF financing. In the second phase, six local FIs participated and received $12 million from the IFC, while GEF contributed an additional $0.7 million for technical assistance. The third phase provided loan guarantees.
By the end of 2006, 331 EE projects worth $93 million were supported from the $55 million loan portfolio that HEECP supported with $17 million of guarantees. No guarantees were called. The facility was later expanded with additional service offerings and FIs. The program demonstrated reduced transaction costs and aided the expansion of EE financing. Mature financial markets and banking systems, along with adequate liquidity, attractive interest rates, and competition among local FIs, are essential for such a program to succeed. The program took over six months to develop and another two years for the products to be used (Wang and others 2013).

De
liv
er
ing
en
er
gy
ef
fic
ien
cy
in
th
e M
iDD
le e
ast
an
D n
or
th
af
ric
a
59
ChinaesColoanGuaranteeProgram.This program began in 2003 to help ESCOs obtain financing for implementing EE projects in China. The objective of this $26 million World Bank/GEF program was to enable ESCO financing; not to develop a wider market for EE financing. The partial loan guarantee program stimulates local FIs to promote financing for ESCOs providing performance guarantees. GEF funds were disbursed into a Guarantee Program Special Fund account held by China’s Ministry of Finance. I&G, the guarantee company, was able to use the facility to issue irrevocable loan guarantee agreements. The fund was also used to pay fund management fees and subrogation payments.
I&G operated the ESCO Loan Guarantee Program consistent with standard guarantee practices in China. The program provided 90 percent loan guarantees given the risk perceived by local FI(s) for ESCO financing. I&G developed project assessment and appraisal procedures with the approval of the World Bank/GEF, and developed a team of full-time staff for conducting due diligence and program operations. I&G also developed credit assessment methodologies for financing ESCOs with technical assistance from the World Bank.
Over three years through 2006, I&G issued 85 ESCO loan guarantees, totaling $32.1 million. The guarantees were provided to 29 ESCOs and mobilized commercial loans from 11 Chinese banks totaling $35.6 million and supported total investments of $57.2 million. The program helped less established ESCOs access commercial financing and develop (mature ESCOs did not require the guarantee program). The use of a local guarantee company was critical for the program’s credibility and success (Wang and others 2013).
IndianRenewableenergydevelopmentAgency)IRedA(eeloanFund.IREDA is a non-bank institution that finances EE projects and new and renewable energy supplies. The World Bank extended a line of credit and GEF grant to IREDA in 2001. IBRD and IDA lent funds to private FIs at commercial rates. The GEF grant supported technical assistance and capacity building. IREDA approved 19 projects totaling $60 million. The typical project size was $4 million, but IREDA also financed projects as small as $200,000 for efficient equipment.
IREDA offered a variety of financing terms (interest rates from 8 percent to 11.5 percent) and tenors (six to 10 years), covering up to 70 percent of ESCO project costs and 80 percent of EE equipment costs. The agency offered a rebate of 1–1.5 percent on the provision of bank guarantees, but standard security packages common in commercial banking in India were required of borrowers. Terms included support for energy audits and preparation of detailed project reports.
IREDA offered strong expertise in project evaluation, a demonstrated record of financing projects with a large loan portfolio, credibility in the market, and a large client relationship network. On the other hand, the program entailed long procedures, little flexibility in changing to meet market needs, high cost of capital in local markets, and high competition with local FIs as financing terms improved in the capital markets. It was also difficult to turn the initial project pipeline into a loan portfolio. This program showed that high levels of investment can be achieved through large, specialized, parastatal FIs, but that loan processes can also be a drag as the market for EE financing matures (Wang and others 2013).
ePsCapitalCorpinMexicoandChina.A program to support financing for ESCOs in the two countries. Both countries lacked adequate local commercial financing for EE projects. Local FIs did not understand EE project cash flow and perceived financing risks to be high. Loan tenors were also short, typically three years, which was inadequate for EE projects.
EPS Capital trained local FIs in Mexico on evaluating projects and helped FIs understand the ESCO performance models. EPS Capital Corp worked with the Mexican Development Bank on developing guarantee products to mitigate the risks perceived by local FIs. EPS also demonstrated a model for aggregating several EE projects into a special purpose entity, to reduce transaction costs and scale up financing levels. EPS Capital accessed grant financing from the US Overseas Private Investment Corporation and Nacional Financiera, SNC (NAFIN) to provide support to local FIs.
In China, EPS raised a $200 million equity fund to meet the equity requirements of Chinese banks for EE projects. The fund was for upfront equity (debt-equity of 50:50 basis), with special-purpose entities buying the EE projects from Chinese ESCOs. The use of the aggregator scales up the investment required, lowers transaction costs, and lowers the credit risk (Hamilton and others 2009).
box3.1.Continued

WO
RLD
BA
NK
GR
OU
P
60
ESCO financing
Financing by ESCOs differs from the above three mechanisms as it is provided through entities that also carry out EE projects. ESCOs finance and implement projects for clients and get their money back through a guaranteed-savings or shared-savings contract (also known as an energy performance contract) that provides a reasonable return on investment. Such a contract shifts the risk of achieving energy savings to the ESCO, which is attractive to many customers. That, coupled with the third-party financing that ESCOs bring, can stimulate demand for EE services, and has proven especially attractive to large industrial and commercial customers.
Pioneered three decades ago in the United States, ESCO financing is now used in some 50 economies, including Brazil, China, India, Republic of Korea, and South Africa (box 3.1). The ESCO market in China is reportedly the largest, worth about $13 billion in 2013. ESCOs have played a key role in ratepayer-funded EE programs outsourced by utilities.
ESCOs have been less successful in developing countries due to incomplete enabling environments, inadequate access to low-cost financing, and poor con-tract enforcement. Where conditions permit, however, ESCOs can undertake EE projects on behalf of customers, utilities, or government EE agencies, providing services that can transform EE markets—including project financing to supplement limited public funds.
UTILITY DELIVERY OF ENERGY EFFICIENCY
Electric utilities have spearheaded EE implementation in several countries.17 These provide useful reference points to MENA countries as they try to implement EE. While the technologies and programs most applicable to each of these sectors may differ in the MENA countries, their programs’ financing mechanisms and ap-proaches to implementation have certain themes in common, enabling them to internalize the experiences of other countries’ utilities.
The customer bases targeted by utilities depend on factors including local regu-lations, customer energy-demand patterns, objectives of the utility in curtailing or shifting demand for electricity, incentive programs, financing and customers’ in-centives to manage their electricity demand.
All sectors would of course benefit from greater EE, but discussions with stake-holders identified the industrial, services, and residential sectors as key for the near term. Industry and services—which includes commercial facilities, public buildings, and services such as water supply and street lighting—are well suited for utility deliv-ery of EE given that industrial and commercial customers generally pay higher tariffs and are better organized with trained personnel to conduct EE programs. The phas-ing in of “smart metering” technology, which improves data gathering and control of customer demand, makes utilities a good partner to deliver EE in the marketplace.
Electric utilities are generally motivated to implement EE to comply with reg-ulatory requirements. An IEA study quoting a regulatory assistance project notes that many regulatory agencies in OECD countries require utilities to meet Ener-gy Efficiency Obligations or Energy Efficiency Resource Standards (EERS), a key driver for utilities to undertake EE measures (Crossley and others 2012).
Ratepayer-funded EE programs have been successful in regulated electricity markets, allowing regulators to mandate utilities to undertake EE programs on a cost-recoverable basis. Deregulation and restructuring of the utility industry, as in many OECD countries, had changed the market, and utilities no longer had the
De
liv
er
ing
en
er
gy
ef
fic
ien
cy
in
th
e M
iDD
le e
ast
an
D n
or
th
af
ric
a
61
same incentive to adopt EE. The distribution companies no longer owned genera-tion plants and did not accrue the same benefits in reduced or delayed investment in new generation capacity.
To revive the market for utility-driven EE and incentivize utilities, regulators therefore introduced a system-benefits charge, as in Brazil and the United States (Box 3.1), collected from all ratepayers to fund EE programs. The system-bene-fits charge in the United States varies from state to state and is generally a fixed amount added to each kWh charged to customers.18 A regulator or state agency serves as the administrator of the funds, which are allocated to utilities or other public and private agencies, including ESCOs, to undertake EE programs.
Regulations and their strict enforcement have been one of the main reasons that utilities have implemented EE programs despite some of the disincentives to do so. This regulated approach to financing and implementing EE programs is appropriate to developing countries where the utilities are regulated, vertically integrated, and largely in the public domain.
Absent regulations, many utilities in developed countries with excess genera-tion capacity follow EE measures as a service to their customers, to gain competi-tive advantage in electricity markets with open access, or to reduce costs of supply.
Electric utilities in countries with constrained energy resources and subsidized electricity prices (some of the MENA countries) are motivated to help their con-sumers reduce energy use as it helps them cut the subsidy and use available elec-tricity to expand the customer base and/or reduce the import of energy resources. Even utilities in resource-rich MENA countries have an incentive to reduce cus-tomer demand given the price subsidies and the potential to export energy resources.
The rest of this chapter summarizes the programmatic approach to EE taken by utilities in six countries, summarized in table 3.1 (with cursory overviews for other economies in Appendix 3), highlighting the experiences most relevant to MENA countries.19
California,unitedstates
Utility-delivered EE. In the United States, most regulated utilities are required to implement EE, and in 25 states utilities are required to comply with the EERS that establish specific, long-term targets for energy savings as part of a least-cost plan to meet electricity demand. Utility investments in EE rose from $4 billion in 2008 to $7.2 billion by 2012. Compliance with EERS targets should result in electricity savings of more than 232 TWh by 2020. However, mandated compliance is not the only spur (box 3.3).
California law, enforced by the Public Utility Commission (CPUC), requires utilities in the state to meet new demand through EE, demand response programs, and renewable energy prior to installing new power plants or procuring power. The commission has developed strategic plans and roadmaps to meet EE targets and to achieve market transformation. The commission promotes five key policy tools to achieve EE goals: customer incentives such as rebates, codes and standards for buildings and appliances, education and outreach programs, technical assistance to customers, and support for R&D into new technologies. The commission peri-odically sets goals for EE—in 2004 it sought to achieve cumulative electrical energy savings by 2013 of 23,000 GWh and cumulative peak electricity demand reduc-tions of 4,900 MW from EE programs.

WO
RLD
BA
NK
GR
OU
P
62
Program funding. Utilities have funded the implementation of EE programs through a charge of $0.003/kWh on customer bills, capped at 3 percent of a cus-tomer’s bill. The customer charge meets about one-fourth of the utilities’ cost of implementing approved EE programs, and the remaining is funded by the utility and recovered through periodic revisions to customer tariffs as approved by the regulator. The budget for implementing EE was $3.1 billion for investor-owned utilities for 2010–12, with about 4 percent of the budget allocated to evaluation, measurement, and verification of energy savings.
Program results. Investor-owned utility programs in 2010 and 2011 achieved esti-mated energy savings of 7,063 GWh or 1.8 percent of retail sales, and reduced peak demand by about 1,069 MW. The cost-benefit ratio for these programs was 2.02, as determined by a total resource cost test. Savings were highest in the commercial sector (55 percent), followed by the residential sector (34 percent). Programs to pro-mote codes and standards delivered about 38 percent of the total savings. Among end uses, high-efficiency lighting accounted for about 59 percent of savings followed by heating, ventilation, and air conditioning (HVAC) improvements at 13 percent and process improvements at 10 percent. Publicly owned utilities, which supply about 25 percent of electricity in the state, achieved electricity savings of 402,416 MWh in 2012, which amounted to 0.74 percent of retail sales. The revised goal for 2015–24 is 21,800 GWh of cumulative electrical energy savings and 4,000 MW of cumulative peak demand reduction. To meet these goals, utilities have developed EE programs and customer awareness programs targeted at each customer sector.
California provides a “shared savings” incentive mechanism for investor-owned utilities. The risk/return incentive mechanism rewards or penalizes the utility for success or failure in meeting energy savings targets. Utilities that achieve at least 80–85 percent of the commission’s targets are granted incentives. Those hitting 65 percent or less are penalized. Energy savings incentives took effect in 2012, linking incentives to quantity of energy saved rather than to percentage goals.
box3.3.harnessingthepowerofutilitiestodeliverenergyefficiencyintheus
Utilities in the United States, driven by regulation and by good system management practices, have been among the leaders delivering EE. In 2009, U.S. utilities accounted for 93 percent of the $4.4 billion spending on EE nationwide (Freeman and others 2010). Even states with capable public agencies rely on utilities’ capacity and knowledge to help achieve EE targets.
U.S. states that impose a systems benefit charge—a charge on customers to fund EE programs—have also relied on utilities to implement EE programs, though the funds could also be used by public agencies to deliver EE.
An important point from U.S. states that have proclaimed EERS is that the EE targets should initially be set low to allow utilities and other service providers to gain experience in identifying and running programs. Utilities that do not meet mandated targets may be required to pay into a state energy fund. The cost-effectiveness of programs may vary depending on their objectives—for instance, programs designed to reduce peak load may typically cost more than an energy savings program, but a reduction in peak load may help the utility avoid or postpone adding new generation capacity, which has even higher value than programs that only reduce operational costs of supplying electricity.
Source: Allen and Riley 2014.

De
liv
er
ing
en
er
gy
ef
fic
ien
cy
in
th
e M
iDD
le e
ast
an
D n
or
th
af
ric
a
63
newsouthwales,Australia
Utility-delivered EE. New South Wales (NSW) is one of three Australian states that have implemented EE obligation programs. The state introduced NSW Green-house Abatement Certificates (NGACs) to meet carbon emissions reduction tar-gets through steps including demand-side management (DSM) and EE measures, creating the world’s first EE certificate trading scheme. This program transitioned in 2009 to the Energy Savings Scheme, a stand-alone EE certificate-trading plan. It obligates generators, retailers, and wholesalers to meet specified targets by surren-dering equivalent Energy Savings Certificates (ESCs). It aims to achieve savings of 4 percent of annual sales for 2014–20. The NSW Energy Efficiency Action Plan of 2013 targets annual savings of 16,000 GWh by 2020, and promotes open and com-petitive market-based delivery of EE services to customers through their existing utilities. Regulators approve EE programs eligible under the schemes, and utilities actively market the program to increase awareness and educate customers.
Program funding. Liable entities may pass the verified costs of implementing EE programs onto customers. Eligible facilitators may also use part of the proceeds from the sale of ESCs to finance program costs, and the registration fee for the ESC covers program administration costs. The ESCs are traded through spot contracts, forward contracts, and options contracts. They have generally been trading at pric-es around A$14.00–32.00 per MWh of electricity savings.
Program results. 8,826,129 ESCs were created between July 2009 and June 2013, resulting in estimated savings of 2,826 GWh, and the scheme is likely to result in electricity savings of 5,501 GWh over 2014–23. Most ESCs are generated through energy-efficient lighting projects. In 2012, the cost of generating an ESC ranged from A$14.84 to A$21.70, and the ESC was trading at about A$25.36. Utilities that acquired ESCs in compliance with program targets incurred an average cost of A$29.39 in 2012. A total resource cost analysis, which measures the net benefit to society, showed that the ESCs produced a net benefit of A$24.56. Liable entities are penalized for any shortfall. In 2014, the penalty was A$25.97 per ESC.
Overall, the Energy Savings Scheme has proven an effective mechanism. It has also stimulated an energy services industry, creating many jobs. The ultimate cost of the ESC scheme is met by customers through increases in energy prices.
southAfrica
Utility-delivered EE. Eskom, the state-owned vertically integrated utility overseen by the National Energy Regulator of South Africa (NERSA), generates much of the country’s power. Eskom has undertaken EE measures that reduced electricity demand by about 3.6 GW (12 percent of system peak load) over 2005–12, and led to energy savings of about 4 TWh. The shortfall in generation capacity in 2008 and 2009 was a primary motivator for implementing EE measures. The approved elec-tricity tariff for 2015 is four times that in 2007. NERSA approves Eskom’s budget for EE and DSM and allows the utility to recover program costs through the tariff.
In 2004, NERSA promulgated the Regulatory Policy on Energy Efficiency and Demand-Side Management, which made EE and DSM a licensing condition for all major electricity distributors, defined the role of ESCOs, and created an indepen-dent verification unit. In 2005, the country adopted a National EE Strategy, with

WO
RLD
BA
NK
GR
OU
P
64
an EE target of 12 percent by 2015. Eskom has promoted an ESCO program since 2005, which targets customers with loads of over 500 MW, and has led to about 450 ESCO projects producing 869 MW of demand reduction and 2,727 GWh of electricity savings. South Africa finalized an Integrated Resource Plan in 2013.
Eskom has implemented a standard offer program to replace inefficient equip-ment targeting customers with loads of 10 kW–5 MW. The program provides set payments against deemed savings associated with equipment replacement, and has delivered an estimated 114 MW of demand reduction and 609 GWh of savings in less than two years. The program also replaced inefficient lighting, shower heads, and heat pumps, resulting in a demand reduction of 112 MW and energy savings of 493 GWh in two years. Eskom’s residential compact fluorescent lamp (CFL) mass rollout program delivers CFLs through door-to-door delivery, direct installation, and product discounts from retailers. The program rolled out 43.5 million CFLs in South Africa over 2004–10, yielding demand reductions of over 1,800 MW.
Program funding. NERSA established an EE and DSM Fund administered by Es-kom in 2004. For 2010–13, NERSA approved an EE budget amounting to 1.5 percent of Eskom’s gross revenues. However, for 2014–18, the budget approved is less than 1 percent of revenues.
Program results. Eskom estimates that it realized net savings of 3,400 MW over 2005–13. Monitoring and verification costs of up to 8 percent of total project costs are allowed by NERSA, and a budget of R128 million was approved for 2010–13. Independent consultants undertake monitoring and verification using an approved methodology based on the International Performance Measurement and Verifica-tion Protocol (IPMVP).20 About half the EE initiatives were no-cost/low cost mea-sures with payback periods of less than three years. The average cost per kWh saved was about R0.4. NERSA establishes targets for Eskom and imposes penalties for non-compliance. Overall, Eskom’s EE programs focusing on residential lighting and programs for the industrial sector have sustained the greatest demand reduction.
China
Utility-delivered EE. China has developed a comprehensive energy strategy to im-plement EE. The industrial sector, which accounts for 69 percent of final energy use, is a key focus. China has been running government-funded EE programs since the 1980s, and adopted new policies in 2010 obligating government-owned utilities to achieve energy savings of at least 0.3 percent in sales and demand savings of at least 0.3 percent compared with the previous year’s consumption. The State Electricity Regulatory Commission (National Energy Administration) regulates grid companies and ensures that they implement DSM and EE measures. Targets for EE may be met by implementing measures in any customer sector and may include measures that reduce transmission and distribution losses. Utilities can also establish ESCOs or purchase up to 40 percent of the targeted savings from other eligible entities.
Program funding. DSM and EE programs get their funding through a surcharge on electricity tariffs, revenues generated by differential pricing for energy-intensive industries, a special fund created and managed by each provincial government, or other fiscal means such as emissions reduction. The guidance on EE obligation allows utility program expenses to be recovered through tariffs, though this mech-

De
liv
er
ing
en
er
gy
ef
fic
ien
cy
in
th
e M
iDD
le e
ast
an
D n
or
th
af
ric
a
65
anism has not yet been put in place (under present regulations, the grid companies are not allowed to fully recover program costs, and they may not be compensated for any reduction in revenue). Grid companies that establish ESCO subsidiaries may be eligible for targeted funding from central and provincial governments. De-spite these sources of funding, grid companies face heavy costs in acquiring energy and demand savings that are not fully covered by financial incentives.
Program results. In 2013, the total energy savings were 16.2 TWh, and the total load reduction was 3.44 GW. A draft compliance scheme awards utilities points for energy savings achieved and implementation steps taken. The maximum is 100 points, of which measures related to the target for EE obligation receive a maxi-mum of 60 and DSM implementation a maximum of 40. In early 2013, the NDRC developed draft procedures for measuring and verifying energy savings by the grid companies and provincial governments that are similar to evaluation practices in the United States. China pays little attention to the cost-effectiveness of EE pro-grams, which are principally implemented to meet EE targets. While there are pro-posals to incentivize grid companies to implement cost-effective DSM measures, grid companies are not sanctioned for not meeting EE goals.
India
Utility-delivered EE. India’s Bureau of Energy Efficiency (BEE) promotes EE. With the support of Susatinable Energy for All (SE4ALL), the BEE supports electricity distribution companies in nationally coordinated EE and DSM programs. India’s 12th Five-Year Plan (2011–15) has established targets and strategies for implement-ing and achieving electricity savings equal to around 45 TWh—roughly 1 percent of total electricity consumption at the start of the Five-Year Plan. The targets include savings from utility DSM programs. Regulators in at least 14 states have established DSM implementation rules. Some 70 percent of government-owned electricity util-ities have an energy department that operates DSM programs.
The few private utilities have been more active in implementing DSM programs, with ESCOs also involved. Utility-delivered DSM is, however, in the early stages and utilities are undertaking pilot projects. India’s National Mission for Enhanced Energy Efficiency of 2008 also promotes cost-effective strategies for end-use de-mand-side measures, under which a market-based mechanism aims to improve in EE in energy-intensive large industries and in power generation.
Program funding. While regulators allow utilities to recover eligible costs of utility DSM programs through the tariffs, revising tariffs is not easy given political and social sensitivity. Utilities are largely supported by funding from international orga-nizations and do not have adequate funds to undertake large programs.
Program results. Several pilot projects have been successful:
> The Maharashtra State Electricity Distribution Company’s agricultural DSM project targeted replacement of 3,530 pumps for projected elec-tricity savings of up to 40 percent. If extended to the roughly 20 million pumps nationally, demand could fall by 62 TWh annually, or about 6.5 percent of the national total. The utility also replaced 380,000 in-

WO
RLD
BA
NK
GR
OU
P
66
candescent lamps with CFLs, for annual savings of 12-16 MWh and reduced peak demand of 7-9 MW.
> Tata Power, a private utility, offers a pilot thermal energy storage pro-gram to encourage customers to run their air conditioners on off-peak rather than peak hours by offering a rebate on the tariff. In the first phase of this initiative in 2014, Tata Power enrolled a thermal storage capacity of over 15,000 TRH, which has achieved a load shift of more than 3.6 million units of energy from peak to off-peak hours.
> In 2008, Noida Power Company Limited ran a pilot project to improve the power factor and efficiency of agricultural water pumping for 100 customers. It resulted in average peak load reduction of 60 percent and energy savings of over 65 percent.
> Reliance Infrastructure Limited, a private utility, ran a DSM program that replaced over 36,000 streetlight lamps, resulting in annual savings of about 5.4 GWh and peak load reduction of 1.3 MW.
Scaling up these programs will take time and will depend on the ability of utilities to recover the costs of carrying them out.
brazil
Utility-delivered EE. Brazil has relatively low electricity intensity and high electric-ity prices that are similar to prices in OECD countries, which motivates custom-ers to take EE steps. The federal government and the national regulator, Agência Nacional de Energia Elétrica (ANEEL), have promoted EE and DSM: ANEEL requires utilities to spend 0.5 percent of their net operating revenues on improving EE. Brazil established the National Electrical Energy Conservation Program (Pro-grama Nacional de Conservacao de Energia Elétrica) in 1985 within the then na-tional electricity utility, Eletrobras, and the Energy Efficiency Program (Programa de Eficiência Energética, or PEE) seeks to promote the efficient use of electricity.
ANEEL also requires utilities to spend 60 percent of the funds set aside for EE for implementing programs that benefit customers that pay a social tariff. ANEEL allows up to 5 percent of funds to be used to meet administration and marketing costs of program delivery. The Ministry of Mines and Energy approved a National Plan for Energy Efficiency in October 2011, which targets 109 TWh of cumulative electricity savings by 2030.
Distribution utilities may invest PEE funds to implement projects in customer facilities. Brazilian utilities have invested heavily in efficient public lighting and in programs targeting the residential, industrial, and commercial sectors. Some of the largest utilities in the country have outsourced EE projects to ESCOs.
Program funding. Utility EE programs derive funding from a percentage of their revenues, which they are required to set aside by ANEEL. Since the passage of this law in 1998, originally set at 1 percent of utility revenue until an amendment in 2007 reduced it to 0.5 percent, the proportion allocated to energy efficiency pro-grams has varied between 0.9 percent and 0.25 percent. Half of the allocation goes to energy efficiency measures targeted at low-income households.

De
liv
er
ing
en
er
gy
ef
fic
ien
cy
in
th
e M
iDD
le e
ast
an
D n
or
th
af
ric
a
67
Program results. The PEE has generated energy savings of more than 8.5 TWh a year and a reduction in peak demand of around 2.5 GW. The National Electri-cal Energy Conservation Program, which funds a broad range of programs, saved nearly 100 TWh in 2011. The requirement for distribution utilities to invest in EE and DSM spurred significant investment: cumulative investments total more than R4.6 billion (US$1.5 billion) since 1998 from the PEE. ANEEL requires a cost-benefit ratio of 0.85 or less for projects to be eligible under the utility EE/DSM program. Overall, utility delivery of EE has been successful and reasonably transparent, though EE has not been adequately integrated into resource planning.

WO
RLD
BA
NK
GR
OU
P
68
table3.1.summaryofexperiencefromutility-implementedeeprogramsinsixcountries
California,unitedstates
newsouthwales,Australia southAfrica China India brazil
keyfocusoftheutility
Focus on electricity and gas use, EE resource standards, utility DSM/EE program
ESC for eligible customers, greenhouse gas abatement, stand-alone EE programs
Focus on electricity use, utility DSM/EE program
Focus on reducing energy intensity. Industry focused, government programs
Electricity-focused DSM/EE is central to Energy for All (E4ALL), central and state agencies, and utilities are involved
Low-energy intensity, relatively high tariffs, government agencies involved in DSM/EE
Policyobjectivesandlegalauthority
Action plans, laws and regulations
Policies and action plans, laws and regulations
Policies, laws, and regulations
Policies, laws and regulations, central coordination agency
Policies, laws and regulations, central and state coordination agencies
Policy, laws and regulations, central coordination agency
sectorcoverage
Electricity and natural gas. Residential, commercial, industrial, and agricultural. EE standards, codes, etc.
Electricity only. Residential, commercial, and industrial sectors
Electricity only. Primarily residential and commercial. Includes industrial and agricultural sectors
Focus on industry and electricity. Other sectors and fuels also eligible, T&D improvement
All sectors are eligible, electricity focused
All sectors and fuels are eligible in all sectors
energysavingstarget
GWh, MW, Therms targets
MWh targets for eligible customer sectors
National and sector targets
DSM EE obligations for utilities, energy and demand saving targets
Electricity and fuel savings targets
Electricity savings target
energyefficiencyactivities
EE programs for residential, commercial, industrial, and agricultural sectors
Accreditation process for ESC
ESCO, performance contracts, standard offer, rebates, etc.
Direct utility programs, ESCO programs, trading of certificates, direct customer programs
Agricultural programs, lighting program, load shirting, ESC (PAT)
Municipal, residential, commercial, and industrial sectors. Lighting program, ESCO-driven programs
Fundingmechanism
Charge on customer tariffs, program cost recovery through rates
Responsibility of eligible customers under ESC, ESC trading
EE and DSM Fund, cost recovery through tariffs
Charge on tariffs, differential tariffs for energy-intensive customers, DSM/EE fund, emission reduction funding, cost recovery through rates not possible
Central and state funding, international funding, PAT trading
Percentage of utility revenues to be expended on DSM/EE
Results
Energy and demand savings by end use, customer sector, segment, etc.
Energy savings, ESCs generated by end use
MW savingsMWh and MW savings by province and program
MW and MWh savings
MW and MWh savings
evaluation,measurement,andverification
Reports to PUC, independent verification
Impact assessment, metering, deemed savings
Based on IPMVPCompliance evaluation scheme for utilities
No standard approach, under development
By regulator. Not very strong
Cost-effectiveness
Total resource cost test
Cost for generating ESC, ESC price in trading
Cost of saving electricity (CSE)
Focus on meeting targets and not on cost-effectiveness
Programs should be cost-effective, but no clear metric
Cost-benefit ratio of under 0.85 required
Performanceincentivesandpenalties
Risk/return incentive mechanism. Incentives above 80%/85% of target, penalties below 65%
No incentives, but penalties for shortfall in ESCs
No incentives, penalties for utility not meeting target
Unclear incentives, no penalties for non-compliance
Incentives for utilities—but mechanism not under implementation
Penalties for utilities
overalleffectiveness
Total resource cost, MWh, utility funded
Customer funded, ESC trading
Mass market programs, poor ESCO showing
Mixed results, ESCO model has been effective
Results are good but difficult to discern
Results are good, but DSM/EE not yet integral to utility planning
Source: Allen and Crossley 2014.

De
liv
er
ing
en
er
gy
ef
fic
ien
cy
in
th
e M
iDD
le e
ast
an
D n
or
th
af
ric
a
69
SUMMARY OF GLOBAL EXPERIENCE
Financing
Financing EE through domestic finance institutions, such as commercial banks, in developing countries is a challenge even when capital markets are strong. Most MENA countries have little experience with EE financing and need to develop in-novative financing mechanisms and products to mitigate the risks to local commer-cial financial institutions and provide attractive financing options to customers.
A multitude of structural factors can hinder deals, such as financing and con-tract laws and terms, high transaction costs, low visibility of EE, small size of proj-ects, opportunity costs for alternative investments and uncertain creditworthiness of customers and service providers. It is a great challenge to package financing mechanisms to meet local market conditions.21 But creating a sustainable source of financing through local financial institutions is critical to creating a liquid mar-ket for financing EE in the long run, and will require overcoming these obstacles and building the capacity of local financial institutions to evaluate and finance EE projects.
Creating a market for financing is more challenging in countries with weak local banking systems, as in some MENA countries, where it may be necessary to support the creation of a strong banking sector as a precursor to sustainable financing. In most countries, however, local banks have enough financial products geared toward consumer retail finance that can be tailored to the needs of EE projects, but that may need considerable public (state or MDB) support, especially where loan tenors range from one to three years and interest rates are prohibitive. Local financial institutions also need to understand the dynamics of EE projects where positive returns are hidden in the cash flow of the entity and to develop ap-propriate financing products. The use of performance guarantees, project aggrega-tors and innovative repayment systems, including through utility bills, can all help mitigate the risks of financing EE.
It is equally critical that financing delivery mechanisms be tailored to local market conditions and not distort local financing markets—concessional financing can stimulate the market but also distort long-term incentives. The World Bank (2014a) study found that lending through local commercial banks offers the high-est prospect of program sustainability and large-scale impact. This may entail de-veloping partnerships with local financial institutions to support them in market development.
deliveryinsixcountries
Most utilities in the six countries were motivated to adopt EE by policy and regula-tory requirements, although some had business reasons particular to the local mar-ket. Some (more in developed-country markets) aimed to sell additional products or services, while others pursued EE regardless of regulations to reduce demand for electricity and put off investing in generation, transmission, and distribution.
In developed economies such as California and New South Wales, utilities com-pete in open electricity markets and have an added incentive to provide expert advisory services to retain customers.
Providing EE services in developing economies brings multiple benefits to the utility, and many utilities are now undertaking EE programs, generally in compli-

WO
RLD
BA
NK
GR
OU
P
70
ance with policy and regulatory obligations, to meet electricity demand cost-effec-tively. Utilities in South Africa, Thailand, and India have all supported EE—pro-grams that replace inefficient lighting with CFLs are the most popular. Efficient lighting can substantially lower peak demand in all countries, but is especially important in countries with inadequate generation and weak transmission and distribution. Finally, utilities in countries with subsidized tariffs that do not meet the cost of electricity supply may seek to lighten the subsidy burden by curtailing demand through EE.
MovingfromMdbsupporttoself-sustainabilityoverthelongrun
One of the most widely deployed utility EE programs worldwide has been installa-tion of CFLs, which are very effective at cutting peak demand load and saving ener-gy. While some CFL programs got all their funding from the utilities, which provided free or subsidized CFLs to customers, others billed customers in installments.
Despite these programs’ apparent success, many utilities have been unable to sustain them without ongoing support from MDBs or other donors, primarily for lack of regulatory mandates and inability to recover program costs through tariff revisions. Subsidized tariffs in many developing countries have discouraged pro-gram implementation, although reduced electricity sales resulting from electricity savings effectively reduce the subsidy burden. This underlines the need for an in-tegrated approach to EE, with well-defined regulatory incentives and sustainable financing mechanisms.
De
liv
er
ing
en
er
gy
ef
fic
ien
cy
in
th
e M
iDD
le e
ast
an
D n
or
th
af
ric
a
71
oPtIonsFoRsCAlInGuPeneRGyeFFICIenCyInMenA
This chapter focuses on the options that MENA countries might consider as they continue to strengthen their approaches to EE.
Building on chapter 2 and chapter 3, chapter 4 reviews the elements necessary to ensure a strong enabling environment and a good finance structure for scaling up EE in MENA; i.e. the policies, institutions, finance, capacity, awareness build-ing, and reporting. It makes suggestions for how to overcome the inherent barriers to EE, and notes the existing good practices established by MENA countries. These provide a rich source of knowledge and clear lessons for developing EE policy within neighboring MENA countries.
The focus of the chapter then turns to the energy savings potential in the elec-tricity sector and each of the three main end-use sectors: industry, services, and residential. To the extent possible, sets of potential options that may be applicable to the three subregions of MENA—Maghreb, Mashreq, and GCC—are presented for the three chosen end-use sectors with the highest energy-saving potential.
The chapter offers examples of how individual countries may benefit from par-ticular options throughout, thereby contributing to the ongoing dialogue about how countries and their development partners can build better enabling environ-ments for targeted EE delivery mechanisms to function at scale. The examples are not exclusive or definitive. Indeed, given the considerable variation in the market characteristics of the individual MENA countries, the appropriate EE programs will be quite different.
For this reason, the report concludes with a menu of best practice options, from which the individual countries can select appropriate measures, rather than a single international best practice formula to implement EE improvements in a particular MENA country.
EE carries many different benefits (IEA 2014e) and the circumstances of each country will determine which of those benefits it will prioritize. Some may seek to deliver economic benefits through reduced expenditures on energy and in supply-side investments. Others may emphasize increased security of supply, employing EE to increase network operational efficiencies and improvements in the reliability of supply. Still others may prioritize social welfare benefits, such as increasing the levels of service (including lighting, refrigeration, and electronic equipment) from new electricity supplies to previously unconnected households.
4

WO
RLD
BA
NK
GR
OU
P
72
In addition, the emphasis for resource-rich energy exporters will be different from that of energy importers, and the incentive to deliver EE may vary depending on budgetary burdens resulting from energy-price policies. Collectively, these driv-ers will help determine the level of ambition and direction of efforts to save energy, shaping the enabling framework and the specific mechanisms for delivering EE.
SETTING THE STAGE: ENHANCING THE ENABLING ENVIRONMENT IN MENA
Chapter 2 discussed the importance of developing an integrated and coherent ap-proach to EE—one that simultaneously addresses the policy, regulatory, and insti-tutional/delivery framework, financing mechanisms and information provisions to achieve EE. In this chapter each of the elements within that enabling environment for successful delivery of EE are examined, with consideration given to the key requirements and necessary actions (figure 4.1). This section relates each element of the enabling environment to the challenges MENA countries face.
Figure4.1.theenablingenvironmentforenergyefficiency
SUCCESSFUL DELIVERY OF
ENERGYEFFICIENCY
ELEMENT 1Policy and regulations
> EE policy including national targets> Legal and regulatory framework> Cost-reflective energy pricing> EE incentive schemes> EE targets by sector> EE standards and labels
ELEMENT 2Institutions and organizations
> Government agency(ies) with authority and responsibility for EE> Utilities regulator> Obligated utilities> Regulation compliance
ELEMENT 3Finance
> Public sector EE financing> ESCO financing> Utility financing> Private (consumer) financing> Public benefits charge
ELEMENT 4Capacity and awarenessbuilding
> Installer certification programs> Energy manager training> Private sector training programs> Public information and awareness programs
ELEMENT 5Information andreporting
> EE improvements (MRV)> EE delivered national benefits> Statistical reporting— baselines, energy consumption and intensity> Best practice

De
liv
er
ing
en
er
gy
ef
fic
ien
cy
in
th
e M
iDD
le e
ast
an
D n
or
th
af
ric
a
73
eleMent1.PolICyAndReGulAtIons
The success of any EE policy depends on the degree of government commitment, level of pro-gram ambition, and stability of public support. International experience has also shown that well-designed policies include clearly defined targets supported by an overarching EE legal and regulatory framework.
eepolicyandsettingnationaltargets
The drivers behind introducing an EE policy vary by country, depending on the market characteristics and the government’s strategic vision for energy use. For ex-ample, the Master Plan of Iraq, which aims to develop a 20-year cost-effective plan for the electricity sector, reflects a need to increase security of supply and satisfy environmental requirements. Significant projects identified in the plan include con-verting existing power plants operating on crude oil to gas combined-cycle power plants, lowering transmission losses by strengthening the grid, and reducing losses in the distribution network by adopting better distribution planning, rebalancing loads across phases, and improving maintenance standards (RCREEE 2015). In Saudi Arabia the delivery of economic benefit is the primary motivation, and a target objective to achieve a 30 percent reduction in electricity intensity between 2005 and 2030 has been set (RCREEE 2015). Energy-importing countries such as Jordan, Morocco, Tunisia, and West Bank and Gaza view EE as an economic necessity and a key element in energy security. Almost all of them (Morocco aside) have adopted national EE action plans with targets and measures. Morocco is fi-nalizing its national strategy.
A bottom-up approach works well for setting national targets because the po-tential for EE improvement varies considerably by sector. Sectoral targets for EE must be appropriate to sectoral energy intensity, specific energy consumption, percentage reduction, and absolute targets. Targets are most effective—and much easier to implement—when stakeholders take part from the earliest stages. This requires placing EE units in key sectoral ministries that can recommend suitable targets and mechanisms to a central unit.
MENA countries in the early stages of EE policy development may also find it effective to introduce realistic and quickly demonstrable (initially short- and medi-um-term) goals and targets to help achieve public support and stakeholder buy-in. Aligning the interests of stakeholders and demonstrating results in a short time helps to sustain activity (Taylor and others 2008; Sarkar and Singh 2010). For example, programs in India, South Africa, and Thailand, which replaced ineffi-cient lighting with CFLs or LEDs (light-emitting diode), have delivered significant savings in the short term. Morocco reduced peak load by 177 MW through the replacement of 4.5 million inefficient light bulbs with CFLs over two years. On average, customers observed about a 22 percent reduction in monthly electricity consumption. By replacing 10 million light bulbs, both Egypt and Morocco aim to reduce around 330 MW of peak load (RCREEE 2015).

WO
RLD
BA
NK
GR
OU
P
74
Costreflectiveenergypricing
Energy subsidies and other forms of price distortion encourage consumers to un-dervalue energy and diminish the financial incentive to adopt EE measures. For consumers to understand the benefits of EE, the price they pay for energy con-sumption needs to be cost-reflective. Subsidies are distortive in all countries, par-ticularly to net energy importers such as Egypt, Jordan, Lebanon, Morocco, and Tu-nisia. In recent years, several MENA countries have embarked on subsidy reforms, and energy importers are making considerable progress.
In particular, according to RCREEE, Egypt has launched a five-year plan to phase out electricity subsidies and plans to increase tariffs annually until 2018, and completely phase out subsidies by 2019. The petroleum sector has also started re-forming subsidies. On July 5, 2014, the government increased prices of gasoline 92 octane by 40 percent, of gasoline 80 octane by 78 percent, of diesel by 65 percent, and of natural gas for cars by 175 percent.
Jordan introduced a five-year plan to reform electricity prices in 2013 and plans to increase rates annually until 2017. Since November 2012, Jordan has removed subsidies for all domestic oil products, and prices track international market trends through a monthly review.
Tunisia also introduced an electricity reform plan in 2014 and has periodically revised rates upward. Morocco eliminated all subsidies for gasoline and industri-al fuel in January 2014, and reviews prices for these fuels twice a month. Sudan increased prices of gasoline by 68 percent, diesel by 75 percent, and cooking gas (LPG) by 67 percent. Yemen removed subsidies for diesel and gasoline in July 2014.
Phasing out subsidies will cost consumers, so reforms have to secure public support. It may be important to introduce programs supported by defined funding sources that can help consumers reduce their energy usage and hence the financial burden of the subsidy reform. Introducing social safety net programs and other mitigation mechanisms to support the poor is also important.
legalandregulatoryframeworksandin-centivesforenhancingee
Appropriate regulatory frameworks support new (and developing) EE policies, including regulations that provide codes and standards for energy performance as well as suitable enforcement mechanisms. Internationally, appliance labeling (especially lighting, refrig-erators, air conditioners, and water heaters), buildings, and industrial equipment have proven highly effective. A number of Arab countries have already adopted standards and labels for appliances, and a few have adopted energy performance codes for build-ings. The barrier is in enforcing them.
The EE labeling initiative in the Neth-erlands has been successful. The program provides information to consumers on EE products through a range of channels includ-ing labels, information centers, and websites.
Figure4.2.Airconditionerenergyperformancelabel,egypt
Source: Energy Efficiency Improvement and Greenhouse Gas Reduction )eeIGGR) Project (www.eeiggr.com).

De
liv
er
ing
en
er
gy
ef
fic
ien
cy
in
th
e M
iDD
le e
ast
an
D n
or
th
af
ric
a
75
Web-based tools calculate energy use and inform consumers about lifecycle costs. Financial support incentives are also available for businesses, in the form of en-ergy investment allowances and tax rebates for purchase of EE equipment. In the MENA region, Jordan provides exemptions from sales tax and customs duties for EE equipment. Tunisia reduces customs duty to 10 percent for EE equipment and provides exemptions from value-added tax. Appliance standards and labels exist in several countries. Figure 4.2 shows examples of labels currently in use for air conditioners in Egypt.
eleMent2.InstItutIonsAndoRGAnIzAtIons
Successful delivery of EE requires strong leader-ship from government and the empowered insti-tutions.22 Their roles and responsibilities must be clearly defined to avoid duplication of tasks.
Based on experience across many regions, the World Bank suggests that EE programs should be commercially oriented, responsive to the needs of target sectors, demand driven, and flexible to help create a sustained shift in the market toward improved EE. These new pro-grams will also need to be steered by a central body, which will provide a principal hub for all stakeholders and ensure that the programs remain on track. Depending on the characteristics of a particular market, it may be appropriate to assign these responsibilities to a dedicated state agency or agencies. Conversely, where utilities will deliver the majority of programs, the utilities regulator may be more suitable.
eeagency
Having a dedicated energy agency, or agencies, with the authority to deliver EE pol-icies and the responsibility for achieving goals has been highly effective internation-ally. However, it is also important to ensure that the new EE policies and activities match those of other public and private agencies.
For example, China’s comprehensive EE programs work primarily through gov-ernment agencies. The NDRC is the lead agency responsible for demand-side management and EE, and coordinates all efforts of sectoral agencies and energy conservation centers in the comprehensive EE programs. Collectively, the agen-cies’ EE programs have contributed to a steady decrease in energy intensity of the economy since 1980 (Allen and Crossley 2014). The Chinese model provides an example of how appropriately resourced agencies can work with private agencies and financial institutions.
ANME in Tunisia is a good example of a dedicated agency that has the political authority to act on government EE policies. An impartial state agency, it can work with other government agencies, policy makers, and other stakeholders in EE pro-grams. Its government affiliation also enables it to take a holistic view of the wider economy and therefore determine the most appropriate sectoral interventions and the most cost-effective use of resources.
The Lebanese Center for Energy Conservation (LCEC) is also a well-established, government-affiliated agency. It is involved in policy formulation, implementation, capacity building, and information dissemination. It plays an important role in fi-

WO
RLD
BA
NK
GR
OU
P
76
nancing EE projects by reviewing and providing recommendations on loan applica-tions for EE projects to Lebanese commercial banks through the National EE and Renewable Energy Action (NEEREA) fund.23
Within the GCC, the mandate of the Bahrain Electricity and Water Conservation Directorate at the Electricity and Water Authority Energy Planning includes policy formulation and implementation in electricity generation, transmission, and distri-bution (RCREEE 2015).
Egypt is in the process of establishing national authorities for EE. A central unit has been set up under the cabinet, as have sectoral EE units in ministries con-cerned with key energy supply and demand sectors (figure 4.3). This framework is still evolving, and to be most effective will require an empowered central unit (or agency) that can focus on planning, strategies, coordination and setting targets, and sectoral units that have strong relationships with enterprises and consumers (World Bank 2011).
Figure4.3.Proposedstructureofnationaleeinstitutionsinegypt
Source: World Bank 2011.
utilitiesregulator
The utilities regulator can also provide an effective channel for delivery of EE pro-grams, by introducing a range of sectoral EE initiatives through utilities’ mandates and incentives programs, as well as supplier obligation schemes. Internationally, there are many examples of successful regulation programs to incentivize utilities
CABINET’sENERGY
EFFICIENCYUNIT
EE UNITHousing
Housing & BuildingResearch Center
EE UNITPetroleum sector
Ministry of Petroleum/Egypt Gas Holding
Company
EE UNITElectricity sector
Egyptian Electricity Holding Company
EE UNITTourism
TourismDevelopment
Authority
EE UNITCommercial buildings
Internal TradeDevelopment Authority
EE UNITIndustry
Industrial Development Authority
EE UNITTransport
National Institutefor Transportation
EE UNITGovernment buidings
Ministry of LocalDevelopment
Technicalassistance

De
liv
er
ing
en
er
gy
ef
fic
ien
cy
in
th
e M
iDD
le e
ast
an
D n
or
th
af
ric
a
77
(Allen and Crossley 2014), such as the California program (chapter 3). This is based on a long-term EE strategy for each economic sector and identifies near-, mid-, and long-term measures:
> Customer incentives, including rebates, innovative or discount financing, and nonfinancial support to consumers are the “carrots” that help pull consumers into choosing the efficient option.
> Codes and standards that mandate minimum efficiency thresholds for buildings, appliances, or equipment (removing the less efficient choices from the market) are the “sticks” that push builders and manufacturers to efficient goods and services.
> Education and information through marketing, education, and outreach inform market actors about EE opportunities. These programs often in-clude labeling, benchmarking, Internet-based comparisons, professional and trade materials, school curricula, and peer-to-peer exchanges.
> Technical assistance helps ensure that customers’, installers’, or retailers’ knowledge barriers are not hampering the progress of critical efficiency initiatives.
obligatedutilities
Governments have an option to introduce an EE certificates scheme, which can be an effective mechanism to provide funding for EE activities and does not require the support of public funding. Ultimately, customers pay the cost of such schemes through higher prices, although in competitive markets these increases are smaller.
Allen and Crossley (2014) recommended that jurisdictions seeking to establish a new energy services industry or expand an existing one can learn a great deal from the Energy Savings Scheme (ESS) in New South Wales (NSW, Australia) (chapter 3). The ESS creates a financial incentive to reduce electricity consump-tion by encouraging energy savings.24 Some other objectives are:
> Help households and businesses reduce electricity consumption and costs.
> Complement any national scheme for pollution reduction by making the reduction of greenhouse gas emissions achievable at a lower cost.
> Reduce the cost of, and need for, additional energy generation, transmis-sion, and distribution infrastructure.
The ESS also enabled organizations with expertise in helping other businesses to reduce electricity to become Accredited Certificate Providers (ACPs). ACPs are voluntary participants in the ESS and are eligible to create and sell ESCs from energy savings projects. The ESS is therefore an important demonstration of two unique policy and regulatory mechanisms that can assist in utility delivery of EE certificate trading and third-party ACPs.
Many of the utilities in MENA countries are state-owned, vertically integrated monopolies. These utilities can benefit directly from EE programs, as the reduction in peak demand will reduce or delay the requirement to invest in additional gener-ation capacity. But an awareness- or capacity-building program may be required to encourage participation from utilities.

WO
RLD
BA
NK
GR
OU
P
78
In other MENA countries where there is active retail competition in the elec-tricity market, utilities have less incentive to invest in EE. In such cases a utilities obligation to undertake action to meet defined EE targets can be effective.
Regulationcompliance
Clear responsibility for monitoring and verifying results is also necessary to con-firm compliance with program requirements and to provide evidence of individual, sectoral, and national benefits from the EE programs. Data gathered is useful in evaluating the effectiveness of EE programs and inform future policy formulation to ensure that it stays relevant to changing market structure.
eleMent3.FInAnCeThe goal is to mobilize private investment in EE to make these markets self-financing. However, barriers remain to the finance and uptake of EE measures. These are discussed under the four headings in the finance element in figure 4.1. In many cases the main and often only source of financing are the consumer’s own funds. The sources described below above would typically augment these.
Some of the barriers are common across all countries, such as the weak rec-ognition of energy savings from efficiency investments, the small size of projects, and the lack of information, data, and capacity to manage EE project finance. Developing countries also have their own barriers, including low capital market development, governance issues, small markets for EE, higher costs of capital and higher perceived national risk for investors (Ryan and others 2012). These reduce access to capital markets and private finance for projects.
Figure4.4Financialinstrumentsbystageoffinancialmarketdevelopment
Source: Ryan and others 2012.
Privatefinance
Publicfinance
Low HighMedium
Private investment
Domestic public investment
Grant
Concessional loan
PPPs
Level of development of capital markets

De
liv
er
ing
en
er
gy
ef
fic
ien
cy
in
th
e M
iDD
le e
ast
an
D n
or
th
af
ric
a
79
Countries at an early stage of development of capital and EE markets need a comprehensive framework to incentivize and provide finance. The design and mix of financial instruments need to match the country’s needs and its commercial and financial market structure. The PROSOL solar water heater program in Tunisia, for instance, demonstrates the usefulness of packaging projects as turnkey opera-tionsFigure 4.5 shows schematically that in countries with low capital market de-velopment, investment in EE comes primarily from public finance through grants and concessional loan instruments. Incentives may also be in the form of parafiscal measures, like reduced duties such as those used under Tunisia’s National Fund for Energy Conservation (FNME) on energy-efficient devices that are not manu-factured domestically. As development picks up, the proportion of EE investment supported by commercial finance usually grows. Lebanon has experience in co-operation between government agencies and the banking sector on EE (box 4.1).
box4.1eepolicyandfinanceinlebanon
The Lebanese Government has officially adopted the National Energy Efficiency Action Plan (NEEAP) for the years 2011-2015 as developed by the Lebanese Center for Energy Conservation (LCEC) in collaboration with the Project on Energy Efficiency in the Construction Sector in the Mediterranean (MED-ENEC), the EU funded Support for the Enhanced Integration and the Improved Security of the Euro-Mediterranean Energy Market (MED-EMIP) project, the League of Arab States, and the Regional Center for Renewable Energy and Energy Efficiency (RCREEE). The LCEC produced the NEEAP in October 2010 in coordination with national and international stakeholders in five cycles of reviews.
The NEEAP 2011-2015 is the first comprehensive strategy in energy efficiency and renewable energy to be ever adopted by a Lebanese or Arab Government. It derives from the Arab Energy Efficiency Guideline developed by the league of Arab states and disseminated among its member states. The NEEAP is an official document that comprises 14 national initiatives paving the way for a structured approach towards achieving the national target of 12 percent renewable energy by 2020, it outlines energy conservation measures to be taken in the country in order to reach the national energy targets. It aims to strengthen the role of the public sector in the provision of information to consumers, the development of solar and hydro energy, the adoption of energy conservation laws, the banning of incandescent lamps, and the development of financing mechanisms.
In Lebanon, finance for EE goes through banks. The Central Bank of Lebanon (CBL) was crucial in developing the National Fund together with the local authority for energy (LCEC). From the start, the objective was to use banks to stimulate investments through low cost funds. NEEREA has the following components:
• Subsidized interest rates, whereby CBL exempts banks from reserve requirements.
• Cash subsidies, which will be paid after the project is completed and the savings are confirmed by LCEC. The subsidies come from the EU and represent 5 percent or 15 percent of the loan amount, depending if the sector already receives another form of subsidy.
• A loan guarantee for Small and Medium Enterprises up to 40 employees (“Kafalat Energy”)
• A TA program to improve staff’s technical and managerial skills in advising clients at the level of the guarantee organization Kafalat, participating commercial banks and CBL.
Sources: http://www.med-enec.com and EIB, 2013 http://www.med-enec.eu/sites/default/files/user_files/downloads/Financing%20EE%20Final.pdf

WO
RLD
BA
NK
GR
OU
P
80
International experience indicates that governments have the greatest success with public finance when they are part of wider national action plans, developed with the business and financial communities, and tailored to address local investment risks and market constraints.25 The suitability of a finance option will depend on several key market characteristics (figure 4.5). One important element is the cost-reflectiveness of energy prices, a ma-jor factor that measures the level of energy subsidy. Electricity market liberalization also matters—that is, whether there is active supply-side competition over electricity companies or they are largely state-owned monopolies. Other factors include the lev-el of capitalization within the market and the level of functionality within the bank-ing system. An exit strategy should be available for occasions when the EE market is developed enough for private financial markets to take over financing.
Figure4.5GeneralmarketcharacteristicsoftheMenAregion
Source: Authors.
Publicsectoreefinancing
The effectiveness of EE policies and programs increases when energy price reforms are in place that improve the financial incentives for energy end users to adopt EE measures.
In countries where the retail price of electricity is subsidized, consumers are more likely to place a low value on energy use and have little awareness of the value of EE, and consumer-financing mechanisms are unlikely to be suitable in these markets. Governments in this situation could introduce a public financing mechanism to mitigate the phasing out of energy subsidies. These countries may also consider it necessary to raise awareness of why EE is becoming a matter of national importance and gain public support for removing energy subsidies.
Even with the recent fall in oil prices, budget burdens can still be substantial on net energy-importing MENA countries that run energy subsidies or alternative mechanisms to control retail prices at below cost levels. As the benefits of energy subsidies tend to accrue preferentially to the wealthy, the predictable result is so-cial inequalities as well. In countries with low per capita GDP, any revisions to the retail price structure should include targeted social safety net programs and other mitigation mechanisms to support the poor and vulnerable. Consumers in these countries are also likely to have a low level of finance available for investing in EE.
Utility-implemented programs that include bulk procurement of EE appliances will work well in these countries, as they have the advantage of lowering their
MARKET CHARACTERISTICS
Energy subsidy
High level of subsidy
Low level of subsidy
Energy market structure
State-owned vertically integrated
monopolies
Liberalised energy market
Finance availibility
High level of capitalization
Low level of capitalization
Banking system
Fullyfunctional
Weaklyfunctional
Financing mechanism
Private financing
ESCO financing
Utility financing
Public financing

De
liv
er
ing
en
er
gy
ef
fic
ien
cy
in
th
e M
iDD
le e
ast
an
D n
or
th
af
ric
a
81
prices. As mentioned in Chapter 3, numerous international examples have focused on replacing inefficient lighting, such as the CFL replacements programs in Ban-gladesh, Egypt, and South Africa and the LED lighting programs in Algeria, Egypt, India, Morocco, and Tunisia. In Egypt, for instance, the CFL program provided a 50 percent cost reduction in price due to public bulk procurement, and customers were able to make payments in installments through their monthly electricity bills.
Governments are important for mobilizing investment in EE: first through pub-lic budgets and investments through dedicated funds or financial intermediaries, second through the tailored application of financial risk-mitigation instruments to mobilize private green investment (figure 4.6).26
Figure4.6.suitablefinanceoptionsdependonbankingsystemfunctionality
Source: Authors.
Public funds can be disbursed by public authorities directly through EE grants and investment subsidies, so they do not require a fully functional banking system. For example, in Ireland the Better Energy Homes program, managed by the Sustain-able Energy Authority of Ireland,27 encourages householders to invest in EE up-grades. The Authority provides grants for roof insulation, external wall insulation, dry‐lining, and other measures. The limitation of such grants and other subsidies is that they are small, making it unlikely that investment for the deeper EE im-provements with higher initial costs will be undertaken, even when the return on investment is attractive.
Introducing fiscal incentives such as tax rebates may be appropriate for coun-tries with less established banking systems, although effective tax collection is required. While tax incentives for EE investments exist in many countries, few MENA countries offer such incentives. The exceptions are Jordan, which offers an exemption from sales tax and customs duties for EE equipment, West Bank and Gaza, where EE equipment is exempt from value-added tax/sales tax, and Tunisia, where EE equipment is exempt from value-added tax (RCREEE 2015).
Public finance can also come from credit lines and loans (which may be avail-able at concessional rates) to local financial institutions for on-lending to proj-ects.28 While several MENA countries do have operational banking systems, many commercial financial markets are not well capitalized and financing is still scarce or expensive, and public funds can provide capital. Concessional loans, credit lines, and guarantee facilities can increase liquidity and lower the risk of default. In Tunisia, two dedicated credit lines exist. The first comes from the World Bank with total capital of $40 million for long-term loans with a guarantee from the Tunisian government for co-generation and industrial EE projects. The second comes from the French Development Agency with total capital of EUR 40 million to provide loans for co-generation, EE, and renewable energy projects (RCREEE 2013).
Fully functionalbanking system
Banking systemwith limited functionality
> Investment subsidies
> Fiscal incentives
> EE funds (grants & loans)
> Concessional loans
> Lines of credit
> Revolving funds
> Risk mitigation products
✔
✔ ✖
✔

WO
RLD
BA
NK
GR
OU
P
82
Once liquidity has been secured for financing EE projects through local finan-cial institutions, public funds can be used to encourage private (consumer) invest-ment in EE through incentives to mitigate risk, such as reduced interest rates or extended repayment periods. In Lebanon, NEEREA provides an entrepreneurial financing mechanism for sustainable energy projects. NEEREA provides mainly long-term soft loans with an interest rate of 0-1 percent. NEEREA loans are pro-vided to end users through all commercial banks in Lebanon for all types of EE projects, with a total repayment period of 14 years, including a grace period of four years (RCREEE 2015).
esCofinancing
The ESCO financing model provides capital support for EE projects, and repay-ment is made through shared savings or guaranteed savings contracts. In markets with high capitalization and well-functioning ESCOs, the ESCO generally borrows funding for the project directly from commercial financial institutions. The ESCO effectively operates as an intermediary between the consumer and the institution, and the ESCO guarantee lowers the perceived risk for the institution and can lead to lower interest rates. Although the ESCO can provide equity to finance the proj-ect, this does not provide an optimum solution as it limits the number of projects it can undertake.
Markets with low levels of capitalization
In countries where the financial markets are not well capitalized and the cost of borrowing is high, the ESCO model would benefit from additional sources of fi-nance. In such cases, public funds (dedicated EE funds), IFIs, or donor agencies could provide less expensive sources of capital, which would improve the cost-ef-fectiveness of EE projects (figure 4.7). These additional sources of finance could go through commercial banks and local finance institutions. Additionally, these three originators could provide support to commercial banks, which would also lower the cost of financing. In either case, the additional funds can stimulate demand for ESCOs.
Figure4.7.suitableesCofinanceoptionsdependingonlevelofcapitalization
Source: Authors.
High level ofcapitalization
Low level ofcapitalization
✔
✖
✔Commercial
financing via
local FI
✔
Commercial financingvia local FI supportedby:
> Public funds
> IFI
> Donor agencies
ESCO FINANCING

De
liv
er
ing
en
er
gy
ef
fic
ien
cy
in
th
e M
iDD
le e
ast
an
D n
or
th
af
ric
a
83
Although ESCOs have been very successful in the United States, and to a lesser extent in Europe, they have tended to be less successful in developing countries where the enabling environment is insufficiently developed. For example, Yes Bank in India developed an EE lending facility for off-balance sheet activities such as ESCO financing, but saw little uptake as the ESCO market is immature there (see Box 3.1).
The Electricity Generating Authority of Thailand (EGAT), however, has been very successful in implementing EE measures that helped it curtail electricity de-mand and meet demand during generation shortfalls. With the assistance of the World Bank and GEF, EGAT adopted a range of measures including voluntary appliance labeling, promotion of ESCOs, lighting programs for the residential and commercial sectors, and improved commercial building EE.
A number of companies have emerged in several MENA countries, having tak-en up various functions of ESCOs, though so far with relatively little uptake of the financing models found elsewhere (Panev and others 2014):
> Morocco’s first ESCO started in 1992, but barriers constrain their further development. There is primary legislation defining ESCOs, but secondary legislation (with the technical specifications and definition of the measures to create the ESCO market) has yet to be published. The country has three to four operational ESCOs, primarily installing efficient lighting on a fee-for-service basis. The Law on Energy Efficiency recognizes ESCOs as a mechanism to implement EE. The establishment of a dedicated EE fund in 2014, providing fiscal incentives, and revising the public procurement process will all help stimulate demand.
> Tunisia has 10 ESCOs accredited by ANME and permitted to operate under the Law on Energy Management. FNME finances ESCOs and ANME has adopted a measurement, reporting, and verification (MRV protocol. A 20 percent investment subsidy is provided to ESCO-implemented projects, and under FNME, a dedicated credit line provides interest-free loans for 15 percent of project costs. A Guarantee Fund is available for loans to ESCOs, covering up to 75 percent of the loan ($400,000) or 75 percent of payments to ESCOs.
> Egypt’s ESCOs provide limited EE services and do not offer performance guarantees. ESCOs may be eligible to carry out projects under a UNDP/GEF project. The Credit Guarantee Company of Egypt has used ESCOs to implement EE projects.
> Jordan’s first ESCO started operations in 1991. The country has 11 operational ESCOs, which are small firms providing EE services. ESCOs can finance projects based on performance contracts (typically taking 50-70 percent of monthly savings for four to six years). Many projects are on a fee-for-services basis. The Jordan Renewable Energy and EE Fund and the National Energy Efficiency Action Plan of Jordan can finance ESCOs.
> Lebanon had eight ESCOs in 2010, but now has only two. ESCOs provide services on a serve-for-fee basis (performance contracts have not taken hold). The Lebanese Centre for Energy Conservation promotes ESCOs. The Lebanese Association of Energy Saving and for Environment (ALMEE)
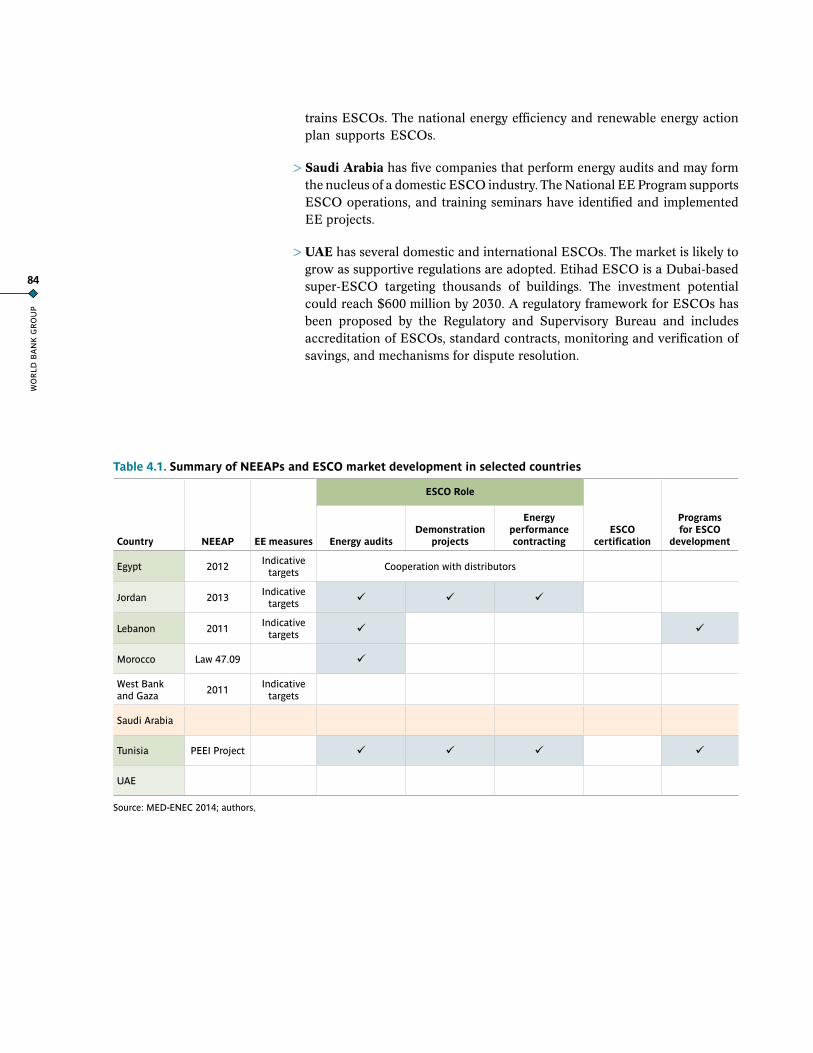
WO
RLD
BA
NK
GR
OU
P
84
trains ESCOs. The national energy efficiency and renewable energy action plan supports ESCOs.
> Saudi Arabia has five companies that perform energy audits and may form the nucleus of a domestic ESCO industry. The National EE Program supports ESCO operations, and training seminars have identified and implemented EE projects.
> UAE has several domestic and international ESCOs. The market is likely to grow as supportive regulations are adopted. Etihad ESCO is a Dubai-based super-ESCO targeting thousands of buildings. The investment potential could reach $600 million by 2030. A regulatory framework for ESCOs has been proposed by the Regulatory and Supervisory Bureau and includes accreditation of ESCOs, standard contracts, monitoring and verification of savings, and mechanisms for dispute resolution.
Country neeAP eemeasures
esCoRole
esCocertification
ProgramsforesCo
developmentenergyauditsdemonstration
projects
energyperformancecontracting
Egypt 2012Indicative
targetsCooperation with distributors
Jordan 2013Indicative
targets ü ü ü
Lebanon 2011Indicative
targets ü ü
Morocco Law 47.09 ü
West Bank and Gaza
2011Indicative
targets
Saudi Arabia
Tunisia PEEI Project ü ü ü ü
UAE
table4.1.summaryofneeAPsandesComarketdevelopmentinselectedcountries
Source: MED-ENEC 2014; authors.

De
liv
er
ing
en
er
gy
ef
fic
ien
cy
in
th
e M
iDD
le e
ast
an
D n
or
th
af
ric
a
85
utilityfinancing
National governments can introduce mandates or requirements on utilities to im-plement EE programs, directly in the case of state-owned utilities or indirectly though supply license obligations in the case of electricity markets with retail com-petition. The finance needed for these programs can be provided from the utility directly, through a public fund (often raised through public benefits charges—see below), or through commercial financing by a third party such as a local or inter-national finance institution (figure 4.8).
Figure4.8.sourceofutilityfinancingandavailablefinanceoptions
Source: Authors.
These forms of financial support can be channeled to the customer through util-ities, including grants, concessional loans, revolving funds, and other risk-miti-gation products. EE programs financed in this way provide a source of funding for customers to invest in EE through on-bill financing, and leverage the com-mercial relationship between the utility and its customers to recover the financial loans through installment charges on on-bill repayment, as in the example above of Egypt’s CFL distribution program. Utility-implemented EE programs are appro-priate in any of the end-use sectors, but the most appropriate form of support will depend on the type of EE measures and the market characteristics.
The results of the analysis in chapter 3 of utility EE finance programs provide some insights into effective utility programs. Most utilities in the six programs ana-lyzed were motivated to adopt EE by policy requirements, although some had busi-ness reasons particular to the local market. Some (mainly in developed-country markets) aimed to sell additional products or services, while others (in developed and developing economies) were impelled to pursue EE regardless of regulations to reduce the demand for electricity and put off investing in generation, transmis-sion and distribution.
Providing EE services in developing economies benefits the utility in many ways, and many utilities are now undertaking EE programs, generally in compli-ance with policy and regulatory obligations, to meet electricity demand cost-effec-tively. Utilities in South Africa, Thailand and India have all supported EE. Efficient lighting can substantially lower peak demand in all countries, but it is especially important in countries with inadequate generation and weak distribution. Finally, utilities in countries with subsidized tariffs that do not meet the cost of electricity supply may seek to lighten the subsidy burden by curtailing demand through EE.
As mentioned earlier, one of the most widely deployed utility EE programs worldwide, the installation of CFLs (as in the example from Egypt above), is very effective at cutting the peak demand load and saving energy. While some CFL programs were financed entirely by the utilities concerned, which provided free
Energy utilitycompany
Utility financing
Public financing
Commercial financing
✔
✔ ✔
✔
EE funds (grants & loans)
Concessional loans
> Lines of credit
> Revolving funds
> Risk mitigation products

WO
RLD
BA
NK
GR
OU
P
86
or subsidized CFLs to customers, others billed customers in installments through the billing system. Despite these programs’ apparent success, many utilities have been unable to sustain them without ongoing support from MDBs or other donors, primarily for lack of regulatory mandates and inability to recover program costs through tariff revisions.
Subsidized tariffs in many developing countries have discouraged program im-plementation, although reduced electricity sales resulting from electricity savings effectively reduce the subsidy burden. This underlines the need for an integrated approach to EE, with well-defined regulatory incentives and sustainable financing mechanisms.
Public benefits charge
National governments can raise finance to fund EE programs through a systems benefit charge, which is placed on the customer’s utility bill and collected by the utility. As a charge will raise the cost of energy for end users, it is best suited to markets where the energy price is not subsidized. Otherwise, it would result in a complicated finance mechanism in which government collects a charge to support EE while reducing the cost of energy and thereby discouraging EE.
The resulting EE fund can then be used by governments to provide public fi-nancing to support EE programs, which may be managed by the utility or state EE agencies, or other public or private agencies permitted by the regulators to imple-ment EE programs.
Where the electricity utilities are vertically integrated, state-owned monopolies, this charge is collected and managed by the utility, as, for example, in California. Where the electricity market is liberal, this charge is generally collected by the util-ity companies and managed by a dedicated state agency or agencies, or by the util-ities regulator (figure 4.9). Such funds allow EE development programs to address technical, regulatory, and market barriers to EE and support program implemen-tation through direct funding, incentives, and awareness and education initiatives.
Figure4.9.Managementofpublicbenefitchargedependingonelectricitymarket
structure
Source: Authors.
State-owned,vertically integrated
monopolies
Liberalizedenergy market
✔
✖
✔Public benefit
charge, managed
by utility
Public benefit
charge, managed
by state agency
✔

De
liv
er
ing
en
er
gy
ef
fic
ien
cy
in
th
e M
iDD
le e
ast
an
D n
or
th
af
ric
a
87
eleMent4.CAPACItyAndAwARenessbuIldInG
The organizations and institutions directly in-volved in implementation need the internal ca-pacity to deliver on EE programs, including dedi-cated, trained human resources with the expertise to develop and deliver the sector-based programs sustainably. In addition, effective implementa-tion of EE policies requires that all stakeholders are aware of the benefits of improved EE, which calls for the preparation of strong and well-tar-geted communication strategies. Element 4 in Figure 4.1 offers a few examples of the measures that can be used to build capacity and awareness.
Targeted efforts to build capacity are therefore an integral part of the enabling environment, and should include education initiatives to meet the requirements of all stakeholders. Germany (alongside the Netherlands and Denmark) is a global leader on the policy mix for improving EE in the buildings sector.29 Germany’s NEEAP indicates a strong governance framework, incorporating a good balance of information and advisory programs with finance and incentive schemes for the buildings sector, with minimum energy performance standards for new buildings and those undergoing major renovations.
Subsidies and policies can support highly efficient new buildings, designed to ensure capacity development and provision of information activities. Financial support, through grants and soft loans, is also available for single measures and for comprehensive retrofits, as well as for new construction outperforming standards. These actions go along with strong communication initiatives to inform and mo-tivate end users as well as professionals to improve EE in buildings. Collectively, the programs have achieved substantial market transformation in setting new stan-dards.
Although the overall objective of capacity-building initiatives and training pro-grams is to promote EE and create awareness of the benefits and the importance of reducing energy use, each sector has its own requirements. For example, within the industrial sector companies, ESCOs, utilities, equipment manufacturers, energy agencies, and commercial banks all need to understand why investment in EE is important.
Capacity building and training to consumers, project developers and lenders are also necessary to promote EE in the services sector, as its consumers generally have little information about the benefits of improved EE and the best options open to them. An example of a comprehensive capacity-building policy for the public sector can be found in the UK, where there is a strong public sector strategy, clear rules and standards for public procurement, and good activities to establish public buildings as a role model. The UK government buying standards program30 includes a set of technical performance specifications for energy consumption. It has three key levels: the minimum mandatory standard, best-practice examples, and the market leader. There is a web-based training program, supported by work-shops that aim to reach as many procurers as possible.
Capacity-building requirements change as a market matures, and so new infor-mation and training programs will be needed (figure 4.10).

WO
RLD
BA
NK
GR
OU
P
88
Figure4.10.Changingcapacity-andawareness-buildingrequirementsinlinewithincreasedmarketmaturity
Source: Authors.
To operate successfully, ESCOs require the enabling regulatory framework and environment to facilitate access to low-cost financing and sufficient awareness of EE benefits. Specific actions are therefore often required to prepare the market for ESCO financing by increasing the technical capacity of the relevant intuitions. For example, in Mexico, EPS Capital conducted a staff training program for lo-cal financial institutions, which included recommended approaches to evaluating EE projects and the associated risks, and helped financial institutions understand the ESCO performance models. EPS Capital Corp. also worked with NAFIN on developing guarantee products to mitigate the risks perceived by local financial institutions. More generally, support for EE could increase through clean energy curricula deployed at schools, training institutes, and universities.
More generally, communications, capacity- and awareness-building initiatives are needed to ensure that the market for EE products and services develops with credibility and integrity. Certification programs would provide assurance to con-sumers and build their confidence in EE investment. These programs should in-clude manufacturers of EE equipment and appliances, as well as service providers and equipment installers.
The potential for sharing public communications strategies exists. Building pub-lic awareness of and support for the benefits of EE are essential to the success of many EE measures. Such efforts would benefit from a shared language (Arabic) and cultural similarities among countries. Today, most countries in the region share the same or overlapping broadcast and other electronic media, so public informa-tion campaigns can reach consumers in many countries cost-effectively.
MA
RK
ET
MA
TU
RIT
Y
ESCO training and awareness programs
Industry- specific energy
managertraining programs
Publicprocurement
rules and standards
relating to EE
SectoralEE information
programs
Financialinstitution
trainingprogram
Utility EE training
program
SectoralEE information
programs
EE publicawarenesscampaign
De
liv
er
ing
en
er
gy
ef
fic
ien
cy
in
th
e M
iDD
le e
ast
an
D n
or
th
af
ric
a
89
eleMent5.InFoRMAtIonAndRePoRtInG
Developing and introducing a new EE policy is the first step to delivering energy savings, real-izing national economic benefits, and improving social welfare. To sustain government commit-ment and encourage continued investment in EE, an evidence base will be needed, reporting the national economic benefits from existing pol-icies and raising the profile of EE in the country as a whole. Element 5 in Figure 4.1 lists some of the key information and reporting requirements.
EE improvments (MRV)
Reliable and robust MRV systems and program evaluation help ensure the achieve-ment of EE policy goals. The data collected through the MRV systems can com-municate the effectiveness of current initiatives. A standardized data gathering methodology will enable the production of statistical reports that include cost-ef-fectiveness and other performance metrics. Of critical importance is the setting of baselines for energy consumption and efficiency against which to measure out-comes of interventions, whether site-specific or sector-wide. The existing data gathering and reporting systems in many MENA countries are likely to benefit from internationally used systems such as the IPMVP (International Performance Measurement and Verification Protocol), which can be adapted.
Statistical Reporting
Another crucial piece of the enabling environment is timely provision of action-able information to consumers. This can include, for instance, periodic real-time information on energy consumption, the cost of that energy use, and possible steps to reduce it. Metering systems have been effective internationally in reliably gath-ering information on energy use and in monitoring energy savings. Outcomes from individual measures can be aggregated by statistical systems into an account of the national benefits of the overall EE program.
Almost all consumers in Sudan have prepaid meters. The meter rollout pro-gram arose in response to the high amount of nontechnical losses in the electrical network and difficulties in collecting fees from customers. Through prepaid meter-ing, customers can monitor their electricity consumption and can either purchase electricity from the distribution company directly or pay through ATMs, mobile banking, and the Internet. Before prepaid meters, overall system losses were in the order of 40 percent annually. They are now about 25 percent. A substantial portion of the 15 percent savings is due to a reduction in nontechnical losses. Sudan is also considering introducing remote monitoring and accurate accounting of electrical losses (RCREEE 2015).
For their part, utilities and EE agencies can conduct customer load surveys to understand energy consumption patterns over a day and seasonally, and design suitable EE programs. Data analysis may be conducted at the customer sector and end-use levels.

WO
RLD
BA
NK
GR
OU
P
90
Best Practices
There is also a need to promote best practice and spread information on ways to overcome barriers to EE programs. Stakeholders within MENA will also benefit from sharing their own experiences of adapting EE finance and delivery mecha-nisms and learning from the experiences of others within the region.
MENA countries are therefore likely to benefit from forming a regional work-ing group of participants directly involved in EE programs. The Arab Ministerial Council of Electricity has already formed such a group, which introduced NEEAP to the region. Also, RCREEE acts as a regional platform that helps 16 MENA country progress with their EE plans. This parallels activity elsewhere: the Con-certed Action group set up by the European Commission to support implementa-tion of the Energy Services Directive is one example covering multiple countries, each challenged by the barriers to implementing new and advanced EE policies.
APPROACHES TO EE FOR NET ENERGY EXPORTERS AND IMPORTERS
Whether a country is a net energy exporter or importer has a direct bearing on the priorities for national energy policy, and energy efficiency is no exception. It can affect the industries and government agencies relevant to EE, public awareness and support for EE, as well as the perceived national benefits from successful delivery of EE.
This section looks first at the key differences between net energy (primarily oil, but also natural gas) importing and oil-exporting countries, and then examines the characteristic differences within these two main groupings. A series of high level EE Action Plan templates that can be used to deliver on EE are then suggested as a starting point for the groups of countries with similar characteristics.
Finally, the section presents options that may be appropriate for countries in the three subregions of MENA.
differencesbetweennetenergyimportingandexportingcountries
Table 4.2, below, outlines how these countries are likely to differ in terms of how the recent fall in oil prices is likely to affect them—the national policy drivers / mo-tivation to improve EE, the general financial characteristics of oil exporters versus oil importers (although it is recognized that there are some exceptions within this general categorization).
Several other country-dependent market characteristics are likely to affect the implementation of energy efficiency policies, the most significant of which are at the bottom of the table.

De
liv
er
ing
en
er
gy
ef
fic
ien
cy
in
th
e M
iDD
le e
ast
an
D n
or
th
af
ric
a
91
table4.2.Comparisonofnetenergyexportersandimporters
OIL EXPORTER1 OIL IMPORTER
GLOBAL TRENDS / FALL IN OIL PRICES
> Lost revenues -- Need to reduce energy intensity / increase GDP
> Improved energy affordability – facilitates reduction in energy subsidies
MOTIVATION TO IMPROVE EE
> Increase economic benefit (increased exports)
> Reduce energy intensity
> Increase sustainability (Global Climate Change targets?)
> Increase security of supply
> Reduced investment in electricity infrastructure (generation, transmission, and distribution)
> Increased affordability (increased GDP)
> Increase sustainability (Global Climate Change targets?)
FINANCIAL MARKET CHARACTERISTICS
> High level of capitalization
> Fully functional banking system
> Generally lower (weighted average cost of capital) WACC / perceived risk
> Low level of capitalization
> Weakly functional banking system
> Generally higher (weighted average cost of capital) WACC / perceived risk
OTHER MARKET CHARACTERISTICS (COUNTRY DEPENDENT)
> Stage of energy policy development
> Energy market structure
> Institution responsible for EE
> Level of energy subsidy
> Level of institutional capacity and stakeholder awareness for the benefits of EE
> Public support for policies to encourage investment in EE / reduction on energy subsidy
Source: Authors.
Based on the characteristic differences within the two main groupings, decision trees can be constructed to guide consideration of which of the suggested EE Action Plans, or elements thereof, would be most appropriate. The key characteristics include:
1. Energy market structure:
> In countries with state owned vertically integrated utilities EE programs driven by utilities are likely to be effective. Conversely,
> In countries with liberalized energy markets the energy (utility) regulator and/or dedicated state agency will have a more significant role.
2. The level of capitalization / availability of finance is likely to affect the ability to mobilize funds, and also the composition of those funds (private vs. public), and therefore the type and level of financial support required to support EE development.
3. The stage of EE development is also a key consideration in deciding which programs and measures are likely to be most effective. For an initiative to

WO
RLD
BA
NK
GR
OU
P
92
be successful the market must be ready to receive and implement it. It is therefore important to have:
> The necessary institutional structure is in place to support the initiative.
> Finance available for investment.
> Public awareness/support for the initiative so consumers understand benefits.
Figure 4.11 shows the proposed typology for net energy exporting countries, and figure 4.12 shows the proposed typology for net energy importing countries. Note that liberalised energy markets include those with a single buyer and partial, some or full unbundling. In deciding on which stage of EE development to assign to a given country, the assessment of domestic experts should be considered alongside information provided in this report and others, e.g. RCREEE (2015).
The countries can be grouped into one of 12 different categories (country types), which share certain similarities in their approach to developing a successful approach to delivering EE.
For these 12 country types (categories), eight high-level EE action plans aimed at delievering EE were developed (Table 4.3). Only eight were developed, as some of the action plans may be appropriate to more than one country type. For exam-ple, countries with a vertically integrated energy market and a low availability of fi-nance at the early stage of EE development are likely to adopt similar EE programs and measures regardless of whether they are an oil importer or an oil exporter. However, the net oil exporter will benefit economically from increased exports and reduced energy intensity, whereas the net oil importer will benefit from increased security of supply resulting from less outages and the ability to afford to invest in grid/network infrastructure.
tyPoloGyoFCountRyCAteGoRyAndtyPekey
CountryCategory: Exporting country (EX); Importing country (IM)
energyMarketstructure: Vertically integrated (VI); Liberalized energy market (LM)
levelofCapitalization:High (H); Low (L)
stageofeedevelopment: Early (E); Intermediate (I)

De
liv
er
ing
en
er
gy
ef
fic
ien
cy
in
th
e M
iDD
le e
ast
an
D n
or
th
af
ric
a
93
Figure4.11.typologyofnetenergyexportingcountries)ex(
Trade balanceStage of EE
developmentCountrycategory
Verticallyintegrated (VI)
Energy marketstrucutre
Liberalizedenergy market (LM)
Net energyexporting
Level ofcapitalization
High (H)
High (H)
Low (L)
Early (E)
Intermediate (I)
Early (E)
Intermediate (I)
Early (E)
Intermediate (I)
EX-1
EX-2
EX-3
EX-4
EX-5
EX-6
Source: Authors.
Figure4.12.typologyofnetenergyimportingcountries)IM(
Trade balanceStage of EE
developmentCountrycategory
Verticallyintegrated (VI)
Energy marketstrucutre
Liberalizedenergy market (LM)
Net energyimporting
Level ofcapitalization
High (H)
Low (L)
Low (L)
Early (E)
Intermediate (I)
Early (E)
Intermediate (I)
Early (E)
Intermediate (I)
IM-1
IM-2
IM-3
IM-4
IM-5
IM-6
Source: Authors.
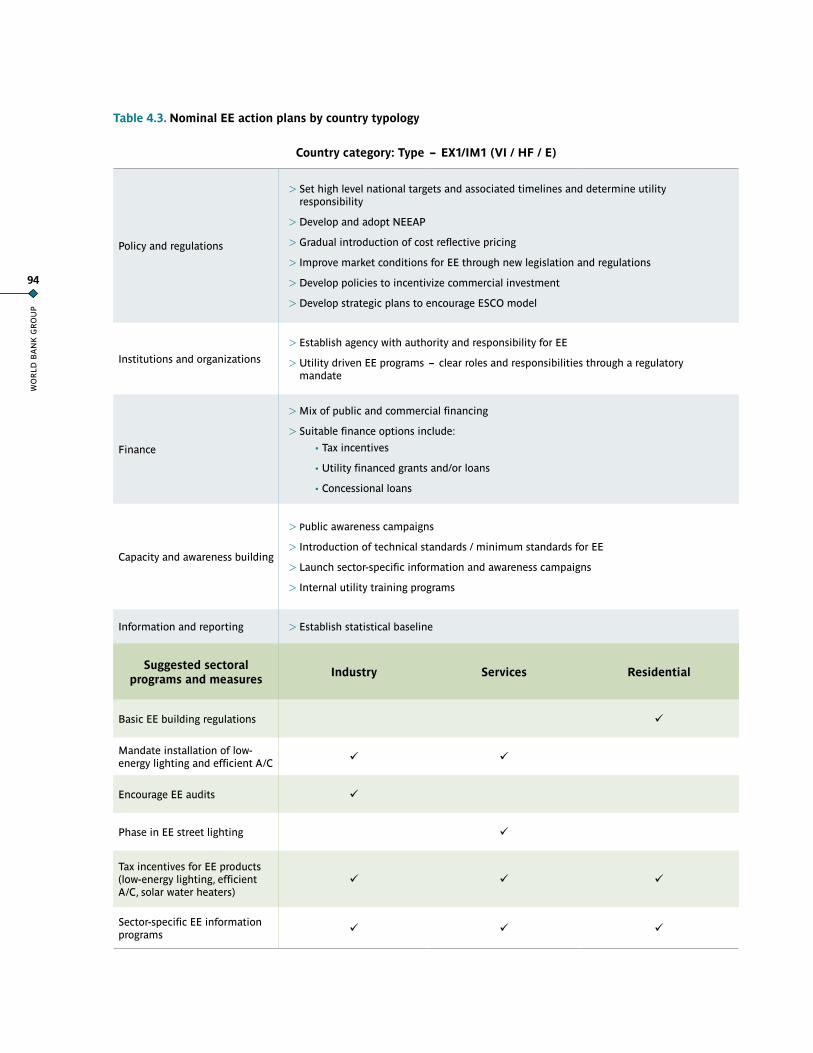
WO
RLD
BA
NK
GR
OU
P
94
table4.3.nominaleeactionplansbycountrytypology
Countrycategory:type–ex1/IM1)vI/hF/e(
Policy and regulations
> Set high level national targets and associated timelines and determine utility responsibility
> Develop and adopt NEEAP
> Gradual introduction of cost reflective pricing
> Improve market conditions for EE through new legislation and regulations
> Develop policies to incentivize commercial investment
> Develop strategic plans to encourage ESCO model
Institutions and organizations
> Establish agency with authority and responsibility for EE
> Utility driven EE programs – clear roles and responsibilities through a regulatory mandate
Finance
> Mix of public and commercial financing
> Suitable finance options include:
• Tax incentives
• Utility financed grants and/or loans
• Concessional loans
Capacity and awareness building
> Public awareness campaigns
> Introduction of technical standards / minimum standards for EE
> Launch sector-specific information and awareness campaigns
> Internal utility training programs
Information and reporting > Establish statistical baseline
suggestedsectoralprogramsandmeasures
Industry services Residential
Basic EE building regulations ü
Mandate installation of low-energy lighting and efficient A/C ü ü
Encourage EE audits ü
Phase in EE street lighting ü
Tax incentives for EE products (low-energy lighting, efficient A/C, solar water heaters)
ü ü ü
Sector-specific EE information programs ü ü ü

De
liv
er
ing
en
er
gy
ef
fic
ien
cy
in
th
e M
iDD
le e
ast
an
D n
or
th
af
ric
a
95
Countrycategory:type–ex2/IM2)vI/hF/I(
Policy and regulations
> Evaluate progress towards achieving high level national targets
> Review and revise NEEAP
> Set new high level targets and associated timelines with utilities
> Continue progression towards cost reflective pricing
> Continue to incentivize commercial investment – gradual withdrawal of public funding
> Evaluate current legislation and regulation and introduce new requirements to improve market conditions for ESCOs
Institutions and organizations
> Review performance of agency with authority and responsibility for EE – introduce new / advanced programs
> Utility driven EE programs – moving towards the development of ESCOs and Super ESCOs
Finance
> Development of ESCO market financed by commercial financing (local and/or international institutions)
> Continuation of utility driven programs – including finance options:
• Tax incentives
• Utility financed on-bill repayment
• Concessional loans
Capacity and awareness building
> Enforcement of regulatory technical standards for EE
> More targeted sectoral programs – targeting specific industries and technologies
> Residential programs to encourage retro-fit linked to utility on-bill repayment
> Utility training initiatives targeted at ESCO market development
Information and reporting > Develop more sophisticated energy end-use data-bases
suggestedsectoralprogramsandmeasures
Industry services Residential
Improved EE building regulations (incl. appliance labelling)
P
Targeted industry specific measures P
Mandate ISO 50001 P
ESCO development programs P P P
Mandate EE street lighting P
Tax incentives for EE products (low-energy lighting, efficient A/C, solar water heaters)
P P P

WO
RLD
BA
NK
GR
OU
P
96
Countrycategory:type–ex3/IM3)vI/lF/e(
Policy and regulations
> Set high level national targets and associated timelines and determine utility responsibility
> Develop and adopt NEEAP – implement actions that will show results quickly
> Gradual introduction of cost reflective pricing
> Improve market conditions for EE through new legislation and regulations
> Development of strategic plans to mobilise commercial finance
Institutions and organizations
> Establish agency with authority and responsibility for EE
> Utility driven EE programs – clear roles and responsibilities through a regulatory mandate
Finance
> Largely public financing channelled through utilities
> Free (utility financed) EE lighting to residential consumers
> Fiscal incentives include:
• Tax rebates
• Utility financed grants and/or loans
• Government grants
Capacity and awareness building
> Public awareness campaigns / education on how to reduce energy bills
> Introduction of technical standards / minimum standards for EE
> Launch sector-specific information and awareness campaigns
> Internal utility training programs
Information and reporting > Establish statistical baseline
suggestedsectoralprogramsandmeasures
Industry services Residential
Basic EE building regulations P
Bulk utility procurement of low-energy lighting (CFL) P P P
Encourage EE audits P
Phase in EE street lighting P
Tax rebates/ exemption from VAT for EE products (low-energy lighting, efficient A/C, solar water heaters)
P P P
Targeted social safety net program P

De
liv
er
ing
en
er
gy
ef
fic
ien
cy
in
th
e M
iDD
le e
ast
an
D n
or
th
af
ric
a
97
Countrycategory:type–ex4/IM4)vI/lF/I(
Policy and regulations
> Evaluate progress towards achieving high level national targets
> Review and revise NEEAP
> Set new high level targets and associated timelines with utilities
> Move towards the introduction of a public benefits charge
> Evaluate current legislation and regulation and introduce new requirements to improve market conditions for EE
> Initiatives to encourage gradual move towards mobilisation of commercial financing (local and international)
Institutions and organizations
> Strengthen existing agency with authority and responsibility for EE – introduce new / advanced programs
> Development of utility driven EE programs – outsourcing large public sector initiatives (EE street lighting) to ESCOs where possible
Finance
> Mix of public and commercial financing
> Utility managed finance (public benefits charge)
> Suitable finance options include:
• Public financing – provision of credit lines / loans to local financial institutions for on-lending to projects
• Utility financed on-bill re-payment
• Utility / local banking financed concessional loans (part financed by international institutions)
Capacity and awareness building
> Enforcement of regulatory technical standards for EE
> More targeted sectoral programs – targeting specific industries and technologies
> Residential programs to encourage retro-fit linked to utility on-bill repayment
Information and reporting > Develop more sophisticated energy end-use data-bases
suggestedsectoralprogramsandmeasures
Industry services Residential
Improved EE building regulations (incl. appliance labelling)
P
Enforce performance standards across all sectors P P P
Mandate ISO 50001 P
Mandate EE street lighting P
Provision of credit for investment in EE improvements P P P

WO
RLD
BA
NK
GR
OU
P
98
Countrycategory:type–ex5)lM/hF/e(
Policy and regulations
> Set high level national targets and associated timelines
> Develop and adopt NEEAP
> Gradual introduction of cost reflective pricing
> Improve market conditions for EE through new legislation and regulations
> EE programs managed by public sector / government
> Develop policies to incentivize commercial investment
> Develop strategic plans to encourage ESCO model
Institutions and organizations
> Establish agency with authority and responsibility for EE
> Introduction of voluntary utility supplier obligation (via supply licence)– agreement of EE targets and timelines
Finance
> Mix of public and commercial financing
> Suitable finance options include:
• Tax incentives
• Utility financed grants and/or loans
• Concessional loans
Capacity and awareness building
> Public awareness campaigns
> Introduction of technical standards / minimum standards for EE
> Launch sector-specific information and awareness campaigns
> Communications program encouraging purchase of EE equipment
Information and reporting > Establish statistical baseline
suggestedsectoralprogramsandmeasures
Industry services Residential
Basic EE building regulations P
Mandate installation of low-energy lighting and efficient A/C
P P
Encourage EE audits P
Phase in EE street lighting P
Introduce a ban on (enforce) energy inefficient products. P
Tax incentives for EE products (low-energy lighting, efficient A/C, solar water heaters)
P P P
Sector-specific EE information programs P P P

De
liv
er
ing
en
er
gy
ef
fic
ien
cy
in
th
e M
iDD
le e
ast
an
D n
or
th
af
ric
a
99
Countrycategory:type–ex6)lM/hF/I(
Policy and regulations
> Evaluate progress towards achieving high level national targets
> Review and revise NEEAP
> Continue progression towards cost reflective pricing
> Evaluate current legislation and regulation and introduce new requirements to improve market conditions for ESCOs
> Continue to incentivize commercial investment – gradual withdrawal of public funding
Institutions and organizations
> Review performance of agency with authority and responsibility for EE – introduce new / advanced programs
> Introduce mandatory obligation on utility supplier obligation (via supply licence)
> Initiatives to encourage the development of ESCOs and Super ESCOs
Finance
> Development of ESCO market financed by commercial financing (local and/or international institutions)
> Suitable finance options include:
• Tax incentives
• Utility financed on-bill re-payment
• Concessional loans
Capacity and awareness building
> Enforcement of regulatory technical standards for EE
> More targeted sectoral programs – targeting specific industries and technologies
> Residential programs to encourage retro-fit linked to utility on-bill repayment
> Introduction of training programs within utilities and industry including benefits of transition to ESCO model
Information and reporting > Develop more sophisticated energy end-use data-bases
Suggested sectoral programs and measures Industry services Residential
Improved EE building regulations (incl. appliance labelling)
P
Targeted industry specific measures P
Mandate ISO 50001 P
ESCO development programs P P P
Mandate EE street lighting P
Tax incentives for EE products (low-energy lighting, efficient A/C, solar water heaters)
P P P

WO
RLD
BA
NK
GR
OU
P
100
Countrycategory:type–IM5)lM/lF/e(
Policy and regulations
> Set high level national targets and associated timelines
> Develop and adopt NEEAP – implement actions that will show results quickly
> Gradual introduction of cost reflective pricing
> Improve market conditions for EE through new legislation and regulations
> EE programs managed by public sector / government
> Development of strategic plans to mobilise commercial finance
Institutions and organizations
> Establish agency with authority and responsibility for EE
> Introduction of voluntary utility supplier obligation (via supply licence)– agreement of EE targets and timelines
Finance
> Largely public financing through government agencies
> Free (government financed) EE lighting to residential consumers
> Fiscal incentives include:
• Tax rebates
• Utility financed grants and/or loans
• Government grants
Capacity and awareness building
> Public awareness campaigns / education on how to reduce energy bills
> Introduction of technical standards / minimum standards for EE
> Launch sector-specific information and awareness campaigns
> Communications program providing advice to consumers on the cost of using EE equipment
Information and reporting > Establish statistical baseline
suggestedsectoralprogramsandmeasures
Industry services Residential
Basic EE building regulations P
Government subsidized provision of low-energy lighting (CFL)
P P P
Encourage EE audits P
Phase in EE street lighting P
Tax rebates/ exemption from VAT for EE products (low-energy lighting, efficient A/C, solar water heaters)
P P P
Targeted social safety net program P

De
liv
er
ing
en
er
gy
ef
fic
ien
cy
in
th
e M
iDD
le e
ast
an
D n
or
th
af
ric
a
101
Countrycategory:type–IM6)lM/lF/I(
Policy and regulations
> Evaluate progress towards achieving high level national targets
> Review and revise NEEAP
> Move towards the introduction of a public benefits charge
> Evaluate current legislation and regulation and introduce new requirements to improve market conditions for EE
> Initiatives to encourage gradual move towards mobilisation of commercial financing (local and international)
Institutions and organizations
> Review performance of agency with authority and responsibility for EE – introduce new / advanced programs
> Introduce mandatory obligation on utility supplier obligation (via supply licence)
> Development of ESCO managed EE programs – outsourcing large public sector initiatives (EE street lighting) to ESCOs where possible
Finance
> Mix of public and commercial financing
> Agency managed finance (public benefits charge)
> Suitable finance options include:
• Public financing – provision of credit lines / loans to local financial institutions for on-lending to projects
• Utility financed on-bill re-payment
• State / local banking financed concessional loans (part financed by international institutions)
Capacity and awareness building
> Enforcement of regulatory technical standards for EE
> More targeted sectoral programs – targeting specific industries and technologies
> Residential programs to encourage retro-fit linked to utility on-bill repayment
Information and reporting > Develop more sophisticated energy end-use data-bases
suggestedsectoralprogramsandmeasures
Industry services Residential
Improved EE building regulations (incl. appliance labelling)
P
Enforce performance standards across all sectors P P P
Mandate ISO 50001 P
Mandate EE street lighting P
Provision of credit for investment in EE improvements
P P P
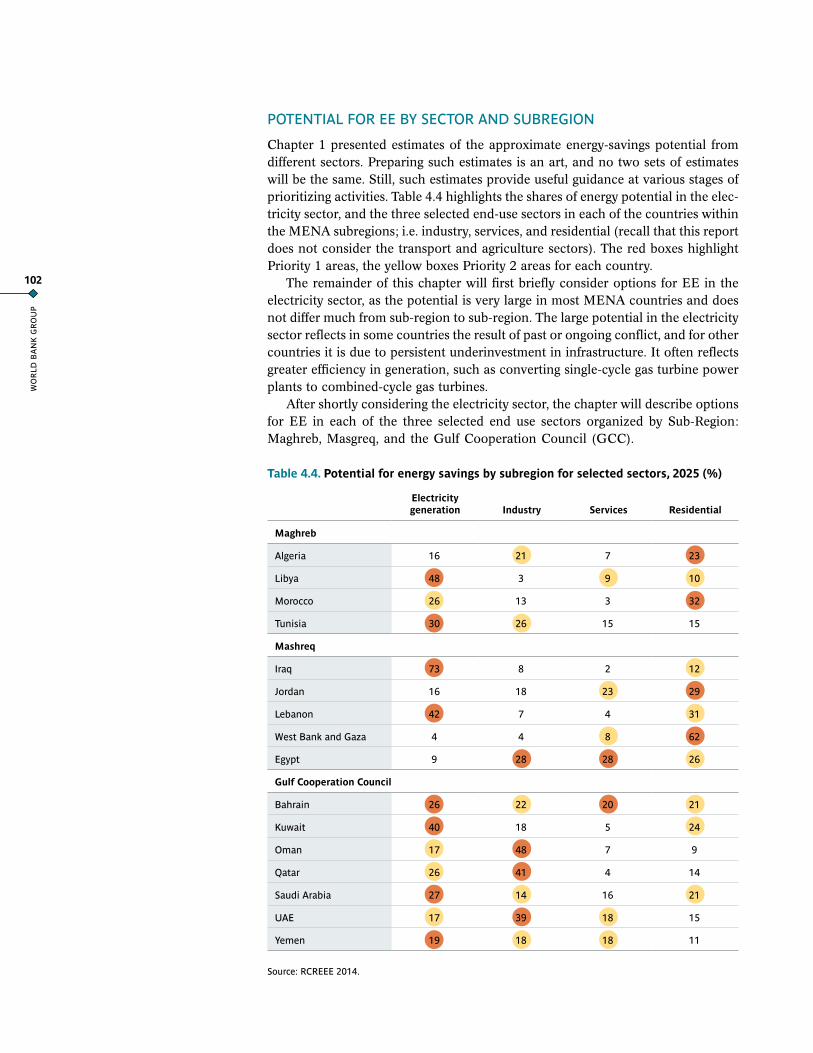
WO
RLD
BA
NK
GR
OU
P
102
POTENTIAL FOR EE BY SECTOR AND SUBREGION
Chapter 1 presented estimates of the approximate energy-savings potential from different sectors. Preparing such estimates is an art, and no two sets of estimates will be the same. Still, such estimates provide useful guidance at various stages of prioritizing activities. Table 4.4 highlights the shares of energy potential in the elec-tricity sector, and the three selected end-use sectors in each of the countries within the MENA subregions; i.e. industry, services, and residential (recall that this report does not consider the transport and agriculture sectors). The red boxes highlight Priority 1 areas, the yellow boxes Priority 2 areas for each country.
The remainder of this chapter will first briefly consider options for EE in the electricity sector, as the potential is very large in most MENA countries and does not differ much from sub-region to sub-region. The large potential in the electricity sector reflects in some countries the result of past or ongoing conflict, and for other countries it is due to persistent underinvestment in infrastructure. It often reflects greater efficiency in generation, such as converting single-cycle gas turbine power plants to combined-cycle gas turbines.
After shortly considering the electricity sector, the chapter will describe options for EE in each of the three selected end use sectors organized by Sub-Region: Maghreb, Masgreq, and the Gulf Cooperation Council (GCC).
table4.4.Potentialforenergysavingsbysubregionforselectedsectors,2025)%(
Source: RCREEE 2014.
electricitygeneration Industry services Residential
Maghreb
Algeria 16 21 7 23
Libya 48 3 9 10
Morocco 26 13 3 32
Tunisia 30 26 15 15
Mashreq
Iraq 73 8 2 12
Jordan 16 18 23 29
Lebanon 42 7 4 31
West Bank and Gaza 4 4 8 62
Egypt 9 28 28 26
GulfCooperationCouncil
Bahrain 26 22 20 21
Kuwait 40 18 5 24
Oman 17 48 7 9
Qatar 26 41 4 14
Saudi Arabia 27 14 16 21
UAE 17 39 18 15
Yemen 19 18 18 11

De
liv
er
ing
en
er
gy
ef
fic
ien
cy
in
th
e M
iDD
le e
ast
an
D n
or
th
af
ric
a
103
REGION-WIDE OPTIONS FOR EE IN THE ELECTRICITY SECTOR
All stakeholders could benefit from efficiency improvements in the electricity supply-side operation, as the gains would also result in an increased reliability of electricity supply and therefore fewer blackouts. The electrical utilities will benefit substantially from reduced system losses, which will ultimately lower the need to invest in new generation, transmission, and distribution capacity. In the countries with the greatest potential to improve EE in the electricity generation sector, the utilities are all vertically integrated and state-owned monopolies. Thus, the utilities are the best positioned to deliver the improvement programs.
Enabling environment
> Policy and regulation: Governments need to agree on an overall plan, such as the NEEAPs that many countries in the MENA region have already adopted, that includes EE targets and associated timelines with the utilities.
> Institutions and organizations: Clear roles and responsibilities for EE and regulatory mandates, or voluntary obligations for utilities, need to be set.
> Finance:
•More cost-reflective prices and efficient collection, alongside EE policies and measures to allow public funds to be made available for investment in EE improvements, should be brought in gradually.
•Public funds could be combined with funding from international donor agencies to maximize funding.
•Governments could also consider introducing a public benefits charge when retail prices become more fully reflective of costs.
> Communications and capacity building: Training programs at utilities are essential. A well-planned and -targeted national/regional communication and awareness campaign is essential.
> Reporting and information: A benchmark is needed to compare and track EE improvements.
Recommended first measures
The first step in preparing to deliver an EE improvement program is to prepare the market and to create awareness among stakeholders that may benefit from the pro-gram. The stakeholders, and indeed the public, should understand that the delivery of EE is a long journey and that it takes time for individuals to notice the benefits. At the outset, the following initial measures are thus recommended:
> Gradual introduction of more cost-reflective prices alongside EE policies and measures.
> EE training program for utilities.
> National EE awareness campaigns.
These are likely to improve awareness, particularly within the utilities, which will provide a firm foundation to progress to the next stage.

WO
RLD
BA
NK
GR
OU
P
104
Intermediate measures
> Convert existing power plants using crude oil to combined-cycle gas power plants.
> Lower transmission losses by strengthening the grid and its maintenance and management.
> Reduce losses in the distribution network by adopting better distribution planning and improving maintenance and management.
> Rebalance loads across phases and improve maintenance standards.
OPTIONS FOR EE MEASURES BY SUB-REGION
The following tables indicate the considerable potential for improving EE across each of the end use sectors, although the delivery mechanism is likely to vary by subregion due to market characteristics. The greatest potential for end use EE im-provement is in the industry and residential sectors (table 4.4). Options for appro-priate delivery mechanisms for each are now considered.
MAGHREB
table4.5.Maghreb—Potentialforenergysavingsbysector,2025)%(
Industry services Residential
Algeria 21 7 23
Libya 3 9 10
Morocco 13 3 32
Tunisia 26 15 15
Source: RCREEE 2014.
Industry
EE initiatives are already taking place—programs in Tunisia are the most advanced, notably EE industrial improvements. Industrial establishments with annual energy consumption exceeding 800 toe have energy audits, dedicated energy managers, and energy reports submitted annually—all mandatory.
For new industrial projects whose total projected energy consumption exceeds 800 toe a year, prior consultation with ANME is mandatory, as it is for new con-struction projects for residential and services sectors whose total projected en-ergy consumption exceeds 200 toe a year. New industrial projects or expansion of existing industrial facilities whose total annual projected energy consumption exceeds 7,000 toe require prior authorization from the ministry in charge of energy. A dedicated EE unit in a Tunisian bank has expanded the flow of EE projects and demand for financing, pointing to one possible means of scaling up investments elsewhere.

De
liv
er
ing
en
er
gy
ef
fic
ien
cy
in
th
e M
iDD
le e
ast
an
D n
or
th
af
ric
a
105
In view of progress toward EE improvement and the capabilities of utilities in the subregion, utility-delivered programs are appropriate. Outsourcing EE program implementation to ESCOs may also be highly relevant.
Based on the comparisons of retail electricity prices and the estimates of energy savings potential in chapter 1, Algeria and Tunisia will benefit greatly from invest-ment in EE.
Enabling environment
> Policy and regulation:
•Governments need to agree on EE targets with energy supply utilities.
•Appropriate regulatory frameworks will support utility-delivered programs and development of the ESCO market.
> Institutions and organizations:
•Utilities and EE service providers like ESCOs must have clear roles and responsibilities through a regulatory mandate or voluntary obligation.
> Finance:
•Initially public (and/or donor) funds should move toward a public benefits charge after a gradual introduction of more cost-reflective prices alongside EE policies and measures.
•Allocation of public funding to encourage and assist development of the ESCO market, alongside establishment of appropriate market conditions.
> Communications and capacity building:
•Introduce training program within utilities and industry, including training in developing the ESCO market.
•Support creation of dedicated EE units in domestic financial institutions, which are essential to sustainable, scalable investments in EE.
Recommended first measures
> Mandate industrial facilities to install efficient lighting.31
> Mandate energy audits in all small and medium industries and in large commercial and service facilities (including malls, hospitals and schools).
> Mandate energy-intensive industries to conform to ISO 5000132 standards or an equivalent energy management protocol.
> Launch sector-specific information and awareness programs.
These should deliver savings quickly and identify further opportunities. Com-bined with improved awareness, they should encourage further investment, leading to intermediate measures.

WO
RLD
BA
NK
GR
OU
P
106
Intermediate measures
> Identify opportunities for cost-effective savings in motor-driven systems, large boilers and compressed air systems.
> Identify industrial equipment to comply with minimum efficiency standards.
> Develop financing mechanisms to support small and medium industries in installing EE equipment.
Residential
One or more dedicated state agencies with the requisite authority are usually the best delivery mechanism.
Based on the comparisons of retail electricity prices and the estimates of en-ergy savings potential in chapter 1, Algeria and Morocco will benefit greatly from investment in EE.
Enabling environment
> Policy and regulation: Governments need to decide on short-term targets and basic actions that will deliver demonstrable results within a short period.
> Institutions and organizations: Governments should assign authority and responsibility for EE programs to one or more state agencies dedicated to EE or with a broader mandate.
> Finance: Initial public and/or donor funds (like Tunisia’s FNME) could move toward a public benefits charge after a gradual introduction of more cost-reflective prices as needed and in line with other key considerations.
> Communications and capacity building: Raise awareness of the benefits of EE among residential consumers.
Recommended first measures
> Continue to strengthen initial steps to phase out inefficient lighting across sectors, and support consumer choice of more efficient products already available in the market, especially air conditioners.33
> Introduce standards and regulations to ban the use of energy-inefficient lighting, and enforce regulations where they have been adopted (Algeria, Morocco, and Tunisia).
> Launch communications programs to improve awareness of EE benefits, including relatively simple “housekeeping” actions that can be easily and inexpensively taken to save energy.
> Launch a public awareness campaign to inform consumers of the running costs of electrical equipment, particularly of inefficient equipment (such as air conditioners).
These should deliver savings quickly and identify further opportunities. Com-bined with improved awareness, they should encourage further investment, leading to intermediate measures.

De
liv
er
ing
en
er
gy
ef
fic
ien
cy
in
th
e M
iDD
le e
ast
an
D n
or
th
af
ric
a
107
Intermediate measures
> Develop and enforce mandatory equipment labeling and performance standards (Algeria and Tunisia have already introduced standards).
> Explore opportunities for harmonizing standards and labels regionally, as well as infrastructure to support implementation.
> Develop mandatory regulations and enforce building energy codes to improve EE in existing and new residential buildings.
> Develop financing mechanisms to encourage residential consumers to purchase (invest in) EE equipment.
MASHREQ
Table 4.6 indicates the share of total EE potential attributable to the three end use sectors in each country. All countries will benefit substantially from improved EE among in the residential sector. The potential for improvement in services is great-est in Egypt, Jordan, and West Bank and Gaza. Egypt’s industrial sector has a wide scope for improvement.
table4.6.Mashreq—Potentialforenergysavingsbysector,2025)%(
Industry services Residential
Iraq 8 2 12
Jordan 18 23 29
Lebanon 7 4 31
West Bank and Gaza 4 8 62
Egypt 28 28 26
Source: RCREEE 2014.
With a liberalized electricity supply market in Jordan and West Bank and Gaza, obliging energy suppliers to deliver EE improvements to the end use sectors could be effective. Outsourcing program implementation to ESCOs is also highly relevant.
Utilities in Egypt and Lebanon have been modernizing and are expanding ca-pacity to deliver EE programs to end use sectors. Many distribution utilities in Egypt, for instance, are already leading EE programs, such as distribution of ef-ficient lights and provision of EE audits, through dedicated EE divisions. Where utilities have less capacity to address end use EE, such as Iraq, setting up one or more dedicated EE agencies may be appropriate.
Enabling environment (West Bank and Gaza and Jordan)
> Policy and regulation:
•Build on current sectoral targets to agree with utilities on overall plan and timeline for activities to promote adoption of EE measures by customers.
•Develop a regulatory framework to support utility-delivered EE programs, and develop the ESCO market.

WO
RLD
BA
NK
GR
OU
P
108
> Institutions and organizations: Utilities need to have clear roles and responsibilities in industry through a regulatory mandate or voluntary obligation.
> Finance:
•Complement relatively high (for the MENA region) electricity tariffs with public EE funds, gradually replacing them with a public benefits charge.
•Allocate public funding to encourage and assist development of the ESCO market.
> Communications and capacity building: Introduce a training program in utilities and industry, including training in developing the ESCO market.
> Education: Implement a national EE campaign to enhance awareness and build support for EE.
Enabling environment (Egypt, Iraq, and Lebanon)
> Policy and regulation: In line with NEEAPs already adopted, implement targets and actions that will show demonstrable results quickly.
> Institutions and organizations: Strengthen existing agencies or, where lacking, assign authority for EE programs to dedicated state agencies.
> Finance: Initial public (and/or donor) funds, potentially along the lines of Tunisia’s FNME, could move toward a public benefits charge after gradual introduction of more cost-reflective prices alongside EE policies and measures.
> Communications and capacity building: Increase awareness of EE benefits among end use consumers.
Residential
Based on the comparisons of retail electricity prices and the estimates of energy savings potential in chapter 1, improving EE in the residential sector will deliver considerable benefits to all subregional countries, particularly Jordan and West Bank and Gaza. Because the residential sector in Lebanon is growing rapidly, now is a good time to inform consumers, especially new ones, of the importance of EE. Egypt has already begun to take action to improve the efficiency of lighting in households (box 4.6)
Recommended first measures
> Provide samples of free, efficient lights to residential consumers (Egypt and Lebanon have piloted such efforts).
> Introduce standards and regulations to ban energy-inefficient lighting, and enforce regulations where they have been adopted (Jordan).
> Launch communications programs to improve awareness of EE benefits to include relatively simple “housekeeping” actions that can be easily and inexpensively taken to save energy.

De
liv
er
ing
en
er
gy
ef
fic
ien
cy
in
th
e M
iDD
le e
ast
an
D n
or
th
af
ric
a
109
> Launch a public awareness campaign to inform consumers of the running costs of electrical equipment, particularly of inefficient equipment (such as air conditioners).
These should deliver savings quickly and identify further opportunities. Com-bined with improved awareness, they should encourage further investment, leading to intermediate measures.
Intermediate measures
> Develop (or update, where they already exist) and enforce mandatory appliance (especially air conditioners) and equipment labeling and performance standards (Egypt, Jordan, and Lebanon have already introduced standards).
> Develop mandatory regulations and enforce building energy codes to improve EE in existing and new residential buildings.
> Develop a range of financing mechanisms to encourage residential consumers to buy (invest in) EE equipment.
Egypt began to address EE relatively early, although for some years the scope of activity was limited. In the 1980s, an ECEP project funded by USAID targeted large factories for EE improvements.
In the 1990s the Energy Efficiency Improvement and Green House Gas Reduction (EEIGGR) project, financed by GEF and implemented by UNDP, helped to establish energy performance standards and labels for six types of equipment as well as energy codes for new residential, commercial, and government buildings. That project also established a USD 1.5 million revolving guarantee fund to support loans for EE projects in industry. The project has, among other outcomes, contributed to ESCO promotion, EE in residential, commercial, and public (street lighting) sectors, and raised public awareness.
In the 2010s, a cabinet-level Energy Efficiency Unit (EEU) was established to promote scale-up of EE and to set a clear EE strategy. In parallel, several EE programs exist in key energy supply and demand sectors. The most important of these currently are the NEEAP adopted in 2015 by the Ministry of Electricity, the EE in Industry project supported by UNIDO, and the Green Tourism initiative under the Ministry of Tourism.
On July 24, 2007, the Supreme Council of Energy issued a decision on using energy-saving light bulbs and phasing out incandescent light bulbs in household. Measures taken since 2010 in accordance with the decision include issuing energy efficiency standards for high-efficiency lighting systems, and providing technical assistance and preparing the feasibility studies and technical for factories to encourage local manufacturing of energy-saving light bulbs. There are now 10 manufacturers of efficient lighting products in Egypt, including three component manufacturers. Approximately 10 million energy-saving bulbs have been sold through distribution companies under an initiative of the Ministry of Electricity and Energy, which requires that EE lamps be sold at half the price in cash or in installments, giving a guarantee period of 18 months. A second phase of the EE lighting began in 2014 to distribute 10 million LED lamps to residential and commercial customers. The LED’s were acquired through bulk public procurement, which led to prices in the range of USD 3.00 to 3.50 per lamp. A third phase will distribute 50 million lamps using a similar approach.
Although solar water heaters have been in use in Egypt since the 1980s, penetration has been limited. In 2014, an EE program under the Ministry of Industry aimed to scale up and locally manufacture solar water heaters for residential, commercial and industrial use.
box4.2.eeprogramsinegypt
Source: Authors.

WO
RLD
BA
NK
GR
OU
P
110
services
Based on the comparisons of retail electricity prices and the estimates of energy savings potential in chapter 1, Egypt and Jordan would benefit substantially from investment in EE in the services sector.
Recommended first measures
> Mandate installation of efficient lighting and equipment (especially air conditioners) in public and private commercial buildings.
> Introduce standards and regulations for energy-efficient lighting and air conditioning in these buildings and enforce regulations where adopted (Jordan).
> Launch a communications program to improve awareness of EE benefits, including “top 10 actions to improve housekeeping.”
> Phase in efficient street lighting in municipalities using utility mandates, with assistance from ESCOs and lamp manufacturers or other suppliers.
These should deliver savings quickly and identify further opportunities. Com-bined with improved awareness, they should encourage further investment, leading to intermediate measures.
Intermediate measures
> Develop mandatory regulations and enforce building energy codes to improve EE in existing and new buildings (public and private).
> Develop and enforce mandatory equipment labeling and performance standards for appliance and equipment (Egypt, Jordan, and Lebanon have already introduced standards).
> Audit and exploit efficient water-pumping programs.
> Develop financing mechanisms to support commercial services in installing EE equipment.
Industry
It is hard to overstate the importance of promoting EE in industry in this subre-gion. Egypt has substantial potential for improving EE in the sector (28 percent), and has already undertaken significant efforts to exploit that potential (box 4.3) Given current levels of cost recovery in retail pricing (32 percent), the country would likely gain notable economic benefits from investment, particularly in ce-ment and petrochemicals. Some possible further steps include:
> Establish reliable, widely accepted benchmarks for key industries, e.g., steel, cement, fertilizers and petrochemicals.
> Establish energy databases and enforce EE standards for key equipment, including electricity motors and boilers, across sectors.
> Mandate utilities to conduct energy audits in small and medium enterprises.
> Mandate energy-intensive industries to conform to the standards of ISO 50001 or an equivalent energy-management protocol.
> Launch industry-specific information and awareness programs.

De
liv
er
ing
en
er
gy
ef
fic
ien
cy
in
th
e M
iDD
le e
ast
an
D n
or
th
af
ric
a
111
GULF COOPERATION COUNCIL (GCC)
Table 4.7 indicates the share of total EE potential attributable to the three end use sectors in each country. Most of the countries are likely to benefit substantially from improved EE, particularly in industry. Bahrain, UAE, and Yemen would also benefit in services and Bahrain, Kuwait, and Saudi Arabia in the residential sector.
table4.7.GCC—Potentialforenergysavingsbysector,2025)%(
Industry services Residential
Bahrain 22 20 21
Kuwait 18 5 24
Oman 48 7 9
Qatar 41 4 14
Saudi Arabia 14 16 21
UAE 39 18 15
Yemen 18 18 11
Source: RCREEE 2014.
Given utilities’ capabilities in the subregion and the extent to which they will gain from improved EE across the system, utility-delivered programs are appropri-ate for all end use sectors. Outsourcing program implementation to ESCOs is also highly relevant.
Enabling environment
> Policy and regulation:
•Governments could set in their NEEAPs end use sectoral EE targets and associated timelines with utilities.
•An appropriate regulatory framework is crucial to support utility-delivered programs and to build the ESCO market.
> Institutions and organizations: Utilities must have clear roles and responsibilities in industry through a regulatory mandate or voluntary obligation.
> Finance:
•Initially public (and/or donor agency) funds should move toward a public benefits charge after a gradual introduction of more cost-reflective prices alongside EE policies and measures.
•Allocate public funding to encourage and assist development of the ESCO market.
> Communications and capacity building: Introduce a training program within utilities and industry, including training in developing the ESCO market.

WO
RLD
BA
NK
GR
OU
P
112
Industry
Based on the comparisons of retail electricity prices and the estimates of energy savings potential in chapter 1, Bahrain, Qatar, Oman, and UAE will benefit sub-stantially from EE investment.
Recommended first measures
> Mandate industrial facilities to install efficient lighting and equipment (e.g., boilers).
> Mandate energy audits in all small and medium industries.
> Mandate energy-intensive industries to conform to the standards of ISO 50001 or an equivalent energy protocol.
> Launch industry-specific information and awareness programs.
These should deliver savings quickly and identify further opportunities. Combined with improved awareness, they should encourage further investment, leading to intermediate measures.
Intermediate measures
> Identify opportunities for cost-effective savings in motor-drive and compressed air systems.
> Identify industrial equipment to comply with minimum efficiency standards.
> Assign public funding to encourage and assist the development of the ESCO market.
> Develop a range of financing mechanisms to support small and medium industries in installing EE equipment.
services
Based on the comparisons of retail electricity prices and the estimates of energy savings potential in chapter 1, Bahrain, UAE, and Yemen have the greatest EE po-tential in the services sector within the GCC. The other GCC countries will benefit substantially from investment in EE in the services sector since there is a low level of cost recovery in the retail electricity prices within the services sector.
Recommended first measures
> Mandate installation of efficient lighting and key equipment, especially air conditioners, in public and private commercial buildings.
> Introduce standards and regulations to ban energy-inefficient lighting in public and private commercial buildings, and enforce regulations where they have been adopted (Bahrain, Qatar, and UAE).
> Launch a communications program to improve awareness of the benefits of EE, including “top 10 actions to improve housekeeping.”
> Phase in efficient street lighting in municipalities using utilities mandates and the assistance of ESCOs and lamp manufacturers or suppliers.
De
liv
er
ing
en
er
gy
ef
fic
ien
cy
in
th
e M
iDD
le e
ast
an
D n
or
th
af
ric
a
113
These should deliver savings quickly and identify further opportunities. Combined with improved awareness, they should encourage further investment, leading to intermediate measures.
Intermediate measures
> Develop mandatory regulations and enforce building energy codes to improve EE in existing and new buildings (public and private).
> Develop and enforce mandatory appliance and equipment labeling and performance standards (Kuwait, Qatar, Saudi Arabia, and UAE have already introduced standards for air conditioners).
> Audit and exploit efficient water-pumping programs.
> Develop financing mechanisms to support commercial services in installing EE equipment.
Residential
Based on the comparisons of retail electricity prices and the estimates of energy savings potential in chapter 1, Bahrain, Kuwait, and Saudi Arabia have the great-est potential for improving EE in the residential sector, although as with services, given the low level of cost recovery in retail electricity prices, most GCC countries are likely to benefit substantially from investment.
Recommended first measures
> Mandate utilities to provide residential consumers with samples of energy-efficient lighting products.
> Introduce standards and regulations to ban the use of energy-inefficient lighting, and enforce regulations where they have been adopted (Bahrain, Qatar, and UAE).
> Launch a communications program to improve awareness of the benefits of EE, including “top 10 actions to improve housekeeping.”
> Launch a public awareness campaign to inform consumers of the running costs of electrical equipment, particularly of inefficient equipment (such as air conditioners).
These should deliver savings quickly and identify further opportunities. Com-bined with improved awareness, they should encourage further investment, leading to intermediate measures.
Intermediate measures
> Develop and enforce mandatory appliance and equipment labeling and performance standards.
> Develop mandatory regulations and enforce building energy codes in existing and new residential buildings (Kuwait, Qatar, Saudi Arabia, and UAE have already introduced standards for air conditioners).
> Assign public funding to encourage and assist development of the ESCO market.

WO
RLD
BA
NK
GR
OU
P
114
> Develop financing mechanisms to encourage residential consumers to buy (invest in) EE equipment.
LOOKING AHEAD
There is no shortage of opportunities for EE across the MENA region. Even those, such as the Maghreb countries, that have already made strides and accumulated a wealth of experience in good practices have great potential. This chapter present-ed options that MENA countries might consider. In the industrial, services and residential sectors, the relatively few near- and medium-term measures described above are likely to deliver significant results, as countries implement their respec-tive NEEAPs and other EE commitments in the coming years. (Although not ad-dressed in this report, the transport sector requires future attention, ideally in the context of national and urban transportation planning.)
Relatively advanced countries can benefit from introducing more-targeted EE programs aimed at well-defined sets of energy consumers to stimulate demand for EE services. This would, among other things, help to build the environment needed to sustain a functioning market for ESCOs and other dedicated providers of efficiency services. The goal would be to create an EE market that would grad-ually require less public support and eventually rely mainly on private activity at commercial scale.
MENA countries at earlier stages of developing their approaches to EE may find it effective to adopt relatively modest targets that will be reached quickly, with the aim of fostering the public support and stakeholder buy-in needed to proceed with more ambitious activities.
Countries with heavily subsidized energy prices might wish to focus on attain-ing EE gains first in the public sector and through regulatory means, such as min-imum energy performance standards (MEPS), while gradually introducing energy subsidy reforms. These countries may also find it productive to launch national campaigns to raise awareness for why EE is becoming a matter of national impor-tance, and build public support for improving EE and lifting energy subsidies.
To ensure continuous attainment of the energy savings that greater efficiency promises, regular fine-tuning of energy plans based on robust monitoring and eval-uation is essential—all of which requires dedicated resources and growing institu-tional capacity. Strengthening the enabling environment remains a challenge even for countries in other regions that are leaders in EE.
Finally, while many of the steps described above can be taken by countries by themselves, other steps, to be most effective, would benefit from concerted action by countries acting together, such as harmonization of standards and labels for energy-consuming appliances and equipment. This approach would enhance the integration of markets and provide strong incentives to enhance the supply chains for more efficient equipment.

De
liv
er
ing
en
er
gy
ef
fic
ien
cy
in
th
e M
iDD
le e
ast
an
D n
or
th
af
ric
a
115
APPendIx1.
AssessInGeneRGyuse—dAtAsouRCes,AssuMPtIons,CAveAts,AndMethods
Reliable data for energy consumption in specific subsectors of the economy are not readily available in most MENA countries, hindering the robust analysis required to develop effective policies and measures. The exceptions are Egypt, Jordan, Leb-anon, Morocco, and Tunisia, which have conducted surveys to estimate demand and potential for EE. In preparing projections of energy consumption and savings, RCREEE (2014) drew on publicly available national, regional, and international data sources (table A1.1).
sectors Countries datasources Reports
en
ergy
Power generation All countries, except for West Bank & Gaza, Qatar
AUPTDE, National sources (statistical offices, ministries of electricity and energy)
Statistical Bulletin, statistical abstracts, electricity, and water statistics
Transmission and distribution losses
All countries, except for West Bank & Gaza and Qatar
PWMSP, AUE, World Bank, National Sources, AUPTDE
Statistical Bulletin
Oil refineries All countries except Lebanon, West Bank & Gaza
OAPEC, OPEC, National sources (statistical offices, ministry of energy),
Statistical bulletins, statistical abstracts
en
du
ses
ecto
rs
Industry Algeria, Bahrain, Egypt, Iraq, Morocco, Oman, Qatar, Tunisia, Jordan, Saudi Arabia, Sudan, Syria, Yemen
National Sources (Statistical Office, Ministry of Industry), RCREEE Indicators study
RCREEE indicators study, Energy Consumption Survey
Residential Algeria, Bahrain, Egypt, Iraq, Jordan, Kuwait, Lebanon, West Bank & Gaza, Morocco, Qatar, Saudi Arabia, Sudan, Tunisia, United Arab Emirates (UAE)
National Sources (statistical offices)
Household Consumption and Expenditure surveys, Energy Consumption Survey
Services Bahrain, Egypt, Lebanon, Oman, Qatar, Morocco, Tunisia, UAE
National Sources (statistical offices)
Tertiary survey
Transport Kuwait, West Bank & Gaza, Tunisia, Morocco
National Sources (statistical offices)
Transport Bulletin, Energy Consumption Survey, Survey on Transport Sector
Agriculture All countries, except GCC
National Sources (statistical offices)
Agriculture survey
tableA1.1.dataavailabilityandsources
Source: RCREEE 2014.

WO
RLD
BA
NK
GR
OU
P
116
The assessment methods are straightforward and transparent, supply an ap-propriate level of detail and accuracy, and generate a sense of the relative gains in different sectors. For example, energy demand in 2020 and 2025 was estimated based on a simple projection of historical growth rates in energy demand over 2000–12. The estimated energy savings in 2020 and 2025 is based on proportional-ly projecting the savings in the base year to the estimated final and primary energy consumption in the future years. The savings in primary energy consumption in each country reflects standard fuel conversion efficiencies for electricity generation to the estimated savings in final energy consumption.
This business-as-usual approach is consistent with the practice for first-level analysis and provides a useful indicator, which can later be refined as better in-formation becomes available. However, a business-as-usual analysis ignores the impacts of improvements in energy use as countries adopt more efficient devices and appliances and reduce their energy intensity as their economies shift toward the services sector, which typically is less energy intensive than the industrial sec-tor. The analysis also ignores the impact of the recent fuel subsidy (tariff) reforms in some MENA countries.
The converse could also be true in energy-producing MENA countries, which may experience an increase in overall energy intensity as production of primary energy rises in response to global demand. The business-as-usual analysis may be especially ill suited to countries such as Egypt, Morocco, and the United Arab Emirates, which are rapidly modernizing their energy infrastructure.
The potential for EE in MENA countries is substantial, despite the challenge posed by lack of reliable data at a disaggregated level of energy consumption. An ESMAP study (2009) for the MENA region estimated that improved EE would generate benefits of 0.5–1 percent of GDP, and a 20 percent improvement in EE throughout the region was estimated to lead to GDP gains of $11 billion (2004 prices), with Egypt, Iran, Morocco, and Tunisia reaping about half the benefits. The study identified potential for energy savings through reduced gas flaring and lowered transmission and distribution losses.
These estimates show that, far from improving their efficiency of energy use, MENA countries increased their energy intensity even as energy intensity declined in many other countries (Figure 1).
Some countries have taken steps to improve EE, however. Tunisia reduced en-ergy intensity by around 18 percent over 1980–2006. ESMAP (2009) estimated that the gain in EE during 2005–07 resulted in annual fuel savings of 390 kilotons of oil equivalent (ktoe), or 0.7 percent of the country’s annual energy consumption, worth $40 million.
Even energy exporters in the region that have very high-energy intensities are taking actions to improve efficiency. For instance, at the recent Conference of Par-ties (COP) meeting on Climate Change held in December 2014 in Lima, a side event on EE in the GCC countries highlighted the importance of EE to their econ-omies (IISD 2014). Saudi Arabia is promoting EE by consumers and has estab-lished the Saudi Energy Efficiency Center (SEEC), responsible for demand-side management and EE projects.

De
liv
er
ing
en
er
gy
ef
fic
ien
cy
in
th
e M
iDD
le e
ast
an
D n
or
th
af
ric
a
117
A key challenge for improved EE in MENA countries are energy price subsi-dies, which substantially lower consumers’ financial incentive to adopt energy-effi-cient technologies (see section below).
Energy pricing, the impact of price signals, the cost and availability of energy-ef-ficient appliances, and the policy and market environment all vary greatly among MENA countries and affect uptake of EE measures. Estimating the market or eco-nomic potential for EE in the region is thus a major undertaking requiring huge data and resources—the focus of this assessment is therefore on the gross technical potential for EE in the MENA countries as a tool for targeting policy efforts.
While several standard approaches and methodologies are available to esti-mate the technical potential for EE in various sectors of an economy, differences among MENA countries in reliability of data, market, and economic conditions, limit the options that can be applied uniformly. For instance, the use of energy intensity indicators such as tons of oil equivalent (toe) per unit of gross domestic product (GDP), while useful, may not capture or differentiate among the differ-ent structures of countries’ economic sectors. However, the use of specific energy consumption norms such as toe per square meter per year (toe/m2/y) for energy use in commercial or residential buildings tons of fuel use per unit output in the industrial sector, while more reliable and comparable across countries, is limited by paucity of data.
The technical potential in this assessment includes several indicators depending on sector and data availability (table A1.2). The technical potential for EE in each MENA country has been estimated for the base year of 2011 or 2012, depending on the year for which the most reliable information was available, and based on norms for EE applicable to the MENA region (RCREEE 2010). The use of such regional norms for EE is reasonably reliable for countries in the same subregion (Mediterranean, Gulf, and North Africa). Specifically, for the residential sector, the assumption is that energy consumption norms are applicable for countries in the same climatic zone and comparable across countries with similar socioeco-nomic and market conditions. Detailed end use energy consumption data (in the residential, services, and industrial sectors) were available for Jordan, and were used in more detailed assessments of the potential for EE in MENA countries. The potential for EE in the residential sector includes the savings from use of efficient lighting and solar water heating systems.
The norms for energy consumption and the potential for EE are also informed by cost abatement curves for energy-efficient technologies developed for a set of MENA countries for the industry, transport, services, residential, and agriculture and fishing sectors. The cost abatement curves were developed under the MED-ENEC and MED-EMIP European Union Southern Mediterranean regional proj-ects for Egypt, Jordan, Lebanon, Morocco, and Tunisia, and were developed based on extensive data collection, compilation, and simulation. This earlier study esti-mated the potential for electricity savings in 2020 through selected technologies and solar water heating in the industry, services, and residential sectors.

WO
RLD
BA
NK
GR
OU
P
118
tableA1.2.IndicatorsofeeusedinRCReeeassessment
sector eeindicatorunits
Electricity production ktoe ,%
Oil refining ktoe ,%
Transport toe/$, kgoe/vehicle/year, kgoe/passenger km
Industry (toe/$, toe/ton (for specific energy-intensive industries
Services toe/$, kgoe/m2, MWh/m2, MWh/1000 km (for street(lighting), kgoe/night guest (for hotels
Residential toe/$, kgoe/m2/y, MWh/m2/y
Agriculture and fisheries toe/$, toe/ton
Total potential Ktoe
Source: RCREEE 2014.
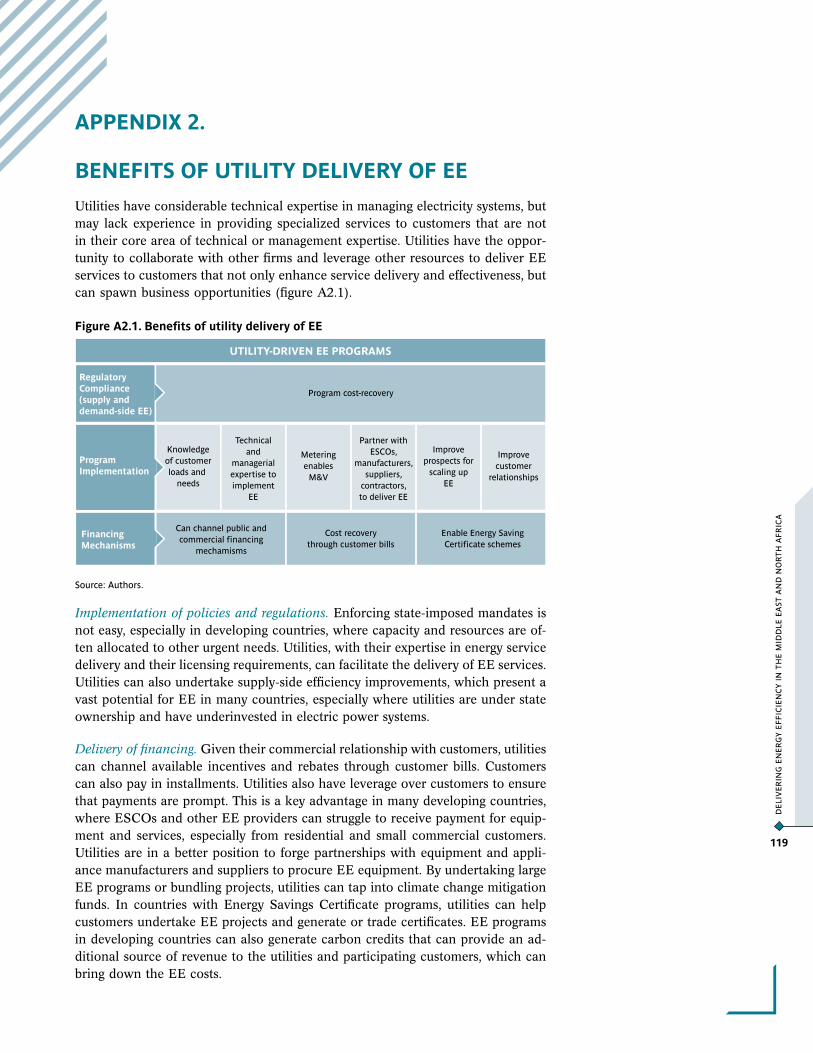
De
liv
er
ing
en
er
gy
ef
fic
ien
cy
in
th
e M
iDD
le e
ast
an
D n
or
th
af
ric
a
119
APPendIx2.
beneFItsoFutIlItydelIveRyoFee
Utilities have considerable technical expertise in managing electricity systems, but may lack experience in providing specialized services to customers that are not in their core area of technical or management expertise. Utilities have the oppor-tunity to collaborate with other firms and leverage other resources to deliver EE services to customers that not only enhance service delivery and effectiveness, but can spawn business opportunities (figure A2.1).
FigureA2.1.benefitsofutilitydeliveryofee
Knowledgeof customerloads and
needs
Program cost-recovery
Technicaland
managerialexpertise toimplement
EE
Meteringenables
M&V
Partner withESCOs,
manufacturers,suppliers,
contractors,to deliver EE
Improveprospects for
scaling upEE
Improvecustomer
relationships
Cost recoverythrough customer bills
Enable Energy SavingCertificate schemes
UTILITY-DRIVEN EE PROGRAMS
Can channel public andcommercial financing
mechamisms
FinancingMechanisms
RegulatoryCompliance(supply anddemand-side EE)
ProgramImplementation
Source: Authors.
Implementation of policies and regulations. Enforcing state-imposed mandates is not easy, especially in developing countries, where capacity and resources are of-ten allocated to other urgent needs. Utilities, with their expertise in energy service delivery and their licensing requirements, can facilitate the delivery of EE services. Utilities can also undertake supply-side efficiency improvements, which present a vast potential for EE in many countries, especially where utilities are under state ownership and have underinvested in electric power systems.
Delivery of financing. Given their commercial relationship with customers, utilities can channel available incentives and rebates through customer bills. Customers can also pay in installments. Utilities also have leverage over customers to ensure that payments are prompt. This is a key advantage in many developing countries, where ESCOs and other EE providers can struggle to receive payment for equip-ment and services, especially from residential and small commercial customers. Utilities are in a better position to forge partnerships with equipment and appli-ance manufacturers and suppliers to procure EE equipment. By undertaking large EE programs or bundling projects, utilities can tap into climate change mitigation funds. In countries with Energy Savings Certificate programs, utilities can help customers undertake EE projects and generate or trade certificates. EE programs in developing countries can also generate carbon credits that can provide an ad-ditional source of revenue to the utilities and participating customers, which can bring down the EE costs.

WO
RLD
BA
NK
GR
OU
P
120
Responsiveness to customer needs. Utilities know energy demand patterns and so are in a good position to design programs that benefit both customers and them-selves. For instance, utilities can work with customers to identify opportunities to curtail or shift loads through improved EE and DSM programs. This is espe-cially true for industrial and large commercial customers. Advanced metering and customer surveys can help target customer loads. Utilities also are aware of the barriers to adoption of EE, both within the utility and for customers, and can de-sign programs that help overcome them. For instance, residential consumers with subsidized tariffs and/or low incomes may have little incentive to install efficient equipment. Utilities can develop programs that help overcome the price barrier, such as on-bill repayment, alongside longer-term strategies to increase tariffs. Fi-nally, utility delivery of EE helps build better relations with customers, which has the potential to improve delivery of electricity services.
Collaborating with local firms and other agencies. Without regulation that requires otherwise, utilities do not generally consider provision of EE services a core com-petency, and may prefer to outsource delivery of EE to professional energy firms such as ESCOs. This approach harnesses specialized expertise for EE programs and can create business opportunities for local firms. In many countries, the ESCO industry has developed by working in collaboration with local utilities. Utilities can also serve as a bridge between consumers and EE institutions and other gov-ernment agencies and trade associations, which seek to promote EE in support of national goals.
Technical and management expertise in program implementation. Utilities’ tech-nical and management expertise in operating and managing power systems can be deployed in EE. Utilities understand that effecting change and realizing the full benefits of EE take time, and their long-standing relationships with customers are an added advantage. Achieving success in EE program delivery typically requires collaborating with local businesses and external consultants.
Sustainability of EE programs. As long-term suppliers of energy services, utilities can deliver sustained EE services and programs to customers, which is essential given that the savings from EE measures need to be sustained through periodic replacements with equivalent or more efficient equipment depending on equip-ment lifetimes. It is in the interest of utilities to ensure that customers sustain EE programs, which will bring the utility the certainty it needs to consider EE as a resource that can displace or delay additional generation to meet growing demand.

De
liv
er
ing
en
er
gy
ef
fic
ien
cy
in
th
e M
iDD
le e
ast
an
D n
or
th
af
ric
a
121
APPendIx3.
otheRexAMPlesoFutIlItydelIveRyoFee
CLP Power, in Hong Kong SAR, China, facilitates free energy audits for its com-mercial and industrial customers to identify EE opportunities and provides loans to customers to adopt EE measures. It has conducted more than 1,300 audits. Its primary motivation is to benefit from a higher return on equity offered to regulated utilities in the territory, where the authorities encourage customers to pursue EE that makes demonstrable energy savings. 34
In Portugal, the Energy Services Regulatory Entity (ERSE) periodically tenders for EE projects under its Promotion Plan of Efficiency in the Consumption of Electrical Energy. Utilities and other eligible entities may bid for these projects and receive funding from the plan.
In countries with weak electricity capacity, it is usually in the utility’s interest to run customer EE programs regardless of regulatory requirements, especially in developing countries facing multiple challenges in meeting fast-growing demand.
The Reliance Infrastructure Limited (Rinfra) serves some 3 million electrici-ty consumers in Mumbai, India. It has undertaken several programs to reduce peak demand with the support of the regulator, the Maharashtra Energy Regu-latory Commission. Rinfra launched the Mumbai Efficient Lighting Program to help small residential and commercial consumers replace inefficient incandescent lamps with CFLs. Customers paid for the new lamps through their utility bills. The program sold 617,000 CFLs with estimated annual energy savings of 48 GWh.
Also in India, Bangalore Electricity Supply Company (BESCOM) in Bengaluru launched the Bangalore Efficient Lighting Program with the Bureau of Energy Ef-ficiency and funding from USAID. BESCOM offered vouchers to residential cus-tomers for CFL lamps procured from major manufacturers. Customers then repaid the cost of the lamp over nine months through their electricity bills. The program sold 300,000 CFLs, leading to estimated energy savings of 24 GWh and demand reduction of perhaps 13 MW.35
In Bangladesh, under the Efficient Lighting Initiative of Bangladesh (ELIB) program, the World Bank financed a loan to replace some 10 million incandescent lamps with CFLs. The CFLs were provided free to residential customers in 10 cities willing to replace incandescent lamps. The program, which required an investment of about $15 million, aims for a 360 MW reduction in energy demand. The pro-gram also benefits from carbon credits, which could contribute $5 million–10 mil-lion in revenues, bringing down the cost of implementing the program.
Eskom, the utility in South Africa, also initiated EE measures to counter a se-vere shortfall in generation capacity in 2008. Eskom launched a National Efficient Lighting Project to replace incandescent lamps with CFLs and followed it with a CFL Sustainability Project. These initiatives have very significantly reduced de-mand—by about 2,000 MW—and have resulted in annual energy savings of about 7 TWh.
Many utilities in New England in the United States bid in a competitive auction to implement EE projects in a forward capacity market operated by the ISO New England, which seeks to competitively procure EE on an equivalent basis with generation resources to meet future demand. EE projects, mainly from utilities, account for a fourth of the bids received by the ISO, and the utilities benefit from

WO
RLD
BA
NK
GR
OU
P
122
the revenues, which they use to supplement the costs of their other EE projects.RWE, the largest power producer in Germany, has launched subsidiary busi-
nesses that profitably provide EE services to industrial customers, generating about ‐500 million a year. A new subsidiary will provide EE services to residential cus-tomers. RWE has implemented some 10,000 projects over five years, which range from advisory services to installation and awareness programs.
Some utilities provide EE services to build stronger relationships with custom-ers and to fulfill objectives of corporate social responsibility—also helping them identify new opportunities. In Austria, for example, heating oil suppliers to indus-try help customers identify and replace inefficient boilers with new ones that can reduce energy use by up to 40 percent. The program has reduced oil use by about 11 percent. The program also helps entities meet EE obligations under European Union directives.
Utilities in Finland have adopted voluntary agreements to support customers’ EE efforts. The utility prepares reports on trends in energy consumption by its customers and provides benchmarks. A majority of customers participate in the program. Utilities have increased revenues by providing additional services. The program has helped reduce residential energy demand by 1–3 percent.
In Sweden, Kalmar Energi, a combined heat and power utility, provides ad-visory and installation services for customers who wish to displace oil or electric heating with district heating to meet both space and process heating needs. The utility provides complete services, including financing to help customers evaluate options for fuel switching to reduce heating costs.

De
liv
er
ing
en
er
gy
ef
fic
ien
cy
in
th
e M
iDD
le e
ast
an
D n
or
th
af
ric
a
123
APPendIx4.
bACkGRoundtostRAteGIesFoRthReePRIoRItyseCtoRs
Detailed assessments of energy use in the three sectors are not readily available. RCREEE (2014) estimates of the potential for EE reflect broad assumptions of energy intensity and consumption norms (see appendix 1).
Industry
Improved EE in the industrial sector will result in energy savings of up to 20 per-cent (or about 66 Mtoe) in 2025 (table A4.1). But this very heterogeneous sector includes a wide range of industries that deploy diverse fuels, manufacturing pro-cesses, and equipment and appliances.
Priority countries. Of the 17 MENA economies examined by RCREEE (2014), 12 have potential to reduce energy use by at least 10 percent by 2025 compared with the business-as-usual scenario (see table A4.1, appendix 1).
tableA4.1.twelvecountrieswithatleast10%potentialforeeinindustry,2025
economy eepotential)%(
Oman 48
Qatar 41
UAE 39
Egypt 28
Tunisia 26
Bahrain 22
Algeria 18
Jordan 18
Kuwait 18
Yemen 18
Morocco 13
Saudi Arabia 13
Source: RCREEE 2014.
Some of the countries with the highest potential for EE in their industrial sec-tors have large energy resource endowments. This may indicate inefficiency in countries where energy prices are very low. But even in countries with few or no commercial energy resources, the potential for EE is significant.

WO
RLD
BA
NK
GR
OU
P
124
Conduct detailed assessments of the potential for EE. The first step should be for countries to undertake detailed assessments of energy use in the industrial sector categorized by type and size of industry, and assess the potential for EE through efficient industrial processes and equipment use. The energy audits should help countries identify the potential for savings both in industrial processes, through a shift to more efficient process technologies, and in equipment, through more effi-cient motor-drive, lighting, and heating systems.
Detailed assessments by Jordan, Lebanon, and Morocco have shown that the potential for EE in the industrial sector involves the use of efficient motors and improvements in compressed air systems (RCREEE 2013). Motors drive systems and typically constitute a significant proportion of electricity use in industries. A program to install energy-efficient motors is generally cost effective in process in-dustries where motor drive systems operate almost continuously. The 12 coun-tries should conduct customer and metering surveys to examine the potential for cost-effective replacement of inefficient motors with energy-efficient motors.
Energy audits. A program to support energy audits in small and medium indus-tries can identify the potential for EE in processes and equipment (large industries generally have the technical expertise to identify EE opportunities on their own). Energy audit programs could be supported through the state EE agency and imple-mented by eligible auditors or by ESCOs.
Program implementation mechanisms. Regulations could mandate energy audits in industrial facilities that consume energy above a predetermined level (to be iden-tified through surveys of industrial facilities). EE opportunities in the industrial sector can be implemented by utilities and ESCOs, or directly by customers. Utili-ty-driven and ESCO programs have the advantage of reducing the risk of achieving savings through use of performance contracts that guarantee savings to the facility and ensure that only cost-effective programs are implemented.
Program financing mechanisms. Utility-implemented programs for the industrial sector can derive support from customer energy bills or through dedicated EE funds channeled through utilities. Fiscal incentives such as tax rebates and exemption on EE equipment are also popular means of incentivizing industrial consumers.
Industrial EE programs may also be implemented by ESCOs with specialized knowledge. ESCO-run programs may be financed through the ESCO or directly by customers with financing from commercial banks. Given the region’s relative lack of experience with the ESCO concept and the perceived risk, which inhibits commercial financing of EE projects, it may be necessary to develop credit lines and EE funds specifically to meet the financing needs for EE in the industrial sec-tor. Financing could be channeled through ESCOs or customers could be directly financed, but savings would be guaranteed through performance contracts.
Monitoring and verification. Metering systems are the preferred option for moni-toring and verification of savings achieved through EE measures implemented in the industrial sector. ESCO performance contracts may also be based on a deemed savings approach for certain EE measures to reduce monitoring costs.
Capacity building and awareness programs. Capacity building and training are es-sential for promoting EE in this sector, and such programs should be targeted at all stakeholders, including industries, ESCOs, utilities, EE agencies, and commercial

De
liv
er
ing
en
er
gy
ef
fic
ien
cy
in
th
e M
iDD
le e
ast
an
D n
or
th
af
ric
a
125
banks. It is important that countries leverage the strength of the private sector, in-cluding equipment manufacturers and suppliers, chambers of commerce, and trade associations, to educate stakeholders and build capacity and create awareness.
Residentialsector
Improved EE in the residential sector will likely result in energy savings of about 22 percent (or about 57,000 ktoe) in 2025. The residential sector comprises two distinct types of customers—apartments and independent single-family dwellings. Residential customers may be further categorized as renters and owners. The ap-proach to implementing EE will need to be tailored for these customer segments because their options and motivations may well vary. A key challenge for EE in the residential sector is subsidized energy pricing, which undermines customers’ motivation to invest in EE.
Apart from the differences in type of dwelling, residential customer segments are homogeneous, as they use similar equipment and appliances. However, there could be key differences in the way they procure and operate equipment since apartment dwellers. Renters may have little or no control over equipment and appliances that are installed by builders or property owners, while owners of sin-gle-family dwellings may have more choices. Another difference is that the design of apartment buildings can be more easily regulated than single-family dwellings to include stringent building codes and standards.
Priority countries. Sixteen economies (table A4.2) have potential to reduce energy use by at least 10 percent by 2025 compared with the business-as-usual scenario. West Bank and Gaza is an outlier, but nine other economies have EE potential of at least 20 percent.
tableA4.2.sixteencountrieswithatleast10%potentialforeeintheresidentialsector,2025
economy eepotential)%(
West Bank and Gaza 62
Morocco 32
Lebanon 31
Jordan 30
Egypt 26
Sudan 25
Kuwait 24
Algeria 23
Bahrain 21
Saudi Arabia 20
UAE 15
Qatar 14
Tunisia 13
Iraq 11
Yemen 11
Libya 10
Source: RCREEE 2014.

WO
RLD
BA
NK
GR
OU
P
126
Conduct detailed assessments of the potential for EE. The first step should be for countries to undertake detailed assessments of energy use in the residential sector to estimate the potential among apartments and single-family dwellings and further categorize the potential for savings among homeowners and renters who have dif-ferent motivations to save energy and different potential for EE.
Detailed assessments by Egypt, Jordan, Lebanon, Morocco, and Tunisia have shown that the potential for EE in the residential sector involves the use of efficient lighting, solar hot water systems, efficient refrigerators and washing machines, and better housekeeping measures (RCREEE 2013). The potential for EE in specific customer segments of the residential sector has not been assessed. Typically, lights, water heaters, and refrigerators are the main energy-consuming end uses in homes. The potential for savings in these systems is significant and generally cost effective (depending on energy prices). The potential for EE through revised building codes and standards remains unexamined, but could be substantial in countries with large apartment buildings. Renters typically are not motivated to undertake EE, especially if the cost of energy is included in the rent.
Energy audits. A program to support energy audits in residential dwellings (apart-ments and single-family dwellings) can identify the potential for EE in these sec-tors. Energy audit programs could be supported through the state EE agency and implemented by eligible auditors or ESCOs.
Program implementation mechanisms. The implementation mechanism best suited for the residential sector depends on the customer segment and end use. Regula-tions that mandate building codes and standards are effective means of ensuring improved building designs that reduce energy use, especially in apartment build-ings. Appliance performance standards and labeling programs can improve EE among all customer segments.
EE programs for the residential sector may be implemented by utilities and ESCOs or directly by customers. Utilities have the advantage of knowing customer demand and have metering systems in place that help identify opportunities and monitor program success. Utility-driven lighting replacement programs have been widely implemented in many countries.
Enforcing building codes and standards can, however, be challenging and will require efforts by all concerned, including architects, builders, and contractors. Appliance labeling and performance standards are more readily applied since they can potentially phase out inefficient equipment in the long term.
Program financing mechanisms. Utility-implemented programs for the residential sector can be financed through customer energy bills or through dedicated EE funds channeled through utilities or EE agencies. Given the subsidized energy prices, it may be necessary to mobilize public funds and IFI/donor financing to undertake EE. The objective of using public funds for EE would be to effectively shift the bur-den of tariff subsidies to purchase of efficient appliances. Customer financing of EE is feasible in countries that do not subsidize energy or are reforming energy prices.
Monitoring and verification. Metering systems and deemed energy savings based on consumption norms for EE appliances are preferred options for monitoring and verification of savings achieved through EE measures implemented in build-ings and appliances used in this sector. Building codes and standards are enforced

De
liv
er
ing
en
er
gy
ef
fic
ien
cy
in
th
e M
iDD
le e
ast
an
D n
or
th
af
ric
a
127
through regulations, and a strict monitoring and compliance system must be put in place in the permitting process.
Capacity building and awareness programs. Capacity building and training are important for promoting EE in the sector because these customers frequently do not have adequate information and knowledge of EE options. Capacity building programs should be targeted at all stakeholders, including homeowners, ESCOs, utilities, and EE agencies. It is important that countries leverage the strength of the private sector, including equipment manufacturers and suppliers, to educate stakeholders, build capacity, and create awareness.
servicessector
Improved EE in the services sector will result in energy savings of up to 13 percent (or about 40 Mtoe) in 2025. The services sector comprises two distinct types of customers: private commercial buildings (offices, hotels, hospitals, and so on) and public facilities that include buildings (schools, hospitals, and municipal buildings), street lighting, and water pumping systems. The approach to implementing EE will need to be tailored to these two segments.
The two customer segments are homogeneous to the extent that both segments operate buildings, which use similar equipment and appliances. But there could be key differences in the way they procure and operate equipment given that the commercial sector generally pays unsubsidized prices for energy. The public sector typically uses government budget allocations to pay energy bills, which may be subsidized. The motivation to implement EE measures may thus be very different.
Priority countries. Nine economies (table A4.3) have potential to reduce energy use by at least 10 percent by 2025 compared with the business-as-usual scenario. Data are unavailable to distinguish potential in the private and public sectors.
tableA4.3.ninecountrieswithatleast10%potentialforeeintheservicessector,2025
economy eepotential)%(
Egypt 28
Jordan 23
Bahrain 20
UAE 18
Yemen 18
Saudi Arabia 15
Tunisia 14
Algeria 11
Sudan 10
Source: RCREEE 2014.
Conduct detailed assessments of the potential for EE. First, countries should un-dertake detailed assessments of energy use in the services sector to estimate the potential among private and public sector customers. This will further categorize

WO
RLD
BA
NK
GR
OU
P
128
the potential for savings in principal customer segments such as buildings, street lighting, water pumping, schools, hospitals, etc., which all have different energy use characteristics and different potential for EE.
Detailed assessments by Egypt, Jordan, Lebanon, Morocco, and Tunisia have shown that the potential for EE in the services sector (as in the residential sector) appears to be principally through efficient street lighting and installation of solar water heater systems. The potential for EE specifically in the commercial segment of the services sector has not been estimated. Usually lighting, space conditioning, and water pumping are the principal end uses in building energy systems. The potential for savings in these systems is high, especially in old buildings. The cost effectiveness of implementing EE measures in buildings would depend on the price of energy. Buildings owned by the public sector generally depend on public funds allocations to pay their bills and may generate little motivation to undertake EE.
EE for street lighting is typically cost effective from a societal perspective and is relatively easy to adopt if funds are available. Countries should assess the mer-its of installing efficient street lighting, which include efficient lamps and control systems. Similarly, EE measures in public water pumping systems could generate high savings, given that water supply and sewerage systems use large motor pump systems that run continuously.
Energy audits. A program to support energy audits in private and public sector buildings and in municipal street lighting and sewerage systems can identify the po-tential for EE in these sectors. Energy audit programs could be supported through the state EE agency and implemented by eligible auditors or ESCOs.
Program implementation mechanisms. The implementation mechanism best suited for the services sector depends on the customer segment and end use to be target-ed. Regulations that mandate building codes and standards and appliance perfor-mance standards and labeling programs are applicable to both public and private customer segments and are perhaps the most effective means of improving the efficiency of energy use in buildings. EE programs can be implemented by utilities and ESCOs or directly by customers. Utility-driven and ESCO programs have the advantage of reducing the risk of achieving savings through use of performance contracts that guarantee savings to the facility and ensure that only cost-effective programs are implemented. Enforcing building codes and standards can, however, be challenging and will require efforts by all concerned stakeholders, including architects, builders, and contractors.
Improvements in street lighting and water pumping systems are perhaps best undertaken by municipalities or EE agencies, who may wish to outsource the im-plementation to ESCOs or to equipment manufacturers and suppliers with special-ized knowledge.
Program financing mechanisms. Utility-implemented programs for the services sector can be financed through customer energy bills or through dedicated EE funds channeled through utilities. Fiscal incentives such as tax rebates and ex-emption on EE equipment are also popular means of incentivizing private sector services consumers.

De
liv
er
ing
en
er
gy
ef
fic
ien
cy
in
th
e M
iDD
le e
ast
an
D n
or
th
af
ric
a
129
Building EE programs for private and public sector services customers and ef-ficient street lighting and water pumping systems may also be implemented by ESCOs. ESCO-implemented programs for commercial clients may be financed through the ESCO or directly by customers with financing from commercial banks. It may be necessary to develop credit lines and EE funds specifically to meet the financing needs for EE in the services sector. Customers in the public sector have little or no motivation to reduce energy bills, so projects will need to be financed through public sources, which may be supplemented by IFI/donor funds and con-cessional financing.
Monitoring and verification. Metering systems and deemed energy savings based on consumption norms for EE appliances are preferred options for monitoring and verification of savings achieved through EE measures implemented in buildings in the services sector. A similar approach can be used for EE measures in street light-ing and water pumping systems.
Capacity building and awareness programs. Capacity building and training are important for promoting EE in the services sector since these customers frequently do not have adequate information and knowledge of EE options. Capacity building programs should be targeted at all stakeholders, including building owners, munic-ipalities, ESCOs, utilities, EE agencies, and commercial banks. It is important that countries leverage the strength of the private sector, including equipment manufac-turers and suppliers, to educate stakeholders, build capacity, and create awareness.
Programs for the services sector should target public and private facilities. While many programs may be common, some programs could be based on cus-tomer motivation.
Considerationsforsectorprioritizationadvancedbystakeholders
In the course of preparing its 2014 study, RCREEE consulted stakeholders to iden-tify factors in addition to potential energy savings that could affect prioritization of sectors for policy actions. The stakeholders provided input on nine countries, revealing some differences in priorities among countries (table A4.4). This input from a sampling of well-informed experts takes into account their views on tech-nical, economic, and political feasibility and relative urgency to address EE in the indicated sectors. The transport sector is absent, partly perhaps because of the per-ceived urgency of responding to electricity outages that affect other sectors. While the potential for efficiency improvements on the supply side is significant, as seen in chapter 1, this was deemed a priority in Iraq, which has suffered infrastructure degradation from years of conflict, and in Sudan, which requires a great deal of investment to expand its utility infrastructure.

WO
RLD
BA
NK
GR
OU
P
130
tableA4.4.PrioritysectorsidentifiedbytheAdvisoryboardtotheRCReeestudy
Country Identifiedprioritysector
EgyptResidential sector and lighting, which account for high electricity consumption.
Industrial sector, especially cement and petrochemicals.
Iraq Rehabilitation of the energy production sector.
Jordan
Commercial sector (hotels, banks, hospitals, etc.), which pay higher prices.
Construction sector though codes and standards.
Industrial sector, which pays higher prices.
Off-grid energy use in the agriculture sector, which requires heavy subsidies.
KuwaitIndustrial, commercial, and public sectors: improve appliance efficiency, especially for air conditioning.
Lebanon Residential sector, which is growing rapidly.
MoroccoManufacturing and construction, which pay high energy prices.
Home appliances through standards and labeling.
Qatar Commercial sector, which has high consumption.
Sudan
Losses in transmission and distribution.
Commercial and public buildings, which have heavy lighting, air-conditioning, and other appliance loads during peak periods.
Tunisia Residential and services sector based on the potential for energy savings.
Industrial sector to target quick-payback measure and reduce the government’s subsidy burden.
Source: RCREEE 2014. Note: Experts from some countries were not available to participate in meetings held during rounds of stakeholder consultations. An expert from Sudan was able to provide expert opinion on priorities for EE in that country, although data were insufficient to include it in the regional projections of energy consump-tion and savings.

De
liv
er
ing
en
er
gy
ef
fic
ien
cy
in
th
e M
iDD
le e
ast
an
D n
or
th
af
ric
a
131
FOOTNOTES
1 Includes members of OAPEC (Organization of Arab Petroleum Exporting Countries)
(Endnotes)
1 The countries of the Maghreb region include Morocco, Tunisia, Algeria and Libya. The countries of the Mashreq region include Iraq, syria, Jordan, Lebanon, and the West Bank and Gaza, and in this report are treated together along with Egypt.The six member states of the Gulf Cooperation Council are the United Arab Emirates, the Kingdom of Bahrain, the Kingdom of Saudi Arabia, the Sultanate of Oman, Qatar and Kuwait,
2 Of the countries surveyed, 32 were in Europe, 9 in North and South America, 17 in Asia and the Pacific, 12 in Africa, and 6 in the Middle East, representing 83 percent of world energy consumption, 47 (more than 60 percent) were non-OECD countries.
3 The report authors recognize that there is considerable potential for greater efficiency in the transport sector. Energy savings could be achieved for virtually all motor fuels, and although important, the approaches to EE in transport are quite different from those focused on electricity end uses. The transport sector is unique, featuring some approaches that are relatively straightforward for many countries to adopt, such as fuel economy standards. But others are extremely difficult—notably reforming fuel pricing, making large investments in infrastructure to shift substantial passenger and freight travel from road to less energy-intensive modes, and overhauling deeply embedded urban and land-use planning practices. To keep the scope of this study manageable, the transport sector is not considered in this analysis.
4 Algeria, Bahrain, Egypt, Iraq, Jordan, Kuwait, Lebanon, Libya, Morocco, Oman, Tunisia, Qatar, Saudi Arabia, Sudan, United Arab Emirates, West Bank and Gaza, and Yemen.
5 Appendix 1 discusses the assessment’s data sources, assumptions, caveats and methods. For instance, a common base year was required for comparative analysis, which meant that for some countries the most recent available data was not available. Since the purpose of the scenarios is to evaluate options for policy actions, not to provide market forecasts, the comparability of the data was more important than their place in time.
Appendix 4 provides a summary of expert opinion from stakeholders consulted by RCREEE (2014), which generally supports the focus in this report on industry, residential, and services.
6 The tertiary sector includes commercial services and public services, which include, inter alia, public buildings, schools and hospitals, street lighting, water supply, and wastewater treatment. In this report, the unqualified term “services” or “services sector” is interchangeable with “tertiary sector.”
7 Total primary energy supply (TPES) is the standard category used to represent economy-wide consumption of primary energy. Primary energy supply is far easier to report for most countries than total primary energy consumption, which requires making estimates for many energy-consuming activities that are typically not reported, leading to inaccuracies and lacunae. The two categories of primary energy consumption and supply, however, are statistically identical.
8 Projections of the primary energy mix by fuel source were not prepared. This will have an influence on overall efficiency of the energy system, but fuel switching is not the primary means for achieving energy savings in most applications.

WO
RLD
BA
NK
GR
OU
P
132
9 The analysis for MENA countries was based on the latest year of data available. For most countries, the base year was 2012, but for Algeria, West Bank and Gaza, and Sudan it was 2011. Only technical potential (measures that are technically feasible without regard to cost) was assessed, since the detailed cost data to estimate techno-economic potential (those investments with a reasonable payback time) are generally unavailable. Energy savings potential based mainly on a top-down approach, comparing indicators of specific energy consumption (energy consumed per unit of economic or physical output, person, floor area etc.) in the country analyzed with references or benchmark values at country, regional or sub-regional levels. Since many countries lack sufficient data to prepare a comprehensive set of benchmarks, it was assumed that benchmark values from countries in the same sub-regions would be generally applicable and not significantly influenced by structural economic differences. Another assumption is that socioeconomic and technological conditions were similar among countries within the same climatic zone, and with similar socioeconomic conditions in the residential sector.
10 The slight drop in potential energy savings, expressed as a share of primary energy consumption, reflects increasing electrification, which results in the loss of a growing share of primary fossil energy in the conversion to electricity.
11 The following points are from ESMAP 2008, except where noted.
12 ANME in Tunisia is very effective in rolling out EE across the country, as it has the political authority to act on government policies—unlike the Bureau of Energy Efficiency of India, a central agency charged with facilitating implementation of national EE policies but lacking enforcement authority in the states.
13 See IEA 2014b, p. 3. Estimates vary widely, however, and, using a more restrictive definition, the IEA has estimated investment in EE to be $130 billion in 2012 (WEO 2014, p. 138).
14 Development banks and donors are also making large commitments to financing EE. Here the IEA (2014b) reports that bilateral and multilateral development banks (MDBs) provided over $22 billion in financing for EE in 2012. MDB finance for EE under climate mitigation programs alone is $4.3 billion in 2013. Some countries, such as China, are also increasingly using public funds for EE: its EE investments exceeded $100 billion over 2006–10, and the country plans to invest $200 billion-$270 billion in EE over 2011–15 to reduce energy intensity (IEA 2014b).
15 Bonds and equity market financing are generally available only to large industrial or commercial customers who have access to capital markets through stocks and shares or bond markets. New financing mechanisms for EE include green bonds, clean energy bonds, and climate bonds. Initially floated by MDBs, they increasingly come from commercial banks. Bonds for EE implementation are still developing and, apart from MDBs, are being used mainly by some corporations in OECD countries to finance EE and clean energy projects. Equity funding for EE is even less common and may not be an option in the MENA region, except for large corporations listed on local stock exchanges. Climate finance may present an alternative in eligible countries that can benefit from financing mechanisms to reduce greenhouse gas emissions.
16 See WRI 2009, p. 35. Appendix G, “Summary of Indian Banks’ EE Schemes” provides details on the SME line of credit schemes of each bank.
17 This section derives primarily from the detailed report prepared by the Regulatory Assistance Project (Allen and Crossley, 2014) for this project. Other sources are drawn on where noted.
18 The surcharge is known by different names in different U.S. states. Some states impose a monthly flat charge instead of a charge per kWh. Other states, such as Oregon and Vermont, allow customers to pay a lower surcharge on providing evidence that they are independently undertaking EE projects.
19 This section draws on the World Bank’s Regulatory Assistance Project.
20 http://www.evo-world.org.
21 The examples that follow in this section come from Taylor and others (2008) and other sources as noted.

De
liv
er
ing
en
er
gy
ef
fic
ien
cy
in
th
e M
iDD
le e
ast
an
D n
or
th
af
ric
a
133
22 http://www.iea.org/publications/freepublications/publication/energy-efficiency-governance.html
23 A joint collaboration of multiple stakeholders (Central Bank of Lebanon, Ministry of Energy and Water, the Ministry of Finance, UNDP, the European Union, and LCEC).
24 New South Wales Legislation 1995. Electricity Supply Act 1995, no. 94. Retrieved 23 October 2014, from http://www5.austlii.edu.au/au/legis/nsw/consol_act/esa1995242/
25 Green Growth in Practice, Lessons from country experiences http://www.ggbp.org/report/green-growth-practice-lessons-country-experiences
26 Green Growth in Practice, Lessons from country experiences http://www.ggbp.org/report/green-growth-practice-lessons-country-experiences
27 http://www.seai.ie
28 Funds may also be sourced from international development banks and lent to national governments, who may on-lend to local financial institutions.
29 See IEA 2009.
30 http://sd.defra.gov.uk
31 Efficient lighting includes all low-energy bulbs such as CFLs and LEDs (light-emitting diode).
32 ISO 50001, 2011 Energy Management System provides a “framework of requirements for organizations to: Develop a policy for more efficient use of energy, fix targets and objectives to meet the policy, use data to better understand and make decisions about energy use, measure the results, review how well the policy works, and continually improve energy management.” http://www.iso.org/iso/home/standards/management-standards/iso50001.htm
33 Some MENA countries have already adopted such policies targeting the residential sector. In January 2015, Algeria began requiring mandatory labeling of EE light bulbs for residential use (Decision of the Ministry of Energy and Mines). Morocco has mandatory energy labeling of household electric lamps. Tunisia has prohibited the sale of incandescent light bulbs with power of at least 100 watts, and those with voltage of at least 100 volts were totally banned as of January 1, 2011.
34 The examples in this appendix are from a global study of utility delivery of EE undertaken by the IEA (2013).
35 www.ieadsm.org, “Case Studies of Network-Driven DSM,” accessed May 2015.

WO
RLD
BA
NK
GR
OU
P
134
ReFeRenCes
Allen, Riley J., and David Crossley. 2014. “MENA Energy Efficiency Project Les-sons for the MENA Region from Case Studies of Utility Delivery of Energy Efficiency.” December. World Bank Group, Washington, DC.
Baffes, John, M. Ayhan Kose, Franziska Ohnsorge, and Marc Stocker. 2015. “The Great Plunge in Oil Prices: Causes, Consequences, and Policy Responses.” Pol-icy Research Note PRN/15/01. Development Economics, World Bank Group, Washington, DC.
Barbose, Galen, Charles Goldman, and Jeff Schlegel. 2009. “The Shifting Land-scape of Ratepayer Funded Energy Efficiency in the U.S.” Ernest Orlando Lawrence Berkeley National Laboratory, LBNL-2258E. October. Berkeley, California.
BP (2015) BP Statistical Review of World Energy. London. https://www.bp.com/content/dam/bp/pdf/energy-economics/statistical-re-
view-2015/bp-statistical-review-of-world-energy-2015-full-report.pdfCrossley, D., J. Gerhard, C. Kadoch, E. Lees, E. Pike Biegunska, A. Sommer, X.
Wang, N. Wasserman, and E. Watson. 2012. “Best Practices in Designing and Implementing Energy Efficiency Obligation Schemes.” International Energy Agency Demand Side Management Programme, Task XXII Research Report. The Regulatory Assistance Project, Montpelier, VT, United States.
ESMAP (Energy Sector Management Assistance Program). 2008. “An Analytical Compendium of Institutional Frameworks for Energy Efficiency Implementa-tion.” October. World Bank Group, Washington, DC.
_____. 2009. Tapping a Hidden Resource Energy Efficiency in the Middle East and North Africa. World Bank Group, Washington, DC.
Freeman, Luisa, Shawn Intorcio, and Jessica Park. 2010. “Implementing Energy Efficiency: Program Delivery Comparison Study.” IEE Whitepaper, The Edison Foundation. March. Washington, DC.
Gradl, Christina, and Claudia Knobloch. 2011. Energize the BoP! Energy Business Model Generator for Low-Income Markets. ENDEVA—Enterprise Solutions for Development. June. Berlin.
Hamilton, Kirsty, Claire Boasson, and Caisse Des Depots. 2009. “Energy Efficiency and the Finance Sector: A Survey on Lending Activities and Policy Issues. A report commissioned by UNEP Finance Initiative’s Climate Change Working Group.” UNEP, Paris.
Hormann, Marc, Joern Carlos Kuntze, and Jad Dib. 2012. Delivering on the Energy Efficiency Promise in the Middle East. Oliver Wyman Consultants, New York.
IEA (International Energy Agency). 2009. Implementing EE Policies—Are IEA countries on track? OECD/IEA, Paris.
_____. 2012. “World Energy Outlook 2012. Energy Efficiency Excerpt.” OECD/IEA, Paris.
_____. 2013a. “Energy Provider‐Delivered Energy Efficiency: A Global Stock‐taking Based on Case Studies.” Paris
_____. 2013b. “Energy Efficiency Market Report.” OECD/IEA, Paris._____. 2014a. “World Energy Investment Outlook Special Report.” OECD/IEA,
Paris._____. 2014b. “Energy Efficiency Market Report.” OECD/IEA, Paris._____. 2014c. “World Energy Outlook 2014.” OECD/IEA, Paris._____. 2014d. “World Energy Outlook online database of energy subsidies.” OECD/
IEA, Paris. http://www.worldenergyoutlook.org/resources/energysubsidies/_____. 2014e. “Capturing the Multiple Benefits of Energy Efficiency.” OECD/IEA,
Paris.

De
liv
er
ing
en
er
gy
ef
fic
ien
cy
in
th
e M
iDD
le e
ast
an
D n
or
th
af
ric
a
135
IISD (International Institute for Sustainable Development). 2014. GCC COP 20 Discussion Highlights Energy Efficiency Progress in the Gulf. http://energy-l.iisd.org/news/gcc-cop-20-discussion-highlights-energy-efficiency-progress-in-the-gulf/, accessed December 15, 2014.
IMF (International Monetary Fund). 2014. Energy Subsidies in the Middle East and North Africa: Lessons for Reform. March. Washington, DC.
MED-ENEC (Energy Efficiency in the Construction Sector in the Mediterranean. 2013. “Energy Efficient Building Guideline for MENA Region.” MED-ENEC, Cairo.
_____. 2014. “Energy Service Companies: A Market Tool to Foster Energy Efficien-cy.” MED-ENEC, Cairo.
Panev, Strahil, Nicola Labanca, Paolo Bertoldi, Tiago Serrenho, Caiman Cahill, and Benigna Boza Kiss. 2014. “ESCO Market Report for Non-European Countries 2013.” JRC Science and Policy Reports, Report EUR 26989 EN. European Commission Joint Research Centre, Institute for Energy and Transport, Ispra, Italy.
Portale, Elisa and Joeri de Wit. 2014. Tracking Progress Toward Sustainable Energy for All in the Middle East and North Africa. World Bank. https://openknowl-edge.worldbank.org/handle/10986/20251
RCREEE (Regional Center for Renewable Energy and Energy Efficiency). 2010. “Energy, Climate Change and the Building Sector in the Mediterranean: Re-gional Prospects.” Study for Plan Bleu, Cairo.
_____. 2013. “Arab Future Energy Index, AFEX 2013, Index Report--Energy Effi-ciency.” Cairo.
_____. 2014. “MENA—Delivery Mechanisms and Institutions to Realize Energy Effi-ciency Potential.” December. Cairo
_____. 2015. “Arab Future Energy Index, AFEX 2015, Index Report--Energy Effi-ciency.” Cairo.
REEEP (Renewable Energy and Energy Efficiency Partnership), ASE (Alliance to Save Energy), and ACORE (American Council on Renewable Energy). 2010. “Compendium of Best Practices Sharing Local and State Successes in Energy Efficiency and Renewable Energy from the United States, A Collaborative Re-port” by REEEP, ASE, ACORE, United States.
Rosenow, Jan, Reg Platt, and Andrea Demurtas. 2014. “Fiscal Impacts of Energy Efficiency Programmes—The Example of Solid Wall Insulation Investment in the UK.” Energy Policy 74: 610–620.
Ryan, Lisa, Nora Selmet and André Asrud. 2012. Plugging the Energy Efficiency Gap with Climate Finance: The role of International Financial Institutions (IFIs) and the Green Climate Fund to realise the potential of energy efficiency in developing countries. Insights Series 2012. OECD/IEA, Paris.
Sarkar, Ashok, and Jas Singh. 2010. Financing Energy Efficiency in Developing Countries—Lessons Learned and Remaining Challenges. April. World Bank Group, Washington, DC.
Sarkar, Ashok, Jonathan E. Sinton, and Joeri de Wit. 2014. “Designing Credit Lines for Energy Efficiency.” Live Wire 2014/11. World Bank Group, Washington, DC.
Sarkar, Ashok, and Anand Subbiah. 2011. Enhancing Institutional Governance for Implementing Energy Efficiency Policies, Laws and Regulations in Developing Countries. World Bank Group, Washington, DC.
Schwanitz, Valeria J., Franziska Piontek, Christoph Bertram, and Gunnar Luderer. 2014. “Long-term Climate Policy Implications of Phasing Out Fossil Fuel Sub-sidies.” Energy Policy 67: 882-894.

WO
RLD
BA
NK
GR
OU
P
136
Taylor, Robert P., Chandrasekar Govindarajalu, Jeremy Levin, Anke S. Meyer, and William A. Ward. 2008. Financing Energy Efficiency: Lessons from Brazil, Chi-na, India, and Beyond. ESMAP. World Bank Group, Washington, DC.
UN ESCWA (United Nations Economic and Social Commission for Western Asia). Wang, Xiaodong, Richard Stern, Dilip Limaye, Wolfgang Mostert, and Yabei Zhang.
2013. Unlocking Commercial Financing for Clean Energy in East Asia. World Bank Group, Washington, DC.
Wasserman, Nancy, and E. Watson.,2012. “Best Practices in Designing and Imple-menting Energy Efficiency Obligation Schemes.” International Energy Agency Demand Side Management Programme, Task XXII Research Report. Montpe-lier, Vermont.
World Bank. 2011. Institutional Framework for Implementation of Energy Efficien-cy in Egypt. World Bank Group, Washington, DC.
_____. 2014a. Western Balkans: Scaling Up Energy Efficiency in Buildings. World Bank Group, Washington, DC.
_____. 2014b. “Corrosive Subsidies.” MENA Economic Monitor, October 2014. World Bank Middle East and North Africa Region, Washington, DC.
_____.2014c. “Transitional Policies to Assist the Poor While Phasing Out Inefficient Fossil Fuel Subsidies That Encourage Wasteful Consumption.” Contribution by the World Bank to G20 Finance Ministers and Central Bank Governors. World Bank Group, Washington, DC.
_____. 2014d. Readiness for Investment in Sustainable Energy: A Tool for Policy Makers—Pilot Report. World Bank Group, Washington, DC. http://rise.world-bank.org/
_____. 2014e. World Bank MENA website, “Energy in MENA.” http://web.world-bank.org/WBSITE/EXTERNAL/COUNTRIES/MENAEXT/0,,contentMD-K:22307440~pagePK:146736~piPK:146830~theSitePK:256299,00.html (ac-cessed November 5, 2014).
World Bank and International Energy Agency (2015). Progress toward Sustainable Energy: Global Tracking Framework 2015. (2nd ed.) Washington, DC: World Bank. http://trackingenergy4all.worldbank.org/
WEC (World Energy Council). 2008. Energy Efficiency Policies Around the World: Review and Evaluation. WEC, London.
_____. 2013. World Energy Perspective: Energy Efficiency Policies—What Works and What Does Not. WEC, London.
WRI (World Resources Institute). 2009. “Powering Up: The Investment Potential of Energy Service Companies in India.” WRI, Washington, DC.
Zhao, Xiaofan, and Leonard Ortolano. 2010. “Implementing China’s National En-ergy Conservation Policies at State-owned Electric Power Generation Plants.” Energy Policy 38(10): 6293-6306.