deep dive gas midstream - ir.uniper.energy · gas will be key in supporting the transformation to...
TRANSCRIPT
Deep Dive
Gas MidstreamChristopher Delbrück, Chief Financial Officer
Keith Martin, Chief Commercial Officer

Content
2
I. Gas market trends
II. Uniper‘s Gas Midstream
business
III. Composition of earnings
IV. Positioning for the future
V. Q+A
Keith Martin
Keith Martin
Christopher Delbrück
Keith Martin

Gas will be key in supporting the
transformation to decarbonization
3Source: IEA WEO 2016 New Policies Scenario
Key highlights
Increasing energy demand
Most energy demand growth will come
from non-OECD countries, driven by
strong economic growth, particularly in
Asia
Non-OECD Asia, including China and
India, accounts for more than half of the
world's total increase in energy
consumption over the projection period
Natural Gas to benefit from
transition to low carbon world
In a transforming energy world natural
gas will play a key role supporting the
transition towards a low carbon world
based on low carbon footprint
Natural gas is flexible to react quickly to
supply imbalances and demand peaks,
hence ideally linked with intermittent
renewable options
Shares of primary energy demand
0
10
20
30
40
50
0
4,000
8,000
12,000
16,000
20,000
2025 20401990 20142000
in MTOEShare in%
Oil
Nuclear
RES
Hydro & Biomass
Total primary energy demand
Coal
Gas
0
2
4
6
8
CAGR 2014 to 2040 [%]
392
197 191
113
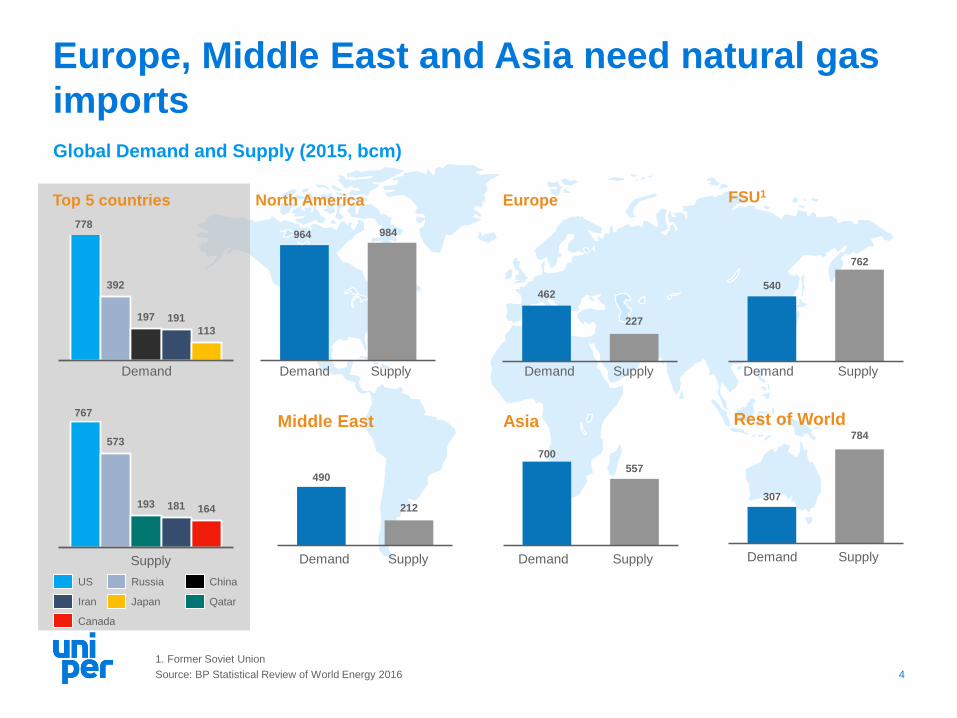
Europe, Middle East and Asia need natural gas
imports
4
Demand
984
Supply
964
North America Europe FSU1
AsiaMiddle East
Demand
Canada
Russia ChinaUS
Iran Japan Qatar
SupplyDemand Demand Supply
Demand SupplySupplyDemand
573
193 181 164
Supply
778
Global Demand and Supply (2015, bcm)
767
462
227
490
212
540
762
700
557
1. Former Soviet Union
Source: BP Statistical Review of World Energy 2016
Rest of World
Demand Supply
307
784
Top 5 countries

0
100
200
300
400
500
600
Increasing European import need driven
by decreasing indigenous production
EU 28 – Indigenous supply, demand
scenarios and import requirements
Current & future supply options
5
East Med
Ru
ssia
So
uth
. C
orr
ido
r(2
)
North Africa (1)L
NG
2020 20252010 20302015
EU-28 indigenous supply
Norway
Rising range
from ~200 to
~290 bcm
1) Pipeline + LNG 2) Azerbaijan, Irak, Iran, Turkmenistan
bcm/y
Source: IHS Cera, July 2016. European Long Term Supply & Demand Outlook
EU-28 import need
NorthSea
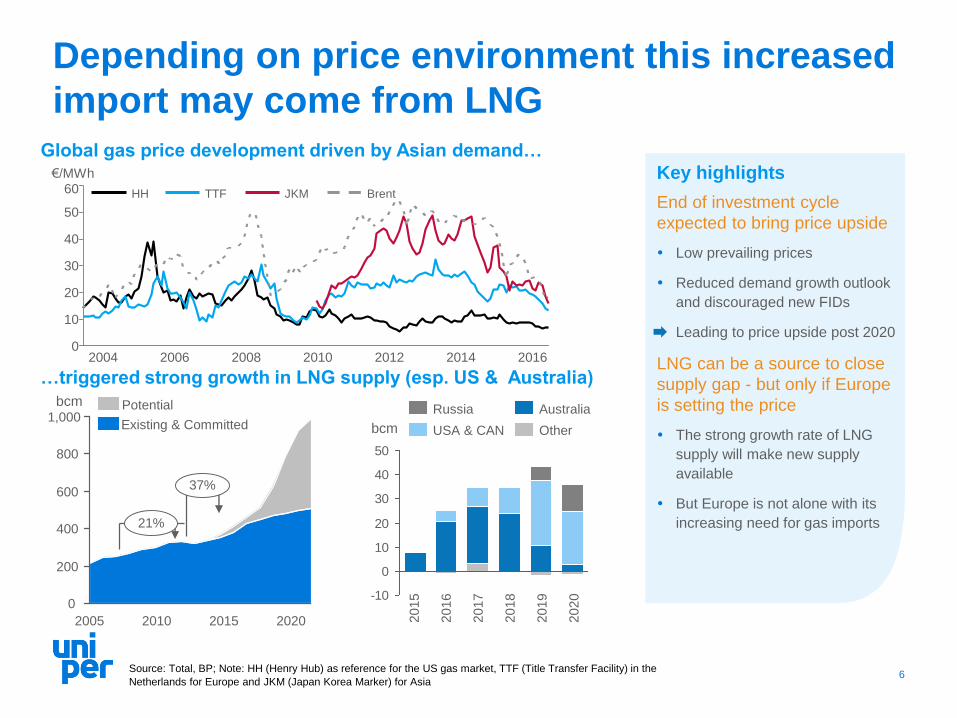
Depending on price environment this increased
import may come from LNG
6
…triggered strong growth in LNG supply (esp. US & Australia)
20102005 20202015
1,000
800
0
21%
600
400
200
37%
Existing & Committed
Potential
-10
0
10
20
30
40
50
Other
Australia
USA & CAN
Russia
2018
2020
2019
2016
2015
2017
Key highlights
End of investment cycle
expected to bring price upside
Low prevailing prices
Reduced demand growth outlook
and discouraged new FIDs
Leading to price upside post 2020
LNG can be a source to close
supply gap - but only if Europe
is setting the price
The strong growth rate of LNG
supply will make new supply
available
But Europe is not alone with its
increasing need for gas imports
Source: Total, BP; Note: HH (Henry Hub) as reference for the US gas market, TTF (Title Transfer Facility) in the
Netherlands for Europe and JKM (Japan Korea Marker) for Asia
Global gas price development driven by Asian demand…
60
50
40
30
20
10
02016201420122010200820062004
BrentJKMTTFHH
€/MWh
bcm
bcm

10
12
14
16
18
10
15
20
25
2016/2017 2015/2016
7Sources: Uniper, Bloomberg – market quotes
-1
1
3
5
7
9
Nov Dec Jan
°C
2015/16 2016/17
€/MWh
Key Highlights
Security of supply
more challenging
2016/17 showed the pattern of a
‘normal’ winter with temperatures
1–2°C below previous year’s level
A cold spell and unforeseen demand
for gas fired generation brought
European gas reserves to
unexpected low levels
Lower indigenous production in
Europe will further increase the
challenges in extreme scenarios
Market does currently not
compensate for security of supply
Summer/ Winter spread at historic
lows. Injection in summer only
marginally profitable on the curve
Spreads/ storage earnings will have
to pick up to secure security of
supply0
20
40
60
80
100%
Feb 16 vs Oct 15 Feb 17 vs Oct 16
February October
€/MWh
Gas Spot Prices
2016/17 vs. 2015/16 (TTF)
Temperatures Winter Season
2016/17 vs. 2015/16 (Germany)
TTF price forward curve Gas Storages – Fill Levels
(Europe)
Flexible LNG can divert into Asia triggering
need for storage and secure supply in Europe
Oct Nov Dec Jan Feb
2017 20192018

Our gas midstream business well positioned to
be a key beneficiary
Decarbonisation kick-starts gas to power
Growing due to long-term coal decommissioning and fuel switching
Key driving force for gas demand mid to long term
Seasonality in gas demand to become even more pronounced
Gas to power requires safe and flexible gas supply
EU with increased dependence on gas imports
Further development and commissioning of gas transport projects of
common interest
LNG share and reliable pipeline gas will increase
As market conditions determine LNG flows – LNG is not reliable for security
of supply
Importance of gas storage to ensure security of supply
8
Content
9
I. Gas market trends
II. Uniper‘s Gas Midstream
business
III. Composition of earnings
IV. Positioning for the future
V. Q+A
Keith Martin
Keith Martin
Christopher Delbrück
Keith Martin

Uniper – a pioneer in the CE gas sector
Year Key Highlight LTC Supply
1926 Ruhrgas AG has been founded
1966 First gas deliveries from the Netherlands
1970 -
1986
First gas supply contract with Russia (Gazprom),
Norway (Troll) and Denmark
1998 Supply from the UK
2002 Takeover by E.ON
2005 Signing of Nord Stream I
2009 25% share in Yuzhno Russkoye
2013 Merger to E.ON Global Commodities
2016 Uniper Global Commodities
2017Sale of Yuzhno Russkoye and support for Nord
Stream II
2 bcm
3 bcm
.
.
.
.
38 bcm
.
51 bcm
.
.
.
.
68 bcm
.
.
.
40 bcm
60%
market
share1
36%
market
share1
Global Commodities
From Ruhrgas to Uniper
10
1. German wholesale market share

Our Gas Midstream business - a strong and
reliable earnings contributor
11
Rest of Uniper
Gas
Midstream2016A
Global
Commodities
International
Power
European
Generation
PowerGas
Midstream
Coal &
Freight /
LNG
Yuzhno
Russkoye
(Sold)
Gas storage
capacity
Wholesale
sales
Portfolio
optimization
Gas pipeline
participations
Gas Midstream in the context of UniperGas Midstream EBITDA vs. Group EBITDA
(adjusted for non-periodic effects)1
Rest of UniperGas
Midstream2015A
Gazprom
adjustment
Gazprom
adjustment
Long-term
supply
portfolio
1. Note: the 2016 Gas Midstream result has been lowered by the non-periodic effect of the 2016 provision release for the Gazprom renegotiation.
Accordingly 2015 Gas Midstream result has been increased by the relevant value.

Well positioned along the entire gas value chain
12
#3 storage player in
Europe with a
flexible, diversified
storage portfolio
8.2 bcm of storage
capacity
Shareholdings in
major European
transit pipelines
Bookings across
Europe:
Hub-to-hub
Market entry-exit
Storage entry-
exit
Shareholdings in
OLT Regasification
terminal with
regulated earnings
LNG bookings in
Gate and Grain and
access to terminals
in Spain with the
ability to bring
additional volumes
into the market
Procurement of in
total ~1,700 TWh
from domestic and
foreign producers
Thereof roughly
400 TWh contracted
long-term with time
and volume flex
Market-reflective
pricing
BBL
OPAL
Nord Stream
II
Transitgas
OLT
Strong asset base at the heart of the gas value chain
Gas Sales of in total
~1,700 TWh, thereof
around 20%2
contracted to
traditional sales
customers with
specific demand
patterns
More than 1,000
customers, mainly
municipal utilities,
industrials and
power plants
Gas, power, energy
related services
Market share ~40%
25bcm
8bcm5bcm
~30% 21% 3%
Uniper Market Share
Mark
et
Cap
acit
y
Sales PortfolioStorageTransmissionLNG Regas
Infrastructure shareholdings and bookingsSupply Portfolio
1. Reflecting annual contracted quantity (ACQ) and not minimum offtake obligation
2. Volume depending on gas to power demand and temperatures
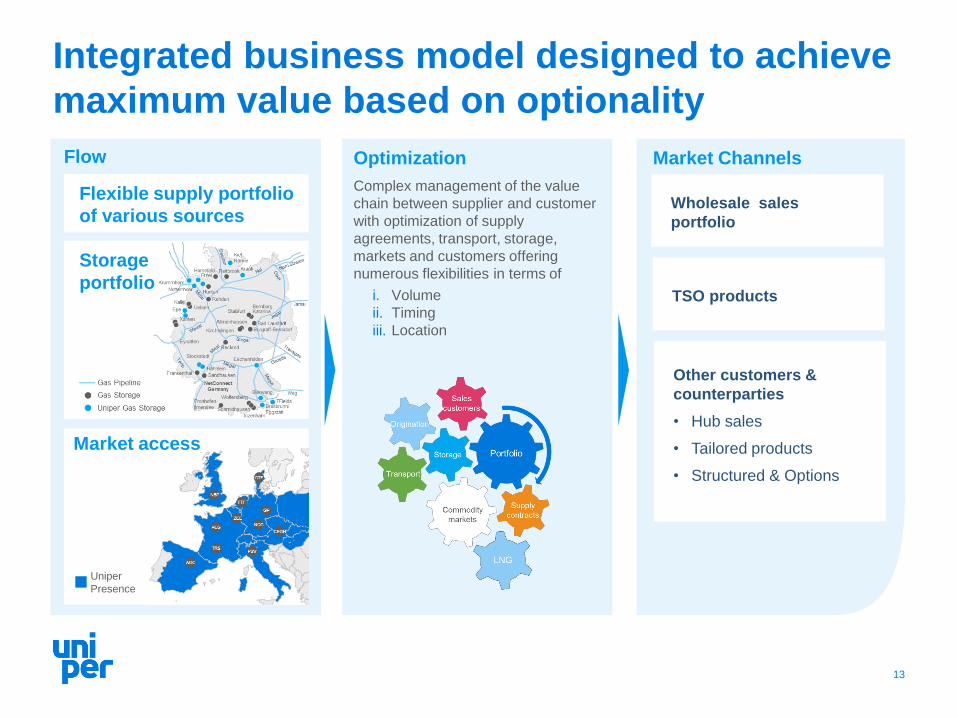
Optimization
Complex management of the value
chain between supplier and customer
with optimization of supply
agreements, transport, storage,
markets and customers offering
numerous flexibilities in terms of
i. Volume
ii. Timing
iii. Location
Integrated business model designed to achieve
maximum value based on optionality
Flexible supply portfolio
of various sources
13
Market ChannelsFlow
Wholesale sales
portfolio
TSO products
Other customers &
counterparties
• Hub sales
• Tailored products
• Structured & Options
Storage
portfolio
Uniper
Presence
Market access

Content
14
I. Gas market trends
II. Uniper‘s Gas Midstream
business
III. Composition of earnings
IV. Positioning for the future
V. Q+A
Keith Martin
Keith Martin
Christopher Delbrück
Keith Martin

Portfolio de-risking
Spread-risk between indexation in gas LTCs and sales
contracts has been widely eliminated
Reduction of asset value
Reduction in summer/ winter spreads
Reduction in volatility
Increase of Optimization earnings
Strong increase in liquidity at trading hubs
Broader portfolio due to new products/ markets
Consequent execution of make-or-buy decision
--
400
800
1.200
1.600
2011 2012 2013 2014 2015 2016
Underlying EBITDA level of ~€350 - 500m
15
1. To create like-for-like comparison historically reported data has been adjusted. Difference to reported figures based on exclusion of disposals of OGE,
SPP and IUK; Nord Stream I included until end of 2015
Underlying earnings plateau
(adjusted for LTC settlement effects1)
Underlying earnings
Extraordinary optimization result
LTC re-negotiation result
LTC re-negotiation result
reallocated
€m
Shift of earnings
500
350
€m
t
Extraction of asset value
Optimization

Sustainable earnings power
A
C
B
16
Infrastructure
Stable earnings from
long-term marketed infrastructure
investments
Supply, Sales and Asset Margin
Structural earnings from supply, sales
and asset margin based on commodity
margin, value from our storage
/transport assets as well as TSO
products
Optimization Margin
Proven earnings from Optimization
Margin based on our portfolio approach
including market elements
Underlying earnings plateau
Additional earnings contributor
Upside from market
recovery
A
B
C
Growth Projects
~€350m
-
€500m
EBITDA2
1. Gross Margin does not include any OPEX
2. Note: includes EBT from infrastructure
Optimization
Gross Margin1
~ €300m-€400m
Infrastructure
EBT
~ €100m
Supply, Sales,
Asset
Gross Margin1
~ €200m-€300m
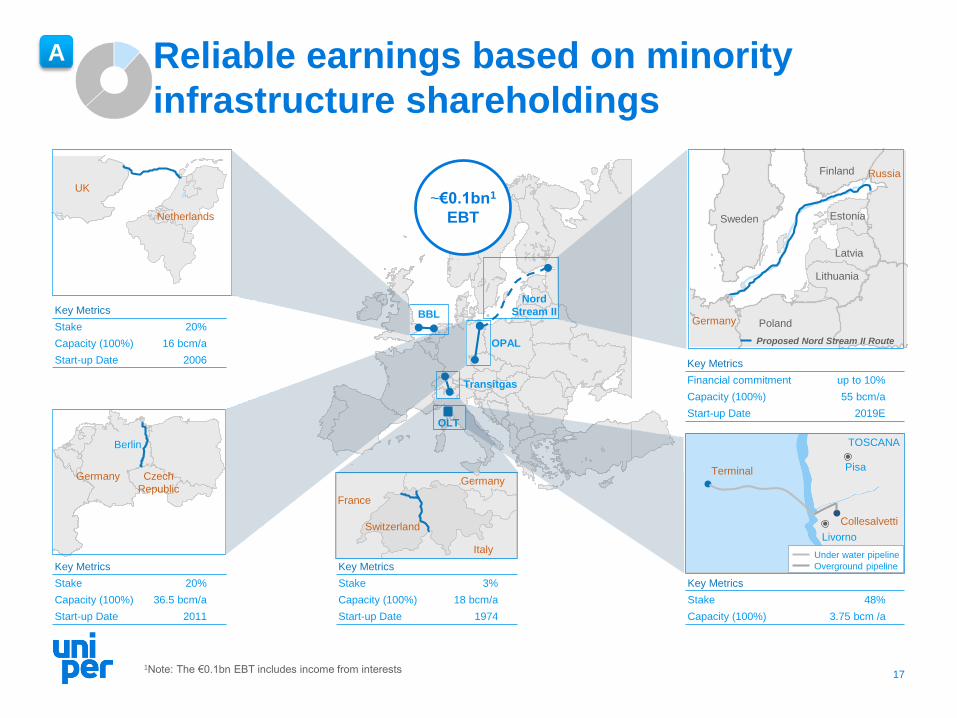
Reliable earnings based on minority
infrastructure shareholdings
17
Key Metrics
Stake 20%
Capacity (100%) 16 bcm/a
Start-up Date 2006
Key Metrics
Stake 20%
Capacity (100%) 36.5 bcm/a
Start-up Date 2011
Key Metrics
Financial commitment up to 10%
Capacity (100%) 55 bcm/a
Start-up Date 2019E
Key Metrics
Stake 3%
Capacity (100%) 18 bcm/a
Start-up Date 1974
Sweden
Poland
Lithuania
Latvia
Estonia
RussiaFinland
Germany
Proposed Nord Stream II Route
UK
Netherlands
Germany
Berlin
Czech
Republic
Switzerland
Italy
Germany
France
Key Metrics
Stake 48%
Capacity (100%) 3.75 bcm /a
Terminal Pisa
Collesalvetti
Livorno
TOSCANA
Under water pipeline
Overground pipeline
BBL
OPAL
Nord
Stream II
Transitgas
OLT
~€0.1bn1
EBT
A
1Note: The €0.1bn EBT includes income from interests

Structural earnings from Supply, Sales
and Asset Margins
18
~€200 –
300mgross
margin
B
4. Earnings from TSO products
Based on the large and diversified assets
Uniper delivers security of supply for
network operators
Current market regime requires mid and
short term services which are offered
3. Transport: intrinsic value
Ability to capture spreads between
different locations
(e.g. NBP/TTF, NCG/AOC)
Therefore intrinsic value as part of or
stable earnings base
1. Commodity margin
Supply & Sales Business delivers
structural margin on the back of
midstream services
2. Storage: intrinsic value
Ability to capture the spread between
seasons as base driver, complemented by
monthly shape, multi-year and location
value
Earnings dependent on the magnitude and
volatility

Value adding function by managing risks
between producer and customer products
19
Contract
Pricing
Contract
Volumes
Delivery
Point
Contract
Duration
Focus on long term
commitments (10yr+)
Producer Midstreamer Customer
Market reflective pricing
(mainly hub based)
Predictability of volume
offtake (i.e. low volume risk
on production)
Delivery at border points to
avoid having to deal with
transport
Transformation of
contract duration
Management of price
mismatches
Managing volume risks and
potential underlying risks like
temperatures
Managing/optimizing
transportation bookings,
dealing with TSOs and
managing regulatory risks
Rather short-term
(1-2 years)
Tailored pricing/ products.
(mainly fixed price)
Flexible volumes to follow
demand (e.g. weather
sensitivity)
Delivery into customer
portfolio/at the doorstep
B

LNG
Proven earnings power from portfolio
optimization of ~€300-400m gross margin
C
Portfolio Effects
Broad toolbox and broad portfolio with partly offsetting positions allow to
generate additional value at limited risks
Structured Optimization of flexibility
Time (storage) and location (transport) optimization generates
additional value
Capturing significant additional value
from diversified portfolio
Asset backed Optimization
Assets enable to take market views on gas prices as well as spreads
20

Content
21
I. Gas market trends
II. Uniper‘s Gas Midstream
business
III. Composition of earnings
IV. Positioning for the future
V. Q+A
Keith Martin
Keith Martin
Christopher Delbrück
Keith Martin

Shah Deniz LTCA long term gas supply has
been signed with the
Azerbaijani state oil
company SOCAR
Growth: Origination of new business activities
(examples)
22
Organic growth
Go East
Expansion of operations into
Eastern Europe to increase
Uniper’s market share
based on existing assets
New LNG Opportunities
Expansion of operations into
middle east creating sales
outlets on global LNG-to-
Power & optimizing Regas
New technologies: examining technical and
economic Feasibility of green fuels
Power-to-Gas technology utilizing renewable electricity
produces green hydrogen and oxygen (electrolysis)
Green hydrogen can be fed into the natural gas grid or
used directly in refineries and mobility to reduce
emissions and to integrate renewables
New ventures
LNG for Trucks Iveco and Uniper open first
LNG fuelling station for
trucks in Germany
Savings on fuel costs and
more pronounced
environmental benefits
LNG services
Providing Services e.g. to
LNG Suppliers,
Infrastructure & Hedge
Funds Nord Stream II
Strategic investment
Source of very stable long-
term cash flows

Uniper gas midstream –
core EBITDA of €350-500m p.a. …
Well positioned
for a decarbonizing
world
Additional value
creation from
optimization
Long-term upsides
from recovery
of gas storage
Growth potential in
global LNG markets
… and upside/ growth potential
Stable earnings from
infrastructure
Reliable margins
in midstream core
23

Content
24
I. Gas market trends
II. Uniper‘s Gas Midstream
business
III. Composition of earnings
IV. Positioning for the future
V. Q+A
Keith Martin
Keith Martin
Christopher Delbrück
Keith Martin