weo outlook oct 2012
DESCRIPTION
World Economic Outlook, October 2012 (Jaime Custodio Guajardo, Senior Economist, Research Department, International Monetary Fund)TRANSCRIPT

World Economic Outlook
Coping with High Debt and Sluggish Growth
October 2012
Main Message: Action Needed to Put Recovery Back on Track
• The global economy has suffered new setbacks
• The forecasts are down • Risks are up sharply
• AE: policies have progressed but much stronger actions are needed
• EM: complex setting—rebuilding policy room for maneuver versus
supporting growth

New Setbacks to the Global Recovery
Global Manufacturing PMI
(Index; > 50 = expansion; SA)
Source: IMF, Global Data Source.
30
35
40
45
50
55
60
06 07 08 09 10 11 12
World
Advanced
Emerging
3
-80
-60
-40
-20
0
20
40
60
80
05 06 07 08 09 10 11 12
Advanced
Emerging
Merchandise Exports (Percent; 3mma annualized)
Aug. 12 Jul. 12

Increasing strains in the euro area
What Went Wrong?
Large growth impact of fiscal adjustment amid tight financial conditions
End of the emerging markets boom
4

Euro Area: Growing fragmentation, despite policy responses
5
-12
-10
-8
-6
-4
-2
0
2
4
6
8
2010 2011 2012
Core Periphery Mar. 12
Portfolio and Other Investment Capital Flows, Excluding Central Banks (Cumulative from December 2009, in percent of GDP)
Sources: Haver Analytics; and IMF staff estimates.
Source: Bloomberg, L.P. and IMF staff estimates.
0
100
200
300
400
500
600
700
Jan-11 Apr-11 Jul-11 Oct-11 Jan-12 Apr-12 Jul-12
Italy
Spain
France
Draghi speech Aug. 2nd
2nd LTRO
Sept. 12
10-Year Government Bond Spreads over German Bunds (basis points)
1st LTRO
6
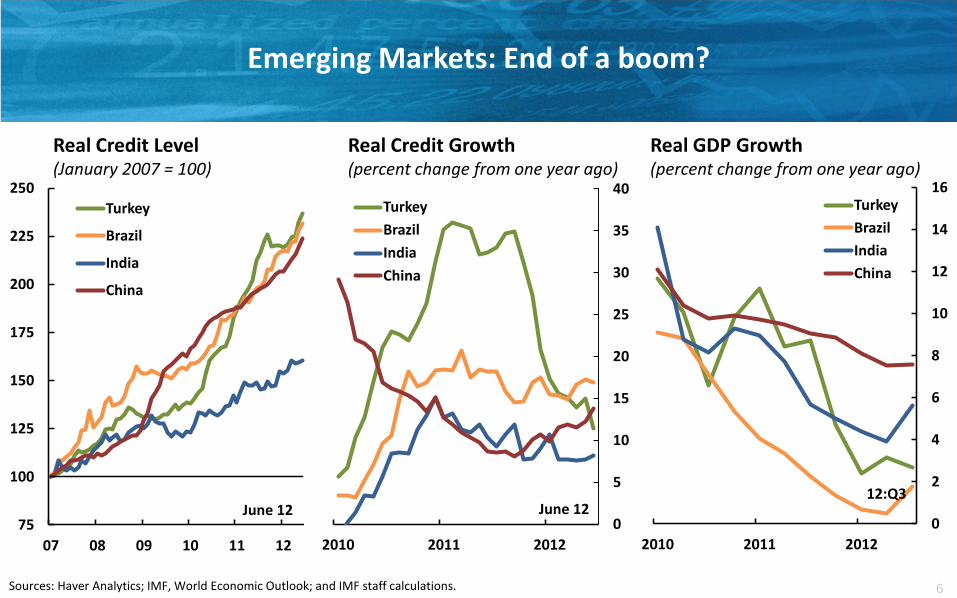
Real GDP Growth (percent change from one year ago)
Emerging Markets: End of a boom?
Sources: Haver Analytics; IMF, World Economic Outlook; and IMF staff calculations.
0
2
4
6
8
10
12
14
16
2010 2011 2012
Turkey
Brazil
India
China
75
100
125
150
175
200
225
250
07 08 09 10 11 12
Turkey
Brazil
India
China
Real Credit Level (January 2007 = 100)
0
5
10
15
20
25
30
35
40
2010 2011 2012
Turkey
Brazil
India
China
Real Credit Growth (percent change from one year ago)
June 12 June 12 12:Q3

7
Tight financial conditions and fiscal policies in AE
-40
-20
0
20
40
60
80
100
2007 2008 2009 2010 2011 2012
U.S.
Euro area
Japan
U.K.
12:Q2
Lending Conditions (Net percentage of domestic respondents tightening standards for loans)
Sources: Lending surveys by the Bank of England, European Central Bank, Bank of Japan, and the U.S. Federal Reserve for households and corporations; and IMF staff estimates.
-3
-2,5
-2
-1,5
-1
-0,5
0
0,5
1
1,5
2009 10 11 12 13
Advanced economies
Emerging and developing economies
Fiscal Consolidation (Change in structural balance as percent of GDP)

Key
Assumptions
•Strong euro-area policies improve financial conditions in 2013H2
•US policymakers avoid fiscal cliff, raise debt ceiling
Outlook: Weak and Uncertain
Outlook •Recovery gradually strengthens
•Downside risks are large
7

World
U.S. Euro Area Japan Brazil India China Russia
2012
(September 2012) 3.3 2.2 -0.4 2.2 1.5 4.9 7.8 3.7
2012
(Revision from Jul 2012) -0.2 0.1 -0.1 -0.2 -1.0 -1.3 -0.2 -0.3
2012
(Revision from Apr 2012) -0.2 0.1 -0.1 0.2 -1.5 -2.0 -0.4 -0.3
2013
(September 2012) 3.6 2.1 0.2 1.2 4.0 6.0 8.2 3.8
2013
(Revision from Jul 2012) -0.3 -0.1 -0.5 -0.3 -0.7 -0.6 -0.2 -0.1
2013
(Revision from Apr 2012) -0.5 -0.3 -0.7 -0.5 -0.1 -1.3 -0.6 -0.1
The outlook has deteriorated since April
WEO Real GDP Growth Projections (percent change from a year earlier)
Source: IMF, World Economic Outlook. 9

-1
0
1
2
3
4
5
6
7
2009 2010 2011 2012 2013
90 percent confidence interval
90 percent confidence interval (April 2012 WEO)
90 percent confidence interval (Sept 2011 WEO)
Baseline
Downside risks are large: 1 in 6 chance of serious global slowdown (global growth < 2 percent)
Prospects for World GDP Growth (percent change)
Downside: 1. More stress in euro area 2. US fiscal cliff, debt ceiling 3. Higher oil prices 4. Medium-term risks: high AE debt; lower EM growth

Key Risks: Escalating euro crisis and U.S. fiscal cliff
Source: IMF staff estimates
Euro Area Downside Scenario (Output loss, percent deviation from baseline in 2013)
-7
-6
-5
-4
-3
-2
-1
0
Note: This scenario assumes that sovereign and corporate spreads rise, credit contracts, and periphery governments are forced to front-load fiscal consolidation.

•Removing
immediate
risks
•Euro Area: Restoring confidence
•United States: Avoiding the fiscal cliff, raise debt ceiling
What Is To Be Done?
•Adjusting
policies
•AE: Managing medium-term fiscal adjustment
•EM&DC: Managing risks vs rebuilding policy space
•Developing Countries: Dealing with commodity price shock

Periphery
•Fiscal adjustment
•Bank recapitalization/resolution
•Structural reforms
Restoring Confidence in the Euro Area
EA partners
•Support adjustment through EFSF/ESM
•Help recapitalize banks
•Advance euro area fiscal and banking union
ECB
•Help ease financial conditions in periphery—latest action
fully delivers on this front; ball is now in other courts
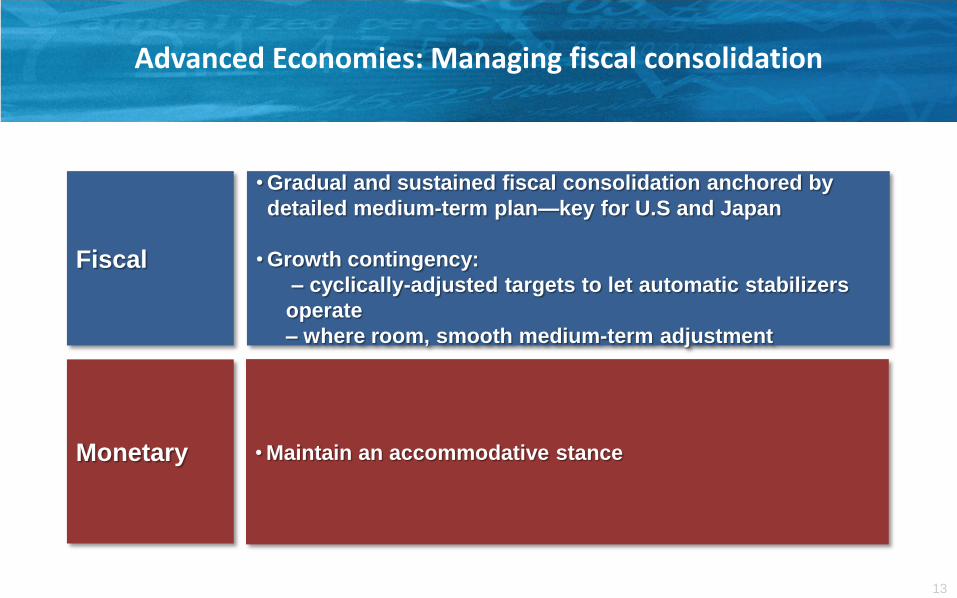
Fiscal
•Gradual and sustained fiscal consolidation anchored by
detailed medium-term plan—key for U.S and Japan
•Growth contingency:
– cyclically-adjusted targets to let automatic stabilizers
operate
– where room, smooth medium-term adjustment
Advanced Economies: Managing fiscal consolidation
Monetary •Maintain an accommodative stance
13

0
20
40
60
80
100
120
140
160
180
200
220
240
0 1 2 3 4 5 6 7 8 9 10 11 12 13 14 15
Reducing public debt is a marathon, not a sprint
After Crossing the 100 Percent Threshold (Percent of GDP, advanced economies)
Median 10th/90th percentile 25th/75th percentile
Years Source: IMF staff calculations.

Downside
risks
•Ease monetary policy further, strengthen macro-prudential measures
•Allow fiscal stabilizers to work
• If needed and consistent with stronger medium-term growth,
deploy fiscal stimulus (e.g. China)
EMDEs: Complex setting—need to calibrate macro stance given potential for real and financial vulnerabilities
Baseline
scenario
•Pause monetary policy tightening or modestly ease
•Continue to rebuild fiscal position, especially India and Russia
15
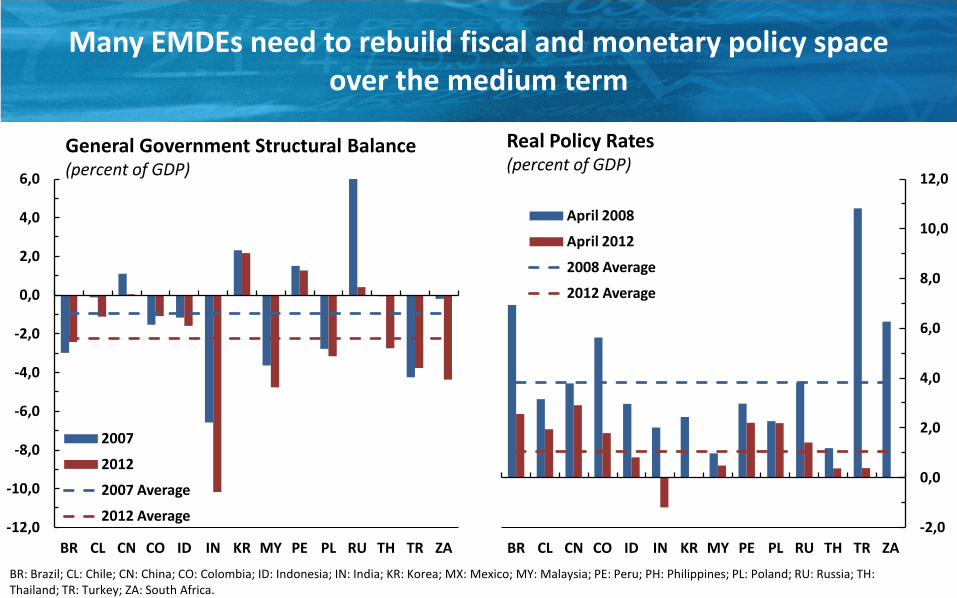
Many EMDEs need to rebuild fiscal and monetary policy space over the medium term
General Government Structural Balance (percent of GDP)
Real Policy Rates (percent of GDP)
-12,0
-10,0
-8,0
-6,0
-4,0
-2,0
0,0
2,0
4,0
6,0
BR CL CN CO ID IN KR MY PE PL RU TH TR ZA
2007
2012
2007 Average
2012 Average -2,0
0,0
2,0
4,0
6,0
8,0
10,0
12,0
BR CL CN CO ID IN KR MY PE PL RU TH TR ZA
April 2008
April 2012
2008 Average
2012 Average
BR: Brazil; CL: Chile; CN: China; CO: Colombia; ID: Indonesia; IN: India; KR: Korea; MX: Mexico; MY: Malaysia; PE: Peru; PH: Philippines; PL: Poland; RU: Russia; TH: Thailand; TR: Turkey; ZA: South Africa.
0
50
100
150
200
250
300
350
400
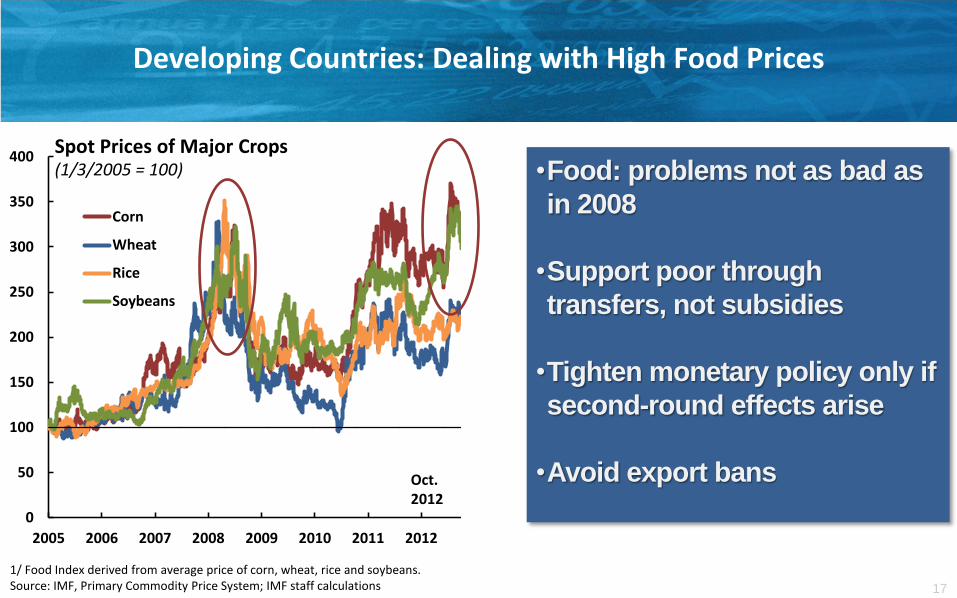
2005 2006 2007 2008 2009 2010 2011 2012
Corn
Wheat
Rice
Soybeans
•Food: problems not as bad as
in 2008
•Support poor through
transfers, not subsidies
•Tighten monetary policy only if
second-round effects arise
•Avoid export bans
Developing Countries: Dealing with High Food Prices
17
Spot Prices of Major Crops (1/3/2005 = 100)
1/ Food Index derived from average price of corn, wheat, rice and soybeans. Source: IMF, Primary Commodity Price System; IMF staff calculations
Oct. 2012

World Economic Outlook
October 2012