ctc 2012 annual_report_low_res_e_-_may_2_2012
TRANSCRIPT
CANADIAN TOURISM COMMISSION | 2012 ANNUAL REPORT
Delivering Value for Canada’s Tourism Businesses
Through Innovation and Effi ciency
This Annual Report showcases key activities and initiatives undertaken throughout
2012. The Annual Report serves as the principal mechanism for the Canadian
Tourism Commission to report to the Parliament of Canada and demonstrate the
results achieved with public resources.
Nunavut
Cover image:
Niagara Helicopters Tour,
Niagara Falls, Ontario
CONTENTS
1 About the CTC
2 Message from the Chair of the Board
3 Message from the President & CEO
4 Results at a Glance
6 Helping Tourism Businesses
13 Year in Review
13 Global Tourism Industry Overview
14 Tourism Industry in Canada
16 Competitor Performance
19 CTC Highlights of 2012
25 Marketing Canada to the World
28 Awards and Recognition in 2012
30 Performance Measurement
33 Corporate Governance
38 Management Discussion and Analysis
46 Financial Statements
53 Notes to the Audited Financial Statements
Canadian Tourism Commission 2012 Annual Report 1
ABOUT THE CTC
The Canadian Tourism Commission (CTC) is Canada’s
national tourism marketing organization. Governed by the
Canadian Tourism Commission Act, we lead the Canadian tourism
industry in marketing Canada as a premier, four-season tourism
destination, and provide a consistent voice for Canada in the
international tourism marketplace.
As a federal Crown corporation, we report to Parliament through
the Minister of Industry, who has delegated his duties and power
related to the CTC to the Minister of State (Small Business and
Tourism). Our purpose is to sustain a vibrant and profi table tourism
industry by supporting a cooperative relationship between the
private sector and the governments of Canada, the provinces and
the territories. The CTC was founded on the principle of public/
private sector partnerships; through contributions that leverage our
federal funding, we achieve the maximum return on investment for
our tourism marketing initiatives.
We collaborate with our partners in the tourism industry to promote
Canada’s extraordinary experiences in 11 countries around the
world. Our current approach targets international travellers in the
Americas (Mexico and Brazil), Europe (the United Kingdom (UK),
Germany and France), Asia (China, India, Japan and South Korea)
and Australia. We also conduct business events sales activities
in the United States (US). Our regional hub structure allows us to
be nimble and opportunistic so that we can adjust our marketing
programs to refl ect changing market conditions and capitalize on
new marketing opportunities as they arise. Moreover, we perform
market research, offer stunning visuals through our Brand Canada
Library and provide resources to help industry leverage Canada’s
successful tourism brand, Canada. Keep Exploring.
The immediate benefi ciary of our activity is Canada’s tourism
industry, with over 157,0001 tourism-related businesses supporting
over 608,0002 jobs in the Canadian economy. The ultimate
benefi ciary is the Canadian taxpayer, who enjoys tourism’s
contribution to the quality of life in Canada through public and
private investments in parks, transportation infrastructure,
attractions, events and event facilities.
1 Statistics Canada, Income and Expenditure Division, Special Tabulation, 2011.2 National Tourism Indicators, Quarterly estimates, Third quarter 2012,
Statistics Canada.
© N
unavu
t To
urism
2 Canadian Tourism Commission 2012 Annual Report
MESSAGE FROM THE CHAIR OF THE BOARD
Tourism is above all a people business. The past year has
enabled me to connect with and learn from more folks in
the Canadian tourism industry than ever before, from coast
to coast to coast.
It started with an invitation from the Honourable Maxime
Bernier, Minister of State (Small Business and Tourism),
for the CTC to review the funding practices of national
tourism organizations around the world and to return with a
comprehensive report.
So began an epic series of industry consultations around
Canada for Michele and myself. We listened to and
compared notes with the Canadian tourism industry,
from provincial tourism associations, industry leaders and
small business owners to prominent federal, provincial
and municipal government fi gures from Yukon and British
Columbia to Quebec and Atlantic Canada.
Our industry showed great leadership and provided fresh
grassroots insights during these discussions. I’d like to thank
the Hotel Association of Canada and the Tourism Industry
Association of Canada for their invaluable support and
leadership in this process and in raising the profi le for the
opportunities presented by our industry for job creation and
economic growth.
We’re always looking ahead at the CTC, sifting the bigger
trends for fresh opportunities. Our team has identifi ed the
youth travel market as a great opening for long-term tourism
growth in Canada, especially in the build-up to our country’s
150th anniversary in 2017. I look forward to seeing this work
develop and fl ourish further in 2013 and beyond.
More CTC thought leadership came last year in the creation
of the Export Tourism Council. Despite total tourism revenue
reaching $82 billion in 2012, most of that growth came from
the domestic market. This Council brings together industry
leaders who have signifi cant investments in export markets
and will be invaluable in helping to inform our strategic
direction in the international marketplace.
In a global context, the G20 world leaders recognized for the
fi rst time the importance of travel and tourism as a driver of
economic recovery, growth and jobs. Marketing budgets are
being strengthened around the globe, while governments
adjust air, visa and border access policies to maximize
competitiveness. And Canada can compete. We have a
great brand and a stellar reputation.
This year, I would like to make special mention of our industry
partners. Over the years, on average our partners have
doubled the amount invested in the CTC by the government.
While that result is harder to achieve in leaner times, as was
the case in 2012, it’s still an impressive demonstration of
the confi dence placed in us by the industry and our mutual
commitment to growing international tourism revenue.
In 2012, partner contributions totalled nearly $62 million,
harnessing our collective marketing voice to $138 million.
The CTC has an incredible team of passionate professionals.
On behalf of everyone on our board, I extend my
compliments and thanks to each one of them for all their
efforts in 2012. It is an honour for me, fellow board members
and the industry volunteers on our fi ve advisory committees
to be associated with such an outstanding team.
Where next? Our markets are showing encouraging signs of
vitality, and that does not include the steady rise in numbers
in Canadians travelling more in their own country. The US
market has bottomed out and a turnaround in Canadian
fortunes has begun. Our emerging and re-emerging markets
are building a head of steam. And Australia goes from
strength to strength. Opportunity is knocking, folks.
Steve Allan
Chair

Canadian Tourism Commission 2012 Annual Report 3
MESSAGE FROM THE PRESIDENT & CEO
“Innovation is the specifi c instrument of
entrepreneurship. The act that endows resources
with a new capacity to create wealth.” — Peter Drucker, 1993
What Drucker said 20 years ago still holds true for the
tourism industry and for us especially at the Canadian
Tourism Commission. Our goal in 2012 was to compete
fi ercely with our international rivals, be top drawer in terms of
marketing innovation and to deliver results—and revenue—
for Canada. We delivered those, in spades.
Pride of place at 2012’s innovation table must go to our
35 Million Directors project. It delivered a stunning visual
story that delighted and inspired people around the world
to come visit Canada. The project also stirred a great sense
of national pride in Canadians to help promote our country
and to support our national tourism industry in communities
across Canada.
We had asked Canadians during the summer to send
us their images and videos that they believed captured
Canada’s heart and soul. More than 8,000 submissions later,
we knew we had struck gold. The video, “Canada. Shared
by Canadians,” has been seen by more 2.5 million people
around the world on YouTube.
Our ground-breaking Signature Experiences Collection®
program went from strength to strength in 2012. Fully
launched in almost all our international markets, the
Collection, now 163 members strong, showcases Canada’s
distinctive tourism experiences to the travel trade and
consumers alike, giving us an extra edge in a crowded
tourism marketplace.
The competition certainly got tougher in 2012, with the
launch of Brand USA. Canadians are being wooed by big
money poured into great campaigns by our close southern
neighbour. This is a genuine game-changer for our industry
at home. There have been changes on the domestic front,
too. New tourism Crown corporations sprang up in 2012 for
British Columbia, Saskatchewan and Nova Scotia. Broadly
speaking, there is an increased sophistication and alignment
with best practices among our partners. The CTC got an A
grade for effi ciency in 2012: we introduced new cloud-based
systems across our internal business, providing our staff with
effective, easy-to-use-tools that saved money and freed up
time and resources for our marketing work.
We re-launched our partnership with the Tourism Industry
Association of Canada on industry communications,
research products and education around issues. Two of
the trickiest subjects we now deal with in tandem are visas
and air access from our key markets. We also started a
series of town halls in December to meet grassroots tourism
stakeholders and pool ideas on how to take the Canadian
tourism industry forward.
I’m delighted to report on our excellent results from the past
year that are directly attributable to our measured marketing
activities in 2012:
• $687 million in tourism export revenue for Canada’s
economy;
• $212 million towards government revenue;
• 5,073 jobs created or protected by Canadian tourism
businesses.
For every dollar invested in our consumer marketing
campaigns, we generated $56 for Canada’s visitor economy.
It’s been another great year working with all our teams at the
CTC. I often tell our partners that the CTC’s two main assets
are our brand, Canada. Keep Exploring, and our people, who
amaze me, push me to excel and are a source of ceaseless
pride. Going forward into 2013 with such talented people
makes me confi dent we will continue to meet our goals of
delivering fresh ideas for attracting visitors to Canada and
increasing the revenue streams into our country.
Keep exploring!
Michele McKenzie
President & CEO
4 Canadian Tourism Commission 2012 Annual Report
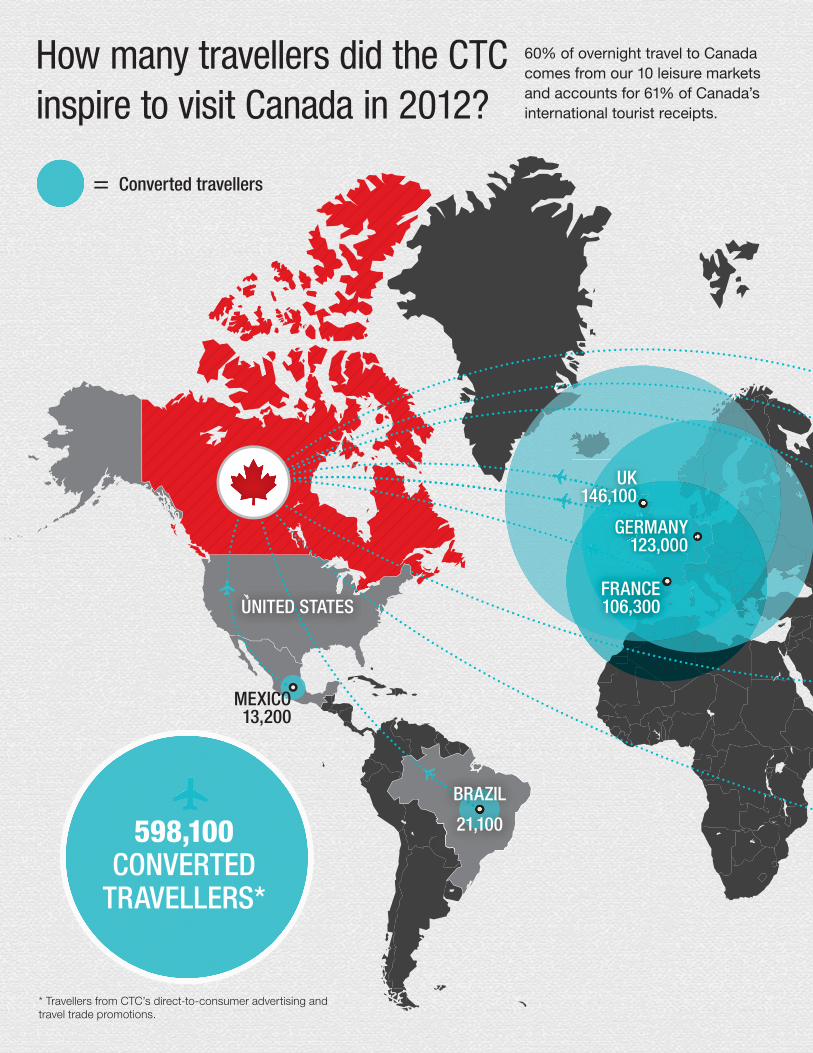
RESULTS AT A GLANCE
BRAZIL
21,100
UNITED STATESFRANCE106,300
GERMANY123,000
UK146,100
MEXICO13,200
How many travellers did the CTC
inspire to visit Canada in 2012?
60% of overnight travel to Canada
comes from our 10 leisure markets
and accounts for 61% of Canada’s
international tourist receipts.
598,100CONVERTED
TRAVELLERS*
Converted travellers=
* Travellers from CTC’s direct-to-consumer advertising and travel trade promotions.
Canadian Tourism Commission 2012 Annual Report 5
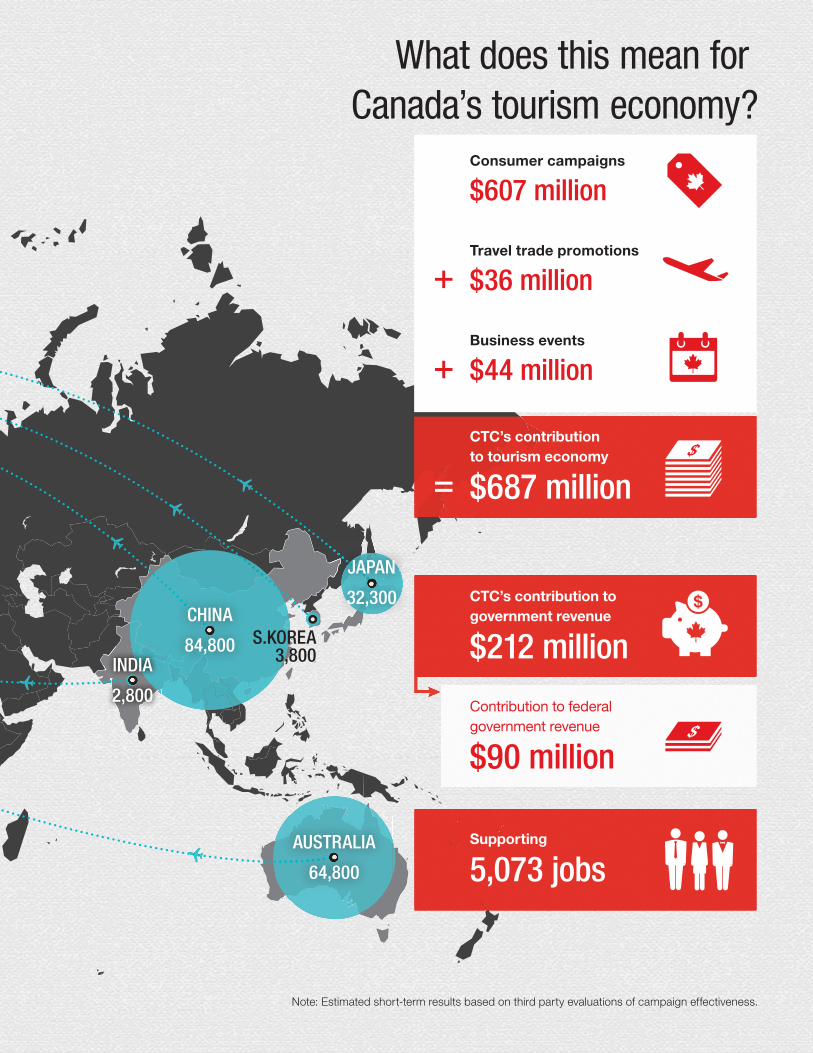
CHINA
84,800INDIA
2,800
AUSTRALIA
64,800
JAPAN
32,300
S.KOREA3,800
What does this mean for
Canada’s tourism economy?
Note: Estimated short-term results based on third party evaluations of campaign effectiveness.
Supporting
5,073 jobs
Consumer campaigns
$607 million
Travel trade promotions
$36 million+
Business events
$44 million+
CTC’s contribution
to tourism economy
$687 million
$
=
$
CTC’s contribution to
government revenue
$212 million
Contribution to federal
government revenue
$90 million
SECTION TITLE
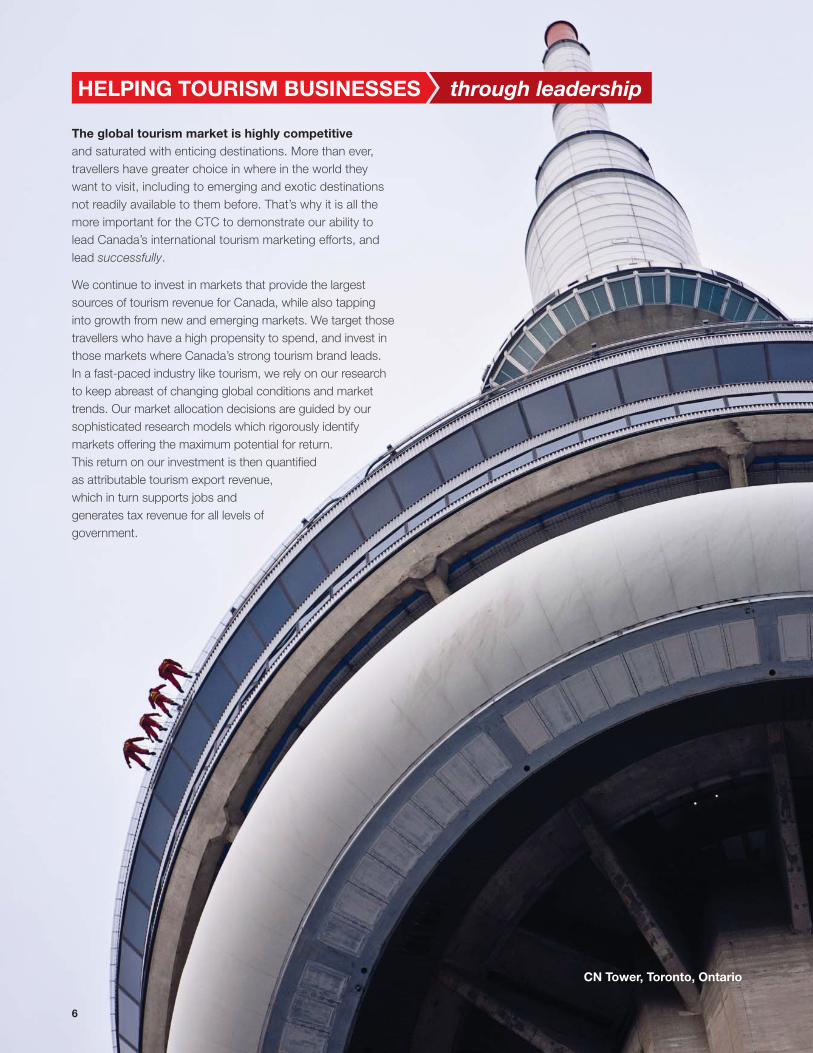
HELPING TOURISM BUSINESSES through leadership
The global tourism market is highly competitive
and saturated with enticing destinations. More than ever,
travellers have greater choice in where in the world they
want to visit, including to emerging and exotic destinations
not readily available to them before. That’s why it is all the
more important for the CTC to demonstrate our ability to
lead Canada’s international tourism marketing efforts, and
lead successfully.
We continue to invest in markets that provide the largest
sources of tourism revenue for Canada, while also tapping
into growth from new and emerging markets. We target those
travellers who have a high propensity to spend, and invest in
those markets where Canada’s strong tourism brand leads.
In a fast-paced industry like tourism, we rely on our research
to keep abreast of changing global conditions and market
trends. Our market allocation decisions are guided by our
sophisticated research models which rigorously identify
markets offering the maximum potential for return.
This return on our investment is then quantifi ed
as attributable tourism export revenue,
which in turn supports jobs and
generates tax revenue for all levels of
government.
CN Tower, Toronto, Ontario
6
Canadian Tourism Commission 2012 Annual Report 7
HELPING TOURISM BUSINESSES
We similarly use our foundation of business insights and
market research to continually improve our marketing and to
impact the strategies of tourism businesses. For example,
recognizing the demand for Canadian outdoor activities,
including hunting and fi shing, in 2012 we launched website
pages with links to outfi tter sites directed at enthusiasts
looking for authentic outdoor experiences that have a long
tradition in Canada. While the knowledge that we gather
helps to inform our decision making, members of the
Canadian tourism industry also use our extensive production
of research publications (e.g. Tourism Snapshot, Global
Tourism Watch summary reports, Market Insights) to help
grow their businesses.
Keeping the tourism industry informed and equipped with
tools is a key focus for us. Our CTC News is the place to
read about our work, keeping the industry up-to-date with
our latest campaigns and activities in all our markets. Our
Brand Canada Library offers a one-stop shop to travel trade
and media for over 5,000 professional images and video
clips of Canada’s urban and natural landscapes. The Library
refl ects the essence and diversity of Canada which can be
used to add an authentic Canadian fl avour to marketing
materials. And for over 30 years, we have been leading
the annual Rendez-vous Canada, Canada’s premier go-
to marketplace which connects international buyers with
Canadian sellers of tourism products.
Being on top of the communications revolution is another
mark that’s earned us a reputation a leader. Years ago,
before social media took off, we saw its potential for a
new kind of marketing. We eagerly embraced new social
platforms such as Facebook, Twitter, YouTube and Flickr into
our marketing channels, putting these tools into the hands
of visitors so they could tell their stories to fellow travellers
and become advocates for Canada. We broke new ground
as an early adopter of social media, and its integration
into our marketing approach has enabled us to build
Canada’s tourism brand globally and engage infl uencers and
consumers in two-way dialogue.
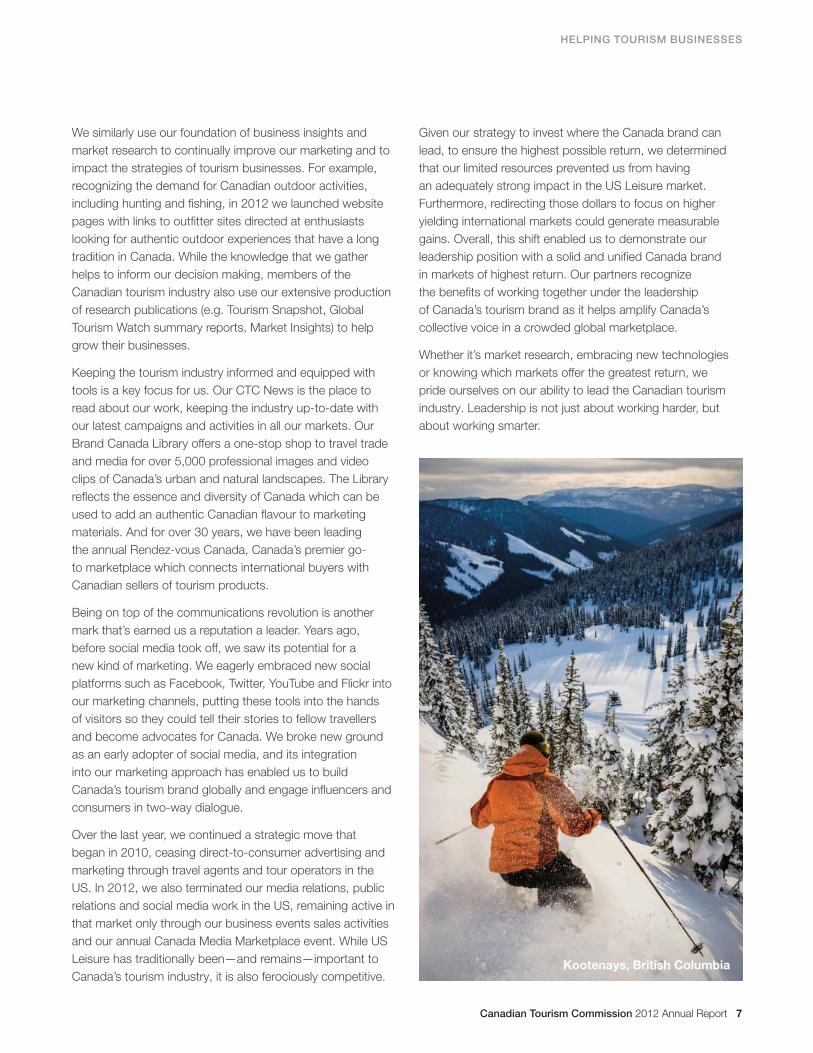
Over the last year, we continued a strategic move that
began in 2010, ceasing direct-to-consumer advertising and
marketing through travel agents and tour operators in the
US. In 2012, we also terminated our media relations, public
relations and social media work in the US, remaining active in
that market only through our business events sales activities
and our annual Canada Media Marketplace event. While US
Leisure has traditionally been—and remains—important to
Canada’s tourism industry, it is also ferociously competitive.
Given our strategy to invest where the Canada brand can
lead, to ensure the highest possible return, we determined
that our limited resources prevented us from having
an adequately strong impact in the US Leisure market.
Furthermore, redirecting those dollars to focus on higher
yielding international markets could generate measurable
gains. Overall, this shift enabled us to demonstrate our
leadership position with a solid and unifi ed Canada brand
in markets of highest return. Our partners recognize
the benefi ts of working together under the leadership
of Canada’s tourism brand as it helps amplify Canada’s
collective voice in a crowded global marketplace.
Whether it’s market research, embracing new technologies
or knowing which markets offer the greatest return, we
pride ourselves on our ability to lead the Canadian tourism
industry. Leadership is not just about working harder, but
about working smarter.
Kootenays, British Columbia
SECTION TITLE
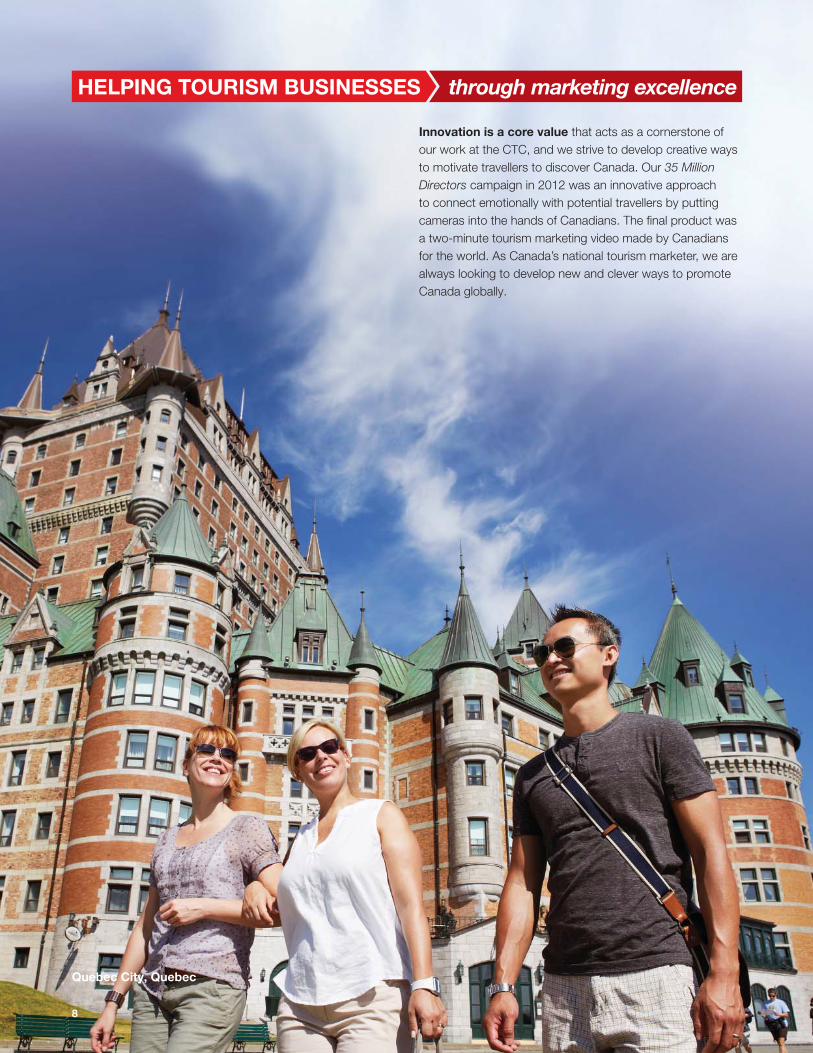
Quebec City, Quebec
8
HELPING TOURISM BUSINESSES through marketing excellence
Innovation is a core value that acts as a cornerstone of
our work at the CTC, and we strive to develop creative ways
to motivate travellers to discover Canada. Our 35 Million
Directors campaign in 2012 was an innovative approach
to connect emotionally with potential travellers by putting
cameras into the hands of Canadians. The fi nal product was
a two-minute tourism marketing video made by Canadians
for the world. As Canada’s national tourism marketer, we are
always looking to develop new and clever ways to promote
Canada globally.
Canadian Tourism Commission 2012 Annual Report 9
HELPING TOURISM BUSINESSES
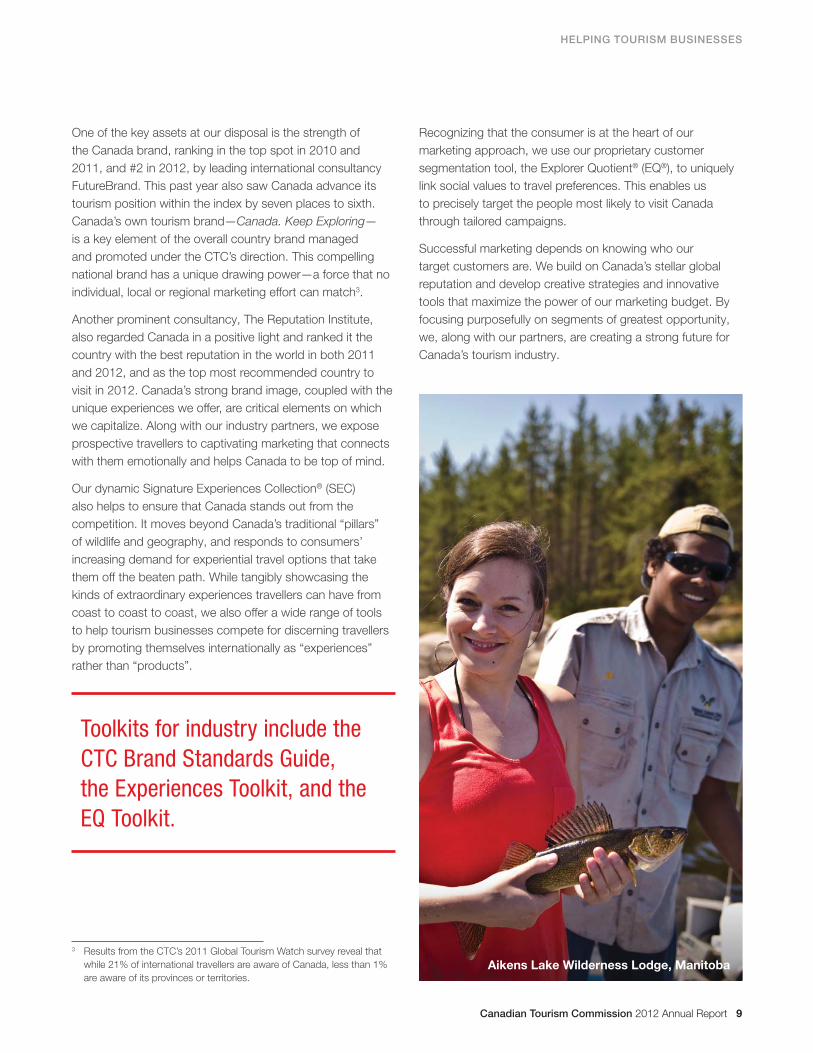
Aikens Lake Wilderness Lodge, Manitoba
One of the key assets at our disposal is the strength of
the Canada brand, ranking in the top spot in 2010 and
2011, and #2 in 2012, by leading international consultancy
FutureBrand. This past year also saw Canada advance its
tourism position within the index by seven places to sixth.
Canada’s own tourism brand—Canada. Keep Exploring—
is a key element of the overall country brand managed
and promoted under the CTC’s direction. This compelling
national brand has a unique drawing power—a force that no
individual, local or regional marketing effort can match3.
Another prominent consultancy, The Reputation Institute,
also regarded Canada in a positive light and ranked it the
country with the best reputation in the world in both 2011
and 2012, and as the top most recommended country to
visit in 2012. Canada’s strong brand image, coupled with the
unique experiences we offer, are critical elements on which
we capitalize. Along with our industry partners, we expose
prospective travellers to captivating marketing that connects
with them emotionally and helps Canada to be top of mind.
Our dynamic Signature Experiences Collection® (SEC)
also helps to ensure that Canada stands out from the
competition. It moves beyond Canada’s traditional “pillars”
of wildlife and geography, and responds to consumers’
increasing demand for experiential travel options that take
them off the beaten path. While tangibly showcasing the
kinds of extraordinary experiences travellers can have from
coast to coast to coast, we also offer a wide range of tools
to help tourism businesses compete for discerning travellers
by promoting themselves internationally as “experiences”
rather than “products”.
Toolkits for industry include the
CTC Brand Standards Guide,
the Experiences Toolkit, and the
EQ Toolkit.
3 Results from the CTC’s 2011 Global Tourism Watch survey reveal that
while 21% of international travellers are aware of Canada, less than 1%
are aware of its provinces or territories.
Recognizing that the consumer is at the heart of our
marketing approach, we use our proprietary customer
segmentation tool, the Explorer Quotient® (EQ®), to uniquely
link social values to travel preferences. This enables us
to precisely target the people most likely to visit Canada
through tailored campaigns.
Successful marketing depends on knowing who our
target customers are. We build on Canada’s stellar global
reputation and develop creative strategies and innovative
tools that maximize the power of our marketing budget. By
focusing purposefully on segments of greatest opportunity,
we, along with our partners, are creating a strong future for
Canada’s tourism industry.
10 Canadian Tourism Commission 2012 Annual Report
HELPING TOURISM BUSINESSES through economic growth
As one of the world’s fastest growing sectors4, tourism
is strategically important for Canada to generate export
revenues that provide new dollars to the economy. The
healthy domestic market is well served by our provincial
and territorial partners. We’ve chosen to focus fully on the
international traveller, thereby reducing duplication of efforts
in promoting Canada to Canadians.
A tourist from one of our leisure markets spends an average
of $1,441 on a trip to Canada5, while a Canadian spends
less than $300 travelling domestically6. While the Canadian
economy benefi ts from increasing domestic tourism
demand, dependence on this market is a serious concern as
there is limited potential for growth due to a relatively small
population base.
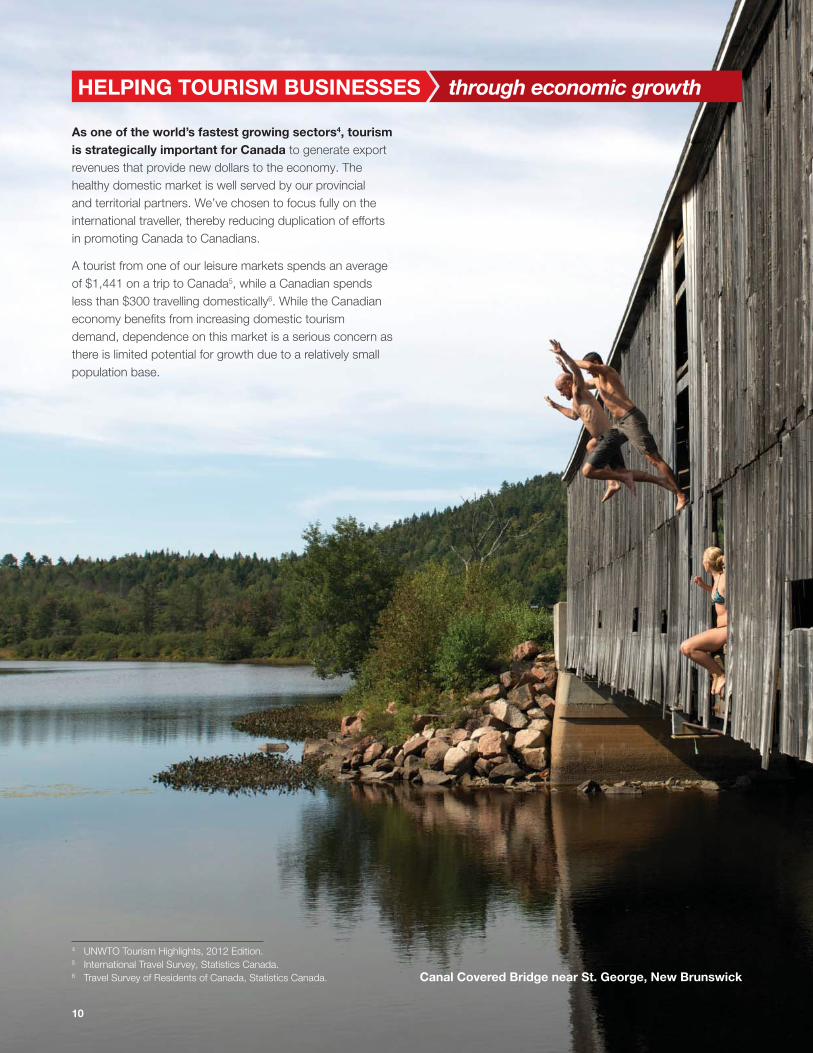
4 UNWTO Tourism Highlights, 2012 Edition.5 International Travel Survey, Statistics Canada.6 Travel Survey of Residents of Canada, Statistics Canada. Canal Covered Bridge near St. George, New Brunswick
10
Canadian Tourism Commission 2012 Annual Report 11
HELPING TOURISM BUSINESSES
With more and more Canadians travelling abroad, the travel
defi cit is forecast to reach a record high of $17.8 billion in
20127, a deterioration of 9% year over year as payments
by Canadians abroad were more than double receipts
from visitors to Canada. As the sixth biggest spender
on international travel8, Canada is now seen as a net
contributor to the world’s tourism economy. Our strategy,
therefore, focuses on revenue. Generating revenue from the
international traveller helps to alleviate the long-term reliance
on the domestic market for tourism growth. Through effective
tourism marketing and promotions supported by aligned
market research, the CTC helps create jobs and generate
wealth for Canadians by stimulating demand for Canada’s
visitor economy.
A top priority for us is to deliver returns on the taxpayer
dollars invested in our organization. Using a rigorous
and commercially accepted methodology to assess the
effectiveness of our campaigns allows us to conservatively
attribute our work to tangible economic impacts. Our short-
term results for 2012 indicate that our measured marketing
activities generated $687 million for Canada—that’s new
money being injected directly into the Canadian economy,
not domestic spending circulating within the country.
7 International Travel Account, Fourth Quarter 2012, Statistics Canada
(preliminary).8 UNWTO World Tourism Barometer, Volume 11, January 2013.
Supporting government programs through the generation
of tax revenue is another priority for us, and so far in 2012
our marketing efforts have contributed $212 million in
government tax revenue. $90 million of this was directed to
the federal treasury, and our contributions are only expected
to increase once long-term results9 are in.
We’ve stayed true to our goal of delivering revenue and jobs
for our country via innovative marketing, the main source of
our competitive advantage to generate demand for travel.
The CTC is trusted to get results, and the alignment of our
partners and their contributions to our marketing activities
are sound testaments to this. In fact, in 2012, partners
contributed close to $62 million—equivalent to 80 cents
for every dollar we received in federal funding—harnessing
our collective marketing voice to $138 million. Our well-
executed marketing programs drive not only revenue growth
for Canada but job growth as well, and our partnerships
enable us to provide an even greater return to the Canadian
taxpayer. So far in 2012, our targeted tourism promotion
activities have supported over 5,000 jobs for Canadian
tourism businesses. No other national tourism organization
that we know of puts more effort into understanding the
specifi c impact of marketing within the context of overall
tourism performance.
9 Short-term results include travel booked up to three months after
campaign completion; long-term results include travel booked up to a
year after campaign completion.
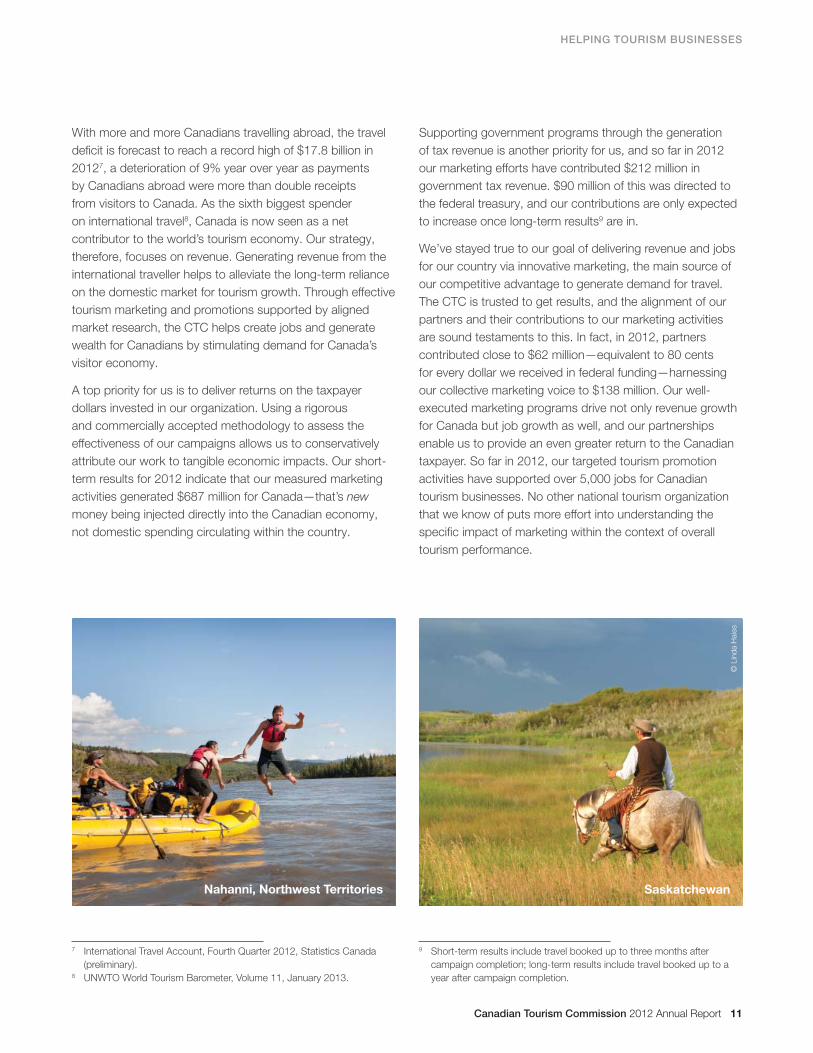
SaskatchewanNahanni, Northwest Territories
© L
ind
a H
ale
s

SECTION TITLE
Canada Day Celebration, Parliament Hill,
Ottawa, Ontario
12
Canadian Tourism Commission 2012 Annual Report 13
YEAR IN REVIEW
GLOBAL TOURISM INDUSTRY OVERVIEW
Tourism is a trillion dollar global business generating fi erce competition within the industry.
Tourists spend $3 billion a day, or $2 million a minute, making tourism a lucrative industry in
which countries can invest to help stimulate their economies and drive trade and investment.
It accounts for one in every 12 jobs10, and in terms of exports, it ranks fourth globally after fuels,
chemicals and food11.
Throughout the course of 2012, the tourism industry proved its resilience yet again. Tourism
has become one of the world’s fastest-growing industries, and is showing no signs of slowing
down. Despite the global fi nancial and economic crisis, people still desire to travel the world. In
fact, international tourist arrivals surpassed the one billion mark in 2012, an increase of 4% over
201112. Between now and 2030, international tourist arrivals are set to increase by an average of
43 million a year to reach 1.8 billion13.
Despite ongoing economic diffi culties in many parts of the world, international tourism
expenditure in 2012 was marked by impressive growth from the world’s two largest emerging
markets. China, the world’s third largest tourism spender, saw a surge of 42% in expenditure
abroad in the fi rst three quarters of 2012. At the same time, the strength of Russia’s economy
and the increasing affl uence of its citizens saw the country’s outbound expenditures grow by
31%, making it the seventh largest tourism spender14.
Although the highest growth rates in expenditure abroad among the top ten markets came from
emerging economies, important traditional source markets showed particularly strong results.
Australia saw its international travel expenditure increase by 5% in 2012. In Europe, despite
economic pressures, expenditure on international travel by top spender Germany grew at 3%,
while the UK increased by 5% after two fl at years. France, on the other hand, registered a
decline of 7% in outbound travel expenditure15.
In Asia, Japan returned to growth with a 3% increase in international spending in 2012,
after registering a decline of 11% the previous year following the March earthquake disaster.
Likewise, both South Korea (2%) and India (8%) saw increases in travel spending abroad16.
As for the Americas, the weak economy and high unemployment rates did not deter
Americans from travelling as the US saw a 7% growth in its international spending in 2012.
For its part, Brazil’s international tourism expenditure also increased by 5% over last year17.
Overall, despite a slow global economic recovery and continued volatility in Europe, 36 of the
top 46 international tourism spenders saw an increase in their outbound travel spending in
the fi rst three quarters of 2012 compared to the same period of the previous year18. This is a
strong indication of the tourism sector’s remarkable stability and potential for long-term growth.
10 UNWTO press release, “International tourism hits one billion”, December 12, 2012.11 UNWTO Tourism Highlights, 2012 Edition.12 UNWTO World Tourism Barometer, Volume 11, January 2013.13 UNWTO Tourism Highlights, 2012 Edition.14 UNWTO World Tourism Barometer, Volume 11, January 2013.15 Ibid.16 Ibid.17 Ibid.18 Ibid.
14 Canadian Tourism Commission 2012 Annual Report
YEAR IN REVIEW
TOURISM INDUSTRY IN CANADA
Canada’s tourism sector is widely varied, ranging from small- and medium-sized enterprises
operating in a single location to large, far-reaching corporations. It also includes marketing
organizations at the provincial, regional and destination levels, as well as tourism industry and
trade associations.
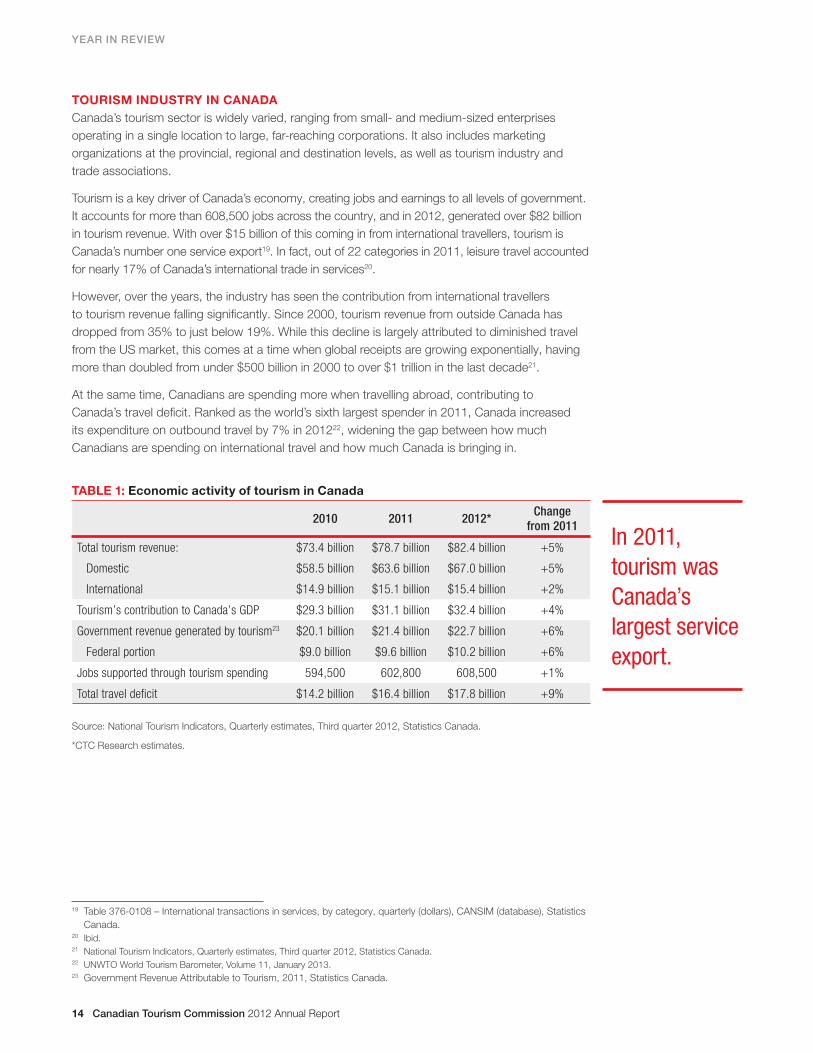
Tourism is a key driver of Canada’s economy, creating jobs and earnings to all levels of government.
It accounts for more than 608,500 jobs across the country, and in 2012, generated over $82 billion
in tourism revenue. With over $15 billion of this coming in from international travellers, tourism is
Canada’s number one service export19. In fact, out of 22 categories in 2011, leisure travel accounted
for nearly 17% of Canada’s international trade in services20.
However, over the years, the industry has seen the contribution from international travellers
to tourism revenue falling signifi cantly. Since 2000, tourism revenue from outside Canada has
dropped from 35% to just below 19%. While this decline is largely attributed to diminished travel
from the US market, this comes at a time when global receipts are growing exponentially, having
more than doubled from under $500 billion in 2000 to over $1 trillion in the last decade21.
At the same time, Canadians are spending more when travelling abroad, contributing to
Canada’s travel defi cit. Ranked as the world’s sixth largest spender in 2011, Canada increased
its expenditure on outbound travel by 7% in 201222, widening the gap between how much
Canadians are spending on international travel and how much Canada is bringing in.
TABLE 1: Economic activity of tourism in Canada
2010 2011 2012*Change
from 2011
Total tourism revenue:
Domestic
International
$73.4 billion
$58.5 billion
$14.9 billion
$78.7 billion
$63.6 billion
$15.1 billion
$82.4 billion
$67.0 billion
$15.4 billion
+5%
+5%
+2%
Tourism’s contribution to Canada’s GDP $29.3 billion $31.1 billion $32.4 billion +4%
Government revenue generated by tourism23
Federal portion
$20.1 billion
$9.0 billion
$21.4 billion
$9.6 billion
$22.7 billion
$10.2 billion
+6%
+6%
Jobs supported through tourism spending 594,500 602,800 608,500 +1%
Total travel defi cit $14.2 billion $16.4 billion $17.8 billion +9%
Source: National Tourism Indicators, Quarterly estimates, Third quarter 2012, Statistics Canada.
*CTC Research estimates.
23
19 Table 376-0108 – International transactions in services, by category, quarterly (dollars), CANSIM (database), Statistics
Canada.20 Ibid.21 National Tourism Indicators, Quarterly estimates, Third quarter 2012, Statistics Canada.22 UNWTO World Tourism Barometer, Volume 11, January 2013.23 Government Revenue Attributable to Tourism, 2011, Statistics Canada.
In 2011,
tourism was
Canada’s
largest service
export.
Canadian Tourism Commission 2012 Annual Report 15
YEAR IN REVIEW
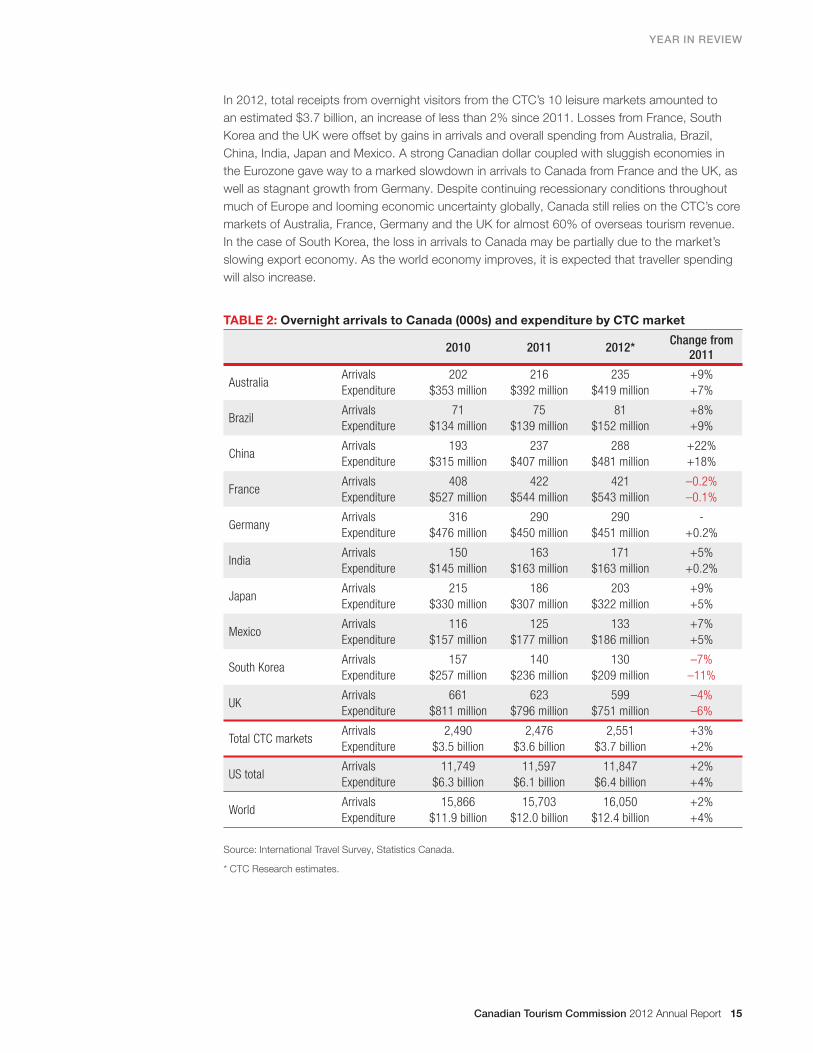
In 2012, total receipts from overnight visitors from the CTC’s 10 leisure markets amounted to
an estimated $3.7 billion, an increase of less than 2% since 2011. Losses from France, South
Korea and the UK were offset by gains in arrivals and overall spending from Australia, Brazil,
China, India, Japan and Mexico. A strong Canadian dollar coupled with sluggish economies in
the Eurozone gave way to a marked slowdown in arrivals to Canada from France and the UK, as
well as stagnant growth from Germany. Despite continuing recessionary conditions throughout
much of Europe and looming economic uncertainty globally, Canada still relies on the CTC’s core
markets of Australia, France, Germany and the UK for almost 60% of overseas tourism revenue.
In the case of South Korea, the loss in arrivals to Canada may be partially due to the market’s
slowing export economy. As the world economy improves, it is expected that traveller spending
will also increase.
TABLE 2: Overnight arrivals to Canada (000s) and expenditure by CTC market
2010 2011 2012*Change from
2011
AustraliaArrivals
Expenditure
202
$353 million
216
$392 million
235
$419 million
+9%
+7%
BrazilArrivals
Expenditure
71
$134 million
75
$139 million
81
$152 million
+8%
+9%
ChinaArrivals
Expenditure
193
$315 million
237
$407 million
288
$481 million
+22%
+18%
FranceArrivals
Expenditure
408
$527 million
422
$544 million
421
$543 million
–0.2%
–0.1%
GermanyArrivals
Expenditure
316
$476 million
290
$450 million
290
$451 million
-
+0.2%
IndiaArrivals
Expenditure
150
$145 million
163
$163 million
171
$163 million
+5%
+0.2%
JapanArrivals
Expenditure
215
$330 million
186
$307 million
203
$322 million
+9%
+5%
MexicoArrivals
Expenditure
116
$157 million
125
$177 million
133
$186 million
+7%
+5%
South KoreaArrivals
Expenditure
157
$257 million
140
$236 million
130
$209 million
–7%
–11%
UKArrivals
Expenditure
661
$811 million
623
$796 million
599
$751 million
–4%
–6%
Total CTC marketsArrivals
Expenditure
2,490
$3.5 billion
2,476
$3.6 billion
2,551
$3.7 billion
+3%
+2%
US totalArrivals
Expenditure
11,749
$6.3 billion
11,597
$6.1 billion
11,847
$6.4 billion
+2%
+4%
WorldArrivals
Expenditure
15,866
$11.9 billion
15,703
$12.0 billion
16,050
$12.4 billion
+2%
+4%
Source: International Travel Survey, Statistics Canada.
* CTC Research estimates.
16 Canadian Tourism Commission 2012 Annual Report
YEAR IN REVIEW
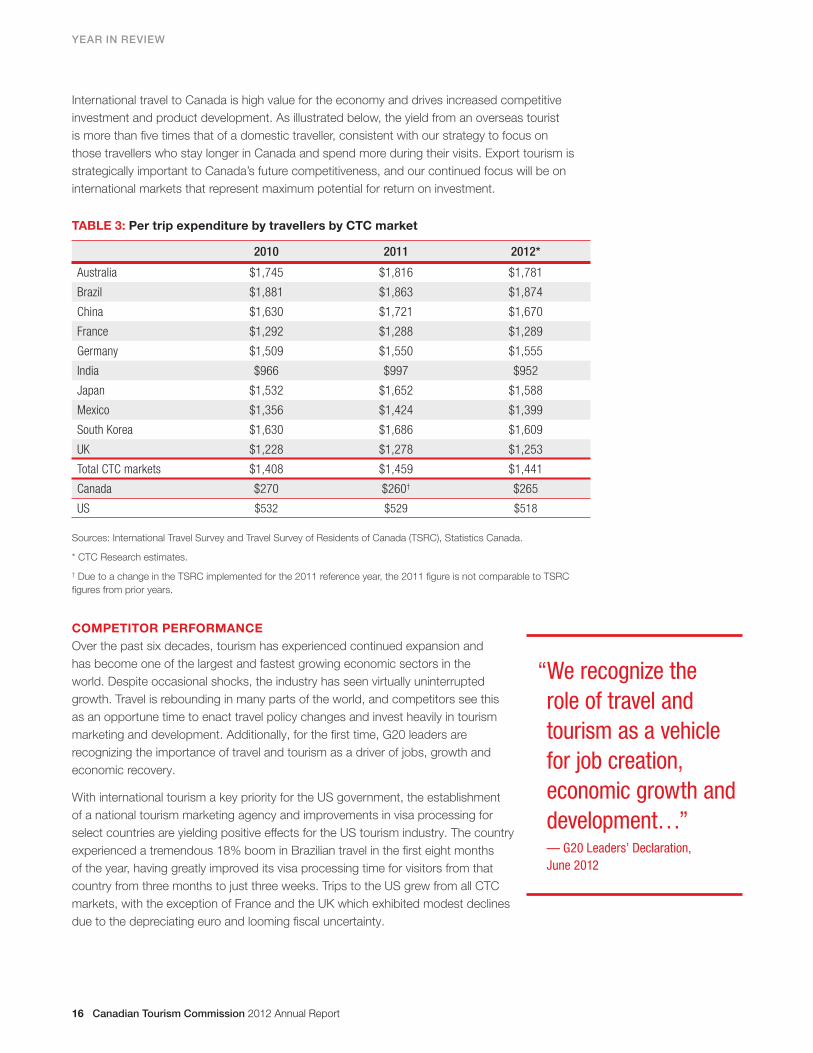
International travel to Canada is high value for the economy and drives increased competitive
investment and product development. As illustrated below, the yield from an overseas tourist
is more than fi ve times that of a domestic traveller, consistent with our strategy to focus on
those travellers who stay longer in Canada and spend more during their visits. Export tourism is
strategically important to Canada’s future competitiveness, and our continued focus will be on
international markets that represent maximum potential for return on investment.
TABLE 3: Per trip expenditure by travellers by CTC market
2010 2011 2012*
Australia $1,745 $1,816 $1,781
Brazil $1,881 $1,863 $1,874
China $1,630 $1,721 $1,670
France $1,292 $1,288 $1,289
Germany $1,509 $1,550 $1,555
India $966 $997 $952
Japan $1,532 $1,652 $1,588
Mexico $1,356 $1,424 $1,399
South Korea $1,630 $1,686 $1,609
UK $1,228 $1,278 $1,253
Total CTC markets $1,408 $1,459 $1,441
Canada $270 $260† $265
US $532 $529 $518
Sources: International Travel Survey and Travel Survey of Residents of Canada (TSRC), Statistics Canada.
* CTC Research estimates.
† Due to a change in the TSRC implemented for the 2011 reference year, the 2011 fi gure is not comparable to TSRC
fi gures from prior years.
COMPETITOR PERFORMANCE
Over the past six decades, tourism has experienced continued expansion and
has become one of the largest and fastest growing economic sectors in the
world. Despite occasional shocks, the industry has seen virtually uninterrupted
growth. Travel is rebounding in many parts of the world, and competitors see this
as an opportune time to enact travel policy changes and invest heavily in tourism
marketing and development. Additionally, for the fi rst time, G20 leaders are
recognizing the importance of travel and tourism as a driver of jobs, growth and
economic recovery.
With international tourism a key priority for the US government, the establishment
of a national tourism marketing agency and improvements in visa processing for
select countries are yielding positive effects for the US tourism industry. The country
experienced a tremendous 18% boom in Brazilian travel in the fi rst eight months
of the year, having greatly improved its visa processing time for visitors from that
country from three months to just three weeks. Trips to the US grew from all CTC
markets, with the exception of France and the UK which exhibited modest declines
due to the depreciating euro and looming fi scal uncertainty.
“We recognize the
role of travel and
tourism as a vehicle
for job creation,
economic growth and
development…”— G20 Leaders’ Declaration,
June 2012
Canadian Tourism Commission 2012 Annual Report 17
YEAR IN REVIEW
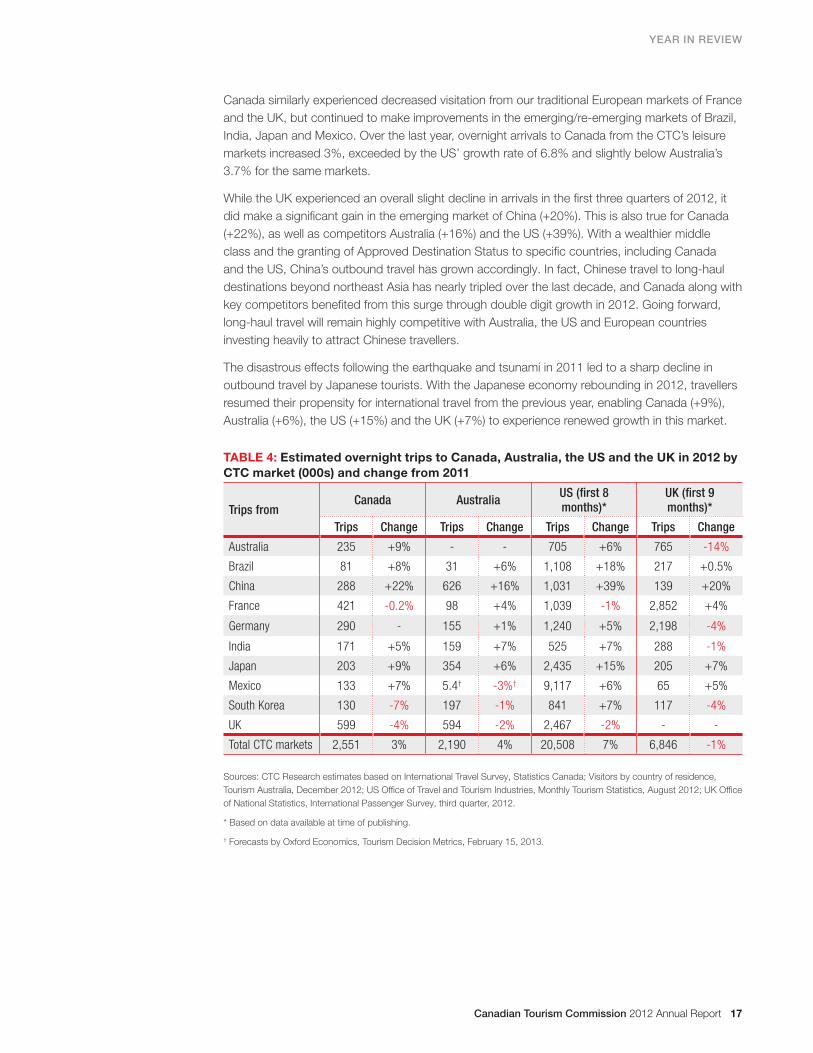
Canada similarly experienced decreased visitation from our traditional European markets of France
and the UK, but continued to make improvements in the emerging/re-emerging markets of Brazil,
India, Japan and Mexico. Over the last year, overnight arrivals to Canada from the CTC’s leisure
markets increased 3%, exceeded by the US’ growth rate of 6.8% and slightly below Australia’s
3.7% for the same markets.
While the UK experienced an overall slight decline in arrivals in the fi rst three quarters of 2012, it
did make a signifi cant gain in the emerging market of China (+20%). This is also true for Canada
(+22%), as well as competitors Australia (+16%) and the US (+39%). With a wealthier middle
class and the granting of Approved Destination Status to specifi c countries, including Canada
and the US, China’s outbound travel has grown accordingly. In fact, Chinese travel to long-haul
destinations beyond northeast Asia has nearly tripled over the last decade, and Canada along with
key competitors benefi ted from this surge through double digit growth in 2012. Going forward,
long-haul travel will remain highly competitive with Australia, the US and European countries
investing heavily to attract Chinese travellers.
The disastrous effects following the earthquake and tsunami in 2011 led to a sharp decline in
outbound travel by Japanese tourists. With the Japanese economy rebounding in 2012, travellers
resumed their propensity for international travel from the previous year, enabling Canada (+9%),
Australia (+6%), the US (+15%) and the UK (+7%) to experience renewed growth in this market.
TABLE 4: Estimated overnight trips to Canada, Australia, the US and the UK in 2012 by
CTC market (000s) and change from 2011
Trips fromCanada Australia
US (fi rst 8 months)*
UK (fi rst 9 months)*
Trips Change Trips Change Trips Change Trips Change
Australia 235 +9% - - 705 +6% 765 -14%
Brazil 81 +8% 31 +6% 1,108 +18% 217 +0.5%
China 288 +22% 626 +16% 1,031 +39% 139 +20%
France 421 -0.2% 98 +4% 1,039 -1% 2,852 +4%
Germany 290 - 155 +1% 1,240 +5% 2,198 -4%
India 171 +5% 159 +7% 525 +7% 288 -1%
Japan 203 +9% 354 +6% 2,435 +15% 205 +7%
Mexico 133 +7% 5.4† -3%† 9,117 +6% 65 +5%
South Korea 130 -7% 197 -1% 841 +7% 117 -4%
UK 599 -4% 594 -2% 2,467 -2% - -
Total CTC markets 2,551 3% 2,190 4% 20,508 7% 6,846 -1%
Sources: CTC Research estimates based on International Travel Survey, Statistics Canada; Visitors by country of residence,
Tourism Australia, December 2012; US Offi ce of Travel and Tourism Industries, Monthly Tourism Statistics, August 2012; UK Offi ce
of National Statistics, International Passenger Survey, third quarter, 2012.
* Based on data available at time of publishing.
† Forecasts by Oxford Economics, Tourism Decision Metrics, February 15, 2013.
18 Canadian Tourism Commission 2012 Annual Report
YEAR IN REVIEW
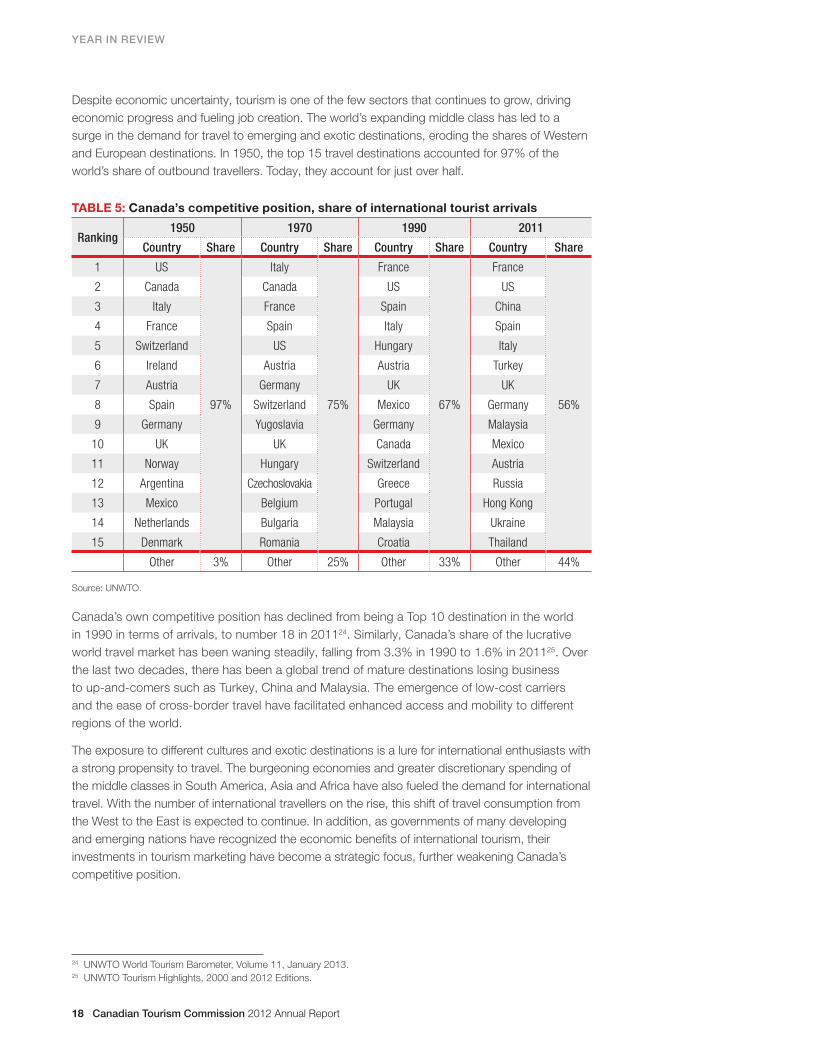
Despite economic uncertainty, tourism is one of the few sectors that continues to grow, driving
economic progress and fueling job creation. The world’s expanding middle class has led to a
surge in the demand for travel to emerging and exotic destinations, eroding the shares of Western
and European destinations. In 1950, the top 15 travel destinations accounted for 97% of the
world’s share of outbound travellers. Today, they account for just over half.
TABLE 5: Canada’s competitive position, share of international tourist arrivals
Ranking1950 1970 1990 2011
Country Share Country Share Country Share Country Share
1 US
97%
Italy
75%
France
67%
France
56%
2 Canada Canada US US
3 Italy France Spain China
4 France Spain Italy Spain
5 Switzerland US Hungary Italy
6 Ireland Austria Austria Turkey
7 Austria Germany UK UK
8 Spain Switzerland Mexico Germany
9 Germany Yugoslavia Germany Malaysia
10 UK UK Canada Mexico
11 Norway Hungary Switzerland Austria
12 Argentina Czechoslovakia Greece Russia
13 Mexico Belgium Portugal Hong Kong
14 Netherlands Bulgaria Malaysia Ukraine
15 Denmark Romania Croatia Thailand
Other 3% Other 25% Other 33% Other 44%
Source: UNWTO.
Canada’s own competitive position has declined from being a Top 10 destination in the world
in 1990 in terms of arrivals, to number 18 in 201124. Similarly, Canada’s share of the lucrative
world travel market has been waning steadily, falling from 3.3% in 1990 to 1.6% in 201125. Over
the last two decades, there has been a global trend of mature destinations losing business
to up-and-comers such as Turkey, China and Malaysia. The emergence of low-cost carriers
and the ease of cross-border travel have facilitated enhanced access and mobility to different
regions of the world.
The exposure to different cultures and exotic destinations is a lure for international enthusiasts with
a strong propensity to travel. The burgeoning economies and greater discretionary spending of
the middle classes in South America, Asia and Africa have also fueled the demand for international
travel. With the number of international travellers on the rise, this shift of travel consumption from
the West to the East is expected to continue. In addition, as governments of many developing
and emerging nations have recognized the economic benefi ts of international tourism, their
investments in tourism marketing have become a strategic focus, further weakening Canada’s
competitive position.
24 UNWTO World Tourism Barometer, Volume 11, January 2013.25 UNWTO Tourism Highlights, 2000 and 2012 Editions.
Canadian Tourism Commission 2012 Annual Report 19
YEAR IN REVIEW
Every dollar the
CTC invested in its
measured 2012
Stampede-related
consumer advertising
campaigns generated
approximately $14 for
the Canadian tourism
economy.
CTC HIGHLIGHTS OF 2012
The following are examples of activities the CTC undertook over the course of
the previous year that demonstrate advancement of our 2012-2016 corporate
objectives and priorities (see page 36).
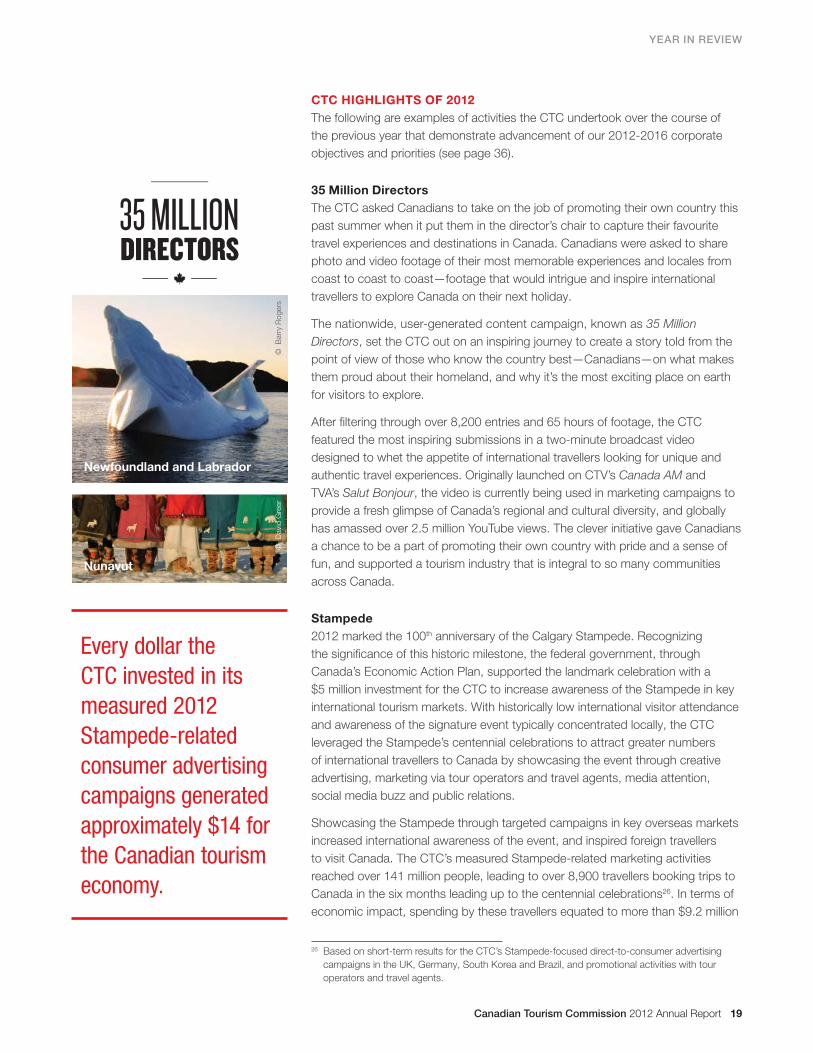
35 Million Directors
The CTC asked Canadians to take on the job of promoting their own country this
past summer when it put them in the director’s chair to capture their favourite
travel experiences and destinations in Canada. Canadians were asked to share
photo and video footage of their most memorable experiences and locales from
coast to coast to coast—footage that would intrigue and inspire international
travellers to explore Canada on their next holiday.
The nationwide, user-generated content campaign, known as 35 Million
Directors, set the CTC out on an inspiring journey to create a story told from the
point of view of those who know the country best—Canadians—on what makes
them proud about their homeland, and why it’s the most exciting place on earth
for visitors to explore.
After fi ltering through over 8,200 entries and 65 hours of footage, the CTC
featured the most inspiring submissions in a two-minute broadcast video
designed to whet the appetite of international travellers looking for unique and
authentic travel experiences. Originally launched on CTV’s Canada AM and
TVA’s Salut Bonjour, the video is currently being used in marketing campaigns to
provide a fresh glimpse of Canada’s regional and cultural diversity, and globally
has amassed over 2.5 million YouTube views. The clever initiative gave Canadians
a chance to be a part of promoting their own country with pride and a sense of
fun, and supported a tourism industry that is integral to so many communities
across Canada.
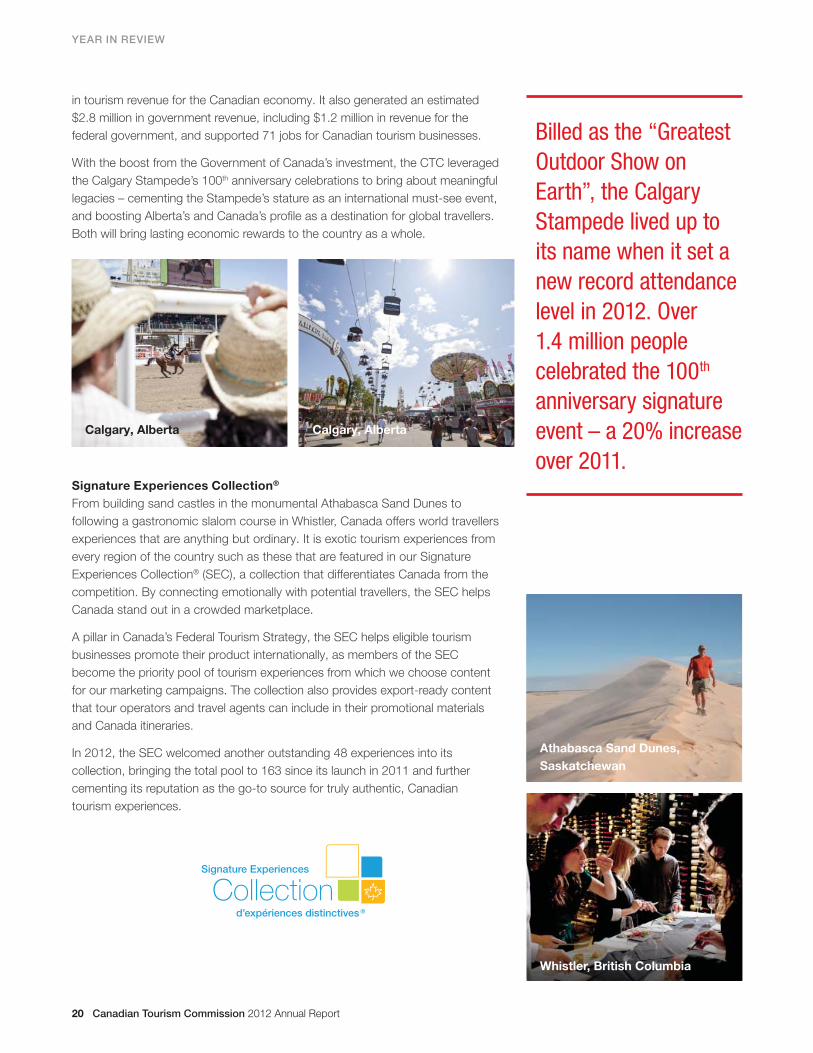
Stampede
2012 marked the 100th anniversary of the Calgary Stampede. Recognizing
the signifi cance of this historic milestone, the federal government, through
Canada’s Economic Action Plan, supported the landmark celebration with a
$5 million investment for the CTC to increase awareness of the Stampede in key
international tourism markets. With historically low international visitor attendance
and awareness of the signature event typically concentrated locally, the CTC
leveraged the Stampede’s centennial celebrations to attract greater numbers
of international travellers to Canada by showcasing the event through creative
advertising, marketing via tour operators and travel agents, media attention,
social media buzz and public relations.
Showcasing the Stampede through targeted campaigns in key overseas markets
increased international awareness of the event, and inspired foreign travellers
to visit Canada. The CTC’s measured Stampede-related marketing activities
reached over 141 million people, leading to over 8,900 travellers booking trips to
Canada in the six months leading up to the centennial celebrations26. In terms of
economic impact, spending by these travellers equated to more than $9.2 million
26 Based on short-term results for the CTC’s Stampede-focused direct-to-consumer advertising
campaigns in the UK, Germany, South Korea and Brazil, and promotional activities with tour
operators and travel agents.
Newfoundland and Labrador
Nunavut
©
Barr
y R
og
ers
©
D
avi
d G
reer
20 Canadian Tourism Commission 2012 Annual Report
YEAR IN REVIEW
in tourism revenue for the Canadian economy. It also generated an estimated
$2.8 million in government revenue, including $1.2 million in revenue for the
federal government, and supported 71 jobs for Canadian tourism businesses.
With the boost from the Government of Canada’s investment, the CTC leveraged
the Calgary Stampede’s 100th anniversary celebrations to bring about meaningful
legacies – cementing the Stampede’s stature as an international must-see event,
and boosting Alberta’s and Canada’s profi le as a destination for global travellers.
Both will bring lasting economic rewards to the country as a whole.
Signature Experiences Collection®
From building sand castles in the monumental Athabasca Sand Dunes to
following a gastronomic slalom course in Whistler, Canada offers world travellers
experiences that are anything but ordinary. It is exotic tourism experiences from
every region of the country such as these that are featured in our Signature
Experiences Collection® (SEC), a collection that differentiates Canada from the
competition. By connecting emotionally with potential travellers, the SEC helps
Canada stand out in a crowded marketplace.
A pillar in Canada’s Federal Tourism Strategy, the SEC helps eligible tourism
businesses promote their product internationally, as members of the SEC
become the priority pool of tourism experiences from which we choose content
for our marketing campaigns. The collection also provides export-ready content
that tour operators and travel agents can include in their promotional materials
and Canada itineraries.
In 2012, the SEC welcomed another outstanding 48 experiences into its
collection, bringing the total pool to 163 since its launch in 2011 and further
cementing its reputation as the go-to source for truly authentic, Canadian
tourism experiences.
Billed as the “Greatest
Outdoor Show on
Earth”, the Calgary
Stampede lived up to
its name when it set a
new record attendance
level in 2012. Over
1.4 million people
celebrated the 100th
anniversary signature
event – a 20% increase
over 2011.
Calgary, Alberta Calgary, Alberta
Athabasca Sand Dunes,
Saskatchewan
Whistler, British Columbia
Canadian Tourism Commission 2012 Annual Report 21
YEAR IN REVIEW
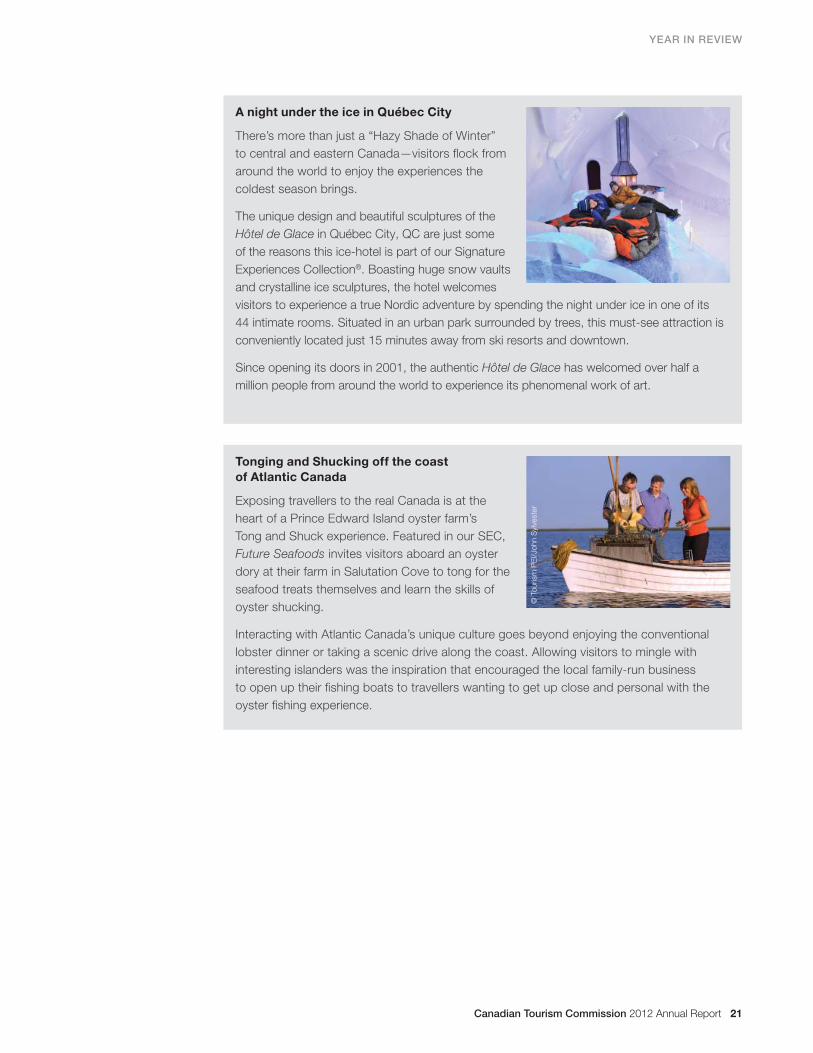
A night under the ice in Québec City
There’s more than just a “Hazy Shade of Winter”
to central and eastern Canada—visitors fl ock from
around the world to enjoy the experiences the
coldest season brings.
The unique design and beautiful sculptures of the
Hôtel de Glace in Québec City, QC are just some
of the reasons this ice-hotel is part of our Signature
Experiences Collection®. Boasting huge snow vaults
and crystalline ice sculptures, the hotel welcomes
visitors to experience a true Nordic adventure by spending the night under ice in one of its
44 intimate rooms. Situated in an urban park surrounded by trees, this must-see attraction is
conveniently located just 15 minutes away from ski resorts and downtown.
Since opening its doors in 2001, the authentic Hôtel de Glace has welcomed over half a
million people from around the world to experience its phenomenal work of art.
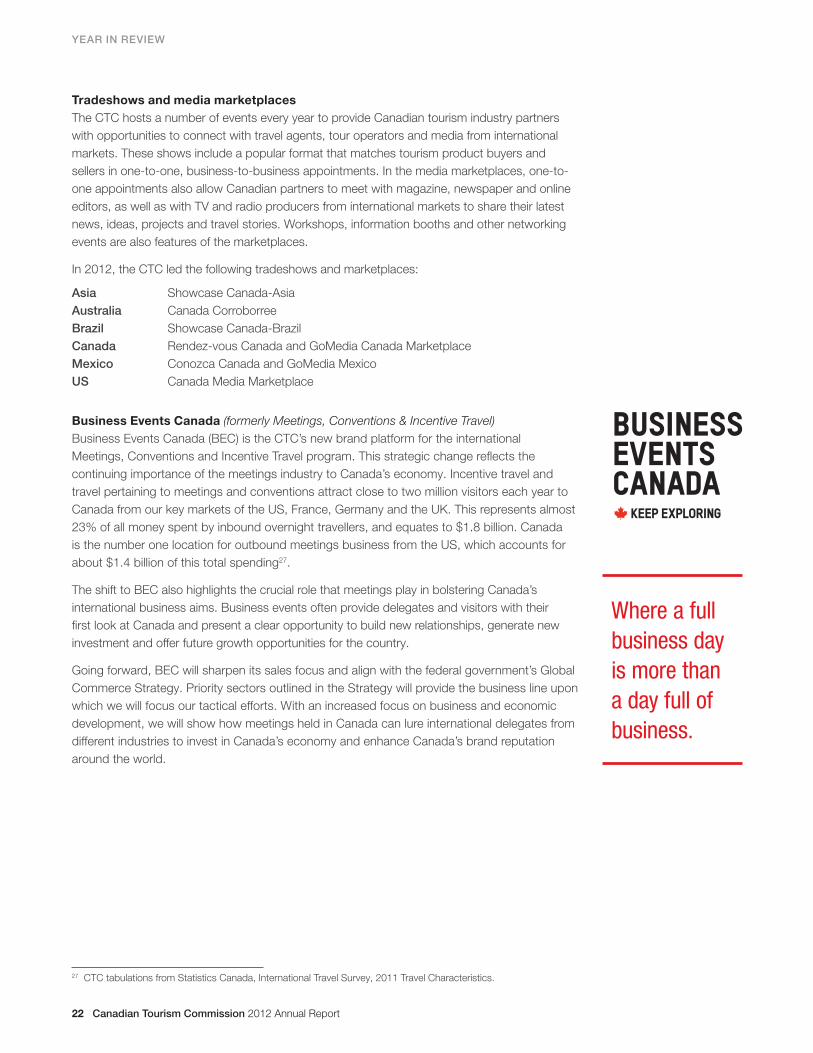
Tonging and Shucking off the coast
of Atlantic Canada
Exposing travellers to the real Canada is at the
heart of a Prince Edward Island oyster farm’s
Tong and Shuck experience. Featured in our SEC,
Future Seafoods invites visitors aboard an oyster
dory at their farm in Salutation Cove to tong for the
seafood treats themselves and learn the skills of
oyster shucking.
Interacting with Atlantic Canada’s unique culture goes beyond enjoying the conventional
lobster dinner or taking a scenic drive along the coast. Allowing visitors to mingle with
interesting islanders was the inspiration that encouraged the local family-run business
to open up their fi shing boats to travellers wanting to get up close and personal with the
oyster fi shing experience.
© T
ourism
PE
I/John S
ylve
ste
r
22 Canadian Tourism Commission 2012 Annual Report
YEAR IN REVIEW
Tradeshows and media marketplaces
The CTC hosts a number of events every year to provide Canadian tourism industry partners
with opportunities to connect with travel agents, tour operators and media from international
markets. These shows include a popular format that matches tourism product buyers and
sellers in one-to-one, business-to-business appointments. In the media marketplaces, one-to-
one appointments also allow Canadian partners to meet with magazine, newspaper and online
editors, as well as with TV and radio producers from international markets to share their latest
news, ideas, projects and travel stories. Workshops, information booths and other networking
events are also features of the marketplaces.
In 2012, the CTC led the following tradeshows and marketplaces:
Asia Showcase Canada-Asia
Australia Canada Corroborree
Brazil Showcase Canada-Brazil
Canada Rendez-vous Canada and GoMedia Canada Marketplace
Mexico Conozca Canada and GoMedia Mexico
US Canada Media Marketplace
Business Events Canada (formerly Meetings, Conventions & Incentive Travel)
Business Events Canada (BEC) is the CTC’s new brand platform for the international
Meetings, Conventions and Incentive Travel program. This strategic change refl ects the
continuing importance of the meetings industry to Canada’s economy. Incentive travel and
travel pertaining to meetings and conventions attract close to two million visitors each year to
Canada from our key markets of the US, France, Germany and the UK. This represents almost
23% of all money spent by inbound overnight travellers, and equates to $1.8 billion. Canada
is the number one location for outbound meetings business from the US, which accounts for
about $1.4 billion of this total spending27.
The shift to BEC also highlights the crucial role that meetings play in bolstering Canada’s
international business aims. Business events often provide delegates and visitors with their
fi rst look at Canada and present a clear opportunity to build new relationships, generate new
investment and offer future growth opportunities for the country.
Going forward, BEC will sharpen its sales focus and align with the federal government’s Global
Commerce Strategy. Priority sectors outlined in the Strategy will provide the business line upon
which we will focus our tactical efforts. With an increased focus on business and economic
development, we will show how meetings held in Canada can lure international delegates from
different industries to invest in Canada’s economy and enhance Canada’s brand reputation
around the world.
27 CTC tabulations from Statistics Canada, International Travel Survey, 2011 Travel Characteristics.
Where a full
business day
is more than
a day full of
business.
Canadian Tourism Commission 2012 Annual Report 23
YEAR IN REVIEW
Social media
Social media is an important element of the CTC’s overall marketing communications strategy.
Our main objective of leveraging social media channels such as Facebook, Twitter, YouTube,
Instagram and Tumblr is to stimulate more people to share their stories and experiences about
Canada in order to drive consideration of Canada as a potential destination amongst a wider
audience. Our focus is to be present where travellers are speaking with travellers and supporting
the conversation.
We enjoyed a lot of success with Instagram in terms of increasing customer engagement in 2012.
Instagram is ideal for showing what’s happening in Canada in the moment, and submissions in
response to our call for user-generated content helped us build advocacy for Canada. Rather than
tapping into the CTC’s image library, engaging customers to share their own content helps drive
a sense of urgency for fellow consumers to visit now. Since we started in 2011, travellers have
shared more than 35,000 photos of Canada using the hashtag #ExploreCanada.
2012 also saw us host our fi rst ever Global Blogger familiarization tour designed to enhance
integrated media coverage of Canadian travel experiences. Nineteen infl uential international
media and bloggers from our various markets travelled on themed itineraries across the
country, with the objective of increasing positive photo and story sharing via this group’s
personal networks.
Social media has allowed us to cost-effectively build Canada’s tourism brand globally, and it will
continue to be useful as a means of engaging infl uencers and consumers in two-way dialogue.
Michael Bublé: “Home for the Holidays”
In 2012 we partnered with Warner Brothers Music to infl uence and leverage content in
international artist Michael Bublé’s Christmas special which was produced in Vancouver.
The objective was to integrate destination content into the NBC program and into the singing
sensation’s own social media platforms. With the infl uence of the CTC, the NBC prime
time program featured various locations in Michael’s home town of Vancouver. We further
produced a “behind the scenes” video at these locations that resulted in over 40,000 views
in the fi rst few weeks of being posted to Michael’s YouTube channel. When the program aired
in prime time on NBC, Michael tweeted live a variety of additional Vancouver and Canadian
content to his 1.2 million followers.
A promotion for the Christmas special was also broadcast in the UK across one of its largest
radio networks. The Canadian crooner acted as guest DJ for the two-hour show, which was
syndicated across different UK radio stations to a potential audience of over 80,000 listeners.
Thirty-second commercial spots featuring Canadian holiday-themed packages peppered the
show, providing consumers with a call to action to book travel to Canada.
24 Canadian Tourism Commission 2012 Annual Report
YEAR IN REVIEW
Ongoing operational effi ciencies
The CTC Board of Directors expects us to conduct operations on the principle of effi ciency as
a matter of ongoing business. Effi ciency is not a one-time event at the CTC; our management
works to meet strict effi ciency and program budget maximization goals as part of the overall
performance management of the organization. As a result, we continuously look to identify
opportunities to increase our operational effi ciency, allowing us to maximize the allocation of our
budget to programming activities. Noteworthy examples include introducing a defi ned contribution
pension program in 2006, and the strategic shift that began in 2010 which led to the reduction of
permanent staff, the closure of fi ve international offi ces, and the move to a hub structure enabling
us to scale up or down with greater fl exibility. Our lean and scalable business model allows us to
adapt quickly to changing market conditions and leverage new opportunities as they arise.
The strategic shift also saw us cede leadership in the US Leisure market to our partners, and
we began directing our focus to where the Canada brand leads internationally. In 2012, we
fi nalized this exit by ceasing our media relations, public relations and social media activities in the
US, remaining active solely in the business events sphere and with our annual Canada Media
Marketplace event.
In 2012, additional operational effi ciency gains were attained through the introduction of a new
suite of cloud-based systems for internal business functions. The new suite replaces legacy
systems that were outdated, complex and expensive to maintain. This move provides our staff
with the right tools that are easy to use, and frees up additional resources which can be directed
to marketing and sales activities.
Most recently, the CTC Board Secretariat launched a new project entitled Paperless Board.
The former process for the preparation of briefi ng material for in-person board meetings was a
manual and time consuming one, and not considered a best practice among the CTC’s peer
organizations. By implementing new technology, briefi ng materials for board meetings are now
compiled electronically, instilling greater effi ciency and enabling ease of access to materials
through one common portal.
Canadian Tourism Commission 2012 Annual Report 25
YEAR IN REVIEW
MARKETING CANADA TO THE WORLD
To achieve our goal of growing revenue for Canada’s tourism economy, we follow a strategy
of focusing on markets where Canada’s tourism brand leads and yields the highest return on
investment, while also tapping into growth from new and emerging markets. Despite our exit
from the US Leisure market, we remain active in the markets that account for more than 60% of
all international arrivals to Canada. By deepening our relationship with high-yield customers—
those who stay longer and spend more—we infl uence their travel decisions and increase
Canada’s tourism revenue even when arrivals are down. We track the incremental tourism
revenue generated from our measured direct-to-consumer advertising campaigns, promotions
with our travel trade partners, and confi rmed bookings from business events based on a
traveller’s average trip expenditure for a given market. The table below summarizes the impacts
that these activities in 2012 had on Canada’s economy:
TABLE 6: Attributable results from CTC’s measured marketing activities
Direct-to-consumer
Advertising*
Travel Trade Promotions
Booked Business Events
Total
Converted/booked travellers† 408,700 189,400 N/A 598,100
Tourism export revenue $607 million $36 million $44 million $687 million
Government tax revenue $187 million $11 million $14 million $212 million
Federal tax revenue $80 million $5 million $6 million $90 million
Jobs supported 4,483 263 327 5,073
* Short-term results based on travel booked up to three months after campaign completion.† Refers to travellers infl uenced to visit Canada upon seeing a CTC campaign.
Results from direct-to-consumer advertising
Direct-to-consumer advertising is the most effective way to infl uence demand for Canada as
a vacation destination. We partner with key private and public-sector tourism organizations on
advertising and marketing campaigns, and in 2012 engaged in integrated advertising campaigns
using television, cinema, print, and online mediums.
To determine the relationship between advertising expenditures, campaign awareness, and
sales that can be conservatively attributed to the marketing program, we evaluate the success
of our direct-to-consumer marketing efforts through third-party administered advertising
evaluation and conversion studies28. A review of our study methodology in 2011 revealed
potential areas of improvement in the timing of when our studies are conducted. In essence,
increasing the time delay between the campaigns and the subsequent advertising studies would
allow for people in long-haul markets suffi cient time to plan and make their trips. This would
result in a more fulsome evaluation of the campaigns’ impacts, and in 2012 we revised our
methodology to allow for this change.
An additional adjustment in our methodology relates to the frequency in which the evaluations
are conducted. Although the CTC currently engages in direct-to-consumer advertising
campaigns in nine of our 10 leisure markets each year, it is cost-prohibitive to continue
conducting an ad evaluation in each market annually. As a result, our direct-to-consumer
campaigns are now studied on a rotating basis, with select markets evaluated each year29.
28 Studies are administered by Longwoods International.29 In 2013, ad campaigns in China, France, Japan, Mexico and the UK will be evaluated, and the ad campaign in
Australia will be assessed in 2014.
26 Canadian Tourism Commission 2012 Annual Report
YEAR IN REVIEW
In 2012, ad campaigns in Brazil, Germany, South Korea and the UK were assessed, and
the CTC extrapolated results for the remaining leisure markets where direct-to-consumer
campaigns took place30.
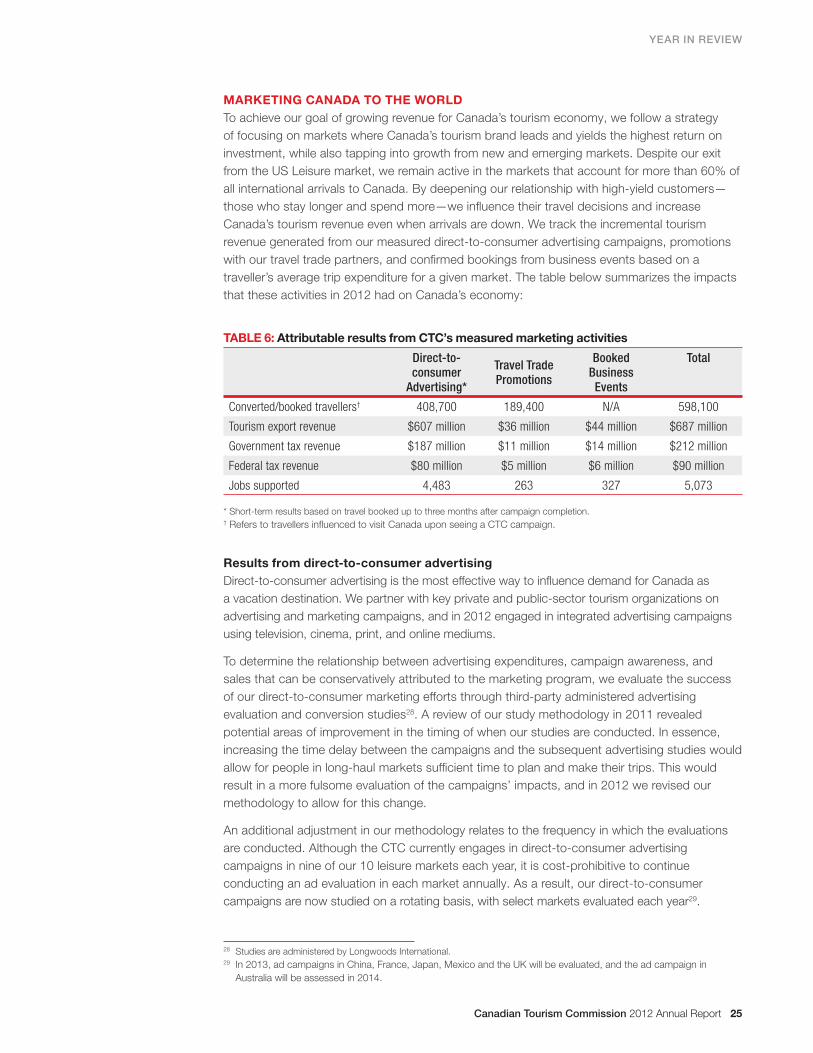
The following table outlines the short-term results for our 2012 direct-to-consumer campaigns.
Results from the longer-term conversion phase of the study (conducted up to a year after
campaigns end) will increase the overall results by including travellers who were motivated to
visit Canada but took longer to book a trip. These fi nal results will be available by summer 2013.
TABLE 7: Short-term results from direct-to-consumer campaigns
2012 Short-term Results
Converted travellers 408,700
Return on investment from marketing campaigns 56 : 1
Attributable tourism export revenue $607 million
Attributable government tax revenue $187 million
Attributable federal tax revenue $80 million
Attributable jobs supported 4,483
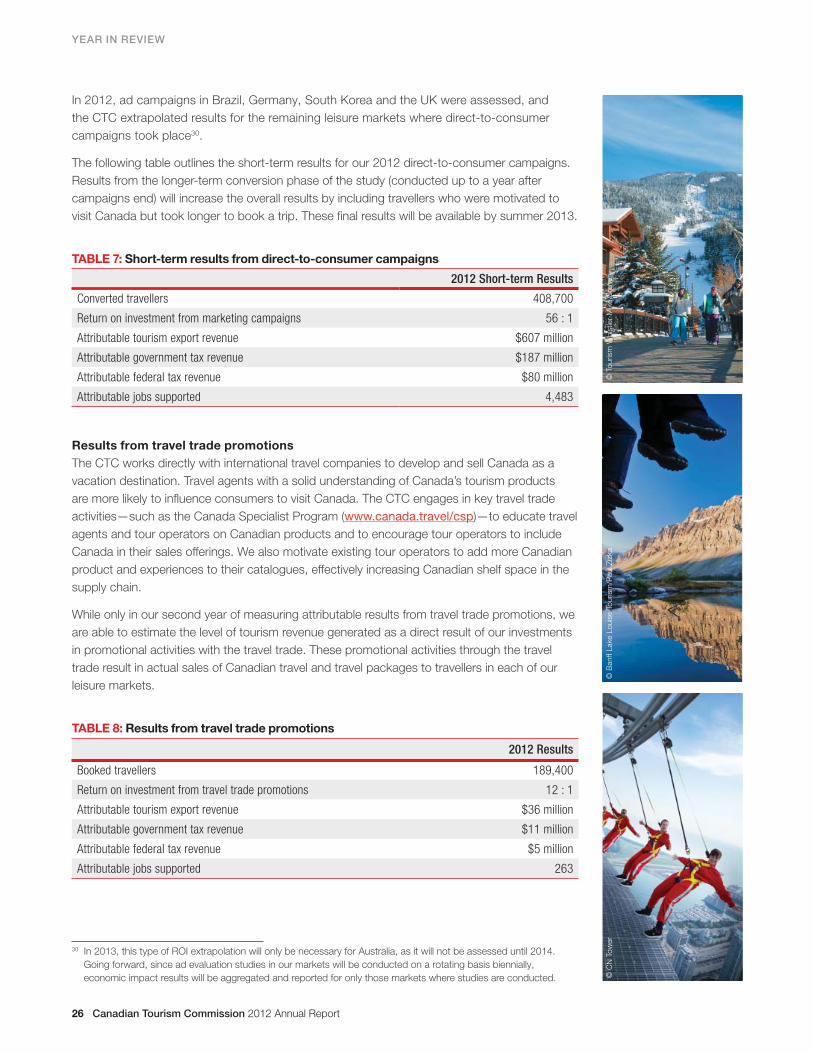
Results from travel trade promotions
The CTC works directly with international travel companies to develop and sell Canada as a
vacation destination. Travel agents with a solid understanding of Canada’s tourism products
are more likely to infl uence consumers to visit Canada. The CTC engages in key travel trade
activities—such as the Canada Specialist Program (www.canada.travel/csp)—to educate travel
agents and tour operators on Canadian products and to encourage tour operators to include
Canada in their sales offerings. We also motivate existing tour operators to add more Canadian
product and experiences to their catalogues, effectively increasing Canadian shelf space in the
supply chain.
While only in our second year of measuring attributable results from travel trade promotions, we
are able to estimate the level of tourism revenue generated as a direct result of our investments
in promotional activities with the travel trade. These promotional activities through the travel
trade result in actual sales of Canadian travel and travel packages to travellers in each of our
leisure markets.
TABLE 8: Results from travel trade promotions
2012 Results
Booked travellers 189,400
Return on investment from travel trade promotions 12 : 1
Attributable tourism export revenue $36 million
Attributable government tax revenue $11 million
Attributable federal tax revenue $5 million
Attributable jobs supported 263
30 In 2013, this type of ROI extrapolation will only be necessary for Australia, as it will not be assessed until 2014.
Going forward, since ad evaluation studies in our markets will be conducted on a rotating basis biennially,
economic impact results will be aggregated and reported for only those markets where studies are conducted.
© T
ourism
Whis
tler-
Mik
e C
rane
© B
anff L
ake L
ouis
e T
ourism
/Paul Z
izka
© C
N T
ow
er
YEAR IN REVIEW
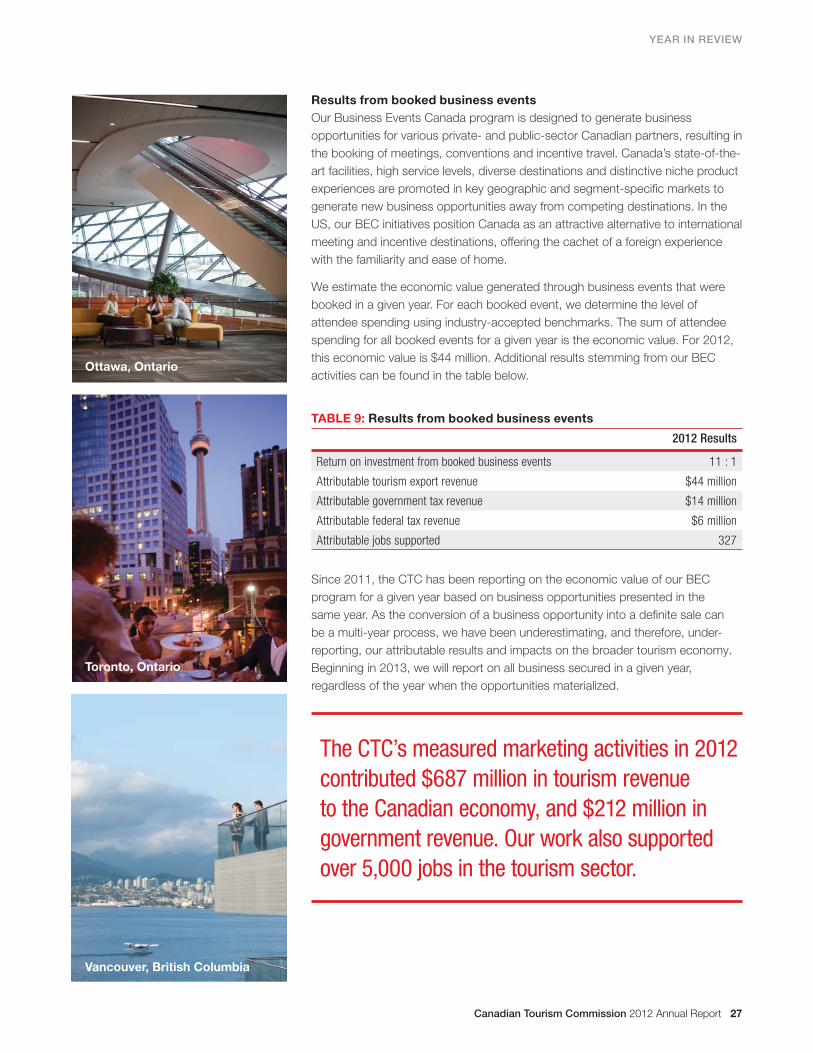
Results from booked business events
Our Business Events Canada program is designed to generate business
opportunities for various private- and public-sector Canadian partners, resulting in
the booking of meetings, conventions and incentive travel. Canada’s state-of-the-
art facilities, high service levels, diverse destinations and distinctive niche product
experiences are promoted in key geographic and segment-specifi c markets to
generate new business opportunities away from competing destinations. In the
US, our BEC initiatives position Canada as an attractive alternative to international
meeting and incentive destinations, offering the cachet of a foreign experience
with the familiarity and ease of home.
We estimate the economic value generated through business events that were
booked in a given year. For each booked event, we determine the level of
attendee spending using industry-accepted benchmarks. The sum of attendee
spending for all booked events for a given year is the economic value. For 2012,
this economic value is $44 million. Additional results stemming from our BEC
activities can be found in the table below.
TABLE 9: Results from booked business events
2012 Results
Return on investment from booked business events 11 : 1
Attributable tourism export revenue $44 million
Attributable government tax revenue $14 million
Attributable federal tax revenue $6 million
Attributable jobs supported 327
Since 2011, the CTC has been reporting on the economic value of our BEC
program for a given year based on business opportunities presented in the
same year. As the conversion of a business opportunity into a defi nite sale can
be a multi-year process, we have been underestimating, and therefore, under-
reporting, our attributable results and impacts on the broader tourism economy.
Beginning in 2013, we will report on all business secured in a given year,
regardless of the year when the opportunities materialized.
The CTC’s measured marketing activities in 2012
contributed $687 million in tourism revenue
to the Canadian economy, and $212 million in
government revenue. Our work also supported
over 5,000 jobs in the tourism sector.
Ottawa, Ontario
Toronto, Ontario
Vancouver, British Columbia
Canadian Tourism Commission 2012 Annual Report 27
28 Canadian Tourism Commission 2012 Annual Report28
AWARDS AND RECOGNITION IN 2012
The CTC prides itself on inventive marketing, and constantly looks for ways to gain a competitive edge in the global
tourism marketplace. The following is a list of various awards presented to the CTC in 2012.
CORPORATE AWARDS
FutureBrand’s Country Brand Index
In 2012, FutureBrand’s Country Brand Index ranked Canada the No. 2
country brand out of 113 countries. (Canada ranked No. 1 in 2010
and 2011.) Canada improved in all seven tourism attributes, raising
Canada’s overall rank on the tourism dimension by seven places to
No. 6. The report also cited Canada’s world-class ski resorts.
Reputation Institute’s Country RepTrak™
Reputation Institute’s 2012 Country RepTrak™ ranked Canada as the
country with the best reputation in the world for the second year in a
row, and as the world’s most recommended country to visit.
MARKETING AND PUBLIC RELATIONS AWARDS
Ad and Design Club of Canada Awards
Interactive Agency of the Year award
Gold award for Interactive Media,
Digital
“Keep Exploring” integrated
campaign
Silver award for Interactive Media,
Business to Consumer
“Drop the Pin”
Silver award for Interactive Media,
Best Use of Game Mechanics
“Keep Exploring” integrated
campaign
Silver for Advertising “Keep Exploring” integrated
campaign
Applied Arts’ Advertising & Interactive Awards
Advertising Complete Ad Campaign “Keep Exploring” integrated
campaign
Interactive Online Campaign “Keep Exploring”
American Society of Association Executives Annual Meeting
& Expo
Best in Show award CTC pavilion
Canadian e-Tourism Awards
2nd place for Best User-generated
Content
“Tumblr Royally Curious”
campaign
3rd place for Best Online Campaign “Hello Canada” campaign
Canadian Marketing Association Awards
Gold award for Digital, Consumer
Services
“Keep Exploring”
Silver award for Advertising,
Consumer Services
“Keep Exploring”
Tofi no, British Columbia
Canadian Tourism Commission 2012 Annual Report 29
AWARDS AND RECOGNITION IN 2012
Expedia Media Solutions
Innovation award “Upgrade to Canada”
campaign in France and
Germany
Global Times Awards
No. 1 Overseas Travel Destination
award
Marketing in China
Hospitality Sales & Marketing Association International
Adrian Awards
Gold award for Advertising “Keep Exploring”
Gold award for Digital “Explore Canada Like a Local”
Silver award for Digital “Keep Exploring” integrated
campaign
Platinum award for Public Relations
Feature Placement – Television
Bringing NBC’s “TODAY”
show to Montréal
Silver award for Public Relations
Campaign Special Event
“Flirtation with Canada”
campaign
Lotus Awards
Merit for Best Website “Drop the Pin”
Merit for Best Digital App/Mobile “Keep Exploring”
Marketing Awards
Finalist, Integrated Campaign “Keep Exploring” integrated
campaign
Finalist, Digital Website/Microsites “Keep Exploring” website
North American Effi es
Finalist for Travel/Tourism/
Destination
“Keep Exploring” integrated
campaign (2011)
Sina’s Golden Track Awards
Best Destination Marketing in China
Top Travel Magazine Awards
Market Leader award Marketing in China
Travel Agents Choice Awards
Long haul destination of the year for
soft adventure
Marketing in the UK
Travel Bulletin Star Awards
Star Tourist Offi ce for Incentives Canadian Tourism
Commission
Travel Journalism Awards for Excellence
Most Outstanding Tourism
Organization in Australia award
Marketing in Australia
UK Travel Marketing Awards
Gold award for Integrated Campaign “Keep Exploring” integrated
campaign (2011)
Webby Awards
Finalist for Tourism “Explore Canada Like a Local”
30 Canadian Tourism Commission 2012 Annual Report
PERFORMANCE MEASUREMENT
Performance measurement on an ongoing basis
enables us to assess our progress on fulfi lling our strategy
and mission, and provides us with the information needed to
guide our decision-making processes.
Since 2008, the CTC has been using the Balanced
Scorecard (BSC) as our performance measurement
framework. This strategy management tool links objectives,
performance measures and targets to our strategy at all
levels, and integrates fi nancial with non-fi nancial measures to
provide a holistic view of our overall performance. Assessing
performance through fi ve different perspectives (Shareholder
& Stakeholder, Customer, Budget and Finance, Internal
Operations, and Workforce) enables us to maximize our
potential to grow tourism export revenues for Canada.
We measure organizational performance in relation to the
external environment, but we also monitor and adapt to
the tourism economy. While the BSC contains a mixture
of CTC performance measures and tourism industry
indicators, industry indicators are included for the purposes
of monitoring the overall health of the industry and refl ect the
combined efforts of all members of the industry. Therefore,
we do not set CTC targets for these measures.
For 2012, the measures deemed most critical to achieving our
goal of growing tourism export revenues for Canada were:
• Attributable tourism export revenue;
• Partner contributions; and
• Employee engagement.
As a result of our direct-to-consumer, travel trade and
business event activities, we are able to estimate the value of
tourism export revenue generated for Canada that is directly
attributable to the CTC. In 2012, based on our direct-to-
consumer activities and sales resulting from our travel trade
promotions and business events, the CTC generated an
estimated $687 million for Canada’s tourism economy.
Although this result is far below our 2012 target of generating
$2.31 billion for the tourism economy, the result should be
interpreted with the following caveats in mind:
1) The revised ad evaluation and conversion methodology
has brought about greater controls to isolate the effect
of advertising on the purchase decision. Due to the
increased time delay (from three months to six months)
between campaigns and the subsequent advertising
studies, direct-to-consumer results are short-term only.
The overall attributable tourism export revenue result
is expected to increase once longer-term conversion
results are available in summer 2013.
2) The $2.31 billion target for 2012 was set in anticipation
of federal appropriations being maintained at current
levels. However, the reduction to the CTC’s core budget
through Budget 2012 resulted in decreased market
allocations to programming budgets.
3) The $2.31 billion target for 2012 was set at the end
of 2010 in consideration of 2010 results. Exceptional
performance results were attained that year due
to improved global economic conditions and the
heightened international awareness of Canada from the
2010 Winter Olympic Games.
Although 2012 ad campaigns in Brazil, Germany, South
Korea and the UK were assessed and results were
extrapolated for the remaining leisure markets where direct-
to-consumer campaigns took place, this type of return
on investment (ROI) extrapolation will only be necessary
for Australia in 2013, as it will not be assessed until 2014.
Going forward, as ad evaluation studies in our markets
will be conducted on a rotating basis biennially, economic
impact results will be aggregated and reported for only those
markets where studies were conducted.
In 2012, partner contributions totalled nearly $62 million
($9.9 million in “cash” and $51.8 million in “non-cash”),
resulting in a contribution ratio of 0.8 : 1 against our
appropriations of approximately $76 million and exceeding
our target of 0.6 : 1. This result demonstrates the continued
relevancy of our programs to partners.
Our employee engagement index held steady at 74%,
refl ecting our employees’ belief in the CTC’s mission and
vision and their commitment to the organization. This result is
comparable to industry standards.
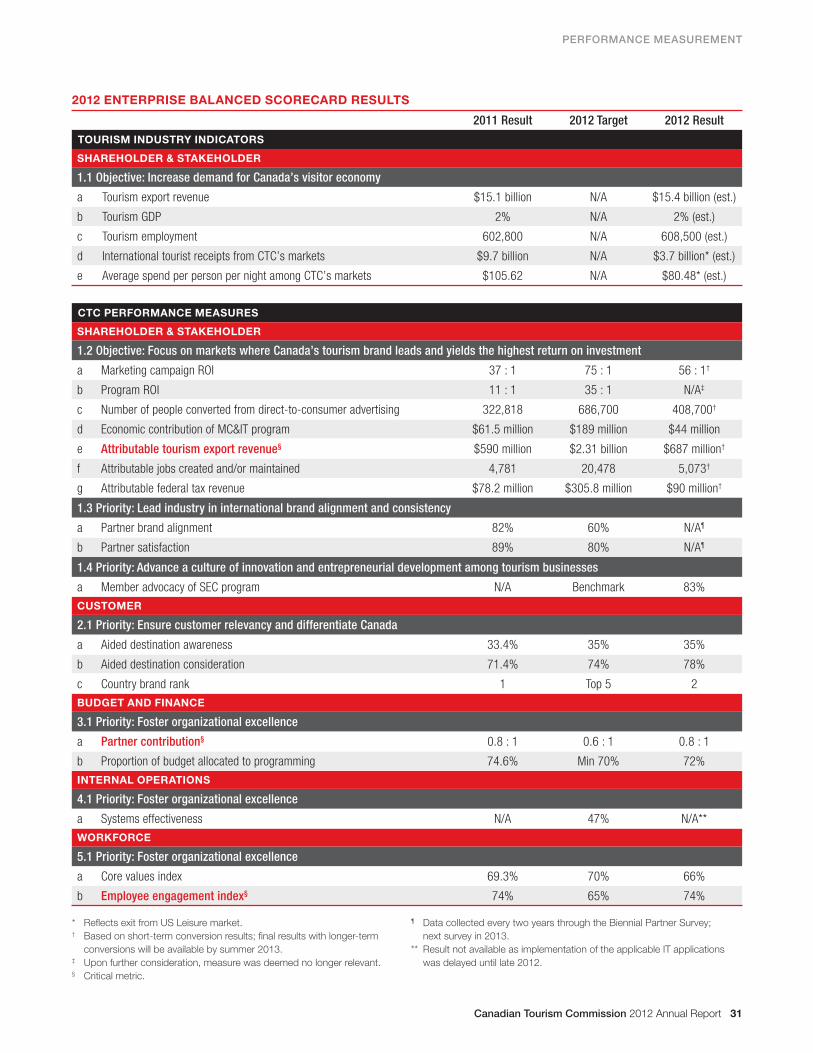
Canadian Tourism Commission 2012 Annual Report 31
PERFORMANCE MEASUREMENT
2012 ENTERPRISE BALANCED SCORECARD RESULTS
2011 Result 2012 Target 2012 Result
TOURISM INDUSTRY INDICATORS
SHAREHOLDER & STAKEHOLDER
1.1 Objective: Increase demand for Canada’s visitor economy
a Tourism export revenue $15.1 billion N/A $15.4 billion (est.)
b Tourism GDP 2% N/A 2% (est.)
c Tourism employment 602,800 N/A 608,500 (est.)
d International tourist receipts from CTC’s markets $9.7 billion N/A $3.7 billion* (est.)
e Average spend per person per night among CTC’s markets $105.62 N/A $80.48* (est.)
CTC PERFORMANCE MEASURES
SHAREHOLDER & STAKEHOLDER
1.2 Objective: Focus on markets where Canada’s tourism brand leads and yields the highest return on investment
a Marketing campaign ROI 37 : 1 75 : 1 56 : 1†
b Program ROI 11 : 1 35 : 1 N/A‡
c Number of people converted from direct-to-consumer advertising 322,818 686,700 408,700†
d Economic contribution of MC&IT program $61.5 million $189 million $44 million
e Attributable tourism export revenue§ $590 million $2.31 billion $687 million†
f Attributable jobs created and/or maintained 4,781 20,478 5,073†
g Attributable federal tax revenue $78.2 million $305.8 million $90 million†
1.3 Priority: Lead industry in international brand alignment and consistency
a Partner brand alignment 82% 60% N/A¶
b Partner satisfaction 89% 80% N/A¶
1.4 Priority: Advance a culture of innovation and entrepreneurial development among tourism businesses
a Member advocacy of SEC program N/A Benchmark 83%
CUSTOMER
2.1 Priority: Ensure customer relevancy and differentiate Canada
a Aided destination awareness 33.4% 35% 35%
b Aided destination consideration 71.4% 74% 78%
c Country brand rank 1 Top 5 2
BUDGET AND FINANCE
3.1 Priority: Foster organizational excellence
a Partner contribution§ 0.8 : 1 0.6 : 1 0.8 : 1
b Proportion of budget allocated to programming 74.6% Min 70% 72%
INTERNAL OPERATIONS
4.1 Priority: Foster organizational excellence
a Systems effectiveness N/A 47% N/A**
WORKFORCE
5.1 Priority: Foster organizational excellence
a Core values index 69.3% 70% 66%
b Employee engagement index§ 74% 65% 74%
* Refl ects exit from US Leisure market.† Based on short-term conversion results; fi nal results with longer-term
conversions will be available by summer 2013.‡ Upon further consideration, measure was deemed no longer relevant.§ Critical metric.
¶ Data collected every two years through the Biennial Partner Survey;
next survey in 2013.
** Result not available as implementation of the applicable IT applications
was delayed until late 2012.
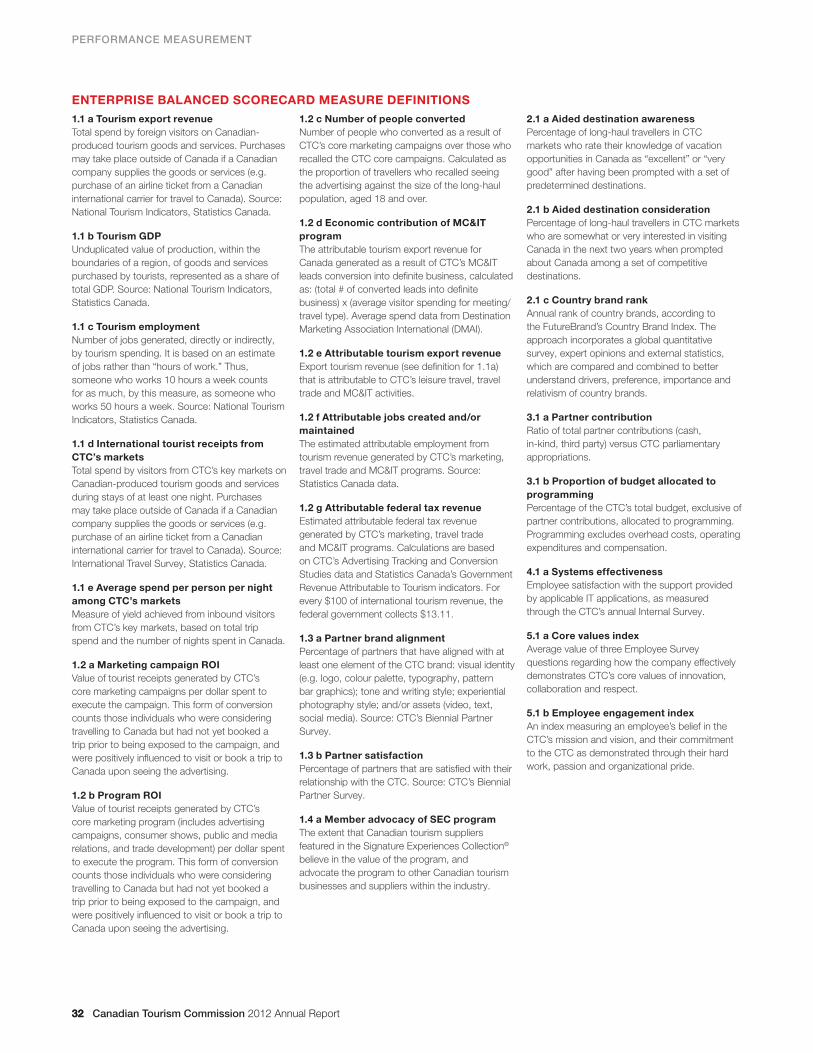
32 Canadian Tourism Commission 2012 Annual Report
PERFORMANCE MEASUREMENT
ENTERPRISE BALANCED SCORECARD MEASURE DEFINITIONS
1.1 a Tourism export revenue
Total spend by foreign visitors on Canadian-
produced tourism goods and services. Purchases
may take place outside of Canada if a Canadian
company supplies the goods or services (e.g.
purchase of an airline ticket from a Canadian
international carrier for travel to Canada). Source:
National Tourism Indicators, Statistics Canada.
1.1 b Tourism GDP
Unduplicated value of production, within the
boundaries of a region, of goods and services
purchased by tourists, represented as a share of
total GDP. Source: National Tourism Indicators,
Statistics Canada.
1.1 c Tourism employment
Number of jobs generated, directly or indirectly,
by tourism spending. It is based on an estimate
of jobs rather than “hours of work.” Thus,
someone who works 10 hours a week counts
for as much, by this measure, as someone who
works 50 hours a week. Source: National Tourism
Indicators, Statistics Canada.
1.1 d International tourist receipts from
CTC’s markets
Total spend by visitors from CTC’s key markets on
Canadian-produced tourism goods and services
during stays of at least one night. Purchases
may take place outside of Canada if a Canadian
company supplies the goods or services (e.g.
purchase of an airline ticket from a Canadian
international carrier for travel to Canada). Source:
International Travel Survey, Statistics Canada.
1.1 e Average spend per person per night
among CTC’s markets
Measure of yield achieved from inbound visitors
from CTC’s key markets, based on total trip
spend and the number of nights spent in Canada.
1.2 a Marketing campaign ROI
Value of tourist receipts generated by CTC’s
core marketing campaigns per dollar spent to
execute the campaign. This form of conversion
counts those individuals who were considering
travelling to Canada but had not yet booked a
trip prior to being exposed to the campaign, and
were positively infl uenced to visit or book a trip to
Canada upon seeing the advertising.
1.2 b Program ROI
Value of tourist receipts generated by CTC’s
core marketing program (includes advertising
campaigns, consumer shows, public and media
relations, and trade development) per dollar spent
to execute the program. This form of conversion
counts those individuals who were considering
travelling to Canada but had not yet booked a
trip prior to being exposed to the campaign, and
were positively infl uenced to visit or book a trip to
Canada upon seeing the advertising.
1.2 c Number of people converted
Number of people who converted as a result of
CTC’s core marketing campaigns over those who
recalled the CTC core campaigns. Calculated as
the proportion of travellers who recalled seeing
the advertising against the size of the long-haul
population, aged 18 and over.
1.2 d Economic contribution of MC&IT
program
The attributable tourism export revenue for
Canada generated as a result of CTC’s MC&IT
leads conversion into defi nite business, calculated
as: (total # of converted leads into defi nite
business) x (average visitor spending for meeting/
travel type). Average spend data from Destination
Marketing Association International (DMAI).
1.2 e Attributable tourism export revenue
Export tourism revenue (see defi nition for 1.1a)
that is attributable to CTC’s leisure travel, travel
trade and MC&IT activities.
1.2 f Attributable jobs created and/or
maintained
The estimated attributable employment from
tourism revenue generated by CTC’s marketing,
travel trade and MC&IT programs. Source:
Statistics Canada data.
1.2 g Attributable federal tax revenue
Estimated attributable federal tax revenue
generated by CTC’s marketing, travel trade
and MC&IT programs. Calculations are based
on CTC’s Advertising Tracking and Conversion
Studies data and Statistics Canada’s Government
Revenue Attributable to Tourism indicators. For
every $100 of international tourism revenue, the
federal government collects $13.11.
1.3 a Partner brand alignment
Percentage of partners that have aligned with at
least one element of the CTC brand: visual identity
(e.g. logo, colour palette, typography, pattern
bar graphics); tone and writing style; experiential
photography style; and/or assets (video, text,
social media). Source: CTC’s Biennial Partner
Survey.
1.3 b Partner satisfaction
Percentage of partners that are satisfi ed with their
relationship with the CTC. Source: CTC’s Biennial
Partner Survey.
1.4 a Member advocacy of SEC program
The extent that Canadian tourism suppliers
featured in the Signature Experiences Collection®
believe in the value of the program, and
advocate the program to other Canadian tourism
businesses and suppliers within the industry.
2.1 a Aided destination awareness
Percentage of long-haul travellers in CTC
markets who rate their knowledge of vacation
opportunities in Canada as “excellent” or “very
good” after having been prompted with a set of
predetermined destinations.
2.1 b Aided destination consideration
Percentage of long-haul travellers in CTC markets
who are somewhat or very interested in visiting
Canada in the next two years when prompted
about Canada among a set of competitive
destinations.
2.1 c Country brand rank
Annual rank of country brands, according to
the FutureBrand’s Country Brand Index. The
approach incorporates a global quantitative
survey, expert opinions and external statistics,
which are compared and combined to better
understand drivers, preference, importance and
relativism of country brands.
3.1 a Partner contribution
Ratio of total partner contributions (cash,
in-kind, third party) versus CTC parliamentary
appropriations.
3.1 b Proportion of budget allocated to
programming
Percentage of the CTC’s total budget, exclusive of
partner contributions, allocated to programming.
Programming excludes overhead costs, operating
expenditures and compensation.
4.1 a Systems effectiveness
Employee satisfaction with the support provided
by applicable IT applications, as measured
through the CTC’s annual Internal Survey.
5.1 a Core values index
Average value of three Employee Survey
questions regarding how the company effectively
demonstrates CTC’s core values of innovation,
collaboration and respect.
5.1 b Employee engagement index
An index measuring an employee’s belief in the
CTC’s mission and vision, and their commitment
to the CTC as demonstrated through their hard
work, passion and organizational pride.
32
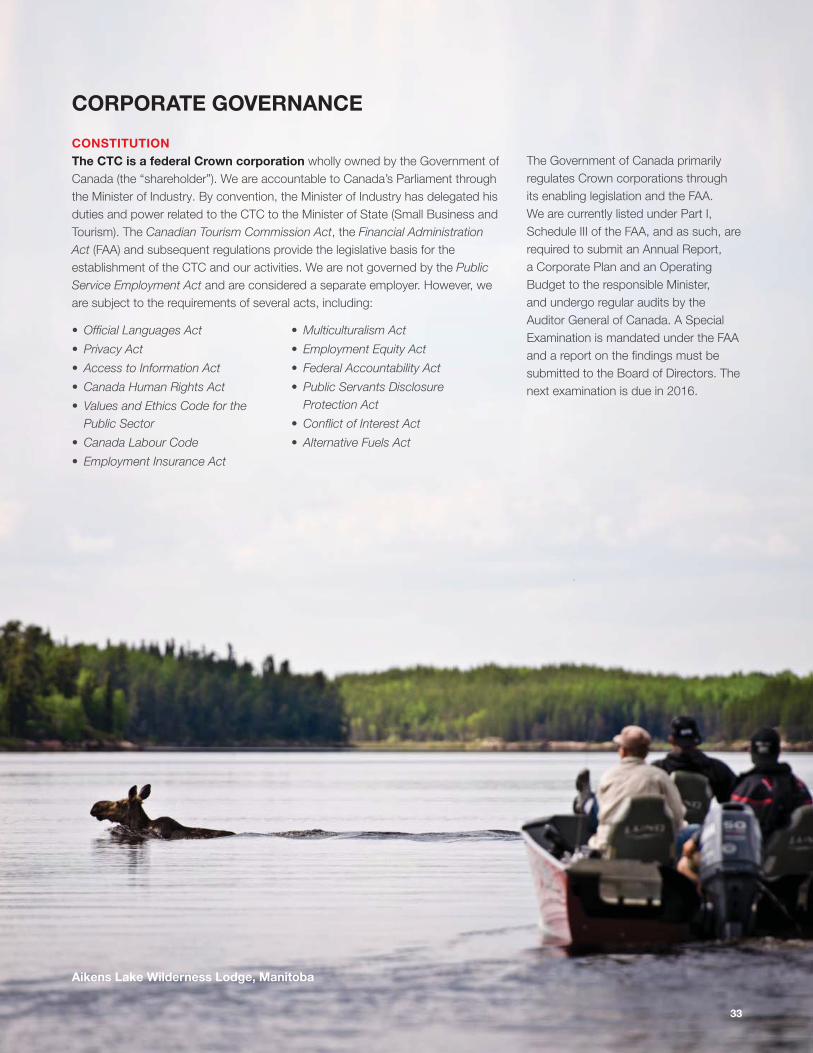
Aikens Lake Wilderness Lodge, Manitoba
CORPORATE GOVERNANCE
CONSTITUTION
The CTC is a federal Crown corporation wholly owned by the Government of
Canada (the “shareholder”). We are accountable to Canada’s Parliament through
the Minister of Industry. By convention, the Minister of Industry has delegated his
duties and power related to the CTC to the Minister of State (Small Business and
Tourism). The Canadian Tourism Commission Act, the Financial Administration
Act (FAA) and subsequent regulations provide the legislative basis for the
establishment of the CTC and our activities. We are not governed by the Public
Service Employment Act and are considered a separate employer. However, we
are subject to the requirements of several acts, including:
• Offi cial Languages Act
• Privacy Act
• Access to Information Act
• Canada Human Rights Act
• Values and Ethics Code for the
Public Sector
• Canada Labour Code
• Employment Insurance Act
• Multiculturalism Act
• Employment Equity Act
• Federal Accountability Act
• Public Servants Disclosure
Protection Act
• Confl ict of Interest Act
• Alternative Fuels Act
33
The Government of Canada primarily
regulates Crown corporations through
its enabling legislation and the FAA.
We are currently listed under Part I,
Schedule III of the FAA, and as such, are
required to submit an Annual Report,
a Corporate Plan and an Operating
Budget to the responsible Minister,
and undergo regular audits by the
Auditor General of Canada. A Special
Examination is mandated under the FAA
and a report on the fi ndings must be
submitted to the Board of Directors. The
next examination is due in 2016.
34 Canadian Tourism Commission 2012 Annual Report
CORPORATE GOVERNANCE
BOARD OF DIRECTORS
A 12-member Board of Directors (currently two vacancies) oversees the management of the organization and
holds management accountable for its performance. The Board, which also includes the President & CEO of
the CTC, is composed of senior business professionals who possess the experience, competencies and skills
required to guide the CTC and help it deliver its strategic goals, seize opportunities and mitigate risks.
The Chair of the Board and the President & CEO are appointed by the Governor-in-Council. The remaining
directors are appointed by the Minister of Industry with the approval of the Governor-in-Council. The CTC Act
names the Deputy Minister of Industry as ex offi cio director.
The President & CEO is accountable to the Board of Directors for the management and performance
of the organization. The Board is accountable to Parliament through the Minister of Industry. The
primary vehicles for reporting to the Crown are the Annual Report and the fi ve-year Corporate Plan,
a summary of which is tabled annually in Parliament and available on the CTC corporate website at
http://en-corporate.canada.travel/about-ctc/corporate-reports.
BOARD ACCOMPLISHMENTS
Consistent with recognized best practices, the Board conducted a board evaluation in 2012. The 2012 survey
results are strongly positive.
The CTC made advancements in various areas of board governance in 2012. The skills-focused board profi le was
updated to ensure the right level and skills were refl ected on the CTC Board. A further gap analysis identifi ed areas
lacking in the present board make-up and tools such as a CTC Director Recruitment Process and a database of
potential directors were established to support director recruitment. The CTC Board also modernized its process in
2012 by moving away from a paper board book system to an entirely paperless process.
The CTC remains committed to reaching out and working with the tourism industry and has mechanisms in
place to ensure our engagement with industry, including:
• The CTC’s advisory committees and their important role of providing strategic advice to the Board of Directors
and the President & CEO;
• The provincial/territorial tourism Deputy Ministers’ forum that meets up to twice annually to ensure that all
jurisdictions are current on the CTC’s activities and have the opportunity to provide input;
• Regular meetings with the CTC’s destination marketing counterparts of provincial and territorial marketing
organizations, as well as with the Destination Marketing Association of Canada, an organization that
represents Canadian civic destination marketing;
• The Export Tourism Council that meets up to twice annually and includes key industry leaders in the tourism
export business; and
• Annual meetings with similar national tourism organizations with the objective of establishing best practices
and international benchmarks.
In 2012, the CTC Board of Directors met four times in person in different regions of the country and six times via
conference call. Attendance at these meetings averaged 86%.

Canadian Tourism Commission 2012 Annual Report 35
CORPORATE GOVERNANCE
Steve Allan
Chair of the CTC Board of
Directors and
Vice-President,
Ernst & Young, Inc.
Calgary, AB
Michele McKenzie
(ex offi cio director)
President and CEO,
Canadian Tourism
Commission
Vancouver, BC
Scott Allison
Vice-President,
Canadian Operations,
Marriott Hotels of Canada
Toronto, ON
Dray Matovic
President,
Halex Ventures Inc.
Niagara Falls, ON
Rod Taylor
Chief Executive Offi cer,
Waste to Energy Canada
Whitehorse, YK
Montie Brewer
Vice-Chair of the Board
Winchester, MA
John Knubley
(ex offi cio director)
Deputy Minister,
Industry Canada
Ottawa, ON
David Jovanovic
Niagara Falls, ON
Alexander Reford
Director,
Les Jardins de Métis Inc.
Grand-Métis, QC
George Young
Huntsville, Ontario
36 Canadian Tourism Commission 2012 Annual Report
CORPORATE GOVERNANCE
COMMITTEES OF THE BOARD OF DIRECTORS
In 2012, the CTC Board of Directors included the following
committees:
Governance & Nominating Committee
• Recommends the appointment of directors to the
Minister of Industry and monitors Board and committee
effectiveness.
Chair: Alexander Reford
Members: Steve Allan, George Young
Audit & Pension Committee
• Oversees fi nancial and management control systems,
the administration and investment activities of the CTC’s
pension plans and internal audits.
Chair: Steve Allan (Interim)
Members: Scott Allison, Montie Brewer, Dray Matovic
Human Resources Committee
• Reviews the Human Resources Strategic Plan, total
compensation for executive employees, and succession
planning.
Chair: Scott Allison
Members: Steve Allan, Rod Taylor
ADVISORY COMMITTEE CHAIRS
According to the CTC’s corporate bylaws, the Board of
Directors may, from time to time, create advisory committees
composed of such persons as it may deem necessary to
advise it on any matters pertaining to the affairs of the CTC.
In 2012, there were six CTC Advisory Committees chaired
by and comprising tourism industry leaders and experts. The
committees take their direction from the Board (strategic
directions) and report to both the Board and the CEO. In
consultation with the industry, the committees and the staff
develop annual and multi-year strategic plans consistent with
the Board’s strategic direction for each program area.
Brand Experiences Committee
Andrew Lind
Vice-President and General Manager
Jonview Canada
Core Markets Committee
Christena Keon Sirsly (until September 2012)
David Whitaker (since September 2012)
President & CEO
Tourism Toronto
Emerging Markets Committee
Mike Ruby
President
Muskoka Language International Inc.
Meetings, Conventions, and Incentive Travel
Marketing Committee
Patricia Lyall
President & CEO
Destination Halifax
Research Committee
Stephen Pearce
Vice-President
Leisure Travel & Destination Management
Tourism Vancouver

Canadian Tourism Commission 2012 Annual Report 37
CORPORATE GOVERNANCE
SENIOR MANAGEMENT COMMITTEE
Michele McKenzie
President and Chief Executive Offi cer
Ms. McKenzie joined the CTC in 2004 after serving as Deputy Minister of Tourism, Culture and Heritage for the
Province of Nova Scotia. She has held positions on a number of boards including the Nova Scotia Liquor Corporation,
the Art Gallery of Nova Scotia and the Nova Scotia Museum. She is a member of the Institute of Corporate Directors,
serves on the Board of the Vancouver Community College Foundation, holds a Bachelor’s degree in Commercial
Recreation / Marketing and conducted MBA studies at Dalhousie University.
Chantal Péan
Senior Vice-President, Corporate Affairs and Corporate Secretary
Ms. Péan joined the CTC in 1991 and was appointed Vice-President of Corporate Affairs and Corporate Secretary
in 2000, and Senior Vice-President of Corporate Affairs and Corporate Secretary in 2003. She holds a Bachelor of
Science degree from the University of Manitoba, and a Bachelor of Law, Notary Diploma (Droit notarial) and MBA from
the University of Ottawa.
Greg Klassen
Senior Vice-President, Marketing Strategy and Communications
Mr. Klassen joined the CTC in 2001 after having worked in marketing with both Telus and AT&T, and having taught
marketing at Algonquin College in Ottawa. He was appointed Vice-President of Marketing in 2005, and Senior Vice-
President of Marketing Strategy and Communications in 2008. He holds an MBA from Thunderbird, The American
Graduate School of International Management and a Bachelor’s degree in Economics from the University of Victoria.
Lena Bullock
Vice-President, Finance and Chief Financial Offi cer
Ms. Bullock joined the CTC in 2005 as Executive Director, Financial Operations, and was appointed Vice-President of
Finance and Chief Financial Offi cer in 2009. She has a Bachelor of Commerce from the University of British Columbia
and is a Chartered Accountant with extensive experience in the private sector, including work with KPMG, Molson
Breweries, Coca Cola Bottling Company and Blast Radius Inc.
Charles McKee
Vice-President, International
Mr. McKee joined the CTC in 2009 as Vice-President, International, after having served with Air Canada for seven
years, most recently as Vice-President, Marketing, based in Montreal. He has also worked with Virgin Atlantic Airways
in London, the US and Asia, and served as Executive Vice-President of LastMinute.com, Europe’s largest online travel
company. He holds an honours degree in East Asian Studies from Harvard University.
Paul Nursey
Vice-President, Strategy and Corporate Communications
Mr. Nursey joined the CTC in 2006 with over 10 years of tourism management experience, having worked with
Rocky Mountaineer Rail Tours, Mount Seymour Resorts and Tourism Vancouver. He was appointed Vice-President of
Strategy and Corporate Communications in 2010. He holds degrees in Economics and Regional Planning from Simon
Fraser University and a certifi cate in Executive Development in Tourism from the University of Hawaii at Manoa. He is
currently conducting MBA studies at the University of Massachusetts Amherst.
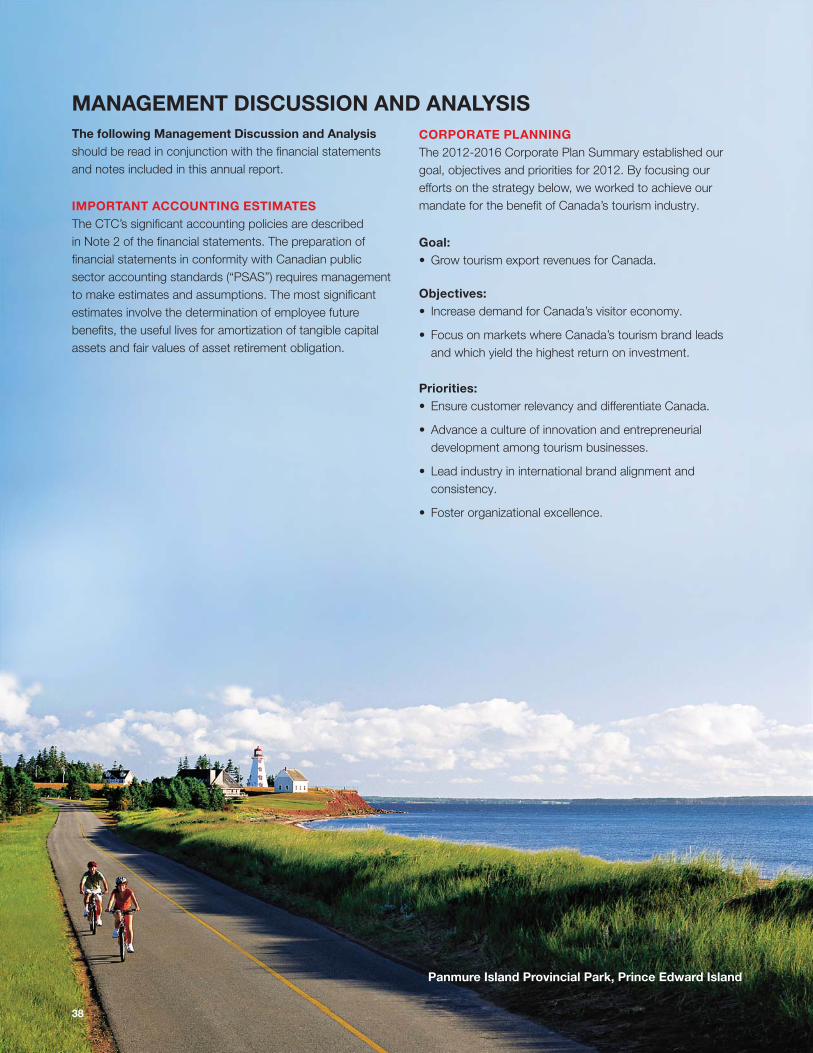
Panmure Island Provincial Park, Prince Edward Island
38
MANAGEMENT DISCUSSION AND ANALYSIS
The following Management Discussion and Analysis
should be read in conjunction with the fi nancial statements
and notes included in this annual report.
IMPORTANT ACCOUNTING ESTIMATES
The CTC’s signifi cant accounting policies are described
in Note 2 of the fi nancial statements. The preparation of
fi nancial statements in conformity with Canadian public
sector accounting standards (“PSAS”) requires management
to make estimates and assumptions. The most signifi cant
estimates involve the determination of employee future
benefi ts, the useful lives for amortization of tangible capital
assets and fair values of asset retirement obligation.
CORPORATE PLANNING
The 2012-2016 Corporate Plan Summary established our
goal, objectives and priorities for 2012. By focusing our
efforts on the strategy below, we worked to achieve our
mandate for the benefi t of Canada’s tourism industry.
Goal:
• Grow tourism export revenues for Canada.
Objectives:
• Increase demand for Canada’s visitor economy.
• Focus on markets where Canada’s tourism brand leads
and which yield the highest return on investment.
Priorities:
• Ensure customer relevancy and differentiate Canada.
• Advance a culture of innovation and entrepreneurial
development among tourism businesses.
• Lead industry in international brand alignment and
consistency.
• Foster organizational excellence.
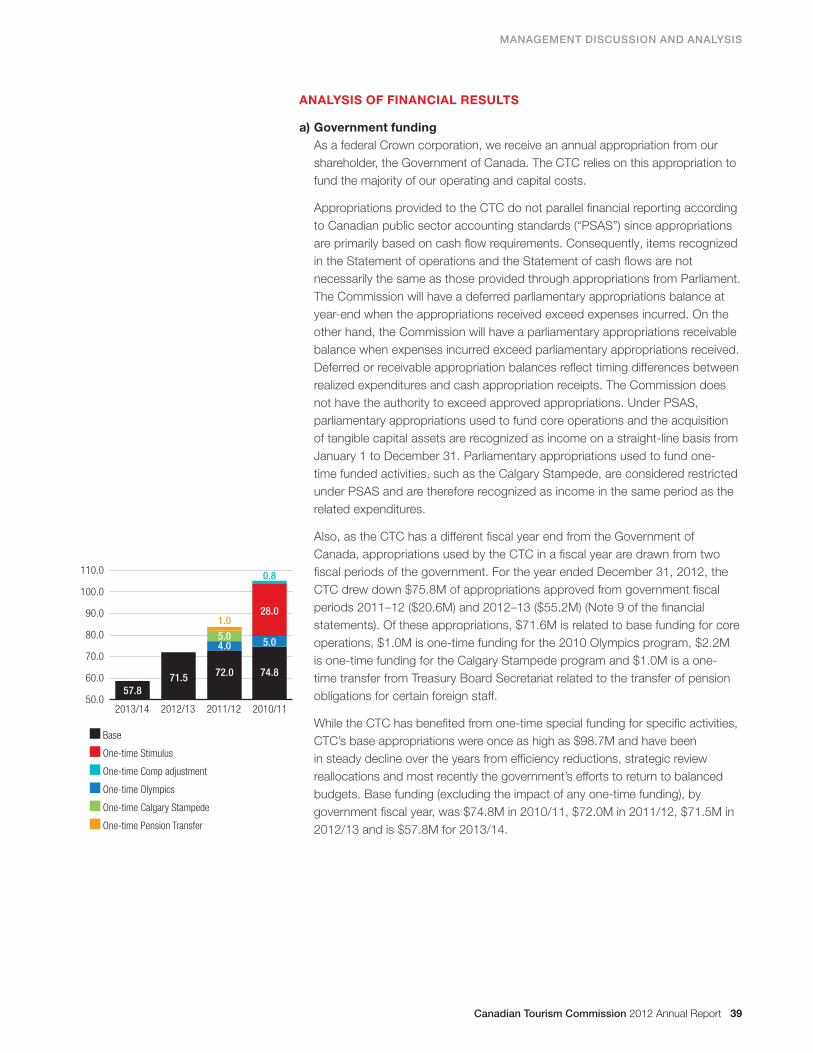
Canadian Tourism Commission 2012 Annual Report 39
110.0
100.0
90.0
80.0
70.0
60.0
50.02013/14 2012/13 2011/12 2010/11
Base
One-time Stimulus
One-time Comp adjustment
One-time Olympics
One-time Calgary Stampede
One-time Pension Transfer
28.0
5.0
74.872.071.5
57.8
4.05.0
1.0
0.8
MANAGEMENT DISCUSSION AND ANALYSIS
ANALYSIS OF FINANCIAL RESULTS
a) Government funding
As a federal Crown corporation, we receive an annual appropriation from our
shareholder, the Government of Canada. The CTC relies on this appropriation to
fund the majority of our operating and capital costs.
Appropriations provided to the CTC do not parallel fi nancial reporting according
to Canadian public sector accounting standards (“PSAS”) since appropriations
are primarily based on cash fl ow requirements. Consequently, items recognized
in the Statement of operations and the Statement of cash fl ows are not
necessarily the same as those provided through appropriations from Parliament.
The Commission will have a deferred parliamentary appropriations balance at
year-end when the appropriations received exceed expenses incurred. On the
other hand, the Commission will have a parliamentary appropriations receivable
balance when expenses incurred exceed parliamentary appropriations received.
Deferred or receivable appropriation balances refl ect timing differences between
realized expenditures and cash appropriation receipts. The Commission does
not have the authority to exceed approved appropriations. Under PSAS,
parliamentary appropriations used to fund core operations and the acquisition
of tangible capital assets are recognized as income on a straight-line basis from
January 1 to December 31. Parliamentary appropriations used to fund one-
time funded activities, such as the Calgary Stampede, are considered restricted
under PSAS and are therefore recognized as income in the same period as the
related expenditures.
Also, as the CTC has a different fi scal year end from the Government of
Canada, appropriations used by the CTC in a fi scal year are drawn from two
fi scal periods of the government. For the year ended December 31, 2012, the
CTC drew down $75.8M of appropriations approved from government fi scal
periods 2011–12 ($20.6M) and 2012–13 ($55.2M) (Note 9 of the fi nancial
statements). Of these appropriations, $71.6M is related to base funding for core
operations, $1.0M is one-time funding for the 2010 Olympics program, $2.2M
is one-time funding for the Calgary Stampede program and $1.0M is a one-
time transfer from Treasury Board Secretariat related to the transfer of pension
obligations for certain foreign staff.
While the CTC has benefi ted from one-time special funding for specifi c activities,
CTC’s base appropriations were once as high as $98.7M and have been
in steady decline over the years from effi ciency reductions, strategic review
reallocations and most recently the government’s efforts to return to balanced
budgets. Base funding (excluding the impact of any one-time funding), by
government fi scal year, was $74.8M in 2010/11, $72.0M in 2011/12, $71.5M in
2012/13 and is $57.8M for 2013/14.
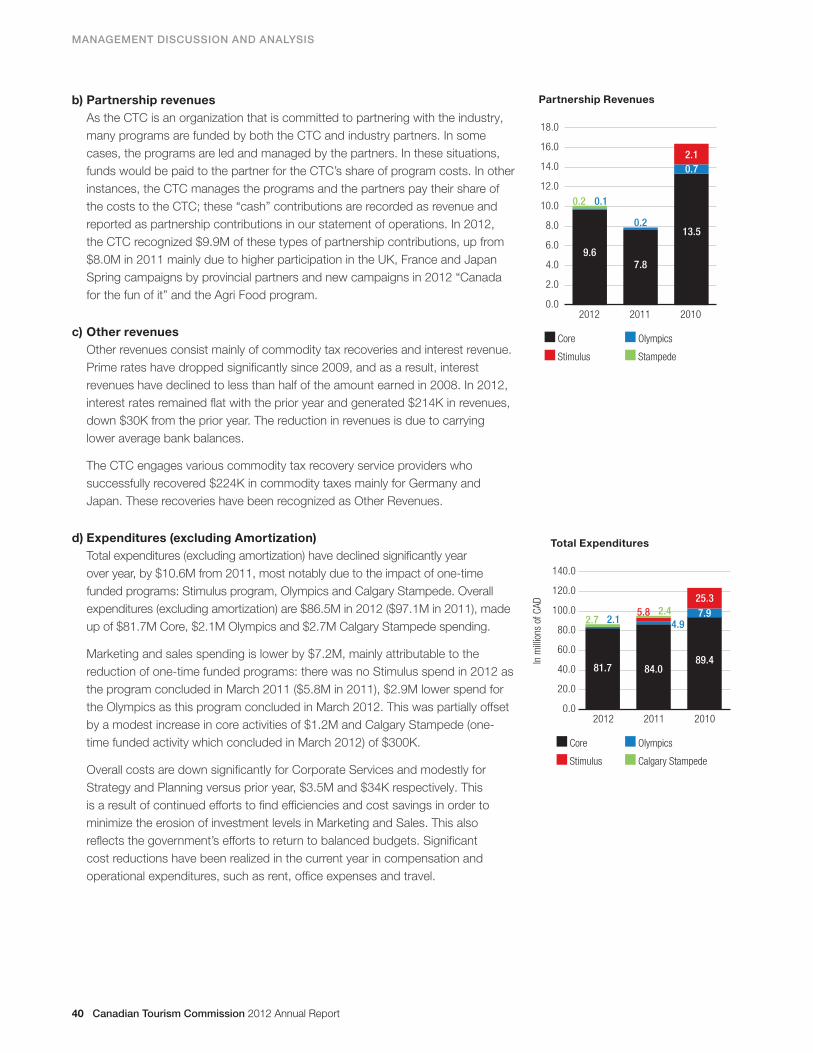
40 Canadian Tourism Commission 2012 Annual Report
MANAGEMENT DISCUSSION AND ANALYSIS
b) Partnership revenues
As the CTC is an organization that is committed to partnering with the industry,
many programs are funded by both the CTC and industry partners. In some
cases, the programs are led and managed by the partners. In these situations,
funds would be paid to the partner for the CTC’s share of program costs. In other
instances, the CTC manages the programs and the partners pay their share of
the costs to the CTC; these “cash” contributions are recorded as revenue and
reported as partnership contributions in our statement of operations. In 2012,
the CTC recognized $9.9M of these types of partnership contributions, up from
$8.0M in 2011 mainly due to higher participation in the UK, France and Japan
Spring campaigns by provincial partners and new campaigns in 2012 “Canada
for the fun of it” and the Agri Food program.
c) Other revenues
Other revenues consist mainly of commodity tax recoveries and interest revenue.
Prime rates have dropped signifi cantly since 2009, and as a result, interest
revenues have declined to less than half of the amount earned in 2008. In 2012,
interest rates remained fl at with the prior year and generated $214K in revenues,
down $30K from the prior year. The reduction in revenues is due to carrying
lower average bank balances.
The CTC engages various commodity tax recovery service providers who
successfully recovered $224K in commodity taxes mainly for Germany and
Japan. These recoveries have been recognized as Other Revenues.
d) Expenditures (excluding Amortization)
Total expenditures (excluding amortization) have declined signifi cantly year
over year, by $10.6M from 2011, most notably due to the impact of one-time
funded programs: Stimulus program, Olympics and Calgary Stampede. Overall
expenditures (excluding amortization) are $86.5M in 2012 ($97.1M in 2011), made
up of $81.7M Core, $2.1M Olympics and $2.7M Calgary Stampede spending.
Marketing and sales spending is lower by $7.2M, mainly attributable to the
reduction of one-time funded programs: there was no Stimulus spend in 2012 as
the program concluded in March 2011 ($5.8M in 2011), $2.9M lower spend for
the Olympics as this program concluded in March 2012. This was partially offset
by a modest increase in core activities of $1.2M and Calgary Stampede (one-
time funded activity which concluded in March 2012) of $300K.
Overall costs are down signifi cantly for Corporate Services and modestly for
Strategy and Planning versus prior year, $3.5M and $34K respectively. This
is a result of continued efforts to fi nd effi ciencies and cost savings in order to
minimize the erosion of investment levels in Marketing and Sales. This also
refl ects the government’s efforts to return to balanced budgets. Signifi cant
cost reductions have been realized in the current year in compensation and
operational expenditures, such as rent, offi ce expenses and travel.
Partnership Revenues
18.0
16.0
14.0
12.0
10.0
8.0
6.0
4.0
2.0
0.02012 2011 2010
Core Olympics
Stimulus Stampede
9.67.8
13.5
0.7
2.1
0.2
0.10.2
Total ExpendituresIn
mill
ions
of
CA
D
140.0
120.0
100.0
80.0
60.0
40.0
20.0
0.02012 2011 2010
Core Olympics
Stimulus Calgary Stampede
81.7 84.089.4
7.9
25.3
4.95.8 2.4
2.12.7
Canadian Tourism Commission 2012 Annual Report 41
MANAGEMENT DISCUSSION AND ANALYSIS
Employee future benefi ts
The CTC offers a number of pension and benefi t plans to its employees. These plans are both
complex in nature and expensive. Additional details of these pension plans are provided in Note
8 of the fi nancial statements.
Transfer of pension obligations from Treasury Board
Prior to 2012, certain employees in our foreign locations accrued benefi ts under the Pension
Scheme for Employees of the Government of Canada Locally-Engaged Outside Canada (the
“Prior Plan”), managed by the Treasury Board, for service prior to January 2, 2001. In 2011,
the Treasury Board notifi ed the CTC that effective January 1, 2012 they would no longer have
funding to reimburse the CTC for benefi ts accrued under the Prior Plan and that they intended
to transfer the obligation to pay those benefi ts to the World Wide Plan (“WWP”), and that
they would transfer an amount of assets to the CTC to fund this obligation. The transfer of
assets ($1.0M) was completed on April 5, 2012. As a result of the asset transfer, the CTC’s
accrued benefi t obligations and related expenses increased by $887K in 2012. The CTC is now
responsible for managing the liquidity, currency and interest rate risks associated with these
funds (which are held in bonds and money market funds) and ensuring that adequate funds are
available as the obligations come due.
Solvency relief
Since 2005, the CTC has contributed $5.9M in special payments to the Canadian defi ned
benefi t pension plan to fund the going concern unfunded liabilities and solvency defi ciencies.
The most recent actuarial valuation as at December 31, 2011 reports a funding excess of
$558K on a going concern basis and a shortfall of $9.2M on a wind up basis. The CTC does
not receive any additional funding for these solvency special payments. The CTC has taken
several steps to mitigate the fi nancial burden:
• The CTC established a defi ned contribution pension plan for Canadian excluded employees
hired on or after August 1, 2005 and for Canadian unionized employees hired on or after
August 1, 2005, effective March 8, 2007.
• Since 2010, the CTC has taken advantage of relief measures offered through the Solvency
Funding Relief Regulations, 2009 (the “2009 Relief Regulations”), which allow the amount of
the minimum special payments determined over a 10-year period (versus a 5-year period),
thereby reducing the annual amount payable.
• In 2011, the CTC began taking advantage of the amendments to the Pension Benefi ts
Standards Regulations, 1985 (the “Regulations”), released by the federal government in
March 2011, which allow a Crown corporation to further reduce its annual solvency special
payments up to an aggregate reduction of 15% of assets (under Section 9.16 of the Pension
Benefi ts Standards Act, 1985, and in accordance with Section 9.2 and Subsections 9(13.3),
9(13.4) and 9(13.5) of the Regulations.
• In June 2012, the CTC submitted a request to the Department of Finance to withdraw from
the 2009 Relief Regulations but continue under the 2011 amendments to the Regulations.
As a result of the withdrawal, as required under subparagraph 19(1)(a)(ii) of the 2009 Relief
Regulations, the CTC contributed special payments of $438K in 2012.
• The CTC intends to seek the maximum solvency relief under the 2011 amendments to the
Regulations. The aggregate reduction in solvency special payments up to and including 2012
is $1,353,000. The aggregate reduction does not exceed 15% of assets ($3,020,900) as at
December 31, 2011.
42 Canadian Tourism Commission 2012 Annual Report
MANAGEMENT DISCUSSION AND ANALYSIS
• During 2012, the CTC, along with its actuary, had numerous discussions
with representatives from the Offi ce of Superintendent of Financial Institutions
(“OSFI”) and the Department of Finance to ascertain the impact of the
withdrawal from the 2009 Relief Regulations on the funded position of the
plan. As these discussions concluded only recently, the actuarial valuation for
funding purposes was fi nalized and fi led with OSFI in February 2013.
• Without the benefi t of the solvency relief, the CTC would have been required to
make special payments of $1.1M in 2012.
Post-retirement benefi t accounting error
While preparing the valuation of the post-retirement benefi ts for 2012, it was
identifi ed that the post-retirement benefi t for certain US-based staff had not been
previously reported and that post-retirement benefi ts for certain Canadian-based
staff should not have been previously reported. Both of these accounting errors
have been corrected retrospectively by restating prior period results. Refer to
Note 3 of the fi nancial statements for further details.
Foreign exchange
The CTC’s functional currency is the Canadian dollar, but it regularly transacts
in multiple foreign currencies as it operates internationally. As a result, the CTC
is exposed to fl uctuations in foreign exchange rates. Transactions involving
foreign currencies are translated into Canadian dollar equivalents using rates of
exchange in effect at the time of those transactions. Gains and losses resulting
from foreign currency transactions are reported on the Statement of operations
as “Corporate services” and are considered an Operating expense. Monetary
assets and liabilities denominated in foreign currencies are translated into
Canadian dollars at the rate of exchange in effect at year end with any resulting
translation gain or loss being included in Statement of operations as “Corporate
Services” and are considered an Operating expense.
Over the past year, the foreign exchange rates of most currencies experienced
only moderate variability. The CTC realized a foreign exchange gain on
transactions of $100K, mainly from the Euro and US dollar, and a loss on
translation of $145K.
Systems Project
In 2012, CTC completed the implementation of a new customer relationship
management tool, fi nancial and procurement systems, mass email marketing
tool, digital asset management system, balanced scorecard reporting tool and
the upgrade of the existing payroll and benefi ts administration system. Each of
the new systems is cloud-based and allows the organization to be scalable. This
signifi cant implementation effort was completed on time and below budget and
also secures signifi cant on-going cost savings of over $500K annually.
The fi nal phase of the systems project will be completed in 2013, which includes
a fi nancial reporting tool and a Human Resource Information system.
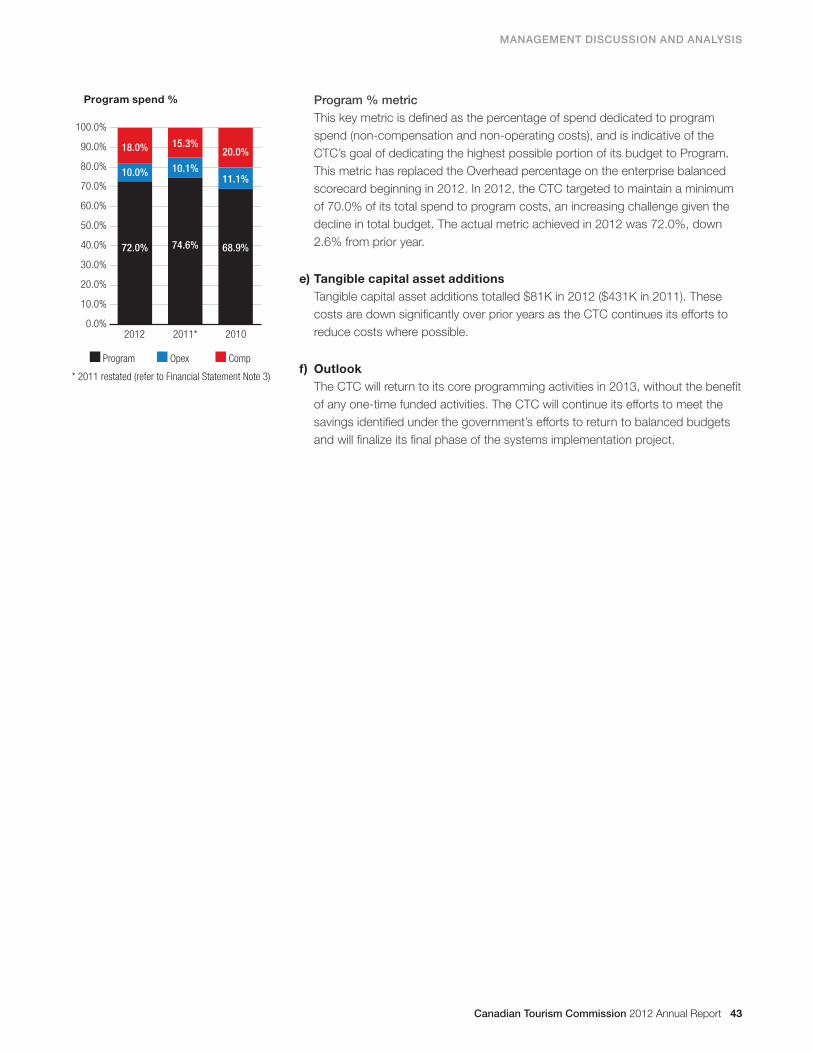
Canadian Tourism Commission 2012 Annual Report 43
Program spend %
100.0%
90.0%
80.0%
70.0%
60.0%
50.0%
40.0%
30.0%
20.0%
10.0%
0.0%2012 2011* 2010
Program Opex Comp
* 2011 restated (refer to Financial Statement Note 3)
72.0% 74.6% 68.9%
10.0% 10.1%11.1%
18.0% 15.3%20.0%
MANAGEMENT DISCUSSION AND ANALYSIS
Program % metric
This key metric is defi ned as the percentage of spend dedicated to program
spend (non-compensation and non-operating costs), and is indicative of the
CTC’s goal of dedicating the highest possible portion of its budget to Program.
This metric has replaced the Overhead percentage on the enterprise balanced
scorecard beginning in 2012. In 2012, the CTC targeted to maintain a minimum
of 70.0% of its total spend to program costs, an increasing challenge given the
decline in total budget. The actual metric achieved in 2012 was 72.0%, down
2.6% from prior year.
e) Tangible capital asset additions
Tangible capital asset additions totalled $81K in 2012 ($431K in 2011). These
costs are down signifi cantly over prior years as the CTC continues its efforts to
reduce costs where possible.
f) Outlook
The CTC will return to its core programming activities in 2013, without the benefi t
of any one-time funded activities. The CTC will continue its efforts to meet the
savings identifi ed under the government’s efforts to return to balanced budgets
and will fi nalize its fi nal phase of the systems implementation project.
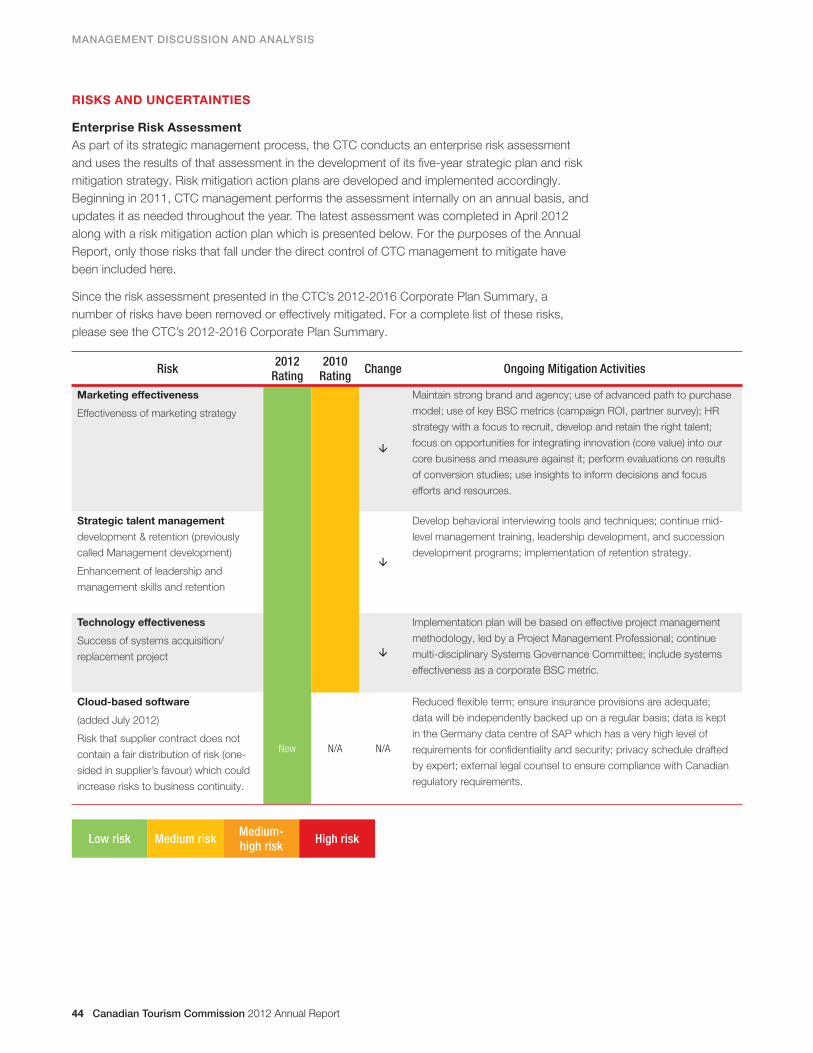
44 Canadian Tourism Commission 2012 Annual Report
MANAGEMENT DISCUSSION AND ANALYSIS
RISKS AND UNCERTAINTIES
Enterprise Risk Assessment
As part of its strategic management process, the CTC conducts an enterprise risk assessment
and uses the results of that assessment in the development of its fi ve-year strategic plan and risk
mitigation strategy. Risk mitigation action plans are developed and implemented accordingly.
Beginning in 2011, CTC management performs the assessment internally on an annual basis, and
updates it as needed throughout the year. The latest assessment was completed in April 2012
along with a risk mitigation action plan which is presented below. For the purposes of the Annual
Report, only those risks that fall under the direct control of CTC management to mitigate have
been included here.
Since the risk assessment presented in the CTC’s 2012-2016 Corporate Plan Summary, a
number of risks have been removed or effectively mitigated. For a complete list of these risks,
please see the CTC’s 2012-2016 Corporate Plan Summary.
Risk2012
Rating2010
RatingChange Ongoing Mitigation Activities
Marketing effectiveness
Effectiveness of marketing strategy
Maintain strong brand and agency; use of advanced path to purchase
model; use of key BSC metrics (campaign ROI, partner survey); HR
strategy with a focus to recruit, develop and retain the right talent;
focus on opportunities for integrating innovation (core value) into our
core business and measure against it; perform evaluations on results
of conversion studies; use insights to inform decisions and focus
efforts and resources.
Strategic talent management
development & retention (previously
called Management development)
Enhancement of leadership and
management skills and retention
Develop behavioral interviewing tools and techniques; continue mid-
level management training, leadership development, and succession
development programs; implementation of retention strategy.
Technology effectiveness
Success of systems acquisition/
replacement project
Implementation plan will be based on effective project management
methodology, led by a Project Management Professional; continue
multi-disciplinary Systems Governance Committee; include systems
effectiveness as a corporate BSC metric.
Cloud-based software
(added July 2012)
Risk that supplier contract does not
contain a fair distribution of risk (one-
sided in supplier’s favour) which could
increase risks to business continuity.
New N/A N/A
Reduced fl exible term; ensure insurance provisions are adequate;
data will be independently backed up on a regular basis; data is kept
in the Germany data centre of SAP which has a very high level of
requirements for confi dentiality and security; privacy schedule drafted
by expert; external legal counsel to ensure compliance with Canadian
regulatory requirements.
Low risk Medium riskMedium-high risk
High risk
Canadian Tourism Commission 2012 Annual Report 45
MANAGEMENT DISCUSSION AND ANALYSIS
Internal Audit
The CTC engages an external fi rm to carry out its Internal Audit function. The Internal Auditors
act independently and report directly to the Audit Committee. The development of CTC’s annual
internal audit program is risk-based and incorporates the results of the enterprise risk assessment
and input from the Board of Directors and key management personnel. In 2012, the internal
auditor began several projects: Review of Management Expense Policies, Human Resources
Follow-up Internal Audit (from 2009), and Systems Implementation Review. These projects will be
fi nalized in early 2013. Management will develop and implement action plans in response to the
internal auditor’s recommendations.
Special examination
Budget Implementation Act 2009 amended Part X of the Financial Administration Act, whereby
extending the frequency of Special Examinations from every fi ve to 10 years. The next Special
Examination for the CTC is due in 2016.
46 Canadian Tourism Commission 2012 Annual Report46 Canadian Tourism Commission 2012 Annual Report
FINANCIAL STATEMENTS
MANAGEMENT RESPONSIBILITY STATEMENT
The management of the Commission is responsible for the performance of the duties delegated to it by
the Board of Directors. These include the preparation of an Annual Report together with audited fi nancial
statements. These statements, approved by the Board of Directors, were prepared in accordance with Canadian
public sector accounting standards appropriate in the circumstances. Other fi nancial and operational information
appearing elsewhere in the Annual Report is consistent with that contained in the fi nancial statements.
Management maintains internal accounting control systems designed to provide reasonable assurance that
relevant and reliable fi nancial information is produced and that transactions comply with the relevant authorities.
Management also maintains fi nancial and management control systems and practices designed to ensure the
transactions are in accordance with Part X of the Financial Administration Act and regulations, the Canadian
Tourism Commission Act, and by-laws of the Commission. These systems and practices are also designed to
ensure that assets are safeguarded and controlled, and that the operations of the Commission are carried out
effectively. In addition, the Audit Committee, appointed by the Board of Directors, oversees the internal audit
activities of the Commission and performs other such functions as are assigned to it.
The Commission’s external auditor, the Auditor General of Canada, is responsible for auditing the fi nancial
statements and for issuing his report thereon.
Michele McKenzie Lena Bullock
President and Chief Executive Offi cer Vice President, Finance and
Chief Financial Offi cer
March 21, 2013
46 Canadian Tourism Commission 2012 Annual Report
48 Canadian Tourism Commission 2012 Annual Report
FINANCIAL STATEMENTS
48 Canadian Tourism Commission 2012 Annual Report
FINANCIAL STATEMENTS
48 Canadian Tourism Commission 2012 Annual Report
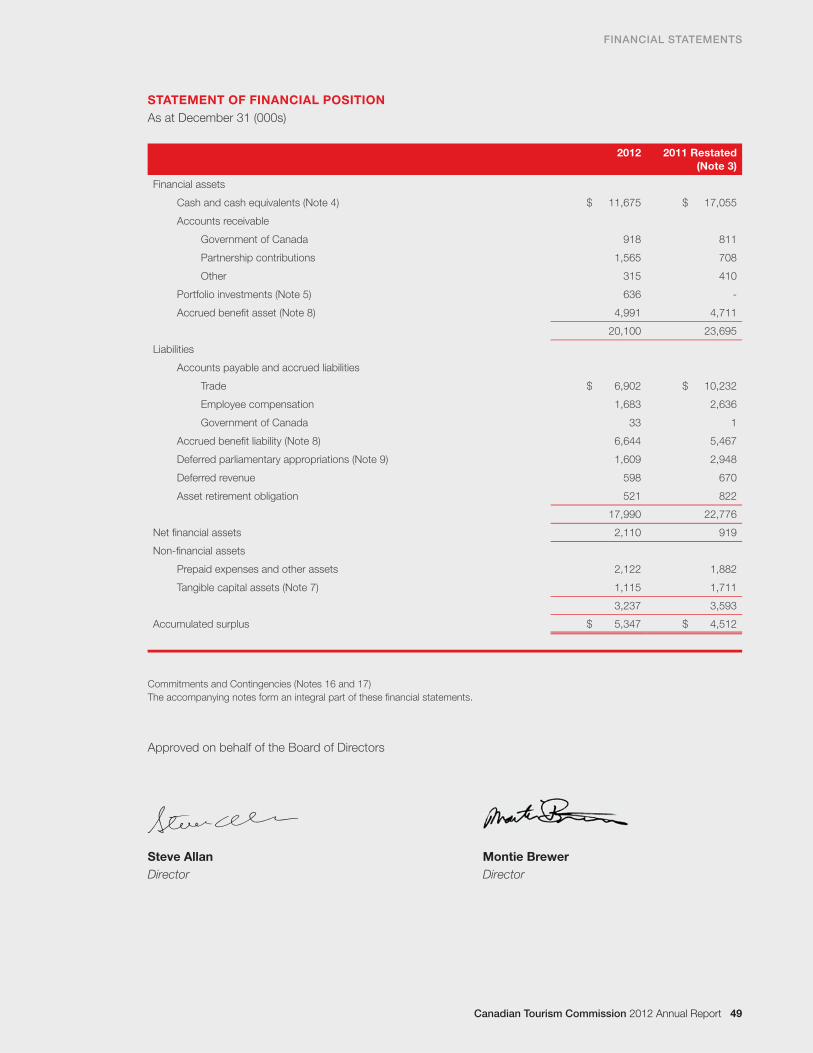
FINANCIAL STATEMENTS
Canadian Tourism Commission 2012 Annual Report 49
STATEMENT OF FINANCIAL POSITION
As at December 31 (000s)
2012 2011 Restated
(Note 3)
Financial assets
Cash and cash equivalents (Note 4)
Accounts receivable
Government of Canada
Partnership contributions
Other
Portfolio investments (Note 5)
Accrued benefi t asset (Note 8)
$ 11,675
918
1,565
315
636
4,991
$ 17,055
811
708
410
-
4,711
20,100 23,695
Liabilities
Accounts payable and accrued liabilities
Trade
Employee compensation
Government of Canada
Accrued benefi t liability (Note 8)
Deferred parliamentary appropriations (Note 9)
Deferred revenue
Asset retirement obligation
$ 6,902
1,683
33
6,644
1,609
598
521
$ 10,232
2,636
1
5,467
2,948
670
822
17,990 22,776
Net fi nancial assets 2,110 919
Non-fi nancial assets
Prepaid expenses and other assets
Tangible capital assets (Note 7)
2,122
1,115
1,882
1,711
3,237 3,593
Accumulated surplus $ 5,347 $ 4,512
Commitments and Contingencies (Notes 16 and 17)
The accompanying notes form an integral part of these fi nancial statements.
Approved on behalf of the Board of Directors
Steve Allan Montie Brewer
Director Director
FINANCIAL STATEMENTS
Canadian Tourism Commission 2012 Annual Report 49
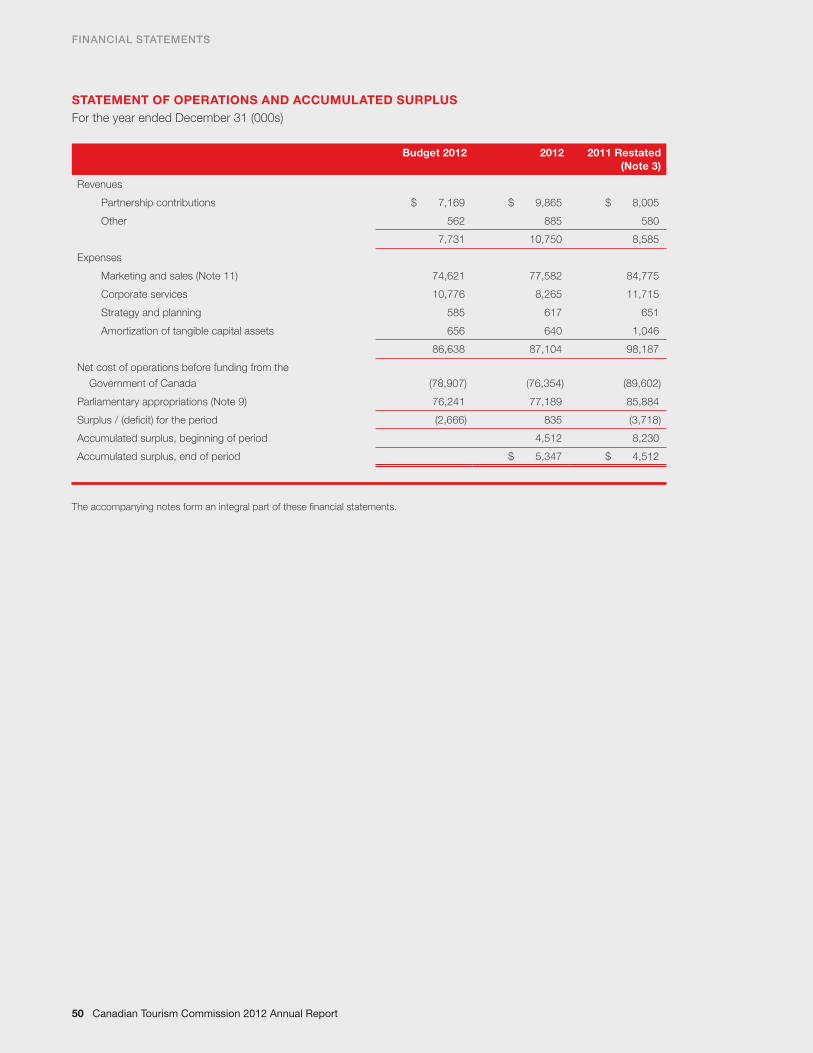
50 Canadian Tourism Commission 2012 Annual Report
FINANCIAL STATEMENTS
50 Canadian Tourism Commission 2012 Annual Report
STATEMENT OF OPERATIONS AND ACCUMULATED SURPLUS
For the year ended December 31 (000s)
Budget 2012 2012 2011 Restated
(Note 3)
Revenues
Partnership contributions
Other
$ 7,169
562
$ 9,865
885
$ 8,005
580
7,731 10,750 8,585
Expenses
Marketing and sales (Note 11)
Corporate services
Strategy and planning
Amortization of tangible capital assets
74,621
10,776
585
656
77,582
8,265
617
640
84,775
11,715
651
1,046
86,638 87,104 98,187
Net cost of operations before funding from the
Government of Canada
Parliamentary appropriations (Note 9)
(78,907)
76,241
(76,354)
77,189
(89,602)
85,884
Surplus / (defi cit) for the period (2,666) 835 (3,718)
Accumulated surplus, beginning of period 4,512 8,230
Accumulated surplus, end of period $ 5,347 $ 4,512
The accompanying notes form an integral part of these fi nancial statements.
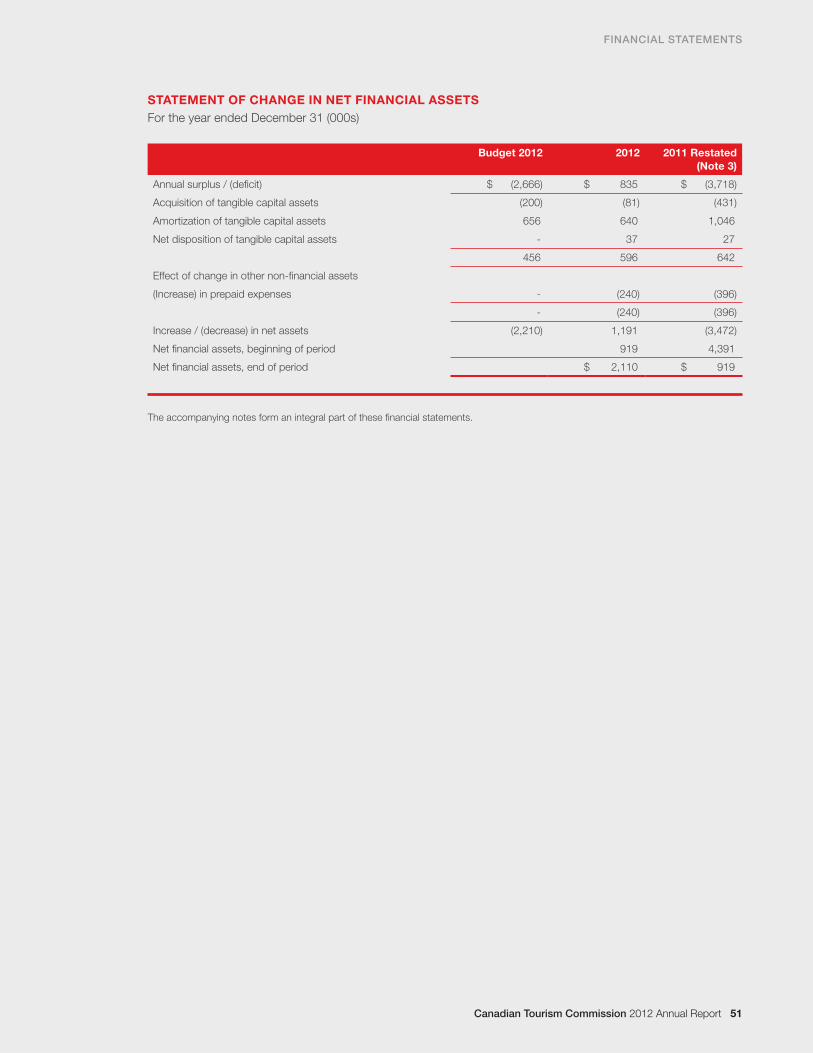
FINANCIAL STATEMENTS
Canadian Tourism Commission 2012 Annual Report 51
STATEMENT OF CHANGE IN NET FINANCIAL ASSETS
For the year ended December 31 (000s)
Budget 2012 2012 2011 Restated
(Note 3)
Annual surplus / (defi cit) $ (2,666) $ 835 $ (3,718)
Acquisition of tangible capital assets
Amortization of tangible capital assets
Net disposition of tangible capital assets
(200)
656
-
(81)
640
37
(431)
1,046
27
456 596 642
Effect of change in other non-fi nancial assets
(Increase) in prepaid expenses - (240) (396)
- (240) (396)
Increase / (decrease) in net assets (2,210) 1,191 (3,472)
Net fi nancial assets, beginning of period 919 4,391
Net fi nancial assets, end of period $ 2,110 $ 919
The accompanying notes form an integral part of these fi nancial statements.
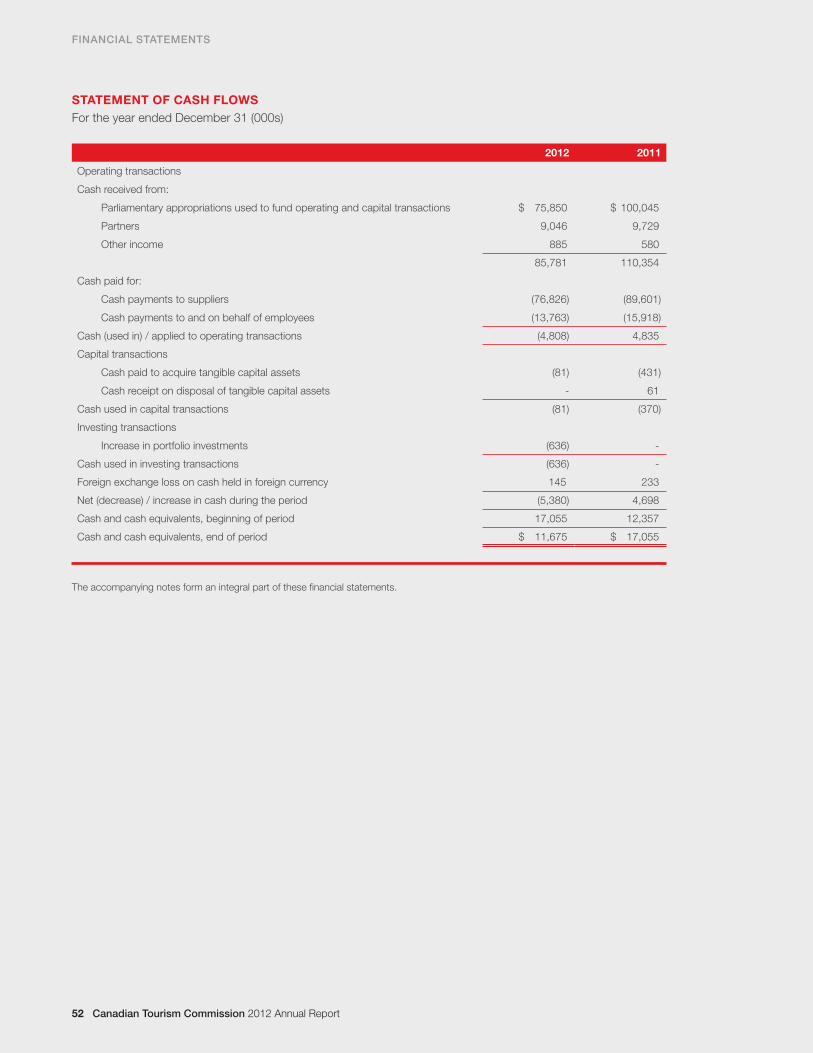
52 Canadian Tourism Commission 2012 Annual Report52 Canadian Tourism Commission 2012 Annual Report
STATEMENT OF CASH FLOWS
For the year ended December 31 (000s)
2012 2011
Operating transactions
Cash received from:
Parliamentary appropriations used to fund operating and capital transactions
Partners
Other income
$ 75,850
9,046
885
$ 100,045
9,729
580
85,781 110,354
Cash paid for:
Cash payments to suppliers
Cash payments to and on behalf of employees
(76,826)
(13,763)
(89,601)
(15,918)
Cash (used in) / applied to operating transactions (4,808) 4,835
Capital transactions
Cash paid to acquire tangible capital assets
Cash receipt on disposal of tangible capital assets
(81)
-
(431)
61
Cash used in capital transactions (81) (370)
Investing transactions
Increase in portfolio investments (636) -
Cash used in investing transactions (636) -
Foreign exchange loss on cash held in foreign currency 145 233
Net (decrease) / increase in cash during the period (5,380) 4,698
Cash and cash equivalents, beginning of period 17,055 12,357
Cash and cash equivalents, end of period $ 11,675 $ 17,055
The accompanying notes form an integral part of these fi nancial statements.
FINANCIAL STATEMENTS
52 Canadian Tourism Commission 2012 Annual Report
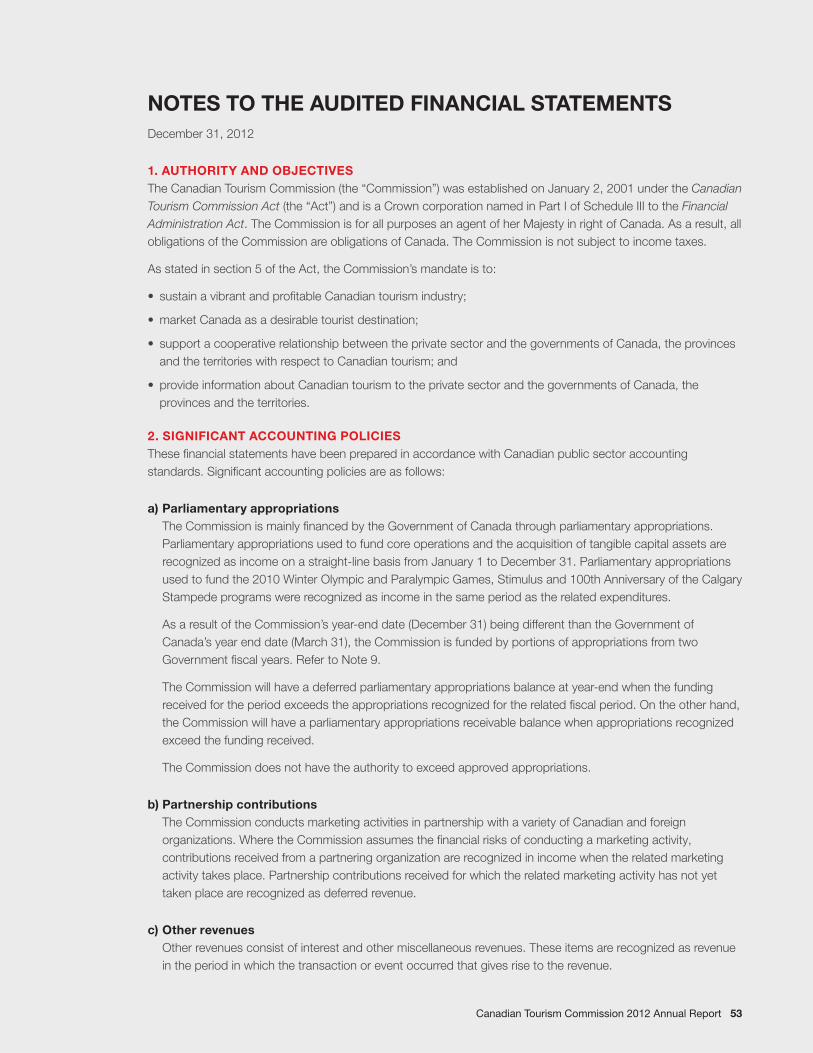
Canadian Tourism Commission 2012 Annual Report 53
NOTES TO THE AUDITED FINANCIAL STATEMENTS
December 31, 2012
1. AUTHORITY AND OBJECTIVES
The Canadian Tourism Commission (the “Commission”) was established on January 2, 2001 under the Canadian
Tourism Commission Act (the “Act”) and is a Crown corporation named in Part I of Schedule III to the Financial
Administration Act. The Commission is for all purposes an agent of her Majesty in right of Canada. As a result, all
obligations of the Commission are obligations of Canada. The Commission is not subject to income taxes.
As stated in section 5 of the Act, the Commission’s mandate is to:
• sustain a vibrant and profi table Canadian tourism industry;
• market Canada as a desirable tourist destination;
• support a cooperative relationship between the private sector and the governments of Canada, the provinces
and the territories with respect to Canadian tourism; and
• provide information about Canadian tourism to the private sector and the governments of Canada, the
provinces and the territories.
2. SIGNIFICANT ACCOUNTING POLICIES
These fi nancial statements have been prepared in accordance with Canadian public sector accounting
standards. Signifi cant accounting policies are as follows:
a) Parliamentary appropriations
The Commission is mainly fi nanced by the Government of Canada through parliamentary appropriations.
Parliamentary appropriations used to fund core operations and the acquisition of tangible capital assets are
recognized as income on a straight-line basis from January 1 to December 31. Parliamentary appropriations
used to fund the 2010 Winter Olympic and Paralympic Games, Stimulus and 100th Anniversary of the Calgary
Stampede programs were recognized as income in the same period as the related expenditures.
As a result of the Commission’s year-end date (December 31) being different than the Government of
Canada’s year end date (March 31), the Commission is funded by portions of appropriations from two
Government fi scal years. Refer to Note 9.
The Commission will have a deferred parliamentary appropriations balance at year-end when the funding
received for the period exceeds the appropriations recognized for the related fi scal period. On the other hand,
the Commission will have a parliamentary appropriations receivable balance when appropriations recognized
exceed the funding received.
The Commission does not have the authority to exceed approved appropriations.
b) Partnership contributions
The Commission conducts marketing activities in partnership with a variety of Canadian and foreign
organizations. Where the Commission assumes the fi nancial risks of conducting a marketing activity,
contributions received from a partnering organization are recognized in income when the related marketing
activity takes place. Partnership contributions received for which the related marketing activity has not yet
taken place are recognized as deferred revenue.
c) Other revenues
Other revenues consist of interest and other miscellaneous revenues. These items are recognized as revenue
in the period in which the transaction or event occurred that gives rise to the revenue.
Canadian Tourism Commission 2012 Annual Report 53

54 Canadian Tourism Commission 2012 Annual Report
NOTES TO THE AUDITED FINANCIAL STATEMENTS
December 31, 2012
54 Canadian Tourism Commission 2012 Annual Report
d) Foreign currency translation
Monetary assets and monetary liabilities denominated in foreign currencies are translated into Canadian
dollars at the applicable year-end exchange rate. Non-monetary assets and non-monetary liabilities
denominated in foreign currencies are translated into Canadian dollars at historical exchange rates. Revenue
and expense items are translated during the year at the exchange rate in effect on the date of the transaction.
Amortization expenses of tangible capital assets are translated at historical rates to which the assets
relate. Translation gains and losses are reported in expenses for the year under “Corporate services”. The
Commission does not hedge against the risk of foreign currency fl uctuations.
e) Portfolio investments
Portfolio investments are measured at cost. Interest income related to these investments is calculated based
on the effective interest rate method.
f) Prepaid expenses
Prepaid expenses consists of program and operating expenses recognized as an expense based on the term
of usage for items such as subscriptions or based on the event date of tradeshows.
g) Tangible capital assets
Tangible capital assets are recorded at cost less accumulated amortization and the amount of any write-
downs or disposals. Tangible capital assets are amortized on a straight-line basis over the estimated useful life
of the assets as follows:
Leasehold improvements Remaining term of lease
Offi ce furniture 5 years
Computer hardware 3 years
Computer software 5 years
Intangible assets are not recognized in these fi nancial statements.
h) Deferred revenue
Deferred revenue consists of deferred revenues from partnering organizations and deferred leasehold
inducements. The deferred revenues relating to partnering organizations are recognized as revenues based
on the event’s date or over the license period. The deferred revenues relating to leasehold inducements are
recognized as revenue over the term of the lease.
i) Asset retirement obligation
Asset retirement obligation consists of decommissioning costs for various offi ce leases. The Commission
recognized asset retirement obligations as a result of legal obligations to restore leased offi ce spaces back
to their original states at the end of the lease term. Asset retirement obligations are measured initially at
fair value, based on management’s best estimates, with the resulting amount capitalized into the carrying
amount of the related asset. The capitalized asset retirement cost is included in leasehold improvements and
amortized on the same basis as the related asset. The amortization expense is included in determining the net
cost of operations. Refer to Note 7.
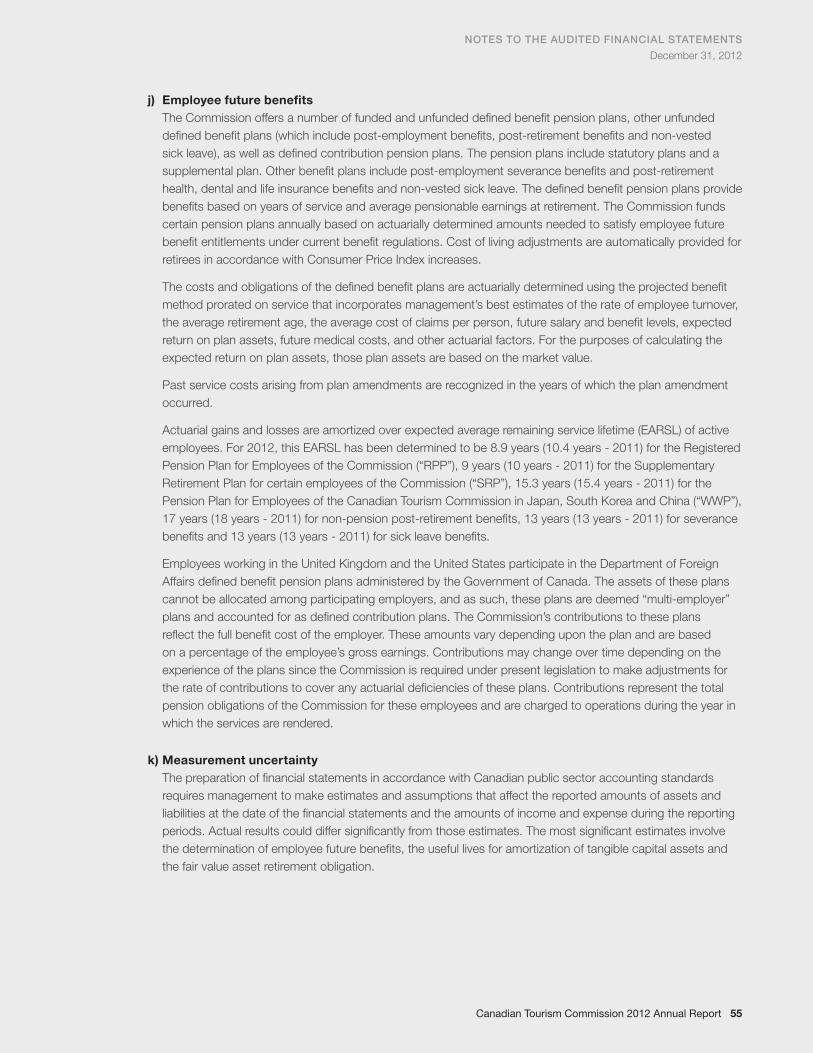
NOTES TO THE AUDITED FINANCIAL STATEMENTS
December 31, 2012
Canadian Tourism Commission 2012 Annual Report 55
j) Employee future benefi ts
The Commission offers a number of funded and unfunded defi ned benefi t pension plans, other unfunded
defi ned benefi t plans (which include post-employment benefi ts, post-retirement benefi ts and non-vested
sick leave), as well as defi ned contribution pension plans. The pension plans include statutory plans and a
supplemental plan. Other benefi t plans include post-employment severance benefi ts and post-retirement
health, dental and life insurance benefi ts and non-vested sick leave. The defi ned benefi t pension plans provide
benefi ts based on years of service and average pensionable earnings at retirement. The Commission funds
certain pension plans annually based on actuarially determined amounts needed to satisfy employee future
benefi t entitlements under current benefi t regulations. Cost of living adjustments are automatically provided for
retirees in accordance with Consumer Price Index increases.
The costs and obligations of the defi ned benefi t plans are actuarially determined using the projected benefi t
method prorated on service that incorporates management’s best estimates of the rate of employee turnover,
the average retirement age, the average cost of claims per person, future salary and benefi t levels, expected
return on plan assets, future medical costs, and other actuarial factors. For the purposes of calculating the
expected return on plan assets, those plan assets are based on the market value.
Past service costs arising from plan amendments are recognized in the years of which the plan amendment
occurred.
Actuarial gains and losses are amortized over expected average remaining service lifetime (EARSL) of active
employees. For 2012, this EARSL has been determined to be 8.9 years (10.4 years - 2011) for the Registered
Pension Plan for Employees of the Commission (“RPP”), 9 years (10 years - 2011) for the Supplementary
Retirement Plan for certain employees of the Commission (“SRP”), 15.3 years (15.4 years - 2011) for the
Pension Plan for Employees of the Canadian Tourism Commission in Japan, South Korea and China (“WWP”),
17 years (18 years - 2011) for non-pension post-retirement benefi ts, 13 years (13 years - 2011) for severance
benefi ts and 13 years (13 years - 2011) for sick leave benefi ts.
Employees working in the United Kingdom and the United States participate in the Department of Foreign
Affairs defi ned benefi t pension plans administered by the Government of Canada. The assets of these plans
cannot be allocated among participating employers, and as such, these plans are deemed “multi-employer”
plans and accounted for as defi ned contribution plans. The Commission’s contributions to these plans
refl ect the full benefi t cost of the employer. These amounts vary depending upon the plan and are based
on a percentage of the employee’s gross earnings. Contributions may change over time depending on the
experience of the plans since the Commission is required under present legislation to make adjustments for
the rate of contributions to cover any actuarial defi ciencies of these plans. Contributions represent the total
pension obligations of the Commission for these employees and are charged to operations during the year in
which the services are rendered.
k) Measurement uncertainty
The preparation of fi nancial statements in accordance with Canadian public sector accounting standards
requires management to make estimates and assumptions that affect the reported amounts of assets and
liabilities at the date of the fi nancial statements and the amounts of income and expense during the reporting
periods. Actual results could differ signifi cantly from those estimates. The most signifi cant estimates involve
the determination of employee future benefi ts, the useful lives for amortization of tangible capital assets and
the fair value asset retirement obligation.
56 Canadian Tourism Commission 2012 Annual Report
NOTES TO THE AUDITED FINANCIAL STATEMENTS
December 31, 2012
56 Canadian Tourism Commission 2012 Annual Report
l) Future accounting changes
PS 3410 Government Transfers
In March 2011, PS 3410 Government Transfers was revised and applies to fi scal periods beginning on or
after April 1, 2012. The Commission will adopt the revisions to this section effective January 1, 2013. The
Commission is assessing the fi nancial impact upon adoption.
PS 1201 Financial Statement Presentation, PS 2601 Foreign Currency Translation, PS 3041 Portfolio
Investments and PS 3450 Financial Instruments
These sections are all to be adopted in entirety effective fi scal years beginning on or after April 1, 2012. The
Commission will adopt the applicable standards for the fi scal year beginning January 1, 2013.
Based on the existing operations, the fi nancial statement impact in 2013 would be limited to the disclosure
of remeasurement gains/losses for any realized and unrealized foreign exchange gains and losses on a new
fi nancial statement called the Statement of Remeasurement Gains and Losses.
3. RESTATEMENT OF PRIOR PERIOD COMPARATIVE FINANCIAL STATEMENTS
While undergoing the actuarial valuation of the Non-Pension Post-Retirement benefi ts, the following items were
identifi ed:
• Post-retirement health, dental and life insurance benefi ts provided to locally engaged staff working in the US
had not been recorded in the previously issued fi nancial statements for the year ended December 31, 2011.
The correction of this error has been applied retrospectively by restating the prior period results.
• Some Canadian employees are ineligible for post-retirement health benefi ts and the benefi ts should not have
been recorded in the previously issued fi nancial statements for the year ended December 31, 2011. The
correction of this error has been applied retrospectively by restating the prior period results.
As a result of these changes (000s):
• The Accrued benefi t liability increased by $1,681 at December 31, 2011.
• Marketing and sales expense decreased by $28 at December 31, 2011.
• Corporate services expense decreased by $106 at December 31, 2011.
• The opening accumulated surplus recorded at January 1, 2011 decreased by $1,815.
• The closing accumulated surplus recorded at December 31, 2011 decreased by $1,681.
4. CASH AND CASH EQUIVALENTS
Cash equivalents consist of a money market term deposit purchased on April 17, 2012.
5. PORTFOLIO INVESTMENTS
The Commission holds portfolio investments consisting of Provincial Governmental bonds purchased on April
17, 2012 with maturity dates staggered between 2013 and 2031.
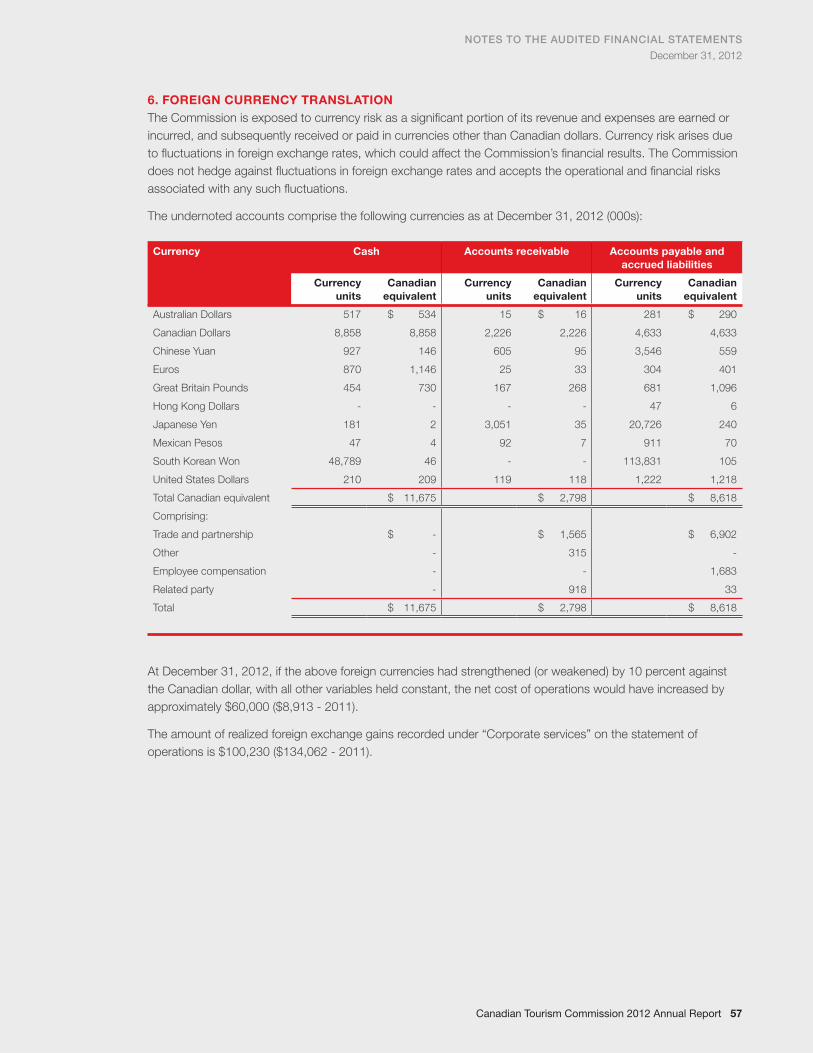
NOTES TO THE AUDITED FINANCIAL STATEMENTS
December 31, 2012
Canadian Tourism Commission 2012 Annual Report 57
6. FOREIGN CURRENCY TRANSLATION
The Commission is exposed to currency risk as a signifi cant portion of its revenue and expenses are earned or
incurred, and subsequently received or paid in currencies other than Canadian dollars. Currency risk arises due
to fl uctuations in foreign exchange rates, which could affect the Commission’s fi nancial results. The Commission
does not hedge against fl uctuations in foreign exchange rates and accepts the operational and fi nancial risks
associated with any such fl uctuations.
The undernoted accounts comprise the following currencies as at December 31, 2012 (000s):
Currency Cash Accounts receivable Accounts payable and
accrued liabilities
Currency
units
Canadian
equivalent
Currency
units
Canadian
equivalent
Currency
units
Canadian
equivalent
Australian Dollars
Canadian Dollars
Chinese Yuan
Euros
Great Britain Pounds
Hong Kong Dollars
Japanese Yen
Mexican Pesos
South Korean Won
United States Dollars
517
8,858
927
870
454
-
181
47
48,789
210
$ 534
8,858
146
1,146
730
-
2
4
46
209
15
2,226
605
25
167
-
3,051
92
-
119
$ 16
2,226
95
33
268
-
35
7
-
118
281
4,633
3,546
304
681
47
20,726
911
113,831
1,222
$ 290
4,633
559
401
1,096
6
240
70
105
1,218
Total Canadian equivalent $ 11,675 $ 2,798 $ 8,618
Comprising:
Trade and partnership
Other
Employee compensation
Related party
$ -
-
-
-
$ 1,565
315
-
918
$ 6,902
-
1,683
33
Total $ 11,675 $ 2,798 $ 8,618
At December 31, 2012, if the above foreign currencies had strengthened (or weakened) by 10 percent against
the Canadian dollar, with all other variables held constant, the net cost of operations would have increased by
approximately $60,000 ($8,913 - 2011).
The amount of realized foreign exchange gains recorded under “Corporate services” on the statement of
operations is $100,230 ($134,062 - 2011).
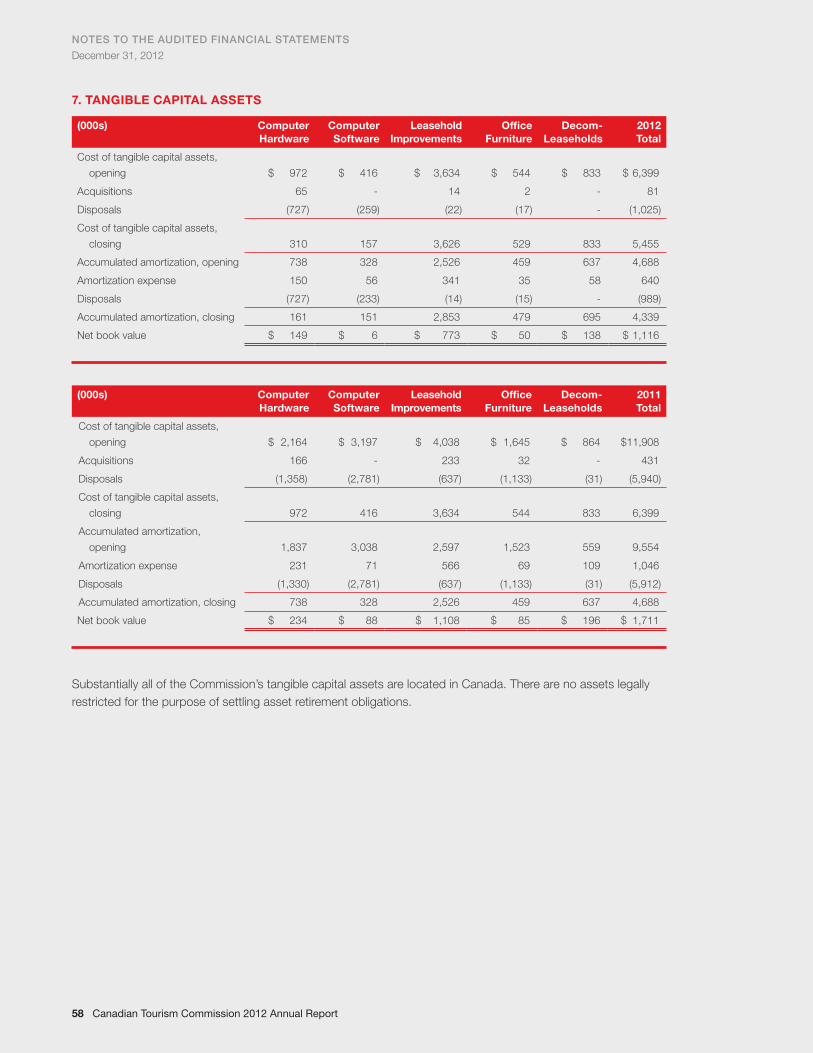
58 Canadian Tourism Commission 2012 Annual Report
NOTES TO THE AUDITED FINANCIAL STATEMENTS
December 31, 2012
58 Canadian Tourism Commission 2012 Annual Report
7. TANGIBLE CAPITAL ASSETS
(000s) Computer
Hardware
Computer
Software
Leasehold
Improvements
Offi ce
Furniture
Decom-
Leaseholds
2012
Total
Cost of tangible capital assets,
opening
Acquisitions
Disposals
$ 972
65
(727)
$ 416
-
(259)
$ 3,634
14
(22)
$ 544
2
(17)
$ 833
-
-
$ 6,399
81
(1,025)
Cost of tangible capital assets,
closing 310 157 3,626 529 833 5,455
Accumulated amortization, opening
Amortization expense
Disposals
738
150
(727)
328
56
(233)
2,526
341
(14)
459
35
(15)
637
58
-
4,688
640
(989)
Accumulated amortization, closing 161 151 2,853 479 695 4,339
Net book value $ 149 $ 6 $ 773 $ 50 $ 138 $ 1,116
(000s) Computer
Hardware
Computer
Software
Leasehold
Improvements
Offi ce
Furniture
Decom-
Leaseholds
2011
Total
Cost of tangible capital assets,
opening
Acquisitions
Disposals
$ 2,164
166
(1,358)
$ 3,197
-
(2,781)
$ 4,038
233
(637)
$ 1,645
32
(1,133)
$ 864
-
(31)
$ 11,908
431
(5,940)
Cost of tangible capital assets,
closing 972 416 3,634 544 833 6,399
Accumulated amortization,
opening
Amortization expense
Disposals
1,837
231
(1,330)
3,038
71
(2,781)
2,597
566
(637)
1,523
69
(1,133)
559
109
(31)
9,554
1,046
(5,912)
Accumulated amortization, closing 738 328 2,526 459 637 4,688
Net book value $ 234 $ 88 $ 1,108 $ 85 $ 196 $ 1,711
Substantially all of the Commission’s tangible capital assets are located in Canada. There are no assets legally
restricted for the purpose of settling asset retirement obligations.
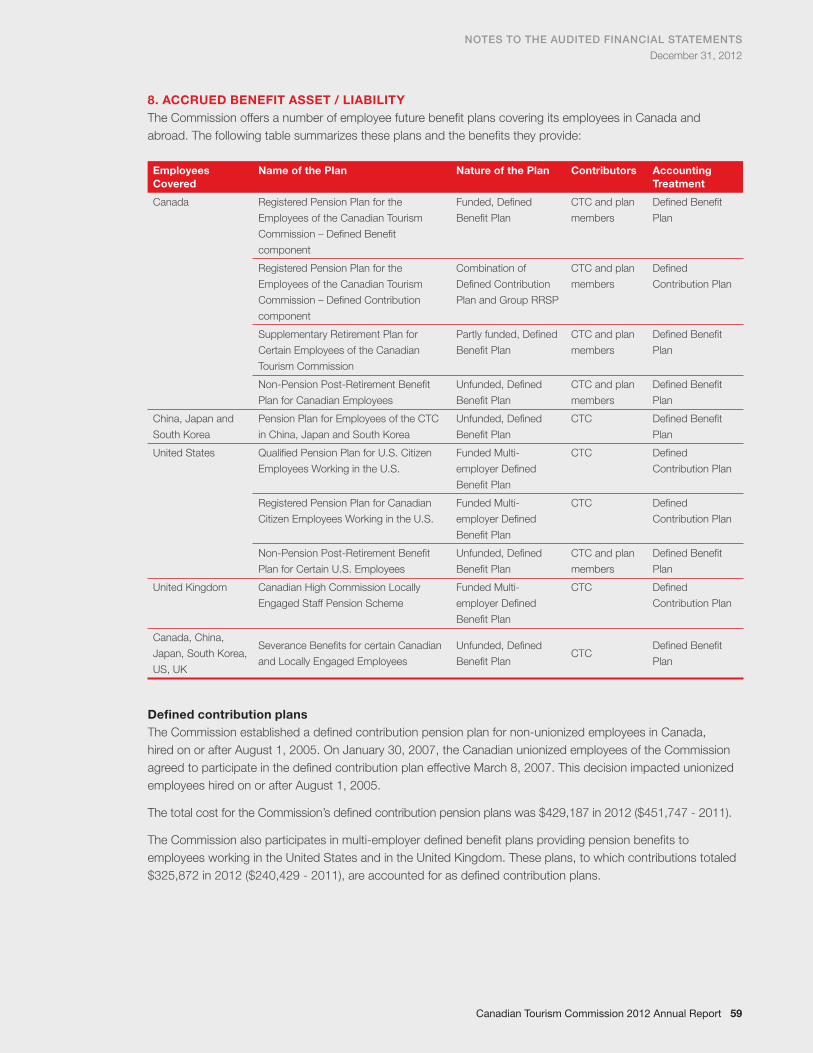
NOTES TO THE AUDITED FINANCIAL STATEMENTS
December 31, 2012
Canadian Tourism Commission 2012 Annual Report 59
8. ACCRUED BENEFIT ASSET / LIABILITY
The Commission offers a number of employee future benefi t plans covering its employees in Canada and
abroad. The following table summarizes these plans and the benefi ts they provide:
Employees
Covered
Name of the Plan Nature of the Plan Contributors Accounting
Treatment
Canada Registered Pension Plan for the
Employees of the Canadian Tourism
Commission – Defi ned Benefi t
component
Funded, Defi ned
Benefi t Plan
CTC and plan
members
Defi ned Benefi t
Plan
Registered Pension Plan for the
Employees of the Canadian Tourism
Commission – Defi ned Contribution
component
Combination of
Defi ned Contribution
Plan and Group RRSP
CTC and plan
members
Defi ned
Contribution Plan
Supplementary Retirement Plan for
Certain Employees of the Canadian
Tourism Commission
Partly funded, Defi ned
Benefi t Plan
CTC and plan
members
Defi ned Benefi t
Plan
Non-Pension Post-Retirement Benefi t
Plan for Canadian Employees
Unfunded, Defi ned
Benefi t Plan
CTC and plan
members
Defi ned Benefi t
Plan
China, Japan and
South Korea
Pension Plan for Employees of the CTC
in China, Japan and South Korea
Unfunded, Defi ned
Benefi t Plan
CTC Defi ned Benefi t
Plan
United States Qualifi ed Pension Plan for U.S. Citizen
Employees Working in the U.S.
Funded Multi-
employer Defi ned
Benefi t Plan
CTC Defi ned
Contribution Plan
Registered Pension Plan for Canadian
Citizen Employees Working in the U.S.
Funded Multi-
employer Defi ned
Benefi t Plan
CTC Defi ned
Contribution Plan
Non-Pension Post-Retirement Benefi t
Plan for Certain U.S. Employees
Unfunded, Defi ned
Benefi t Plan
CTC and plan
members
Defi ned Benefi t
Plan
United Kingdom Canadian High Commission Locally
Engaged Staff Pension Scheme
Funded Multi-
employer Defi ned
Benefi t Plan
CTC Defi ned
Contribution Plan
Canada, China,
Japan, South Korea,
US, UK
Severance Benefi ts for certain Canadian
and Locally Engaged Employees
Unfunded, Defi ned
Benefi t PlanCTC
Defi ned Benefi t
Plan
Defi ned contribution plans
The Commission established a defi ned contribution pension plan for non-unionized employees in Canada,
hired on or after August 1, 2005. On January 30, 2007, the Canadian unionized employees of the Commission
agreed to participate in the defi ned contribution plan effective March 8, 2007. This decision impacted unionized
employees hired on or after August 1, 2005.
The total cost for the Commission’s defi ned contribution pension plans was $429,187 in 2012 ($451,747 - 2011).
The Commission also participates in multi-employer defi ned benefi t plans providing pension benefi ts to
employees working in the United States and in the United Kingdom. These plans, to which contributions totaled
$325,872 in 2012 ($240,429 - 2011), are accounted for as defi ned contribution plans.
60 Canadian Tourism Commission 2012 Annual Report
NOTES TO THE AUDITED FINANCIAL STATEMENTS
December 31, 2012
60 Canadian Tourism Commission 2012 Annual Report
Defi ned benefi t plans
Canada
The Commission has a number of defi ned benefi t plans in Canada, which provide post-retirement and post-
employment benefi ts to its employees.
Effective January 2, 2004, pension arrangements include a registered pension plan as well as a supplemental
arrangement, which provides pension benefi ts in excess of statutory limits. The Commission provides pension
benefi ts based on employees’ years of service and average earnings at the time of retirement. The registered
pension plan is funded by contributions from the Commission and from the members. In accordance with
pension legislation, the Commission contributes amounts determined on an actuarial basis and has the ultimate
responsibility for ensuring that the liabilities of the plan are adequately funded over time. The supplemental
retirement plan liabilities arising on and after January 2, 2004 are funded on a pay-as-you-go basis.
Post-retirement benefi ts include health, dental and life insurance benefi ts. The cost of these benefi ts is paid for
by the Commission and the retirees.
Abroad
The Commission has a number of defi ned benefi t plans for its locally engaged staff outside of Canada, which
provide pension and severance benefi ts. The Commission provides retirement benefi ts based on employees’
years of service and average earnings at the time of retirement. In accordance with pension legislation, the
Commission contributes amounts determined on an actuarial basis to the plan and has the ultimate responsibility
for ensuring that the liabilities of the plan (as they pertain to its employees) are adequately funded over time.
Transfer of pension benefi t obligation from Treasury Board Secretariat
In March 2012, the Commission received $1.0 million from Treasury Board Secretariat (“TBS”) relating to locally
engaged staff pension benefi ts under the Pension Scheme for Employees of the Government of Canada Locally-
Engaged Outside Canada, 1996 for service prior to January 2, 2001. Prior to this, TBS had been reimbursing
the Commission for amounts related to the past service period. The funds are held by the Commission in bonds
and money market funds and are recorded as Portfolio investments and Cash and cash equivalents.
In 2012, the year of the transfer, the Commission has recorded $886,500 in past service costs related to the
pension obligation transferred from TBS. The liability related to the pension obligation is now refl ected in the
Commission’s fi nancial statements. The Commission continues to be responsible for the service accruing on and
after January 2, 2001.
Severance benefi ts
Severance benefi ts are provided for certain current employees in Canada, China, Japan, South Korea, United
States and United Kingdom. The cost of the benefi ts is fully paid by the Commission. These plans are unfunded.
Measurement date and date of actuarial valuation
The most recent actuarial valuation of the Canadian registered defi ned benefi t pension plan for funding purposes
was as at December 31, 2011. This report was required to be fi led with OSFI no later than June 30, 2012;
however, due to discussions with OSFI regarding the impact of the relief regulations (see below), this report was
fi led on February 19, 2013.
The going concern fi nancial position based on the most recent actuarial valuation showed a funding surplus
of $557,700 (surplus of $706,900 - 2011). The valuation also identifi ed an average solvency ratio of 80.7%
(85.5% - 2011).
Under normal circumstances, the Commission would be required to make special payments over the fi ve
years following the effective date of the valuation to eliminate any unfunded liability and any solvency shortfall.
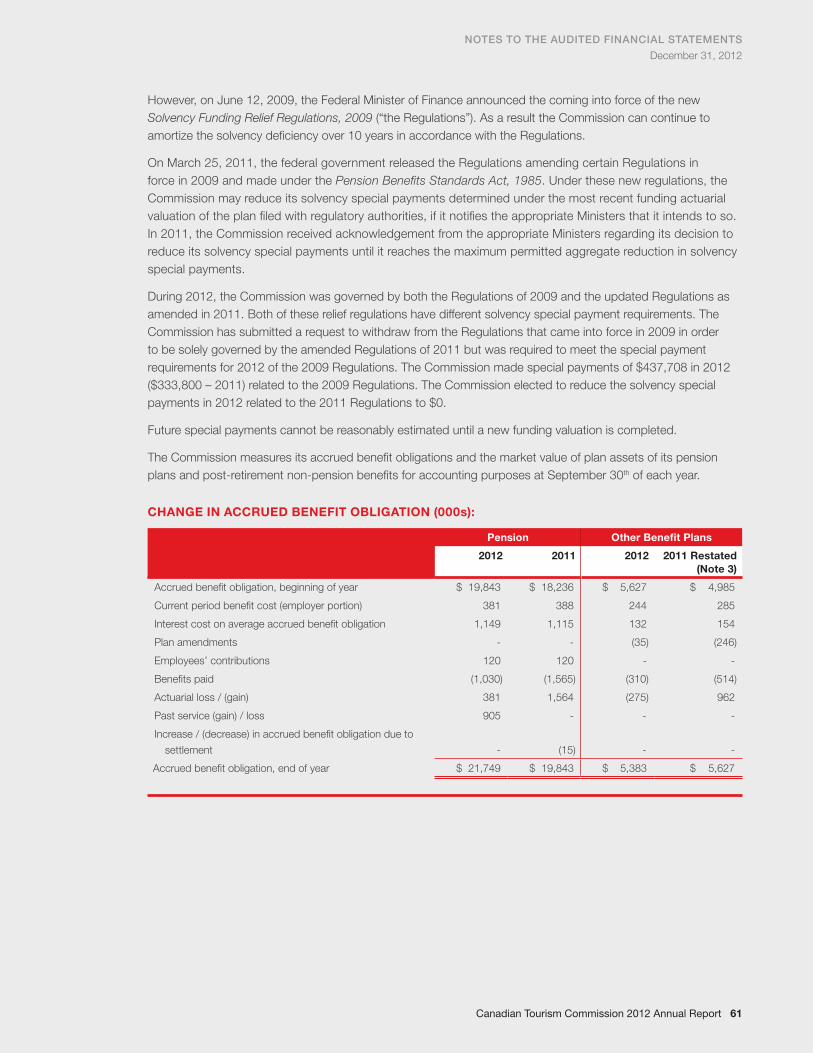
NOTES TO THE AUDITED FINANCIAL STATEMENTS
December 31, 2012
Canadian Tourism Commission 2012 Annual Report 61
However, on June 12, 2009, the Federal Minister of Finance announced the coming into force of the new
Solvency Funding Relief Regulations, 2009 (“the Regulations”). As a result the Commission can continue to
amortize the solvency defi ciency over 10 years in accordance with the Regulations.
On March 25, 2011, the federal government released the Regulations amending certain Regulations in
force in 2009 and made under the Pension Benefi ts Standards Act, 1985. Under these new regulations, the
Commission may reduce its solvency special payments determined under the most recent funding actuarial
valuation of the plan fi led with regulatory authorities, if it notifi es the appropriate Ministers that it intends to so.
In 2011, the Commission received acknowledgement from the appropriate Ministers regarding its decision to
reduce its solvency special payments until it reaches the maximum permitted aggregate reduction in solvency
special payments.
During 2012, the Commission was governed by both the Regulations of 2009 and the updated Regulations as
amended in 2011. Both of these relief regulations have different solvency special payment requirements. The
Commission has submitted a request to withdraw from the Regulations that came into force in 2009 in order
to be solely governed by the amended Regulations of 2011 but was required to meet the special payment
requirements for 2012 of the 2009 Regulations. The Commission made special payments of $437,708 in 2012
($333,800 – 2011) related to the 2009 Regulations. The Commission elected to reduce the solvency special
payments in 2012 related to the 2011 Regulations to $0.
Future special payments cannot be reasonably estimated until a new funding valuation is completed.
The Commission measures its accrued benefi t obligations and the market value of plan assets of its pension
plans and post-retirement non-pension benefi ts for accounting purposes at September 30th of each year.
CHANGE IN ACCRUED BENEFIT OBLIGATION (000s):
Pension Other Benefi t Plans
2012 2011 2012 2011 Restated
(Note 3)
Accrued benefi t obligation, beginning of year
Current period benefi t cost (employer portion)
Interest cost on average accrued benefi t obligation
Plan amendments
Employees’ contributions
Benefi ts paid
Actuarial loss / (gain)
Past service (gain) / loss
Increase / (decrease) in accrued benefi t obligation due to
settlement
$ 19,843
381
1,149
-
120
(1,030)
381
905
-
$ 18,236
388
1,115
-
120
(1,565)
1,564
-
(15)
$ 5,627
244
132
(35)
-
(310)
(275)
-
-
$ 4,985
285
154
(246)
-
(514)
962
-
-
Accrued benefi t obligation, end of year $ 21,749 $ 19,843 $ 5,383 $ 5,627
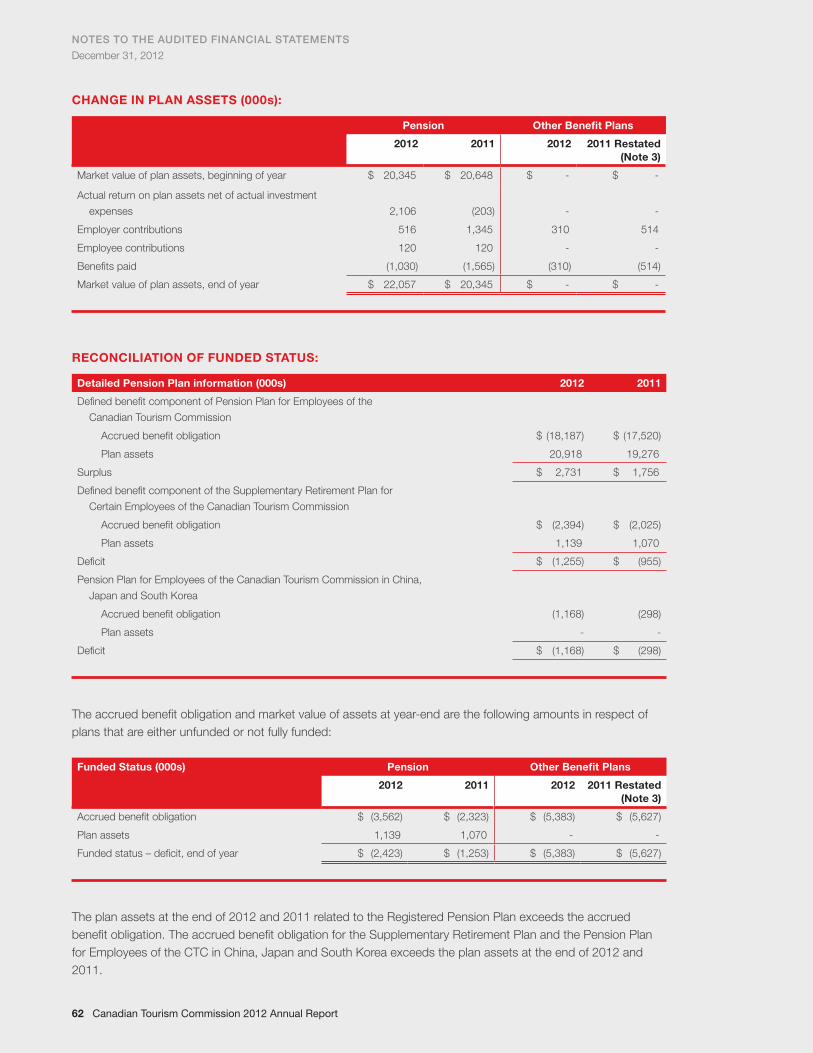
62 Canadian Tourism Commission 2012 Annual Report
NOTES TO THE AUDITED FINANCIAL STATEMENTS
December 31, 2012
62 Canadian Tourism Commission 2012 Annual Report
CHANGE IN PLAN ASSETS (000s):
Pension Other Benefi t Plans
2012 2011 2012 2011 Restated
(Note 3)
Market value of plan assets, beginning of year $ 20,345 $ 20,648 $ - $ -
Actual return on plan assets net of actual investment
expenses
Employer contributions
Employee contributions
Benefi ts paid
2,106
516
120
(1,030)
(203)
1,345
120
(1,565)
-
310
-
(310)
-
514
-
(514)
Market value of plan assets, end of year $ 22,057 $ 20,345 $ - $ -
RECONCILIATION OF FUNDED STATUS:
Detailed Pension Plan information (000s) 2012 2011
Defi ned benefi t component of Pension Plan for Employees of the
Canadian Tourism Commission
Accrued benefi t obligation
Plan assets
$ (18,187)
20,918
$ (17,520)
19,276
Surplus $ 2,731 $ 1,756
Defi ned benefi t component of the Supplementary Retirement Plan for
Certain Employees of the Canadian Tourism Commission
Accrued benefi t obligation
Plan assets
$ (2,394)
1,139
$ (2,025)
1,070
Defi cit $ (1,255) $ (955)
Pension Plan for Employees of the Canadian Tourism Commission in China,
Japan and South Korea
Accrued benefi t obligation
Plan assets
(1,168)
-
(298)
-
Defi cit $ (1,168) $ (298)
The accrued benefi t obligation and market value of assets at year-end are the following amounts in respect of
plans that are either unfunded or not fully funded:
Funded Status (000s) Pension Other Benefi t Plans
2012 2011 2012 2011 Restated
(Note 3)
Accrued benefi t obligation
Plan assets
$ (3,562)
1,139
$ (2,323)
1,070
$ (5,383)
-
$ (5,627)
-
Funded status – defi cit, end of year $ (2,423) $ (1,253) $ (5,383) $ (5,627)
The plan assets at the end of 2012 and 2011 related to the Registered Pension Plan exceeds the accrued
benefi t obligation. The accrued benefi t obligation for the Supplementary Retirement Plan and the Pension Plan
for Employees of the CTC in China, Japan and South Korea exceeds the plan assets at the end of 2012 and
2011.
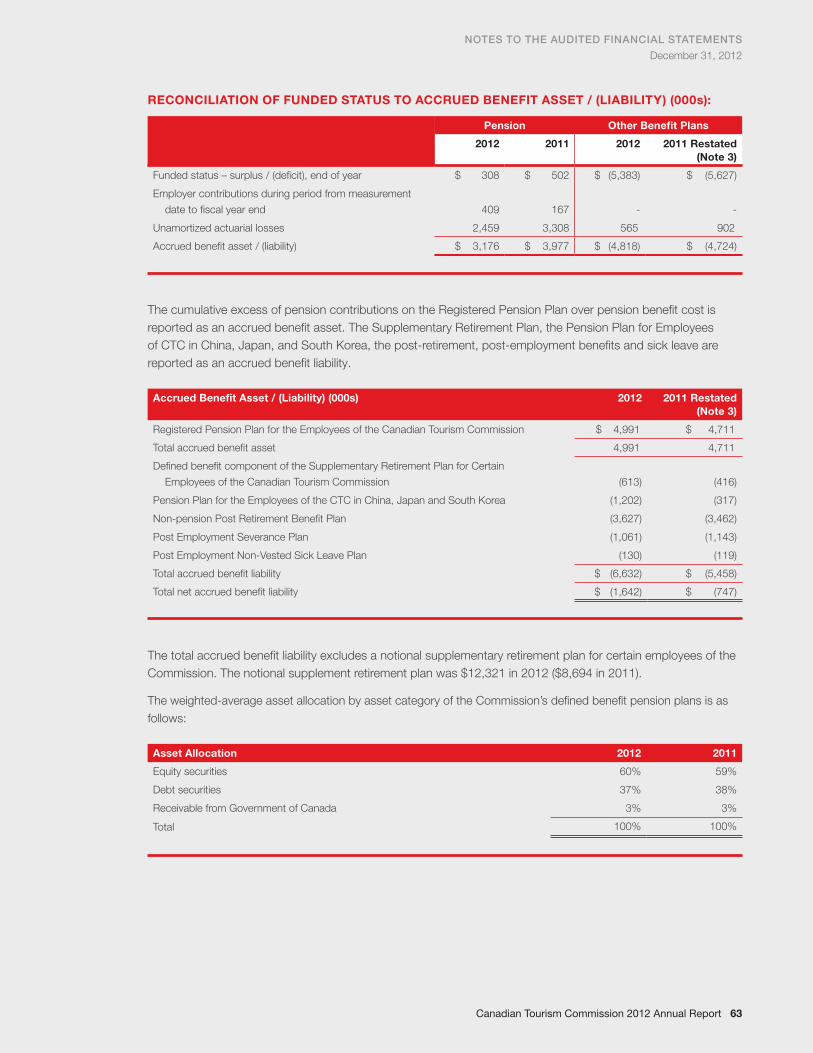
NOTES TO THE AUDITED FINANCIAL STATEMENTS
December 31, 2012
Canadian Tourism Commission 2012 Annual Report 63
RECONCILIATION OF FUNDED STATUS TO ACCRUED BENEFIT ASSET / (LIABILITY) (000s):
Pension Other Benefi t Plans
2012 2011 2012 2011 Restated
(Note 3)
Funded status – surplus / (defi cit), end of year
Employer contributions during period from measurement
date to fi scal year end
Unamortized actuarial losses
$ 308
409
2,459
$ 502
167
3,308
$ (5,383)
-
565
$ (5,627)
-
902
Accrued benefi t asset / (liability) $ 3,176 $ 3,977 $ (4,818) $ (4,724)
The cumulative excess of pension contributions on the Registered Pension Plan over pension benefi t cost is
reported as an accrued benefi t asset. The Supplementary Retirement Plan, the Pension Plan for Employees
of CTC in China, Japan, and South Korea, the post-retirement, post-employment benefi ts and sick leave are
reported as an accrued benefi t liability.
Accrued Benefi t Asset / (Liability) (000s) 2012 2011 Restated
(Note 3)
Registered Pension Plan for the Employees of the Canadian Tourism Commission $ 4,991 $ 4,711
Total accrued benefi t asset 4,991 4,711
Defi ned benefi t component of the Supplementary Retirement Plan for Certain
Employees of the Canadian Tourism Commission
Pension Plan for the Employees of the CTC in China, Japan and South Korea
Non-pension Post Retirement Benefi t Plan
Post Employment Severance Plan
Post Employment Non-Vested Sick Leave Plan
(613)
(1,202)
(3,627)
(1,061)
(130)
(416)
(317)
(3,462)
(1,143)
(119)
Total accrued benefi t liability $ (6,632) $ (5,458)
Total net accrued benefi t liability $ (1,642) $ (747)
The total accrued benefi t liability excludes a notional supplementary retirement plan for certain employees of the
Commission. The notional supplement retirement plan was $12,321 in 2012 ($8,694 in 2011).
The weighted-average asset allocation by asset category of the Commission’s defi ned benefi t pension plans is as
follows:
Asset Allocation 2012 2011
Equity securities
Debt securities
Receivable from Government of Canada
60%
37%
3%
59%
38%
3%
Total 100% 100%
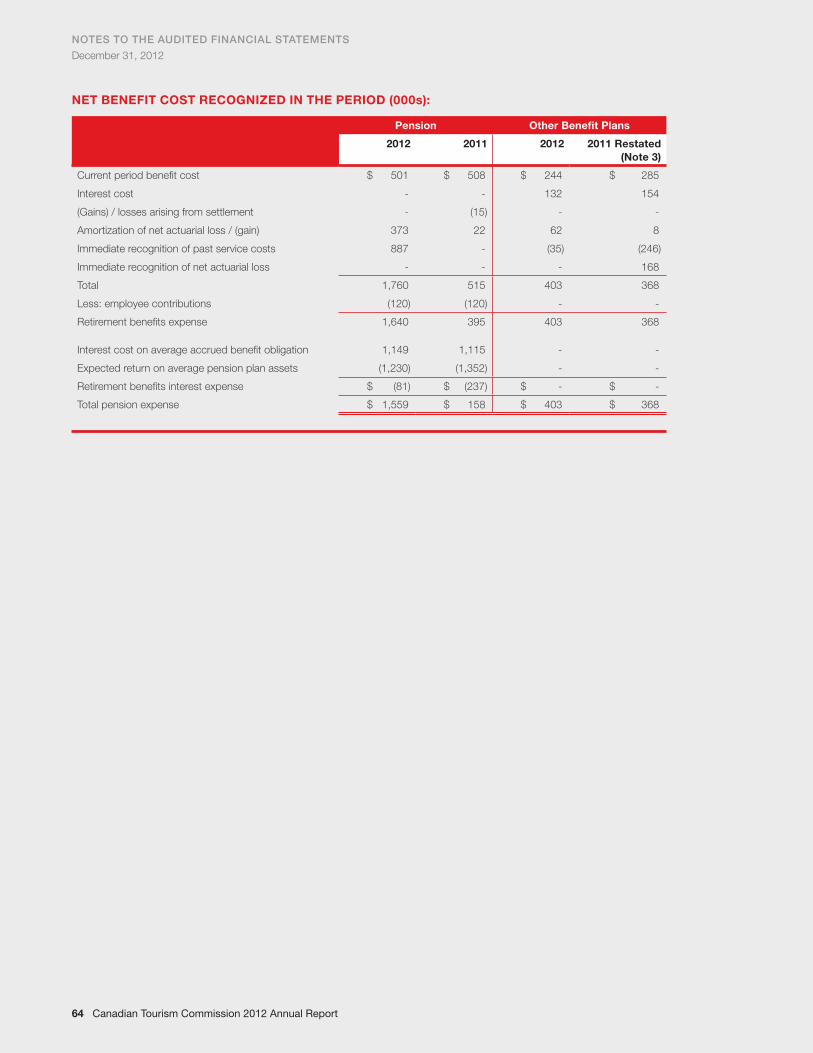
64 Canadian Tourism Commission 2012 Annual Report
NOTES TO THE AUDITED FINANCIAL STATEMENTS
December 31, 2012
64 Canadian Tourism Commission 2012 Annual Report
NET BENEFIT COST RECOGNIZED IN THE PERIOD (000s):
Pension Other Benefi t Plans
2012 2011 2012 2011 Restated
(Note 3)
Current period benefi t cost
Interest cost
(Gains) / losses arising from settlement
Amortization of net actuarial loss / (gain)
Immediate recognition of past service costs
Immediate recognition of net actuarial loss
$ 501
-
-
373
887
-
$ 508
-
(15)
22
-
-
$ 244
132
-
62
(35)
-
$ 285
154
-
8
(246)
168
Total
Less: employee contributions
1,760
(120)
515
(120)
403
-
368
-
Retirement benefi ts expense
Interest cost on average accrued benefi t obligation
Expected return on average pension plan assets
1,640
1,149
(1,230)
395
1,115
(1,352)
403
-
-
368
-
-
Retirement benefi ts interest expense $ (81) $ (237) $ - $ -
Total pension expense $ 1,559 $ 158 $ 403 $ 368
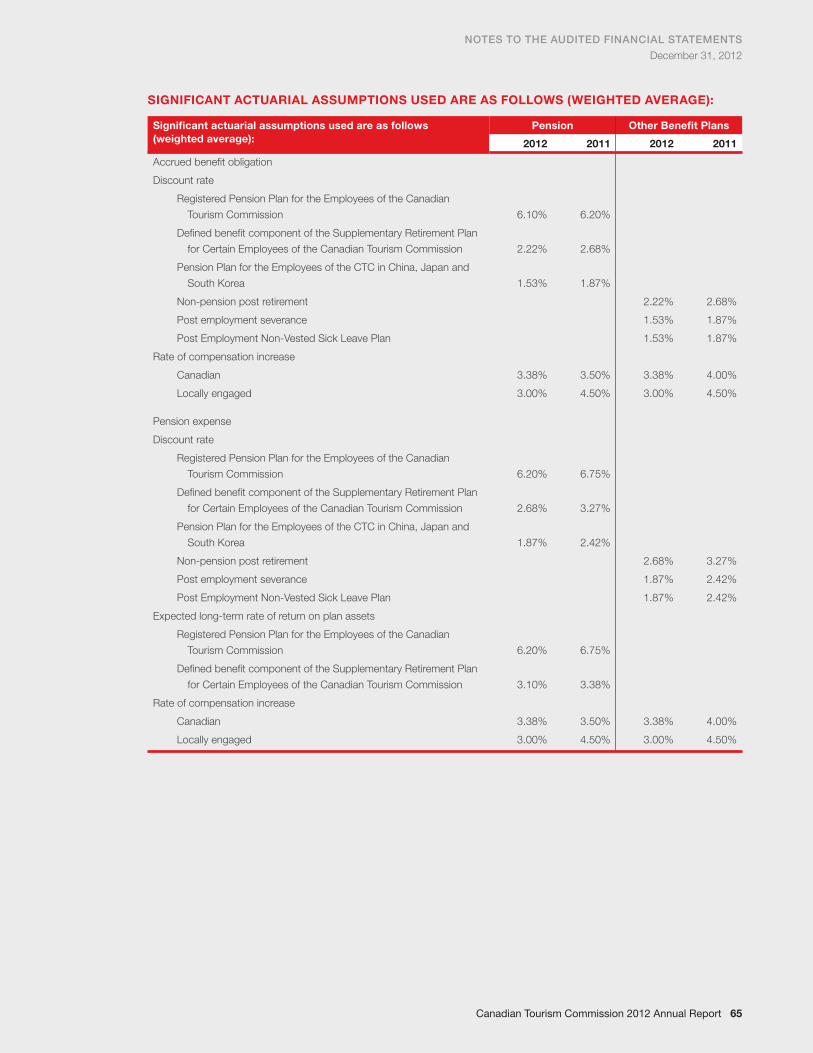
NOTES TO THE AUDITED FINANCIAL STATEMENTS
December 31, 2012
Canadian Tourism Commission 2012 Annual Report 65
SIGNIFICANT ACTUARIAL ASSUMPTIONS USED ARE AS FOLLOWS (WEIGHTED AVERAGE):
Signifi cant actuarial assumptions used are as follows
(weighted average):
Pension Other Benefi t Plans
2012 2011 2012 2011
Accrued benefi t obligation
Discount rate
Registered Pension Plan for the Employees of the Canadian
Tourism Commission
Defi ned benefi t component of the Supplementary Retirement Plan
for Certain Employees of the Canadian Tourism Commission
Pension Plan for the Employees of the CTC in China, Japan and
South Korea
Non-pension post retirement
Post employment severance
Post Employment Non-Vested Sick Leave Plan
Rate of compensation increase
Canadian
Locally engaged
Pension expense
Discount rate
Registered Pension Plan for the Employees of the Canadian
Tourism Commission
Defi ned benefi t component of the Supplementary Retirement Plan
for Certain Employees of the Canadian Tourism Commission
Pension Plan for the Employees of the CTC in China, Japan and
South Korea
Non-pension post retirement
Post employment severance
Post Employment Non-Vested Sick Leave Plan
Expected long-term rate of return on plan assets
Registered Pension Plan for the Employees of the Canadian
Tourism Commission
Defi ned benefi t component of the Supplementary Retirement Plan
for Certain Employees of the Canadian Tourism Commission
Rate of compensation increase
Canadian
Locally engaged
6.10%
2.22%
1.53%
3.38%
3.00%
6.20%
2.68%
1.87%
6.20%
3.10%
3.38%
3.00%
6.20%
2.68%
1.87%
3.50%
4.50%
6.75%
3.27%
2.42%
6.75%
3.38%
3.50%
4.50%
2.22%
1.53%
1.53%
3.38%
3.00%
2.68%
1.87%
1.87%
3.38%
3.00%
2.68%
1.87%
1.87%
4.00%
4.50%
3.27%
2.42%
2.42%
4.00%
4.50%
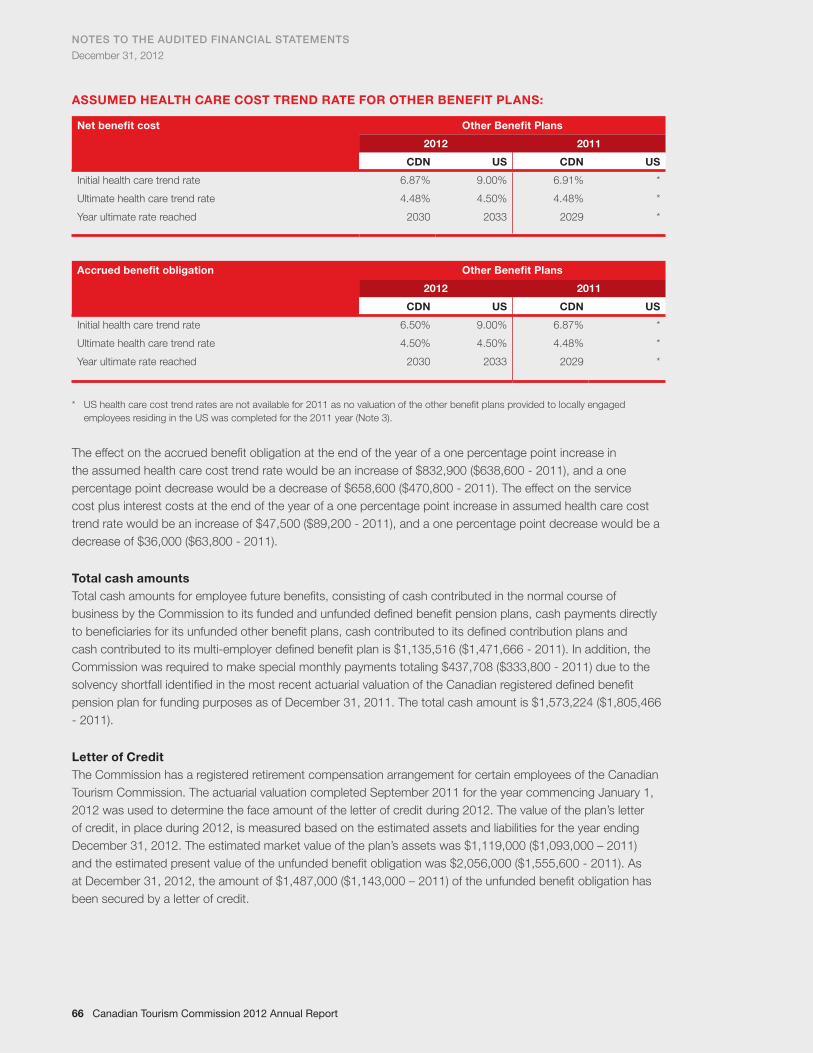
66 Canadian Tourism Commission 2012 Annual Report
NOTES TO THE AUDITED FINANCIAL STATEMENTS
December 31, 2012
66 Canadian Tourism Commission 2012 Annual Report
ASSUMED HEALTH CARE COST TREND RATE FOR OTHER BENEFIT PLANS:
Net benefi t cost Other Benefi t Plans
2012 2011
CDN US CDN US
Initial health care trend rate
Ultimate health care trend rate
Year ultimate rate reached
6.87%
4.48%
2030
9.00%
4.50%
2033
6.91%
4.48%
2029
*
*
*
Accrued benefi t obligation Other Benefi t Plans
2012 2011
CDN US CDN US
Initial health care trend rate
Ultimate health care trend rate
Year ultimate rate reached
6.50%
4.50%
2030
9.00%
4.50%
2033
6.87%
4.48%
2029
*
*
*
* US health care cost trend rates are not available for 2011 as no valuation of the other benefi t plans provided to locally engaged
employees residing in the US was completed for the 2011 year (Note 3).
The effect on the accrued benefi t obligation at the end of the year of a one percentage point increase in
the assumed health care cost trend rate would be an increase of $832,900 ($638,600 - 2011), and a one
percentage point decrease would be a decrease of $658,600 ($470,800 - 2011). The effect on the service
cost plus interest costs at the end of the year of a one percentage point increase in assumed health care cost
trend rate would be an increase of $47,500 ($89,200 - 2011), and a one percentage point decrease would be a
decrease of $36,000 ($63,800 - 2011).
Total cash amounts
Total cash amounts for employee future benefi ts, consisting of cash contributed in the normal course of
business by the Commission to its funded and unfunded defi ned benefi t pension plans, cash payments directly
to benefi ciaries for its unfunded other benefi t plans, cash contributed to its defi ned contribution plans and
cash contributed to its multi-employer defi ned benefi t plan is $1,135,516 ($1,471,666 - 2011). In addition, the
Commission was required to make special monthly payments totaling $437,708 ($333,800 - 2011) due to the
solvency shortfall identifi ed in the most recent actuarial valuation of the Canadian registered defi ned benefi t
pension plan for funding purposes as of December 31, 2011. The total cash amount is $1,573,224 ($1,805,466
- 2011).
Letter of Credit
The Commission has a registered retirement compensation arrangement for certain employees of the Canadian
Tourism Commission. The actuarial valuation completed September 2011 for the year commencing January 1,
2012 was used to determine the face amount of the letter of credit during 2012. The value of the plan’s letter
of credit, in place during 2012, is measured based on the estimated assets and liabilities for the year ending
December 31, 2012. The estimated market value of the plan’s assets was $1,119,000 ($1,093,000 – 2011)
and the estimated present value of the unfunded benefi t obligation was $2,056,000 ($1,555,600 - 2011). As
at December 31, 2012, the amount of $1,487,000 ($1,143,000 – 2011) of the unfunded benefi t obligation has
been secured by a letter of credit.
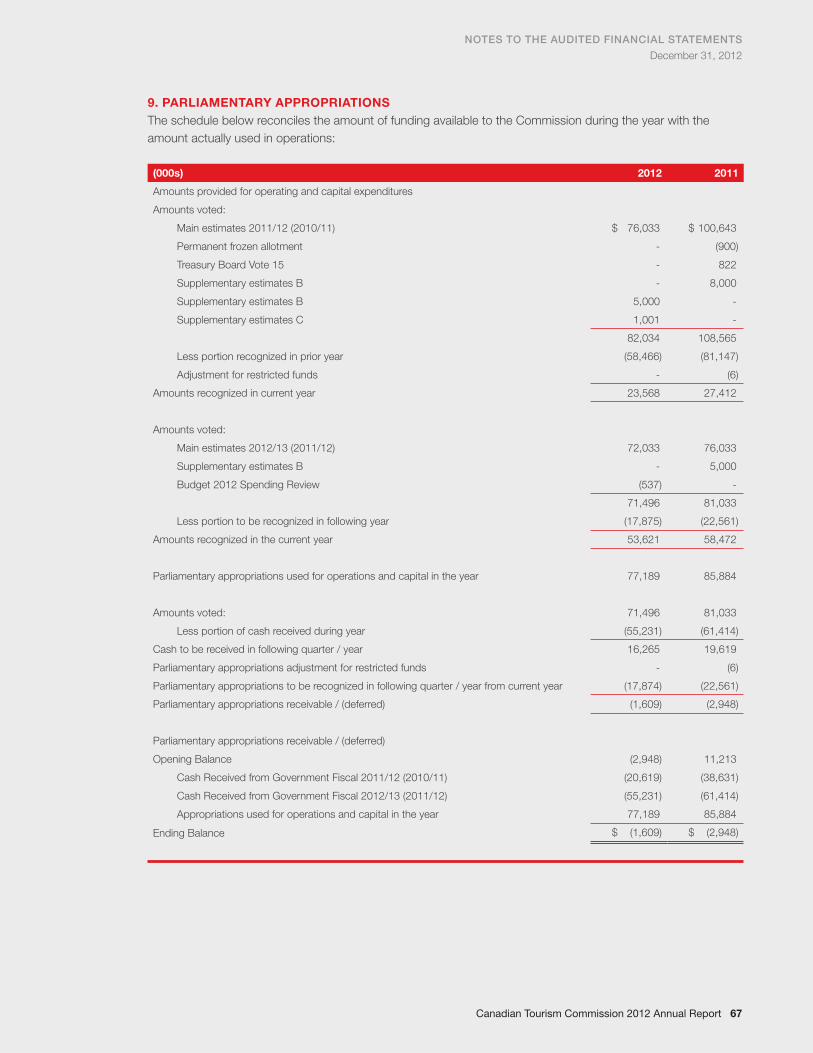
NOTES TO THE AUDITED FINANCIAL STATEMENTS
December 31, 2012
Canadian Tourism Commission 2012 Annual Report 67
9. PARLIAMENTARY APPROPRIATIONS
The schedule below reconciles the amount of funding available to the Commission during the year with the
amount actually used in operations:
(000s) 2012 2011
Amounts provided for operating and capital expenditures
Amounts voted:
Main estimates 2011/12 (2010/11)
Permanent frozen allotment
Treasury Board Vote 15
Supplementary estimates B
Supplementary estimates B
Supplementary estimates C
$ 76,033
-
-
-
5,000
1,001
$ 100,643
(900)
822
8,000
-
-
Less portion recognized in prior year
Adjustment for restricted funds
82,034
(58,466)
-
108,565
(81,147)
(6)
Amounts recognized in current year 23,568 27,412
Amounts voted:
Main estimates 2012/13 (2011/12)
Supplementary estimates B
Budget 2012 Spending Review
72,033
-
(537)
76,033
5,000
-
Less portion to be recognized in following year
71,496
(17,875)
81,033
(22,561)
Amounts recognized in the current year 53,621 58,472
Parliamentary appropriations used for operations and capital in the year 77,189 85,884
Amounts voted:
Less portion of cash received during year
71,496
(55,231)
81,033
(61,414)
Cash to be received in following quarter / year
Parliamentary appropriations adjustment for restricted funds
Parliamentary appropriations to be recognized in following quarter / year from current year
16,265
-
(17,874)
19,619
(6)
(22,561)
Parliamentary appropriations receivable / (deferred) (1,609) (2,948)
Parliamentary appropriations receivable / (deferred)
Opening Balance
Cash Received from Government Fiscal 2011/12 (2010/11)
Cash Received from Government Fiscal 2012/13 (2011/12)
Appropriations used for operations and capital in the year
(2,948)
(20,619)
(55,231)
77,189
11,213
(38,631)
(61,414)
85,884
Ending Balance $ (1,609) $ (2,948)
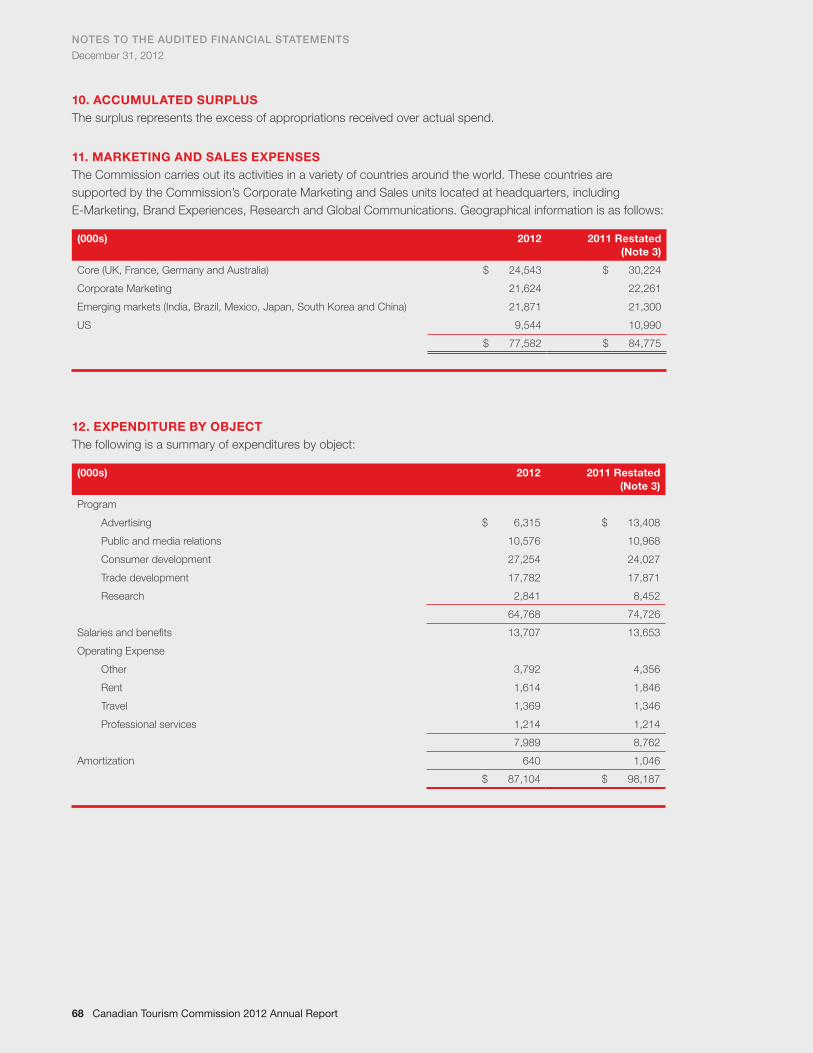
68 Canadian Tourism Commission 2012 Annual Report
NOTES TO THE AUDITED FINANCIAL STATEMENTS
December 31, 2012
68 Canadian Tourism Commission 2012 Annual Report
10. ACCUMULATED SURPLUS
The surplus represents the excess of appropriations received over actual spend.
11. MARKETING AND SALES EXPENSES
The Commission carries out its activities in a variety of countries around the world. These countries are
supported by the Commission’s Corporate Marketing and Sales units located at headquarters, including
E-Marketing, Brand Experiences, Research and Global Communications. Geographical information is as follows:
(000s) 2012 2011 Restated
(Note 3)
Core (UK, France, Germany and Australia)
Corporate Marketing
Emerging markets (India, Brazil, Mexico, Japan, South Korea and China)
US
$ 24,543
21,624
21,871
9,544
$ 30,224
22,261
21,300
10,990
$ 77,582 $ 84,775
12. EXPENDITURE BY OBJECT
The following is a summary of expenditures by object:
(000s) 2012 2011 Restated
(Note 3)
Program
Advertising
Public and media relations
Consumer development
Trade development
Research
$ 6,315
10,576
27,254
17,782
2,841
$ 13,408
10,968
24,027
17,871
8,452
64,768 74,726
Salaries and benefi ts
Operating Expense
Other
Rent
Travel
Professional services
13,707
3,792
1,614
1,369
1,214
13,653
4,356
1,846
1,346
1,214
7,989 8,762
Amortization 640 1,046
$ 87,104 $ 98,187
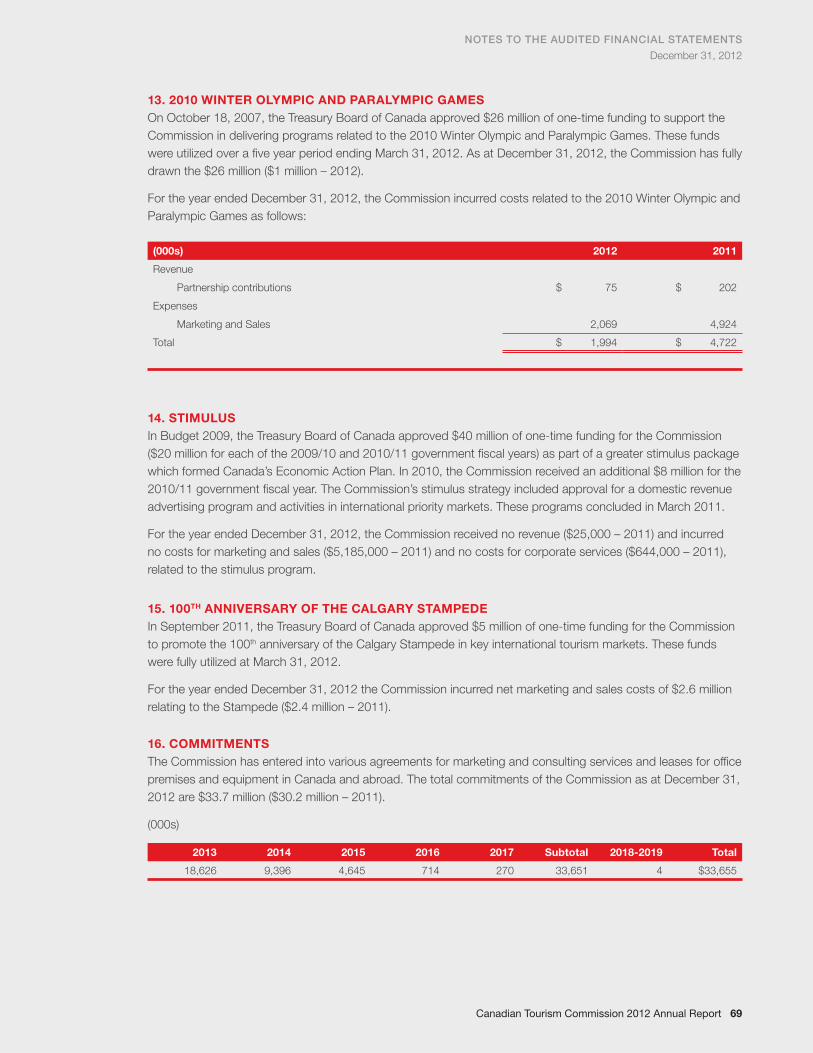
NOTES TO THE AUDITED FINANCIAL STATEMENTS
December 31, 2012
Canadian Tourism Commission 2012 Annual Report 69
13. 2010 WINTER OLYMPIC AND PARALYMPIC GAMES
On October 18, 2007, the Treasury Board of Canada approved $26 million of one-time funding to support the
Commission in delivering programs related to the 2010 Winter Olympic and Paralympic Games. These funds
were utilized over a fi ve year period ending March 31, 2012. As at December 31, 2012, the Commission has fully
drawn the $26 million ($1 million – 2012).
For the year ended December 31, 2012, the Commission incurred costs related to the 2010 Winter Olympic and
Paralympic Games as follows:
(000s) 2012 2011
Revenue
Partnership contributions
Expenses
Marketing and Sales
$ 75
2,069
$ 202
4,924
Total $ 1,994 $ 4,722
14. STIMULUS
In Budget 2009, the Treasury Board of Canada approved $40 million of one-time funding for the Commission
($20 million for each of the 2009/10 and 2010/11 government fi scal years) as part of a greater stimulus package
which formed Canada’s Economic Action Plan. In 2010, the Commission received an additional $8 million for the
2010/11 government fi scal year. The Commission’s stimulus strategy included approval for a domestic revenue
advertising program and activities in international priority markets. These programs concluded in March 2011.
For the year ended December 31, 2012, the Commission received no revenue ($25,000 – 2011) and incurred
no costs for marketing and sales ($5,185,000 – 2011) and no costs for corporate services ($644,000 – 2011),
related to the stimulus program.
15. 100TH ANNIVERSARY OF THE CALGARY STAMPEDE
In September 2011, the Treasury Board of Canada approved $5 million of one-time funding for the Commission
to promote the 100th anniversary of the Calgary Stampede in key international tourism markets. These funds
were fully utilized at March 31, 2012.
For the year ended December 31, 2012 the Commission incurred net marketing and sales costs of $2.6 million
relating to the Stampede ($2.4 million – 2011).
16. COMMITMENTS
The Commission has entered into various agreements for marketing and consulting services and leases for offi ce
premises and equipment in Canada and abroad. The total commitments of the Commission as at December 31,
2012 are $33.7 million ($30.2 million – 2011).
(000s)
2013 2014 2015 2016 2017 Subtotal 2018-2019 Total
18,626 9,396 4,645 714 270 33,651 4 $33,655

70 Canadian Tourism Commission 2012 Annual Report
NOTES TO THE AUDITED FINANCIAL STATEMENTS
December 31, 2012
70 Canadian Tourism Commission 2012 Annual Report
17. CONTINGENCIES
In the normal course of business and as a result of the Commission’s restructuring activities in 2010, various
claims and lawsuits have been brought against the Commission. Where in the opinion of management, losses,
which may result from the settlement of the matters, are determinable within a reasonable range and such
losses were considered by management as likely to be incurred, they would be charged to expenses. In the
event management concludes that potential losses are indeterminable, no provision has been recognized in
the accounts of the Commission. Due to the confi dential and sensitive nature of the claims and lawsuits, the
Commission cannot disclose any information regarding the potential losses.
70 Canadian Tourism Commission 2012 Annual Report
NOTES TO THE AUDITED FINANCIAL STATEMENTS
December 31, 2012

Tombstone Territorial Park, Yukon© G
ove
rnm
ent
of Yukon/F
ritz
Muelle
r
Library and Archives Canada Cataloguing in Publication
Canadian Tourism Commission
Annual Report 2012 / Canadian Tourism Commission
Issued also in French under title: Rapport annuel 2012
Catalogue numbers:
Paper: Iu82-2012E
1481-3556
PDF: Iu82-2012E-PDF
1493-5767
Canadian Tourism Commission
Suite 1400, Four Bentall Centre
1055 Dunsmuir Street
Vancouver, BC V7X 1L2
Canada
www.canada.travel
© 2013 Canadian Tourism Commission
© N
ew
found
land
and
Lab
rad
or
Tourism
©
Gove
rnm
ent
of Yukon
Dere
k C
row
e
© T
ourism
PE
I/Jo
hn S
ylve
ste
r
© H
isto
ric R
eeso
r R
anch/T
ho
mas S
bam
pato