cslf technical working group nov. 5 , 2013, washington … · cslf technical working group . nov....
TRANSCRIPT

Dr. S. Julio Friedmann
Deputy Assistant Secretary Office of Clean Coal
November 2013
CSLF Technical Working Group Nov. 5th, 2013, Washington DC
2
This has been a good decade for CCUS R&D Advancements
3
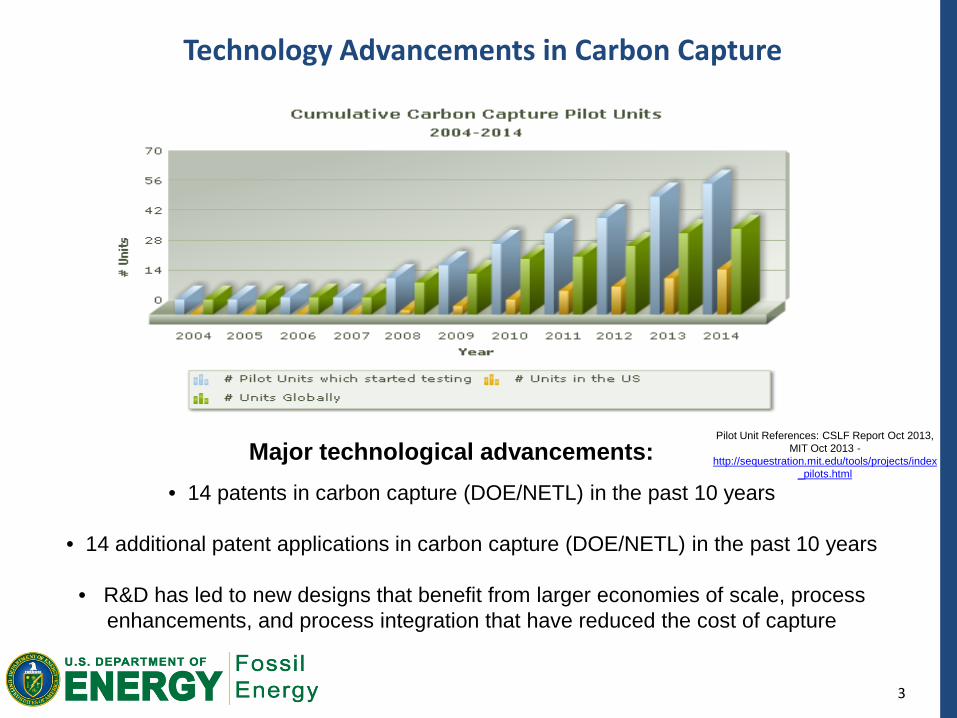
Technology Advancements in Carbon Capture
• 14 patents in carbon capture (DOE/NETL) in the past 10 years
• 14 additional patent applications in carbon capture (DOE/NETL) in the past 10 years
• R&D has led to new designs that benefit from larger economies of scale, process enhancements, and process integration that have reduced the cost of capture
Major technological advancements: Pilot Unit References: CSLF Report Oct 2013,
MIT Oct 2013 -http://sequestration.mit.edu/tools/projects/index
_pilots.html
4
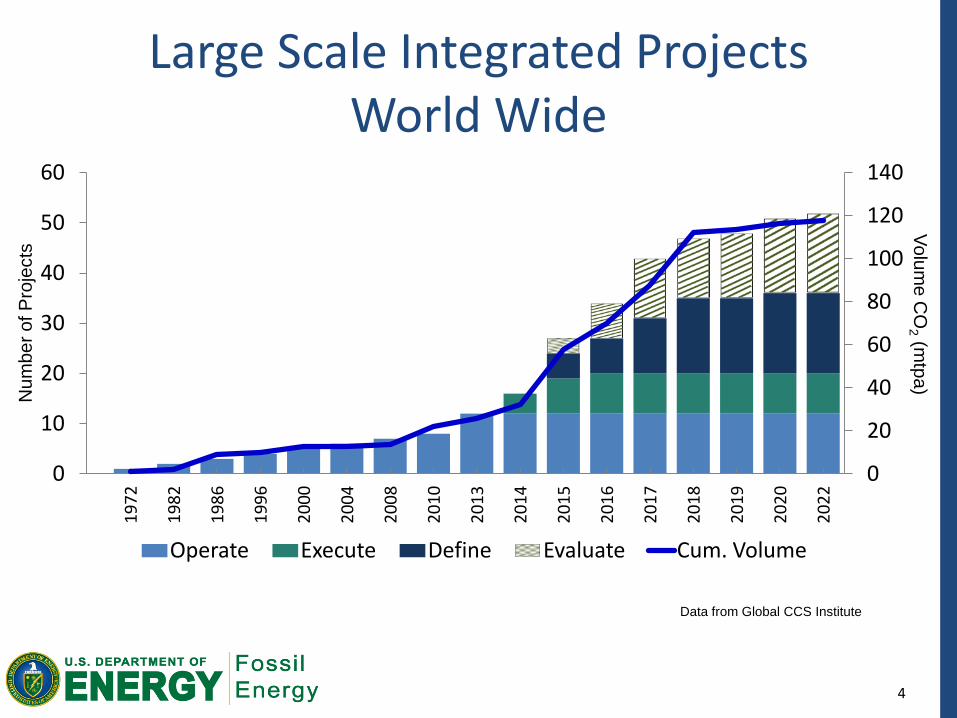
Large Scale Integrated Projects World Wide
0
20
40
60
80
100
120
140
0
10
20
30
40
50
60
1972
1982
1986
1996
2000
2004
2008
2010
2013
2014
2015
2016
2017
2018
2019
2020
2022
Operate Execute Define Evaluate Cum. Volume
Num
ber o
f Pro
ject
s Volum
e CO
2 (mtpa)
Data from Global CCS Institute
0%
5%
10%
15%
20%
25%
30%
35%
40%
Pow
er G
ener
atio
n Pe
nalt
y [%
of P
lant
Out
put]
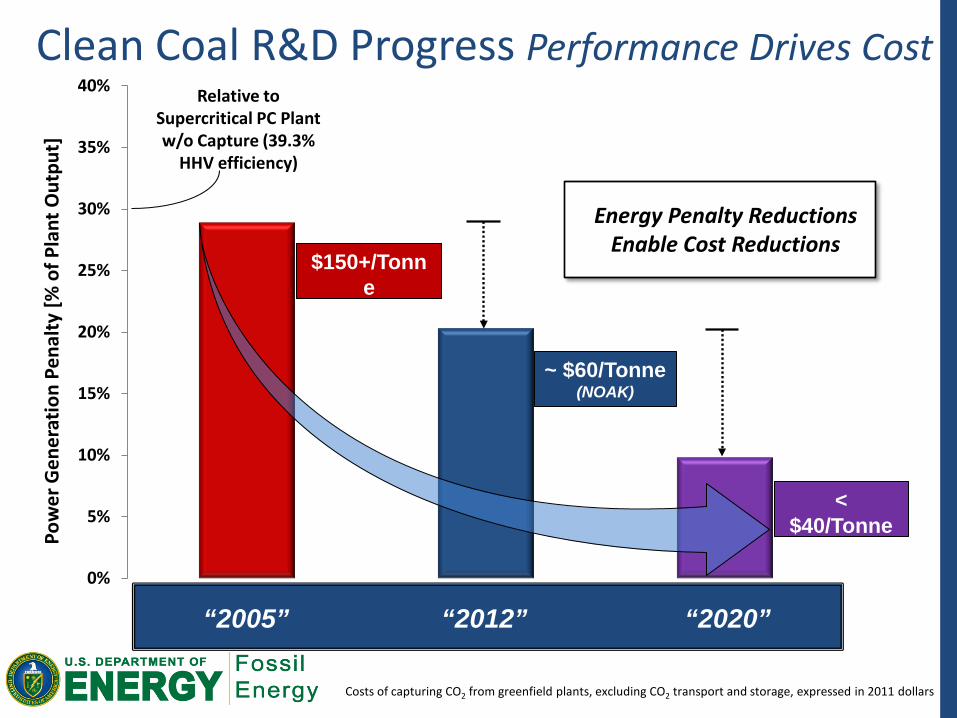
Clean Coal R&D Progress Performance Drives Cost
Costs of capturing CO2 from greenfield plants, excluding CO2 transport and storage, expressed in 2011 dollars
“2005” “2012” “2020”
$150+/Tonne
(NOAK)
~ $60/Tonne (NOAK)
< $40/Tonne
(NOAK)
Energy Penalty Reductions Enable Cost Reductions
Relative to Supercritical PC Plant w/o Capture (39.3%
HHV efficiency)
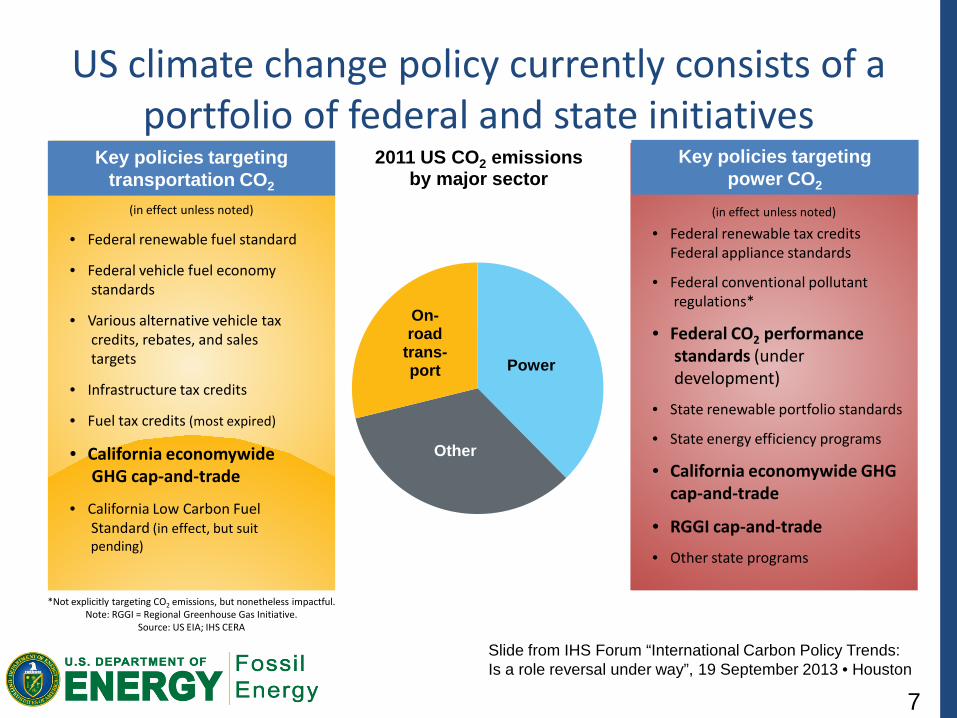
US climate change policy currently consists of a portfolio of federal and state initiatives
(in effect unless noted)
• Federal renewable fuel standard
• Federal vehicle fuel economy standards
• Various alternative vehicle tax credits, rebates, and sales targets
• Infrastructure tax credits
• Fuel tax credits (most expired)
• California economywide GHG cap-and-trade
• California Low Carbon Fuel Standard (in effect, but suit pending)
7
(in effect unless noted)
• Federal renewable tax credits Federal appliance standards
• Federal conventional pollutant regulations*
• Federal CO2 performance standards (under development)
• State renewable portfolio standards
• State energy efficiency programs
• California economywide GHG cap-and-trade
• RGGI cap-and-trade
• Other state programs
*Not explicitly targeting CO2 emissions, but nonetheless impactful.
Note: RGGI = Regional Greenhouse Gas Initiative. Source: US EIA; IHS CERA
Power
Other
On-road
trans-port
2011 US CO2 emissions by major sector
Key policies targeting transportation CO2
Key policies targeting power CO2
Slide from IHS Forum “International Carbon Policy Trends: Is a role reversal under way”, 19 September 2013 • Houston
8
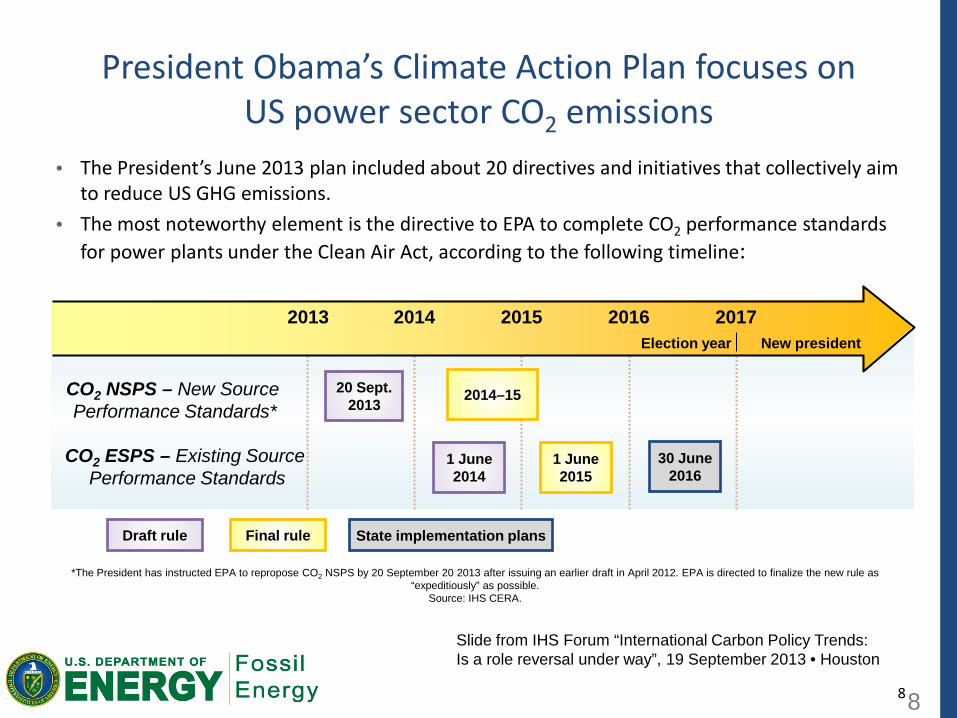
President Obama’s Climate Action Plan focuses on US power sector CO2 emissions
*The President has instructed EPA to repropose CO2 NSPS by 20 September 20 2013 after issuing an earlier draft in April 2012. EPA is directed to finalize the new rule as “expeditiously” as possible.
Source: IHS CERA.
8
• The President’s June 2013 plan included about 20 directives and initiatives that collectively aim to reduce US GHG emissions.
• The most noteworthy element is the directive to EPA to complete CO2 performance standards for power plants under the Clean Air Act, according to the following timeline:
Final rule Draft rule
2013 2014 2016 2017 2015
20 Sept. 2013
1 June 2014
1 June 2015
30 June 2016
State implementation plans
New president Election year
CO2 NSPS – New Source Performance Standards*
CO2 ESPS – Existing Source Performance Standards
2014–15
Slide from IHS Forum “International Carbon Policy Trends: Is a role reversal under way”, 19 September 2013 • Houston

9
A wide range of technologies will be necessary to reduce energy-related CO2 emissions substantially.
IEA CCS Roadmap 2013: Key Technologies for Reducing Global CO2 Emissions
Source: IEA Roadmap 2013. Note: Numbers in brackets are shares in 2050. For example, 14% is the share of CCS in cumulative emission reductions through 2050, and 17% is the share of CCS in emission reductions in 2050, compared with the 6DS.
10
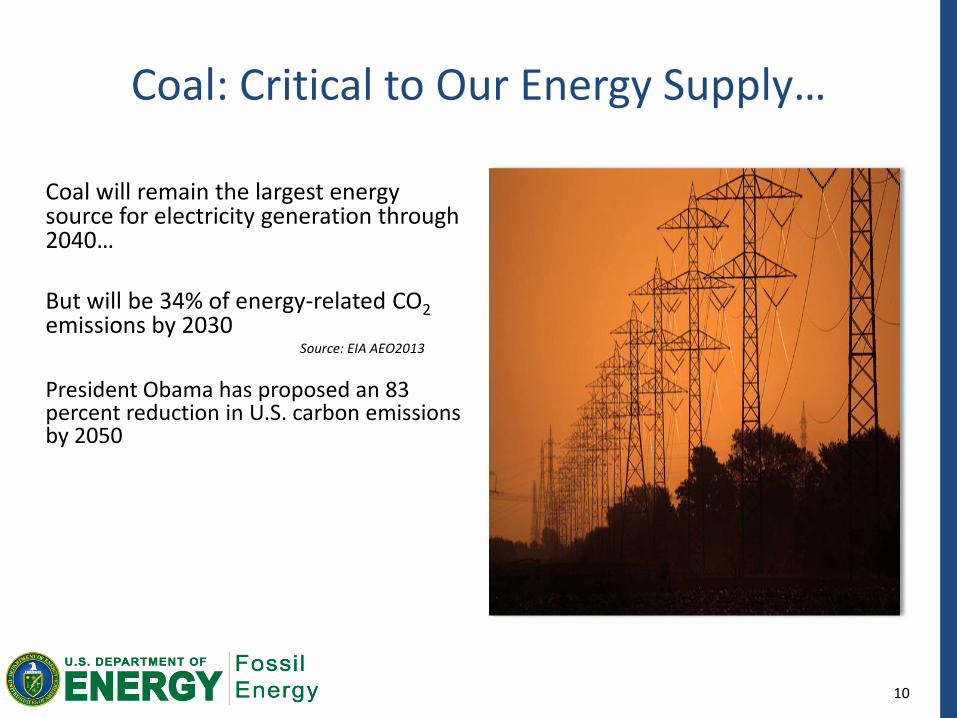
Coal will remain the largest energy
source for electricity generation through 2040…
But will be 34% of energy-related CO2
emissions by 2030 Source: EIA AEO2013
President Obama has proposed an 83 percent reduction in U.S. carbon emissions by 2050
Coal: Critical to Our Energy Supply…

12
A global resource, changing the world
New EIA-ARI Study: • 6,622 Tcf recoverable shale
• 22,600 Tcf recoverable natural gas Global shale adds 40%!
13
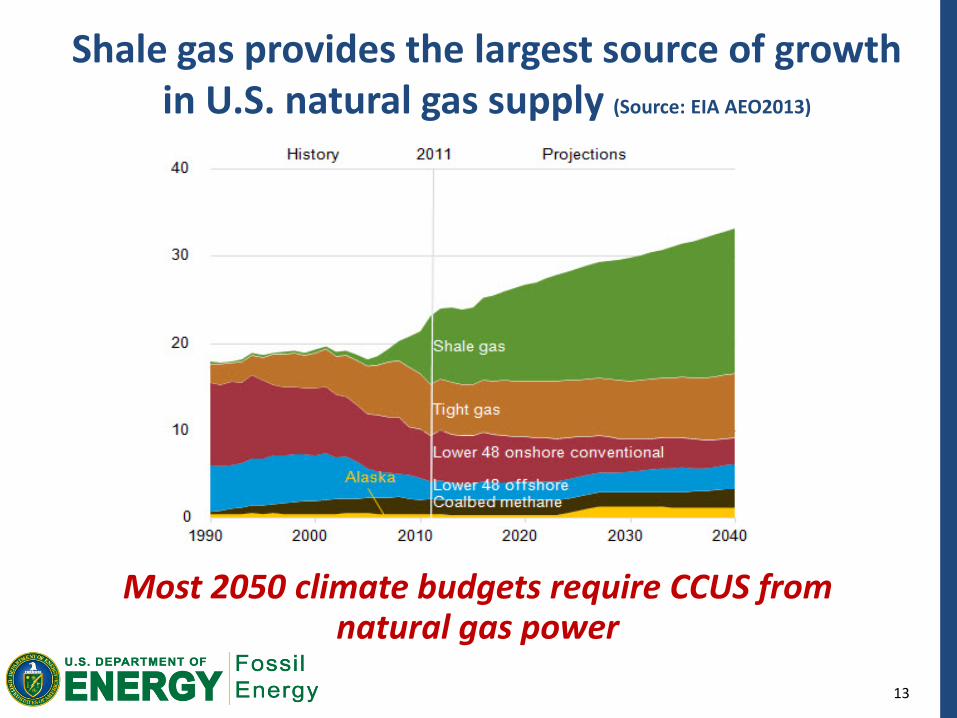
Shale gas provides the largest source of growth in U.S. natural gas supply (Source: EIA AEO2013)
Most 2050 climate budgets require CCUS from natural gas power
15
DOE Office of Fossil Energy Clean Coal Program
16
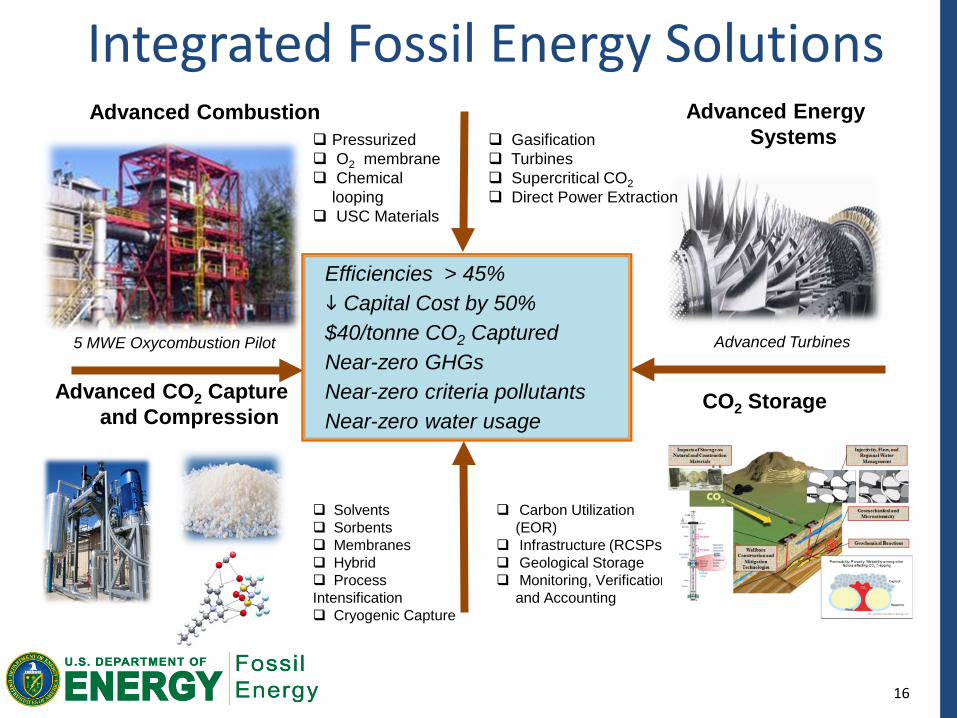
Advanced Combustion
CO2 Storage Advanced CO2 Capture and Compression
Solvents Sorbents Membranes Hybrid Process Intensification Cryogenic Capture
Pressurized O2 membrane Chemical
looping USC Materials
Carbon Utilization (EOR)
Infrastructure (RCSPs) Geological Storage Monitoring, Verification
and Accounting
Gasification Turbines Supercritical CO2 Direct Power Extraction
Integrated Fossil Energy Solutions
Efficiencies > 45% Capital Cost by 50% $40/tonne CO2 Captured Near-zero GHGs Near-zero criteria pollutants Near-zero water usage
Advanced Energy Systems
5 MWE Oxycombustion Pilot Advanced Turbines
17
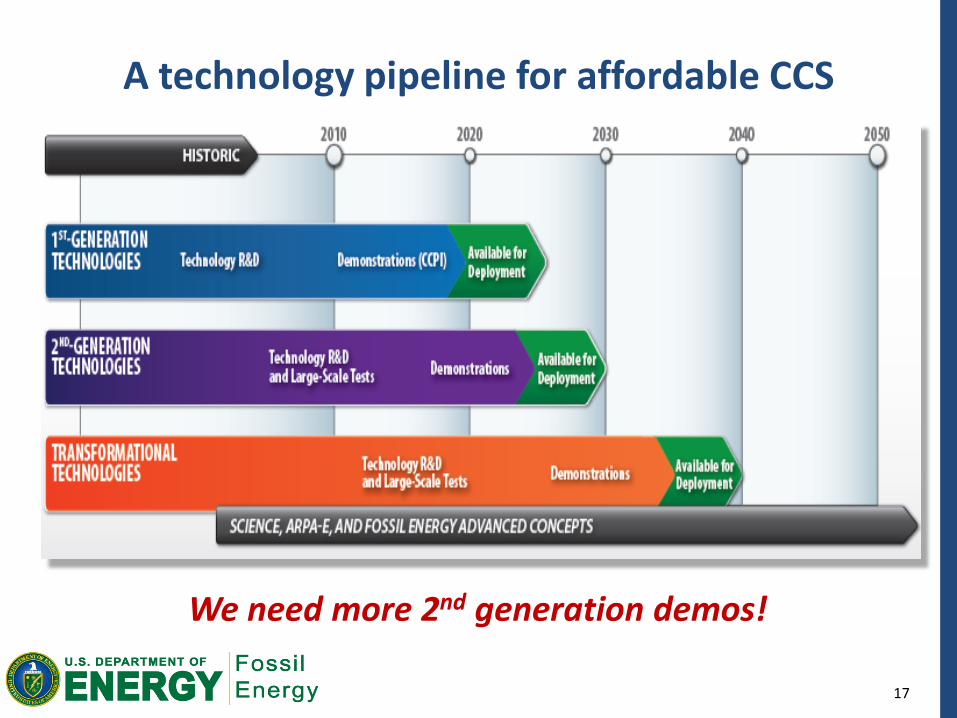
A technology pipeline for affordable CCS
We need more 2nd generation demos!
18
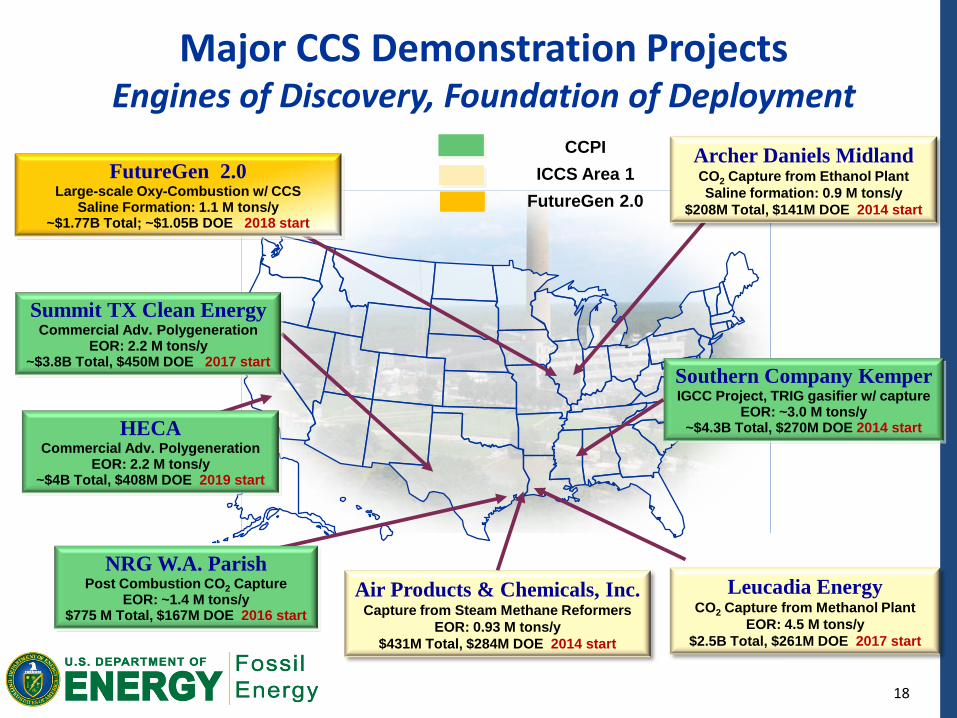
Major CCS Demonstration Projects
Engines of Discovery, Foundation of Deployment
CCPI ICCS Area 1
FutureGen 2.0
Southern Company Kemper IGCC Project, TRIG gasifier w/ capture
EOR: ~3.0 M tons/y ~$4.3B Total, $270M DOE 2014 start
NRG W.A. Parish Post Combustion CO2 Capture
EOR: ~1.4 M tons/y $775 M Total, $167M DOE 2016 start
Summit TX Clean Energy Commercial Adv. Polygeneration
EOR: 2.2 M tons/y ~$3.8B Total, $450M DOE 2017 start
HECA Commercial Adv. Polygeneration
EOR: 2.2 M tons/y ~$4B Total, $408M DOE 2019 start
Leucadia Energy CO2 Capture from Methanol Plant
EOR: 4.5 M tons/y $2.5B Total, $261M DOE 2017 start
Air Products & Chemicals, Inc. Capture from Steam Methane Reformers
EOR: 0.93 M tons/y $431M Total, $284M DOE 2014 start
FutureGen 2.0 Large-scale Oxy-Combustion w/ CCS
Saline Formation: 1.1 M tons/y ~$1.77B Total; ~$1.05B DOE 2018 start
Archer Daniels Midland CO2 Capture from Ethanol Plant Saline formation: 0.9 M tons/y
$208M Total, $141M DOE 2014 start
19
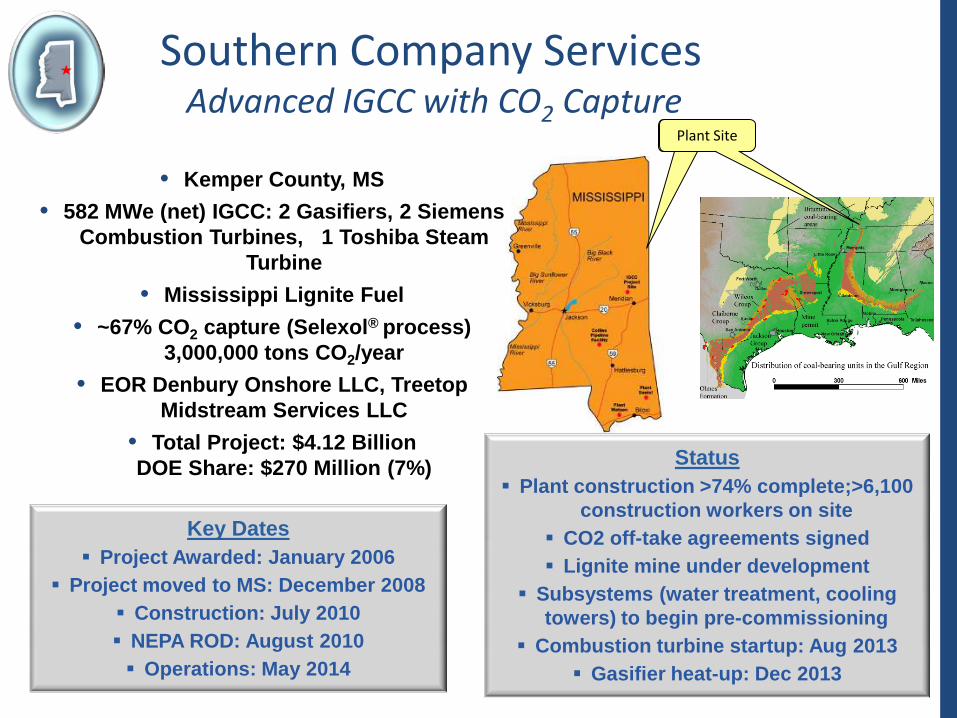
Southern Company Services Advanced IGCC with CO2 Capture
Plant Site Plant Site
Status Plant construction >74% complete;>6,100
construction workers on site CO2 off-take agreements signed Lignite mine under development
Subsystems (water treatment, cooling towers) to begin pre-commissioning
Combustion turbine startup: Aug 2013 Gasifier heat-up: Dec 2013
Key Dates Project Awarded: January 2006
Project moved to MS: December 2008 Construction: July 2010 NEPA ROD: August 2010 Operations: May 2014
• Kemper County, MS • 582 MWe (net) IGCC: 2 Gasifiers, 2 Siemens
Combustion Turbines, 1 Toshiba Steam Turbine
• Mississippi Lignite Fuel • ~67% CO2 capture (Selexol® process)
3,000,000 tons CO2/year • EOR Denbury Onshore LLC, Treetop
Midstream Services LLC • Total Project: $4.12 Billion DOE Share: $270 Million (7%)
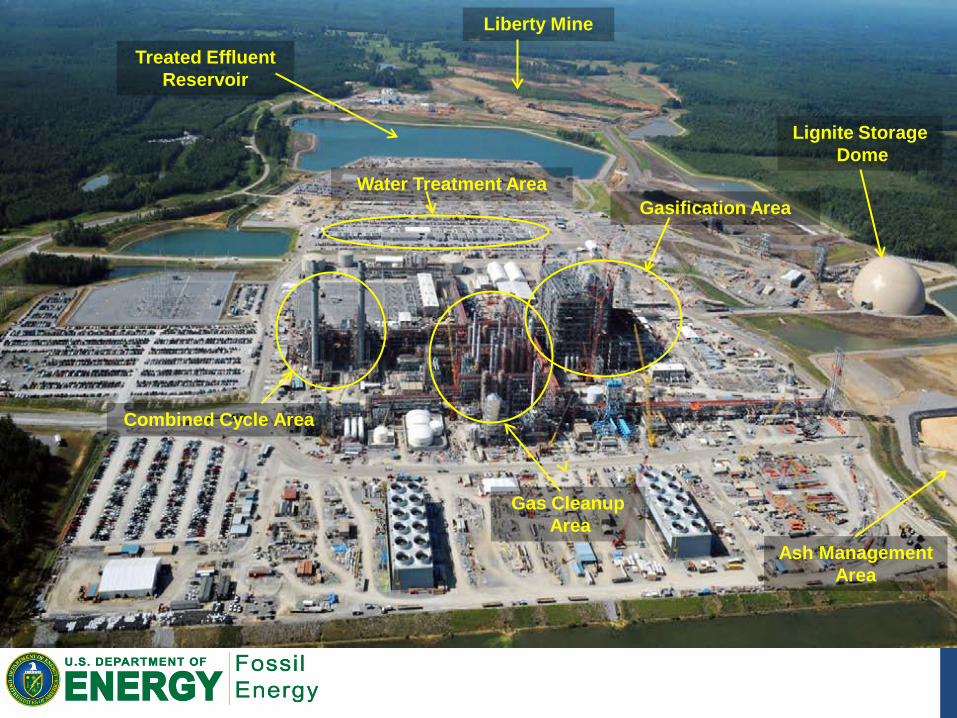
Gasification Area
Liberty Mine
Treated Effluent Reservoir
Lignite Storage Dome
Water Treatment Area
Gas Cleanup Area
Ash Management Area
Combined Cycle Area
23
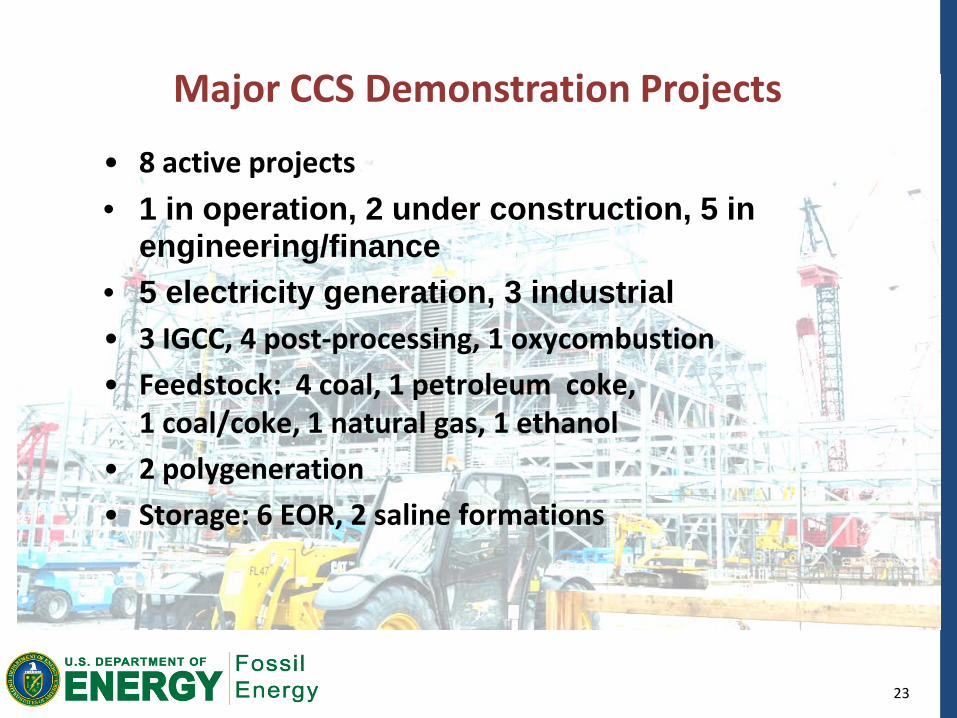
• 8 active projects
• 1 in operation, 2 under construction, 5 in engineering/finance
• 5 electricity generation, 3 industrial • 3 IGCC, 4 post-processing, 1 oxycombustion
• Feedstock: 4 coal, 1 petroleum coke, 1 coal/coke, 1 natural gas, 1 ethanol
• 2 polygeneration
• Storage: 6 EOR, 2 saline formations
Major CCS Demonstration Projects
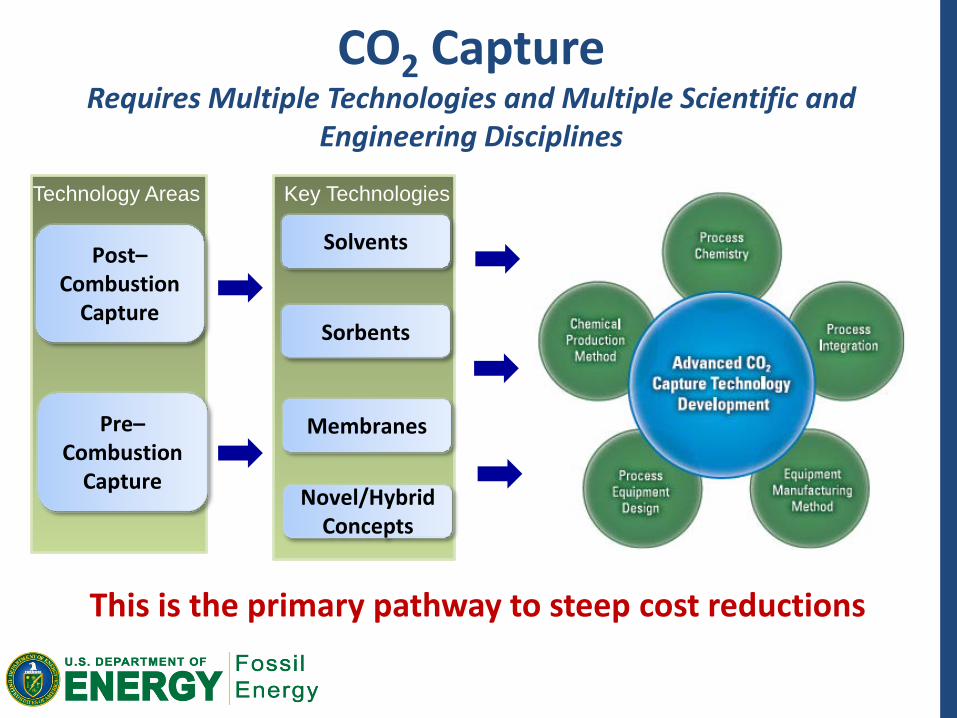
CO2 Capture Requires Multiple Technologies and Multiple Scientific and
Engineering Disciplines
Post–Combustion
Capture
Solvents
Sorbents
Membranes Pre–Combustion
Capture
Technology Areas Key Technologies
Novel/Hybrid Concepts
This is the primary pathway to steep cost reductions
25
8
7
3
1
2
4
6
5
9
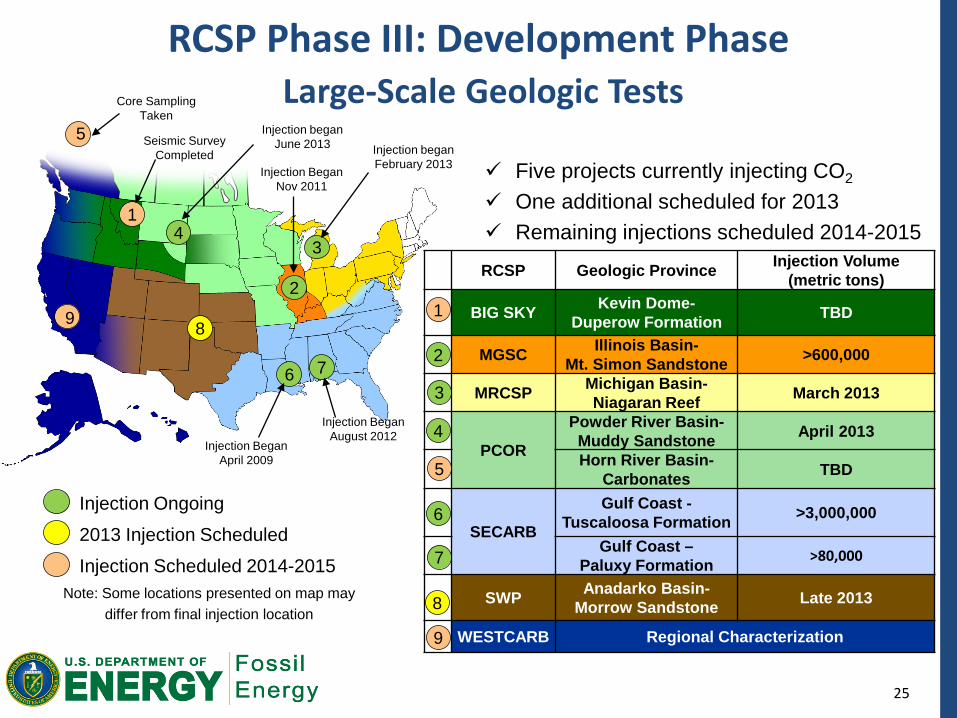
RCSP Geologic Province Injection Volume (metric tons)
BIG SKY Kevin Dome- Duperow Formation TBD
MGSC Illinois Basin- Mt. Simon Sandstone >600,000
MRCSP Michigan Basin- Niagaran Reef March 2013
PCOR
Powder River Basin- Muddy Sandstone April 2013
Horn River Basin- Carbonates TBD
SECARB
Gulf Coast - Tuscaloosa Formation >3,000,000
Gulf Coast – Paluxy Formation >80,000
SWP Anadarko Basin- Morrow Sandstone Late 2013
WESTCARB Regional Characterization
Injection Ongoing
2013 Injection Scheduled
Injection Scheduled 2014-2015
1
2
3
4
7
8
6
9
5
Five projects currently injecting CO2 One additional scheduled for 2013 Remaining injections scheduled 2014-2015
Injection Began Nov 2011
Injection Began April 2009
Core Sampling Taken
Note: Some locations presented on map may differ from final injection location
Injection Began August 2012
RCSP Phase III: Development Phase Large-Scale Geologic Tests
Injection began February 2013
Injection began June 2013 Seismic Survey
Completed
26
Large-Scale CO2 Storage Tests
• 8 large scale tests ongoing/planned for 6 of 7 Regional Partnerships
• Tests based on strong core R&D program and 20 smaller field tests.
• Schedule: 5 injecting now, 1 starting 2013, 2 starting 2014-2015
• Storage: 5 EOR, 3 saline formations
• 7 of the 8 will inject between 1 M – 2.9 M tonnes CO2
• CO2 sources: NG processing plants, coal power plants, ethanol production plant, natural CO2 source
• All tests have extensive MVA and will inform Best Practice Manuals
27
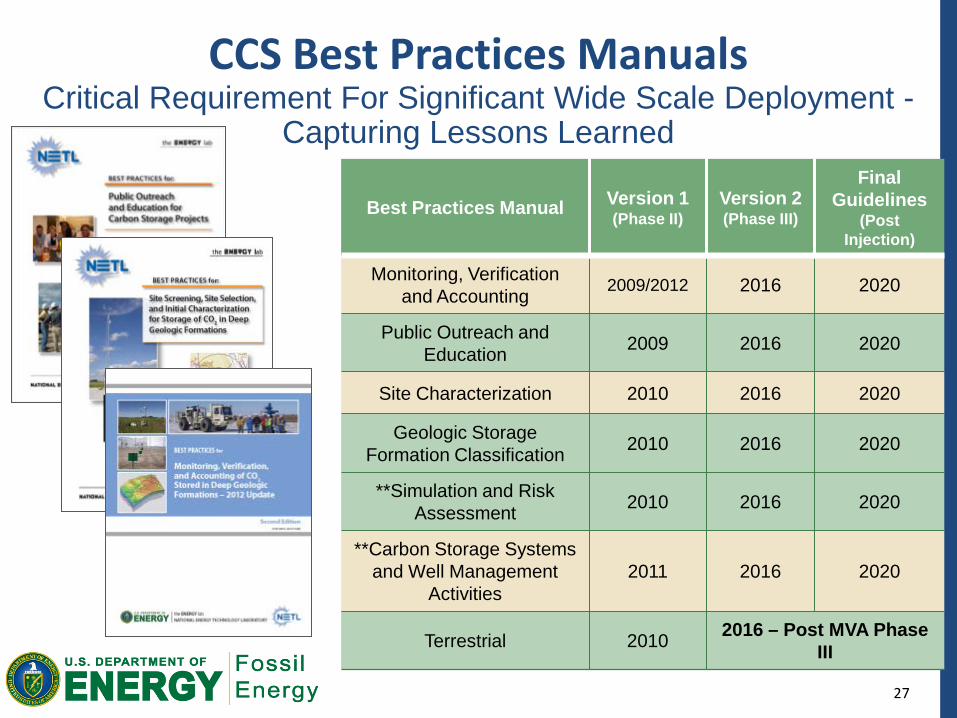
Best Practices Manual Version 1 (Phase II)
Version 2 (Phase III)
Final Guidelines
(Post Injection)
Monitoring, Verification and Accounting 2009/2012 2016 2020
Public Outreach and Education 2009 2016 2020
Site Characterization 2010 2016 2020
Geologic Storage Formation Classification 2010 2016 2020
**Simulation and Risk Assessment 2010 2016 2020
**Carbon Storage Systems and Well Management
Activities 2011 2016 2020
Terrestrial 2010 2016 – Post MVA Phase III
CCS Best Practices Manuals Critical Requirement For Significant Wide Scale Deployment -
Capturing Lessons Learned
28
The future looks bright – we should pursue important new opportunities
WATER: Both challenge and opportunity
• Water co-production: 8M m3 water for 6M tons CO2.
• Water reclamation: lignite drying
• Water integration: upgrading municipal water with waste heat
UTILIZATION: Part of the work and value
• EOR already common; ROZ advancing
• CO2-Algae: small volumes, tough economics; improving
• Cement and mineralization: small volumes, tough economics; improving
Entering commercial realm; now it gets exciting